Attached files
| file | filename |
|---|---|
| EXCEL - IDEA: XBRL DOCUMENT - Houghton Mifflin Harcourt Co | Financial_Report.xls |
| EX-32.1 - EX-32.1 - Houghton Mifflin Harcourt Co | d846641dex321.htm |
| EX-32.2 - EX-32.2 - Houghton Mifflin Harcourt Co | d846641dex322.htm |
| EX-31.1 - EX-31.1 - Houghton Mifflin Harcourt Co | d846641dex311.htm |
| EX-23.1 - EX-23.1 - Houghton Mifflin Harcourt Co | d846641dex231.htm |
| EX-21.1 - EX-21.1 - Houghton Mifflin Harcourt Co | d846641dex211.htm |
| EX-31.2 - EX-31.2 - Houghton Mifflin Harcourt Co | d846641dex312.htm |
| EX-10.34 - EX-10.34 - Houghton Mifflin Harcourt Co | d846641dex1034.htm |
| EX-10.36 - EX-10.36 - Houghton Mifflin Harcourt Co | d846641dex1036.htm |
| EX-10.32 - EX-10.32 - Houghton Mifflin Harcourt Co | d846641dex1032.htm |
| EX-10.33 - EX-10.33 - Houghton Mifflin Harcourt Co | d846641dex1033.htm |
| EX-10.35 - EX-10.35 - Houghton Mifflin Harcourt Co | d846641dex1035.htm |
Table of Contents
UNITED STATES
SECURITIES AND EXCHANGE COMMISSION
WASHINGTON, D.C. 20549
FORM 10-K
| x | ANNUAL REPORT PURSUANT TO SECTION 13 OR 15(d) OF THE SECURITIES EXCHANGE ACT OF 1934, or |
For the fiscal year ended December 31, 2014
| ¨ | TRANSITION REPORT PURSUANT TO SECTION 13 OR 15(d) OF THE SECURITIES EXCHANGE ACT OF 1934 |
Commission file number 001-36166
Houghton Mifflin Harcourt Company
(Exact name of registrant as specified in its charter)
| Delaware | 27-1566372 | |
| (State or other jurisdiction of incorporation or organization) |
(I.R.S. Employer Identification No.) |
222 Berkeley Street
Boston, MA 02116
(617) 351-5000
(Address, including zip code, and telephone number, including area code, of registrant’s principal executive offices)
Securities registered pursuant to Section 12(b) of the Act:
| Title of each class |
Name of each exchange on which registered | |
| Common Stock, $0.01 par value | The NASDAQ Stock Market LLC |
Securities registered pursuant to Section 12(g) of the Act: None
Indicate by check mark if the registrant is a well-known seasoned issuer, as defined in Rule 405 of the Securities Act. Yes x No ¨
Indicate by check mark if the registrant is not required to file reports pursuant to Section 13 or Section 15(d) of the Act. Yes ¨ No x
Indicate by check mark whether the registrant (1) has filed all reports required to be filed by Section 13 or 15(d) of the Securities Exchange Act of 1934 during the preceding 12 months (or for such shorter period that the Registrant was required to file such reports), and (2) has been subject to such filing requirements for the past 90 days. Yes x No ¨
Indicate by check mark whether the Registrant has submitted electronically and posted on its corporate Web site, if any, every Interactive Data File required to be submitted and posted pursuant to Rule 405 of Regulation S-T (§ 232.405 of this chapter) during the preceding 12 months (or for such shorter period that the Registrant was required to submit and post such files). Yes x No ¨
Indicate by check mark if disclosure of delinquent filers pursuant to Item 405 of Regulation S-K (§ 229.405 of this chapter) is not contained herein, and will not be contained, to the best of Registrant’s knowledge, in definitive proxy or information statements incorporated by reference in Part III of this Form 10-K or any amendment to this Form 10-K. ¨
Indicate by check mark whether the Registrant is a large accelerated filer, an accelerated filer, a non-accelerated filer, or a smaller reporting company. See the definitions of “large accelerated filer,” “accelerated filer” and “smaller reporting company” in Rule 12b-2 of the Exchange Act.
| Large accelerated filer | x | Accelerated filer | ¨ | |||
| Non-accelerated filer | ¨ | Smaller reporting company | ¨ | |||
Indicate by check mark whether the Registrant is a shell company (as defined in Rule 12b-2 of the Exchange Act). Yes ¨ No x
The aggregate market value of the voting stock held by non-affiliates of the Registrant as of June 30, 2014, was approximately $2.1 billion.
The number of shares of common stock, par value $0.01 per share, outstanding as of February 12, 2015 was 142,172,861.
Documents incorporated by reference and made a part of this Form 10-K:
The information required by Part III of this Form 10-K, to the extent not set forth herein, is incorporated herein by reference from the Registrant’s Definitive Proxy Statement for its 2015 Annual Meeting of Stockholders, to be filed with the Securities and Exchange Commission not later than 120 days after December 31, 2014.
Table of Contents
2
Table of Contents
SPECIAL NOTE REGARDING FORWARD-LOOKING STATEMENTS
The statements contained herein include forward-looking statements, which involve risks and uncertainties. These forward-looking statements can be identified by the use of forward-looking terminology, including the terms “believes,” “estimates,” “projects,” “anticipates,” “expects,” “could,” “intends,” “may,” “will” or “should,” “forecast,” “intend,” “plan,” “potential,” “project,” “target” or, in each case, their negative, or other variations or comparable terminology. These forward-looking statements include all matters that are not historical facts. They include statements regarding our intentions, beliefs or current expectations concerning, among other things, our results of operations, financial condition, liquidity, prospects, growth, strategies, the industry in which we operate and potential business decisions. We derive many of our forward-looking statements from our operating budgets and forecasts, which are based upon many detailed assumptions. While we believe that our assumptions are reasonable, we caution that it is very difficult to predict the impact of known factors, and, of course, it is impossible for us to anticipate all factors that could affect our actual results. All forward-looking statements are based upon information available to us on the date of this report.
By their nature, forward-looking statements involve risks and uncertainties because they relate to events and depend on circumstances that may or may not occur in the future. We caution you that forward-looking statements are not guarantees of future performance and that our actual results of operations, financial condition and liquidity, and the development of the industry in which we operate may differ materially from those made in or suggested by the forward-looking statements contained herein. In addition, even if our results of operations, financial condition and liquidity and the development of the industry in which we operate are consistent with the forward looking statements contained herein, those results or developments may not be indicative of results or developments in subsequent periods.
Important factors that could cause our results to vary from expectations include, but are not limited to: changes in state and local education funding and/or related programs, legislation and procurement processes; adverse or worsening economic trends or the continuation of current economic conditions; changes in consumer demand for, and acceptance of, our products; changes in competitive factors; offerings by technology companies that compete with our products; industry cycles and trends; conditions and/or changes in the publishing industry; changes or the loss of our key third-party print vendors; restrictions under agreements governing our outstanding indebtedness; changes in laws or regulations governing our business and operations; changes or failures in the information technology systems we use; demographic trends; uncertainty surrounding our ability to enforce our intellectual property rights; inability to retain management or hire employees; impact of potential impairment of goodwill and other intangibles in a challenging economy; decline or volatility of our stock price regardless of our operating performance; and other factors discussed in the “Risk Factors” section of this Annual Report on Form 10-K (this “Annual Report”). In light of these risks, uncertainties and assumptions, the forward-looking events described herein may not occur.
We undertake no obligation, and do not expect, to publicly update or publicly revise any forward-looking statement, whether as a result of new information, future events or otherwise, except as required by law. All subsequent written and oral forward-looking statements attributable to us or to persons acting on our behalf are expressly qualified in their entirety by the cautionary statements contained herein.
3
Table of Contents
As used in this Annual Report, the terms “we,” “us,” “our,” “HMH” and the “Company” refer to Houghton Mifflin Harcourt Company, formerly known as HMH Holdings (Delaware), Inc., and its consolidated subsidiaries, unless otherwise expressly stated or the context otherwise requires.
Company Overview
Our mission is to change people’s lives by fostering passionate, curious learners. We believe that by combining world-class educational content and services with cutting edge technology, we can enable learning in a changing landscape and make the educational process more dynamic, engaging and effective.
We are a global learning company, specializing in education solutions across a variety of media. We deliver content, services and technology to both educational institutions and consumers, reaching over 50 million students in more than 150 countries worldwide. In the United States, we are the leading provider of Kindergarten through 12th grade (K-12) educational content by market share. We believe that nearly every current K-12 student in the United States has utilized our content during the course of his or her education. As a result, we believe that we have an established reputation with students and educators that is difficult for others to replicate and that positions us to also provide content and services that serve their learning needs beyond the classroom. We believe our long-standing reputation and well-known brands enable us to capitalize on consumer and digital trends in the education market through our existing and developing channels. Furthermore, since 1832, we have published trade and reference materials, including adult and children’s fiction and non-fiction books that have won industry awards such as the Pulitzer Prize, Newbery and Caldecott medals and National Book Award, all of which we believe are widely known.
We believe our leadership position in the K-12 market, our primary market, provides us with strong competitive advantages. We have established relationships with educators, institutions, parents, students and life-long learners around the world that are founded on our education expertise, content and services that meet the evolving needs of our customers. Our portfolio of intellectual property spans educational, general interest, children’s and reference works, and has been developed by award-winning authors—including 9 Nobel Prize winners, 48 Pulitzer Prize winners and 13 National Book Award winners—and learning architects with expertise in education pedagogy. Our content includes characters and titles such as Curious George, Carmen Sandiego, The Oregon Trail, The Little Prince, The Lord of the Rings, Life of Pi, Webster’s New World Dictionary and Cliffs Notes that we believe are recognized in the United States and internationally. Through our network of over 500 quota-carrying sales professionals, we serve a growing list of institutional customers.
We sell our products and services across multiple media and distribution channels and are expanding our customer base beyond educational institutions, with an increasing focus on individual consumers who comprise a significant target audience of life-long learners. Leveraging our portfolio of content, including some of our children’s brands and titles that we believe are iconic and timeless, such as Carmen Sandiego and Curious George, we create interactive digital content, mobile apps and educational games, build websites and provide technology-based educational solutions for the home. Based on the strength of our content portfolio and its adaptability across multiple distribution channels, we believe that we are also well positioned to expand into the early learning and global English language learning markets without significant additional costs associated with content development.
We believe we are a leader in transforming the traditional educational content and services landscape based on our market share, which is greater than 40% in our addressable market, and the size of our digital products portfolio, which includes approximately 34,000 titles. Our digital products portfolio, combined with our content development or distribution agreements with recognized technology leaders, such as Apple, Google, Intel and Knewton, enables us to bring our next-generation learning solutions and content to learners across virtually all platforms and devices. These agreements, however, are non-exclusive, and these technology leaders may also
4
Table of Contents
have agreements with our competitors who are moving into the digital-content market. Additionally, we believe our technology and development capabilities allow us to enhance content engagement and effectiveness with embedded assessment, interactivity, personalization and adaptivity.
In addition to our comprehensive instructional materials, we provide assessment solutions, school improvement and professional development services, which help teachers and administrators meet their academic objectives and regulatory mandates. We believe that our research-based education solutions are important for school systems and educators as they provide a comprehensive set of curriculum and instructional strategy solutions designed to deliver learning and teaching results both in the classroom and at home.
Market Opportunity
Rising Global Demand for Education
We believe we are a leading provider in the global learning market based on our market share and are well positioned to take advantage of the continued growth expected to result as more countries transition to knowledge-based economies, global markets integrate, and consumption, especially in emerging markets, rises. In International markets, we focus our offerings on English language education and instructional products. The global education sector, especially in Asia and the Middle East, is experiencing rising enrollments and increasing government and consumer spending driven by the close connection between levels of educational attainment, evolving standards, personal career prospects and economic growth that will increase the demand for our English language products. In particular, we believe that the educational markets where we are focusing our international growth, such as China, India, Brazil, Mexico and the Middle East, are poised for long-term growth. However, there can be no guarantee that the global educational markets will continue to rise or that we will be able to increase our market share in foreign countries or benefit from growth in these markets.
U.S. K-12 Market is Large and Growing
In the United States, which is our primary market today and in which we sell educational content for both public and private schools, the K-12 education sector represents one of the largest industry segments accounting for over $632 billion of expenditures, or about 4.4% of the 2011 U.S. gross domestic product as measured by the U.S Education’s National Center for Education Statistics (“NCES”) for the 2010-2011 school year. The instructional supplies and services component of this market was estimated to be approximately $30 billion in 2011 and is expected to continue growing as a result of several secular and cyclical factors. From 2000-01 to 2010-11, current expenditures per student in public elementary and secondary schools increased by 14%, after adjusting for inflation. However, there can be no assurance that the U.S. K-12 market will grow.
In addition to its size, the U.S. K-12 education market is highly decentralized and is characterized by complex content adoption processes. The sector is comprised of approximately 15,600 public school districts across the 50 states and 132,000 public and private elementary and secondary schools. We believe this market structure underscores the importance of scale and industry relationships and the need for broad, diverse coverage across states, districts and schools. Even while we believe certain initiatives in the education sector such as the Common Core State Standards, a set of shared math and literacy standards benchmarked to international standards, have increased standardization in K-12 education content, we believe significant state standard specific customization still exists, and we believe the need to address customization provides an ongoing need for companies in the sector to maintain relationships with individual state and district policymakers and expertise in state-varying academic standards.
Growth in the U.S. K-12 market for educational content and services will be driven by several factors. In the near term, total spend by institutions, which is largely dependent upon state and local funding, is rebounding in the wake of the U.S. economic recovery. While the market has historically grown above the pace of inflation, averaging 7.2% growth annually since 1969, the difficult operating environment stemming from the recession has caused many states and school districts to defer spending on educational materials. Following the recovery,
5
Table of Contents
and as tax revenues collected through income, sales and property taxes continue to rebound, institutional customers benefit from improved funding cycles. However, the U.S. economic recovery has been slower than anticipated and there can be no assurance that any further improvement will be significant. Nevertheless, states such as California, Florida and Texas have been moving forward with major adoptions of instructional materials. For example, in 2015 California is scheduled to adopt materials in English language arts, Florida is scheduled to adopt social studies materials, and Texas is expected to purchase social studies and high school mathematics materials adopted in 2014.
Longer-term growth in the U.S. K-12 market is positively correlated with student enrollments. Compared to 54.7 million students in 2010, total U.S. public school enrollments are expected to increase to approximately 58.0 million by the 2022 school year, according to NCES and the U.S. Census Bureau. Accordingly, NCES forecasts that the current expenditures in the U.S. K-12 market are expected to grow to approximately $699 billion by 2022-23. The instructional supplies and services market, which uses the types of educational materials and services that we offer, represents approximately 4.8%, or $33.5 billion, of these expenditures. There is no guarantee that spending will increase by the amount forecasted and, if it does, there is no guarantee that our sales will increase accordingly.
In addition, increased investment in areas of government policy focus is expected to further drive market growth. For example, President Obama has identified early childhood development as an important education initiative of his administration and has proposed a Preschool for All initiative, which has not been enacted, with a $75 billion budget over the next 10 years to increase access to high-quality early childhood education. In addition, according to a January 2015 report from the Education Commission of the States (ECS), state funding for Preschool programs totaled $6.3 billion in fiscal 2014-15, a 12% increase from the prior fiscal year. We believe the adoption of new academic standards in many states, including states that have adopted the Common Core State Standards in mathematics and English language arts, is also expanding the market for teacher professional development and school improvement services.
Increasing Focus on Accountability and Student Outcomes
U.S. K-12 education has come under significant political scrutiny in recent years, due to recognition of its importance to the U.S. society at large and concern over the perceived decline in U.S. students’ competitiveness relative to their international peers. An independent task force report published in March of 2012 by the Council on Foreign Relations, a non-partisan membership organization and think tank, observed that American students rank far behind global leaders in international tests of literacy, math and science, and concluded that the current state of U.S. education severely impairs the United States’ economic, military and diplomatic security as well as broader components of America’s global leadership.
These concerns helped lead to the passage of No Child Left Behind (“NCLB”), in 2002, which ushered in an era of stricter accountability, higher standards and increased transparency in education. Since the enactment of NCLB, states have been required to measure annual progress towards these standards and make results publicly available. Race to the Top, a competitive grant program initiated by the U.S. Department of Education (“DOE”) in 2009, continued the push for greater accountability, encouraging states to adopt internationally benchmarked college and career-ready standards and teacher evaluation systems based in part on standardized test scores. Since 2009, 46 states have adopted and most are now in the process of implementing new academic standards in mathematics and English language arts, based on the Common Core State Standards, developed under the auspices of governors and state chief school officers.
This heightened focus on accountability and the adoption of new, more rigorous standards has elevated the importance of, and helped drive demand for, high-quality, proven content that is aligned with these standards and empowers educators to meet new requirements. Schools have also increased their expenditures on services that provide them with the data management and assessment capabilities they need to measure their progress. Although this trend may lead to increases in spending by schools and districts, educational mandates and expenditures can also be affected by other factors.
6
Table of Contents
Growing Shift Towards Digital Materials
The digitalization of education content and delivery is also driving a substantial shift in the education market. An increasing number of schools are utilizing digital content in their classrooms and implementing online or blended learning environments, which mix the use of print and digital educational materials in the classroom. Technologies are also being adapted for educational uses on the internet, mobile devices and through cloud-computing, which permits the sharing of digital files and programs among multiple computers or other devices at the same time through a virtual network. An analysis conducted by the DOE in 2009 that surveyed more than a thousand empirical studies of online learning found that, on average, students in online learning conditions performed modestly better than those receiving face-to-face instruction.
While the adoption of technology within the U.S. K-12 market may differ significantly across districts and states due to varying resources and infrastructure, most schools are seeking to implement more technology and are seeking partners to help them create effective digital learning environments. In some cases, districts are requiring providers of instructional materials to include digital components in their offerings, and are exploring subscription-based models for acquiring content. Many educators also believe that the increased implementation of digital learning environments will enable the widespread use of learning analytics, which enhance the ability to monitor patterns or gather intelligence surrounding student behavior and learning to ultimately help schools build better pedagogical methods, target at-risk students and improve student retention.
Competitive Strengths
We believe we are a leader in our market based on our decades-long experience developing content and solutions and forming and maintaining long-term customer and industry relationships. We believe the following to be our key competitive strengths:
| • | High-quality content portfolio. Our intellectual property portfolio is one of our most valuable and difficult to replicate assets. It reflects multi-billion dollar investments over our history in content development, conceptualization and acquisition, including, on average, $120 million in annual pre-publication content development expenditures over the past five years. Our portfolio contains almost 500,000 separate International Standard Book Numbers, including print, digital and bundled titles, spanning education, general interest, children’s and reference works and includes content developed in collaboration with respected educational authors such as Irene Fountas, Gay Su Pinnell and Ed Berger. We leverage this content, which is backed by decades of research, to provide educational products and solutions used and relied upon daily by thousands of teachers, students, parents and lifelong learners. Our solutions provide comprehensive and effective educational curricula developed to meet or exceed U.S. and global education standards, including the Common Core State Standards. As an example of the efficacy of our educational content, a recent independent, gold standard randomized control trial study (the only research design meeting What Works Clearinghouse standards for demonstrating effectiveness), conducted by PRES Associates, concluded that students using HMH Journeys had significantly greater learning gains than similar students using competitors’ reading programs. |
| • | Long-standing relationships with educators and other key education stakeholders. Cultivating relationships with educators is a critical success factor in our market. Given the nature of K-12 education and the market’s multi-year usage cycle, wherein schools use a specific curriculum program for several years, we believe that educators have little room for error in selecting programs for their schools and seek out relationships with established providers to minimize curriculum selection risk. We believe our relationships with educators are an important source of competitive advantage. Our relationships reflect a long history of education policy expertise, unique content development competencies, and results-driven education solutions, and lead to strong contract retention and better access to new customers and future growth opportunities. For example, as states have considered adopting the Common Core State Standards and adding their state-specific academic requirements to Common Core State Standards, we have played an active role in the changing curriculum landscape. We have met with various state leaders and discussed generally the transition to Common Core State Standards and related matters, including how our products, |
7
Table of Contents
| services and capabilities can help educators with that transition. Separately, we provide fee-based teacher training sessions through our educational services offerings for educators adopting the Common Core State Standards. These services constitute part of our growing suite of professional services provided to improve educational effectiveness for schools and educators. |
Our sales force utilizes a strategic, consultative approach that involves stakeholders at every level of the decision-making process, from state legislators and school districts to school administrators and teachers. Our approach positions us to flexibly respond to schools’ and teachers’ needs, as demonstrated by our growing suite of professional services, which are focused on improving educational effectiveness at both the institutional and instructor levels.
| • | Iconic brands with international recognition. Our brands include characters and titles that we believe are recognized in the United States and internationally, such as Curious George, CliffsNotes, Gossie & Gertie, The Polar Express and Life of Pi, and which we believe resonate with students, teachers, educators and parents. We believe that nearly every school-aged child in the United States has used our curriculum as part of their education because we sell our educational products to approximately 13,850 public school districts and 14,600 private schools in the United States that collectively represent approximately 98% of student enrollments in the United States. Our comprehensive instructional materials reach 100% of the top 1,000 school districts in the United States. This combination of reach and recognition contributes to what we believe is a long-lasting relationship with consumers, who are introduced to our brands as children, use our educational products throughout their pre-K-12 school years, read our general interest titles as adults, and then purchase our content for their own children. We believe that we have a strong foundation upon which to further monetize our intellectual property across new media and channels, including websites, mobile applications, e-books and games. |
| • | Strategic relationships with industry and technology thought leaders. Our position as a leader in our market allows us to continually expand upon our strategic relationships with both industry and technology thought leaders. These relationships enable us to create innovative solutions that meet the evolving needs of the global education market. For example, our agreements with technology companies in the U.S. K-12 education market include a non-exclusive digital distribution agreement with Apple under which our educational content is delivered on the iOS platform as interactive textbooks through the iBookstore and a non-exclusive agreement with Knewton to deliver adaptive learning solutions to K-12 students in the United States via the integration of our educational content with Knewton’s proprietary personalized learning technology. Additionally, we have entered into a series of agreements with A&E, a cable and television channel, enabling us to develop and offer traditional and digital instructional materials featuring A&E History multimedia content in co-branded products in the U.S. market. |
| • | Strong financial position and scalable business model. Our strong financial position is derived from our ability to generate significant cash flow from operating activities and the actions that we have taken over the past few years. For the years ended December 31, 2014, 2013 and 2012, we generated $491.0 million, $157.2 million and $104.8 million of cash flow from operations, respectively. As a result of the lingering impact of the economic recession on spending, our significant non-cash charges associated with our 2010 recapitalization, and other factors, we generated net losses for the years ended December 31, 2014, 2013 and 2012 of $111.5 million, $111.2 million and $87.1 million, respectively. |
We believe that as we continue to monetize our content across newly developed channels, we will begin to realize even greater sales while incurring lower incremental costs, which will further improve our operating margins. In addition, as we distribute more of our content in digital formats, our operating margins will benefit from lower development and distribution costs relative to print products. We have embraced this gradual shift to digital through our “hybrid” offerings of print and digital products that allow for flexibility in the delivery of an education curriculum while allowing us to benefit from better margins as more and more schools make the transition to digital. Because of these factors, we believe our business model is scalable since we should be able to generate future revenue without materially increasing our costs as we
8
Table of Contents
believe our current infrastructure, warehousing and fulfillment capabilities can support increased sales. Our debt balance of $243.1 million as of December 31, 2014, current cash and short-term investment position of $743.3 million as of December 31, 2014 and total available liquidity of $963.4 million as of December 31, 2014 provide the flexibility to continue to invest in new projects and pursue selective acquisitions.
Products and Services
We are organized along two reportable segments: Education and Trade Publishing. Our primary segment measures are net sales and Adjusted EBITDA. The Education segment is our largest business, representing approximately 88% of our total net sales for each of the years ended December 31, 2014, 2013 and 2012.
Education
Our Education segment provides educational products, technology platforms and services to meet the diverse needs of today’s classrooms. These products and services include print and digital content in the form of textbooks, digital courseware, instructional aids, educational assessment and intervention solutions, which are aimed at improving learning outcomes, professional development and school reform services. With an in-house content development team supplemented by external specialists, we develop programs that can be aligned to state standards and customized for specific state requests. In addition, our Education segment offers a wide range of educational, cognitive and developmental standardized testing products in print and digital online formats, targeting the educational and clinical assessment markets. The principal markets for our Education products are elementary and secondary school systems.
The Education segment includes, in addition to our Houghton Mifflin Harcourt brand, such brands as Heinemann, Riverside, Holt McDougal, Great Source, Rigby, Saxon, Steck-Vaughn, and Math in Focus. These brands offer solutions in reading, language arts, mathematics, intervention, social studies, science and world languages, as well as curriculum resources, professional development services and an array of highly regarded educational, cognitive and developmental assessment products. These brands, collectively, benefit from a market share greater than 40% in our addressable market, which is the portion of the total market in which we sell our products and services, as well as strong relationships with its customers. Most of these relationships have been developed over many years through a service-based approach, which entails a member of our sales force interacting with the customer and providing a product or service tailored to meet the customer’s needs.
The Education segment net sales and Adjusted EBITDA were $1,209.1 million and $298.5 million, $1,207.9 million and $343.2 million and $1,128.6 million and $329.7 million, for the years ended December 31, 2014, 2013 and 2012, respectively.
Our Education products consist of the following offerings:
| • | Comprehensive Curriculum. The Comprehensive Curriculum group develops comprehensive educational programs intended to provide a complete course of study in a subject, either at a single grade level or across multiple grade levels, and serve as the primary source of classroom instruction. We develop and market Comprehensive Curriculum programs for the pre-K-12 market utilizing the Houghton Mifflin Harcourt brands. This group focuses its publishing portfolio on the subjects that have consistently received the highest priority from educators and educational policy makers, namely reading, literature and language arts, mathematics, science, world languages and social studies. Within each subject, comprehensive learning programs are designed and then marketed with a variety of proprietary products to maximize teaching effectiveness, including textbooks, workbooks, teachers’ guides and resources, audio and visual aids and technology-based products. |
| • | Supplemental and Intervention Products. We develop products targeted at addressing struggling learners through comprehensive intervention solutions, products targeted at assisting English language learners and products providing incremental instruction in a particular subject area. Supplemental Products are used both as alternatives and as supplements to Comprehensive Curriculum programs, |
9
Table of Contents
| enabling local educators to tailor their education programs in a cost-effective way that is irrespective of adoption schedules. Included with this group of products are professional books and developmental resources aimed at empowering pre-K-12 teachers, our Benchmark Assessment System, which allows teachers to evaluate students’ reading levels three times a year, and our Leveled Literacy Intervention System, which is a supplementary intervention program for children struggling with reading and writing. The author base includes prominent experts in teaching, such as Irene Fountas and Gay Su Pinnell, who support the practice of other teachers through books, videos, workshops and classroom tools. The Supplemental and Intervention Products group generates net sales and earnings that do not vary greatly with the adoption cycle. In addition, the development of supplemental and intervention materials tends to require significantly less capital investment than the development of a Comprehensive Curriculum program. |
| • | Educational Services. To extend our value proposition beyond curriculum, assessment and technology solutions, we provide consulting services to assist school districts in increasing accountability for improvement and offering professional development training, comprehensive services and school turnaround solutions. We believe our educational services offer integrated solutions that combine the best learning resources available today. These include learning resources that are supported with professional development in classroom assessment, teacher effectiveness and high-impact leadership, which have a measurable and sustainable impact on student achievement. |
| • | Assessment. Assessment products provide district and state-level solutions focused on clinical, group and formative assessment tools and platform solutions. Clinical solutions provide psychological and special needs testing to assess intellectual, cognitive and behavioral development. Our products include measurement tools and services relating to intellectual ability, academic achievement assessments around cognitive abilities and several diagnostic and assessment tools that assist in identifying the learning needs of students. |
| • | International. We sell our educational solutions into global education markets predominantly to large English language schools in high growth territories primarily in Asia, the Pacific, the Middle East, Latin America, the Caribbean and Africa. In addition to our sales and business development team, we have a global network of distributors in local markets around the world. |
Trade Publishing
Our Trade Publishing segment, which dates back to 1832, primarily develops, markets and sells consumer books in print and digital formats and licenses book rights to other publishers and electronic businesses in the United States and abroad. The principal markets for Trade Publishing products are retail stores (both physical and online) and wholesalers. Reference materials are also sold to schools, colleges, libraries, office supply distributors and other businesses.
Our Trade Publishing segment offers an extensive library of general interest, young readers and reference works that include well-known characters and brands. Our award-winning general interest titles encompass literary fiction, culinary, and non-fiction in hardcover, e-book and paperback formats, including the Mariner Books paperback line. Among the general interest properties are the popular J.R.R. Tolkien titles and the prolific Best American series. The general interest group also publishes the CliffsNotes series of test prep and study guides, branded field guides, such as the Peterson Field Guides and Taylor’s Gardening Guides and extensive culinary works. With the 2012 acquisition of certain culinary and reference assets, we bolstered our catalog and increased our market share in those two niches. In culinary, our catalog now includes major cookbook brands such as Betty Crocker and Better Homes and Gardens in addition to recent best sellers including the How to Cook Everything series. Our catalog features numerous Nobel and Pulitzer Prize winners and Newbery and Caldecott medal winners, including a 2014 and 2013 Caldecott Honor winner and a 2014 Pulitzer Prize winner. In young readers publishing, a segment in which we demonstrated growth in 2014, our list addresses a broad age group and includes an array of products for the preschool/early learning market, including board books, picture books and workbooks. This list includes recognized characters such as Curious George and Martha Speaks, both
10
Table of Contents
successful television programs featured on PBS, Five Little Monkeys, Gossie & Gertie, and many more. We also publish novels for young adults, a growing genre which we bolstered with additional editorial talent in 2014. In the reference category, we are the publisher of the American Heritage and Webster’s New World dictionaries, and related titles.
Even before e-books gained prominence in the market, we had developed in-house experience in converting, structuring, storing and distributing dictionary and other reference content for digital platforms, and applied our knowledge and tools in the digital space to consumer trade content including e-books and applications. In addition to traditional conversions of print to digital content, we now develop our content digitally in various formats with minimal incremental investment, and we employ in-house programmers and developers to produce new digital content based on our trade products. For example, we have brought the Curious George character to multiple digital platforms with the development of a prominent website, curiousgeorge.com, which is an award-winning interactive learning tool for pre-school children, and a suite of Curious George apps, which both entertain and educate early learners at home. As such, we have an established and flexible solution for converting, manipulating and distributing trade content to the many emerging digital consumer platforms such as e-readers and tablets. We continue to actively publish into the sizable consumer market for e-books, book or character-based applications and other digital products with net sales from e-books reaching $24.0 million for the year ended December 31, 2014, and now representing approximately 15% of our Trade Publishing segment net sales for the same period. We continue to focus on the development of innovative new digital products which capitalize on our content, our digital expertise, and the growing consumer demand for these products. In addition, we are increasingly leveraging the strength of our Trade Publishing brands and characters, such as Curious George, together with our expertise in developing educational solutions, to further penetrate the large and growing consumer market for at-home educational products and services.
For the years ended December 31, 2014, 2013 and 2012, Trade Publishing net sales and Adjusted EBITDA were approximately $163.2 million and $12.7 million, $170.7 million and $24.4 million, and $157.1 million and $28.8 million, respectively.
Our Industry
K-12 comprehensive curriculum or basal market
The U.S. K-12 comprehensive curriculum or basal market provides educational programs and assessments to approximately 55.0 million students across approximately 132,000 elementary and secondary schools. Basal programs cover curriculum standards in a particular subject and include a comprehensive offering of teacher and student materials required to conduct the class throughout the year. Products and services in basal programs include students’ print and digital offerings and a variety of supporting materials such as teacher’s editions, formative assessments, whole group instruction materials, practice aids, educational games and services.
Comprehensive curriculum programs are the primary source of classroom education for most K-12 academic subjects, and as a result, enrollment trends are a major driver of industry growth. Although economic cycles may affect short-term buying patterns, school enrollments, a driver of growth in the educational publishing industry, are highly predictable and are expected to trend upward over the longer term.
In addition, the market for comprehensive curriculum programs is affected by changes in state curriculum standards, which drive instruction, assessment, and accountability in each state. A significant change in state curriculum standards requires that assessments, teacher training programs, and instructional materials be revised or replaced to align to the new standards, which historically has driven demand for new comprehensive curriculum programs.
The majority of states are in the process of implementing or transitioning to new curriculum standards in the two most important subject areas, mathematics and English language arts. For the most part, these new standards are based on the Common Core State Standards, the product of a multi-state effort to establish a single set of
11
Table of Contents
content standards in mathematics and English language arts for grades K-12. Forty-six states and the District of Columbia have adopted the Common Core State Standards or curriculum standards based on them. Most of these states are administering new student assessments aligned to the new standards, including tests developed by two multistate testing consortia, the Smarter Balanced Assessment Consortium and the Partnership for Assessment of Readiness for College and Careers, beginning in the 2014-15 school year. Schools in these states will need to augment and replace instructional materials, including comprehensive curriculum programs, to align to the new standards and to prepare students for the new state assessments.
Instructional material adoption process
The process through which materials and curricula are selected and procured for classroom use varies throughout the United States. Twenty states, known as adoption states, approve and procure new basal programs usually every six to eight years on a state-wide basis, and individual schools or school districts typically purchase instructional materials from the state approved list, although in some adoption states districts may be permitted to select materials not on the state list. In all remaining states, known as open states or open territories, each individual school or school district can procure materials at any time, though usually according to a five to ten year cycle. In adoption states, the states approve curriculum and often provide dedicated funding for educational and instructional materials, while in open states, local school districts approve curriculum and provide funding.
The following chart illustrates the current adoption and open states:

The student population in adoption states represents over 50% of the U.S. elementary and secondary school-age population. A number of adoption states provide categorical state funding for instructional materials, that is, funds that typically cannot be used for any purpose other than to purchase instructional content or, in some cases, technology equipment used to deliver instruction. In some states, categorical instructional materials funds can be used only for the purchase of materials on the state-approved list.
In adoption states, the state education board’s decision to approve a certain program developed by an educational content provider depends on recommendations from instructional materials committees, which are often comprised of educators and curriculum specialists. Such committees typically recommend a program only if it aligns to the state’s educational content standards. To ensure the approval and subsequent success of a new instructional materials program, educational content providers typically conduct extensive market research, including: discussions of the planned curriculum with the state-level curriculum advisors to secure their support; development of prototype instructional materials that are focus-tested with educators, often against competing programs, to gather feedback on the program’s content and design; and incorporation of qualitative input from existing customers in terms of classroom needs.
In open territories, the procurement process is typically characterized by a presentation and provision of sample materials to instructional materials selection committees, which subsequently evaluate and recommend a particular program to district level school boards. Products are generally customized to meet the states’ curriculum standards with similar research methods as in adoption states.
12
Table of Contents
We believe that a content provider’s ultimate success in a given state will depend on a variety of factors, including the quality of its programs and materials, the strength of its relationships with key decision-makers and the magnitude of its marketing and sales efforts. As a result, educational content providers often implement formal market research efforts that include educator focus groups, prototypes of student and ancillary materials and comparisons against competing products. At the same time, marketing and editorial staffs work closely together to incorporate the results of research into products, while developing the most up-to-date, research- and needs-based curricula.
Supplemental and Intervention materials market
The supplemental and intervention materials market includes a wide range of product offerings targeted at addressing specific needs in a district generally not addressed through a comprehensive curriculum solution. These products are typically offered in the form of print, digital, service and blended product solutions. The development of supplemental materials and solutions tends to require significantly less capital investment than the development of a basal program. These materials and solutions enable local educators to tailor their education programs in a cost-effective way that is not tied to adoption schedules.
Supplemental products and services are funded through state and local resources as well as government funding allocations as designated through Title I of the Elementary and Secondary Education Act (“ESEA”) and the Individuals with Disabilities Education Act (“IDEA”). Title I distributes funding to those schools and school districts which are comprised of a relatively high percentage of students from low income families as defined by the ESEA. In addition, Title I appropriates money for the education system for the prevention of dropouts and the improvement of schools. IDEA governs how states and public agencies provide early intervention, special education and related services to children with disabilities. In recent years, the supplemental materials that schools have purchased have changed as the demands and expectations for educators and students have changed. Educational institutions have increasingly purchased digital solutions along with traditional supplemental materials and, with the growing emphasis on accountability, demand for targeted intervention solutions, school reform and turnaround services has been on the rise.
Assessment market
The assessment market includes summative, formative or in-classroom, and diagnostic assessments. Summative assessments are concluding or “final” exams that measure students’ proficiency in a particular subject or group of subjects on an aggregate level or against state standards. Formative assessments are on-going, in-classroom tests that occur throughout the school year and monitor progress in certain subjects or curriculum units. Diagnostic assessments are designed to pinpoint areas of need and are often administered by specialists to identify learning difficulties and qualify individuals for special services under the requirements of IDEA.
Many states and districts are also utilizing teacher evaluation systems that measure teacher performance based on standardized test scores and other elements required to meet certain benchmarks set by policymakers. Certain federal agencies are shifting the focus to children at even younger ages to provide intervention before significant achievement gaps are realized. As a result, this has led to additional opportunities in the early childhood development market.
Many states are implementing new statewide student assessment programs in the 2014-15 school year, including those promulgated by the Smarter Balanced Assessment Consortium and the Partnership Assessment of Readiness for College and Careers. Presently, 21 states are participating in the Smarter Balanced Assessment Consortium, while 12 states and the District of Columbia are participating in the Partnership Assessment of Readiness for College and Careers.
As states plan for the upcoming new assessments, and districts continue to transition to new standards based on the Common Core State Standards, demand for quality measures which help the districts prepare for the content coverage and item types anticipated on the new assessments should continue to increase.
13
Table of Contents
International market
The global education market continues to demonstrate strong macroeconomic growth characteristics. There are 1.4 billion students out of a 7.2 billion world population. Population growth is a leading indicator for pre-primary school enrollments, which have a subsequent impact on secondary and higher education enrollments. Globally, according to United Nations Educational, Scientific and Cultural Organization (“UNESCO”), rapid population growth has caused pre-primary enrollments to grow by 16.2% worldwide from 2007 to 2011. Additionally, the global population is expected to be approximately 9.0 billion by 2050, as countries develop and improvements in medical conditions increase the birth rate.
Internationally, we predominantly export and sell K-12 books to premium private schools that utilize the U.S. curriculum, which are located primarily in Asia, the Pacific, the Middle East, Latin America, the Caribbean and Africa. Our international sales team utilizes a global network of distributors in local markets around the world. According to the Book Industry Study Group and the Association of American Publishers, the size of the K-12 U.S. export market is estimated at $100 million, of which we have a growing market share.
Our immediate strategy is to expand our addressable market through working with local distributors to localize our K-12 content for sale into public and private schools in targeted international markets and to sell digitized content through key distributors into global school and consumer markets.
Trade Publishing market
The Trade Publishing market includes works of fiction and non-fiction in the General Interest and Young Reader’s categories, dictionaries and other reference works. While print remains the primary format in which trade books are produced and distributed, the market for trade titles in digital format, primarily e-books, has developed rapidly over the past several years, as the industry evolves to embrace new technologies for developing, producing, marketing and distributing trade works.
Seasonality
In the K-12 market, we typically receive payments for products and services from individual school districts, and, to a lesser extent, individual schools and states. In the case of testing and assessment products and services, payment is received from the individually contracted parties. In the Trade Publishing market, payment is received for products from book distributors and retail booksellers.
Approximately 88% of our net sales for the year ended December 31, 2014 were derived from our Education segment, which is a markedly seasonal business. Schools conduct the majority of their purchases in the second and third quarters of the calendar year in preparation for the beginning of the school year. Thus, over the past three years, approximately 67% of consolidated net sales were realized in the second and third quarters. Sales of K-12 instructional materials and customized testing products are also cyclical, with some years offering more sales opportunities than others. The amount of funding available at the state level for educational materials also has a significant effect on year-to-year net sales.
Competition
We sell our products in competitive markets. In these markets, product quality, customer service and perceived stability and longevity are major factors in generating sales growth. Other factors affecting sales growth in the K-12 market include the level of student enrollment in subjects that are up for adoption and the level of spending per student appropriated in each state and/or school district. Profitability is affected by industry developments including: (i) competitive selling, sampling and gratis costs; (ii) development costs for customized instructional materials and assessment programs; and (iii) higher technology costs due to the increased number of textbook program components being developed in digital formats. There are three primary traditional comprehensive curriculum publishers in the K-12 market, which also compete with a variety of specialized or
14
Table of Contents
regional publishers that focus on select disciplines and/or geographic regions. There are multiple competitors in the Trade Publishing, supplemental and assessment markets. Our larger competitors in the educational market include Pearson Education, Inc., McGraw Hill Education, Cengage Learning, Inc., Scholastic Corporation and K12 Inc.
Printing and binding; raw materials
We outsource the printing and binding of our products, with approximately 75% of our printing currently handled by one major supplier and one print services broker who negotiates on our behalf with an extended supplier base. We have procurement agreements that provide volume and scheduling flexibility and price predictability. We have a longstanding relationship with these parties. Approximately 20% of our printed materials (consisting primarily of teacher’s editions and other ancillary components) are printed outside of the United States and approximately 80% of our printed materials (including most student editions) are printed within the United States. Paper is one of our principal raw materials. We purchase our paper primarily through one paper merchant and also directly through suppliers for limited product types. We maintain various agreements that protect against supply availability and unbound price increases. We manage our paper supply concentration by having primary and secondary sources and staying ahead of dramatic market changes.
Distribution
We operate three distribution facilities from which we coordinate our own distribution process: one each in Indianapolis, Indiana; Geneva, Illinois; and Troy, Missouri. We also utilize select suppliers to assist us with coordinating the distribution process for a limited number of product types. Additionally, some adoption states require us to use in-state textbook depositories for educational materials sold in that particular state. We utilize delivery firms including United Parcel Service Inc., FedEx Freight, CH Robinson Worldwide Inc., YRC Freight, SAIA and USF Holland, Inc. to facilitate the principally ground transportation of products.
Employees
As of December 31, 2014, we had approximately 3,300 employees, none of which were covered by collective bargaining agreements. These employees are substantially located in the United States with approximately 230 employees located outside of the United States. We believe that relations with employees are generally good.
Intellectual property
Our principal intellectual property assets consist of our trademarks and copyrights in our content. Substantially all of our publications are protected by copyright, whether registered or unregistered, either in our name as the author of a work made for hire or the assignee of copyright, or in the name of an author who has licensed us to publish the work. Ownership of such copyrights secures the exclusive right to publish the work in the United States and in many countries abroad for specified periods: in the United States in most cases either 95 years from publication or for the author’s life plus 70 years, but in any event a minimum of 28 years for works published prior to 1978 and 35 years for works published thereafter. In most cases, the authors who retain ownership of their copyright have licensed to us exclusive rights for the full term of copyright. Under U.S. copyright law, for licenses granted by an author during or after 1978, such exclusive licenses are subject to termination by the author or certain of the author’s heirs for a five year period beginning at the end of 35 years after the date of publication of the work or 40 years after the date of the license grant, whichever term ends earlier.
We do not own any material patents, franchises or concessions, but we have registered certain trademarks and service marks in connection with our publishing businesses. We believe we have taken, and take in the ordinary course of business, all appropriate available legal steps to reasonably protect our intellectual property in all material jurisdictions.
15
Table of Contents
Environmental matters
We generally contract with independent printers and binders for their services, and our operations are generally not otherwise affected by environmental laws and regulations. However, as the owner and lessee of real property, we are subject to environmental laws and regulations, including those relating to the discharge of hazardous materials into the environment, the remediation of contaminated sites and the handling and disposal of wastes. It is possible that we could face liability, regardless of fault, and can be held jointly or severally liable, if contamination were to be discovered on the properties that we own or lease or on properties that we have formerly owned or leased. We are currently unaware of any material environmental liabilities or other material environmental issues relating to our properties or operations and anticipate no material expenditures for compliance with environmental laws or regulations.
Additional information
Houghton Mifflin Harcourt Company was incorporated as a Delaware corporation on March 5, 2010, and was established as the holding company of the current operating group. The Company changed its name from HMH Holdings (Delaware), Inc. on October 22, 2013. We make available our annual reports on Form 10-K, quarterly reports on Form 10-Q, current reports on Form 8-K and amendments to these reports, as well as other information, free of charge through our corporate website under the “Corporate Governance” link located at: ir.hmhco.com, as soon as reasonably practicable after being filed with or furnished to the Securities and Exchange Commission (the “SEC”). The information found on our website or any other website we refer to in this Annual Report is not part of this Annual Report or any other report we file with or furnish to the SEC.
16
Table of Contents
Our business and results of operations may be adversely affected by many factors outside of our control, including changes in federal, state and local education funding, general economic conditions and/or changes in the state procurement process.
The performance and growth of our U.S. educational comprehensive curriculum, supplemental and assessment businesses depend in part on federal and state education funding, which in turn is dependent on the robustness of state finances and the level of funding allocated to educational programs. State, local and municipal finances were and continue to be adversely affected by the recent U.S. economic recession and are affected by general economic conditions and factors outside of our control, as well as increasing costs and financial liabilities of under-funded public pension plans. In response to general economic conditions or budget shortfalls, states and districts may reduce educational spending to protect against existing or expected economic conditions or seek cost savings to mitigate budget deficits. Most public school districts, the primary customers for K-12 products and services, depend largely on state and local funding to purchase materials. In school districts in states that primarily rely on local tax proceeds, significant reductions in those proceeds for any reason can severely restrict district purchases of instructional materials. In districts and states that primarily rely on state funding for instructional materials, a reduction in state funds or loosening of restrictions on the use of those funds may reduce net sales. Additionally, many school districts receive substantial amounts through Federal education programs, funding for which may be reduced as a result of Congressional budget actions.
Federal and/or state legislative changes can also affect the funding available for educational expenditure, which include the impact of education reform, such as the reauthorization of the Elementary and Secondary Education Act (“ESEA”) and the implementation of Common Core State Standards. Existing programs and funding streams could be changed or eliminated in connection with legislation to reauthorize the ESEA and/or the federal appropriations process, in ways that could negatively affect demand and sources of funding for our products and services. Our business, results of operations and financial condition may be materially adversely affected by many factors outside of our control, including, but not limited to, delays in the timing of adoptions, changes in curricula and changes in student testing processes. There can be no assurances that states or districts will have sufficient funding to purchase our products and services, that we will win their business in our competitive marketplace or that schools or districts that have historically purchased our products and services will do so again in the future.
There is considerable political controversy in many states surrounding the adoption and implementation of Common Core State Standards. Legislation has been introduced in a number of states to drop Common Core standards, and some states are considering revisions to and/or rebranding of the standards. These developments could disrupt local adoptions of instructional materials and require modifications to our programs offered for sale in states that adopt such changes.
Similarly, changes in the state procurement process for textbooks, supplemental materials and student tests, particularly in adoption states, can also affect our markets and sales. A significant portion of our net sales is derived from sales of K-12 instructional materials pursuant to cyclical adoption schedules. Due to the revolving and staggered nature of state adoption schedules, sales of K-12 instructional materials have traditionally been cyclical, with some years offering more sales opportunities than others. In addition, changes in curricula and changes in the student testing processes can negatively affect our programs and therefore the size of our market in any given year.
For example, over the next few years, adoptions are scheduled in one or more of the primary subjects of reading, language arts and literature, social studies and mathematics in, among others, the states of California, Texas and Florida, the three largest adoption states. The inability to succeed in these states, or reductions in their anticipated funding levels, could materially and adversely affect net sales for the year of adoption and subsequent years. Allowing districts flexibility to use state funds previously dedicated exclusively to the purchase of
17
Table of Contents
instructional materials and other items such as technology hardware and training could adversely affect district expenditures on state-adopted instructional materials in the future.
Decreases in federal and state education funding and negative trends or changes in general economic conditions can have a material adverse effect on our business, results of operations and financial condition.
Introduction of new products, services or technologies could impact our profitability.
We operate in highly competitive markets that continue to change to adapt to customer needs. In order to maintain a competitive position, we must continue to invest in new content and new ways to deliver our products and services. These investments may not be profitable or may be less profitable than what we have experienced historically. In particular, in the context of our current focus on key digital opportunities, including e-books, the market is evolving and we may be unsuccessful in establishing ourselves as a significant competitor. New distribution channels, such as digital platforms, the internet, online retailers and delivery platforms (e.g., tablets and e-readers), present both threats and opportunities to our traditional publishing models, potentially impacting both sales volumes and pricing.
Our operating results fluctuate on a seasonal and quarterly basis and our business is dependent on our results of operations for the third quarter.
Our business is seasonal. For the year ended December 31, 2014, we derived approximately 88% of net sales from our Education Segment. For sales of educational products, purchases typically are made primarily in the second and third quarters of the calendar year, in preparation for the beginning of the school year, though testing net sales are primarily generated in the second and fourth quarters. We typically realize a significant portion of net sales during the third quarter, making third-quarter results material to full-year performance. This sales seasonality affects operating cash flow from quarter to quarter. We normally incur a net cash deficit from all of our activities through the middle of the third quarter of the year. In addition, changes in our customers’ ordering patterns may impact the comparison of results in a quarter with the same quarter of the previous year, in a quarter with the consecutive quarter or a fiscal year with the prior fiscal year.
Agreements with Resellers.
We have entered into agreements with resellers from time to time pertaining to certain defined products and channels. These agreements have been both exclusive and non-exclusive and have pertained to specific products as well as specific channels. Depending on the timing of when orders with resellers occur, an individual transaction with a reseller could potentially be material to the quarter or year in which it occurs. Furthermore, there is no assurance that future orders from resellers will occur within similar timeframes as past orders or be of similar magnitude. Some of our agreements have performance metrics which allow for one or both parties to terminate the agreement. If such termination were to occur, our sales could be materially impacted.
Receivables to our two largest resellers comprised approximately 17.0% of our December 31, 2014 accounts receivable balance. If such resellers are unable to remit contractual payments when due or at all, our financial results and cash position for the quarter and year could be materially impacted.
Our business is and will continue to be impacted by the rate of and state of technological change, including the digital evolution and other disruptive technologies, and the presence and development of open-sourced content could continue to increase, which could adversely affect our net sales.
Our industry has been impacted by the digitalization of content and proliferation of distribution channels, either over the internet, or via other electronic means, replacing traditional print formats. The digital migration brings the need for change in product distribution, consumers’ perception of value and the publisher’s position between retailers and authors. Such digitalization increases competitive threats both from large media players and
18
Table of Contents
from smaller businesses, online and mobile portals. If we are unable to continue to adapt and transition to the move to digitalization at the rate of our competitors, our ability to effectively compete in the marketplace will be affected.
In recent years, there have been initiatives by non-profit organizations such as the Gates Foundation and the Hewlett Foundation to develop educational content that can be “open sourced” and made available to educational institutions for free or nominal cost. To the extent that such open sourced content is developed and made available to educational customers and is competitive with our instructional materials, our sales opportunities and net sales could be adversely affected.
Technological changes and the availability of free or relatively inexpensive information and materials may also affect changes in consumer behavior and expectations. Public and private sources of free or relatively inexpensive information and lower pricing for digital products may reduce demand and impact the prices we can charge for our products and services. To the extent that technological changes and the availability of free or relatively inexpensive information and materials limit the prices we can charge or demand for our products and services, our business, financial position and results of operations may be materially adversely affected.
Changes in product distribution channels and/or customer bankruptcy may restrict our ability to grow and affect our profitability in our Trade Publishing segment.
New distribution channels such as digital formats, the internet, online retailers, growing delivery platforms (e.g., tablets and e-readers), combined with the concentration of retailer power, pose threats and provide opportunities to our traditional consumer publishing models in our Trade Publishing segment, potentially impacting both sales volumes and pricing. The economic slowdown combined with the trend in distribution channels toward the use of e-books has created contraction in the consumer books retail market that has increased the risk of bankruptcy of major retail customers. Additional bankruptcies of traditional “bricks and mortar” retailers of Trade Publishing could negatively affect our business, financial condition and results of operations.
Expansion of our investments and business outside of our traditional core U.S. market may result in lower than expected returns and incremental risks.
To take advantage of international growth opportunities and to reduce our reliance on our core U.S. market, we are increasing our investments in a number of countries and emerging markets, including Asia and the Middle East, some of which are inherently more risky than our investments in the U.S. market. Political, economic, currency, reputational and corporate governance risks, including fraud, as well as unmanaged expansion, are all factors which could limit our returns on investments made in these markets. For example, political instability in the Middle East has caused uncertainty in the region, which could affect our results of operations in the region. Also, certain international customers require longer payment terms, increasing our credit risk. As we expand internationally, these risks will become more pertinent to us and could have a bigger impact on our business.
We operate in a highly competitive environment that is subject to rapid change and we must continue to invest and adapt to remain competitive.
Our businesses operate in highly competitive markets, with significant established competitors, such as Pearson Education, Inc., McGraw Hill Education, Cengage Learning, Inc., Scholastic Corporation, K12 Inc. and John Wiley & Sons, Inc. These markets continue to change in response to technological innovations and other factors. Profitability is affected by developments in our markets beyond our control, including: changing U.S. federal and state standards for educational materials; rising development costs due to customers’ requirements for more customized instructional materials and assessment programs; changes in prevailing educational and testing methods and philosophies; higher technology costs due to the trend toward delivering more educational content in both traditional print and electronic formats; market acceptance of new technology products, including online or computer-based testing; an increase in the amount of materials given away in the K-12 markets as part of a
19
Table of Contents
bundled pack; the impact of the expected increase in turnover of K-12 teachers and instructors on the market acceptance of our products; customer consolidation in the retail and wholesale trade book market and the increased dependence on fewer but stronger customers; rising advances for popular authors and market pressures to maintain competitive retail pricing; a material increase in product returns or in certain costs such as paper; and overall uncertain economic issues that affect all markets.
We cannot predict with certainty the changes that may occur and the effect of those changes on the competitiveness of our businesses, and the acceleration of any of these developments may materially and adversely affect our profitability.
The means of delivering our products may be subject to rapid technological change. Although we have undertaken several initiatives and invested significant amounts of capital to adapt to and benefit from these changes, we cannot predict whether technological innovations will, in the future, make some of our products, particularly those printed in traditional formats, wholly or partially obsolete. If this were to occur, we might be required to invest significant resources to further adapt to the changing competitive environment. In addition, we cannot predict whether end customers will have sufficient funding to purchase the equipment needed to use our new technology products.
In order to maintain a competitive position, we must continue to invest in new offerings and new ways to deliver our products and services. These investments may not be profitable or may be less profitable than what we have experienced historically. We could experience threats to our existing businesses from the rise of new competitors due to the rapidly changing environment within which we operate.
There is a risk that technology companies may offer educational materials that compete with our products.
While our educational content is protected by copyright law, there is nothing to prevent technology companies from developing their own educational digital products and offering educational content to schools. Technology companies are free to distribute materials with and on their technology devices and platforms. Many technology companies have substantial resources that they could devote to expand their business, including the development of educational digital products. Furthermore, while we have entered into digital distribution agreements with a number of technology companies, our agreements are non-exclusive arrangements and there is nothing to prevent such technology companies from developing and distributing other educational content to the K-12 market. There is a risk that a technology company with significant resources could license or acquire their own educational content and compete with us, which could negatively affect our business, financial condition and results of operations.
There is also a risk of further disintermediation, which is the occurrence of state, district and other customers contracting directly with technology companies. As a result, there is a risk that technology companies may own direct relationships with our customers, and accordingly, they may have a significant influence over the pricing and distribution strategies for digital and print education materials.
Our history of operations includes periods of operating and net losses, and we may incur operating and net losses in the future. Our significant net losses and our significant amount of indebtedness led us to declare bankruptcy in 2012.
For the years ended December 31, 2014, 2013 and 2012, we generated operating losses of $85.4 million, $86.6 million and $120.7 million, respectively, and net losses of $111.5 million, $111.2 million, and $87.1 million, respectively. See “Management’s Discussion and Analysis of Financial Condition and Results of Operations—Results of Operations” and the consolidated financial statements included elsewhere in this Annual Report for more information regarding our results of operations during these periods. If we continue to suffer operating and net losses, the trading price of our common stock may decline significantly.
20
Table of Contents
Our net losses in recent years were impacted from general economic conditions, reductions in significant markets, federal, state and local budget shortfalls and the contraction of spending throughout most states, non-cash charges associated with our 2010 recapitalization, among other things. In addition, we had a significant amount of indebtedness prior to May 2012. During May 2012, as a result of our financial position, results of operations and significant amount of indebtedness, we filed a voluntary petition for bankruptcy under Chapter 11 of the United States Bankruptcy Code. On June 22, 2012, we emerged from bankruptcy pursuant to a pre-packaged plan of reorganization. Although we have significantly less interest expense as a result of our emergence from bankruptcy and have decreased our selling and administrative expenses, we may not generate sufficient net sales in future periods to pay for all of our operating or other expenses, which could have a material adverse effect on our business, results of operations and financial condition.
Our ability to enforce our intellectual property and proprietary rights may be limited, which may harm our competitive position and materially and adversely affect our business and results of operations.
Our products are largely comprised of intellectual property content delivered through a variety of media, including books and digital and web-based media. We rely on copyright, trademark and other intellectual property laws to establish and protect our proprietary rights in these products. However, we cannot make assurances that our proprietary rights will not be challenged, invalidated or circumvented. We conduct business in other countries where the extent of effective legal protection for intellectual property rights is uncertain, and this uncertainty could affect future growth. Moreover, despite the existence of copyright and trademark protection under applicable laws, third parties may nonetheless violate our intellectual property rights, and our ability to remedy such violations, particularly in foreign countries, may be limited. In addition, the copying and distribution of content over the Internet creates additional challenges for us in protecting our proprietary rights. If we are unable to adequately protect and enforce our intellectual property and proprietary rights, our competitive position may be harmed and our business and financial results could be materially and adversely affected.
We are subject to risks based on Information Technology (“IT”) systems and technological change. A major data privacy breach or unanticipated IT system failure may cause reputational damage to our brands and financial loss.
Our business is dependent on information technology. We either provide software and/or internet-based services to our customers or we use complex IT systems and products to support our business activities, particularly in infrastructure and as we move our products and services to an increasingly digital delivery platform.
We face several technological risks associated with software product development and service delivery in our educational businesses, information technology security (including virus and hacker attacks), e-commerce, enterprise resource planning, system implementations and upgrades. Our growth strategy includes a consumer e-commerce strategy and an integrated solutions strategy that further subjects us to technological risks. If our e-commerce and integrated solutions expansion strategy is not successful, our business and growth prospects may be adversely affected. Additionally, the failure to recruit and retain staff with relevant skills may constrain our ability to grow as we combine traditional publishing products with online service offerings.
Across our businesses we hold large volumes of personal data, including that of employees, customers and students. Failure to adequately protect such personal data could lead to penalties, significant remediation costs, reputational damage, potential cancellation of existing contracts and inability to compete for future business. We have policies, processes, internal controls and cybersecurity mechanisms in place intended to ensure the stability of our information technology, provide security from unauthorized access to our systems and maintain business continuity, but no mechanisms are entirely free from failure and we have no guarantee that our security mechanisms will be adequate to prevent all possible security threats. Our operating results may be adversely impacted by unanticipated system failures, data corruption or breaches in security.
21
Table of Contents
We rely on third-party software development as part of our digital platform.
Some of the technologies and software that compose our instruction and assessment technologies are developed by third parties. We rely on those third parties for the development of future components and modules. Thus, we face risks associated with software product development and the ability of those third parties to meet our needs and their obligations under our contracts with them.
We may not be able to complete, or achieve the expected benefits from, any future acquisitions, which could materially and adversely affect our growth.
We have at times used acquisitions as a means of expanding our business and expect that we will continue to do so. If we do not successfully integrate acquisitions, anticipated operating advantages and cost savings may not be realized. The acquisition and integration of companies involve a number of risks, including: use of available cash, new borrowings or borrowings under our revolving credit facility to consummate the acquisition; demands on management related to the increase in our size after an acquisition; diversion of management’s attention from existing operations to the integration of acquired companies; integration of companies’ existing systems into our systems; difficulties in the assimilation and retention of employees; and potential adverse effects on our operating results.
We may not be able to maintain the levels of operating efficiency that acquired companies achieved independently. Successful integration of acquired operations will depend upon our ability to manage those operations and to eliminate redundant and excess costs. We may not be able to achieve the cost savings and other benefits that we would hope to achieve from acquisitions, which could materially and adversely affect our business, financial condition and results of operations.
We may not be able to retain or attract the key management, creative, editorial and sales personnel that we need to remain competitive and grow.
Our success depends, in part, on our ability to continue to retain key management and other personnel. We operate in a number of highly visible industry segments where there is intense competition for experienced and highly effective individuals, including authors. Our successful operations in these segments may increase the market visibility of members of key management, creative and editorial teams and result in their recruitment by other businesses. There can be no assurance that we can continue to attract and retain the necessary talented employees, including executive officers and other key members of management and, if we fail to do so, it could adversely affect our business.
In addition, our sales personnel make up approximately 15% of our employees, and our business results depend largely upon the experience, knowledge of local market dynamics and long-standing customer relationships of such personnel. Our inability to retain or hire effective sales people at economically reasonable compensation levels could materially and adversely affect our ability to operate profitably and grow our business.
A significant increase in operating costs and expenses could have a material adverse effect on our profitability.
Our major expenses include employee compensation and printing, paper and distribution costs for product-related manufacturing. We offer competitive salary and benefit packages in order to attract and retain the quality employees required to grow and expand our businesses. Compensation costs are influenced by general economic factors, including those affecting the cost of health insurance and post-retirement benefits, and any trends specific to the employee skillsets we require. We could experience changes in pension costs and funding requirements due to poor investment returns and/or changes in pension laws and regulations.
Paper is one of our principal raw materials and, for the year ended December 31, 2014, our paper purchases totaled approximately $57 million while our manufacturing costs totaled approximately $267 million. As a result, our business may be negatively impacted by an increase in paper prices. Paper prices fluctuate based on the
22
Table of Contents
worldwide demand and supply for paper in general and for the specific types of paper used by us. The price of paper may fluctuate significantly in the future, and changes in the market supply of, or demand for paper, could affect delivery times and prices. Paper suppliers may consolidate and as a result, there may be future shortfalls in supplies necessary to meet the demands of the entire marketplace. We may need to find alternative sources for paper from time to time. Our books and workbooks are printed by third parties and we typically have multi-year contracts for the production of books and workbooks. Increases in any of our operating costs and expenses could materially and adversely affect our profitability and our business, financial condition and results of operations.
We make significant investments in information technology data centers and other technology initiatives, as well as significant investments in the development of programs for the K-12 marketplace. Although we believe we are prudent in our investment strategies and execution of our implementation plans, there is no assurance as to the ultimate recoverability of these investments.
We also have other significant operating costs, and unanticipated increases in these costs could adversely affect our operating margins. Higher energy costs and other factors affecting the cost of publishing, transporting and distributing our products could adversely affect our financial results. Our inability to absorb the impact of increases in paper costs and other costs or any strategic determination not to pass on all or a portion of these increases to customers could adversely affect our business, financial condition and results of operations.
Exposure to litigation could have a material effect on our financial position and results of operations.
We are involved in legal actions and claims arising from our business practices and face the risk that additional actions and claims will be filed in the future. Litigation alleging infringement of copyrights and other intellectual property rights has become extensive in the educational publishing industry. At present, there are various suits pending or threatened which claim that we exceeded the print run limitation or other restrictions in licenses granted to us to reproduce photographs in our instructional materials. A number of similar claims against us have already been settled. While management does not expect any of these matters to have a material adverse effect on our results of operations, financial position or cash flows, due to the inherent uncertainty of the litigation process, the resolution of any particular legal proceeding or change in applicable legal standards could have a material effect on our financial position and results of operations.
We have insurance in such amounts and with such coverage and deductibles as management believes is reasonable. However, there can be no assurance that our liability insurance will cover all events or that the limits of coverage will be sufficient to fully cover all potential liabilities.
Operational disruption to our business caused by a major disaster, external threats or the loss of one of our key third-party print vendors could restrict our ability to supply products and services to our customers.
Across all our businesses, we manage complex operational and logistical arrangements including distribution centers, data centers and large office facilities as well as relationships with third-party print vendors. We have also outsourced some support functions, including application maintenance support, to third-party providers. Failure to recover from a major disaster (such as fire, flood or other natural disaster) at a key facility or the disruption of supply from a key third-party vendor, developer or distributor (e.g., due to bankruptcy) could restrict our ability to service our customers. External threats, such as terrorist attacks, strikes, weather and political upheaval, could affect our business and employees, disrupting our daily business activities.
We currently rely on two key third-party print vendors to handle approximately 76% of our printing requirements, and we expect a small number of print vendors will continue to account for a substantial portion of our printing requirements for the foreseeable future. The loss of, or a significant adverse change in our relationships with, our key print vendors could have a material adverse effect on our business and cost of sales. There can be no assurance that our relationships with our print vendors will continue or that their businesses or operations will not be affected by major disasters or external factors. If we were to lose one of our key print
23
Table of Contents
vendors, if our relationships with these vendors were to adversely change or if their businesses were impacted by general economic conditions or the factors described above, our business and results of operations may be materially and adversely affected.
We are subject to contingent liabilities that may affect liquidity and our ability to meet our obligations.
In the ordinary course of business, we issue performance-related surety bonds and letters of credit posted as security for our operating activities, some of which obligate us to make payments if we fail to perform under certain contracts in connection with the sale of instructional materials and assessment tests. The surety bonds are partially backstopped by letters of credit. As of December 31, 2014, our contingent liability for all letters of credit was approximately $20.2 million, of which $2.4 million were issued to backstop $11.3 million of surety bonds. The letters of credit reduce the borrowing availability on our revolving credit facility, which could affect liquidity and, therefore, our ability to meet our obligations. We may increase the number and amount of contracts that require the use of letters of credit, which may further restrict liquidity and, therefore, our ability to meet our obligations in the future.
We may be adversely affected by significant changes in interest rates.
Our financing indebtedness, including borrowings under our revolving credit facility, bears interest at variable rates. As of December 31, 2014, we had $243.1 million of aggregate principal amount indebtedness outstanding under our term loan facility that bears interest at a variable rate. An increase or decrease of 1% in the interest rate will change our interest expense by approximately $2.4 million on an annual basis. We also have up to $250 million of borrowing availability, subject to borrowing base availability, under our revolving credit facility, and borrowings under the revolving credit facility bear interest at a variable rate. Assuming that the revolving credit facility is fully drawn, an increase or decrease of 1% in the interest rate will change our interest expense associated with the revolving credit facility by $2.5 million on an annual basis.
If market interest rates increase, variable-rate debt will create higher debt service requirements, which could adversely affect our cash flow. If we enter into agreements limiting exposure to higher interest rates in the future, these agreements may not offer complete protection from this risk.
We may not be able to generate sufficient cash to service all of our indebtedness and may be forced to take other actions to satisfy our obligations under our indebtedness, which may not be successful.
Our ability to make scheduled payments or to refinance our debt obligations and to fund planned capital expenditures and other growth initiatives depends on our financial and operating performance, which is subject to prevailing economic and competitive conditions and to certain financial, business and other factors beyond our control. We may not be able to maintain a level of cash flow from operating activities sufficient to permit us to pay the principal, premium, if any, and interest on our indebtedness or to fund our other liquidity needs.
If our cash flows and capital resources are insufficient to fund our debt service obligations, we may be forced to reduce or delay capital expenditures, sell assets, seek additional capital or seek to restructure or refinance our indebtedness. These alternative measures may not be successful and may not permit us to meet our scheduled debt service obligations. In the absence of such operating results and resources, we could face substantial liquidity problems and might be required to sell material assets or operations to attempt to meet our debt service and other obligations. Our term loan facility and revolving credit facility restrict our ability to use the proceeds from asset sales. We may not be able to consummate those asset sales to raise capital or sell assets at prices that we believe are fair and proceeds that we do receive may not be adequate to meet any debt service obligations then due.
Despite our current leverage, we may still be able to incur substantially more debt. This could further exacerbate the risks that we face.
We may be able to incur substantial additional indebtedness, including additional secured indebtedness, in the future. The terms of the credit agreements do, and the agreements governing our existing and future
24
Table of Contents
indebtedness may restrict, but will not completely prohibit, us from doing so. As of December 31, 2014, we had approximately $220.0 million of borrowing base availability under our revolving credit facility. This may have the effect of reducing the amount of proceeds in the event of a liquidation. If new debt or other liabilities are added to our current debt levels, the related risks that we now face could intensify.
We may record future goodwill or indefinite-lived intangibles impairment charges related to our reporting units, which could materially adversely impact our results of operations.
We test our goodwill and indefinite-lived intangibles asset balances for impairment during the fourth quarter of each year, or more frequently if indicators are present or changes in circumstances suggest that impairment may exist. We assess goodwill for impairment at the reporting unit level and, in evaluating the potential for impairment of goodwill, we make assumptions regarding estimated net sales projections, growth rates, cash flows and discount rates. Although we use consistent methodologies in developing the assumptions and estimates underlying the fair value calculations used in our impairment tests, these estimates are uncertain by nature and can vary from actual results. Declines in the future performance and cash flows of the reporting unit or small changes in other key assumptions may result future goodwill impairment charges, which could materially adversely impact our results of operations. We had goodwill and indefinite-lived intangible assets of approximately $532.9 million and $439.7 million and $531.8 million and $440.0 million as of December 31, 2014 and 2013, respectively. There were no goodwill impairment charges for the years ended December 31, 2014, 2013 and 2012. For the years ended December 31, 2014, 2013 and 2012, impairment charges for indefinite-lived intangible assets were $0.4 million, $0.5 million, and $5.0 million, respectively.
Future sales of our common stock, or the perception in the public markets that these sales may occur, may depress the price of our common stock.
Additional sales of a substantial number of our shares of common stock in the public market, or the perception that such sales may occur, could have a material adverse effect on the price of our common stock and could materially impair our ability to raise capital through the sale of additional shares. As of February 12, 2015, we had 142,172,861 shares of common stock issued and outstanding that were freely tradable without restriction under the Securities Act of 1933, as amended (the “Securities Act”), except for any shares held or acquired by our directors, executive officers and other affiliates (as that term is defined in the Securities Act), which are restricted securities under the Securities Act. Restricted securities may not be sold in the public market unless the sale is registered under the Securities Act or an exemption from registration is available. The sale of such shares by our directors, executive officers or other stockholders in the public market, or the perception that these sales may occur, could cause the market price of our common stock to decrease significantly.
A significant amount of shares of our common stock have been registered for resale under a shelf registration statement. Pursuant to the Company’s investor rights agreement, certain of our stockholders have certain demand and piggyback rights that have, in the past, and may, in the future, require us to file registration statements registering their common stock or to include sales of such common stock in registration statements that we may file for ourselves or other stockholders. Any shares of common stock sold under these registration statements will be freely tradable in the public market. In the event such rights are exercised and a large number of common stock is sold in the public market, such sales could reduce the trading price of our common stock. These sales also could impede our ability to raise future capital. Additionally, we will bear all expenses in connection with any such registrations, except that the selling stockholders may be responsible for their pro rata shares of underwriters’ fees, commissions and discounts, stock transfer taxes and certain legal expenses.
Affiliates of Paulson & Co., Inc. own a significant portion of our outstanding common stock and have the right to nominate one director for election to our board of directors.
As of February 12, 2015, investment funds and managed accounts affiliated with Paulson & Co., Inc. (“Paulson”) beneficially owned, in the aggregate, approximately 22.5% of our outstanding common stock. We
25
Table of Contents
have entered into an amended and restated director nomination agreement with these stockholders, under which Paulson has the right to nominate one director for election to our board of directors, so long as Paulson holds at least 15% of our issued and outstanding common stock, and we have agreed to take certain actions in furtherance of Paulson’s rights under the director nomination agreement. In addition, if requested by Paulson, we have agreed to cause the director nominated by Paulson to be designated as a member of each committee of our board of directors, unless the designation would violate legal restrictions or the rules and regulations of the national securities exchange on which our common stock is listed. As a result of their ownership interests and director nomination rights, the stockholders affiliated with Paulson may have the ability to influence the outcome of matters that require approval of our stockholders or to otherwise influence the Company. The interests of these stockholders might conflict with, or differ from, other stockholder interests, and may cause us to pursue transactions or take actions that could enhance their equity investments, even though such transactions or actions may involve risks to other stockholders.
Item 1B. Unresolved Staff Comments
None.
Our principal executive office is located at 222 Berkeley Street, Boston, Massachusetts 02116. The following table describes the approximate building areas in square feet, principal uses and the years of expiration on leased premises of our significant operating properties as of December 31, 2014. We believe that these properties are suitable and adequate for our present and anticipated business needs, satisfactory for the uses to which each is put, and, in general, fully utilized.
| Location | Expiration year |
Approximate area | Principal use of space | Segment used by | ||||||||
| Owned Premises: |
||||||||||||
| Indianapolis, Indiana |
Owned | 491,779 | Warehouse | All segments | ||||||||
| Troy, Missouri |
Owned | 575,000 | Office and warehouse | Education | ||||||||
| Leased Premises: |
||||||||||||
| Orlando, Florida |
2019 | 250,842 | Office | Education | ||||||||
| Evanston, Illinois |
2017 | 150,050 | Office | Education | ||||||||
| Rolling Meadows, Illinois |
2015 | 112,014 | Office | Education | ||||||||
| Geneva, Illinois |
2019 | 485,989 | Office and warehouse | Education | ||||||||
| Wilmington, Massachusetts |
2015 | 22,102 | Office | Education | ||||||||
| Boston, Massachusetts (Corporate office) |
2017 | 328,686 | Office | All segments | ||||||||
| Portsmouth, New Hampshire |
2019 | 25,145 | Office | Education | ||||||||
| New York, New York |
2016 | 28,704 | Office | Trade Publishing | ||||||||
| Austin, Texas |
2016 | 195,230 | Office | Education | ||||||||
| Dublin, Ireland |
2025 | 39,944 | Office | Education | ||||||||
| Orlando, Florida |
2016 | 25,400 | Warehouse | Corporate Records Center | ||||||||
| Itasca, Illinois |
2016 | 46,823 | Warehouse | Education | ||||||||
In addition, we lease several other offices that are not material to our operations and, in some instances, are partially or fully subleased.
We are involved in ordinary and routine litigation and matters incidental to our business. Specifically, there have been various settled, pending and threatened litigation that allege we exceeded the print run limitation or other restrictions in licenses granted to us to reproduce photographs in our instructional materials. While
26
Table of Contents
management believes that there is a reasonable possibility we may incur a loss associated with the pending and threatened litigation, we are not able to estimate such amount, but we do not expect any of these matters to have a material adverse effect on our results of operations, financial position or cash flows. We have insurance in such amounts and with such coverage and deductibles as management believes is reasonable. There can be no assurance that our liability insurance will cover all events or that the limits of coverage will be sufficient to fully cover all liabilities.
Item 4. Mine Safety Disclosures
Not applicable.
Item 5. Market for Registrant’s Common Equity, Related Stockholder Matters and
Issuer Purchases of Equity Securities
Market information. Our common stock has been listed on the NASDAQ Global Select Market (“NASDAQ”) under the symbol “HMHC” since November 14, 2013. The following table sets forth, for the periods indicated, the high and low closing sales prices for our common stock as reported by NASDAQ.
| 2013 | High | Low | ||||||
| Fourth Quarter (from November 14, 2013) |
$ | 18.73 | $ | 13.74 | ||||
| 2014 | ||||||||
| First Quarter |
$ | 20.55 | $ | 17.07 | ||||
| Second Quarter |
20.82 | 17.66 | ||||||
| Third Quarter |
20.62 | 17.26 | ||||||
| Fourth Quarter |
20.91 | 18.88 | ||||||
The closing price of our common stock on NASDAQ on February 12, 2015, was $20.07 per share.
Holders. As of February 12, 2015, there were approximately 27 stockholders of record of our common stock, one of which was Cede & Co., a nominee for The Depository Trust Company. All of our common stock held by brokerage firms, banks and other financial institutions as nominees for beneficial owners are considered to be held of record by Cede & Co., who is considered to be one stockholder of record. A substantially greater number of holders of our common stock are “street name” or beneficial holders, whose shares of common stock are held of record by banks, brokers and other financial institutions. Because such shares of common stock are held on behalf of stockholders, and not by the stockholders directly, and because a stockholder can have multiple positions with different brokerage firms, banks and other financial institutions, we are unable to determine the total number of stockholders we have.
Dividends. We have never paid or declared any cash dividends on our common stock. At present, we intend to retain our future earnings, if any, to fund the operations and growth of our business. Our future decisions concerning the payment of dividends on our common stock will depend upon our results of operations, financial condition and capital expenditure plans, as well as other factors as our board of directors, in its discretion, may consider relevant, and the extent to which the declaration or payment of dividends may be limited by agreements we have entered or cause us to lose the benefits of certain of our agreements. See “Management’s Discussion and Analysis of Financial Condition and Results of Operations—Liquidity and Capital Resources.”
Securities authorized for issuance under equity compensation plans. The equity compensation plan information set forth in Part III, Item 12 of this Annual Report is incorporated by reference herein.
27
Table of Contents
Performance Graph. The graph below matches the cumulative return of holders of the Company’s common stock with the cumulative returns of the Dow Jones Publishing index, the S&P 500 index, the NASDAQ Composite index, the Russell 2000 index, and our Peer Group index, which is comprised of Pearson PLC, Scholastic Corporation, K-12 Inc., and John Wiley & Sons, Inc. The Russell 2000 index was included as the Company was added to that index during 2014. The graph assumes that the value of the investment in the Company’s common stock, in each index (including reinvestment of dividends) was $100 on November 14, 2013 and tracks it through February 12, 2015. All prices reflect closing prices on the last day of trading at the end of each period.
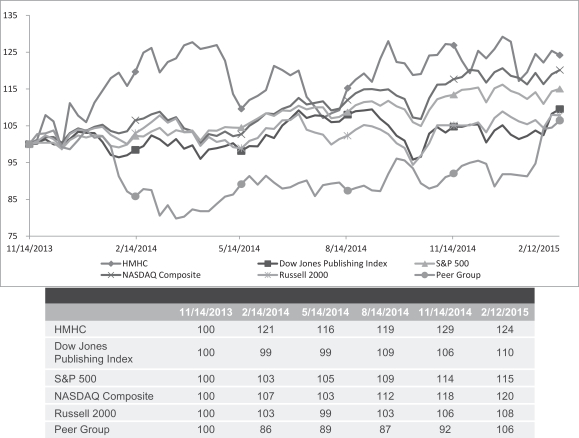
The stock price performance shown on the graph is not necessarily indicative of future price performance. Information used in the graph was obtained from a source we believe to be reliable, but we do not assume responsibility for any errors or omissions in such information.
Recent sales of unregistered securities. None.
28
Table of Contents
Item 6. Selected Financial Data
The following table summarizes the consolidated historical financial data of Houghton Mifflin Harcourt Company (Successor) and HMH Publishing Company (Predecessor) for the periods presented. We derived the consolidated historical financial data as of December 31, 2014 and 2013 and for the years ended December 31, 2014, 2013, and 2012 from our audited consolidated financial statements included in this Annual Report. We derived the consolidated historical financial statement data as of December 31, 2012, 2011 and 2010 (Successor), for the year ended December 31, 2011 and the periods March 10, 2010 to December 31, 2010 (Successor) and January 1, 2010 to March 9, 2010 (Predecessor) from our audited consolidated financial statements for such years, which are not included in this Annual Report. Historical results for any prior period are not necessarily indicative of results to be expected in any future period. The data set forth in the following table should be read together with the section entitled “Management’s Discussion and Analysis of Financial Condition and Results of Operations” and our consolidated financial statements and related notes thereto.
| Successor | Predecessor | |||||||||||||||||||||||
| (in thousands, except share and per share data) | 2014 | 2013 | Year Ended December 31, |
March 10, 2010 to December 31, 2010 |
January 1, 2010 to March 9, 2010 |
|||||||||||||||||||
| 2012 | 2011 | |||||||||||||||||||||||
| Operating Data: |
||||||||||||||||||||||||
| Net sales |
$ | 1,372,316 | $ | 1,378,612 | $ | 1,285,641 | $ | 1,295,295 | $ | 1,397,142 | $ | 109,905 | ||||||||||||
| Cost and expenses: |
||||||||||||||||||||||||
| Cost of sales, excluding pre-publication and publishing rights amortization |
588,726 | 585,059 | 515,948 | 512,612 | 559,593 | 45,270 | ||||||||||||||||||
| Publishing rights amortization (1) |
105,624 | 139,588 | 177,747 | 230,624 | 235,977 | 48,336 | ||||||||||||||||||
| Pre-publication amortization (2) |
129,693 | 121,715 | 137,729 | 176,829 | 181,521 | 37,923 | ||||||||||||||||||
|
|
|
|
|
|
|
|
|
|
|
|
|
|||||||||||||
| Cost of sales |
824,043 | 846,362 | 831,424 | 920,065 | 977,091 | 131,529 | ||||||||||||||||||
| Selling and administrative |
612,535 | 580,887 | 533,462 | 638,023 | 597,628 | 119,039 | ||||||||||||||||||
| Other intangible asset amortization |
12,170 | 18,968 | 54,815 | 67,372 | 57,601 | 2,006 | ||||||||||||||||||
| Impairment charge for investment in preferred stock, goodwill, intangible assets, pre-publication costs and fixed assets |
1,679 | 9,000 | 8,003 | 1,674,164 | 103,933 | 4,028 | ||||||||||||||||||
| Severance and other charges (3) |
7,300 | 10,040 | 9,375 | 32,801 | (11,243 | ) | — | |||||||||||||||||
| Gain on bargain purchase |
— | — | (30,751 | ) | — | — | — | |||||||||||||||||
|
|
|
|
|
|
|
|
|
|
|
|
|
|||||||||||||
| Operating loss |
(85,411 | ) | (86,645 | ) | (120,687 | ) | (2,037,130 | ) | (327,868 | ) | (146,697 | ) | ||||||||||||
|
|
|
|
|
|
|
|
|
|
|
|
|
|||||||||||||
| Other Income (expense) |
||||||||||||||||||||||||
| Interest expense |
(18,245 | ) | (21,344 | ) | (123,197 | ) | (244,582 | ) | (258,174 | ) | (157,947 | ) | ||||||||||||
| Other (loss) income, net |
— | — | — | — | (6 | ) | 9 | |||||||||||||||||
| Loss on extinguishment of debt |
— | (598 | ) | — | — | — | — | |||||||||||||||||
| Change in fair value of derivative instruments |
(1,593 | ) | (252 | ) | 1,688 | (811 | ) | 90,250 | (7,361 | ) | ||||||||||||||
|
|
|
|
|
|
|
|
|
|
|
|
|
|||||||||||||
| Loss before reorganization items and taxes |
(105,249 | ) | (108,839 | ) | (242,196 | ) | (2,282,523 | ) | (495,798 | ) | (311,996 | ) | ||||||||||||
| Reorganization items, net (4) |
— | — | (149,114 | ) | — | — | — | |||||||||||||||||
| Income tax expense (benefit) |
6,242 | 2,347 | (5,943 | ) | (100,153 | ) | 11,929 | (220 | ) | |||||||||||||||
|
|
|
|
|
|
|
|
|
|
|
|
|
|||||||||||||
| Net loss |
$ | (111,491 | ) | $ | (111,186 | ) | $ | (87,139 | ) | $ | (2,182,370 | ) | $ | (507,727 | ) | $ | (311,776 | ) | ||||||
|
|
|
|
|
|
|
|
|
|
|
|
|
|||||||||||||
| Net loss per share—basic and diluted (5) |
$ | (0.79 | ) | $ | (0.79 | ) | $ | (0.26 | ) | $ | (3.85 | ) | $ | (0.90 | ) | $ | (100,572.90 | ) | ||||||
|
|
|
|
|
|
|
|
|
|
|
|
|
|||||||||||||
| Net loss per share attributable to common stockholders—basic and diluted (5) |
$ | (0.79 | ) | $ | (0.79 | ) | $ | (0.26 | ) | $ | (3.85 | ) | $ | (0.90 | ) | $ | (100,572.90 | ) | ||||||
|
|
|
|
|
|
|
|
|
|
|
|
|
|||||||||||||
| Weighted average number of common shares used in net loss per share attributable to common stockholders—basic and diluted (5) |
140,594,689 | 139,928,650 | 340,918,128 | 567,272,470 | 567,272,470 | 3,100 | ||||||||||||||||||
|
|
|
|
|
|
|
|
|
|
|
|
|
|||||||||||||
| Balance Sheet Data (as of period end): |
||||||||||||||||||||||||
| Cash, cash equivalents and short-term investments |
$ | 743,345 | $ | 425,349 | $ | 475,119 | $ | 413,610 | $ | 397,740 | ||||||||||||||
| Working capital |
771,468 | 606,001 | 599,085 | 440,844 | 380,678 | |||||||||||||||||||
| Total assets |
3,011,107 | 2,910,386 | 3,029,584 | 3,263,903 | 5,257,155 | |||||||||||||||||||
| Debt (short-term and long-term) |
243,125 | 245,625 | 248,125 | 3,011,588 | 2,861,594 | |||||||||||||||||||
| Stockholders’ equity (deficit) |
1,759,680 | 1,850,276 | 1,943,701 | (674,552 | ) | 1,517,828 | ||||||||||||||||||
29
Table of Contents
| Successor | Predecessor | |||||||||||||||||||||||
| (in thousands, except share and per share data) | 2014 | 2013 | Year Ended December 31, |
March 10, 2010 to December 31, 2010 |
January 1, 2010 to March 9, 2010 |
|||||||||||||||||||
| 2012 | 2011 | |||||||||||||||||||||||
| Statement of Cash Flows Data: |
||||||||||||||||||||||||
| Net cash provided by (used in): |
||||||||||||||||||||||||
| Operating activities |
491,043 | 157,203 | 104,802 | 132,796 | 182,966 | $ | (41,296 | ) | ||||||||||||||||
| Investing activities |
(367,619 | ) | (168,578 | ) | (295,998 | ) | (195,300 | ) | (232,122 | ) | (25,616 | ) | ||||||||||||
| Financing activities |
19,529 | (4,075 | ) | 106,664 | 96,041 | 402,289 | (150 | ) | ||||||||||||||||
| Other Data: |
||||||||||||||||||||||||
| Capital expenditures: |
||||||||||||||||||||||||
| Pre-publication capital expenditures (6) |
115,509 | 126,718 | 114,522 | 122,592 | 96,613 | 22,057 | ||||||||||||||||||
| Other capital expenditures |
67,145 | 59,803 | 50,943 | 71,817 | 64,139 | 3,559 | ||||||||||||||||||
| Pre-publication amortization |
129,693 | 121,715 | 137,729 | 176,829 | 181,521 | 37,923 | ||||||||||||||||||
| Depreciation and intangible asset amortization |
190,084 | 220,264 | 290,693 | 356,388 | 342,227 | 61,242 | ||||||||||||||||||
| (1) | Publishing rights are intangible assets that allow us to publish and republish existing and future works as well as create new works based on previously published materials and are amortized on an accelerated basis over periods estimated to represent the useful life of the content. |
| (2) | We capitalize the art, prepress, manuscript and other costs incurred in the creation of the master copy of a book or other media and amortize such costs from the year of sale typically over five years on an accelerated basis. |
| (3) | Represents severance and real estate charges. The credit balance in 2010 relates to the reversal of certain charges recorded in prior periods due to a change in estimate. |
| (4) | Represents net gain associated with our Chapter 11 reorganization in 2012. |
| (5) | Gives retroactive effect to the Stock Split for all periods subsequent to our March 9, 2010 restructuring. |
| (6) | Represents capital expenditures for the art, prepress, manuscript and other costs incurred in the creation of the master copy of a book or other media. |
30
Table of Contents
Item 7. Management’s Discussion and Analysis of Financial Condition and Results of Operations
The following discussion and analysis is intended to facilitate an understanding of our results of operations and financial condition and should be read in conjunction with our consolidated financial statements and the accompanying notes included elsewhere in this Annual Report. The following discussion and analysis of our financial condition and results of operations contains forward-looking statements about our business, operations and industry that involve risks and uncertainties, such as statements regarding our plans, objectives, expectations and intentions. Actual results and the timing of events may differ materially from those expressed or implied in such forward-looking statements due to a number of factors, including those set forth under “Risk Factors” and elsewhere in this Annual Report. See “Risk Factors” and “Special Note Regarding Forward-Looking Statements.”
Overview
We are a global learning company, specializing in education solutions across a variety of media. We deliver content, services and technology to both educational institutions and consumers, reaching over 50 million students in more than 150 countries worldwide. In the United States, we are the leading provider of K-12 educational content by market share. Furthermore, since 1832, we have published trade and reference materials, including adult and children’s fiction and non-fiction books that have won industry awards such as the Pulitzer Prize, Newbery and Caldecott medals and National Book Award, all of which we believe are widely known. We believe our long-standing reputation and well-known brands enable us to capitalize on consumer and digital trends in the education market through our existing and developing channels.
Corporate History
Houghton Mifflin Harcourt Company was incorporated as a Delaware corporation on March 5, 2010, and was established as the holding company of the current operating group. The Company changed its name from HMH Holdings (Delaware), Inc. on October 22, 2013. Houghton Mifflin Harcourt was formed in December 2007 with the acquisition of Harcourt Education Group, then the second-largest K-12 U.S. publisher, by Houghton Mifflin Group. Houghton Mifflin Group was previously formed in December 2006 by the acquisition of Houghton Mifflin Publishers Inc. by Riverdeep Group plc. We are headquartered in Boston, Massachusetts.
Key Aspects and Trends of Our Operations
Business Segments
We are organized along two business segments: Education and Trade Publishing. Our Education segment is our largest segment and represented approximately 88% of our total net sales for each of the years ended December 31, 2014, 2013 and 2012. Our Trade Publishing segment represented approximately 12% of our total net sales for each of the years ended December 31, 2014, 2013 and 2012. The Corporate and Other category represents certain general overhead costs not fully allocated to the business segments, such as legal, accounting, treasury, human resources and executive functions.
Net Sales
We derive revenue primarily from the sale of print and digital content and instructional materials, trade books, reference materials, multimedia instructional programs, license fees for book rights, content, software and services, test scoring, consulting and training. We primarily sell to customers in the United States. Our net sales are driven primarily as a function of volume and, to a certain extent, changes in price. Our net sales consist of our billings for products and services, less revenue that will be deferred until future recognition and a provision for product returns. Deferred revenues primarily derive from work-texts, workbooks, online interactive digital content, digital and on-line learning components. The work-texts and workbooks are deferred until delivered,
31
Table of Contents
which often extends over the life of the contract and the online and digital content is typically recognized ratably over the life of the contract. The digitalization of education content and delivery is driving a substantial shift in the education market. An increasing number of schools are utilizing digital content in their classrooms and implementing online or blended learning environments, which is altering the historical mix of print and digital educational materials in the classroom. As a result, our business model has shifted to more digital and on-line learning components to address the needs of the education marketplace; thus, resulting in an increase in the percentage of our net sales being deferred.
Basal programs, which represent the most significant portion of our Education segment net sales, cover curriculum standards in a particular K-12 academic subject and include a comprehensive offering of teacher and student materials required to conduct the class throughout the school year. Products and services in basal programs include print and digital offerings for students and a variety of supporting materials such as teacher’s editions, formative assessments, whole group instruction materials, practice aids, educational games and services. The process through which materials and curricula are selected and procured for classroom use varies throughout the United States. Twenty states, known as adoption states, approve and procure new basal programs usually every five to seven years on a state-wide basis, before individual schools or school districts are permitted to schedule the purchase of materials. In all remaining states, known as open states or open territories, each individual school or school district can procure materials at any time, though usually according to a five to nine year cycle. The student population in adoption states represents over 50% of the U.S. elementary and secondary school-age population. Many adoption states provide “categorical funding” for instructional materials, which means that state funds cannot be used for any other purpose. Our basal programs, primarily in adoption states, typically have the higher deferred sales than other parts of the business. The higher deferred sales are primarily due to the length of time that our programs are being delivered, along with greater component and digital product offerings. A significant portion of our Education segment net sales is dependent upon our ability to maintain residual sales, which are subsequent sales after the year of the original adoption, and our ability to continue to generate new business. In addition, our market is affected by changes in state curriculum standards, which drive instruction, assessment and accountability in each state. Changes in state curriculum standards require that instructional materials be revised or replaced to align to the new standards, which historically has driven demand for basal programs.
We also derive our Education segment net sales from the sale of summative, formative or in-classroom and diagnostic assessments to districts and schools in all 50 states. Summative assessments are concluding or “final” exams that measure students’ proficiency in a particular academic subject or group of subjects on an aggregate level or against state standards. Formative assessments are on-going, in-classroom tests that occur throughout the school year and monitor progress in certain subjects or curriculum units. Additionally, our offerings include supplemental products that target struggling learners through comprehensive intervention solutions along with products targeted at assisting English language learners.
In international markets, our Education segment predominantly exports and sells K-12 books to premium private schools that utilize the U.S. curriculum, which are located primarily in Asia, the Pacific, the Middle East, Latin America and the Caribbean. Our international sales team utilizes a global network of distributors in local markets around the world.
Our Trade Publishing segment sells works of fiction and non-fiction for adults and children, dictionaries and other reference works through physical and online retail outlets and book distributors, as well as through our e-commerce platform.
Factors affecting our net sales include:
Education
| • | state or district per student funding levels; |
| • | the cyclicality of the purchasing schedule for adoption states; |
32
Table of Contents
| • | student enrollments; |
| • | adoption of new education standards; |
| • | technological advancement and the introduction of new content and products that meet the needs of students, teachers and consumers, including through strategic agreements pertaining to content development and distribution; and |
| • | the amount of net sales subject to deferrals which is impacted by the mix of product offering between digital and non-digital products along with the mix of product delivered immediately or over time. |
Trade Publishing
| • | consumer spending levels as influenced by various factors, including the U.S. economy and consumer confidence; |
| • | the transition to e-books and any resulting impact on market growth; |
| • | the publishing of bestsellers along with obtaining recognized authors; and |
| • | movie tie-ins to our titles that spur sales of current and backlist titles, which are titles that have been on sale for more than a year. |
State or district per student funding levels, which closely correlate with state and local receipts from income, sales and property taxes, impact our sales as institutional customers are affected by funding cycles. Most public school districts, the primary customers for K-12 products and services, are largely dependent on state and local funding to purchase materials. Recently, total educational materials expenditures by institutions in the United States is rebounding in the wake of the economic recovery. Globally, education expenditures are projected to grow at 7% through 2018, according to GSV Asset Management.
We monitor the purchasing cycles for specific disciplines in the adoption states in order to manage our product development and to plan sales campaigns. Our sales may be materially impacted during the years that major adoption states, such as Florida, California and Texas, are or are not scheduled to make significant purchases. For example, Florida implemented a language arts adoption in 2014 and is scheduled to adopt social studies materials in 2015, for purchase in 2016. Texas school districts purchased mathematics and science materials in 2014, and adopted social studies and high school math materials for purchase in 2015. California adopted math materials in 2013, with purchases expected to be spread over 2014-15, and is scheduled to adopt English language arts materials in 2015 for purchase beginning in 2016. Both Florida and Texas, along with several other adoption states, provide dedicated state funding for instructional materials and classroom technology, with funding typically appropriated by the legislature in the first half of the year in which materials are to be purchased. Texas has a two-year budget cycle and in the 2015 legislative session will appropriate funds for purchases in 2015 and 2016. California funds instructional materials in part with a dedicated portion of state lottery proceeds and in part out of general formula funds, with the minimum overall level of school funding determined according to the Proposition 98 funding guarantee. Nationally, total state funding for public schools has been trending upward as state revenues recover from the lows of the 2008-2009 economic recession. While we do not currently have contracts with these states for future instructional materials adoptions and there is no guarantee that we will continue to capture the same market share in the future, we have historically captured approximately 50% of the market share in these states in the years that they adopt educational materials for various subjects.
Longer-term growth in the U.S. K-12 market is positively correlated with student enrollments, which is a driver of growth in the educational publishing industry. Although economic cycles may affect short-term buying patterns, school enrollments are highly predictable and are expected to trend upward over the longer term. According to NCES, student enrollments are expected to increase from 54.7 million in 2010, to over 58.0 million by the 2022 school year. Outside the United States, the global education market continues to demonstrate strong
33
Table of Contents
macroeconomic growth characteristics. Population growth is a leading indicator for pre-primary school enrollments, which have a subsequent impact on secondary and higher education enrollments. Globally, according to UNESCO, rapid population growth has caused pre-primary enrollments to grow by 16.2% worldwide from 2007 to 2011. The global population is expected to be approximately 9.0 billion by 2050, as countries develop and improvements in medical conditions increase the birth rate.
The digitalization of education content and delivery is also driving a substantial shift in the education market. As the K-12 educational market transitions to purchasing more digital solutions, our ability to offer embedded assessments, adaptive learning, real-time interaction and student specific personalization in addition to our core educational content in a platform- and device-agnostic manner will provide new opportunities for growth.
Our Trade Publishing segment is heavily influenced by the U.S. and broader global economy, consumer confidence and consumer spending. As the economy continues to recover, both consumer confidence and consumer spending have increased and are at their highest level since 2008.
While print remains the primary format in which trade books are produced and distributed, the market for trade titles in digital format, primarily e-books, has developed rapidly over the past several years, as the industry evolves to embrace new technologies for developing, producing, marketing and distributing trade works. We continue to focus on the development of innovative new digital products which capitalize on our strong content, our digital expertise and the growing consumer demand for these products.
In the Trade Publishing segment, annual results can be driven by bestselling trade titles. Furthermore, backlist titles can experience resurgence in sales when made into films. Over the past several years, a number of our backlist titles such as The Hobbit, The Lord of the Rings, Life of Pi, Extremely Loud and Incredibly Close, The Giver and The Time Traveler’s Wife have benefited in popularity due to movie releases and have subsequently resulted in increased trade sales.
We employ several pricing models to serve various customer segments, including institutions, consumers, other government agencies (e.g., penal institutions, community centers, etc.) and other third parties. In addition to traditional pricing models where a customer receives a product in return for a payment at the time of product receipt, we currently use the following pricing models:
| • | Pay-up-front: Customer makes a fixed payment at time of purchase and we provide a specific product/service in return; |
| • | Pre-pay Subscription: Customer makes a one-time payment at time of purchase, but receives a stream of goods/services over a defined time horizon; for example, we currently provide customers the option to purchase a multi-year subscription to textbooks where for a one-time charge, a new copy of the work text is delivered to the customer each year for a defined time period. Pre-pay subscriptions to online textbooks are another example where the customer receives access to an online book for a specific period of time; and |
| • | Pay-as-you-go Subscription: Similar to the Pre-pay subscription, except that the customer makes periodic payments in a pre-described manner. |
Cost of sales, excluding pre-publication and publishing rights
Cost of sales, excluding pre-publication and publishing rights, include expenses directly attributable to the production of our products and services, including the non-capitalizable costs associated with our content operations department. The expenses within cost of sales include variable costs such as paper, printing and binding costs of our print materials, royalty expenses paid to our authors, gratis costs or products provided at no charge as part of the sales transaction, and inventory obsolescence. Also included in cost of sales are labor costs
34
Table of Contents
related to professional services. We also include amortization expense associated with our software platforms. Certain products such as trade books and those products associated with our renowned authors carry higher royalty costs; conversely, digital offerings usually have a lower cost of sales due to lower costs associated with their production. Also, sales to adoption states usually contain higher cost of sales. A change in the sales mix of these products can impact consolidated profitability.
Pre-publication amortization and publishing rights amortization
A publishing right is an acquired right which allows us to publish and republish existing and future works as well as create new works based on previously published materials. As part of our March 9, 2010 restructuring, we recorded an intangible asset for publishing rights and amortize such asset on an accelerated basis over the useful lives of the various copyrights involved. See Note 1 to our consolidated financial statements included elsewhere in this Annual Report.
We capitalize the art, prepress, manuscript and other costs incurred in the creation of the master copy of a book or other media, known as the pre-publication costs. Pre-publication costs are primarily amortized from the year of sale over five years using the sum-of-the-years-digits method, which is an accelerated method for calculating an asset’s amortization. Under this method, the amortization expense recorded for a pre-publication cost asset is approximately 33% (year 1), 27% (year 2), 20% (year 3), 13% (year 4) and 7% (year 5). We utilize this policy for all pre-publication costs, except with respect to our Trade Publishing consumer books, for which we generally expense such costs as incurred, and our assessment products, for which we use the straight-line amortization method. The amortization methods and periods chosen best reflect the pattern of expected sales generated from individual titles or programs. We periodically evaluate the remaining lives and recoverability of capitalized pre-publication costs, which are often dependent upon program acceptance by state adoption authorities.
Selling and administrative expenses
Our selling and administrative expenses include the salaries, benefits and related costs of employees engaged in sales and marketing, fulfillment and administrative functions. Also included within selling and administrative costs are variable costs such as commission expense, outbound transportation costs, sampling and depository fees, which are fees paid to state mandated depositories which fulfill centralized ordering and warehousing functions for specific states. Additionally, significant fixed and discretionary costs include facilities, telecommunications, professional fees, promotions and advertising. We expect our selling and administrative costs in dollars to increase as we invest in new growth initiatives.
Other intangible asset amortization
Our other intangible asset amortization expense primarily includes the amortization of acquired intangible assets consisting of customer relationships, content rights and licenses. Our customer relationships, which constituted the largest component of the amortization expense over the past two years, pertained to our assessment customers and was fully amortized as of March 31, 2013. The existing software, content rights and licenses will be amortized over varying periods of 6 to 25 years. The expense for the year ending December 31, 2014 was $12.2 million.
Interest expense
Our interest expense includes interest accrued on our term loan facility along with, to a lesser extent, our revolving credit facility, capital leases and the amortization of any deferred financing fees and loan discounts. Our interest expense for the year ended December 31, 2014 was $18.2 million.
35
Table of Contents
Reorganization items, net
Our reorganization items, net represents expense and income amounts that were recorded to the statement of operations as a result of the bankruptcy proceedings. The amount is primarily attributed to cancellation of debt income net of related expenses and the elimination of deferred costs related to the cancelled debt. Reorganization items were incurred starting with the date of the bankruptcy filing through the date of bankruptcy emergence.
Chapter 11 Reorganization
On May 10, 2012, we entered into a Restructuring Support Agreement (the “Plan Support Agreement”) with consenting creditors holding greater than 74% of the principal amount of the then-outstanding senior secured indebtedness of the Company and with equity owners holding approximately 64% of the Company’s then-outstanding common stock. The consenting creditors agreed to support the Company’s Pre-Packaged Chapter 11 Plan of Reorganization (“Plan”).
On May 21, 2012 (the “Petition Date”), the U.S.-based entities that borrowed or guaranteed the debt of the Company (collectively the “Debtors”), filed voluntary petitions for relief under Chapter 11 of the United States Bankruptcy Code (“Chapter 11”) in the United States Bankruptcy Court for the Southern District of New York (“Court”). The Debtors also concurrently filed the Plan, the Disclosure Statement in support of the Plan and filed various motions seeking relief to continue operations. Following the Petition Date, the Debtors operated their business as “debtors in possession” (“DIP”) under the jurisdiction of the Court and in accordance with the applicable provisions of the Bankruptcy Code and orders of the Court.
On June 22, 2012, the Company successfully emerged from bankruptcy as a reorganized company pursuant to the Plan. The financial restructuring realized by the confirmation of the Plan was accomplished through a debt-for-equity exchange. The Plan deleveraged the Company’s balance sheet by eliminating the Company’s secured indebtedness in exchange for new equity in the Company. Existing stockholders, in their capacity as stockholders, received warrants for the new equity in the Company in exchange for the existing equity.
Subsequent to the Petition Date, the provisions in U.S. GAAP guidance for reorganizations applied to the Company’s financial statements while it operated under the provisions of Chapter 11. The accounting guidance did not change the application of generally accepted accounting principles in the preparation of financial statements. However, it does require that the financial statements, for periods including and subsequent to the filing of the Chapter 11 petition, distinguish transactions and events that are directly associated with the reorganization from the ongoing operations of the business. Accordingly, all transactions (including, but not limited to, all professional fees, realized gains and losses and provisions for losses) directly associated with the reorganization and restructuring of our businesses are reported separately in our financial statements. All such expense or income amounts are reported in reorganization items in our consolidated statements of operations for the year ended December 31, 2012. The Company was not required to apply fresh-start accounting based on U.S. GAAP guidance for reorganizations due to the fact that the pre-petition holders who owned more than 50% of the Company’s outstanding common stock immediately before confirmation of the Plan received more than 50% of the Company’s outstanding common stock upon emergence. Accordingly, a new reporting entity was not created for accounting purposes.
Below is a summary of the significant transactions affecting the Company’s capital structure as a result of the effectiveness of the Plan.
Equity Transactions
On June 22, 2012, pursuant to the Plan, all of the issued and outstanding shares of common stock of the Company, including all options, warrants or any other agreements to acquire shares of common stock of the Company that existed prior to the Petition Date, were cancelled and in exchange, holders of such interests received distributions pursuant to the terms of the Plan. The distributions received by holders of interests in our
36
Table of Contents
common stock prior to the petition date on June 22, 2012 pursuant to the terms of the Plan included adequate protection payments and conversion fees of approximately $60.1 million and $26.1 million, respectively. These amounts represent only the portion attributable to the existing stockholders prior to the petition date. There were $69.7 million of adequate protection payments and $30.3 million of conversion fee payments made in total. Following the emergence on June 22, 2012, the authorized capital stock of the Company consisted of (i) 380,000,000 shares of common stock and (ii) 20,000,000 shares of preferred stock, $0.01 par value per share.
On June 22, 2012, the Company issued an aggregate of 140,000,000 post-emergence shares of new common stock pursuant to the final Plan, of which 82,022 are treasury shares, on a pro rata basis to the holders of the then-existing first lien term loan (the “Term Loan”), the then-existing first lien revolving loan facility (the “Revolving Loan”) and the 10.5% Senior Secured Notes due 2019 (the “10.5% Senior Notes”) as of the Petition Date. The Company issued the new common stock pursuant to Section 1145(a)(1) of the Bankruptcy Code.
Our MIP became effective upon emergence. The MIP provides for grants of options and restricted stock at a strike price equal to or greater than the fair value per share of common stock as of the date of the grant and reserved for management and employees up to 10% of the new common stock of the Company. On June 22, 2012, in connection with our emergence from bankruptcy, the Company granted 9,251,462 stock options to executive officers with an exercise price of $12.50. Each of the stock options granted have an exercise price equal to or greater than the fair value on the date of grant and generally vest over a three or four year period. Also, on June 22, 2012, the Company granted 24,000 restricted stock units to independent directors which vest after one year.
Debt Transactions
On June 22, 2012, the Company’s creditors converted the Term Loan with an aggregate outstanding principal balance of $2.6 billion and the Revolving Loan with an aggregate outstanding principal balance of $235.8 million, and the outstanding $300.0 million principal amount of 10.5% Senior Notes to 100 percent pro rata ownership of the Company’s common stock, subject to dilution pursuant to the MIP and the exercise of the new warrants, and received $30.3 million in cash.
In connection with the Chapter 11 filing on May 22, 2012, the Company entered into a new $500.0 million senior secured credit facility, which converted into an exit facility on the effective date of the emergence from Chapter 11. This exit facility consists of a $250.0 million revolving credit facility, which is secured by the Company’s accounts receivable and inventory, and a $250.0 million term loan credit facility. The proceeds of the exit facility were used to fund the costs of the reorganization and are providing working capital to the Company since its emergence from Chapter 11.
A summary of the transactions affecting the Company’s debt balances is as follows (in thousands):
| Debt balance prior to emergence from bankruptcy (including accrued interest) |
$ | (3,142,234 | ) | |
| Exchange of debt for new shares of common stock |
1,750,000 | |||
| Elimination of debt discount and deferred financing fees |
98,352 | |||
| Adequate protection payments |
69,701 | |||
| Conversion fees |
30,299 | |||
| Professional fees |
21,726 | |||
|
|
|
|||
| (Gain) loss on extinguishment of debt |
$ | (1,172,156 | ) | |
|
|
|
37
Table of Contents
Results of Operations
Consolidated Operating Results for the Years Ended December 31, 2014 and 2013
| (dollars in thousands) | Year Ended December 31, 2014 |
Year Ended December 31, 2013 |
Dollar change |
Percent Change |
||||||||||||
| Net sales |
$ | 1,372,316 | $ | 1,378,612 | $ | (6,296 | ) | (0.5 | )% | |||||||
| Costs and expenses: |
||||||||||||||||
| Cost of sales, excluding pre-publication and publishing rights amortization |
588,726 | 585,059 | 3,667 | 0.6 | % | |||||||||||
| Publishing rights amortization |
105,624 | 139,588 | (33,964 | ) | (24.3 | )% | ||||||||||
| Pre-publication amortization |
129,693 | 121,715 | 7,978 | 6.6 | % | |||||||||||
|
|
|
|
|
|
|
|
|
|||||||||
| Cost of sales |
824,043 | 846,362 | (22,319 | ) | (2.6 | )% | ||||||||||
| Selling and administrative |
612,535 | 580,887 | 31,648 | 5.4 | % | |||||||||||
| Other intangible asset amortization |
12,170 | 18,968 | (6,798 | ) | (35.8 | )% | ||||||||||
| Impairment charge for investment in preferred stock, intangible assets, pre-publication costs and fixed assets |
1,679 | 9,000 | (7,321 | ) | (81.3 | )% | ||||||||||
| Severance and other charges |
7,300 | 10,040 | (2,740 | ) | (27.3 | )% | ||||||||||
|
|
|
|
|
|
|
|
|
|||||||||
| Operating loss |
(85,411 | ) | (86,645 | ) | (1,234 | ) | (1.4 | )% | ||||||||
|
|
|
|
|
|
|
|
|
|||||||||
| Other income (expense): |
||||||||||||||||
| Interest expense |
(18,245 | ) | (21,344 | ) | (3,099 | ) | (14.5 | )% | ||||||||
| Change in fair value of derivative instruments |
(1,593 | ) | (252 | ) | (1,341 | ) | NM | |||||||||
| Loss on debt extinguishment |
— | (598 | ) | 598 | NM | |||||||||||
|
|
|
|
|
|
|
|
|
|||||||||
| Loss before taxes |
(105,249 | ) | (108,839 | ) | (3,590 | ) | (3.3 | )% | ||||||||
| Income tax expense |
6,242 | 2,347 | 3,895 | NM | ||||||||||||
|
|
|
|
|
|
|
|
|
|||||||||
| Net loss |
$ | (111,491 | ) | $ | (111,186 | ) | $ | 305 | NM | |||||||
|
|
|
|
|
|
|
|
|
|||||||||
NM = not meaningful
Net sales for the year ended December 31, 2014 decreased $6.3 million, or 0.5%, from $1,378.6 million for the same period in 2013, to $1,372.3 million. The decrease was largely driven by $18.0 million lower net sales of professional development and professional services, primarily due to the prior year period benefitting $8.0 million from the completion of a contract that led to the recognition of net sales previously deferred, coupled with lower learning management system sales and services as we have exited that business. Further, there was a $9.0 million decrease in net sales of traditional print supplemental products due to an aging product base and a $3.0 million decline in international sales due to a decline in licensing revenue. Additionally, there was a decrease of $8.0 million in Trade Publishing net sales, as the prior year period benefitted from strong net sales of backlist titles associated with the theatrical releases of The Hobbit and Life of Pi, which did not occur in the current period. Partially offsetting the decreases were higher net sales of $13.0 million from our Heinemann products, primarily related to the Leveled Literacy Intervention product line along with $13.0 million of higher assessment net sales driven by the release of a new version of the Woodcock Johnson program and higher sales directly to consumers. Additionally, there were net sales of $230.0 million during 2014 that were deferred, compared to net sales of $2.0 million in the prior year, and will be recognized up to seven years rather than immediately due to the increase in digital and subscription components within our programs along with the length of our programs. Our billings increased $221.8 million, or 16%, from 2013 to 2014 primarily due to large Texas Math and Science adoptions and, to a lesser extent, adoptions in California and Florida.
38
Table of Contents
Operating loss for the year ended December 31, 2014 decreased $1.2 million, or 1.4%, from a loss of $86.6 million for the same period in 2013, to a loss of $85.4 million, due primarily to the following:
| • | A $32.8 million net reduction in amortization expense related to publishing rights, pre-publication and other intangible assets compared to the prior year due to our use of accelerated amortization methods, |
| • | Further, there was a $7.3 million reduction in impairment costs compared to the prior year. In 2013, there were $7.4 million of software development costs impaired, $1.1 million of pre-publication costs impaired and $0.5 million of tradenames impaired. In 2014, we recorded a $1.3 million impairment charge related to an investment in preferred stock and a $0.4 million impairment charge related to tradenames, |
| • | Partially offsetting the aforementioned, our cost of sales, excluding pre-publication and publishing rights amortization, increased $3.7 million compared to the prior year. As a percent of net sales, our cost of sales, excluding pre-publication and publishing rights amortization increased to 42.9% from 42.4%, resulting in an approximate $6.3 million decrease in profitability partially offset by a $2.6 million decrease attributed to lower volume. The increase in our costs was primarily attributed to a 1.3% increase in royalties as a percent of net sales, attributed to the increased billings, which had a negative impact on profitability of an approximate $17.7 million, along with higher depreciation expense of $9.7 million, attributed to increased platform spend over the past several years. The increases were partially offset by a reduction in our product cost of $14.5 million and $6.6 million of lower inventory obsolescence expense, |
| • | Also, there was an increase in selling and administrative costs of $31.6 million compared to the prior year, primarily due to increased variable costs of $34.9 million of commissions associated with the approximately $221.8 million increase in our billings, higher technology costs of $12.3 million, an increase of $3.0 million of outside labor to support the increased billings, and a $1.9 million increase in stock-based compensation due to additional equity award issuances, partially offset by a $19.1 million decline in fees associated with the registration of securities. |
Interest expense for the year ended December 31, 2014 decreased $3.1 million, or 14.5%, to $18.2 million from $21.3 million for the same period in 2013 primarily as a result of Amendment No. 4 to our term loan facility, which reduced the interest rate applicable to borrowings thereunder by 1.0%.
Change in fair value of derivative instruments for the year ended December 31, 2014 unfavorably changed by $1.3 million from an expense of $0.3 million in 2013 to an expense of $1.6 million in 2014. The loss on change in fair value of derivative instruments was related to unfavorable foreign exchange forward and option contracts executed on the Euro that were adversely impacted by the stronger U.S. dollar.
Income tax expense for the year ended December 31, 2014 increased $3.9 million from an expense of $2.3 million for the year ended December 31, 2013, to an expense of $6.2 million. For both periods, the income tax expense was impacted by certain discrete tax items including the accrual of potential interest and penalties on uncertain tax positions. Including the tax effects of these discrete tax items, the effective rate was 5.9% and 2.2% for the year ended December 31, 2014 and 2013, respectively.
For the year ended December 31, 2014, we recorded no tax benefit on the year-to-date loss, except for the country of Ireland where we released the valuation allowance by approximately $3.0 million. The income tax expense of $6.2 million was primarily related to movement in the deferred tax liability associated with tax amortization on indefinite lived intangibles, and accrual of interest and penalties on uncertain tax positions.
39
Table of Contents
Consolidated Operating Results for the Years Ended December 31, 2013 and 2012
| (dollars in thousands) | Year Ended December 31, 2013 |
Year Ended December 31, 2012 |
Dollar change |
Percent Change |
||||||||||||
| Net sales |
$ | 1,378,612 | $ | 1,285,641 | $ | 92,971 | 7.2 | % | ||||||||
| Costs and expenses: |
||||||||||||||||
| Cost of sales, excluding pre-publication and publishing rights amortization |
585,059 | 515,948 | 69,111 | 13.4 | % | |||||||||||
| Publishing rights amortization |
139,588 | 177,747 | (38,159 | ) | (21.5 | )% | ||||||||||
| Pre-publication amortization |
121,715 | 137,729 | (16,014 | ) | (11.6 | )% | ||||||||||
|
|
|
|
|
|
|
|
|
|||||||||
| Cost of sales |
846,362 | 831,424 | 14,938 | 1.8 | % | |||||||||||
| Selling and administrative |
580,887 | 533,462 | 47,425 | 8.9 | % | |||||||||||
| Other intangible asset amortization |
18,968 | 54,815 | (35,847 | ) | (65.4 | )% | ||||||||||
| Impairment charge for intangible assets, pre-publication costs and fixed assets |
9,000 | 8,003 | 997 | 12.5 | % | |||||||||||
| Severance and other charges |
10,040 | 9,375 | 665 | 7.1 | % | |||||||||||
| Gain on bargain purchase |
— | (30,751 | ) | 30,751 | NM | |||||||||||
|
|
|
|
|
|
|
|
|
|||||||||
| Operating loss |
(86,645 | ) | (120,687 | ) | (34,042 | ) | (28.2 | )% | ||||||||
|
|
|
|
|
|
|
|
|
|||||||||
| Other income (expense): |
||||||||||||||||
| Interest expense |
(21,344 | ) | (123,197 | ) | (101,853 | ) | (82.7 | )% | ||||||||
| Change in fair value of derivative instruments |
(252 | ) | 1,688 | (1,940 | ) | NM | ||||||||||
| Loss on debt extinguishment |
(598 | ) | — | (598 | ) | NM | ||||||||||
|
|
|
|
|
|
|
|
|
|||||||||
| Loss before reorganization items and taxes |
(108,839 | ) | (242,196 | ) | (133,357 | ) | (55.1 | )% | ||||||||
| Reorganization items, net |
— | (149,114 | ) | 149,114 | NM | |||||||||||
| Income tax expense (benefit) |
2,347 | (5,943 | ) | 8,290 | 139.5 | % | ||||||||||
|
|
|
|
|
|
|
|
|
|||||||||
| Net loss |
$ | (111,186 | ) | $ | (87,139 | ) | $ | 24,047 | 27.6 | % | ||||||
|
|
|
|
|
|
|
|
|
|||||||||
NM = not meaningful
Net sales for the year ended December 31, 2013 increased $93.0 million, or 7.2%, from $1,285.6 million for the same period in 2012, to $1,378.6 million. The increase was largely driven by $34.0 million of increased adoptions sales, primarily in Florida and Tennessee, due to new adoptions that did not exist in the prior year, together with $12.0 million of increased sales in the open territory market driven by a large sale to the New York City school district of our Go Math! product. Also benefitting sales for the year ended December 31, 2013 was an incremental $37.0 million of sales of intervention and professional development products, $12.0 million of higher international, professional services and assessment sales and $13.7 million additional net sales from our culinary product line. Additionally, we were able to increase sales in the private, parochial and charter school channel through an agreement with a reseller. The private, parochial and charter school channel incremental sales along with the sale of consumable backlist products sold to both other resellers and directly to customers, resulted in an increase of $16.0 million in 2013 as compared to 2012. Offsetting the above positive factors were lower residual sales of $13.0 million, which are typically lower in years of larger adoption sales; lower supplemental product sales due to an aging products, and $16.0 million of lower sales of learning management systems as we migrate to a new learning management system partner strategy.
Operating loss for the year ended December 31, 2013 decreased $34.0 million, or 28.2%, from a loss of $120.7 million for the same period in 2012, to a loss of $86.6 million, due primarily to the following:
| • | a $90.0 million reduction in amortization expense related to publishing rights, pre-publication and other intangible assets due to our use of accelerated amortization methods and lower pre-publication spending over the past several years as compared to previous years. |
40
Table of Contents
| • | Increased sales of $93.0 million, however, our cost of sales, excluding pre-publication and publishing rights amortization, as a percent of sales increased to 42.4% from 40.1% resulting in an approximate $31.7 million adverse impact on profitability. This increase was the result of a shift in our product mix impacting production costs by $7.5 million and royalty costs by $4.7 million. Additionally, our gratis costs were $12.1 million higher due to increased sales to adoption states and we incurred $10.2 million of higher depreciation on digital platforms. The net effect of the increased sales was an improvement of approximately $24 million on the operating loss from the prior year. |
| • | Offsetting the favorable impacts on our operating loss was a $47.4 million increase in selling and administrative costs primarily due to approximately $20 million of costs associated with our initial public offering in November 2013 and a $16.7 million increase in commission expense, a $5.3 million increase in stock compensation costs and a $8.3 million increase in sampling expenses in advance of the 2014 scheduled adoptions and transportation expenses associated with the increase in sales; |
| • | Partially offset by a $30.8 million gain on bargain purchase in 2012 that did not occur in 2013. |
Interest expense for the year ended December 31, 2013 decreased $101.9 million, or 82.7%, to $21.3 million from $123.2 million for the same period in 2012, primarily as a result of our emergence from bankruptcy with substantially reduced debt.
Change in fair value of derivative instruments for the year ended December 31, 2013 unfavorably changed by $1.9 million from income of $1.7 million to an expense of $0.3 million. The loss on change in fair value of derivative instruments was related to unfavorable foreign exchange forward and option contracts executed on the Euro.
Income tax expense for the year ended December 31, 2013 increased $8.3 million from a tax benefit of $5.9 million for the year ended December 31, 2012, to a tax expense of $2.3 million. For both periods, the income tax expense was impacted by certain discrete tax items including the accrual of potential interest and penalties on uncertain tax positions. Including the tax effects of these discrete tax items, the effective rate was 2.1% and (6.4)% for the year ended December 31, 2013 and 2012, respectively.
For the year ended December 31, 2013, we recorded no tax benefit on the year-to-date loss. The income tax expense of $2.3 million was primarily related to movement in the deferred tax liability associated with tax amortization on indefinite lived intangibles, accrual of interest and penalties on uncertain tax positions and to a tax benefit allocated to continuing operations as a result of recording gains in other comprehensive income (loss). Similar to 2012, such gains provide a source of income that enables realization of the tax benefit of the current year’s loss in continuing operations.
The income tax benefit for the year ended December 31, 2012 was primarily due to a tax benefit allocated to continuing operations after considering the gain recorded in the second quarter of 2012 in additional paid-in capital as a result of the reorganization. This tax benefit in continuing operations was offset by the deferred tax liabilities associated with tax amortization on indefinite-lived intangibles, as well as expected foreign, state and local taxes.
Adjusted EBITDA
To supplement our financial statements presented in accordance with GAAP, we have presented Adjusted EBITDA in addition to our GAAP results. This information should be considered as supplemental in nature and should not be considered in isolation or as a substitute for the related financial information prepared in accordance with GAAP. Management believes that the presentation of Adjusted EBITDA provides useful information to investors regarding our results of operations because it assists both investors and management in analyzing and benchmarking the performance and value of our business. Adjusted EBITDA provides an indicator
41
Table of Contents
of general economic performance that is not affected by debt restructurings, fluctuations in interest rates or effective tax rates, non-cash charges, or levels of depreciation or amortization along with costs such as severance, facility closure costs, and acquisition costs. Accordingly, our management believes that this measurement is useful for comparing general operating performance from period to period. In addition, targets and positive trends in Adjusted EBITDA are used as performance measures and to determine certain compensation of management. Other companies may define Adjusted EBITDA differently and, as a result, our measure of Adjusted EBITDA may not be directly comparable to Adjusted EBITDA of other companies. Although we use Adjusted EBITDA as a financial measure to assess the performance of our business, the use of Adjusted EBITDA is limited because it does not include certain material costs, such as interest and taxes, necessary to operate our business. Adjusted EBITDA should be considered in addition to, and not as a substitute for, net earnings in accordance with GAAP as a measure of performance. Adjusted EBITDA is not intended to be a measure of liquidity or free cash flow for discretionary use. You are cautioned not to place undue reliance on Adjusted EBITDA.
Below is a reconciliation of our net loss to Adjusted EBITDA for the years ended December 31, 2014, 2013 and 2012:
| Year Ended December 31, | ||||||||||||
| 2014 | 2013 | 2012 | ||||||||||
| Net loss |
$ | (111,491 | ) | $ | (111,186 | ) | $ | (87,139 | ) | |||
| Interest expense |
18,245 | 21,344 | 123,197 | |||||||||
| Provision (benefit) for income taxes |
6,242 | 2,347 | (5,943 | ) | ||||||||
| Depreciation expense |
72,290 | 61,705 | 58,131 | |||||||||
| Amortization expense (1) |
247,487 | 280,271 | 370,291 | |||||||||
| Non-cash charges—stock compensation |
11,376 | 9,524 | 4,227 | |||||||||
| Non-cash charges—gain (loss) on derivative instruments |
1,593 | 252 | (1,688 | ) | ||||||||
| Asset impairment charges |
1,679 | 9,000 | 8,003 | |||||||||
| Purchase accounting adjustments (2) |
3,661 | 11,460 | (16,511 | ) | ||||||||
| Fees, expenses or charges for equity offerings, debt or acquisitions |
4,424 | 23,540 | 267 | |||||||||
| Restructuring |
2,577 | 3,123 | 6,716 | |||||||||
| Severance separation costs and facility closures (3) |
7,300 | 13,040 | 9,375 | |||||||||
| Reorganization items, net (4) |
— | — | (149,114 | ) | ||||||||
| Debt extinguishment loss |
— | 598 | — | |||||||||
|
|
|
|
|
|
|
|||||||
| Adjusted EBITDA |
$ | 265,383 | $ | 325,018 | $ | 319,812 | ||||||
|
|
|
|
|
|
|
|||||||
| (1) | Includes pre-publication amortization of $129,693, $121,715 and $137,729 for the years ended December 31, 2014, 2013 and 2012 respectively. |
| (2) | Represents certain non-cash accounting adjustments, most significantly relating to deferred revenue and inventory costs. |
| (3) | Represents costs associated with restructuring. Included in such costs are severance, facility integration (including inventory excess) and vacancy of excess facilities. |
| (4) | Represents net gain associated with our Chapter 11 reorganization in 2012. |
42
Table of Contents
Segment Operating Results
Results of Operations—Comparing Years Ended December 31, 2014 and 2013 and 2012
Education
| Year Ended December 31, | 2014 vs. 2013 | 2013 vs. 2012 | ||||||||||||||||||||||||||
| Dollar change |
Percent change |
Dollar change |
Percent change |
|||||||||||||||||||||||||
| 2014 | 2013 | 2012 | ||||||||||||||||||||||||||
| Net sales |
$ | 1,209,142 | $ | 1,207,908 | $ | 1,128,591 | $ | 1,234 | 0.1 | % | $ | 79,317 | 7.0 | % | ||||||||||||||
| Costs and expenses: |
||||||||||||||||||||||||||||
| Cost of sales, excluding pre-publication and publishing rights amortization |
482,765 | 476,488 | 424,205 | 6,277 | 1.3 | % | 52,283 | 12.3 | % | |||||||||||||||||||
| Publishing rights amortization |
94,225 | 126,781 | 161,649 | (32,556 | ) | (25.7 | )% | (34,868 | ) | (21.6 | )% | |||||||||||||||||
| Pre-publication amortization |
128,793 | 120,562 | 136,361 | 8,231 | 6.8 | % | (15,799 | ) | (11.6 | )% | ||||||||||||||||||
|
|
|
|
|
|
|
|
|
|
|
|
|
|
|
|||||||||||||||
| Cost of sales |
705,783 | 723,831 | 722,215 | (18,048 | ) | (2.5 | )% | 1,616 | 0.2 | % | ||||||||||||||||||
| Selling and administrative |
495,421 | 452,561 | 438,503 | 42,860 | 9.5 | % | 14,058 | 3.2 | % | |||||||||||||||||||
| Other intangible asset amortization |
9,865 | 17,079 | 54,542 | (7,214 | ) | (42.2 | )% | (37,463 | ) | (68.7 | )% | |||||||||||||||||
| Impairment charge for investment in preferred stock, intangible assets, pre-publication costs and fixed assets |
1,279 | 8,500 | 8,003 | (7,221 | ) | (85.0 | )% | 497 | 6.2 | % | ||||||||||||||||||
|
|
|
|
|
|
|
|
|
|
|
|
|
|
|
|||||||||||||||
| Operating income (loss) |
$ | (3,206 | ) | $ | 5,937 | $ | (94,672 | ) | $ | (9,143 | ) | (154.0 | )% | $ | 100,609 | 106.3 | % | |||||||||||
|
|
|
|
|
|
|
|
|
|
|
|
|
|
|
|||||||||||||||
| Net income (loss) |
$ | (3,206 | ) | $ | 5,937 | $ | (94,672 | ) | $ | (9,143 | ) | (154.0 | )% | $ | 100,609 | 106.3 | % | |||||||||||
|
|
|
|
|
|
|
|
|
|
|
|
|
|
|
|||||||||||||||
| Adjustments from net income (loss) to Education segment Adjusted EBITDA |
||||||||||||||||||||||||||||
| Depreciation expense |
63,865 | 53,875 | 49,600 | 9,990 | 18.5 | % | 4,275 | 8.6 | % | |||||||||||||||||||
| Amortization expense |
232,884 | 264,422 | 352,552 | (31,538 | ) | (11.9 | )% | (88,130 | ) | (25.0 | )% | |||||||||||||||||
| Non-cash charges—asset impairment charges |
1,279 | 8,500 | 8,003 | (7,221 | ) | (85.0 | )% | 497 | 6.2 | % | ||||||||||||||||||
| Purchase accounting adjustments |
3,661 | 10,449 | 14,240 | (6,788 | ) | (65.0 | )% | (3,791 | ) | (26.6 | )% | |||||||||||||||||
|
|
|
|
|
|
|
|
|
|
|
|
|
|
|
|||||||||||||||
| Education segment Adjusted EBITDA |
$ | 298,483 | $ | 343,183 | $ | 329,723 | $ | (44,700 | ) | (13.0 | )% | $ | 13,460 | 4.1 | % | |||||||||||||
|
|
|
|
|
|
|
|
|
|
|
|
|
|
|
|||||||||||||||
| Education segment Adjusted EBITDA as a % of net sales |
24.7 | % | 28.4 | % | 29.2 | % | ||||||||||||||||||||||
|
|
|
|
|
|
|
|||||||||||||||||||||||
NM = not meaningful
Our Education segment net sales for the year ended December 31, 2014 increased $1.2 million, or 0.1%, from $1,207.9 million for the same period in 2013, to $1,209.1 million. The increase was largely driven by higher net sales of $13.0 million from the Heinemann business, primarily related to the Leveled Literacy Intervention product line along with $13.0 million of higher assessment net sales driven by the release of a new version of the Woodcock Johnson program and higher sales directly to consumers. Additionally, there were net sales of $230.0 million during 2014 that were deferred, compared to net sales of $2.0 million in the prior year, and will be recognized up to seven years rather than immediately due to the increase in digital and subscription components within our programs along with the length of our programs. Our billings increased $221.8 million, or 16%, from 2013 to 2014 primarily due to large Texas Math and Science adoptions and, to a lesser extent, adoptions in California and Florida. Partially offsetting the increase were lower net sales of professional development and professional services, primarily due to the prior year period benefitting $8.0 million from the completion of a contract that led to the recognition of revenue previously deferred, coupled with lower learning management system sales and services as we have exited those
43
Table of Contents
offerings. Further, there was a $9.0 million decrease in net sales of traditional print supplemental products due to an aging product base and a $3.0 million decline in international sales due to a decline in licensing revenue.
Our Education segment net sales for the year ended December 31, 2013 increased $79.3 million, or 7.0%, from $1,128.6 million for the same period in 2012, to $1,207.9 million. The increase was largely driven by $34.0 million of increased adoptions sales, primarily in Florida and Tennessee, due to new adoptions that did not exist in the prior year, together with $12.0 million of increased sales in the open territory market driven by a large sale to the New York City school district of our Go Math! product. Also benefitting sales for the year ended December 31, 2013 was an incremental $37.0 million of sales of intervention and professional development products along with $12.0 million of higher international, professional services and assessment sales. Additionally, we were able to increase sales in the private, parochial and charter school channel through an agreement with a reseller. The private, parochial and charter school channel incremental sales along with the sale of consumable backlist products sold to both other resellers and directly to customers resulted in an increase of $16.0 million in 2013 as compared to 2012. Offsetting the above positive factors were lower residual sales of $13.0 million, which are typically lower in years of larger adoption sales; lower supplemental product sales due to an aging products, and $16.0 million of lower sales of learning management systems as we migrate to a new learning management system partner strategy.
Our Education segment cost of sales for the year ended December 31, 2014, decreased $18.0 million, or 2.5%, from $723.8 million for the same period in 2013, to $705.8 million. The decrease was attributed to a $24.3 million reduction in net amortization expense related to publishing rights and pre-publication amortization due to our use of accelerated amortization methods. Partially offsetting the aforementioned decrease was an increase in cost of sales, excluding pre-publication and publishing rights amortization, of $6.3 million as our cost of sales, excluding pre-publication and publishing rights amortization, as a percent of net sales, increased to 39.9% from 39.4%, resulting in higher product cost of approximately $5.8 million with $0.6 million of the increase due to higher volume. The increase in product cost was primarily due to higher royalty costs, which as a percent of net sales, increased to 7.2% from 5.8%, resulting in an approximate $16.9 million of decreased profitability offset by lower production costs of $7.6 million attributed to longer print runs along with $3.5 million of lower inventory obsolescence.
Our Education segment cost of sales for the year ended December 31, 2013, increased $1.6 million, or 0.2%, from $722.2 million for the same period in 2012, to $723.8 million. The increase was attributed to a $52.3 million increase in cost of sales, excluding pre-publication and publishing rights amortization. This increase was primarily due to $12.1 million of higher gratis costs due to increased sales to adoption states, which typically carry higher gratis, $5.0 million increase in production cost, $11.5 million increase in royalties associated with our product mix, $10.2 million of higher amortization on digital platforms, and $13.5 million due to the increase in sales volume. Offsetting the increase in cost of sales, excluding pre-publication and publishing rights amortization, was $50.7 million reduction in amortization expense related to publishing rights and pre-publication costs due to our use of accelerated amortization methods and lower pre-publication spending over the past several years as compared to previous years.
Our Education segment selling and administrative expense for the year ended December 31, 2014, increased $42.9 million, or 9.5%, from $452.6 million for the same period in 2013, to $495.4 million. The increase was primarily due to increased variable costs of $35.5 million of commissions, associated with the approximately $221.8 million increase in our billings. Additionally, both labor-related and marketing and promotion costs increased modestly.
Our Education segment selling and administrative expense for the year ended December 31, 2013, increased $14.1 million, or 3.2%, from $438.5 million for the same period in 2012, to $452.6 million. The increase was due to an increase of $24.5 million in variable costs pertaining to commissions, transportation, samples and depository fees associated with higher sales and sales mix along with $3.9 million of higher technology and professional fees. Offsetting the increase in selling and administrative expenses was a reduction in labor related costs of $9.5 million related to reduced head count, and lower depreciation of $6.0 million.
44
Table of Contents
Our Education segment Adjusted EBITDA for the year ended December 31, 2014, decreased $44.7 million, or 13.0%, from income of $343.2 million for the same period in 2013, to income of $298.5 million. Our Education segment Adjusted EBITDA excludes depreciation, amortization, impairment charges and purchase accounting adjustments. The purchase accounting adjustments for both 2014 and 2013 related to adjustments to deferred revenue for the 2010 restructuring where we adjusted our balance sheet to fair value. The purchase accounting adjustments will gradually decrease each year. Our Education segment Adjusted EBITDA as a percentage of net sales were 24.7% and 28.4% for the years ended December 31, 2014 and 2013, respectively, due to the identified factors impacting net sales, cost of sales and selling and administrative expense after removing those items not included in Education segment Adjusted EBITDA.
Our Education segment Adjusted EBITDA for the year ended December 31, 2013, increased $13.5 million, or 4.1%, from $329.7 million for the same period in 2012, to $343.2 million. Our Education segment Adjusted EBITDA excludes depreciation, amortization, impairment charges and purchase accounting adjustments. The impairment charge of $8.5 million pertains primarily to the write off of platforms and programs that will not be utilized in the future. The purchase accounting adjustments for both 2013 and 2012 related to adjustments to deferred revenue for the 2010 restructuring where we adjusted our balance sheet to fair value. The purchase accounting adjustments will gradually decrease each year. The decrease in our Education segment Adjusted EBITDA as a percentage of net sales, from 29.2% of net sales for the year ended December 31, 2012 to 28.4% for the same period in 2013, was due to the identified factors impacting net sales, cost of sales and selling and administrative expense after removing those items not included in Education segment Adjusted EBITDA.
45
Table of Contents
Trade Publishing
| Year Ended December 31, | 2014 vs. 2013 | 2013 vs. 2012 | ||||||||||||||||||||||||||
| Dollar change |
Percent change |
Dollar change |
Percent change |
|||||||||||||||||||||||||
| 2014 | 2013 | 2012 | ||||||||||||||||||||||||||
| Net sales |
$ | 163,174 | $ | 170,704 | $ | 157,050 | $ | (7,530 | ) | (4.4 | )% | $ | 13,654 | 8.7 | % | |||||||||||||
| Costs and expenses: |
||||||||||||||||||||||||||||
| Cost of sales, excluding pre-publication and publishing rights amortization |
105,961 | 105,571 | 91,743 | 390 | 0.4 | % | 13,828 | 15.1 | % | |||||||||||||||||||
| Publishing rights amortization |
11,399 | 12,807 | 16,098 | (1,408 | ) | (11.0 | )% | (3,291 | ) | (20.4 | )% | |||||||||||||||||
| Pre-publication amortization |
900 | 1,153 | 1,368 | (253 | ) | (21.9 | )% | (215 | ) | (15.7 | )% | |||||||||||||||||
|
|
|
|
|
|
|
|
|
|
|
|
|
|
|
|||||||||||||||
| Cost of sales |
118,260 | 119,531 | 109,209 | (1,271 | ) | (1.1 | )% | 10,322 | 9.5 | % | ||||||||||||||||||
| Selling and administrative |
45,128 | 42,227 | 36,994 | 2,901 | 6.9 | % | 5,233 | 14.1 | % | |||||||||||||||||||
| Other intangible asset amortization |
2,305 | 1,889 | 273 | 416 | 22.0 | % | 1,616 | NM | ||||||||||||||||||||
| Impairment charge for intangible assets |
400 | 500 | — | (100 | ) | (20.0 | )% | 500 | NM | |||||||||||||||||||
| Gain on bargain purchase |
— | — | (30,751 | ) | — | NM | 30,751 | NM | ||||||||||||||||||||
|
|
|
|
|
|
|
|
|
|
|
|
|
|
|
|||||||||||||||
| Operating Income (loss) |
$ | (2,919 | ) | $ | 6,557 | $ | 41,325 | $ | (9,476 | ) | NM | $ | (34,768 | ) | (84.1 | )% | ||||||||||||
|
|
|
|
|
|
|
|
|
|
|
|
|
|
|
|||||||||||||||
| Net Income (loss) |
$ | (2,919 | ) | $ | 6,557 | $ | 41,325 | $ | (9,476 | ) | NM | $ | (34,768 | ) | (84.1 | )% | ||||||||||||
|
|
|
|
|
|
|
|
|
|
|
|
|
|
|
|||||||||||||||
| Adjustments from Net Income (loss) to Trade Publishing segment Adjusted EBITDA |
||||||||||||||||||||||||||||
| Depreciation expense |
591 | 531 | 461 | 60 | 11.3 | % | 70 | 15.2 | % | |||||||||||||||||||
| Amortization expense |
14,603 | 15,849 | 17,739 | (1,246 | ) | (7.9 | )% | (1,890 | ) | (10.7 | )% | |||||||||||||||||
| Non-cash charges—asset impairment charges |
400 | 500 | — | (100 | ) | (20.0 | )% | 500 | NM | |||||||||||||||||||
| Purchase accounting adjustments |
— | 1,011 | (30,751 | ) | (1,011 | ) | NM | 31,762 | NM | |||||||||||||||||||
|
|
|
|
|
|
|
|
|
|
|
|
|
|
|
|||||||||||||||
| Trade Publishing segment Adjusted EBITDA |
$ | 12,675 | $ | 24,448 | $ | 28,774 | $ | (11,773 | ) | (48.2 | )% | $ | (4,326 | ) | (15.0 | )% | ||||||||||||
|
|
|
|
|
|
|
|
|
|
|
|
|
|
|
|||||||||||||||
| Trade Publishing segment Adjusted EBITDA as a % of net sales |
7.8 | % | 14.3 | % | 18.3 | % | ||||||||||||||||||||||
|
|
|
|
|
|
|
|||||||||||||||||||||||
NM = not meaningful
Our Trade Publishing segment net sales for the year ended December 31, 2014, decreased $7.5 million, or 4.4%, from $170.7 million for the same period in 2013, to $163.2 million. The decrease was largely driven by the prior year period benefitting from strong net sales of backlist titles associated with the theatrical releases of The Hobbit and Life of Pi, which did not occur in the current period. Additionally, sales of General Interests front list titles were down from the prior year as the prior year benefited from successful front list titles such as Francona. While 2014 did have strong front list titles, The Giver movie tie-in title and New York Times number one best seller What If, these titles could not offset the strength of the prior year titles.
Our Trade Publishing segment net sales for the year ended December 31, 2013, increased $13.7 million, or 8.7%, from $157.0 million for the same period in 2012, to $170.7 million. The increase was attributed to additional net sales from the culinary product line in connection with our 2012 acquisition of certain assets as well as increases in the General Interest and Young Readers products.
46
Table of Contents
Our Trade Publishing segment cost of sales for the year ended December 31, 2014, decreased $1.3 million, or 1.1%, from $119.5 million for the same period in 2013, to $118.3 million. The decrease is primarily related to decreased net sales and lower amortization expense of $1.4 million related to publishing rights, which was lower due to our use of accelerated amortization methods. Our cost of sales, excluding pre-publication and publishing rights amortization, as a percent of net sales, increased to 64.9% from 61.8%, resulting in an approximate $5.0 million of loss in profitability. The decrease in product profitability was the result of product mix and higher royalties. The decrease was offset by a $4.7 million lower cost of sales, excluding pre-publication and publishing rights amortization, due to less volume.
Our Trade Publishing segment cost of sales for the year ended December 31, 2013, increased $10.3 million, or 9.5%, from $109.2 million for the same period in 2012, to $119.5 million. The increase is primarily related to increased sales and a change in the sales mix offset by lower amortization expense of $3.3 million related to publishing rights, which was lower due to our use of accelerated amortization methods.
Our Trade Publishing segment selling and administrative expense for the year ended December 31, 2014, increased $2.9 million, or 6.9%, from $42.2 million for the same period in 2013, to $45.1 million. The increase was primarily related to higher promotional expenses and development costs of $1.4 million.
Our Trade Publishing segment selling and administrative expense for the year ended December 31, 2013, increased $5.2 million, or 14.1%, from $37.0 million for the same period in 2012, to $42.2 million. The increase was primarily related to higher labor costs of $3.3 million, higher promotional expense of $1.0 million and $0.7 million of higher variable expenses for transportation fees and commissions associated with the increased sales.
Our Trade Publishing segment Adjusted EBITDA for the year ended December 31, 2014, decreased $11.8 million, or 48.2%, from $24.4 million for the same period in 2013, to $12.7 million. Our Trade Publishing segment Adjusted EBITDA excludes depreciation, amortization, impairment charges and purchase accounting adjustments. Our Trade Publishing segment Adjusted EBITDA as a percentage of net sales was 7.8% for the year ended December 31, 2014, which was down from 14.3% for the same period in 2013, due to the identified factors impacting net sales, cost of sales and selling and administrative expenses after removing those items not included in segment adjusted EBITDA.
Our Trade Publishing segment Adjusted EBITDA for the year ended December 31, 2013, decreased $4.3 million, or 15.0%, from $28.8 million for the same period in 2012, to $24.4 million. Our Trade Publishing segment Adjusted EBITDA excludes depreciation, amortization, impairment charges and purchase accounting adjustments. The purchase accounting adjustment pertains to the step-up of acquired assets in November 2012 and the impairment pertains to the write-down to fair value of a certain tradename imprint. Our Trade Publishing segment Adjusted EBITDA as a percentage of net sales was 14.3% for the year ended December 31, 2013, which was down from 18.3% for the same period in 2012 due to the identified factors impacting, cost of sales and selling and administrative expenses after removing those items not included in segment adjusted EBITDA.
47
Table of Contents
Corporate and Other
| 2014 vs. 2013 | 2013 vs. 2012 | |||||||||||||||||||||||||||
| Year Ended December 31, | Dollar change |
Percent change |
Dollar change |
Percent change |
||||||||||||||||||||||||
| 2014 | 2013 | 2012 | ||||||||||||||||||||||||||
| Net sales |
$ | — | $ | — | $ | — | $ | — | NM | $ | — | NM | ||||||||||||||||
| Costs and expenses: |
||||||||||||||||||||||||||||
| Cost of sales, excluding pre-publication and publishing rights amortization |
— | 3,000 | — | (3,000 | ) | NM | 3,000 | NM | ||||||||||||||||||||
| Publishing rights amortization |
— | — | — | — | NM | — | NM | |||||||||||||||||||||
| Pre-publication amortization |
— | — | — | — | NM | — | NM | |||||||||||||||||||||
|
|
|
|
|
|
|
|
|
|
|
|
|
|
|
|||||||||||||||
| Cost of sales |
— | 3,000 | — | (3,000 | ) | NM | 3,000 | NM | ||||||||||||||||||||
| Selling and administrative |
71,986 | 86,099 | 57,965 | (14,113 | ) | (16.4 | )% | 28,134 | 48.5 | % | ||||||||||||||||||
| Severance and other charges |
7,300 | 10,040 | 9,375 | (2,740 | ) | (27.3 | )% | 665 | 7.1 | % | ||||||||||||||||||
|
|
|
|
|
|
|
|
|
|
|
|
|
|
|
|||||||||||||||
| Operating loss |
$ | (79,286 | ) | $ | (99,139 | ) | $ | (67,340 | ) | $ | (19,853 | ) | (20.0 | )% | $ | 31,799 | 47.2 | % | ||||||||||
|
|
|
|
|
|
|
|
|
|
|
|
|
|
|
|||||||||||||||
| Interest expense |
(18,245 | ) | (21,344 | ) | (123,197 | ) | (3,099 | ) | (14.5 | )% | (101,853 | ) | (82.7 | )% | ||||||||||||||
| Change in fair value of derivative instruments |
(1,593 | ) | (252 | ) | 1,688 | (1,341 | ) | NM | (1,940 | ) | NM | |||||||||||||||||
| Loss on debt extinguishment |
— | (598 | ) | — | 598 | NM | (598 | ) | NM | |||||||||||||||||||
|
|
|
|
|
|
|
|
|
|
|
|
|
|
|
|||||||||||||||
| Loss before taxes |
(99,124 | ) | (121,333 | ) | (188,849 | ) | 22,209 | 18.3 | % | 67,516 | (35.8 | )% | ||||||||||||||||
| Income tax expense (benefit) |
6,242 | 2,347 | (5,943 | ) | 3,895 | NM | 8,290 | NM | ||||||||||||||||||||
|
|
|
|
|
|
|
|
|
|
|
|
|
|
|
|||||||||||||||
| Net loss |
$ | (105,366 | ) | $ | (123,680 | ) | $ | (182,906 | ) | $ | (18,314 | ) | (12.3 | )% | $ | (59,226 | ) | (32.4 | )% | |||||||||
|
|
|
|
|
|
|
|
|
|
|
|
|
|
|
|||||||||||||||
| Adjustments from net loss to Corporate and Other Adjusted EBITDA |
||||||||||||||||||||||||||||
| Interest expense |
18,245 | 21,344 | 123,197 | (3,099 | ) | (14.52 | )% | (101,853 | ) | (82.7 | )% | |||||||||||||||||
| Provision for income taxes |
6,242 | 2,347 | (5,943 | ) | 3,895 | NM | 8,290 | (139.4 | )% | |||||||||||||||||||
| Depreciation expense |
7,834 | 7,299 | 8,070 | 535 | 7.3 | % | (771 | ) | (9.6 | )% | ||||||||||||||||||
| Non-cash charges—(gain) loss on derivative instruments |
1,593 | 252 | (1,688 | ) | 1,341 | NM | 1,940 | (114.9 | )% | |||||||||||||||||||
| Non-cash charges—stock compensation |
11,376 | 9,524 | 4,227 | 1,852 | 19.4 | % | 5,297 | 125.3 | % | |||||||||||||||||||
| Fees, expenses or charges for equity offerings, debt or acquisitions |
4,424 | 23,540 | 267 | (19,116 | ) | (81.2 | )% | 23,273 | NM | |||||||||||||||||||
| Restructuring |
2,577 | 3,123 | 6,716 | (546 | ) | (17.5 | )% | (3,593 | ) | (53.5 | )% | |||||||||||||||||
| Severance separation costs and facility closures |
7,300 | 13,040 | 9,375 | (5,740 | ) | (44.0 | )% | 3,665 | 39.1 | % | ||||||||||||||||||
| Debt extinguishment loss |
— | 598 | — | (598 | ) | NM | 598 | NM | ||||||||||||||||||||
|
|
|
|
|
|
|
|
|
|
|
|
|
|
|
|||||||||||||||
| Corporate and Other Adjusted EBITDA |
$ | (45,775 | ) | $ | (42,613 | ) | $ | (38,685 | ) | $ | (3,162 | ) | 7.4 | % | $ | (3,928 | ) | 10.2 | % | |||||||||
|
|
|
|
|
|
|
|
|
|
|
|
|
|
|
|||||||||||||||
NM= not meaningful
The Corporate and Other category represents certain general overhead costs not fully allocated to the business segments such as legal, accounting, treasury, human resources, technology and executive functions.
Our cost of sales for the Corporate and Other category for the year ended December 31, 2014 decreased $3.0 million. The decrease was attributed to a non-recurring $3.0 million inventory reserve associated with the closure of a warehouse in 2013, which from a segment perspective is considered Other.
48
Table of Contents
Our cost of sales for the Corporate and Other category for the year ended December 31, 2013 increased $3.0 million. The increase was attributed to a $3.0 million increase in inventory reserve associated with the closure of a warehouse, which from a segment perspective is considered Other.
Our selling and administrative expense for the Corporate and Other category for year ended December 31, 2014, decreased $14.1 million, or 16.4%, from $86.1 million for the same period in 2013, to $72.0 million. The decrease was attributed to a $19.1 million decline in costs related to our initial public offering, along with acquisition related activity along with lower severance, facility closure, and restructuring cost of $6.3 million partially offset by higher legal, consulting and professional fees of $6.7 million and a $1.9 million increase in equity compensation charges due to additional equity award issuances.
Our selling and administrative expense for the Corporate and Other category for year ended December 31, 2013, increased $28.1 million, or 48.5%, from $58.0 million for the same period in 2012, to $86.1 million. The increase was attributed to a $5.3 million increase in equity compensation charges, and a $23.3 million increase which pertained to costs related to our initial public offering, along with acquisition related activity. Partially offsetting the increase in selling and administrative costs was $0.8 million of lower depreciation and a $2.7 million gain on an asset sale.
Adjusted EBITDA for the Corporate and Other category for the year ended December 31, 2014, decreased $3.2 million, or 7.4%, from a loss of $42.6 million for the same period in 2013, to a loss of $45.8 million. Our Adjusted EBITDA for the Corporate and Other category excludes depreciation, equity compensation charges, initial public offering costs, acquisition related activity, restructuring costs, severance and facility costs. The decrease in our Adjusted EBITDA for the Corporate and Other category was due to the factors described above after removing those items not included in Adjusted EBITDA for the Corporate and Other category.
Adjusted EBITDA for the Corporate and Other category for the year ended December 31, 2013, decreased $3.9 million, or 10.2%, from a loss of $38.7 million for the same period in 2012, to a loss of $42.6 million. Our Adjusted EBITDA for the Corporate and Other category excludes depreciation, equity compensation charges, initial public offering costs, acquisition related activity, restructuring costs, severance and facility costs. The increase in our Adjusted EBITDA for the Corporate and Other category was due to the factors described above after removing those items not included in Adjusted EBITDA for the Corporate and Other category.
Seasonality and Comparability
Our net sales, operating profit or loss and net cash provided by or used in operations are impacted by the inherent seasonality of the academic calendar. Consequently, the performance of our businesses may not be comparable quarter to consecutive quarter and should be considered on the basis of results for the whole year or by comparing results in a quarter with results in the same quarter for the previous year.
In the K-12 market, we typically receive payments for products and services from individual school districts, and, to a lesser extent, individual schools and states. In the Trade Publishing markets, payment is received for products and services from book distributors and retail booksellers. In the case of testing and assessment products and services, payment is received from the individually contracted parties.
Approximately 88% of our net sales for the year ended December 31, 2014 were derived from our Education segment, which is a markedly seasonal business. Schools conduct the majority of their purchases in the second and third quarters of the calendar year in preparation for the beginning of the school year. Thus, over the past three years, approximately 67% of our consolidated net sales were realized in the second and third quarters. Sales of K-12 instructional materials and customized testing products are also cyclical, with some years offering more sales opportunities than others. The amount of funding available at the state level for educational materials also has a significant effect on year-to-year net sales. Although the loss of a single customer would not have a material adverse effect on our business, schedules of school adoptions and market acceptance of our products can materially affect year-to-year net sales performance.
49
Table of Contents
The following table is indicative of the seasonality of our business and the related results:
Quarterly Results of Operations
| (in thousands) | First Quarter 2013 |
Second Quarter 2013 |
Third Quarter 2013 |
Fourth Quarter 2013 |
First Quarter 2014 |
Second Quarter 2014 |
Third Quarter 2014 |
Fourth Quarter 2014 |
||||||||||||||||||||||||
| Education segment |
$ | 126,827 | $ | 323,733 | $ | 504,585 | $ | 252,763 | $ | 121,874 | $ | 364,618 | $ | 504,724 | $ | 217,926 | ||||||||||||||||
| Trade Publishing segment |
39,767 | 39,218 | 45,605 | 46,114 | 32,059 | 37,272 | 46,284 | 47,559 | ||||||||||||||||||||||||
|
|
|
|
|
|
|
|
|
|
|
|
|
|
|
|
|
|||||||||||||||||
| Net sales |
166,594 | 362,951 | 550,190 | 298,877 | 153,933 | 401,890 | 551,008 | 265,485 | ||||||||||||||||||||||||
| Costs and expenses: |
||||||||||||||||||||||||||||||||
| Cost of sales, excluding pre-publication and publishing rights amortization |
87,060 | 158,756 | 214,750 | 124,493 | 92,648 | 166,796 | 205,395 | 123,887 | ||||||||||||||||||||||||
| Publishing rights amortization |
39,450 | 33,137 | 33,501 | 33,500 | 30,751 | 24,776 | 25,048 | 25,049 | ||||||||||||||||||||||||
| Pre-publication amortization |
26,157 | 30,496 | 31,815 | 33,247 | 28,974 | 32,063 | 33,463 | 35,193 | ||||||||||||||||||||||||
|
|
|
|
|
|
|
|
|
|
|
|
|
|
|
|
|
|||||||||||||||||
| Cost of sales |
152,667 | 222,389 | 280,066 | 191,240 | 152,373 | 223,635 | 263,906 | 184,129 | ||||||||||||||||||||||||
| Selling and administrative |
130,236 | 133,467 | 156,592 | 160,592 | 137,010 | 152,283 | 167,741 | 155,501 | ||||||||||||||||||||||||
| Other intangible asset amortization |
10,752 | 2,681 | 2,654 | 2,881 | 2,945 | 3,007 | 3,029 | 3,189 | ||||||||||||||||||||||||
| Impairment charge for investment in preferred stock, intangible assets, pre-publication costs and fixed assets |
— | 8,500 | — | 500 | — | 1,279 | — | 400 | ||||||||||||||||||||||||
| Severance and other charges |
1,928 | 1,553 | 3,343 | 3,216 | 1,757 | 3,362 | 181 | 2,000 | ||||||||||||||||||||||||
|
|
|
|
|
|
|
|
|
|
|
|
|
|
|
|
|
|||||||||||||||||
| Operating income (loss) |
(128,989 | ) | (5,639 | ) | 107,535 | (59,552 | ) | (140,152 | ) | 18,324 | 116,151 | (79,734 | ) | |||||||||||||||||||
|
|
|
|
|
|
|
|
|
|
|
|
|
|
|
|
|
|||||||||||||||||
| Other income (expense) |
||||||||||||||||||||||||||||||||
| Interest expense |
(5,907 | ) | (5,678 | ) | (5,041 | ) | (4,718 | ) | (4,297 | ) | (4,395 | ) | (4,662 | ) | (4,891 | ) | ||||||||||||||||
| Change in fair value of derivative instruments |
(530 | ) | 51 | 250 | (23 | ) | (103 | ) | (205 | ) | (1,252 | ) | (33 | ) | ||||||||||||||||||
| Loss on extinguishment of debt |
— | (598 | ) | — | — | — | — | — | — | |||||||||||||||||||||||
|
|
|
|
|
|
|
|
|
|
|
|
|
|
|
|
|
|||||||||||||||||
| Income (loss) before taxes |
(135,426 | ) | (11,864 | ) | 102,744 | (64,293 | ) | (144,552 | ) | 13,724 | 110,237 | (84,658 | ) | |||||||||||||||||||
| Income tax expense (benefit) |
1,955 | 2,402 | (2,368 | ) | 358 | 1,783 | 2,176 | 3,207 | (924 | ) | ||||||||||||||||||||||
|
|
|
|
|
|
|
|
|
|
|
|
|
|
|
|
|
|||||||||||||||||
| Net income (loss) |
$ | (137,381 | ) | $ | (14,266 | ) | $ | 105,112 | $ | (64,651 | ) | $ | (146,335 | ) | $ | 11,548 | $ | 107,030 | $ | (83,734 | ) | |||||||||||
|
|
|
|
|
|
|
|
|
|
|
|
|
|
|
|
|
|||||||||||||||||
During the first quarter of 2014, we recorded an out-of-period correction of approximately $1.1 million reducing net sales and increasing deferred revenue that should have been deferred previously. In addition, during the first quarter of 2014, we recorded approximately $3.5 million of incremental expense, primarily commissions, related to the prior year. These out-of-period corrections had no impact on our debt covenant compliance. Management believes these out-of-period corrections are not material to the current period financial statements or any previously issued financial statements and does not expect them to be material for the full fiscal year 2014. Additionally, we revised previously reported balance sheet amounts to severance and other charges of $7.3 million, which has been reclassified as long-term and to current deferred revenue of $5.2 million which has also been reclassified as long-term. The revision was not material to the reported consolidated balance sheet for any previously filed periods.
During the fourth quarter of 2013, we recorded an out-of-period correction of approximately $5.7 million of additional net sales that was deferred and should have been recognized previously in 2011 ($4.5 million), 2012 ($0.9 million), and the first nine months of 2013 ($0.3 million). In addition, during 2013, we recorded approximately $2.6 million of incremental expense related to prior years. These out-of-period corrections had no impact on cash or debt covenants compliance. Management believes these out-of-period corrections are not material to the current period financial statements or any previously issued financial statements.
50
Table of Contents
The fourth quarter of 2013 was positively impacted by an agreement with a reseller for product sales in private, parochial, and charter school markets.
Liquidity and Capital Resources
| December 31, | ||||||||||||
| (in thousands) | 2014 | 2013 | 2012 | |||||||||
| Cash and cash equivalents |
$ | 456,581 | $ | 313,628 | $ | 329,078 | ||||||
| Short-term investments |
286,764 | 111,721 | 146,041 | |||||||||
| Current portion of long-term debt |
67,500 | 2,500 | 2,500 | |||||||||
| Long-term debt |
175,625 | 243,125 | 245,625 | |||||||||
| For the year ended December 31, | ||||||||||||
| 2014 | 2013 | 2012 | ||||||||||
| Net cash provided by operating activities |
$ | 491,043 | $ | 157,203 | $ | 104,802 | ||||||
On June 22, 2012, our creditors converted the First Lien Credit Agreement consisting of the Term Loan with an aggregate outstanding principal balance of $2.6 billion and the Revolving Loan with an aggregate outstanding principal balance of $235.8 million and the outstanding $300.0 million principal amount of 10.5% Senior Notes to 100 percent pro rata ownership of our common stock.
On May 22, 2012, we entered into a new $500.0 million senior secured credit facility, which was converted into an exit facility on the effective date of the emergence from Chapter 11. As a result, our existing senior secured credit facilities consist of a $250.0 million asset-based revolving credit facility and a $250.0 million term loan facility. The proceeds from the initial borrowings under the senior secured credit facilities were used to fund the costs of the reorganization and provide post-closing working capital to the Company.
Under both the revolving credit facility and the term loan facility, Houghton Mifflin Harcourt Publishers Inc., HMH Publishers LLC and Houghton Mifflin Harcourt Publishing Company are the borrowers (the “Borrowers”), and Citibank, N.A. acts as both the administrative agent and the collateral agent.
The obligations under our senior secured credit facilities are guaranteed by the Company and each of its direct and indirect for profit domestic subsidiaries (other than the Borrowers) (collectively, the “Guarantors”) and are secured by all capital stock and other equity interests of the Borrowers and the Guarantors and substantially all of the other tangible and intangible assets of the Borrowers and the Guarantors, including without limitation, receivables, inventory, equipment, contract rights, securities, patents, trademarks, other intellectual property, cash, bank accounts and securities accounts and owned real estate. The revolving credit facility is secured by first priority liens on receivables, inventory, deposit accounts, securities accounts, instruments, chattel paper and other assets related to the foregoing (the “Revolving First Lien Collateral”), and second priority liens on the collateral which secures the term loan facility on a first priority basis. The term loan facility is secured by first priority liens on the capital stock and other equity interests of the Borrower and the Guarantors, equipment, owned real estate, trademarks and other intellectual property, general intangibles that are not Revolving First Lien Collateral and other assets related to the foregoing, and second priority liens on the Revolving First Lien Collateral.
Borrowings under the term loan facility are payable in equal quarterly amounts totaling 1.0% per annum of the original term loan facility amount prior to the maturity date of the term loan facility, with the remaining unpaid balance due and payable at maturity. No amortization payments are required with respect to the revolving credit facility.
The revolving credit facility is available based on a borrowing base comprised of eligible inventory and eligible receivables. Up to $40.0 million of the revolving credit facility is available for issuances of letters of credit. The amount of any outstanding letters of credit reduce availability under the revolving credit facility on a dollar for dollar basis.
51
Table of Contents
The revolving credit facility has a term of five years and the interest rate for borrowings under the revolving credit facility is based on, at the Borrowers’ election, LIBOR or an alternate base rate, plus in each case a margin that is determined based on average daily availability. The term loan facility has a term of six years and the interest rate for borrowings under the term loan facility is based on, at the Borrowers’ election, LIBOR plus 3.25% per annum or the alternate base rate plus 2.25%. The LIBOR rate under the term loan facility is subject to a minimum “floor” of 1.00%. As of December 31, 2014, the interest rate of the term loan facility was 4.25%. As of December 31, 2014, we had approximately $243.1 million outstanding under our term loan facility and no amounts outstanding under our revolving credit facility. We had approximately $220.0 million of borrowing availability under our revolving credit facility and approximately $20.2 million of outstanding letters of credit as of December 31, 2014.
On January 15, 2014, we amended our term loan facility to, among other things, reduce the interest rates applicable to the loans under the term loan facility. As a result of the amendment, interest rates for loans under the term loan facility are (i) the alternate base rate plus 2.25% per annum, a reduction from the alternate base rate plus 3.25% in effect prior to the amendment, and (ii) LIBOR plus 3.25% per annum, a reduction from LIBOR plus 4.25% in effect prior to the amendment.
The term loan facility contains financial covenants based on a defined EBITDA calculation requiring the Company, on a consolidated basis, to maintain a certain minimum interest coverage ratio and a certain maximum leverage ratio. The interest coverage ratio is now 9.0 to 1.0 for fiscal quarters through maturity. The maximum leverage ratio is now 2.0 to 1.0 for fiscal quarters through maturity. The revolving credit facility contains a minimum fixed charge coverage ratio which is tested if availability is less than the greater of $31.25 million and 15% of the lesser of the total commitment and the borrowing base then in effect, or less than $20.0 million if certain conditions are met. We were in compliance with each of these covenants in the term loan facility as of December 31, 2014, and the minimum fixed charge coverage ratio was not applicable under the revolving credit facility. The senior secured credit facilities also contain customary restrictive covenants, including limitations on incurrence of indebtedness, incurrence of liens, transactions with affiliates, mergers, dividends and other distributions, asset dispositions and investments.
Additionally, we are subject to Excess Cash Flow provisions under the term loan facility which are predicated upon our leverage ratio and cash flow. As of December 31, 2014, we are required to pay approximately $65.0 million under this provision. Accordingly, this amount has been classified in our current portion of long-term debt.
Our senior secured credit facilities contain customary events of default, subject to applicable grace periods, including for nonpayment of principal, interest or other amounts, violation of covenants, incorrectness of representations or warranties in any material respect, cross default to material indebtedness, material monetary judgments, ERISA defaults, insolvency, actual or asserted invalidity of loan documents or material security and change of control.
We had $456.6 million of cash and cash equivalents and $286.8 million of short-term investments as of December 31, 2014. We had $313.6 million of cash and cash equivalents and $111.7 million of short-term investments as of December 31, 2013.
We expect our net cash provided by operations combined with our cash and cash equivalents and borrowings under our revolving credit facility to provide sufficient liquidity to fund our current obligations, capital spending, debt service requirements and working capital requirements over at least the next twelve months.
52
Table of Contents
Operating activities
Net cash provided by operating activities was $491.0 million for the year ended December 31, 2014, a $333.8 million increase from the $157.2 million provided by operating activities for the year ended December 31, 2013. The increase in cash provided by operating activities from 2013 to 2014 was primarily driven by favorable net changes in operating assets and liabilities of $354.4 million. These changes were primarily due to favorable changes in deferred revenue of $228.4 million attributed to increased billings and change in product mix, favorable changes in accounts receivable of $153.5 million, favorable changes in royalties of $7.4 million, partially offset by unfavorable changes in inventories and accounts payable of $17.2 million and $4.5 million, respectively, and unfavorable net changes in other operating assets and liabilities of $13.2 million. Further, the increase was partially offset by less profitable operations, net of non-cash charges, of $20.6 million.
Net cash provided by operating activities was $157.2 million for the year ended December 31, 2013, a $52.4 million increase from the $104.8 million provided by operating activities for the year ended December 31, 2012. The increase in cash provided by operating activities from 2012 to 2013 was primarily driven by lower interest of $101.9 million, a direct result of the substantial reduction in debt related to our Chapter 11 reorganization, offset by $22.1 million of less profitable operations, and by unfavorable net changes in operating assets and liabilities of $27.4 million. These changes were primarily as a result of unfavorable changes in accounts receivable of $113.9 million due to timing, unfavorable changes in inventory of $29.1 million and in other assets and liabilities of $0.1 million partially offset by favorable changes in deferred revenue of $55.3 million, as deferred revenue declined in 2012 as a result of the lower adoption market, which is the primary driver of deferred revenue, and accounts payable of $45.7 million due to the timing of payments, and favorable changes in severance of $14.7 million.
Investing activities
Net cash used in investing activities was $367.6 million for the year ended December 31, 2014, an increase of $199.0 million from the $168.6 million used in investing activities for the year ended December 31, 2013. The increase in cash investing expenditures is primarily attributed to a $209.2 million increase in net purchases of short-term investments attributed to the 2014 cash generation. Further, there was a decrease in proceeds from sale of assets of $4.8 million for 2013 activity that did not occur in 2014. The overall increase in net cash used in investing activities was offset by a decrease in acquisition of business activity expenditures of $9.6 million and $3.9 million in pre-publication costs and property, plant and equipment, due to improvements in capital allocation management.
Net cash used in investing activities was $168.6 million for the year ended December 31, 2013, a decrease of $127.4 million from the $296.0 million used in investing activities for the year ended December 31, 2012. The decrease in cash investing expenditures is primarily attributed to an increase in net proceeds of $179.3 million from short-term investment activity, offset by a $21.1 million increase in additions to pre-publication costs and property, plant and equipment, primarily platforms. Although a portion of the increase is attributed to timing, there is a portion of the increase due to incremental spending as we prepare programs for an increase in upcoming adoptions over the next couple of years.
Financing activities
Net cash provided by financing activities was $19.5 million for the year ended December 31, 2014, an increase of $23.6 million from the $4.1 million of net cash used in financing activities for the year ended December 31, 2013. The increase was due to proceeds from stock option exercises of $22.7 million, partially offset by tax withholding payments related to net share settlements of restricted stock units of $0.7 million. Further, in 2013, there were $1.6 million of contingent consideration payments related to prior year acquisitions that did not occur in 2014.
53
Table of Contents
Net cash used in financing activities was $4.1 million for the year ended December 31, 2013, a decrease of $110.7 million from the $106.7 million net cash provided by financing activities for the year ended December 31, 2012. We paid $2.5 million of principal payments in 2013 for our outstanding indebtedness under the term loan facility during 2013. During the year ended December 31, 2012, we received proceeds of $250.0 million in connection with the initial borrowings under our term-loan facility. This amount was partially offset by our Chapter 11 reorganization costs and principal payments of long term debt of $12.7 million.
Critical Accounting Policies and Estimates
The preparation of financial statements in conformity with U.S. GAAP requires the use of estimates, assumptions and judgments by management that affect the reported amounts of assets, liabilities, net sales, expenses and related disclosure of contingent assets and liabilities in the amounts reported in the financial statements and accompanying notes. On an on-going basis, we evaluate our estimates and assumptions, including, but not limited to, book returns, allowance for bad debts, recoverability of advances to authors, valuation of inventory, financial instruments, depreciation and amortization periods, recoverability of long-term assets such as property, plant and equipment, capitalized pre-publication costs, other identified intangibles, goodwill, deferred revenue, income taxes, pensions and other postretirement benefits, contingencies, litigation and purchase accounting. We base our estimates on historical experience and on various other assumptions that we believe to be reasonable under the circumstances, the results of which form the basis for making judgments about the carrying value of assets and liabilities that are not readily apparent from other sources. Actual results may differ from those estimates. For a complete description of our significant accounting policies, see Note 3 of Notes to Consolidated Financial Statements included in Item 8, “Financial Statements and Supplementary Data.” The following policies and account descriptions include those identified as critical to our business operations and the understanding of our results of operations.
Revenue Recognition
Revenue is recognized only once persuasive evidence of an arrangement with the customer exists, the sales price is fixed or determinable, delivery of products or services has occurred, title and risk of loss with respect to products have transferred to the customer, all significant obligations, if any, have been performed, and collection is probable.
We enter into certain contractual arrangements that have multiple elements, one or more of which may be delivered subsequent to the delivery of other elements. These multiple-deliverable arrangements may include print and digital media, professional development services, training, software licenses, access to hosted content, and various services related to the software including but not limited to hosting, maintenance and support, and implementation. For these multiple-element arrangements, we allocate revenue to each deliverable of the arrangement based on the relative selling prices of the deliverables. In such circumstances, we first determine the selling price of each deliverable based on (i) vendor-specific objective evidence of fair value (“VSOE”) if that exists, (ii) third-party evidence of selling price (“TPE”) when VSOE does not exist, or (iii) our best estimate of the selling price when neither VSOE nor TPE exists. Revenue is then allocated to the non-software deliverables as a group and to the software deliverables as a group using the relative selling prices of each of the deliverables in the arrangement, based on the selling price hierarchy. Non-software deliverables include print and digital textbooks and instructional materials, trade books, reference materials, assessment materials and multimedia instructional programs; licenses to book rights and content; access to hosted content; and services including test development, test delivery, test scoring, professional development, consulting and training when those services do not relate to software deliverables. Software deliverables include software licenses, software maintenance and support services, professional services and training when those services relate to software deliverables.
For the non-software deliverables, we determine the revenue for each deliverable based on its relative selling price in the arrangement and we recognize revenue upon delivery of the product or service, assuming all other revenue recognition criteria have been met. Revenue for test delivery, test scoring and training is
54
Table of Contents
recognized when the service has been completed. Revenue for test development, professional development, consulting and training is recognized as the service is provided. Revenue for access to hosted interactive content is recognized ratably over the term of the arrangement.
For the software deliverables as a group, we recognize revenue in accordance with the authoritative guidance for software revenue recognition. As our software licenses are typically sold with maintenance and support, professional services or training, we use the residual method to determine the amount of software license revenue to be recognized.
Under the residual method, arrangement consideration of the software deliverables as a group is allocated to the undelivered elements based upon VSOE of those elements, with the residual amount of the arrangement fee allocated to and recognized as license revenue upon delivery, assuming all other revenue recognition criteria have been met. If VSOE of one or more of the undelivered services or other elements does not exist, all revenues of the software-deliverables arrangement are deferred until delivery of all of those services or other elements has occurred, or until VSOE of each of those services or other elements can be established.
As products are shipped with right of return, a provision for estimated returns on these sales is made at the time of sale based on historical experience.
Shipping and handling fees charged to customers are included in net sales.
Accounts Receivable
Accounts receivable are recorded net of allowances for doubtful accounts and reserves for book returns. In the normal course of business, we extend credit to customers that satisfy predefined criteria. We estimate the collectability of our receivables. Allowances for doubtful accounts are established through the evaluation of accounts receivable aging and prior collection experience to estimate the ultimate collectability of these receivables. Reserves for book returns are based on historical return rates and sales patterns. We determine the required reserves by segregating our returns into the applicable product or sales channel pools. Returns in the K-12 market have been historically low. We have experienced higher returns with respect to sales to resellers, international sales and Trade Publishing sales, which all result in a greater degree of risk and subjectivity when establishing the appropriate level of reserves for this customer base. At the time we determine that a receivable balance, or any portion thereof, is deemed to be permanently uncollectible, the balance is written off. The allowance for doubtful accounts and reserve for returns are reported as reductions of the accounts receivable balance and amounted to $5.6 million and $5.1 million, and $22.2 million and $35.5 million as of December 31, 2014 and 2013, respectively.
Inventories
Inventories are stated at the lower of weighted average cost or net realizable value. The level of obsolete and excess inventory is estimated on a program or title level-basis by comparing the number of units in stock with the expected future demand. The expected future demand of a program or title is determined by the copyright year, the previous years’ sales history, the subsequent year’s sales forecast, known forward-looking trends including our development cycle to replace the title or program and competing titles or programs. A change in sales trends could affect the estimated reserve. The inventory obsolescence reserve is reported as a reduction of the inventories balance and amounted to $59.0 million and $60.6 million as of December 31, 2014 and 2013, respectively.
Pre-publication Costs
Pre-publication costs are capitalized and are primarily amortized from the year of sale over five years using the sum-of-the-years-digits method, which is an accelerated method for calculating an asset’s amortization. Under this method, the amortization expense recorded for a pre-publication cost asset is approximately 33%
55
Table of Contents
(year 1), 27% (year 2), 20% (year 3), 13% (year 4) and 7% (year 5). We utilize this policy for all pre-publication costs, except with respect to our Trade Publishing young readers and general interest books, for which we expense such costs as incurred, and our assessment products, for which we use the straight-line amortization method. The amortization methods and periods chosen best reflect the pattern of expected sales generated from individual titles or programs. We periodically evaluate the remaining lives and recoverability of capitalized pre-publication costs, which are often dependent upon program acceptance by state adoption authorities.
Amortization expense related to pre-publication costs for the years ended December 31, 2014, 2013 and 2012 were $129.7 million, $121.7 million and $137.7 million, respectively.
For the year ended December 31, 2014, no pre-publication costs were deemed to be impaired. For the years ended December 31, 2013 and 2012, pre-publication costs of $1.1 million and $0.4 million, respectively, were deemed to be impaired. The impairment was included as a charge to the statement of operations in the impairment charge for investment in preferred stock, intangible assets, pre-publication costs and fixed assets caption.
Goodwill and Indefinite-Lived Intangible Assets
Goodwill and indefinite-lived intangible assets (certain trade names) are not amortized but are reviewed at least annually for impairment or earlier, if an indication of impairment exists. Recoverability of goodwill and indefinite lived intangibles is evaluated using a two-step process. In the first step, the fair value of a reporting unit is compared to its carrying value. If the fair value of a reporting unit exceeds the carrying value of the net assets assigned to a reporting unit, goodwill is considered not impaired and no further testing is required. If the carrying value of the net assets assigned to a reporting unit exceeds the fair value of a reporting unit, the second step of the impairment test is performed in order to determine the implied fair value of a reporting unit’s goodwill. Determining the implied fair value of goodwill requires valuation of a reporting unit’s tangible and intangible assets and liabilities in a manner similar to the allocation of purchase price in a business combination. If the carrying value of a reporting unit’s goodwill exceeds its implied fair value, goodwill is deemed impaired and is written down to the extent of the difference. We estimate total fair value of each reporting unit using discounted cash flow analysis, and make assumptions regarding future net sales, gross margins, working capital levels, investments in new products, capital spending, tax, cash flows and the terminal value of the reporting unit. With regard to other intangibles with indefinite lives, we determine the fair value by asset, which is then compared to its carrying value to determine if the assets are impaired.
Goodwill is allocated entirely to our Education reporting unit. Determining the fair value of a reporting unit is judgmental in nature, and involves the use of significant estimates and assumptions. These estimates and assumptions may include net sales growth rates and operating margins used to calculate projected future cash flows, risk-adjusted discount rates, future economic and market conditions, the determination of appropriate market comparables as well as the fair value of individual assets and liabilities. Consistent with prior years, we used an income approach to establish the fair value of the reporting unit as of October 1, 2014. As in prior years, we used the most recent five year strategic plan as the initial basis of our analysis.
We completed our annual goodwill and indefinite-lived intangible asset impairment tests as of October 1, 2014, 2013, and 2012 and recorded a non-cash impairment charge of $0.4 million, $0.5 million and $5.0 million for the years ended December 31, 2014, 2013, and 2012, respectively. The impairments principally related to two specific tradenames within the Trade Publishing segment in 2014 and 2013 and one specific tradename within the Education segment in 2012. The impairment charges resulted primarily from a decline in revenue from previously projected amounts as a result of the economic downturn and reduced educational spending by states and school districts.
Royalty Advances
Royalty advances to authors are capitalized and represent amounts paid in advance of the sale of an author’s product and are recovered as earned. As advances are recorded, a partial reserve may be recorded immediately based primarily upon historical sales experience to estimate the likelihood of recovery. Advances are evaluated
56
Table of Contents
periodically to determine if they are expected to be recovered. Any portion of a royalty advance that is not expected to be recovered is fully reserved. The reserve for royalty advances is reported as a reduction of the royalty advances to authors balance and amounted to $55.0 million and $41.2 million as of December 31, 2014 and 2013, respectively.
Stock-Based Compensation
The fair value of each stock option grant was estimated on the date of grant using the Black-Scholes option pricing model, which requires management’s use of highly subjective estimates and assumptions. The use of different estimates and assumptions in the option pricing model could have a material impact on the estimated fair value of option grants and the related expense. Historically, as a private company, we lacked company-specific historical and implied volatility information. Therefore, we estimate our expected volatility based on the historical volatility of our publicly traded peer companies and expect to continue to do so until such time as we have adequate historical data regarding the volatility of our traded stock price. The expected life assumption is based on the simplified method for estimating expected term for awards. This option has been elected as we do not have sufficient stock option exercise experience to support a reasonable estimate of the expected term. The risk-free interest rate is the yield currently available on U.S. Treasury zero-coupon issues with a remaining term approximating the expected term of the option. The expected dividend yield is based on actual dividends paid or to be paid. We recognize compensation expense for only the portion of stock based awards that are expected to vest. Accordingly, we have estimated expected forfeitures of stock based awards based on our historical forfeiture rate and used these rates in developing a future forfeiture rate. If our actual forfeiture rate varies from our historical rates and estimates, additional adjustments to compensation expense may be required in future periods.
Impact of Inflation and Changing Prices
Although inflation is currently well below levels in prior years and has, therefore, benefited recent results, particularly in the area of manufacturing costs, there are offsetting costs. Our ability to adjust selling prices has always been limited by competitive factors and long-term contractual arrangements which either prohibit price increases or limit the amount by which prices may be increased. Further, a weak domestic economy at a time of low inflation could cause lower tax receipts at the state and local level, and the funding and buying patterns for textbooks and other educational materials could be adversely affected. Prices for paper moderated during the last three years.
The most significant assets affected by inflation include pre-publication, other property, plant and equipment and inventories. We use the weighted average cost method to value substantially all inventory. We have negotiated favorable pricing through contractual agreements with our two top print and sourcing vendors, and from our other major vendors, which has helped to stabilize our unit costs, and therefore our cost of inventories sold. Our publishing business requires a high level of investment in pre-publication for our educational and reference works, and in other property, plant and equipment. We expect to continue to commit funds to the publishing areas through both internal growth and acquisitions. We believe that by continuing to emphasize cost controls, technological improvements and quality control, we can continue to moderate the impact of inflation on our operating results and financial position.
Covenant Compliance
As of December 31, 2014, we were in compliance with all of our debt covenants.
We are currently required to meet certain restrictive financial covenants as defined under our term loan facility and revolving credit facility. We have financial covenants primarily pertaining to interest coverage and maximum leverage ratios. A breach of any of these covenants, ratios, tests or restrictions, as applicable, for which a waiver is not obtained could result in an event of default, in which case our lenders could elect to declare
57
Table of Contents
all amounts outstanding to be immediately due and payable and result in a cross-default under other arrangements containing such provisions. A default would permit lenders to accelerate the maturity for the debt under these agreements and to foreclose upon any collateral securing the debt owed to these lenders and to terminate any commitments of these lenders to lend to us. If the lenders accelerate the payment of the indebtedness, our assets may not be sufficient to repay in full the indebtedness and any other indebtedness that would become due as a result of any acceleration. Further, in such an event, the lenders would not be required to make further loans to us, and assuming similar facilities were not established and we are unable to obtain replacement financing, it would materially affect our liquidity and results of operations.
Additionally, we are subject to Excess Cash Flow provisions under the term loan facility which are predicated upon our leverage ratio and cash flow. As of December 31, 2014, we are required to pay approximately $65.0 million under this provision. Accordingly, we have classified this amount in our current portion of long-term debt.
Contractual Obligations
The following table provides information with respect to our estimated commitments and obligations as of December 31, 2014:
| Contractual Obligations |
Total | Less than 1 year |
1-3 years | 3-5 years | More than 5 years |
|||||||||||||||
| (in thousands) | ||||||||||||||||||||
| Term loan facility due May 2018 (1) |
$ | 243,125 | $ | 67,500 | $ | 5,000 | $ | 170,625 | $ | — | ||||||||||
| Interest payable on term loan facility due May 2018 (2) |
35,327 | 10,479 | 20,634 | 4,214 | — | |||||||||||||||
| Capital leases |
3,813 | 2,408 | 1,405 | — | — | |||||||||||||||
| Operating leases (3) |
158,762 | 42,547 | 55,832 | 26,783 | 33,600 | |||||||||||||||
| Purchase obligations (4) |
89,029 | 53,160 | 32,425 | 2,096 | 1,348 | |||||||||||||||
|
|
|
|
|
|
|
|
|
|
|
|||||||||||
| Total cash contractual obligations |
$ | 530,056 | $ | 176,094 | $ | 115,296 | $ | 203,718 | $ | 34,948 | ||||||||||
|
|
|
|
|
|
|
|
|
|
|
|||||||||||
| (1) | The term loan facility amortizes at a rate of 1% per annum of the original $250.0 million amount. |
| (2) | As of December 31, 2014, the interest rate was 4.25%. |
| (3) | Represents minimum lease payments under non-cancelable operating leases. |
| (4) | Purchase obligations are agreements to purchase goods or services that are enforceable and legally binding. These goods and services consist primarily of author advances, subcontractor expenses, information technology licenses, and outsourcing arrangements. |
In addition to the payments described above, we have employee benefit obligations that require future payments. For example, we have made $13.9 million in cash contributions to our pension and postretirement benefit plans in 2014 and expect to make another $8.8 million of contributions in 2015 relating to our pension and postretirement benefit plans although we are not obligated to do so. We expect to periodically draw and repay borrowings under the revolving credit facility. We believe that we will be able to meet our cash interest obligations on our outstanding debt when they are due and payable.
Off-Balance Sheet Arrangement
We have no off-balance sheet arrangements.
58
Table of Contents
Item 7A. Quantitative and Qualitative Disclosures About Market Risk
We are exposed to market risk from foreign currency exchange rates and interest rates, which could affect operating results, financial position and cash flows. We manage exposure to these market risks through our regular operating and financing activities and, when appropriate, through the use of derivative financial instruments. These derivative financial instruments are utilized to hedge economic exposures, as well as reduce our earnings and cash flow volatility resulting from shifts in market rates. As permitted, we may designate certain of these derivative contracts for hedge accounting treatment in accordance with authoritative guidance regarding accounting for derivative instruments and hedging activities. However, certain of these instruments may not qualify for, or we may choose not to elect, hedge accounting treatment and, accordingly, the results of our operations may be exposed to some level of volatility. Volatility in our results of operations will vary with the type and amount of derivative hedges outstanding, as well as fluctuations in the currency and interest rate market during the period. Periodically, we may enter into derivative contracts, including interest rate swap agreements and interest rate caps and collars to manage interest rate exposures, and foreign currency spot, forward, swap and option contracts to manage foreign currency exposures. The fair market values of all of these derivative contracts change with fluctuations in interest rates and/or currency rates and are designed so that any changes in their values are offset by changes in the values of the underlying exposures. Derivative financial instruments are held solely as risk management tools and not for trading or speculative purposes.
By their nature, all derivative instruments involve, to varying degrees, elements of market and credit risk not recognized in our financial statements. The market risk associated with these instruments resulting from currency exchange and interest rate movements is expected to offset the market risk of the underlying transactions, assets and liabilities being hedged. Our policy is to deal with counterparties having a single A or better credit rating at the time of the execution. We manage credit risk through the continuous monitoring of exposures to such counterparties.
We continue to review liquidity sufficiency by performing various stress test scenarios, such as cash flow forecasting, which considers hypothetical interest rate movements. Furthermore, we continue to closely monitor current events and the financial institutions that support our credit facility, including monitoring their credit ratings and outlooks, credit default swap levels, capital raising and merger activity.
As of December 31, 2014, we have $243.1 million of aggregate principal amount indebtedness outstanding under our term loan facility that bears interest at a variable rate. An increase or decrease of 1% in the interest rate will change our interest expense by approximately $2.4 million on an annual basis. We also have up to $250.0 million of borrowing availability, subject to borrowing base availability, under our revolving credit facility, and borrowings under the revolving credit facility bear interest at a variable rate. We have no borrowings outstanding under the revolving credit facility at December 31, 2014. Assuming that the revolving credit facility is fully drawn, an increase or decrease of 1% in the interest rate will change our interest expense associated with the revolving credit facility by $2.5 million on an annual basis.
We conduct various digital development activities in Ireland, and as such, our cash flows and costs are subject to fluctuations from changes in foreign currency exchange rates. We manage our exposures to this market risk through the use of short-term foreign exchange forward and option contracts, when deemed appropriate, which were not significant as of December 31, 2014 and December 31, 2013. We do not enter into derivative transactions or use other financial instruments for trading or speculative purposes.
59
Table of Contents
Item 8. Financial Statements and Supplementary Data
Report of Independent Registered Public Accounting Firm
To the Board of Directors and Stockholders of
Houghton Mifflin Harcourt Company:
In our opinion, the consolidated financial statements listed in the index appearing under Item 15(a)(1) present fairly, in all material respects, the financial position of Houghton Mifflin Harcourt Company and its subsidiaries at December 31, 2014 and December 31, 2013, and the results of their operations and their cash flows for each of the three years in the period ended December 31, 2014 in conformity with accounting principles generally accepted in the United States of America. Also in our opinion, the Company maintained, in all material respects, effective internal control over financial reporting as of December 31, 2014, based on criteria established in Internal Control—Integrated Framework (2013) issued by the Committee of Sponsoring Organizations of the Treadway Commission (COSO). The Company’s management is responsible for these financial statements, for maintaining effective internal control over financial reporting and for its assessment of the effectiveness of internal control over financial reporting, included in Management’s Report on Internal Control over Financial Reporting appearing under Item 9A. Our responsibility is to express opinions on these financial statements and on the Company’s internal control over financial reporting based on our audits (which was an integrated audit in 2014). We conducted our audits in accordance with the standards of the Public Company Accounting Oversight Board (United States). Those standards require that we plan and perform the audits to obtain reasonable assurance about whether the financial statements are free of material misstatement and whether effective internal control over financial reporting was maintained in all material respects. Our audits of the financial statements included examining, on a test basis, evidence supporting the amounts and disclosures in the financial statements, assessing the accounting principles used and significant estimates made by management, and evaluating the overall financial statement presentation. Our audit of internal control over financial reporting included obtaining an understanding of internal control over financial reporting, assessing the risk that a material weakness exists, and testing and evaluating the design and operating effectiveness of internal control based on the assessed risk. Our audits also included performing such other procedures as we considered necessary in the circumstances. We believe that our audits provide a reasonable basis for our opinions.
A company’s internal control over financial reporting is a process designed to provide reasonable assurance regarding the reliability of financial reporting and the preparation of financial statements for external purposes in accordance with generally accepted accounting principles. A company’s internal control over financial reporting includes those policies and procedures that (i) pertain to the maintenance of records that, in reasonable detail, accurately and fairly reflect the transactions and dispositions of the assets of the company; (ii) provide reasonable assurance that transactions are recorded as necessary to permit preparation of financial statements in accordance with generally accepted accounting principles, and that receipts and expenditures of the company are being made only in accordance with authorizations of management and directors of the company; and (iii) provide reasonable assurance regarding prevention or timely detection of unauthorized acquisition, use, or disposition of the company’s assets that could have a material effect on the financial statements.
Because of its inherent limitations, internal control over financial reporting may not prevent or detect misstatements. Also, projections of any evaluation of effectiveness to future periods are subject to the risk that controls may become inadequate because of changes in conditions, or that the degree of compliance with the policies or procedures may deteriorate.
/s/ PricewaterhouseCoopers LLP
Boston, Massachusetts
February 26, 2015
60
Table of Contents
Houghton Mifflin Harcourt Company
| (in thousands of dollars, except share information) | December 31, 2014 |
December 31, 2013 |
||||||
| Assets |
||||||||
| Current assets |
||||||||
| Cash and cash equivalents |
$ | 456,581 | $ | 313,628 | ||||
| Short-term investments |
286,764 | 111,721 | ||||||
| Accounts receivable, net of allowance for bad debts and book returns of $27.8 million and $40.6 million, respectively |
255,669 | 318,101 | ||||||
| Inventories |
183,961 | 182,194 | ||||||
| Deferred income taxes |
20,459 | 29,842 | ||||||
| Prepaid expenses and other assets |
18,665 | 16,130 | ||||||
|
|
|
|
|
|||||
| Total current assets |
1,222,099 | 971,616 | ||||||
| Property, plant, and equipment, net |
138,362 | 140,848 | ||||||
| Pre-publication costs, net |
236,995 | 269,488 | ||||||
| Royalty advances to authors, net of allowance of $55.0 million and $41.2 million, respectively |
46,777 | 46,881 | ||||||
| Goodwill |
532,921 | 531,786 | ||||||
| Other intangible assets, net |
801,969 | 919,994 | ||||||
| Deferred income taxes |
3,705 | — | ||||||
| Other assets |
28,279 | 29,773 | ||||||
|
|
|
|
|
|||||
| Total assets |
$ | 3,011,107 | $ | 2,910,386 | ||||
|
|
|
|
|
|||||
| Liabilities and Stockholders’ Equity |
||||||||
| Current liabilities |
||||||||
| Current portion of long-term debt |
$ | 67,500 | $ | 2,500 | ||||
| Accounts payable |
51,266 | 105,012 | ||||||
| Royalties payable |
80,089 | 65,387 | ||||||
| Salaries, wages, and commissions payable |
59,733 | 29,945 | ||||||
| Deferred revenue |
157,016 | 107,905 | ||||||
| Interest payable |
47 | 55 | ||||||
| Severance and other charges |
5,928 | 8,184 | ||||||
| Accrued postretirement benefits |
2,037 | 2,141 | ||||||
| Other liabilities |
27,015 | 32,002 | ||||||
|
|
|
|
|
|||||
| Total current liabilities |
450,631 | 353,131 | ||||||
| Long-term debt |
175,625 | 243,125 | ||||||
| Royalties payable |
— | 1,520 | ||||||
| Long-term deferred revenue |
370,103 | 189,258 | ||||||
| Accrued pension benefits |
18,525 | 24,405 | ||||||
| Accrued postretirement benefits |
26,500 | 23,860 | ||||||
| Deferred income taxes |
112,220 | 116,999 | ||||||
| Other liabilities |
97,823 | 107,812 | ||||||
|
|
|
|
|
|||||
| Total liabilities |
1,251,427 | 1,060,110 | ||||||
|
|
|
|
|
|||||
| Commitments and contingencies (Note 13) |
||||||||
| Stockholders’ equity |
||||||||
| Preferred stock, $0.01 par value: 20,000,000 shares authorized; no shares issued and outstanding at December 31, 2014 and 2013 |
— | — | ||||||
| Common stock, $0.01 par value: 380,000,000 shares authorized; 142,000,019 and 140,044,400 shares issued at December 31, 2014 and 2013, respectively; and 141,917,997 and 139,962,378 shares outstanding at December 31, 2014 and 2013, respectively |
1,420 | 1,400 | ||||||
| Treasury stock, 82,022 shares as of December 31, 2014 and 2013 |
— | — | ||||||
| Capital in excess of par value |
4,784,962 | 4,750,589 | ||||||
| Accumulated deficit |
(2,999,913 | ) | (2,888,422 | ) | ||||
| Accumulated other comprehensive loss |
(26,789 | ) | (13,291 | ) | ||||
|
|
|
|
|
|||||
| Total stockholders’ equity |
1,759,680 | 1,850,276 | ||||||
|
|
|
|
|
|||||
| Total liabilities and stockholders’ equity |
$ | 3,011,107 | $ | 2,910,386 | ||||
|
|
|
|
|
|||||
The accompanying notes are an integral part of these consolidated financial statements.
61
Table of Contents
Houghton Mifflin Harcourt Company
Consolidated Statements of Operations
| (in thousands of dollars, except share and per share data) | Years Ended December 31, | |||||||||||
| 2014 | 2013 | 2012 | ||||||||||
| Net sales |
$ | 1,372,316 | $ | 1,378,612 | $ | 1,285,641 | ||||||
| Costs and expenses |
||||||||||||
| Cost of sales, excluding pre-publication and publishing rights amortization |
588,726 | 585,059 | 515,948 | |||||||||
| Publishing rights amortization |
105,624 | 139,588 | 177,747 | |||||||||
| Pre-publication amortization |
129,693 | 121,715 | 137,729 | |||||||||
|
|
|
|
|
|
|
|||||||
| Cost of sales |
824,043 | 846,362 | 831,424 | |||||||||
| Selling and administrative |
612,535 | 580,887 | 533,462 | |||||||||
| Other intangible asset amortization |
12,170 | 18,968 | 54,815 | |||||||||
| Impairment charge for investment in preferred stock, intangible assets, pre-publication costs and fixed assets |
1,679 | 9,000 | 8,003 | |||||||||
| Severance and other charges |
7,300 | 10,040 | 9,375 | |||||||||
| Gain on bargain purchase |
— | — | (30,751 | ) | ||||||||
|
|
|
|
|
|
|
|||||||
| Operating loss |
(85,411 | ) | (86,645 | ) | (120,687 | ) | ||||||
|
|
|
|
|
|
|
|||||||
| Other income (expense) |
||||||||||||
| Interest expense |
(18,245 | ) | (21,344 | ) | (123,197 | ) | ||||||
| Change in fair value of derivative instruments |
(1,593 | ) | (252 | ) | 1,688 | |||||||
| Loss on extinguishment of debt |
— | (598 | ) | — | ||||||||
|
|
|
|
|
|
|
|||||||
| Loss before reorganization items and taxes |
(105,249 | ) | (108,839 | ) | (242,196 | ) | ||||||
| Reorganization items, net |
— | — | (149,114 | ) | ||||||||
| Income tax expense (benefit) |
6,242 | 2,347 | (5,943 | ) | ||||||||
|
|
|
|
|
|
|
|||||||
| Net loss |
$ | (111,491 | ) | $ | (111,186 | ) | $ | (87,139 | ) | |||
|
|
|
|
|
|
|
|||||||
| Net loss per share attributable to common stockholders |
||||||||||||
| Basic |
$ | (0.79 | ) | $ | (0.79 | ) | $ | (0.26 | ) | |||
|
|
|
|
|
|
|
|||||||
| Diluted |
$ | (0.79 | ) | $ | (0.79 | ) | $ | (0.26 | ) | |||
|
|
|
|
|
|
|
|||||||
| Weighted average shares outstanding |
||||||||||||
| Basic |
140,594,689 | 139,928,650 | 340,918,128 | |||||||||
|
|
|
|
|
|
|
|||||||
| Diluted |
140,594,689 | 139,928,650 | 340,918,128 | |||||||||
|
|
|
|
|
|
|
|||||||
The accompanying notes are an integral part of these consolidated financial statements.
62
Table of Contents
Houghton Mifflin Harcourt Company
Consolidated Statements of Comprehensive Loss
| Years Ended December 31, | ||||||||||||
| (in thousands of dollars) | 2014 | 2013 | 2012 | |||||||||
| Net loss |
$ | (111,491 | ) | $ | (111,186 | ) | $ | (87,139 | ) | |||
| Other comprehensive income (loss) |
||||||||||||
| Foreign currency translation adjustments |
(29 | ) | 404 | (465 | ) | |||||||
| Change in pension and benefit plan liability, net of tax expense of $4,977 and $85 for 2013 and 2012, respectively |
(13,380 | ) | 7,846 | 2,378 | ||||||||
| Unrealized gain (loss) on short-term investments, net of tax |
(89 | ) | (13 | ) | 12 | |||||||
|
|
|
|
|
|
|
|||||||
| Other comprehensive income (loss), net of taxes |
(13,498 | ) | 8,237 | 1,925 | ||||||||
|
|
|
|
|
|
|
|||||||
| Comprehensive loss |
$ | (124,989 | ) | $ | (102,949 | ) | $ | (85,214 | ) | |||
|
|
|
|
|
|
|
|||||||
The accompanying notes are an integral part of these consolidated financial statements.
63
Table of Contents
Houghton Mifflin Harcourt Company
Consolidated Statements of Cash Flows
| Years Ended December 31, | ||||||||||||
| (in thousands of dollars) | 2014 | 2013 | 2012 | |||||||||
| Cash flows from operating activities |
||||||||||||
| Net loss |
$ | (111,491 | ) | $ | (111,186 | ) | $ | (87,139 | ) | |||
| Adjustments to reconcile net loss to net cash provided by operating activities |
||||||||||||
| Gain on bargain purchase |
— | — | (30,751 | ) | ||||||||
| Gain on sale of assets |
— | (2,720 | ) | — | ||||||||
| Depreciation and amortization expense |
319,777 | 341,979 | 428,422 | |||||||||
| Amortization of debt discount and deferred financing costs |
4,750 | 4,797 | 24,584 | |||||||||
| Deferred income taxes (benefit) |
899 | (3,121 | ) | (10,076 | ) | |||||||
| Noncash stock-based compensation expense |
11,376 | 9,524 | 6,254 | |||||||||
| Noncash issuance of warrants |
— | — | 10,747 | |||||||||
| Reorganization items |
— | — | (179,024 | ) | ||||||||
| Loss on extinguishment of debt |
— | 598 | — | |||||||||
| Impairment charge for investment in preferred stock, intangible assets, pre-publication costs and fixed assets |
1,679 | 9,000 | 8,003 | |||||||||
| Change in fair value of derivative instruments |
1,593 | 252 | (1,688 | ) | ||||||||
| Changes in operating assets and liabilities, net of acquisitions |
||||||||||||
| Accounts receivable |
65,519 | (88,029 | ) | 25,826 | ||||||||
| Inventories |
(1,763 | ) | 15,419 | 44,549 | ||||||||
| Accounts payable and accrued expenses |
(3,432 | ) | 1,076 | (44,594 | ) | |||||||
| Royalties, net |
13,286 | 5,851 | 9,478 | |||||||||
| Deferred revenue |
229,105 | 702 | (54,615 | ) | ||||||||
| Interest payable |
(8 | ) | (32 | ) | 4,912 | |||||||
| Severance and other charges |
(5,210 | ) | (2,759 | ) | (17,460 | ) | ||||||
| Accrued pension and postretirement benefits |
(16,724 | ) | (15,057 | ) | (19,710 | ) | ||||||
| Other, net |
(18,313 | ) | (9,091 | ) | (12,916 | ) | ||||||
|
|
|
|
|
|
|
|||||||
| Net cash provided by operating activities |
491,043 | 157,203 | 104,802 | |||||||||
|
|
|
|
|
|
|
|||||||
| Cash flows from investing activities |
||||||||||||
| Proceeds from restricted cash accounts |
— | — | 26,495 | |||||||||
| Proceeds from sales and maturities of short-term investments |
134,275 | 251,168 | 19,575 | |||||||||
| Purchases of short-term investments |
(310,149 | ) | (217,855 | ) | (165,603 | ) | ||||||
| Additions to pre-publication costs |
(115,509 | ) | (126,718 | ) | (114,522 | ) | ||||||
| Additions to property, plant, and equipment |
(67,145 | ) | (59,803 | ) | (50,943 | ) | ||||||
| Proceeds from sale of assets |
— | 4,825 | — | |||||||||
| Acquisition of business, net of cash acquired |
(9,091 | ) | (18,695 | ) | (11,000 | ) | ||||||
| Investment in preferred stock |
— | (1,500 | ) | — | ||||||||
|
|
|
|
|
|
|
|||||||
| Net cash (used in) provided by investing activities |
(367,619 | ) | (168,578 | ) | (295,998 | ) | ||||||
|
|
|
|
|
|
|
|||||||
| Cash flows from financing activities |
||||||||||||
| Proceeds from term loan |
— | — | 250,000 | |||||||||
| Payments of long-term debt |
(2,500 | ) | (2,500 | ) | (12,750 | ) | ||||||
| Tax withholding payments related to net share settlements of restricted stock units |
(723 | ) | — | — | ||||||||
| Proceeds from stock option exercises |
22,752 | — | — | |||||||||
| Payments of deferred financing fees |
— | — | (26,586 | ) | ||||||||
| Payment of capital restructuring costs |
— | — | (104,000 | ) | ||||||||
| Payments of contingent consideration |
— | (1,575 | ) | — | ||||||||
|
|
|
|
|
|
|
|||||||
| Net cash provided by (used in) financing activities |
19,529 | (4,075 | ) | 106,664 | ||||||||
|
|
|
|
|
|
|
|||||||
| Net increase (decrease) in cash and cash equivalents |
142,953 | (15,450 | ) | (84,532 | ) | |||||||
| Cash and cash equivalents |
||||||||||||
| Beginning of period |
313,628 | 329,078 | 413,610 | |||||||||
| Net (decrease) increase in cash and cash equivalents |
142,953 | (15,450 | ) | (84,532 | ) | |||||||
|
|
|
|
|
|
|
|||||||
| End of period |
$ | 456,581 | $ | 313,628 | $ | 329,078 | ||||||
|
|
|
|
|
|
|
|||||||
| Supplementary disclosure of cash flow information |
||||||||||||
| Income taxes paid |
$ | 2,336 | $ | 1,220 | $ | 7,699 | ||||||
| Interest paid |
12,328 | 17,595 | 92,481 | |||||||||
| Pre-publication costs included in accounts payable (non cash) |
6,102 | 24,499 | 15,070 | |||||||||
| Property, plant, and equipment included in accounts payable (non cash) |
2,663 | 6,162 | 3,659 | |||||||||
| Property, plant, and equipment acquired under capital leases (non cash) |
3,495 | 4,289 | 4,799 | |||||||||
The accompanying notes are an integral part of these consolidated financial statements.
64
Table of Contents
Houghton Mifflin Harcourt Company
Consolidated Statements of Stockholders’ Equity
| Capital in excess of Par Value |
Accumulated Deficit |
Accumulated Other Comprehensive Income (Loss) |
||||||||||||||||||||||||||
| (in thousands of dollars, except share information) |
Common Stock | Treasury Stock | Total | |||||||||||||||||||||||||
| Shares | Par Value | |||||||||||||||||||||||||||
| Balance at December 31, 2011 |
567,272,470 | $ | 567 | $ | — | $ | 2,038,431 | $ | (2,690,097 | ) | $ | (23,453 | ) | $ | (674,552 | ) | ||||||||||||
| Net loss |
— | — | — | — | (87,139 | ) | — | (87,139 | ) | |||||||||||||||||||
| Other comprehensive income (loss), net of tax expense of $85 |
— | — | — | — | — | 1,925 | 1,925 | |||||||||||||||||||||
| Issuance of common stock |
140,000,000 | 1,400 | — | 1,748,600 | — | — | 1,750,000 | |||||||||||||||||||||
| Gain on debt-for-equity exchange, net of tax expense of $73,801 |
(567,272,470 | ) | (567 | ) | — | 937,033 | — | — | 936,466 | |||||||||||||||||||
| Issuance of warrants |
— | — | — | 10,747 | — | — | 10,747 | |||||||||||||||||||||
| Stock compensation |
— | — | — | 6,254 | — | — | 6,254 | |||||||||||||||||||||
| Addition of treasury stock, 82,022 shares |
— | — | — | — | — | — | — | |||||||||||||||||||||
|
|
|
|
|
|
|
|
|
|
|
|
|
|
|
|||||||||||||||
| Balance at December 31, 2012 |
140,000,000 | $ | 1,400 | $ | — | $ | 4,741,065 | $ | (2,777,236 | ) | $ | (21,528 | ) | $ | 1,943,701 | |||||||||||||
| Net loss |
— | — | — | — | (111,186 | ) | — | (111,186 | ) | |||||||||||||||||||
| Other comprehensive income (loss), net of tax expense of $4,977 |
— | — | — | — | — | 8,237 | 8,237 | |||||||||||||||||||||
| Issuance of common stock for vesting of restricted stock units |
44,400 | — | — | — | — | — | — | |||||||||||||||||||||
| Stock compensation |
— | — | — | 9,524 | — | — | 9,524 | |||||||||||||||||||||
|
|
|
|
|
|
|
|
|
|
|
|
|
|
|
|||||||||||||||
| Balance at December 31, 2013 |
140,044,400 | $ | 1,400 | $ | — | $ | 4,750,589 | $ | (2,888,422 | ) | $ | (13,291 | ) | $ | 1,850,276 | |||||||||||||
| Net loss |
— | — | — | — | (111,491 | ) | — | (111,491 | ) | |||||||||||||||||||
| Other comprehensive income (loss), net |
— | — | — | — | — | (13,498 | ) | (13,498 | ) | |||||||||||||||||||
| Issuance of common stock for vesting of restricted stock units |
95,553 | 1 | — | (1 | ) | — | — | — | ||||||||||||||||||||
| Issuance of common stock for exercise of stock options |
1,860,066 | 19 | — | 23,721 | — | — | 23,740 | |||||||||||||||||||||
| Stock withheld to cover tax withholdings requirements upon vesting of restricted stock units |
— | — | — | (723 | ) | — | — | (723 | ) | |||||||||||||||||||
| Stock compensation |
— | — | — | 11,376 | — | — | 11,376 | |||||||||||||||||||||
|
|
|
|
|
|
|
|
|
|
|
|
|
|
|
|||||||||||||||
| Balance at December 31, 2014 |
142,000,019 | $ | 1,420 | $ | — | $ | 4,784,962 | $ | (2,999,913 | ) | $ | (26,789 | ) | $ | 1,759,680 | |||||||||||||
|
|
|
|
|
|
|
|
|
|
|
|
|
|
|
|||||||||||||||
The accompanying notes are an integral part of these consolidated financial statements.
65
Table of Contents
Houghton Mifflin Harcourt Company
Notes to Consolidated Financial Statements
(in thousands of dollars, except share and per share information)
| 1. | Basis of Presentation |
Houghton Mifflin Harcourt Company, formerly known as HMH Holdings (Delaware), Inc. (“HMH”, “Houghton Mifflin Harcourt”, “we”, “us”, “our”, or the “Company”), is a global learning company, specializing in education solutions across a variety of media, delivering content, services and technology to over 50 million students in over 150 countries worldwide. We deliver our offerings to both educational institutions and consumers around the world. In the United States, we are the leading provider of Kindergarten through twelfth grade (K-12) educational content by market share. We believe that nearly every current K-12 student in the United States has utilized our content during the course of his or her education. As a result, we believe that we have an established reputation with students and educators that is difficult for others to replicate and positions us to also provide broader content and services to serve their learning needs beyond the classroom. We believe our long-standing reputation and well-known brands enable us to capitalize on consumer and digital trends in the education market through our existing and developing channels. Furthermore, since 1832, we have published trade and reference materials, including adult and children’s fiction and non-fiction books that have won industry awards such as the Pulitzer Prize, Newbery and Caldecott medals and National Book Award, all of which are widely known.
The consolidated December 31, 2014 and 2013 financial statements of HMH include the accounts of all of our wholly-owned subsidiaries as of and for the periods ended December 31, 2014, December 31, 2013 and December 31, 2012.
The accompanying consolidated financial statements have been prepared in accordance with accounting principles generally accepted in the United States of America (“GAAP”). All intercompany accounts and transactions have been eliminated.
During the first quarter of 2014, we recorded an out-of-period correction of approximately $1.1 million reducing net sales and increasing deferred revenue that should have been deferred previously. In addition, during the first quarter of 2014, we recorded approximately $3.5 million of incremental expense, primarily commissions, related to the prior year. These out-of-period corrections had no impact on our debt covenant compliance. Management believes these out-of-period corrections are not material to the current period financial statements or any previously issued financial statements. Additionally, we revised previously reported balance sheet amounts to severance and other charges of $7.3 million, which has been reclassified as long-term and to current deferred revenue of $5.2 million which has also been reclassified as long-term. The revision was not material to the reported consolidated balance sheet for any previously filed periods.
During the fourth quarter of 2013, we recorded an out-of-period correction of approximately $5.7 million of additional net sales that was deferred and should have been recognized previously in 2011 ($4.5 million), 2012 ($0.9 million), and the first nine months of 2013 ($0.3 million). In addition, during 2013, we recorded approximately $2.6 million of incremental expense related to prior years. These out-of-period corrections had no impact on cash or debt covenants compliance. Management believes these out-of-period corrections are not material to the current period financial statements or any previously issued financial statements.
Seasonality and Comparability
Our net sales, operating profit and operating cash flows are impacted by the inherent seasonality of the academic calendar. Consequently, the performance of our businesses may not be comparable quarter to consecutive quarter and should be considered on the basis of results for the whole year or by comparing results in a quarter with results in the same quarter for the previous year.
Schools make most of their purchases in the second and third quarters of the calendar year in preparation for the beginning of the school year. Thus, over the past three years, approximately 67% of consolidated net
66
Table of Contents
Houghton Mifflin Harcourt Company
Notes to Consolidated Financial Statements
(in thousands of dollars, except share and per share information)
sales have historically been realized in the second and third quarters. Sales of K-12 instructional materials and customized testing products are also cyclical, with some years offering more sales opportunities than others. The amount of funding available at the state level for educational materials also has a significant effect on year-to-year net sales. Although the loss of a single customer would not have a material adverse effect on our business, schedules of school adoptions and market acceptance of our products can materially affect year-to-year net sales performance.
Chapter 11 Reorganization
On May 10, 2012, we entered into a Restructuring Support Agreement (“Plan Support Agreement”) with consenting creditors holding greater than 74% of the principal amount of the then-outstanding senior secured indebtedness of the Company and with equity owners holding approximately 64% of the Company’s then-outstanding common stock. The consenting creditors agreed to support the Company’s Pre-Packaged Chapter 11 Plan of Reorganization (“Plan”). Pursuant to the Plan Support Agreement, the Company agreed to use its best efforts to (i) support and complete the restructuring and all transactions contemplated by the Plan, (ii) take any and all necessary and appropriate actions in furtherance of the restructuring contemplated under the Plan, (iii) complete the restructuring and all transactions contemplated under the Plan within set time-frames, (iv) obtain any and all required regulatory and/or third-party approvals for the restructuring, and (v) not directly or indirectly, seek, solicit, support, or engage in the negotiation or formulation of alternate plans of reorganization that were inconsistent with the reorganization as contemplated by the Plan Support Agreement.
On May 21, 2012 (the “Petition Date”), the U.S. based entities that borrowed or guaranteed the debt of the Company (collectively the “Debtors”), filed voluntary petitions for relief under Chapter 11 of the United States Bankruptcy Code (“Chapter 11”) in the United States Bankruptcy Court for the Southern District of New York (“Court”). The Debtors also concurrently filed the Plan, the Disclosure Statement in support of the Plan and filed various motions seeking relief to continue operations. Following the Petition Date, the Debtors operated their business as “debtors in possession” (“DIP”) under the jurisdiction of the Court and in accordance with the applicable provisions of the Bankruptcy Code and orders of the Court. Under Chapter 11, certain claims against us in existence before the Petition Date were stayed while we operated our business as a DIP, including any actions that might be commenced with regards to secured claims, although the holders of such claims had the right to move the Court for relief from the stay. Subsequent to the Petition Date, these claims were reflected in the balance sheet as liabilities subject to compromise. Secured claims were secured primarily by liens on the Company’s accounts receivable. Additional claims (liabilities subject to compromise) could have potentially arisen after the filing date resulting from rejection of executory contracts or from the determination by the Court (or agreed to by parties in interest).
On June 22, 2012, the Company successfully emerged from bankruptcy as a reorganized company pursuant to the Plan. Ultimately, the Debtors did not reject any executory contracts during the bankruptcy case, and the Company continues to review and reconcile claims that were filed against it by creditors.
Stock Split and Name Change
The Board of Directors approved a 2-for-1 stock split of the Company’s common stock, which occurred on October 22, 2013. In addition, the Board of Directors and stockholders approved an increase to the number of authorized shares of preferred stock and common stock to 20,000,000 shares authorized and 380,000,000 shares authorized, respectively. The accompanying financial statements and notes to the financial statements give retroactive effect to the stock split for all periods presented.
67
Table of Contents
Houghton Mifflin Harcourt Company
Notes to Consolidated Financial Statements
(in thousands of dollars, except share and per share information)
On October 22, 2013, the Company changed its name from “HMH Holdings (Delaware), Inc.” to “Houghton Mifflin Harcourt Company.”
| 2. | Chapter 11 Reorganization Disclosures |
As discussed in Note 1, the Company filed voluntary petitions for relief under Chapter 11. On June 21, 2012, the Bankruptcy Court entered an order confirming and approving the Plan for the Debtors. Subsequently, the Plan became effective and the transactions contemplated under the Plan were consummated on June 22, 2012.
Subsequent to the Petition Date, the provisions in GAAP guidance for reorganizations applied to the Company’s financial statements while it operated under the provisions of Chapter 11. The accounting guidance did not change the application of GAAP in the preparation of financial statements. However, it does require that the financial statements, for periods including and subsequent to the filing of the Chapter 11 petition, distinguish transactions and events that are directly associated with the reorganization from the ongoing operations of the business. Accordingly, all transactions (including, but not limited to, all professional fees, realized gains and losses and provisions for losses) directly associated with the reorganization and restructuring of our businesses are reported separately in our financial statements. All such expense or income amounts are reported in reorganization items in the accompanying consolidated statements of operations for the year ended December 31, 2012.
Summary of Emergence
On June 22, 2012, the Company successfully emerged from bankruptcy as a reorganized company pursuant to the Plan. The financial restructuring realized by the confirmation of the Plan was accomplished through a debt-for-equity exchange. The Plan deleveraged the Company’s balance sheet by eliminating the Company’s secured indebtedness in exchange for new equity in the Company. Existing stockholders, in their capacity as stockholders, received warrants for the new equity in the Company in exchange for the existing equity.
Upon the Company’s emergence from Chapter 11 bankruptcy proceedings on June 22, 2012, the Company was not required to apply fresh-start accounting based on U.S. GAAP guidance for reorganizations due to the fact that the pre-petition holders who owned more than 50% of the Company’s outstanding common stock immediately before confirmation of the Plan received more than 50% of the Company’s outstanding common stock upon emergence. Accordingly, a new reporting entity was not created for accounting purposes.
Below is a summary of the significant transactions affecting the Company’s capital structure as a result of the effectiveness of the Plan.
Equity Transactions
On June 22, 2012, pursuant to the Plan, all of the issued and outstanding shares of common stock of the Company, including all options, warrants or any other agreements to acquire shares of common stock of the Company that existed prior to the Petition Date, were cancelled and in exchange, holders of such interests received distributions pursuant to the terms of the Plan. The distributions received by holders of interests in our common stock prior to the petition date on June 22, 2012 pursuant to the terms of the Plan included adequate protection payments and conversion fees of approximately $60.1 million and $26.1 million, respectively. These amounts represent only the portion attributable to the existing shareholders prior to the petition date. There were $69.7 million of adequate protection payments and $30.3 million of conversion fee
68
Table of Contents
Houghton Mifflin Harcourt Company
Notes to Consolidated Financial Statements
(in thousands of dollars, except share and per share information)
payments made in total. Following the emergence on June 22, 2012, the authorized capital stock of the Company consists of (i) 380,000,000 shares of common stock and (ii) 20,000,000 shares of preferred stock, $0.01 par value per share. There are no other outstanding obligations, warrants, options, or other rights to subscribe for or purchase from the Company any class of capital stock of the Company.
A Management Incentive Plan (“MIP”) became effective upon emergence. The MIP provides for grants of options and restricted stock at a strike price equal to or greater than the fair value per share of common stock as of the date of the grant and reserved for management and employees up to 10% of the new common stock of the Company. On June 22, 2012, in connection with our emergence from bankruptcy, the Company granted 9,251,462 stock options to executive officers with an exercise price of $12.50. Each of the stock options granted have an exercise price equal to or greater than the fair value on the date of grant and generally vest over a three or four year period. Also, on June 22, 2012, the Company granted 24,000 restricted stock units to independent directors which vest after one year.
Debt Transactions
On June 22, 2012, the Company’s creditors converted the First Lien Credit Agreement consisting of the then-existing first lien term loan (the “Term Loan”) with an aggregate outstanding principal balance of $2.6 billion and the then-existing first lien revolving loan facility (the “Revolving Loan”) with an aggregate outstanding principal balance of $235.8 million, and the outstanding $300.0 million principal amount of 10.5% Senior Secured Notes due 2019 (the “10.5% Senior Notes”) to 100 percent pro rata ownership of the Company’s common stock, subject to dilution pursuant to the MIP and the exercise of any existing common stockholder’s pro rata share of warrants to purchase 5% of the common stock of the Company pursuant to the Plan, and received $30.3 million in cash.
In connection with the Chapter 11 filing on May 22, 2012, the Company entered into a new $500.0 million senior secured credit facility (“DIP Facility”), which converted into an exit facility on the effective date of the emergence from Chapter 11. This exit facility consists of a $250.0 million revolving credit facility, which is secured by the Company’s accounts receivable and inventory, and a $250.0 million term loan credit facility. The proceeds from the initial borrowings under the term loan credit facility were used to fund the costs of the reorganization and provide post-closing working capital to the Company.
A summary of the transactions affecting the Company’s debt balances is as follows:
| Debt balance prior to emergence from bankruptcy (including accrued interest) |
$ | (3,142,234 | ) | |
| Exchange of debt for new common shares |
1,750,000 | |||
| Elimination of debt discount and deferred financing fees |
98,352 | |||
| Adequate protection payments |
69,701 | |||
| Conversion fees |
30,299 | |||
| Professional fees |
21,726 | |||
|
|
|
|||
| (Gain) loss on extinguishment |
$ | (1,172,156 | ) | |
|
|
|
Reorganization Items
Reorganization items represent expense or income amounts that were recorded in the consolidated financial statements as a result of the bankruptcy proceedings. Reorganization items were incurred starting with the date of the bankruptcy filing through the date of bankruptcy emergence. Approximately 86.2% of the (gain) loss on extinguishment was allocated to capital in excess of par value in the consolidated balance sheet based on the percentage of the Company’s creditors that converted their debt to equity who were also
69
Table of Contents
Houghton Mifflin Harcourt Company
Notes to Consolidated Financial Statements
(in thousands of dollars, except share and per share information)
equityholders as of the date of the bankruptcy filing. The remaining portion of the (gain) loss on extinguishment of debt was allocated to reorganization items, net in the consolidated statement of operations based on the percentage of the Company’s creditors that converted their debt to equity who did not have a pre-existing equity ownership in the Company as of the date of the bankruptcy filing. The gain from reorganization items for the year ended December 31, 2012 were as follows:
| Total | Adjusted to Capital in excess of par value |
Reorganization items, net |
||||||||||
| Debt to equity conversion |
$ | (1,392,234 | ) | $ | (1,199,549 | ) | $ | (192,685 | ) | |||
| Elimination of debt discount and deferred financing fees |
98,352 | 84,740 | 13,612 | |||||||||
| Adequate protection payments |
69,701 | 60,054 | 9,647 | |||||||||
| Conversion fees |
30,299 | 26,106 | 4,193 | |||||||||
| Professional fees |
21,726 | 18,381 | 3,345 | |||||||||
|
|
|
|
|
|
|
|||||||
| (Gain) loss on extinguishment |
(1,172,156 | ) | (1,010,268 | ) | (161,888 | ) | ||||||
| Stock compensation |
2,027 | — | 2,027 | |||||||||
| Issuance of warrants |
10,747 | — | 10,747 | |||||||||
|
|
|
|
|
|
|
|||||||
| Reorganization items, net |
$ | (1,159,382 | ) | $ | (1,010,268 | ) | $ | (149,114 | ) | |||
|
|
|
|
|
|
|
|||||||
Liabilities Subject to Compromise
Certain pre-petition liabilities and indebtedness were subject to compromise under the Plan and were reported at amounts allowed or expected to be allowed by the Court. A summary of liabilities subject to compromise reflected in the consolidated balance sheet as of May 21, 2012 is as follows:
| May 21, 2012 |
||||
| $2,668,690 Term Loan due June 12, 2014 |
$ | 2,570,815 | ||
| $235,751 Revolving Loan due December 12, 2013 |
235,751 | |||
| $300,000 10.5% senior secured notes due June 1, 2019 |
300,000 | |||
| Accrued interest |
35,668 | |||
|
|
|
|||
| Total |
$ | 3,142,234 | ||
|
|
|
|||
As of December 31, 2014, 2013 and 2012, there were no liabilities subject to compromise.
All pre-petition claims were considered liabilities subject to compromise at May 21, 2012. As discussed above, the Term Loan, the Revolving Loan, the 10.5% Senior Notes, and the associated accrued interest were exchanged for new common stock in the Company. There were no other liabilities subject to compromise as of May 21, 2012. We honored other prepetition obligations, including employee wages and trade payables in the ordinary course of business.
| 3. | Significant Accounting Policies |
Principles of Consolidation
Our accompanying consolidated financial statements include the results of operations of the Company and our wholly-owned subsidiaries. All material intercompany accounts and transactions are eliminated in consolidation.
70
Table of Contents
Houghton Mifflin Harcourt Company
Notes to Consolidated Financial Statements
(in thousands of dollars, except share and per share information)
Use of Estimates
The preparation of financial statements in conformity with accounting principles generally accepted in the United States of America requires the use of estimates, assumptions and judgments by management that affect the reported amounts of assets, liabilities, revenues, expenses, and related disclosure of contingent assets and liabilities in the amounts reported in the financial statements and accompanying notes. On an ongoing basis, we evaluate our estimates and assumptions including, but not limited to, book returns, allowance for bad debts, recoverability of advances to authors, valuation of inventory, depreciation and amortization periods, recoverability of long-term assets such as property, plant, and equipment, capitalized pre-publication costs, other identified intangibles, goodwill, deferred revenue, income taxes, pensions and other postretirement benefits, contingencies, and litigation. We base our estimates on historical experience and on various other assumptions that we believe to be reasonable under the circumstances, the results of which form the basis for making judgments about the carrying value of assets and liabilities that are not readily apparent from other sources. Actual results may differ from those estimates.
Revenue Recognition
We derive revenue primarily from the sale of print and digital content and instructional materials, trade books, reference materials, assessment materials and multimedia instructional programs; license fees for book rights, content and software; and services that include test development, test delivery, test scoring, professional development, consulting and training as well as access to hosted interactive content. Revenue is recognized only once persuasive evidence of an arrangement with the customer exists, the sales price is fixed or determinable, delivery of products or services has occurred, title and risk of loss with respect to products have transferred to the customer, all significant obligations, if any, have been performed, and collection is probable.
We enter into certain contractual arrangements that have multiple elements, one or more of which may be delivered subsequent to the delivery of other elements. These multiple-deliverable arrangements may include print and digital media, professional development services, training, software licenses, access to hosted content, and various services related to the software including but not limited to hosting, maintenance and support, and implementation. For these multiple-element arrangements, we allocate revenue to each deliverable of the arrangement based on the relative selling prices of the deliverables. In such circumstances, we first determine the selling price of each deliverable based on (i) vendor-specific objective evidence of fair value (“VSOE”) if that exists, (ii) third-party evidence of selling price (“TPE”) when VSOE does not exist, or (iii) our best estimate of the selling price when neither VSOE nor TPE exists. Revenue is then allocated to the non-software deliverables as a group and to the software deliverables as a group using the relative selling prices of each of the deliverables in the arrangement, based on the selling price hierarchy. Non-software deliverables include print and digital textbooks and instructional materials, trade books, reference materials, assessment materials and multimedia instructional programs; licenses to book rights and content; access to hosted content; and services including test development, test delivery, test scoring, professional development, consulting and training when those services do not relate to software deliverables. Software deliverables include software licenses, software maintenance and support services, professional services and training when those services relate to software deliverables.
For the non-software deliverables, we determine the revenue for each deliverable based on its relative selling price in the arrangement and we recognize revenue upon delivery of the product or service, assuming all other revenue recognition criteria have been met. Revenue for test delivery, test scoring and training is recognized when the service has been completed. Revenue for test development, professional development, consulting and training is recognized as the service is provided. Revenue for access to hosted interactive content is recognized ratably over the term of the arrangement.
71
Table of Contents
Houghton Mifflin Harcourt Company
Notes to Consolidated Financial Statements
(in thousands of dollars, except share and per share information)
For the software deliverables as a group, we recognize revenue in accordance with the authoritative guidance for software revenue recognition. As our software licenses are typically sold with maintenance and support, professional services or training, we use the residual method to determine the amount of software license revenue to be recognized. Under the residual method, arrangement consideration of the software deliverables as a group is allocated to the undelivered elements based upon VSOE of those elements, with the residual amount of the arrangement fee allocated to and recognized as license revenue upon delivery, assuming all other revenue recognition criteria have been met. If VSOE of one or more of the undelivered services or other elements does not exist, all revenues of the software-deliverables arrangement are deferred until delivery of all of those services or other elements has occurred, or until VSOE of each of those services or other elements can be established.
As products are shipped with right of return, a provision for estimated returns on these sales is made at the time of sale based on historical experience.
Shipping and handling fees charged to customers are included in net sales.
Advertising Costs and Sample Expenses
Advertising costs are charged to selling and administrative expenses as incurred. Advertising costs were $8.6 million, $8.0 million and $6.7 million for the years ended December 31, 2014, 2013 and 2012, respectively. Sample expenses are charged to selling and administrative expenses when the samples are shipped.
Cash and Cash Equivalents
Cash and cash equivalents consist primarily of cash in banks and highly liquid investment securities that have maturities of three months or less when purchased. The carrying amount of cash equivalents approximates fair value because of the short term maturity of these investments.
Short-term Investments
Short-term investments typically consist of marketable securities with maturities between three and twelve months at the balance sheet date. We have classified all of our short-term investments as available-for-sale at December 31, 2014 and 2013. The investments are reported at fair value, with any unrealized gains or losses excluded from earnings and reported as a separate component of stockholders’ equity as other comprehensive income (loss).
Accounts Receivable
Accounts receivable are recorded net of allowances for doubtful accounts and reserves for book returns. In the normal course of business, we extend credit to customers that satisfy predefined criteria. We estimate the collectability of our receivables. Allowances for doubtful accounts are established through the evaluation of accounts receivable aging and prior collection experience to estimate the ultimate collectability of these receivables. Reserves for book returns are based on historical return rates and sales patterns.
Inventories
Inventories are stated at the lower of weighted average cost or net realizable value. The level of obsolete and excess inventory is estimated on a program or title level-basis by comparing the number of units in stock
72
Table of Contents
Houghton Mifflin Harcourt Company
Notes to Consolidated Financial Statements
(in thousands of dollars, except share and per share information)
with the expected future demand. The expected future demand of a program or title is determined by the copyright year, the previous years’ sales history, the subsequent year’s sales forecast, and known forward-looking trends including our development cycle to replace the title or program and competing titles or programs.
Property, Plant, and Equipment
Property, plant, and equipment are stated at cost, or in the case of assets acquired in business combinations, at fair value as of the acquisition date, less accumulated depreciation. Equipment under capital lease is stated at fair value at inception of the lease, less accumulated depreciation. Maintenance and repair costs are charged to expense as incurred, and renewals and improvements that extend the useful life of the assets are capitalized. Depreciation on property, plant, and equipment is calculated using the straight-line method over the estimated useful lives of the assets or, in the case of assets acquired in business combinations, over their remaining lives. Equipment held under capital leases and leasehold improvements are amortized using the straight-line method over the shorter of the lease term or estimated useful life of the asset. Estimated useful lives of property, plant, and equipment are as follows:
| Estimated Useful Life |
||||
| Building and building equipment |
10 to 35 years | |||
| Machinery and equipment |
2 to 15 years | |||
| Capitalized software |
3 to 5 years | |||
| Leasehold improvements |
Lesser of useful life or lease term | |||
Capitalized Internal-Use and External-Use Software
Capitalized internal-use and external-use software is included in property, plant and equipment on the consolidated balance sheets.
We capitalize certain costs related to obtaining or developing computer software for internal use including external customer-facing websites. Costs incurred during the application development stage, including external direct costs of materials and services, and payroll and payroll related costs for employees who are directly associated with the internal-use software project, are capitalized and amortized on a straight-line basis over the expected useful life of the related software. The application development stage includes design of chosen path, software configuration and integration, coding, hardware installation and testing. Costs incurred during the preliminary stage, as well as maintenance, training and upgrades that do not result in additional functionality are expensed as incurred.
Certain computer software development costs for software that is to be sold or marketed are capitalized in the consolidated balance sheets. Capitalization of computer software development costs begins upon the establishment of technological feasibility. We define the establishment of technological feasibility as a working model. Amortization of capitalized computer software development costs is provided on a product-by-product basis using the straight-line method, beginning upon commercial release of the product, and continuing over the remaining estimated economic life of the product. The carrying amounts of computer software development costs are periodically compared to net realizable value and impairment charges are recorded, as appropriate, when amounts expected to be realized are lower.
We review internal and external software development costs for impairment. There was no such impairment for the year ended December 31, 2014. For the years ended December 31, 2013 and 2012, software
73
Table of Contents
Houghton Mifflin Harcourt Company
Notes to Consolidated Financial Statements
(in thousands of dollars, except share and per share information)
development costs of $7.4 million and $2.6 million, respectively, were impaired. All impairments were included as a charge to the statement of operations in the impairment charge for investment in preferred stock, intangible assets, pre-publication costs and fixed assets caption.
Pre-publication costs
We capitalize the art, prepress, manuscript and other costs incurred in the creation of the master copy of a book or other media (the “pre-publication costs”). Pre-publication costs are primarily amortized from the year of sale over five years using the sum-of-the-years-digits method, which is an accelerated method for calculating an asset’s amortization. Under this method, the amortization expense recorded for a pre-publication cost asset is approximately 33% (year 1), 27% (year 2), 20% (year 3), 13% (year 4) and 7% (year 5). This policy is used throughout the Company, except for the Trade Publishing young readers and general interest books, which generally expenses such costs as incurred, and the assessment products, which uses the straight-line amortization method. The amortization methods and periods chosen best reflect the pattern of expected sales generated from individual titles or programs. We periodically evaluate the remaining lives and recoverability of capitalized pre-publication costs, which are often dependent upon program acceptance by state adoption authorities.
Amortization expense related to pre-publication costs for the years ended December 31, 2014, 2013 and 2012 were $129.7 million, $121.7 million and $137.7 million, respectively.
There was no impairment for the year ended December 31, 2014. For the years ended December 31, 2013 and 2012, pre-publication costs of $1.1 million, and $0.4 million respectively, were impaired. The impairment was included as a charge to the statement of operations in the impairment charge for investment in preferred stock, intangible assets, pre-publication costs and fixed assets caption.
Goodwill and indefinite-lived intangible assets
Goodwill is the excess of the purchase price paid over the fair value of the net assets of the business acquired. Other intangible assets principally consist of branded trademarks and trade names, acquired publishing rights and customer relationships. Goodwill and indefinite-lived intangible assets (certain trade names) are not amortized but are reviewed at least annually for impairment or earlier, if an indication of impairment exists. Recoverability of goodwill and indefinite lived intangibles is evaluated using a two-step process. In the first step, the fair value of a reporting unit is compared to its carrying value. If the fair value of a reporting unit exceeds the carrying value of the net assets assigned to a reporting unit, goodwill is considered not impaired and no further testing is required. If the carrying value of the net assets assigned to a reporting unit exceeds the fair value of a reporting unit, the second step of the impairment test is performed in order to determine the implied fair value of a reporting unit’s goodwill. Determining the implied fair value of goodwill requires valuation of a reporting unit’s tangible and intangible assets and liabilities in a manner similar to the allocation of purchase price in a business combination. If the carrying value of a reporting unit’s goodwill exceeds its implied fair value, goodwill is deemed impaired and is written down to the extent of the difference. We estimate total fair value of each reporting unit using market approaches and also a discounted cash flow analysis, and make assumptions regarding future revenue, gross margins, working capital levels, investments in new products, capital spending, tax, cash flows and the terminal value of the reporting unit. With regard to other intangibles with indefinite lives, we determine the fair value by asset, which is then compared to its carrying value to determine if the assets are impaired.
Goodwill is allocated entirely to our Education reporting unit. Determining the fair value of a reporting unit is judgmental in nature, and involves the use of significant estimates and assumptions. These estimates and assumptions may include revenue growth rates and operating margins used to calculate projected future cash
74
Table of Contents
Houghton Mifflin Harcourt Company
Notes to Consolidated Financial Statements
(in thousands of dollars, except share and per share information)
flows, risk-adjusted discount rates, future economic and market conditions, the determination of appropriate market comparables as well as the fair value of individual assets and liabilities. Consistent with prior years, we used a combination of a market approach and income approach to establish the fair value of the reporting unit as of October 1, 2014.
We completed our annual goodwill and indefinite-lived intangible asset impairment tests as of October 1, 2014, 2013, and 2012 and recorded a noncash impairment charge of $0.4 million, $0.5 million and $5.0 million for the years ended December 31, 2014, 2013 and 2012, respectively. The impairments principally related to two specific tradenames within the Trade Publishing segment in both 2014 and 2013 and one specific tradename within the Education segment in 2012. The impairment charges resulted primarily from a decline in revenue from previously projected amounts.
Publishing Rights
A publishing right is an acquired right that allows us to publish and republish existing and future works as well as create new works based on previously published materials. We determine the fair market value of the publishing rights arising from business combinations by discounting the after-tax cash flows projected to be derived from the publishing rights and titles to their net present value using a rate of return that accounts for the time value of money and the appropriate degree of risk. The useful life of the publishing rights is based on the lives of the various copyrights involved. We calculate amortization using the percentage of the projected operating income before taxes derived from the titles in the current year as a percentage of the total estimated operating income before taxes over the remaining useful life. Acquired publication rights, as well as customer-related intangibles with definitive lives, are primarily amortized on an accelerated basis over periods ranging from three to 20 years.
Impairment of other long-lived assets
We review our other long-lived assets for impairment whenever events or changes in circumstances indicate that the carrying amount of an asset may not be fully recoverable. If the future undiscounted cash flows are less than their book value, impairment exists. The impairment is measured as the difference between the book value and the fair value of the underlying asset. Fair value is normally determined using a discounted cash flow model.
Severance
We accrue postemployment benefits if the obligation is attributable to services already rendered, rights to those benefits accumulate, payment of benefits is probable, and amount of benefit is reasonably estimated. Postemployment benefits include severance benefits.
Subsequent to recording such accrued severance liabilities, changes in market or other conditions may result in changes to assumptions upon which the original liabilities were recorded that could result in an adjustment to the liabilities.
Royalty advances
Royalty advances to authors are capitalized and represent amounts paid in advance of the sale of an author’s product and are recovered as earned. As advances are recorded, a partial reserve may be recorded immediately based primarily upon historical sales experience. Advances are evaluated periodically to determine if they are expected to be recovered. Any portion of a royalty advance that is not expected to be
75
Table of Contents
Houghton Mifflin Harcourt Company
Notes to Consolidated Financial Statements
(in thousands of dollars, except share and per share information)
recovered is fully reserved. Cash payments for royalty advances are included within cash flows from operating activities, under the caption “Royalties, net,” in our consolidated statements of cash flows.
Income taxes
We record income taxes using the asset and liability method. Deferred income tax assets and liabilities are recognized for future tax consequences attributable to differences between the financial statement carrying amounts of existing assets and liabilities and their respective income tax basis, and operating loss and tax credit carryforwards. Our consolidated financial statements contain certain deferred tax assets which have arisen primarily as a result of interest expense limitations, as well as other temporary differences between financial and tax accounting. We establish a valuation allowance if the likelihood of realization of the deferred tax assets is reduced based on an evaluation of objective verifiable evidence. Significant management judgment is required in determining our provision for income taxes, our deferred tax assets and liabilities and any valuation allowance recorded against those deferred tax assets. We evaluate the weight of all available evidence to determine whether it is more likely than not that some portion or all of the deferred income tax assets will not be realized.
We also evaluate any uncertain tax positions and only recognize the tax benefit from an uncertain tax position if it is more likely than not that the tax position will be sustained on examination by the taxing authorities, based on the technical merits of the position. The tax benefits recognized in the financial statements from such positions are then measured based on the largest benefit that has a greater than 50 percent likelihood of being realized upon settlement. We record a liability for unrecognized tax benefits resulting from uncertain tax positions taken or expected to be taken in a tax return. Any change in judgment related to the expected ultimate resolution of uncertain tax positions is recognized in earnings in the period in which such change occurs. Interest and penalties, if any, related to unrecognized tax benefits are recorded in income tax expense.
Stock-Based Compensation
Certain employees and or directors have been granted stock options and restricted stock awards in the Company’s common stock. Stock based compensation expense reflects the fair value of stock-based awards measured at the grant date and recognized over the relevant service period. We estimate the fair value of each stock-based award on the measurement date using either the current market price or the Black-Scholes option valuation model. The Black-Scholes option valuation model incorporates assumptions as to stock volatility, the expected life of the options, risk-free interest rate and dividend yield for time-vested stock options and restricted stock. We recognize compensation cost on a straight-line basis over the awards’ vesting periods.
Comprehensive Loss
Comprehensive loss is defined as changes in the equity of an enterprise except those resulting from stockholder transactions. The amounts shown on the consolidated statements of stockholders’ equity and comprehensive loss relate to the cumulative effect of changes in pension and postretirement liabilities, foreign currency translation gain and loss adjustments, and unrealized gains and losses on short-term investments.
Foreign Currency Translation
The functional currency for each of our subsidiaries is the currency of the primary economic environment in which the subsidiary operates, generally defined as the currency in which the entity generates and expends
76
Table of Contents
Houghton Mifflin Harcourt Company
Notes to Consolidated Financial Statements
(in thousands of dollars, except share and per share information)
cash. Foreign currency denominated assets and liabilities are translated into United States dollars at current rates as of the balance sheet date and the revenue, costs and expenses are translated at the average rates established during each reporting period. Cumulative translation gains or losses are recorded in equity as an element of accumulated other comprehensive income.
Financial instruments
Derivative financial instruments are employed to manage risks associated with interest rate exposures and are not used for trading or speculative purposes. We recognize all derivative instruments, such as foreign exchange forward and option contracts, in our consolidated balance sheets at fair value. Changes in the fair value of derivatives are recognized periodically either in earnings or in stockholders’ equity as a component of accumulated other comprehensive loss, depending on whether the derivative financial instrument qualifies for hedge accounting and, if so, whether it qualifies as a fair value hedge or a cash flow hedge. Gains and losses on derivatives designated as hedges, to the extent they are effective, are recorded in other comprehensive income, and subsequently reclassified to earnings to offset the impact of the hedged items when they occur. Changes in the fair value of derivatives not qualifying as hedges are reported in earnings. Our foreign exchange forward and option contracts did not qualify for hedge accounting because we did not contemporaneously document our hedging strategy upon entering into the hedging arrangements. There were no derivative instruments that qualified for hedge accounting during 2014, 2013 and 2012.
Treasury Stock
We account for treasury stock under the cost method. When shares are reissued or retired from treasury stock they are accounted for at an average price. Upon retirement the excess over par value is charged against capital in excess of par value.
Net Loss per Share
Basic net loss per share attributable to common stockholders is computed by dividing net loss attributable to common stockholders by the weighted-average common shares outstanding during the period. Except where the result would be anti-dilutive, net loss per share is computed using the treasury stock method for the exercise of stock options. For periods in which the Company has reported net losses, diluted net loss per share attributable to common stockholders is the same as basic net loss per share attributable to common stockholders, since dilutive common shares are not assumed to have been issued if their effect is anti-dilutive. Diluted net loss per share attributable to common stockholders is the same as basic net loss per share attributable to common stockholders for the years ended December 31, 2014, 2013 and 2012.
Recent Accounting Pronouncements
Recent accounting pronouncements, not included below, are not expected to have a material impact on our consolidated financial position and results of operations.
In August 2014, the Financial Accounting Standards Board (“FASB”) issued new guidance related to the disclosures around going concern. The new standard provides guidance around management’s responsibility to evaluate whether there is substantial doubt about an entity’s ability to continue as a going concern and to provide related footnote disclosures. The new standard is effective for fiscal years, and interim periods within those fiscal years, beginning after December 15, 2016. Early adoption is permitted. The adoption of this standard is not expected to have an impact on our consolidated financial statements or disclosures.
77
Table of Contents
Houghton Mifflin Harcourt Company
Notes to Consolidated Financial Statements
(in thousands of dollars, except share and per share information)
In June 2014, the FASB issued new guidance related to stock compensation. The new standard requires that a performance target that affects vesting, and that could be achieved after the requisite service period, be treated as a performance condition. As such, the performance target should not be reflected in estimating the grant date fair value of the award. This update further clarifies that compensation cost should be recognized in the period in which it becomes probable that the performance target will be achieved and should represent the compensation cost attributable to the periods for which the requisite service has already been rendered. The new standard is effective for fiscal years, and interim periods within those fiscal years, beginning after December 15, 2015 and can be applied either prospectively or retrospectively to all awards outstanding as of the beginning of the earliest annual period presented as an adjustment to opening retained earnings. Early adoption is permitted. We do not believe the adoption of this new accounting standard will impact our consolidated financial statements.
In May 2014, the FASB issued new accounting guidance related to revenue recognition. This new standard will replace all current U.S. GAAP guidance on this topic and eliminate all industry-specific guidance. The new revenue recognition standard provides a unified model to determine when and how revenue is recognized. The core principle is that a company should recognize revenue to depict the transfer of promised goods or services to customers in an amount that reflects the consideration for which the entity expects to be entitled in exchange for those goods or services. This guidance will be effective beginning January 1, 2017 and can be applied either retrospectively to each period presented or as a cumulative-effect adjustment as of the date of adoption. We are in the process of evaluating the impact of adopting this new accounting standard on our consolidated financial statements.
In April 2014, the FASB issued new guidance related to reporting discontinued operations. This new standard raises the threshold for a disposal to qualify as a discontinued operation and requires new disclosures of both discontinued operations and certain other disposals that do not meet the definition of a discontinued operation. The new standard is effective for fiscal years beginning on or after December 15, 2014. Early adoption is permitted but only for disposals that have not been reported in financial statements previously issued. We do not believe the adoption of this new accounting standard will impact our consolidated financial statements.
| 4. | Acquisitions |
On May 12, 2014, we completed the acquisition of certain assets and liabilities of Channel One News, which is a digital content provider dedicated to encouraging kids to be informed, digitally-savvy global citizens. The acquisition allows for continued development of high-quality digital content for students, teachers and parents across multiple modalities, and brings video and cross-media production capabilities to HMH.
On May 19, 2014, we completed the acquisition of 100% of the stock of Curiosityville, which is an online personalized learning environment that helps children ages 3-8 learn through playful exploration and discovery both at home and in pre-school settings. The acquisition also includes its proprietary data collection and analytics engine, the Learning Tree, which provides real-time information on individual learners and personalized recommendations for learning, both online and offline.
On June 30, 2014, we completed the acquisition of 100% of the stock of School Chapters, which is an educational solutions provider dedicated to standards-based education quality management, accreditation services and community-based resources for educators and learners across the pre-K-12 and college spectrum.
The total aggregate purchase price for the three acquisitions described above was approximately $9.5 million, which consisted of cash at closing of approximately $9.1 million, and amounts in accrued liabilities
78
Table of Contents
Houghton Mifflin Harcourt Company
Notes to Consolidated Financial Statements
(in thousands of dollars, except share and per share information)
of approximately $0.4 million. Goodwill, other intangible assets, accounts receivable, property, plant, and equipment, other assets and other liabilities recorded as part of the acquisitions totaled approximately $1.1 million, $0.2 million, $3.1 million, $6.8 million, $0.4 million and $1.7 million, respectively.
In 2013, we made a $1.5 million investment in preferred stock. Based on impairment indicators, we were required to remeasure the fair value of our 2013 investment with any resulting gain or loss recognized in the statement of operations. Based on the implied fair value of the investment, we recorded an impairment charge of approximately $1.3 million during the year ended December 31, 2014 relating to the fair value remeasurement.
On October 28, 2013, we completed the acquisition of Choice Solutions, Inc., which is an educational technology company focused on educational data science, analytics, integrated solutions, and professional services for a total purchase price of approximately $15.9 million, which consisted of cash at closing, subject to a closing working capital adjustment. The transaction was accounted for under the acquisition method of accounting. Goodwill, other intangible assets, cash, other assets, other liabilities and deferred tax liabilities recorded as part of the acquisition totaled approximately $7.6 million, $10.4 million, $2.5 million, $0.8 million, $1.4 million and $4.0 million, respectively.
On April 10, 2013, we completed the acquisition of Tribal Nova, Inc., which is an educational technology company focused on the development of digital games, products and services for pre-school children for a total purchase price of approximately $7.3 million. The purchase price consisted of approximately $5.8 million of cash at closing and promissory notes due over two years totaling approximately $1.5 million, subject to a closing working capital adjustment which increased the amount due by approximately $0.1 million. The acquisition provides us with an increased capacity to create entertaining and innovative online educational games. The transaction was accounted for under the acquisition method of accounting. Goodwill, other intangible assets, cash, other assets and other liabilities recorded as part of the acquisition totaled approximately $4.1 million, $1.6 million, $0.5 million, $1.7 million and $2.2 million, respectively.
During 2012, we acquired certain asset product lines from a third party for a total purchase price of approximately $11.0 million, which was paid in cash at closing. The acquisition provides us with the copyrights, trademarks and intellectual property of the acquired product lines for our Trade Publishing segment. In connection with the acquisition, we entered into a transition services agreement whereby the third party provided certain transitional services to us for the acquired product lines. Since the fair value assigned to the net assets acquired exceeded the consideration paid, we recorded a $30.8 million gain on bargain purchase on the transaction in 2012. Intangible assets, author advances, and other assets recorded as part of the acquisition totaled approximately $30.4 million, $6.2 million, and $5.1 million, respectively.
All transactions above were accounted for under the acquisition method of accounting. We allocated the purchase price to each of the assets and liabilities acquired at estimated fair values as of the acquisition date. The excess of the purchase price over the net amounts assigned to the fair value of the assets acquired and liabilities assumed was recorded as goodwill. The financial results of each company acquired were included within our financial statements from their respective dates of acquisition. The acquisitions were not considered to be material for purposes of additional disclosure.
79
Table of Contents
Houghton Mifflin Harcourt Company
Notes to Consolidated Financial Statements
(in thousands of dollars, except share and per share information)
| 5. | Balance Sheet Information |
Short-term Investments
The estimated fair value of our short-term investments classified as available for sale, is as follows:
| December 31, 2014 | ||||||||||||||||
| Amortized Cost |
Unrealized Gains |
Unrealized Losses |
Estimated Fair Value |
|||||||||||||
| Short-term investments: |
||||||||||||||||
| U.S. Government and agency securities |
$ | 286,675 | $ | 10 | $ | (99 | ) | $ | 286,764 | |||||||
|
|
|
|
|
|
|
|
|
|||||||||
| $ | 286,675 | $ | 10 | $ | (99 | ) | $ | 286,764 | ||||||||
|
|
|
|
|
|
|
|
|
|||||||||
| December 31, 2013 | ||||||||||||||||
| Amortized Cost |
Unrealized Gains |
Unrealized Losses |
Estimated Fair Value |
|||||||||||||
| Short-term investments: |
||||||||||||||||
| U.S. Government and agency securities |
$ | 111,721 | $ | 4 | $ | (4 | ) | $ | 111,721 | |||||||
|
|
|
|
|
|
|
|
|
|||||||||
| $ | 111,721 | $ | 4 | $ | (4 | ) | $ | 111,721 | ||||||||
|
|
|
|
|
|
|
|
|
|||||||||
The contractual maturities of our short-term investments are one year or less.
Account Receivable
Accounts receivable at December 31, 2014 and 2013 consisted of the following:
| 2014 | 2013 | |||||||
| Accounts receivable |
$ | 283,453 | $ | 358,734 | ||||
| Allowance for bad debt |
(5,625 | ) | (5,084 | ) | ||||
| Reserve for book returns |
(22,159 | ) | (35,549 | ) | ||||
|
|
|
|
|
|||||
| $ | 255,669 | $ | 318,101 | |||||
|
|
|
|
|
|||||
Inventories
Inventories at December 31, 2014 and 2013 consisted of the following:
| 2014 | 2013 | |||||||
| Finished goods |
$ | 178,812 | $ | 177,017 | ||||
| Raw materials |
5,149 | 5,177 | ||||||
|
|
|
|
|
|||||
| Inventory |
$ | 183,961 | $ | 182,194 | ||||
|
|
|
|
|
|||||
80
Table of Contents
Houghton Mifflin Harcourt Company
Notes to Consolidated Financial Statements
(in thousands of dollars, except share and per share information)
Property, Plant, and Equipment
Balances of major classes of assets and accumulated depreciation and amortization at December 31, 2014 and 2013 were as follows:
| 2014 | 2013 | |||||||
| Land and land improvements |
$ | 4,717 | $ | 4,717 | ||||
| Building and building equipment |
9,723 | 9,505 | ||||||
| Machinery and equipment |
18,766 | 15,223 | ||||||
| Capitalized software |
350,179 | 294,361 | ||||||
| Leasehold improvements |
28,719 | 27,961 | ||||||
|
|
|
|
|
|||||
| 412,104 | 351,767 | |||||||
| Less: Accumulated depreciation and amortization |
(273,742 | ) | (210,919 | ) | ||||
|
|
|
|
|
|||||
| Property, plant, and equipment, net |
$ | 138,362 | $ | 140,848 | ||||
|
|
|
|
|
|||||
For the year ended December 31, 2014, 2013 and 2012, depreciation and amortization expense related to property, plant, and equipment were $72.3 million, $61.7 million and $58.1 million, respectively.
Property, plant, and equipment at December 31, 2014 and 2013 included approximately $6.9 million and $6.0 million, respectively, acquired under capital lease agreements, of which the majority is included in machinery and equipment. The future minimum lease payments required under non-cancelable capital leases as of December 31, 2014 is as follows: $2.4 million in 2015 and $1.4 million in 2016.
Substantially all property, plant, and equipment are pledged as collateral under our Term Loan and Revolving Credit Facility.
Accumulated Other Comprehensive Loss
Accumulated other comprehensive loss consisted of the following at December 31, 2014, 2013 and 2012:
| 2014 | 2013 | 2012 | ||||||||||
| Net change in pension and benefit plan liability |
$ | (24,198 | ) | $ | (10,818 | ) | $ | (18,664 | ) | |||
| Foreign currency translation adjustments |
(2,502 | ) | (2,473 | ) | (2,877 | ) | ||||||
| Unrealized gain on short-term investments |
(89 | ) | — | 13 | ||||||||
|
|
|
|
|
|
|
|||||||
| $ | (26,789 | ) | $ | (13,291 | ) | $ | (21,528 | ) | ||||
|
|
|
|
|
|
|
|||||||
Amounts reclassified from accumulated other comprehensive loss for the years ended December 31, 2014, 2013 and 2012 relating to the amortization of defined benefit pension and postretirement benefit plans totaled approximately $(1.4) million, $0.6 million and $0.9 million, respectively, and affected the selling and administrative line item in the consolidated statement of operations. These accumulated other comprehensive loss components are included in the computation of net periodic benefit cost.
81
Table of Contents
Houghton Mifflin Harcourt Company
Notes to Consolidated Financial Statements
(in thousands of dollars, except share and per share information)
| 6. | Goodwill and Other Intangible Assets |
Goodwill and other intangible assets consisted of the following:
| December 31, 2014 | December 31, 2013 | |||||||||||||||
| Cost | Accumulated Amortization |
Cost | Accumulated Amortization |
|||||||||||||
| Goodwill |
$ | 532,921 | $ | — | $ | 531,786 | $ | — | ||||||||
| Trademarks and tradenames |
439,719 | — | 440,005 | — | ||||||||||||
| Publishing rights |
1,180,000 | (889,560 | ) | 1,180,000 | (783,937 | ) | ||||||||||
| Customer related and other |
283,225 | (211,415 | ) | 283,172 | (199,246 | ) | ||||||||||
|
|
|
|
|
|
|
|
|
|||||||||
| $ | 2,435,865 | $ | (1,100,975 | ) | $ | 2,434,963 | $ | (983,183 | ) | |||||||
|
|
|
|
|
|
|
|
|
|||||||||
The changes in the carrying amount of goodwill for the years ended December 31, 2014 and 2013 are as follows:
| Balance at December 31, 2012 |
$ | 520,088 | ||
|
|
|
|||
| Goodwill |
1,962,588 | |||
| Accumulated impairment losses |
(1,442,500 | ) | ||
| Acquisitions |
11,698 | |||
|
|
|
|||
| Balance at December 31, 2013 |
$ | 531,786 | ||
|
|
|
|||
| Goodwill |
1,974,286 | |||
| Accumulated impairment losses |
(1,442,500 | ) | ||
| Acquisitions |
1,135 | |||
|
|
|
|||
| Balance at December 31, 2014 |
$ | 532,921 | ||
|
|
|
We had goodwill of $532.9 million and $531.8 million at December 31, 2014 and 2013, respectively. The additions to goodwill relate to our acquisitions described in Note 4 of approximately $1.1 million and $11.7 million for the year ended December 31, 2014 and 2013, respectively. There was no goodwill impairment charge for the years ended December 31, 2014 and 2013.
In accordance with the provisions of the accounting standard for goodwill and other intangible assets, goodwill and certain indefinite-lived tradenames are not amortized. We recorded an impairment charge of approximately $0.4 million, $0.5 million, and $5.0 million for certain of our indefinite-lived intangible assets at October 1, 2014, 2013, and 2012, respectively. Amortization expense for publishing rights and customer related and other intangibles were $117.8 million, $158.6 million and $232.6 million for the year ended December 31, 2014, 2013 and 2012, respectively.
Estimated aggregate amortization expense expected for each of the next five years related to intangibles subject to amortization is as follows:
| Publishing Rights |
Other Intangible Assets |
|||||||
| 2015 |
81,007 | 12,346 | ||||||
| 2016 |
61,350 | 11,201 | ||||||
| 2017 |
46,238 | 10,080 | ||||||
| 2018 |
34,713 | 9,053 | ||||||
| 2019 |
26,557 | 6,488 | ||||||
| Thereafter |
40,575 | 22,642 | ||||||
82
Table of Contents
Houghton Mifflin Harcourt Company
Notes to Consolidated Financial Statements
(in thousands of dollars, except share and per share information)
| 7. | Debt |
Long-term debt at December 31, 2014 and 2013 consisted of the following:
| 2014 | 2013 | |||||||
| $250,000 Term Loan due May 21, 2018 interest payable monthly |
$ | 243,125 | $ | 245,625 | ||||
| Less: Current portion of long-term debt |
67,500 | 2,500 | ||||||
|
|
|
|
|
|||||
| Total long-term debt |
$ | 175,625 | $ | 243,125 | ||||
|
|
|
|
|
|||||
Included in the Current portion of long-term debt is $65.0 million payable under the Excess Cash Flow provisions of the Term Loan Facility, which are predicated upon our leverage ratio and cash flow.
Long-term debt repayments due in each of the next five years and thereafter is as follows:
| Year |
| |||
| 2015 |
67,500 | |||
| 2016 |
2,500 | |||
| 2017 |
2,500 | |||
| 2018 |
170,625 | |||
| 2019 |
— | |||
| Thereafter |
— | |||
|
|
|
|||
| $ | 243,125 | |||
|
|
|
|||
On January 15, 2014, we entered into Amendment No. 4 to our Term Loan Facility, which reduced the interest rate applicable to outstanding borrowings by 1.0%. The transaction was accounted for under the accounting guidance for debt modifications and extinguishments. We recorded an expense of approximately $1.0 million relating to third party transaction fees which was included in the selling and administrative line item in its consolidated statements of operations for the year ended December 31, 2014.
On May 24, 2013, we entered into Amendment No. 3 to the Term Loan Facility. Amendment No. 3 primarily reduced the term loan spread by 1.75% and reduced the LIBOR floor by 0.25% resulting in an overall decrease in the Term Loan Facility interest rate of 2.00%. The Term Loan Facility has a term of six years and the interest rate for borrowings under the Term Loan Facility is based on the borrowers’ election, LIBOR plus 4.25% per annum or the alternate base rate plus 3.25%. The LIBOR rate under the Term Loan Facility is subject to a minimum “floor” of 1.00%. As of December 31, 2013, the interest rate of the Term Loan Facility is 5.25%. During the year ended December 31, 2013, due to the change in syndication, we recorded a loss on debt extinguishment of approximately $0.6 million relating to the write off of capitalized deferred financing fees in accordance with the accounting guidance for debt modifications and extinguishments.
On May 22, 2012, we entered into a new $500.0 million DIP facility which was converted into an exit facility upon emergence from Chapter 11. This exit facility consists of a $250.0 million revolving credit facility (“Revolving Credit Facility”), which is secured by the Company’s accounts receivable and inventory, and a $250.0 million term loan credit facility (“Term Loan”). The Revolving Credit Facility has a term of five years and the interest rate is determined by a combination of LIBOR rate and average daily availability. No funds have been drawn on the Revolving Credit Facility as of December 31, 2012. The Term Loan has a term of six years and the interest rate is based on the LIBOR plus 6.0%. The actual LIBOR is subject to a minimum “floor” of 1.25%. The proceeds of the Term Loan were used to fund the costs of the reorganization and provide post-closing working capital to the Company.
83
Table of Contents
Houghton Mifflin Harcourt Company
Notes to Consolidated Financial Statements
(in thousands of dollars, except share and per share information)
On June 11, 2012 and June 20, 2012, respectively, we entered into Amendment No. 1 and Amendment No. 2 to the Term Loan. Amendment No. 1 modified definitions by reducing LIBOR from 1.50% to 1.25% along with a reduction in the interest rate from 6.25% to 6.0%. Amendment No. 2 related to administrative matters modifying the notice requirement, which enabled the Company to move from a DIP facility to an exit facility upon emergence from bankruptcy.
On June 20, 2012, we entered into Amendment No. 1 and Amendment No. 2 to our Revolving Credit Facility. Amendment No. 1 modified definitions relating to administrative matters releasing our restricted cash of $26.5 million, which was collateralizing our letters of credit. Amendment No. 2 modified certain provisions of the agreement with regard to same day borrowing.
In 2012, the contractual interest exceeded the amount reported in the statement of operations by $19.2 million as interest ceased accruing on the Term Loan, Revolving Loan and 10.5% Senior Notes at the date of the bankruptcy filing.
Loan Covenants
We are required to meet certain restrictive financial covenants as defined under our Term Loan and Revolving Credit Facility. We have financial covenants pertaining to interest coverage, maximum leverage, and fixed charge ratios. The interest coverage ratio is now 9.0 to 1.0 for all fiscal quarters ending through maturity. The maximum leverage ratio is now 2.0 to 1.0 for fiscal quarters ending through maturity. The fixed charge ratio, which only pertains to the revolving credit facility and is only tested in limited situations, is 1.0 to 1.0 through the end of the facility. As of December 31, 2014, we were in compliance with all of our debt covenants.
Loan Guarantees
Under both the revolving credit facility and the term loan facility, Houghton Mifflin Harcourt Publishers Inc., HMH Publishers LLC and Houghton Mifflin Harcourt Publishing Company are the borrowers (collectively, the “Borrowers”), and Citibank, N.A. acts as both the administrative agent and the collateral agent.
The obligations under our senior secured credit facilities are guaranteed by the Company and each of its direct and indirect-for-profit domestic subsidiaries (other than the Borrowers) (collectively, the “Guarantors”) and are secured by all capital stock and other equity interests of the Borrowers and the Guarantors and substantially all of the other tangible and intangible assets of the Borrowers and the Guarantors, including without limitation, receivables, inventory, equipment, contract rights, securities, patents, trademarks, other intellectual property, cash, bank accounts and securities accounts and owned real estate. The revolving credit facility is secured by first priority liens on receivables, inventory, deposit accounts, securities accounts, instruments, chattel paper and other assets related to the foregoing (the “Revolving First Lien Collateral”), and second priority liens on the collateral which secures the term loan facility on a first priority basis. The term loan facility is secured by first priority liens on the capital stock and other equity interests of the Borrower and the Guarantors, equipment, owned real estate, trademarks and other intellectual property, general intangibles that are not Revolving First Lien Collateral and other assets related to the foregoing, and second priority liens on the Revolving First Lien Collateral.
84
Table of Contents
Houghton Mifflin Harcourt Company
Notes to Consolidated Financial Statements
(in thousands of dollars, except share and per share information)
| 8. | Severance and Other Charges |
2014
During the year ended December 31, 2014, $7.9 million of severance payments were made to employees whose employment ended in 2014 and prior years and $4.6 million of net payments for office space no longer utilized by the Company. Further, we recorded an expense in the amount of $5.0 million to reflect additional costs for severance, which we expect to pay the remaining $1.3 million over the next twelve months, along with a $2.3 million accrual for additional space vacated or revised estimates for space previously vacated.
2013
During the year ended December 31, 2013, $5.8 million of severance payments were made to employees whose employment ended in 2013 and prior years and $7.0 million of net payments for office space no longer utilized by the Company. Further, we recorded an expense in the amount of $10.0 million to reflect additional costs for severance and revised estimates for office space no longer utilized in connection to our continuing strategic alignment of the business.
2012
During the year ended December 31, 2012, $19.2 million of severance payments were made to employees whose employment ended in 2012 and prior years and $7.6 million of net payments for office space no longer utilized by the Company. Further, we recorded an expense in the amount of $9.4 million to reflect additional costs for severance and revised estimates for office space no longer utilized in connection to our continuing strategic alignment of the business.
A summary of the significant components of the severance/restructuring and other charges is as follows:
| 2014 | ||||||||||||||||
| Severance/ restructuring accrual at December 31, 2013 |
Severance/ restructuring expense |
Cash payments | Severance/ restructuring accrual at December 31, 2014 |
|||||||||||||
| Severance costs |
$ | 4,115 | $ | 5,022 | $ | (7,866 | ) | $ | 1,271 | |||||||
| Other accruals |
11,416 | 2,278 | (4,644 | ) | 9,050 | |||||||||||
|
|
|
|
|
|
|
|
|
|||||||||
| $ | 15,531 | $ | 7,300 | $ | (12,510 | ) | $ | 10,321 | ||||||||
|
|
|
|
|
|
|
|
|
|||||||||
| 2013 | ||||||||||||||||
| Severance/ restructuring accrual at December 31, 2012 |
Severance/ restructuring expense |
Cash payments | Severance/ restructuring accrual at December 31, 2013 |
|||||||||||||
| Severance costs |
$ | 2,142 | $ | 7,801 | $ | (5,828 | ) | $ | 4,115 | |||||||
| Other accruals |
16,148 | 2,239 | (6,971 | ) | 11,416 | |||||||||||
|
|
|
|
|
|
|
|
|
|||||||||
| $ | 18,290 | $ | 10,040 | $ | (12,799 | ) | $ | 15,531 | ||||||||
|
|
|
|
|
|
|
|
|
|||||||||
| 2012 | ||||||||||||||||
| Severance/ restructuring accrual at December 31, 2011 |
Severance/ restructuring expense |
Cash payments | Severance/ restructuring accrual at December 31, 2012 |
|||||||||||||
| Severance costs |
$ | 16,071 | $ | 5,284 | $ | (19,213 | ) | $ | 2,142 | |||||||
| Other accruals |
19,679 | 4,091 | (7,622 | ) | 16,148 | |||||||||||
|
|
|
|
|
|
|
|
|
|||||||||
| $ | 35,750 | $ | 9,375 | $ | (26,835 | ) | $ | 18,290 | ||||||||
|
|
|
|
|
|
|
|
|
|||||||||
85
Table of Contents
Houghton Mifflin Harcourt Company
Notes to Consolidated Financial Statements
(in thousands of dollars, except share and per share information)
The current portion of the severance and other charges was $5.9 million and $8.2 million as of December 31, 2014 and 2013, respectively.
| 9. | Income Taxes |
The components of loss before taxes by jurisdiction are as follows:
| For the Year Ended December 31, 2014 |
For the Year Ended December 31, 2013 |
For the Year Ended December 31, 2012 |
||||||||||
| U.S. |
$ | (102,284 | ) | $ | (80,969 | ) | $ | (47,755 | ) | |||
| Foreign |
(2,945 | ) | (27,870 | ) | (45,327 | ) | ||||||
|
|
|
|
|
|
|
|||||||
| Loss before taxes |
$ | (105,249 | ) | $ | (108,839 | ) | $ | (93,082 | ) | |||
|
|
|
|
|
|
|
|||||||
Total income taxes by jurisdiction are as follows:
| For the Year Ended December 31, 2014 |
For the Year Ended December 31, 2013 |
For the Year Ended December 31, 2012 |
||||||||||
| Income tax expense (benefit) |
||||||||||||
| U.S. |
$ | 9,632 | $ | 1,496 | $ | (7,045 | ) | |||||
| Foreign |
(3,390 | ) | 851 | 1,102 | ||||||||
|
|
|
|
|
|
|
|||||||
| $ | 6,242 | $ | 2,347 | $ | (5,943 | ) | ||||||
|
|
|
|
|
|
|
|||||||
Significant components of the expense (benefit) for income taxes attributable to loss from continuing operations consist of the following:
| For the Year Ended December 31, 2014 |
For the Year Ended December 31, 2013 |
For the Year Ended December 31, 2012 |
||||||||||
| Current |
||||||||||||
| Foreign |
$ | 588 | $ | 760 | $ | 1,102 | ||||||
| U.S.—Federal |
— | — | — | |||||||||
| U.S.—State and other |
4,633 | 3,734 | 3,031 | |||||||||
|
|
|
|
|
|
|
|||||||
| Total current |
5,221 | 4,494 | 4,133 | |||||||||
| Deferred |
||||||||||||
| Foreign |
(3,633 | ) | 91 | — | ||||||||
| U.S.—Federal |
3,889 | (1,417 | ) | (9,201 | ) | |||||||
| U.S.—State and other |
765 | (821 | ) | (875 | ) | |||||||
|
|
|
|
|
|
|
|||||||
| Total deferred |
1,021 | (2,147 | ) | (10,076 | ) | |||||||
|
|
|
|
|
|
|
|||||||
| Income tax expense (benefit) |
$ | 6,242 | $ | 2,347 | $ | (5,943 | ) | |||||
|
|
|
|
|
|
|
|||||||
86
Table of Contents
Houghton Mifflin Harcourt Company
Notes to Consolidated Financial Statements
(in thousands of dollars, except share and per share information)
The reconciliation of the income tax rate computed at the statutory tax rate to the reported income tax expense (benefit) attributable to continuing operations is as follows:
| For the Year Ended December 31, 2014 |
For the Year Ended December 31, 2013 |
For the Year Ended December 31, 2012 |
||||||||||
| Statutory rate |
(35.0 | )% | (35.0 | )% | (35.0 | )% | ||||||
| Permanent items |
1.0 | 2.5 | 3.7 | |||||||||
| UTP interest |
3.3 | — | — | |||||||||
| Transfer pricing adjustments |
— | — | (0.1 | ) | ||||||||
| Reorganization expense |
— | — | 5.9 | |||||||||
| Bargain purchase gain |
— | — | (11.6 | ) | ||||||||
| Foreign rate differential |
0.1 | 6.0 | 10.3 | |||||||||
| State and local taxes |
1.2 | 0.3 | — | |||||||||
| Increase in valuation allowance |
35.3 | 28.4 | 20.4 | |||||||||
|
|
|
|
|
|
|
|||||||
| Effective tax rate |
5.9 | % | 2.2 | % | (6.4 | )% | ||||||
|
|
|
|
|
|
|
|||||||
The significant components of the net deferred tax assets and liabilities are shown in the following table:
| 2014 | 2013 | |||||||
| Tax asset related to |
||||||||
| Net operating loss and other carryforwards |
$ | 71,565 | $ | 40,021 | ||||
| Returns reserve/inventory expense |
61,124 | 64,264 | ||||||
| Pension and postretirement benefits |
8,122 | 10,488 | ||||||
| Deferred interest (1) |
463,013 | 483,143 | ||||||
| Deferred revenue |
75,577 | 109,240 | ||||||
| Deferred compensation |
23,084 | 17,182 | ||||||
| Other, net |
26,394 | 21,163 | ||||||
| Valuation allowance |
(550,660 | ) | (527,960 | ) | ||||
|
|
|
|
|
|||||
| 178,219 | 217,541 | |||||||
| Tax liability related to |
||||||||
| Intangible assets |
(211,805 | ) | (231,186 | ) | ||||
| Depreciation and amortization expense |
(54,201 | ) | (73,512 | ) | ||||
| Other, net |
(269 | ) | — | |||||
|
|
|
|
|
|||||
| (266,275 | ) | (304,698 | ) | |||||
|
|
|
|
|
|||||
| Net deferred tax liabilities |
$ | (88,056 | ) | $ | (87,157 | ) | ||
|
|
|
|
|
|||||
| (1) | The Deferred Interest tax asset represents disallowed interest deductions under IRC Section 163(j) (Limitation on Deduction for interest on Certain Indebtedness) for the current and prior years. The disallowed interest is able to be carried forward and utilized in future years pursuant to IRC Section 163(j)(1)(B). A full valuation allowance has been provided against deferred tax assets net of deferred tax liabilities, with the exception of deferred tax liabilities resulting from long lived intangibles. |
The net deferred tax liability balance is stated at prevailing statutory income tax rates. Deferred tax assets and liabilities are reflected on our consolidated balance sheets as follows:
| 2014 | 2013 | |||||||
| Current deferred tax assets |
$ | 20,459 | $ | 29,842 | ||||
| Non-current deferred tax assets |
3,705 | — | ||||||
| Noncurrent deferred tax liability |
(112,220 | ) | (116,999 | ) | ||||
|
|
|
|
|
|||||
| $ | (88,056 | ) | $ | (87,157 | ) | |||
|
|
|
|
|
|||||
87
Table of Contents
Houghton Mifflin Harcourt Company
Notes to Consolidated Financial Statements
(in thousands of dollars, except share and per share information)
A reconciliation of the gross amount of unrecognized tax benefits, excluding accrued interest and penalties, is as follows:
| Balance at December 31, 2011 |
$ | 70,774 | ||
|
|
|
|||
| Reductions based on tax positions related to the prior year |
(105 | ) | ||
| Additions based on tax positions related to the current year |
3,965 | |||
|
|
|
|||
| Balance at December 31, 2012 |
$ | 74,634 | ||
|
|
|
|||
| Reductions based on tax positions related to the prior year |
(1,984 | ) | ||
| Additions based on tax positions related to the current year |
2,853 | |||
|
|
|
|||
| Balance at December 31, 2013 |
$ | 75,503 | ||
|
|
|
|||
| Reductions based on tax positions related to the prior year |
— | |||
| Additions based on tax positions related to the current year |
3,131 | |||
|
|
|
|||
| Balance at December 31, 2014 |
$ | 78,634 | ||
|
|
|
The above table has been revised to include the effects of an uncertain tax position in a foreign jurisdiction.
At December 31, 2014, we had $78.6 million of gross unrecognized tax benefits (excluding interest and penalties), of which $68.5 million, if recognized, would reduce the Company’s effective tax rate. The Company expects the amount of unrecognized tax benefit disclosed to be reduced by $52.1 million over the next twelve months.
With a few exceptions, we are currently open for audit under the statute of limitation for Federal, state and foreign jurisdictions for years 2011 to 2013. However, carryforward attributes from prior years may still be adjusted upon examination by tax authorities if they are used in a future period.
We report penalties and tax-related interest expense on unrecognized tax benefits as a component of the provision for income taxes in the accompanying consolidated statement of operations. At December 31, 2014 and 2013, we had $10.9 million and $8.3 million, respectively, of accrued interest and penalties in the accompanying consolidated balance sheet. Interest and penalties included in the provision for income taxes for the years ended December 31, 2014 and 2013 were $3.5 million and $2.4 million, respectively.
On January 1, 2013, as part of the 2012 Chapter 11 Reorganization, we realized approximately $1.3 billion of cancellation of debt income. We have excluded cancellation of debt income of $1.3 billion from taxable income since the Company was insolvent (liabilities greater than the fair value of its assets) by this amount at the time of the exchange. Although we did not have to pay current cash taxes from this transaction, it reduced our tax attributes, such as net operating loss carryovers and tax credit carryovers and also reduced our tax basis of our assets to offset the $1.3 billion of taxable income that did not have to be recognized due to insolvency. As a result, our net operating losses and credit carryforwards were reduced on January 1, 2013, and a portion of our tax basis in our assets were reduced at that time.
As of December 31, 2014, we have approximately $127.3 million of Federal tax loss carryforwards, which will expire between 2033 and 2034. The Company has approximately $124.8 million of state tax loss carryforward, which will expire between 2018 and 2034. In addition, we have foreign tax credit carryforwards of $1.5 million, which will expire through 2023. The Company’s United Kingdom and Irish net operating losses of $11.1 million and $27.2 million, respectively, are not subject to expiration. The Canadian losses ($3.3 million federal and $3.6 million for province purposes) will expire between December 31, 2029 and December 31, 2033.
88
Table of Contents
Houghton Mifflin Harcourt Company
Notes to Consolidated Financial Statements
(in thousands of dollars, except share and per share information)
In accordance with IRC Sec. 382, if certain substantial changes in the entity’s ownership occur, there would be an annual limitation on the amount of the carryforward(s) that can be utilized.
The Company’s deferred tax assets in the table above as of December 31, 2014 and December 31, 2013, do not include reductions of $9.1 million and $0.6 million, respectively, related to excess tax benefits from the exercise of employee stock options that are a component of NOLs as these benefits can only be recognized when the related tax deduction reduces income taxes payable.
Based on our assessment of historical pre-tax losses and the fact that we did not anticipate sufficient future taxable income in the near term to assure utilization of certain deferred tax assets, the Company recorded a valuation allowance at December 31, 2014 and 2013 of $550.7 million and $528.0 million, respectively. We have increased our valuation allowance by $22.7 million and $15.8 million in 2014 and 2013, respectively.
As of December 31, 2014 and 2013, the Company had $9.7 million and $0.6 million of unrecorded additional paid in capital net operating losses, respectively. All of the Company’s undistributed international earnings are intended to be indefinitely reinvested in operations outside of the United States as of December 31, 2014.
| 10. | Retirement and Postretirement Benefit Plans |
Retirement Plan
We have a noncontributory, qualified defined benefit pension plan (the “Retirement Plan”), which covers certain employees. The Retirement Plan is a cash balance plan, which accrues benefits based on pay, length of service, and interest. The funding policy is to contribute amounts subject to minimum funding standards set forth by the Employee Retirement Income Security Act of 1974 and the Internal Revenue Code. The Retirement Plan’s assets consist principally of common stocks, fixed income securities, investments in registered investment companies, and cash and cash equivalents. We also have a nonqualified defined benefit plan, or nonqualified plan, that previously covered employees who earned over the qualified pay limit as determined by the Internal Revenue Service. The nonqualified plan accrues benefits for the participants based on the cash balance plan calculation. The nonqualified plan is not funded. We use a December 31 date to measure the pension and postretirement liabilities. In 2007, both the qualified and nonqualified pension plans eliminated participation in the plans for new employees hired after October 31, 2007.
We also had a foreign defined benefit plan. On May 28, 2014, the plan was converted to individual annuity policies and the liability discharge occurred, which resulted in a settlement charge of approximately $1.7 million. This amount has been recorded to the selling and administrative line in our consolidated statements of operations for the year ended December 31, 2014. The foreign defined benefit plan is included in the accompanying table for year ended December 31, 2013.
We are required to recognize the funded status of defined benefit pension and other postretirement plans as an asset or liability in the balance sheet and are required to recognize actuarial gains and losses and prior service costs and credits in other comprehensive income and subsequently amortize those items in the statement of operations. Further, we are required to use a measurement date equal to the fiscal year end.
89
Table of Contents
Houghton Mifflin Harcourt Company
Notes to Consolidated Financial Statements
(in thousands of dollars, except share and per share information)
The following table summarizes the Accumulated Benefit Obligations (“ABO”), the change in Projected Benefit Obligation (“PBO”), and the funded status of our plans as of and for the financial statement period ended December 31, 2014 and 2013:
| 2014 | 2013 | |||||||
| ABO at end of period |
$ | 184,510 | $ | 191,519 | ||||
| Change in PBO |
||||||||
| PBO at beginning of period |
$ | 191,519 | $ | 204,420 | ||||
| Foreign defined benefit plan termination |
(14,934 | ) | — | |||||
| Service cost |
— | — | ||||||
| Interest cost on PBO |
7,671 | 7,405 | ||||||
| Plan settlements |
— | (1,446 | ) | |||||
| Actuarial (gain) loss |
13,338 | (9,671 | ) | |||||
| Benefits paid |
(13,084 | ) | (9,424 | ) | ||||
| Exchange rates |
— | 235 | ||||||
|
|
|
|
|
|||||
| PBO at end of period |
$ | 184,510 | $ | 191,519 | ||||
|
|
|
|
|
|||||
| Change in plan assets |
||||||||
| Fair market value at beginning of period |
$ | 167,114 | $ | 155,706 | ||||
| Foreign defined benefit plan termination |
(15,152 | ) | — | |||||
| Plan settlements |
— | (1,446 | ) | |||||
| Actual return |
13,069 | 11,540 | ||||||
| Company contribution |
14,038 | 10,615 | ||||||
| Benefits paid |
(13,084 | ) | (9,424 | ) | ||||
| Exchange rates |
— | 123 | ||||||
|
|
|
|
|
|||||
| Fair market value at end of period |
$ | 165,985 | $ | 167,114 | ||||
|
|
|
|
|
|||||
| Funded status |
$ | (18,525 | ) | $ | (24,405 | ) | ||
|
|
|
|
|
|||||
Amounts recognized in the consolidated balance sheets at December 31, 2014 and 2013 consist of:
| 2014 | 2013 | |||||||
| Noncurrent liabilities |
$ | (18,525 | ) | $ | (24,405 | ) | ||
Additional year-end information for pension plans with ABO in excess of plan assets at December 31, 2014 and 2013 consist of:
| 2014 | 2013 | |||||||
| PBO |
$ | 184,510 | $ | 176,585 | ||||
| ABO |
184,510 | 176,585 | ||||||
| Fair value of plan assets |
165,985 | 151,962 | ||||||
Amounts not yet reflected in net periodic benefit cost and recognized in accumulated other comprehensive income at December 31, 2014 and 2013 consist of:
| 2014 | 2013 | |||||||
| Net gain (loss) |
$ | (18,143 | ) | $ | (9,536 | ) | ||
|
|
|
|
|
|||||
| Accumulated other comprehensive income (loss) |
$ | (18,143 | ) | $ | (9,536 | ) | ||
|
|
|
|
|
|||||
90
Table of Contents
Houghton Mifflin Harcourt Company
Notes to Consolidated Financial Statements
(in thousands of dollars, except share and per share information)
Weighted average assumptions used to determine the benefit obligations (both PBO and ABO) at December 31, 2014 and 2013 are:
| 2014 | 2013 | |||||||
| Discount rate |
3.8 | % | 4.6 | % | ||||
| Increase in future compensation |
N/A | N/A | ||||||
Net periodic pension cost includes the following components:
| For the Year Ended December 31, 2014 |
For the Year Ended December 31, 2013 |
For the Year Ended December 31, 2012 |
||||||||||
| Interest cost on projected benefit obligation |
$ | 7,671 | $ | 7,405 | $ | 8,288 | ||||||
| Expected return on plan assets |
(10,122 | ) | (10,124 | ) | (9,047 | ) | ||||||
| Amortization of net (gain) loss |
— | 337 | 13 | |||||||||
|
|
|
|
|
|
|
|||||||
| Net pension expense |
(2,451 | ) | (2,382 | ) | (746 | ) | ||||||
| Loss (gain) due to settlement |
— | 167 | 84 | |||||||||
|
|
|
|
|
|
|
|||||||
| Net cost (gain) recognized for the period |
$ | (2,451 | ) | $ | (2,215 | ) | $ | (662 | ) | |||
|
|
|
|
|
|
|
|||||||
Significant actuarial assumptions used to determine net periodic pension cost at December 31, 2014, 2013 and 2012 are:
| 2014 | 2013 | 2012 | ||||||||||
| Discount rate |
4.6 | % | 3.8 | % | 4.4 | % | ||||||
| Increase in future compensation |
N/A | N/A | N/A | |||||||||
| Expected long-term rate of return on assets |
7.0 | % | 6.7 | % | 6.7 | % | ||||||
Assumptions on Expected Long-Term Rate of Return as Investment Strategies
We employ a building block approach in determining the long-term rate of return for plan assets. Historical markets are studied and long-term relationships between equities and fixed income are preserved congruent with the widely accepted capital market principle that assets with higher volatility generate a greater return over the long run. Current market factors such as inflation and interest rates are evaluated before long-term capital market assumptions are determined. The long-term portfolio return is established via a building block approach and proper consideration of diversification and rebalancing. Peer data and historical returns are reviewed for reasonability and appropriateness. We regularly review the actual asset allocation and periodically rebalances investments to a targeted allocation when appropriate. The current targeted asset allocation is 30% with equity managers, 55% with fixed income managers, 5% with real-estate investment trust managers and 10% with hedge fund managers. For 2014, we will use a 7.0% long-term rate of return for the Retirement Plan. We will continue to evaluate the expected rate of return assumption, at least annually, and will adjust as necessary.
Plan Assets
Plan assets for the U.S. tax qualified plans consist of a diversified portfolio of fixed income securities, equity securities, real estate, and cash equivalents. Plan assets do not include any of our securities. The U.S. pension plan assets are invested in a variety of funds within a Collective Trust (“Trust”). The Trust is a group trust designed to permit qualified trusts to comingle their assets for investment purposes on tax-exempt basis. As of December 31, 2013, the U.K pension plan assets were invested in a single bulk annuity policy with a third party.
91
Table of Contents
Houghton Mifflin Harcourt Company
Notes to Consolidated Financial Statements
(in thousands of dollars, except share and per share information)
Investment Policy and Investment Targets
The tax qualified plans consist of the U.S. pension plan and the U.K. pension scheme (prior to May 28, 2014). It is our practice to fund amounts for our qualified pension plans at least sufficient to meet minimum requirements of local benefit and tax laws. The investment objectives of our pension plan asset investments is to provide long-term total growth and return, which includes capital appreciation and current income. The nonqualified noncontributory defined benefit pension plan is generally not funded. Assets were invested among several asset classes.
The percentage of assets invested in each asset class at December 31, 2014 and 2013 is shown below.
| 2014 | Percentage | |||
| in Each | ||||
| Asset Class | Asset Class | |||
| Equity |
29.7 | % | ||
| Fixed income |
55.1 | |||
| Real estate investment trust |
5.1 | |||
| Other |
10.1 | |||
|
|
|
|||
| 100.0 | % | |||
|
|
|
|||
| 2013 | Percentage | |||
| in Each | ||||
| Asset Class | Asset Class | |||
| Equity |
37.8 | % | ||
| Fixed income |
43.7 | |||
| Real estate investment trust |
3.9 | |||
| Annuity policies |
8.9 | |||
| Other |
5.7 | |||
|
|
|
|||
| 100.0 | % | |||
|
|
|
|||
Fair Value Measurements
The fair value of our pension plan assets by asset category and by level at December 31 were as follows:
| Year ended December 31, 2014 |
Markets for Identical Assets (Level 1) |
Observable Inputs (Level 2) |
||||||||||
| Cash and cash equivalents |
$ | 1,436 | $ | 1,436 | $ | — | ||||||
| Equity securities |
||||||||||||
| U.S. equity |
28,630 | — | 28,630 | |||||||||
| Non U.S. equity |
14,844 | — | 14,844 | |||||||||
| Emerging markets equity |
5,763 | — | 5,763 | |||||||||
| Fixed Income |
||||||||||||
| Government bonds |
22,430 | — | 22,430 | |||||||||
| Corporate bonds |
47,774 | — | 47,774 | |||||||||
| Mortgage-backed securities |
9,742 | — | 9,742 | |||||||||
| Asset-backed securities |
1,534 | — | 1,534 | |||||||||
| Commercial Mortgage-Backed Securities |
2,291 | — | 2,291 | |||||||||
| International Fixed Income |
6,610 | — | 6,610 | |||||||||
| Alternatives |
||||||||||||
| Real Estate |
8,472 | — | 8,472 | |||||||||
| Hedge funds |
15,283 | — | 15,283 | |||||||||
| Other |
1,176 | — | 1,176 | |||||||||
|
|
|
|
|
|
|
|||||||
| $ | 165,985 | $ | 1,436 | $ | 164,549 | |||||||
|
|
|
|
|
|
|
|||||||
92
Table of Contents
Houghton Mifflin Harcourt Company
Notes to Consolidated Financial Statements
(in thousands of dollars, except share and per share information)
| For the Year ended December 31, 2013 |
Quoted Prices in Active Markets for Identical Assets (Level 1) |
Significant Other Observable Inputs (Level 2) |
||||||||||
| Cash and cash equivalents |
$ | 1,619 | $ | 1,619 | $ | — | ||||||
| Equity securities |
||||||||||||
| U.S. equity |
41,544 | — | 41,544 | |||||||||
| Non U.S. equity |
20,156 | — | 20,156 | |||||||||
| Emerging markets equity |
1,550 | — | 1,550 | |||||||||
| Fixed Income |
||||||||||||
| Government bonds |
20,230 | — | 20,230 | |||||||||
| Corporate bonds |
38,050 | — | 38,050 | |||||||||
| Mortgage-backed securities |
10,750 | — | 10,750 | |||||||||
| Asset-backed securities |
700 | — | 700 | |||||||||
| Commercial Mortgage-Backed Securities |
513 | — | 513 | |||||||||
| International Fixed Income |
2,767 | — | 2,767 | |||||||||
| Alternatives |
||||||||||||
| Real Estate |
6,485 | — | 6,485 | |||||||||
| Hedge funds |
7,017 | — | 7,017 | |||||||||
| Annuity policies |
14,932 | — | 14,932 | |||||||||
| Other |
801 | — | 801 | |||||||||
|
|
|
|
|
|
|
|||||||
| $ | 167,114 | $ | 1,619 | $ | 165,495 | |||||||
|
|
|
|
|
|
|
|||||||
We recognize that risk and volatility are present to some degree with all types of investments. However, high levels of risk are minimized through diversification by asset class, by style of each fund.
Estimated Future Benefit Payments
The following benefit payments are expected to be paid.
| Fiscal Year Ended | Pension | |||
| 2015 |
17,225 | |||
| 2016 |
17,258 | |||
| 2017 |
18,061 | |||
| 2018 |
17,969 | |||
| 2019 |
9,901 | |||
| 2020—2024 |
48,154 | |||
Expected Contributions
We expect to contribute approximately $6.8 million in 2015; however, the actual funding decision will be made after the 2015 valuation is completed.
Postretirement Benefit Plan
We also provide postretirement medical benefits to retired full-time, nonunion employees hired before April 1, 1992, who have provided a minimum of five years of service and attained age 55.
93
Table of Contents
Houghton Mifflin Harcourt Company
Notes to Consolidated Financial Statements
(in thousands of dollars, except share and per share information)
During 2012, we amended the postretirement medical benefits plan, resulting in the benefit contributions for certain participants to remain at the current year level for all future years. The result of the plan change was to reduce our accrued postretirement benefits liability by approximately $8.7 million with the offset to other comprehensive income in accordance with the accounting guidance for other postretirement defined benefit plans.
The following table summarizes the Accumulated Postretirement Benefit Obligation (“APBO”), the changes in plan assets, and the funded status of our plan as of and for the financial statement periods ended December 31, 2014 and 2013.
| 2014 | 2013 | |||||||
| Change in APBO |
||||||||
| APBO at beginning of period |
$ | 26,001 | $ | 29,573 | ||||
| Service cost (benefits earned during the period) |
179 | 222 | ||||||
| Interest cost on APBO |
1,361 | 1,275 | ||||||
| Employee contributions |
591 | 641 | ||||||
| Actuarial (gain) loss |
3,611 | (2,513 | ) | |||||
| Benefits paid |
(3,206 | ) | (3,197 | ) | ||||
|
|
|
|
|
|||||
| APBO at end of period |
$ | 28,537 | $ | 26,001 | ||||
|
|
|
|
|
|||||
| Change in plan assets |
||||||||
| Fair market value at beginning of period |
$ | — | $ | — | ||||
| Company contributions |
2,615 | 2,556 | ||||||
| Employee contributions |
591 | 641 | ||||||
| Benefits paid |
(3,206 | ) | (3,197 | ) | ||||
|
|
|
|
|
|||||
| Fair market value at end of period |
$ | — | $ | — | ||||
|
|
|
|
|
|||||
| Funded status |
$ | (28,537 | ) | $ | (26,001 | ) | ||
|
|
|
|
|
|||||
Amounts for postretirement benefits accrued in the consolidated balance sheets at December 31, 2014 and 2013 consist of:
| 2014 | 2013 | |||||||
| Current liabilities |
$ | (2,037 | ) | $ | (2,141 | ) | ||
| Noncurrent liabilities |
(26,500 | ) | (23,860 | ) | ||||
|
|
|
|
|
|||||
| Net amount recognized |
$ | (28,537 | ) | $ | (26,001 | ) | ||
|
|
|
|
|
|||||
Amounts not yet reflected in net periodic benefit cost and recognized in accumulated other comprehensive income at December 31, 2014 and 2013 consist of:
| 2014 | 2013 | |||||||
| Net gain (loss) |
$ | (6,087 | ) | $ | (2,476 | ) | ||
| Prior service cost |
4,876 | 6,257 | ||||||
|
|
|
|
|
|||||
| Accumulated other comprehensive income (loss) |
$ | (1,211 | ) | $ | 3,781 | |||
|
|
|
|
|
|||||
Weighted average actuarial assumptions used to determine APBO at year-end December 31, 2014 and 2013 are:
| 2014 | 2013 | |||||||
| Discount rate |
3.9 | % | 4.7 | % | ||||
| Health care cost trend rate assumed for next year |
6.9 | % | 7.1 | % | ||||
| Rate to which the cost trend rate is assumed to decline |
4.5 | % | 4.5 | % | ||||
| Year that the rate reaches the ultimate trend rate |
2027 | 2027 | ||||||
94
Table of Contents
Houghton Mifflin Harcourt Company
Notes to Consolidated Financial Statements
(in thousands of dollars, except share and per share information)
Net periodic postretirement benefit cost included the following components:
| 2014 | 2013 | 2012 | ||||||||||
| Service cost |
$ | 179 | $ | 222 | $ | 250 | ||||||
| Interest cost on APBO |
1,183 | 1,095 | 1,269 | |||||||||
| Amortization of unrecognized prior service cost |
(1,381 | ) | (1,381 | ) | (1,035 | ) | ||||||
| Amortization of net (gain) loss |
— | 309 | — | |||||||||
|
|
|
|
|
|
|
|||||||
| Net periodic postretirement benefit expense |
$ | (19 | ) | $ | 245 | $ | 484 | |||||
|
|
|
|
|
|
|
|||||||
Significant actuarial assumptions used to determine postretirement benefit cost at December 31, 2014, 2013 and 2012 are:
| 2014 | 2013 | 2012 | ||||||||||
| Discount rate |
4.7 | % | 3.8 | % | 4.5 | % | ||||||
| Health care cost trend rate assumed for next year |
7.1 | % | 7.4 | % | 7.6 | % | ||||||
| Rate to which the cost trend rate is assumed to decline (ultimate trend rate) |
4.5 | % | 4.5 | % | 4.5 | % | ||||||
| Year that the rate reaches the ultimate trend rate |
2027 | 2027 | 2027 | |||||||||
Assumed health care trend rates have a significant effect on the amounts reported for the health care plans. A one-percentage-point change in assumed health care cost trend rates would have the following effects on the expense recorded in 2014 and 2013 for the postretirement medical plan:
| 2014 | 2013 | |||||||
| One-percentage-point increase |
||||||||
| Effect on total of service and interest cost components |
$ | 12 | $ | 12 | ||||
| Effect on postretirement benefit obligation |
246 | 298 | ||||||
| One-percentage-point decrease |
||||||||
| Effect on total of service and interest cost components |
(11 | ) | (11 | ) | ||||
| Effect on postretirement benefit obligation |
(223 | ) | (190 | ) | ||||
The following table presents the change in other comprehensive income for the year ended December 31, 2014 related to our pension and postretirement obligations.
| Pension Plans |
Postretirement Plan |
Total | ||||||||||
| Sources of change in accumulated other comprehensive loss |
||||||||||||
| Net loss arising during the period |
$ | (10,370 | ) | $ | (3,611 | ) | $ | (13,981 | ) | |||
| Amortization of prior service credit |
— | (1,381 | ) | (1,381 | ) | |||||||
|
|
|
|
|
|
|
|||||||
| Total accumulated other comprehensive loss recognized during the period |
$ | (10,370 | ) | $ | (4,992 | ) | $ | (15,362 | ) | |||
|
|
|
|
|
|
|
|||||||
Estimated amounts that will be amortized from accumulated other comprehensive income (loss) over the next fiscal year.
| Total Pension Plans |
Total Postretirement Plan |
|||||||
| Prior service credit (cost) |
$ | — | $ | 1,381 | ||||
| Net gain (loss) |
(331 | ) | (220 | ) | ||||
|
|
|
|
|
|||||
| $ | (331 | ) | $ | 1,161 | ||||
|
|
|
|
|
|||||
95
Table of Contents
Houghton Mifflin Harcourt Company
Notes to Consolidated Financial Statements
(in thousands of dollars, except share and per share information)
Estimated Future Benefit Payments
The following benefit payments, which reflect expected future service, are expected to be paid:
| Fiscal Year Ended | Postretirement Plan |
|||
| 2015 |
2,037 | |||
| 2016 |
1,951 | |||
| 2017 |
1,925 | |||
| 2018 |
1,858 | |||
| 2019 |
1,844 | |||
| 2020-2024 |
8,918 | |||
Expected Contribution
We expect to contribute approximately $2.0 million in 2015.
Defined Contribution Retirement Plan
We maintain a defined contribution retirement plan, the Houghton Mifflin 401(k) Savings Plan, which conforms to Section 401(k) of the Internal Revenue Code, and covers substantially all of our eligible employees. Participants may elect to contribute up to 50.0% of their compensation subject to an annual limit. We provide a matching contribution in amounts up to 3.0% of employee contributions. The 401(k) contribution expense amounted to $5.7 million, $5.4 million and $4.9 million for the years ended December 31, 2014, December 31, 2013 and 2012, respectively. We did not make any additional discretionary contributions in 2014, 2013 and 2012.
| 11. | Stock-Based Compensation |
The Management Incentive Plan (“MIP”) became effective on June 22, 2012. The MIP provides for grants of stock options to employees, restricted stock and restricted stock units to employees and independent members of the board of directors at a strike price equal to or greater than the fair value per share of common stock as of the date of grant. The stock related to award forfeitures and stock withheld to cover tax withholding requirements upon vesting of restricted stock units remains outstanding and may be reallocated to new recipients. There were 16,374,270 shares authorized and available for issuance on June 22, 2012. As of December 31, 2014, there were 3,217,734 shares of common stock underlying awards reserved for future issuance under the MIP.
The vesting terms for equity awards generally range from 1 to 4 years over equal annual installments and generally expire seven years after the date of grant. Restricted stock is common stock that is subject to a risk of forfeiture only upon voluntary termination or termination for cause, as defined. Total compensation expense related to stock option grants and restricted stock issuances recorded in the years ended December 31, 2014 and 2013 was approximately $11.4 million and $9.5 million respectively, and was recorded in selling and administrative expense. Total compensation expense related to stock option grants and restricted stock issuances recorded in the year ended December 31, 2012 was approximately $6.3 million of which approximately $4.3 million was recorded in selling and administrative expense and approximately $2.0 million was recorded in reorganization items, net.
96
Table of Contents
Houghton Mifflin Harcourt Company
Notes to Consolidated Financial Statements
(in thousands of dollars, except share and per share information)
Stock Options
The following tables summarize option activity for HMH employees in stock options for the periods ended December 31, 2014 and 2013:
| Number of Shares |
Weighted Average Exercise Price |
|||||||
| Balance at December 31, 2012 |
9,904,562 | $ | 12.50 | |||||
| Granted |
3,632,012 | 13.32 | ||||||
| Forfeited |
(994,456 | ) | 12.51 | |||||
|
|
|
|
|
|||||
| Balance at December 31, 2013 |
12,542,118 | $ | 12.74 | |||||
|
|
|
|
|
|||||
| Granted |
943,600 | 19.86 | ||||||
| Exercised |
(1,876,566 | ) | 12.65 | |||||
| Forfeited |
(641,000 | ) | 13.31 | |||||
|
|
|
|
|
|||||
| Balance at December 31, 2014 |
10,968,152 | $ | 13.33 | |||||
|
|
|
|
|
|||||
| Options Exercisable at end of year |
4,357,248 | $ | 12.66 | |||||
The intrinsic value of a stock option is the amount by which the current market value of the underlying stock exceeds the exercise price of the option as of the balance sheet date. The intrinsic value of options outstanding and exercisable was approximately $81.0 million and $35.1 million, respectively, at December 31, 2014 and approximately $53.0 million and $14.1 million, respectively, at December 31, 2013. There was no intrinsic value of options outstanding and exercisable at December 31, 2012.
We estimate the fair value of stock options using the Black-Scholes valuation model. Key input assumptions used to estimate the fair value of stock options include the exercise price of the award, the expected volatility of our stock over the option’s expected term, the risk-free interest rate over the option’s expected term, and our expected annual dividend yield.
The fair value of each option granted was estimated on the grant date using the Black-Scholes valuation model with the following assumptions:
| For the Year Ended December 31, 2014 |
For the Year Ended December 31, 2013 |
For the Year Ended December 31, 2012 |
||||||||||
| Expected term (years) (a) |
4.75 | 4.75 | 4.0 | |||||||||
| Expected dividend yield |
0.00 | % | 0.00 | % | 0.00 | % | ||||||
| Expected volatility (b) |
20.40%-22.63 | % | 21.42%-24.55 | % | 24.21%-26.54 | % | ||||||
| Risk-free interest rate (c) |
1.49%-1.82 | % | 0.75%-1.71 | % | 0.67%-0.76 | % | ||||||
| (a) | The expected term is the number of years that we estimate that options will be outstanding prior to exercise. |
| (b) | We have estimated volatility for options granted based on the historical volatility for a group of companies believed to be a representative peer group, selected based on industry and market capitalization, due to lack of sufficient historical publicly traded prices of our own common stock. |
| (c) | The risk-free interest rate is based on the U.S. Treasury yield for a period commensurate with the expected life of the option. |
The accounting standard for stock-based compensation requires companies to estimate forfeitures at the time of grant and periodically revise those estimates in subsequent periods if actual forfeitures differ from those estimates. Stock-based compensation expense is recorded only for those awards expected to vest using an estimated forfeiture rate based on historical forfeiture data coupled with and estimated derived forfeiture rate of peers.
97
Table of Contents
Houghton Mifflin Harcourt Company
Notes to Consolidated Financial Statements
(in thousands of dollars, except share and per share information)
As of December 31, 2014, there remained approximately $13.5 million of unearned compensation expense related to unvested stock options to be recognized over a weighted average term of 2.0 years.
The weighted average grant date fair value was $4.18, $2.82 and $2.76 for options granted in 2014, 2013 and 2012, respectively.
The following tables summarize information about stock options outstanding and exercisable under the plan at December 31, 2014:
| Options Outstanding |
Options Exercisable | |||||||||||||||||||
| Range of Exercise Price |
Options Outstanding at December 31, 2014 |
Weighted Average Remaining Contractual life |
Weighted Average Exercise Price |
Options Exercisable at December 31, 2014 |
Weighted Average Exercise Price |
|||||||||||||||
| $12.50 |
8,193,586 | 4.6 | $ | 12.50 | 4,017,380 | $ | 12.50 | |||||||||||||
| $13.48 |
1,666,966 | 5.5 | $ | 13.48 | 236,868 | $ | 13.48 | |||||||||||||
| $14.78—$17.84 |
324,000 | 6.4 | $ | 16.67 | 71,000 | $ | 15.60 | |||||||||||||
| $18.28 |
6,600 | 6.4 | $ | 18.28 | — | — | ||||||||||||||
| $18.51 |
40,000 | 6.4 | $ | 18.51 | — | — | ||||||||||||||
| $18.80 |
20,000 | 6.7 | $ | 18.80 | — | — | ||||||||||||||
| $19.24 |
10,000 | 6.0 | $ | 19.24 | — | — | ||||||||||||||
| $19.89 |
32,000 | 9.2 | $ | 19.89 | 32,000 | $ | 19.89 | |||||||||||||
| $20.35 |
50,000 | 6.3 | $ | 20.35 | — | — | ||||||||||||||
| $20.49 |
625,000 | 6.9 | $ | 20.49 | — | — | ||||||||||||||
|
|
|
|
|
|
|
|
|
|
|
|||||||||||
| $12.50—$20.49 |
10,968,152 | 4.9 | $ | 13.33 | 4,357,248 | $ | 12.66 | |||||||||||||
|
|
|
|
|
|
|
|
|
|
|
|||||||||||
Restricted Stock Units
The following table summarizes restricted stock activity for grants to certain employees and independent members of the board of directors in our restricted stock units:
| Numbers of Units |
Weighted Average Grant Date Fair Value |
|||||||
| Balance at December 31, 2012 |
44,400 | $ | 12.50 | |||||
| Granted |
221,802 | 14.11 | ||||||
| Vested |
(44,400 | ) | 12.50 | |||||
|
|
|
|
|
|||||
| Balance at December 31, 2013 |
221,802 | $ | 14.11 | |||||
|
|
|
|
|
|||||
| Granted |
86,239 | $ | 18.82 | |||||
| Vested |
(135,136 | ) | 13.12 | |||||
| Forfeited |
(1,040 | ) | 19.24 | |||||
|
|
|
|
|
|||||
| Balance at December 31, 2014 |
171,865 | $ | 17.22 | |||||
|
|
|
|
|
|||||
98
Table of Contents
Houghton Mifflin Harcourt Company
Notes to Consolidated Financial Statements
(in thousands of dollars, except share and per share information)
| 12. | Fair Value Measurements |
The accounting standard for fair value measurements among other things, defines fair value, establishes a consistent framework for measuring fair value and expands disclosure for each major asset and liability category measured at fair value on either a recurring or nonrecurring basis. The accounting standard establishes a three-tier fair value hierarchy which prioritizes the inputs used in measuring fair value as follows:
| Level 1 | Observable input such as quoted prices in active markets for identical assets or liabilities; | |
| Level 2 | Observable inputs, other than the quoted prices in active markets, that are observable either directly or indirectly; and | |
| Level 3 | Unobservable inputs in which there is little or no market data, which require the reporting entity to develop its own assumptions. | |
Assets and liabilities measured at fair value are based on one or more of three valuation techniques identified in the tables below. Where more than one technique is noted, individual assets or liabilities were valued using one or more of the noted techniques. The valuation techniques are as follows:
| (a) | Market approach: Prices and other relevant information generated by market transactions involving identical or comparable assets or liabilities; |
| (b) | Cost approach: Amount that would be currently required to replace the service capacity of an asset (current replacement cost); and |
| (c) | Income approach: Valuation techniques to convert future amounts to a single present amount based on market expectations (including present value techniques). |
On a recurring basis, we measure certain financial assets and liabilities at fair value, including our money market funds, short-term investments which consist of U.S. treasury securities and U.S. agency securities, and foreign exchange forward and option contracts. The accounting standard for fair value measurements defines fair value as the price that would be received to sell an asset or paid to transfer a liability in an orderly transaction between market participants at the measurement date. As such, fair value is a market-based measurement that should be determined based on assumptions that market participants would use in pricing an asset or liability. In determining fair value, we utilize valuation techniques that maximize the use of observable inputs and minimize the use of unobservable inputs to the extent possible as well as consider counterparty and its credit risk in its assessment of fair value.
The following tables present our financial assets and liabilities measured at fair value on a recurring basis at December 31, 2014 and December 31, 2013:
| 2014 | Quoted Prices in Active Markets for Identical Assets (Level 1) |
Significant Other Observable Inputs (Level 2) |
Valuation Technique | |||||||||||
| Financial assets |
||||||||||||||
| Money market funds |
$ | 438,907 | $ | 438,907 | $ | — | (a) | |||||||
| U.S. treasury securities |
93,004 | 93,004 | — | (a) | ||||||||||
| U.S. agency securities |
194,028 | — | 194,028 | (a) | ||||||||||
|
|
|
|
|
|
|
|||||||||
| $ | 725,939 | $ | 531,911 | $ | 194,028 | |||||||||
|
|
|
|
|
|
|
|||||||||
| Financial liabilities |
||||||||||||||
| Foreign exchange derivatives |
$ | 1,370 | $ | — | $ | 1,370 | (a) | |||||||
|
|
|
|
|
|
|
|||||||||
| $ | 1,370 | $ | — | $ | 1,370 | |||||||||
|
|
|
|
|
|
|
|||||||||
99
Table of Contents
Houghton Mifflin Harcourt Company
Notes to Consolidated Financial Statements
(in thousands of dollars, except share and per share information)
| 2013 | Quoted Prices in Active Markets for Identical Assets (Level 1) |
Significant Other Observable Inputs (Level 2) |
Valuation Technique |
|||||||||||||
| Financial assets |
||||||||||||||||
| Money market funds |
$ | 259,031 | $ | 259,031 | $ | — | (a | ) | ||||||||
| U.S. treasury securities |
57,076 | 57,076 | — | (a | ) | |||||||||||
| U.S. agency securities |
54,645 | — | 54,645 | (a | ) | |||||||||||
| Foreign exchange derivatives |
222 | — | 222 | (a | ) | |||||||||||
|
|
|
|
|
|
|
|||||||||||
| $ | 370,974 | $ | 316,107 | $ | 54,867 | |||||||||||
|
|
|
|
|
|
|
|||||||||||
Our money market funds and U.S. treasury securities are classified within Level 1 of the fair value hierarchy because they are valued using quoted prices in active markets for identical instruments. Our U.S. agency securities are classified within level 2 of the fair value hierarchy because they are valued using other than quoted prices in active markets. In addition to $438.9 million and $259.0 million invested in money market funds as of December 31, 2014 and December 31, 2013, respectively, we had $17.7 million and $54.6 million of cash invested in bank accounts as of December 31, 2014 and December 31, 2013, respectively.
Our foreign exchange derivatives consist of forward and option contracts and are classified within Level 2 of the fair value hierarchy because they are valued based on observable inputs and are available for substantially the full term of our derivative instruments. We use foreign exchange forward and option contracts to fix the functional currency value of forecasted commitments, payments and receipts. The aggregate notional amount of the outstanding foreign exchange forward and option contracts was $18.7 million and $24.1 million at December 31, 2014 and December 31, 2013, respectively. Our foreign exchange forward and option contracts contain netting provisions to mitigate credit risk in the event of counterparty default, including payment default and cross default. At December 31, 2014 and December 31, 2013, the fair value of our counterparty default exposure was less than $1.0 million and spread across several highly rated counterparties.
The following table presents our nonfinancial assets and liabilities measured at fair value on a nonrecurring basis during 2014 and 2013:
| 2014 | Significant (Level 3) |
Total Impairment |
Valuation Technique | |||||||||||
| Nonfinancial assets |
||||||||||||||
| Investment in preferred stock |
$ | — | $ | — | $ | 1,279 | (b) | |||||||
| Other intangible assets |
3,800 | 3,800 | 400 | (a)(c) | ||||||||||
|
|
|
|
|
|
|
|||||||||
| $ | 3,800 | $ | 3,800 | $ | 1,679 | |||||||||
|
|
|
|
|
|
|
|||||||||
100
Table of Contents
Houghton Mifflin Harcourt Company
Notes to Consolidated Financial Statements
(in thousands of dollars, except share and per share information)
| 2013 | Significant (Level 3) |
Total Impairment |
Valuation Technique | |||||||||||
| Nonfinancial assets |
||||||||||||||
| Property, plant, and equipment |
$ | — | $ | — | $ | 7,439 | (b) | |||||||
| Pre-publication costs |
— | — | 1,061 | (b) | ||||||||||
| Other intangible assets |
4,200 | 4,200 | 500 | (a)(c) | ||||||||||
|
|
|
|
|
|
|
|||||||||
| $ | 4,200 | $ | 4,200 | $ | 9,000 | |||||||||
|
|
|
|
|
|
|
|||||||||
| Nonfinancial liabilities |
||||||||||||||
| Contingent consideration liability associated with acquisitions |
$ | 1,881 | $ | 1,881 | $ | — | (c) | |||||||
|
|
|
|
|
|
|
|||||||||
| $ | 1,881 | $ | 1,881 | $ | — | |||||||||
|
|
|
|
|
|
|
|||||||||
Our nonfinancial assets, which include goodwill, other intangible assets, property, plant, and equipment, and pre-publication costs, are not required to be measured at fair value on a recurring basis. However, if certain trigger events occur, or if an annual impairment test is required, we evaluate the nonfinancial assets for impairment. If an impairment did occur, the asset is required to be recorded at the estimated fair value.
We review software and platform development costs, included within property, plant, and equipment, for impairment. There was no impairment for the year ended December 31, 2014. For the year ended December 31, 2013, software development costs of $7.4 million were impaired as the products will not be sold in the marketplace.
Pre-publication costs recorded on the balance sheet are periodically reviewed for impairment by comparing the unamortized capitalized costs of the assets to the fair value of those assets. There was no impairment for the year ended December 31, 2014. For the year ended December 31, 2013, pre-publication costs of $1.1 million were impaired as the programs will not be sold in the marketplace.
In evaluating goodwill for impairment, we first compare our reporting unit’s fair value to its carrying value. We estimate the fair values of our reporting units by considering market multiple and recent transaction values of peer companies, where available, and projected discounted cash flows, if reasonably estimable. There was no impairment recorded for goodwill for the years ended December 31, 2014 and 2013.
We perform an impairment test for our other intangible assets by comparing the assets fair value to its carrying value. Fair value is estimated based on recent market transactions, where available, and projected discounted cash flows, if reasonably estimable. There was a $0.4 million and $0.5 million impairment recorded for the years ended December 31, 2014 and 2013, respectively, relating to two specific tradename intangible assets. The fair value of goodwill and other intangible assets are estimates, which are inherently subject to significant uncertainties, and actual results could vary significantly from these estimates.
Other accruals include restructuring charges which were valued using our internal estimates using a discounted cash flow model, and we have classified the other accruals as Level 3 in the fair value hierarchy.
The fair value of an acquisition-related contingent consideration liability is affected most significantly by changes in the estimated probabilities of the contingencies being achieved.
101
Table of Contents
Houghton Mifflin Harcourt Company
Notes to Consolidated Financial Statements
(in thousands of dollars, except share and per share information)
The following table presents a summary of changes in fair value of the Company’s Level 3 liabilities measured on a recurring basis for 2014 and 2013:
| Level 3 Inputs Liabilities |
||||
| Balance at December 31, 2012 |
$ | 5,055 | ||
| Change in fair value of contingent consideration liability, included in selling and administrative expenses |
(1,781 | ) | ||
| Change in fair value of contingent consideration liability, included in interest expense |
182 | |||
| Payments of contingent consideration liability |
(1,575 | ) | ||
|
|
|
|||
| Balance at December 31, 2013 |
1,881 | |||
| Change in fair value of contingent consideration liability, included in selling and administrative expenses |
(2,000 | ) | ||
| Change in fair value of contingent consideration liability, included in interest expense |
119 | |||
|
|
|
|||
| Balance at December 31, 2014 |
$ | — | ||
|
|
|
|||
Fair Value of Debt
The following table presents the carrying amounts and estimated fair market values of our debt at December 31, 2014 and December 31, 2013. The fair value of debt is deemed to be the amount at which the instrument could be exchanged in an orderly transaction between market participants at the measurement date.
| December 31, 2014 | December 31, 2013 | |||||||||||||||
| Carrying Amount |
Estimated Fair Value |
Carrying Amount |
Estimated Fair Value |
|||||||||||||
| Debt |
||||||||||||||||
| $250,000 Term loan |
$ | 243,125 | $ | 242,517 | $ | 245,625 | $ | 247,774 | ||||||||
The fair market values of our debt were estimated based on quoted market prices on a private exchange for those instruments that are traded and are classified as level 2 within the fair value hierarchy, at December 31, 2014 and, 2013. The fair market values require varying degrees of management judgment. The factors used to estimate these values may not be valid on any subsequent date. Accordingly, the fair market values of the debt presented may not be indicative of their future values.
| 13. | Commitments and Contingencies |
Lease Obligations
We have operating leases for various real property, office facilities, and warehouse equipment that expire at various dates through 2019. Certain leases contain renewal and escalation clauses for a proportionate share of operating expenses.
102
Table of Contents
Houghton Mifflin Harcourt Company
Notes to Consolidated Financial Statements
(in thousands of dollars, except share and per share information)
The future minimum rental commitments under all noncancelable leases (with initial or remaining lease terms in excess of one year) for real estate and equipment are payable as follows:
| Operating Leases |
||||
| 2015 |
42,547 | |||
| 2016 |
36,883 | |||
| 2017 |
18,949 | |||
| 2018 |
14,786 | |||
| 2019 |
11,997 | |||
| Thereafter |
33,600 | |||
|
|
|
|||
| Total minimum lease payments |
158,762 | |||
|
|
|
|||
| Total future minimal rentals under subleases |
26,239 | |||
For the years ended December 31, 2014, 2013 and 2012 rent expense, net of sublease income, was $26.8 million, $33.9 million and $38.0 million, respectively. For the years ended December 31, 2014, 2013 and 2012, the rent expense included a $2.3 million, $2.2 million and $4.1 million charge as additional real estate was vacated.
Contingencies
We are involved in ordinary and routine litigation and matters incidental to our business. Litigation alleging infringement of copyrights and other intellectual property rights has become extensive in the educational publishing industry. Specifically, there have been various settled, pending and threatened litigation that allege we exceeded the print run limitation or other restrictions in licenses granted to us to reproduce photographs in our textbooks. While management believes that there is a reasonable possibility we may incur a loss associated with the pending and threatened litigation, we are not able to estimate such amount, but we do not expect any of these matters to have a material adverse effect on our results of operations, financial position or cash flows. We have insurance over such amounts and with coverage and deductibles as management believes is reasonable. There can be no assurance that our liability insurance will cover all events or that the limits of coverage will be sufficient to fully cover all liabilities. We were contingently liable for $11.3 million and $23.0 million of performance related surety bonds for our operating activities as of December 31, 2014 and 2013, respectively. An aggregate of $20.2 million and $19.7 million of letters of credit existed each year at December 31, 2014 and 2013 of which $2.4 million backed the aforementioned performance related surety bonds each year in 2014 and 2013.
We routinely enter into standard indemnification provisions as part of license agreements involving use of our intellectual property. These provisions typically require us to indemnify and hold harmless licensees in connection with any infringement claim by a third party relating to the intellectual property covered by the license agreement. The assessment business routinely enters into contracts with customers that contain provisions requiring us to indemnify the customer against a broad array of potential liabilities resulting from any breach of the contract or the invalidity of the test. Although the term of these provisions and the maximum potential amounts of future payments we could be required to make is not limited, we have never incurred any costs to defend or settle claims related to these types of indemnification provisions. We therefore believe the estimated fair value of these provisions is inconsequential, and have no liabilities recorded for them as of December 31, 2014 and December 31, 2013.
103
Table of Contents
Houghton Mifflin Harcourt Company
Notes to Consolidated Financial Statements
(in thousands of dollars, except share and per share information)
Concentration of Credit Risk and Significant Customers
As of December 31, 2014, no individual customer comprised more than 10% of our accounts receivable balance. We believe that our accounts receivable credit risk exposure is limited and we have not experienced significant write-downs in our accounts receivable balances.
As of December 31, 2013, two customers represented approximately $104.8 million, or 32.9%, of our accounts receivable, net balance and there existed a payable by the Company to one of the same customers in the amount of $4.6 million and there is a contractual right to offset with such customer.
| 14. | Related Party Transactions |
As discussed in Note 2, upon the Company’s emergence from Chapter 11 bankruptcy proceedings, holders of the Term Loan, Revolving Loan, and 10.5% Senior Notes were issued post-emergence shares of new common stock pursuant to the final Plan on a pro rata basis. Certain of these holders of the Term Loan, Revolving Loan, and 10.5% Senior Notes were also equity holders prior to the consummation of the Plan. The amount of the gain attributable to the debt to equity conversion, net of elimination of fees and other charges, of $1,010.3 million, which is associated to the holders of the Term Loan, Revolving Loan, and 10.5% Senior Notes that were also equity holders prior to the consummation of the Plan, was charged to capital in excess of par value.
A company controlled by an immediate family member of our Chief Executive Officer performed web-design services for the Company in 2014. For the year ended December 31, 2014, we were billed $0.4 million for those services.
| 15. | Net Loss Per Share |
The following table sets forth the computation of basic and diluted earnings per share (“EPS”):
| For the Year Ended December 31, 2014 |
For the Year Ended December 31, 2013 |
For the Year Ended December 31, 2012 |
||||||||||
| Numerator |
||||||||||||
| Net loss attributable to common stockholders |
$ | (111,491 | ) | $ | (111,186 | ) | $ | (87,139 | ) | |||
|
|
|
|
|
|
|
|||||||
| Denominator |
||||||||||||
| Weighted average shares outstanding |
||||||||||||
| Basic |
140,594,689 | 139,928,650 | 340,918,128 | |||||||||
| Diluted |
140,594,689 | 139,928,650 | 340,918,128 | |||||||||
| Net loss per share attributable to common stockholders |
||||||||||||
| Basic |
$ | (0.79 | ) | $ | (0.79 | ) | $ | (0.26 | ) | |||
| Diluted |
$ | (0.79 | ) | $ | (0.79 | ) | $ | (0.26 | ) | |||
As we incurred a net loss in each of the periods presented above, all outstanding stock options and restricted stock units have an anti-dilutive effect and therefore are excluded from the computation of diluted weighted average shares outstanding. Accordingly, basic and diluted weighted average shares outstanding are equal for such periods.
104
Table of Contents
Houghton Mifflin Harcourt Company
Notes to Consolidated Financial Statements
(in thousands of dollars, except share and per share information)
The following table summarizes our weighted average outstanding common stock equivalents that were anti-dilutive due to the net loss attributable to common stockholders during the periods, and therefore excluded from the computation of diluted EPS:
| For the Year Ended December 31, 2014 |
For the Year Ended December 31, 2013 |
For the Year Ended December 31, 2012 |
||||||||||
| Stock options |
10,341,948 | 10,921,049 | 6,609,382 | |||||||||
| Restricted stock units |
153,314 | 166,928 | 141,086 | |||||||||
| 16. | Segment Reporting |
As of December 31, 2014, we had two reportable segments (Education and Trade Publishing). Our Education segment provides educational products, technology platforms and services to meet the diverse needs of today’s classrooms. These products and services include print and digital content in the form of textbooks, digital courseware, instructional aids, educational assessment and intervention solutions, which are aimed at improving achievement and supporting learning for students that are not keeping pace with peers, professional development and school reform services. Our Trade Publishing segment primarily develops, markets and sells consumer books in print and digital formats and licenses book rights to other publishers and electronic businesses in the United States and abroad. The principal markets for Trade Publishing products are retail stores, both physical and online, and wholesalers. Reference materials are also sold to schools, colleges, libraries, office supply distributors and other businesses.
We measure and evaluate our reportable segments based on segment Adjusted EBITDA. We exclude from segment Adjusted EBITDA certain corporate related expenses, as our corporate functions do not meet the definition of a segment, as defined in the accounting guidance relating to segment reporting. In addition, certain transactions or adjustments that our Chief Operating Decision Maker considers to be unusual and/or non-operational, such as amounts related to goodwill and other intangible asset impairment charges and restructuring related charges, as well as amortization expenses, are excluded from segment Adjusted EBITDA. Although we exclude these amounts from segment Adjusted EBITDA, they are included in reported consolidated operating income (loss) and are included in the reconciliation below.
| (in thousands) | Year Ended December 31, | Total | ||||||||||||||
| Education | Trade Publishing |
Corporate/ Other |
||||||||||||||
| 2014 |
||||||||||||||||
| Net sales |
$ | 1,209,142 | $ | 163,174 | $ | — | $ | 1,372,316 | ||||||||
| Segment adjusted EBITDA |
298,483 | 12,675 | (45,775 | ) | 265,383 | |||||||||||
| 2013 |
||||||||||||||||
| Net sales |
$ | 1,207,908 | $ | 170,704 | $ | — | $ | 1,378,612 | ||||||||
| Segment adjusted EBITDA |
343,183 | 24,448 | (42,613 | ) | 325,018 | |||||||||||
| 2012 |
||||||||||||||||
| Net sales |
$ | 1,128,591 | $ | 157,050 | $ | — | $ | 1,285,641 | ||||||||
| Segment adjusted EBITDA |
329,723 | 28,774 | (38,685 | ) | 319,812 | |||||||||||
105
Table of Contents
Houghton Mifflin Harcourt Company
Notes to Consolidated Financial Statements
(in thousands of dollars, except share and per share information)
Reconciliation of Adjusted EBITDA to the consolidated statements of operations is as follows:
| (in thousands) | Year Ended December 31, | |||||||||||
| 2014 | 2013 | 2012 | ||||||||||
| Total Segment Adjusted EBITDA |
$ | 265,383 | $ | 325,018 | $ | 319,812 | ||||||
| Interest expense |
(18,245 | ) | (21,344 | ) | (123,197 | ) | ||||||
| Depreciation expense |
(72,290 | ) | (61,705 | ) | (58,131 | ) | ||||||
| Amortization expense |
(247,487 | ) | (280,271 | ) | (370,291 | ) | ||||||
| Stock compensation |
(11,376 | ) | (9,524 | ) | (4,227 | ) | ||||||
| Gain (loss) on derivative instruments |
(1,593 | ) | (252 | ) | 1,688 | |||||||
| Asset impairment charges |
(1,679 | ) | (9,000 | ) | (8,003 | ) | ||||||
| Purchase accounting adjustments |
(3,661 | ) | (11,460 | ) | 16,511 | |||||||
| Fees, expenses or charges for equity offerings, debt or acquisitions |
(4,424 | ) | (23,540 | ) | (267 | ) | ||||||
| Debt restructuring |
— | (598 | ) | — | ||||||||
| Restructuring |
(2,577 | ) | (3,123 | ) | (6,716 | ) | ||||||
| Severance, separation costs and facility closures |
(7,300 | ) | (13,040 | ) | (9,375 | ) | ||||||
| Reorganization items, net |
— | — | 149,114 | |||||||||
|
|
|
|
|
|
|
|||||||
| Loss from continuing operations before taxes |
(105,249 | ) | (108,839 | ) | (93,082 | ) | ||||||
|
|
|
|
|
|
|
|||||||
| Provision (benefit) for income taxes |
6,242 | 2,347 | (5,943 | ) | ||||||||
|
|
|
|
|
|
|
|||||||
| Net loss |
$ | (111,491 | ) | $ | (111,186 | ) | $ | (87,139 | ) | |||
|
|
|
|
|
|
|
|||||||
Segment information as of December 31, 2014 and 2013 is as follows:
| (in thousands) | ||||||||
| 2014 | 2013 | |||||||
| Total assets—Education segment |
$ | 2,003,683 | $ | 2,206,690 | ||||
| Total assets—Trade Publishing segment |
218,530 | 231,918 | ||||||
| Total assets—Corporate and Other |
788,894 | 471,778 | ||||||
|
|
|
|
|
|||||
| $ | 3,011,107 | $ | 2,910,386 | |||||
Schedule of long-lived assets as of December 31, 2014 and 2013 is as follows:
The following represents long-lived assets outside of the United States, which are substantially in Ireland. All other long-lived assets are located in the United States.
| (in thousands) | 2014 | 2013 | ||||||
| Long-lived assets - International |
$ | 4,239 | $ | 13,425 | ||||
106
Table of Contents
Houghton Mifflin Harcourt Company
Notes to Consolidated Financial Statements
(in thousands of dollars, except share and per share information)
The following is a schedule of net sales by geographic region:
| (in thousands) | ||||
| Year Ended December 31, 2014 |
||||
| Net sales—U.S. |
$ | 1,291,199 | ||
| Net sales—International |
81,117 | |||
|
|
|
|||
| Total net sales |
$ | 1,372,316 | ||
| Year Ended December 31, 2013 |
||||
| Net sales—U.S. |
$ | 1,296,563 | ||
| Net sales—International |
82,049 | |||
|
|
|
|||
| Total net sales |
$ | 1,378,612 | ||
| Year Ended December 31, 2012 |
||||
| Net sales—U.S. |
$ | 1,206,972 | ||
| Net sales—International |
78,669 | |||
|
|
|
|||
| Total net sales |
$ | 1,285,641 | ||
| 17. | Valuation and Qualifying Accounts |
| Balance at Beginning of Year |
Net Charges to Revenues or Expenses and Additions |
Utilization of Allowances |
Balance at End of Year |
|||||||||||||
| 2014 |
||||||||||||||||
| Allowance for doubtful accounts |
$ | 5,084 | $ | 3,274 | $ | (2,733 | ) | $ | 5,625 | |||||||
| Reserve for returns |
35,548 | 53,877 | (67,266 | ) | 22,159 | |||||||||||
| Reserve for royalty advances |
41,248 | 13,829 | (77 | ) | 55,000 | |||||||||||
| Deferred tax valuation allowance |
527,960 | 25,947 | (3,247 | ) | 550,660 | |||||||||||
| 2013 |
||||||||||||||||
| Allowance for doubtful accounts |
$ | 10,543 | $ | 2,261 | $ | (7,720 | ) | $ | 5,084 | |||||||
| Reserve for returns |
25,784 | 58,290 | (48,526 | ) | 35,548 | |||||||||||
| Reserve for royalty advances |
26,194 | 16,949 | (1,895 | ) | 41,248 | |||||||||||
| Deferred tax valuation allowance |
512,234 | 15,726 | — | 527,960 | ||||||||||||
| 2012 |
||||||||||||||||
| Allowance for doubtful accounts |
$ | 18,229 | $ | 2,113 | $ | (9,799 | ) | $ | 10,543 | |||||||
| Reserve for returns |
25,614 | 44,213 | (44,043 | ) | 25,784 | |||||||||||
| Reserve for royalty advances |
12,252 | 14,536 | (594 | ) | 26,194 | |||||||||||
| Deferred tax valuation allowance (1) |
822,485 | — | (310,251 | ) | 512,234 | |||||||||||
| (1) | Deferred tax valuation allowance was reduced in connection with the accounting for emergence from bankruptcy in the year ended December 31, 2012. |
107
Table of Contents
Houghton Mifflin Harcourt Company
Notes to Consolidated Financial Statements
(in thousands of dollars, except share and per share information)
| 18. | Quarterly Results of Operations (Unaudited) |
| Three Months Ended | ||||||||||||||||
| March 31, | June 30, | September 30, | December 31, | |||||||||||||
| 2014: |
||||||||||||||||
| Net sales |
$ | 153,933 | $ | 401,890 | $ | 551,008 | $ | 265,485 | ||||||||
| Gross profit |
1,560 | 178,255 | 287,102 | 81,356 | ||||||||||||
| Operating income (loss) |
(140,152 | ) | 18,324 | 116,151 | (79,734 | ) | ||||||||||
| Net income (loss) |
(146,335 | ) | 11,548 | 107,030 | (83,734 | ) | ||||||||||
| 2013: |
||||||||||||||||
| Net sales |
$ | 166,594 | $ | 362,951 | $ | 550,190 | $ | 298,877 | ||||||||
| Gross profit |
13,927 | 140,562 | 270,124 | 107,637 | ||||||||||||
| Operating income (loss) |
(128,989 | ) | (5,639 | ) | 107,535 | (59,552 | ) | |||||||||
| Net income (loss) |
(137,381 | ) | (14,266 | ) | 105,112 | (64,651 | ) | |||||||||
Our net sales, operating profit or loss and net cash provided by or used in operations are impacted by the inherent seasonality of the academic calendar. Consequently, the performance of our businesses may not be comparable quarter to consecutive quarter and should be considered on the basis of results for the whole year or by comparing results in a quarter with results in the same quarter for the previous year.
During the first quarter of 2014, we recorded an out-of-period correction of approximately $1.1 million reducing net sales and increasing deferred revenue that should have been deferred previously. In addition, during the first quarter of 2014, we recorded approximately $3.5 million of incremental expense, primarily commissions, related to the prior year. These out-of-period corrections had no impact on our debt covenant compliance. Management believes these out-of-period corrections are not material to the current period financial statements or any previously issued financial statements. Additionally, we revised previously reported balance sheet amounts to severance and other charges of $7.3 million, which has been reclassified as long-term, and to current deferred revenue of $5.2 million, which has also been reclassified as long-term. The revision was not material to the reported consolidated balance sheet for any previously filed periods.
During the fourth quarter of 2013, we recorded an out-of-period correction of approximately $5.7 million of additional net sales that was deferred and should have been recognized previously in 2011 ($4.5 million), 2012 ($0.9 million), and the first nine months of 2013 ($0.3 million). In addition, during 2013, we recorded approximately $2.6 million of incremental expense related to prior years. These out-of-period corrections had no impact on cash or debt covenants compliance. Management believes these out-of-period corrections are not material to the current period financial statements or any previously issued financial statements.
The fourth quarter of 2013 was positively impacted by an agreement with a reseller for product sales in private, parochial, and charter school markets. The net effect of reseller activity was a decrease in net sales of $62.6 million for the fourth quarter of 2014 as compared to the same period in 2013.
108
Table of Contents
Item 9. Changes in and Disagreements with Accountants on Accounting and Financial Disclosure
None.
Item 9A. Controls and Procedures
Evaluation of Disclosure Controls and Procedures
We carried out an evaluation, under the supervision and with the participation of our management, including our Chief Executive Officer and Chief Financial Officer, of the effectiveness of our disclosure controls and procedures, as defined in Rules 13a-15(e) and 15d-15(e) of the Securities Exchange Act of 1934 (as amended, the “Exchange Act”). Based on that evaluation, our Chief Executive Officer and Chief Financial Officer have concluded that our disclosure controls and procedures as of December 31, 2014 were effective to provide reasonable assurance that information required to be disclosed by us in reports that we file or submit under the Exchange Act is recorded, processed, summarized and reported within the time periods specified in the SEC’s rules and forms and the information required to be disclosed by us is accumulated and communicated to our management, including our Chief Executive Officer and Chief Financial Officer, to allow timely decisions regarding required disclosure.
In designing and evaluating the disclosure controls and procedures, management recognizes that any controls and procedures, no matter how well designed and operated, can provide only reasonable assurance of achieving the desired control objectives. In addition, the design of disclosure controls and procedures must reflect the fact that there are resource constraints and that management is required to apply judgment in evaluating the benefits of possible controls and procedures relative to their costs.
Management’s Report on Internal Control over Financial Reporting
Management of the Company is responsible for establishing and maintaining adequate internal control over financial reporting as defined in Rules 13a-15(f) or 15d-15(f) promulgated under the Securities Exchange Act of 1934. Internal control over financial reporting is a process designed to provide reasonable assurance regarding the reliability of financial reporting and the preparation of financial statements for external purposes in accordance with generally accepted accounting principles and includes those policies and procedures that:
| • | Pertain to the maintenance of records that, in reasonable detail, accurately and fairly reflect the transactions and disposition of the assets of the Company; |
| • | Provide reasonable assurance that transactions are recorded as necessary to permit preparation of financial statements in accordance with generally accepted accounting principles, and that receipts and expenditures of the Company are being made only in accordance with authorizations of management and directors of the Company; and |
| • | Provide reasonable assurance regarding prevention or timely detection of unauthorized acquisition, use or dispositions of the Company’s assets that could have a material effect on the financial statements. |
Because of its inherent limitations, internal control over financial reporting may not prevent or detect misstatements. Also, projections of any evaluation of effectiveness to future periods are subject to the risk that controls may become inadequate because of changes in conditions, or that the degree of compliance with the policies or procedures may deteriorate.
The Company’s management assessed the effectiveness of the Company’s internal control over financial reporting as of December 31, 2014. In making this assessment, the Company’s management used the criteria established in Internal Control-Integrated Framework (2013) issued by the Committee of Sponsoring Organizations of the Treadway Commission (COSO).
Based on our assessment and those criteria, management concluded that, as of December 31, 2014, the Company’s internal control over financial reporting was effective.
109
Table of Contents
The effectiveness of the Company’s internal control over financial reporting as of December 31, 2014 has been audited by PricewaterhouseCoopers LLP, an independent registered public accounting firm, as stated in their report which appears herein in Item 8 of this Annual Report.
Changes in Internal Control Over Financial Reporting
There were no changes in our internal control over financial reporting in the quarter ended December 31, 2014 that materially affected, or are reasonably likely to materially affect, our internal control over financial reporting.
None.
Item 10. Directors, Executive Officers and Corporate Governance
Except to the extent provided below, the information required by this Item shall be set forth in our Proxy Statement for our 2015 Annual Meeting of Stockholders, to be filed with the SEC within 120 days of December 31, 2014, and is incorporated into this Annual Report by reference.
We have adopted a Code of Conduct that applies to our principal executive officer, principal financial officer and principal accounting officer or any person performing similar functions, which we post on our website in the “Corporate Governance” link located at: ir.hmhco.com. We intend to publish any amendment to, or waiver from, the Code of Conduct on our website. We will provide any person, without charge, a copy of such Code of Conduct upon written request, which may be mailed to 222 Berkeley Street, Boston, MA 02116, Attn: Corporate Secretary.
Item 11. Executive Compensation
The information required by this Item shall be set forth in our Proxy Statement for our 2015 Annual Meeting of Stockholders to be filed with the SEC within 120 days of December 31, 2014, and is incorporated into this Annual Report by reference.
Item 12. Security Ownership of Certain Beneficial Owners and Management and Related Stockholders Matters
The information required by this Item shall be set forth in our Proxy Statement for our 2015 Annual Meeting of Stockholders to be filed with the SEC within 120 days of December 31, 2014, and is incorporated into this Annual Report by reference.
Item 13. Certain Relationships and Related Transactions
The information required by this Item shall be set forth in our Proxy Statement for our 2015 Annual Meeting of Stockholders to be filed with the SEC within 120 days of December 31, 2014, and is incorporated into this Annual Report by reference.
Item 14. Principal Accounting Fees and Services
The information required by this Item shall be set forth in our Proxy Statement for our 2015 Annual Meeting of Stockholders to be filed with the SEC within 120 days of December 31, 2014, and is incorporated into this Annual Report by reference.
110
Table of Contents
Item 15. Exhibits, Financial Statement Schedules
(a) Documents filed as part of the report.
| (1) Consolidated Financial Statements |
||||
| 60 | ||||
| Consolidated Balance Sheets as of December 31, 2014 and 2013 |
61 | |||
| Consolidated Statements of Operations for the years ended December 31, 2014, 2013 and 2012 |
62 | |||
| Consolidated Statements of Comprehensive Loss for the years ended December 31, 2014, 2013 and 2012 |
63 | |||
| Consolidated Statements of Cash Flows for the years ended December 31, 2014, 2013 and 2012 |
64 | |||
| Consolidated Statements of Stockholders’ Equity for the years ended December 31, 2014, 2013 and 2012 |
65 | |||
| 66 | ||||
| (2) Financial Statement Schedules. |
||||
| Schedule II—“Valuation and Qualifying Accounts” is included herein as Note 17 in the Notes to Consolidated Financial Statements. |
||||
| 112 | ||||
| See the Exhibit Index. |
111
Table of Contents
| Exhibit |
Description | |
| 2.1 | Prepackaged Joint Plan of Reorganization of the Debtors Under Chapter 11 of the Bankruptcy Code by and among Houghton Mifflin Harcourt Publishing Company, Houghton Mifflin Harcourt Publishers Inc., HMH Publishers, LLC, Houghton Mifflin Holding Company, Inc., Houghton Mifflin, LLC, Houghton Mifflin Finance, Inc., Houghton Mifflin Holdings, Inc., HM Publishing Corp., Riverdeep Inc., A Limited Liability Company, Broderbund LLC, RVDP, Inc., HRW Distributors, Inc., Greenwood Publishing Group, Inc., Classroom Connect, Inc., Achieve! Data Solutions, LLC, Steck-Vaughn Publishing LLC, HMH Supplemental Publishers Inc., HMH Holdings (Delaware), Inc., Sentry Realty Corporation, Houghton Mifflin Company International, Inc., The Riverside Publishing Company, Classwell Learning Group Inc., Cognitive Concepts, Inc., Edusoft And Advanced Learning Centers, Inc. (incorporated herein by reference to Exhibit No. 2.1 to Amendment No. 1 to the Company’s Registration Statement on Form S-1, filed September 13, 2013 (File No. 333-190356)). | |
| 3.1 | Amended and Restated Certificate of Incorporation (incorporated herein by reference to Exhibit No. 3.1 to Amendment No. 4 to the Company’s Registration Statement on Form S-1, filed October 25, 2013 (File No. 333-190356)). | |
| 3.2 | Certificate of Amendment to Amended and Restated Certificate of Incorporation (incorporated herein by reference to Exhibit No. 3.2 to Amendment No. 4 to the Company’s Registration Statement on Form S-1, filed October 25, 2013 (File No. 333-190356)). | |
| 3.3 | Amended and Restated By-laws (incorporated herein by reference to Exhibit No. 3.1 to the Company’s Current Report on Form 8-K, filed November 19, 2013 (File No. 001-36166)). | |
| 4.1 | Investor Rights Agreement, dated as of June 22, 2012, by and among HMH Holdings (Delaware), Inc. and the stockholders party thereto (incorporated herein by reference to Exhibit No. 4.1 to Amendment No. 1 to the Company’s Registration Statement on Form S-1, filed September 13, 2013 (File No. 333-190356)). | |
| 4.2 | Amended and Restated Director Nomination Agreement, dated as of August 2, 2013, by and among the Company, Paulson Advantage Master Ltd., Paulson Advantage Plus Master Ltd., Paulson Advantage Select Master Fund Ltd., Paulson Credit Opportunities Master Ltd. and PP Opportunities Ltd. (incorporated herein by reference to Exhibit No. 4.2 to Amendment No. 1 to the Company’s Registration Statement on Form S-1, filed September 13, 2013 (File No. 333-190356)). | |
| 4.3 | Specimen Common Stock Certificate (incorporated herein by reference to Exhibit No. 4.3 to Amendment No. 4 to the Company’s Registration Statement on Form S-1, filed October 25, 2013 (File No. 333-190356)). | |
| 4.4 | Form of Warrant Certificate (incorporated herein by reference to Exhibit No. 4.4 to Amendment No. 2 to the Company’s Registration Statement on Form S-1, filed October 4, 2013 (File No. 333-190356)). | |
| 4.5 | Warrant Agreement, dated as of June 22, 2012, among HMH Holdings (Delaware), Inc., Computershare Inc. and Computershare Trust Company, N.A. (incorporated herein by reference to Exhibit No. 4.5 to Amendment No. 2 to the Company’s Registration Statement on Form S-1, filed October 4, 2013 (File No. 333-190356)). | |
| 10.1† | HMH Holdings (Delaware), Inc. 2012 Management Incentive Plan (incorporated herein by reference to Exhibit No. 10.1 to Amendment No. 1 to the Company’s Registration Statement on Form S-1, filed September 13, 2013 (File No. 333-190356)). | |
| 10.2† | HMH Holdings (Delaware), Inc. 2012 Management Incentive Plan Form of Stock Option Award Notice (incorporated herein by reference to Exhibit No. 10.2 to Amendment No. 1 to the Company’s Registration Statement on Form S-1, filed September 13, 2013 (File No. 333-190356)). | |
112
Table of Contents
| Exhibit |
Description | |
| 10.3† | HMH Holdings (Delaware), Inc. 2012 Management Incentive Plan Form of Restricted Stock Unit Award Notice (incorporated herein by reference to Exhibit No. 10.3 to Amendment No. 1 to the Company’s Registration Statement on Form S-1, filed September 13, 2013 (File No. 333-190356)). | |
| 10.4† | HMH Holdings (Delaware), Inc. 2012 Management Incentive Plan Form of Non-Employee Grantee Restricted Stock Unit Award Notice (incorporated herein by reference to Exhibit No. 10.4 to Amendment No. 1 to the Company’s Registration Statement on Form S-1, filed September 13, 2013 (File No. 333-190356)). | |
| 10.5† | HMH Holdings (Delaware), Inc. Change in Control Severance Plan (incorporated herein by reference to Exhibit No. 10.5 to Amendment No. 1 to the Company’s Registration Statement on Form S-1, filed September 13, 2013 (File No. 333-190356)). | |
| 10.6† | Employment Agreement, effective as of August 1, 2013, by and between HMH Holdings (Delaware), Inc. and Linda K. Zecher (incorporated herein by reference to Exhibit No. 10.6 to Amendment No. 1 to the Company’s Registration Statement on Form S-1, filed September 13, 2013 (File No. 333-190356)). | |
| 10.7† | Employment Agreement, effective as of August 1, 2013, by and between HMH Holdings (Delaware), Inc. and Eric L. Shuman (incorporated herein by reference to Exhibit No. 10.7 to Amendment No. 1 to the Company’s Registration Statement on Form S-1, filed September 13, 2013 (File No. 333-190356)). | |
| 10.8† | John Dragoon Offer Letter dated March 27, 2012 (incorporated herein by reference to Exhibit No. 10.8 to Amendment No. 1 to the Company’s Registration Statement on Form S-1, filed September 13, 2013 (File No. 333-190356)). | |
| 10.9† | William Bayers Offer Letter dated April 10, 2007, as amended on May 14, 2009 (incorporated herein by reference to Exhibit No. 10.9 to Amendment No. 1 to the Company’s Registration Statement on Form S-1, filed September 13, 2013 (File No. 333-190356)). | |
| 10.11† | Form of Director Compensation Letter (incorporated herein by reference to Exhibit No. 10.11 to Amendment No. 1 to the Company’s Registration Statement on Form S-1, filed September 13, 2013 (File No. 333-190356)). | |
| 10.12† | Form of Indemnification Agreement (incorporated herein by reference to Exhibit No. 10.12 to Amendment No. 1 to the Company’s Registration Statement on Form S-1, filed September 13, 2013 (File No. 333-190356)). | |
| 10.13 | Superpriority Senior Secured Debtor-in-Possession and Exit Term Loan Credit Agreement, dated as of May 22, 2012 by and among HMH Holdings (Delaware), Inc. as Holdings, Houghton Mifflin Harcourt Publishers Inc., HMH Publishers, LLC, and Houghton Mifflin Harcourt Publishing Company as Borrowers, the subsidiary guarantors and lenders party thereto, and Citibank, N.A. as Administrative Agent and Collateral Agent (incorporated herein by reference to Exhibit No. 10.13 to Amendment No. 1 to the Company’s Registration Statement on Form S-1, filed September 13, 2013 (File No. 333-190356)). | |
| 10.14 | First Amendment to DIP/Exit Term Loan Credit Agreement, dated as of June 11, 2012, by and among HMH Holdings (Delaware), Inc., Houghton Mifflin Harcourt Publishers Inc., HMH Publishers, LLC, and Houghton Mifflin Harcourt Publishing Company, the subsidiary guarantors and lenders party thereto, and Citibank, N.A. as Administrative Agent and Collateral Agent (incorporated herein by reference to Exhibit No. 10.14 to Amendment No. 1 to the Company’s Registration Statement on Form S-1, filed September 13, 2013 (File No. 333-190356)). | |
113
Table of Contents
| Exhibit |
Description | |
| 10.15 | Letter Waiver and Amendment No. 2 to Credit Agreement, dated as of June 20, 2012, by and among HMH Holdings (Delaware), Inc., Houghton Mifflin Harcourt Publishers Inc., HMH Publishers, LLC, and Houghton Mifflin Harcourt Publishing Company, the subsidiary guarantors thereto, and Citibank, N.A. as a lender (incorporated herein by reference to Exhibit No. 10.15 to Amendment No. 1 to the Company’s Registration Statement on Form S-1, filed September 13, 2013 (File No. 333-190356)). | |
| 10.16 | Term Facility Guarantee and Collateral Agreement, dated as of May 22, 2012, by and among the Company and HMH Holdings (Delaware), Inc., Houghton Mifflin Harcourt Publishers Inc., HMH Publishers, LLC, and Houghton Mifflin Harcourt Publishing Company, the subsidiaries of HMH Holdings (Delaware), Inc. from time to time party thereto, and Citibank, N.A. as Collateral Agent. (incorporated herein by reference to Exhibit No. 10.16 to Amendment No. 1 to the Company’s Registration Statement on Form S-1, filed September 13, 2013 (File No. 333-190356)). | |
| 10.17 | Amendment No. 3 to Superpriority Senior Secured Debtor-in-Possession and Exit Term Loan Credit Agreement, and Amendment No. 1 to Term Facility Guarantee and Collateral Agreement, dated as of May 24, 2013, by and among HMH Holdings (Delaware), Inc., Houghton Mifflin Harcourt Publishers Inc., HMH Publishers, LLC, and Houghton Mifflin Harcourt Publishing Company, the subsidiary guarantors and lenders party thereto, and Citibank, N.A. as Administrative Agent and Collateral Agent (incorporated herein by reference to Exhibit No. 10.17 to Amendment No. 1 to the Company’s Registration Statement on Form S-1, filed September 13, 2013 (File No. 333-190356)). | |
| 10.18 | Superpriority Senior Secured Debtor-in-Possession and Exit Revolving Loan Credit Agreement, dated as of May 22, 2012, by and among HMH Holdings (Delaware), Inc. as Holdings, Houghton Mifflin Harcourt Publishers Inc., HMH Publishers, LLC, and Houghton Mifflin Harcourt Publishing Company as Borrowers, the subsidiary guarantors and lenders party thereto, and Citibank, N.A. as Administrative Agent and Collateral Agent (incorporated herein by reference to Exhibit No. 10.18 to Amendment No. 1 to the Company’s Registration Statement on Form S-1, filed September 13, 2013 (File No. 333-190356)). | |
| 10.19 | First Amendment to DIP/Exit Revolving Loan Credit Agreement, dated as of June 20, 2012, by and among HMH Holdings (Delaware), Inc., Houghton Mifflin Harcourt Publishers Inc., HMH Publishers, LLC, and Houghton Mifflin Harcourt Publishing Company, the subsidiary guarantors and lenders party thereto, and Citibank, N.A. as Administrative Agent and Collateral Agent (incorporated herein by reference to Exhibit No. 10.19 to Amendment No. 1 to the Company’s Registration Statement on Form S-1, filed September 13, 2013 (File No. 333-190356)). | |
| 10.20 | Second Amendment to DIP/Exit Revolving Loan Credit Agreement, dated as of June 20, 2012, by and among HMH Holdings (Delaware), Inc., Houghton Mifflin Harcourt Publishers Inc., HMH Publishers, LLC, and Houghton Mifflin Harcourt Publishing Company, the subsidiary guarantors and lenders party thereto, and Citibank, N.A. as Administrative Agent and Collateral Agent (incorporated herein by reference to Exhibit No. 10.20 to Amendment No. 1 to the Company’s Registration Statement on Form S-1, filed September 13, 2013 (File No. 333-190356)). | |
| 10.21 | Revolving Facility Guarantee and Collateral Agreement, dated as of May 22, 2012, by and among HMH Holdings (Delaware), Inc., Houghton Mifflin Harcourt Publishers Inc., HMH Publishers, LLC, and Houghton Mifflin Harcourt Publishing Company, the subsidiaries of HMH Holdings (Delaware), Inc. from time to time party thereto, and Citibank, N.A. as Collateral Agent (incorporated herein by reference to Exhibit No. 10.21 to Amendment No. 1 to the Company’s Registration Statement on Form S-1, filed September 13, 2013 (File No. 333-190356)). | |
| 10.22 | Term Loan/Revolving Facility Lien Subordination and Intercreditor Agreement, dated as of May 22, 2012, by and among Citibank, N.A., as Revolving Facility Agent, and Citibank, N.A., as Term Facility Agent, HMH Holdings (Delaware), Inc. as Holdings, Houghton Mifflin Harcourt Publishers Inc., HMH Publishers, LLC, and Houghton Mifflin Harcourt Publishing Company as Borrowers, and the subsidiary guarantors named therein (incorporated herein by reference to Exhibit No. 10.22 to Amendment No. 1 to the Company’s Registration Statement on Form S-1, filed September 13, 2013 (File No. 333-190356)). | |
114
Table of Contents
| Exhibit |
Description | |
| 10.23 | Amendment No. 4 to the Superpriority Senior Secured Debtor-In-Possession and Exit Term Loan Credit Agreement, dated as of January 15, 2014, by and among Houghton Mifflin Harcourt Company, Houghton Mifflin Harcourt Publishers Inc., HMH Publishers LLC, Houghton Mifflin Harcourt Publishing Company, certain other subsidiaries of Houghton Mifflin Harcourt Company, as Subsidiary Guarantors, the lenders party thereto and Citibank, N.A., as administrative agent and collateral agent (incorporated herein by reference to Exhibit No. 10.1 to the Company’s Current Report on Form 8-K, filed January 16, 2014 (File No. 001-36166)). | |
| 10.24† | HMH Holdings (Delaware), Inc. 2012 Management Incentive Plan Form of Restricted Stock Unit Award Notice (incorporated herein by reference to Exhibit No. 10.1 to the Company’s Current Report on Form 8-K, filed February 6, 2014 (File No. 001-36166)). | |
| 10.25† | HMH Holdings (Delaware), Inc. 2012 Management Incentive Plan Restricted Stock Unit Award Notice, dated January 31, 2014, by and between Houghton Mifflin Harcourt Company and Eric Shuman (incorporated herein by reference to Exhibit No. 10.2 to the Company’s Current Report on Form 8-K, filed February 6, 2014 (File No. 001-36166)). | |
| 10.26† | HMH Holdings (Delaware), Inc. 2012 Management Incentive Plan Restricted Stock Unit Award Notice, dated January 31, 2014, by and between Houghton Mifflin Harcourt Company and William F. Bayers (incorporated herein by reference to Exhibit No. 10.3 to the Company’s Current Report on Form 8-K, filed February 6, 2014 (File No. 001-36166)). | |
| 10.27† | HMH Holdings (Delaware), Inc. 2012 Management Incentive Plan Restricted Stock Unit Award Notice, dated January 31, 2014, by and between Houghton Mifflin Harcourt Company and John Dragoon (incorporated herein by reference to Exhibit No. 10.4 to the Company’s Current Report on Form 8-K, filed February 6, 2014 (File No. 001-36166)). | |
| 10.28† | Mary Cullinane Offer Letter dated October 21, 2011 (incorporated herein by reference to Exhibit No. 10.28 to the Company’s Annual Report on Form 10-K, filed March 27, 2014 (File No. 001-36166)). | |
| 10.29† | Lee R. Ramsayer Offer Letter dated January 25, 2012 (incorporated herein by reference to Exhibit No. 10.29 to the Company’s Annual Report on Form 10-K, filed March 27, 2014 (File No. 001-36166)). | |
| 10.30† | Brook M. Colangelo Offer Letter dated November 2, 2012 (incorporated herein by reference to Exhibit No. 10.30 to the Company’s Annual Report on Form 10-K, filed March 27, 2014 (File No. 001-36166)). | |
| 10.31† | Houghton Mifflin Harcourt Severance Plan, dated September 5, 2014 (incorporated herein by reference to Exhibit No. 10.01 to the Company’s Quarterly Report on Form 10-Q, filed November 6, 2014 (File No. 001-36166)). | |
| 10.32†* | Bridgett P. Paradise Offer Letter dated June 11, 2014. | |
| 10.33†* | HMH Holdings (Delaware), Inc. 2012 Management Incentive Plan Performance-Based Restricted Stock Award Notice | |
| 10.34†* | HMH Holdings (Delaware), Inc. 2012 Management Incentive Plan Performance-Based Restricted Stock Unit Award Notice | |
| 10.35†* | HMH Holdings (Delaware), Inc. 2012 Management Incentive Plan Time-Based Restricted Stock Award Notice | |
| 10.36†* | HMH Holdings (Delaware), Inc. 2012 Management Incentive Plan Time-Based Restricted Stock Unit Award Notice | |
115
Table of Contents
| Exhibit |
Description | |
| 21.1* | List of Subsidiaries of the Registrant. | |
| 23.1* | Consent of PricewaterhouseCoopers LLP, independent registered public accounting firm. | |
| 31.1* | Certification of CEO Pursuant to Rule 13a-14(a) or 15d-14(a) of the Securities Exchange Act of 1934, as Adopted Pursuant to Section 302 of the Sarbanes-Oxley Act of 2002. | |
| 31.2* | Certification of CFO Pursuant to Rule 13a-14(a) or 15d-14(a) of the Securities Exchange Act of 1934, as Adopted Pursuant to Section 302 of the Sarbanes-Oxley Act of 2002. | |
| 32.1** | Certification of CEO Pursuant to 18 U.S.C. Section 1350, as Adopted Pursuant to Section 906 of the Sarbanes-Oxley Act of 2002. | |
| 32.2** | Certification of CFO Pursuant to 18 U.S.C. Section 1350, as Adopted Pursuant to Section 906 of the Sarbanes-Oxley Act of 2002. | |
| 101.INS* | XBRL Instance Document. | |
| 101.SCH* | XBRL Taxonomy Extension Schema Document. | |
| 101.CAL* | XBRL Taxonomy Extension Calculation Linkbase Document. | |
| 101.DEF* | XBRL Taxonomy Extension Definition Linkbase Document. | |
| 101.LAB* | XBRL Taxonomy Extension Label Linkbase Document. | |
| 101.PRE* | XBRL Taxonomy Extension Presentation Linkbase Document. | |
| † | Identifies a management contract or compensatory plan or arrangement. |
| * | Filed herewith |
| ** | This certification shall not be deemed “filed” for the purposes of Section 18 of the Securities Exchange Act of 1934 or otherwise subject to the liabilities under that section. Furthermore, this certification shall not be deemed to be incorporated by reference into the filings of the Company under the Securities Act of 1933 or the Securities Exchange Act of 1934, regardless of any general incorporation language in such filing. |
116
Table of Contents
Pursuant to the requirements of Section 13 or 15(d) of the Securities Exchange Act of 1934, the registrant has duly caused this report to be signed on its behalf by the undersigned, thereunto duly authorized.
| Houghton Mifflin Harcourt Company (Registrant) | ||
| By: | /s/ Linda K. Zecher | |
| Linda K. Zecher | ||
| President, Chief Executive Officer | ||
| (On behalf of the registrant) | ||
February 26, 2015
Pursuant to the requirements of the Securities Exchange Act of 1934, this report has been signed below by the following persons on behalf of the registrant and in the capacities and on the dates indicated.
| Signature | Title | Date | ||
| /s/ Linda K. Zecher Linda K. Zecher |
President, Chief Executive Officer (Principal Executive Officer) and Director |
February 26, 2015 | ||
| /s/ Eric L. Shuman Eric L. Shuman |
Executive Vice President and Chief Financial Officer (Principal Financial Officer) |
February 26, 2015 | ||
| /s/ Michael J. Dolan Michael J. Dolan |
Senior Vice President and Corporate Controller (Principal Accounting Officer) |
February 26, 2015 | ||
| /s/ Lawrence K. Fish Lawrence K. Fish |
Chairman of the Board of Directors | February 26, 2015 | ||
| /s/ Sheru Chowdhry Sheru Chowdhry |
Director | February 26, 2015 | ||
| /s/ L. Gordon Crovitz L. Gordon Crovitz |
Director | February 26, 2015 | ||
| /s/ Jill A. Greenthal Jill A. Greenthal |
Director | February 26, 2015 | ||
| /s/ John F. Killian John F. Killian |
Director | February 26, 2015 | ||
| /s/ John R. McKernan, Jr. John R. McKernan, Jr. |
Director | February 26, 2015 | ||
| /s/ Jonathan F. Miller Jonathan F. Miller |
Director | February 26, 2015 | ||
| /s/ E. Rogers Novak, Jr. E. Rogers Novak, Jr. |
Director | February 26, 2015 | ||
117