Attached files
| file | filename |
|---|---|
| EX-31.1 - CERTIFICATION - GASE ENERGY, INC. | f10k2013a1ex31i_gaseenergy.htm |
| EX-32.1 - CERTIFICATION - GASE ENERGY, INC. | f10k2013a1ex32i_gaseenergy.htm |
| EXCEL - IDEA: XBRL DOCUMENT - GASE ENERGY, INC. | Financial_Report.xls |
| 10-K/A - AMENDMENT NO 1 TO ANNUAL REPORT - GASE ENERGY, INC. | f10k2013a1_gaseenergy.htm |
Exhibit 10.8
Great
East Energy Inc.
DISCLOSURE OF OIL AND GAS OPERATIONS
for
Lysychansko-Toshkivskay Project
Located in
the Donetsk Basin
SOUTHEASTERN UKRAINE
EFFECTIVE JANUARY 1, 2014
PREPARED
OCTOBER 20, 2014
REVISED DECEMBER 31, 2014
by B.L. Whelan, P. Geo.
Great East, Lysychansko-Toshkivskay, Ukraine, NI51-101, 2014
| TABLE OF CONTENTS | ||
| 1.0 | AUTHORIZATION | 7 |
| 2.0 | PURPOSE | 7 |
| 3.0 | DEFINITIONS | 7 |
| 4.0 | PRODUCT PRICES | 8 |
| 5.0 | SUBSOIL FEE (ROYALTY) | 8 |
| 6.0 | CAPITAL EXPENDITURES AND OPERATING COSTS | 8 |
| 7.0 | ABANDONMENT AND RESTORATION | 8 |
| 8.0 | ABBREVIATIONS AND CONVERSIONS | 8 |
| 9.0 | INTRODUCTION | 12 |
| 10.0 | EXECUTIVE SUMMARY | 13 |
| 11.0 | NATURAL GAS RESOURCES AND NET PRESENT VALUE OF FUTURE NET REVENUE | 21 |
| 11.1 | CLASSIFICATION OF RESOURCES | 21 |
| 11.2 | TOTAL FUTURE NET REVENUE (UNDISCOUNTED) BASED ON FORECAST PRICES AND COSTS WITH COST RECOVERY | 22 |
| 12.0 | PRICING ASSUMPTIONS | 22 |
| 12.1 | PRICING ASSUMPTIONS – FORECAST PRICES AND COSTS | 22 |
| 13.0 | RECONCILIATION OF COMPANY NET RESERVES BY PRINCIPAL PRODUCT TYPE BASED ON FORECAST PRICES AND COSTS | 23 |
| 14.0 | UNDEVELOPED RESOURCES | 23 |
| 14.1 | RISK AND UNCERTAINTY | 23 |
| 14.2 | PROSPECT ANALYSIS | 23 |
| 15.0 | RECONCILIATION OF CHANGES IN NET PRESENT VALUE OF FUTURE RESERVES DISCOUNTED AT 10%, FORECAST PRICES ($000) | 23 |
| 16.0 | SIGNIFICANT FACTORS OR UNCERTAINTIES AFFECTING RESOURCES DATA | 23 |
| 17.0 | OIL AND GAS PROPERTIES | 24 |
| 17.1 | GENERAL | 24 |
| 17.2 | GEOLOGY | 24 |
| 17.2.1 | DONBASS DEVELOPMENT AREA | 25 |
| 17.2.2 | LYSYCHANSKO-TOSHKIVSKAY | 25 |
| 17.3 | PRODUCTION | 29 |
| 17.4 | RESERVOIR CHARACTERISTICS | 29 |
| 18.0 | COSTS TO BE INCURRED | 29 |
| 18.1 | LEASE COSTS | 29 |
| 19.0 | EXPLORATION AND DEVELOPMENT ACTIVITIES | 29 |
| 19.1 | EXPLORATION AND DEVELOPMENT COSTS | 29 |
| 19.2 | CAPITAL COSTS | 30 |
| 19.3 | OPERATING COSTS | 30 |
| 20.0 | FORWARD CONTRACTS | 30 |
| 21.0 | ABANDONMENT AND RECLAMATION COSTS | 30 |
| 22.0 | TAX HORIZON | 30 |
| 23.0 | PRODUCTION ESTIMATES | 30 |
| 24.0 | PRODUCTION HISTORY | 30 |
| 2 |
Great East, Lysychansko-Toshkivskay, Ukraine, NI51-101, 2014
| 24.1 | AVERAGE DAILY PRODUCTION | 31 |
| 24.2 | PRICES RECEIVED, ROYALTIES PAID, PRODUCTION COSTS AND NETBACKS | 31 |
| 25.0 | PRODUCTION VOLUME BY FIELD | 31 |
| 26.0 | RECOMMENDATIONS | 31 |
| 27.0 | REFERENCES | 32 |
| 28.0 | CERTIFICATE OF QUALIFICATIONS | 33 |
| FIGURES | ||
| FIGURE 1, | RESOURCES CLASSIFICATION FRAMEWORK (SPE-PRMS, FIGURE 1.1) | |
| FIGURE 2, | LOCATION MAP | |
| FIGURE 3, | LOCATION MAP | |
| FIGURE 4, | PERMIT OUTLINE WITH DOMAL STRUCTURES | |
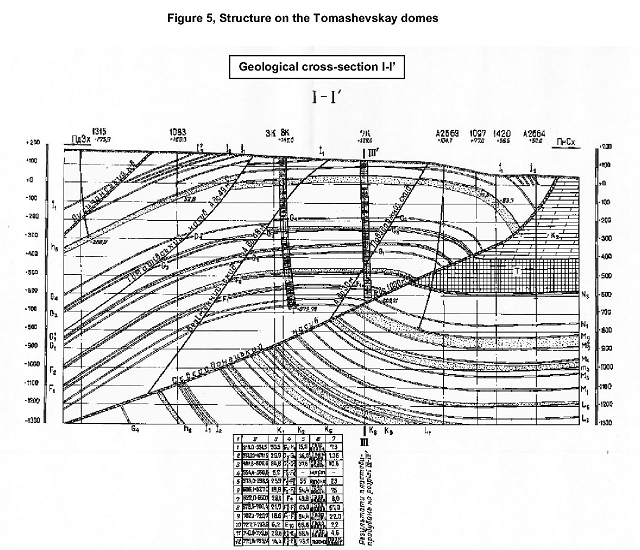
| FIGURE 5, | STRUCTURE ON THE TOMASHEVSKAY DOMES | |
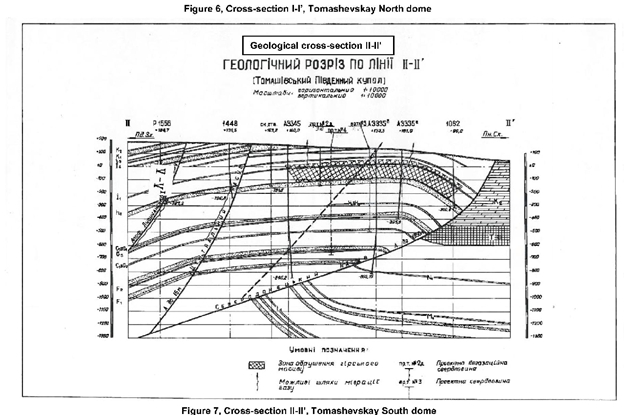
| FIGURE 6, | CROSS-SECTION I-I’, TOMASHEVSKAY NORTH DOME | |
| FIGURE 7, | CROSS-SECTION II-II’, TOMASHEVSKAY SOUTH DOME | |
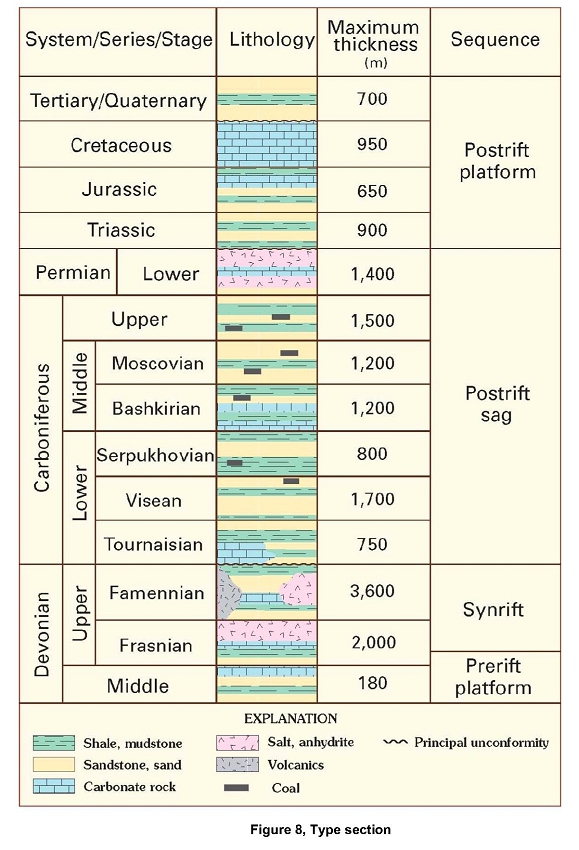
| FIGURE 8, | TYPE SECTION | |
| FIGURE 9, | CHRONO- AND LITHOSTRIGRAPHY OF THE DONBAS FOLD | |
| BELT
SHOWING THE DISTRIBUTION OF SOURCE ROCKS, POTENTIAL RESERVOIRS, SEALING BEDS AND ERODED FORMATIONS IN THE STUDY AREA. MAJOR MAGMATIC AND TECTONIC EVENTS ARE ALSO SHOWN | ||
| TABLES | ||
| TABLE 1, | PRODUCT PRICES | |
| TABLE 2, | TOMASHEVSKOYA SOUTH DOME INPUT PARAMETERS | |
| TABLE 3, | VOLUMETRIC ESTIMATES LYSYCHANSK-TOSHKIVSKAY LICENSE | |
| TABLE 4, | SUMMARY OF RESERVES | |
| TABLE 5, | ACREAGE AND WELLS | |
| TABLE 6, | UKRAINE LICENSE | |
| TABLE 7, | LICENSE COORDINATES | |
| TABLE 8, | DOMAL STRUCTURES | |
| TABLE 9, | PRESENT VALUES OF CURRENT PRODUCTION, CONSTANT PRICE | |
| TABLE 10, | PRESENT VALUE CASES FOR SINGLE NEW WELL | |
| TABLE 11, | PRESENT VALUES CASES FOR DEVELOPMENT/EXPLORATION PROGRAM (AFTER TAXES) | |
| TABLE 12, | TOTAL FUTURE NET REVENUE (UNDISCOUNTED) BASED ON FORECAST PRICES AND COSTS WITH COST RECOVERY, SINGLE WELL | |
| TABLE 13, | FUTURE
NET REVENUE BY PRODUCTION GROUP BASED ON FORECAST PRICES AND COSTS WITH COST RECOVERY, DEVELOPMENT/EXPLORATION PROGRAM | |
| 3 |
Great East, Lysychansko-Toshkivskay, Ukraine, NI51-101, 2014
| TABLE 14, | SALES PRICES | |
| TABLE 15, | GENERAL INFORMATION, TOSHKIVSKAY MINE | |
| TABLE 16, | COAL METHANE LIBERATED AT DECONTAMINATION, TOSHKIVSKAY MINE | |
| TABLE 17, | SCHEDULE OF EXPLORATION AND DEVELOPMENT | |
| TABLE 18, | PRODUCTION HISTORY | |
| APPENDIX | ||
| CHART 1, | ANNUAL PRODUCTION | |
| TABLE 19, | FORECAST CASH FLOW, SINGLE WELL, 250 Mcfd | |
| TABLE 20, | FORECAST CASH FLOW, CURRENT PRODUCTION A3555a | |
| TABLE 21, | FORECAST CASH FLOW, CURRENT PRODUCTION 11K | |
| TABLE 22, | FORECAST CASH FLOW, COMBINED CURRENT PRODUCTION | |
| TABLE 23, | FORECAST CASH FLOW, CONSTANT PRICE, SEQUENTIAL DRILL PROGRAM, COST RECOVERY | |
| TABLE 24, | FORECAST CASH FLOW, CONSTANT PRICE, NO COST RECOVERY | |
| TABLE 25, | FORECAST CASH FLOW, ESCALATED PRICE, STAGGERED DRILL PROGRAM, COST RECOVERY | |
| TABLE 26, | FORECAST CASH FLOW, ESCALATED PRICE, NO COST RECOVERY | |
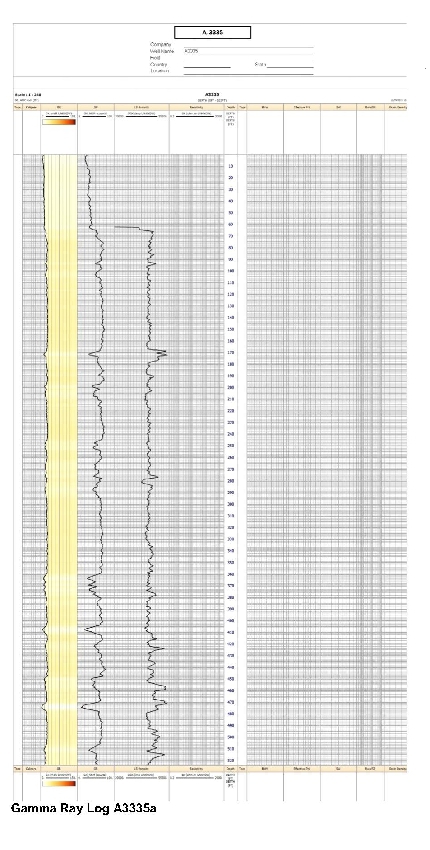
| GAMMA RAY ELECTRIC LOG, A3335 | ||
| 4 |
Great East, Lysychansko-Toshkivskay, Ukraine, N151-101, 2014
Barry l. Whelan, P. GEO.
Suite
1290, 625 Howe Street, Vancouver, B.C. V6C 2T6
Phone: (604)-259-2525: Fax: 604-674-5113
e-mail: blwhelan@gmail.com
October 20, 2014
Great
East Energy Inc.
173 Keith St., Suite 300
Warrenton, VA 20186
USA
Attention:
Dear Sir:
| Re: | Evaluation
of Resources – Great East Energy Inc. Lysychansko-Toshkivskay Project, Ukraine, |
In accordance with your authorization, we have performed an evaluation of the resources on the Lysychansk-Toshkivskay project in the Ukraine for Great East Energy Inc. (the “Company”), in order to determine the feasibility of the Company’s geological investigations and potential industrial development of resources within the area under the terms proposed and the value of the resources after consideration of risk. This evaluation has been conducted utilizing forecast prices and costs.
Our analysis has included a review of the available technical data including the geological and geophysical interpretation presented by the Company, the proposed financial terms under which the Company shall operate, information from wells within the area, and the proposed program for any prospects and the expenditures anticipated. We have reviewed this material with respect to the estimated resources and productivity that would be expected from a successful program, the anticipated capital costs, the average operating costs in the area and the expected product prices. We have considered the availability of product markets and pipelines within the area.
In forming our opinion of the prospects we have relied to considerable extent on the information provided by the Company, which together with our independent analysis and judgment was sufficient for us to establish the nature of the prospects and risks involved.
An economic analysis has been performed for the Company’s interest position. This analysis has been utilized for formulating and supporting our recommendation on the project and the values do not necessarily infer “fair market value” of these resources. All monetary units in this report are US dollars.
Based on our analysis, after consideration of risk, we have concluded that the potential of the prospects is of sufficient merit to justify the work program being proposed, and we therefore recommend and support the Company’s planned activities.
All data gathered and calculations created in support of this report are stored in our files and can be made available or presented upon request. We reserve the right to make revisions to this report in light of additional information made available or which becomes known subsequent to the preparation this report. Due to the risks involved in oil and gas exploration, our assessment of the project cannot be considered a guarantee that any wells drilled will be successful.
Prior to public disclosure of any information contained in the report, or our name as author, our written consent must be obtained, as to the information being disclosed and the manner in which it is presented. This report may not be reproduced, distributed or made available for use by any other party without out written consent and may not be reproduced for distribution at any time without the complete report, unless otherwise reviewed and approved by us.
| 5 |
Great East, Lysychansko-Toshkivskay, Ukraine, N151-101, 2014
We consent to the submission of this report, in its entirety, to securities regulatory agencies and stock exchanges, by the Company.
Very truly yours,

Barry L. Whelan, P. Geo.
| 6 |
Great East, Lysychansko-Toshkivskay, Ukraine, N151-101, 2014
SCOPE OF REPORT
| 1.0 | AUTHORIZATION |
This report has been authorized by Mr. Timur Khromaev on behalf of Great East Energy Inc. The technical analysis of this project has been performed during the months of August and November 2013 and a revision was performed in October, 2014 to bring the report current to January 1, 2014.
| 2.0 | PURPOSE |
The purpose of this report was to independently determine the economic feasibility of the Company undertaking the exploration and industrial development of the resources in the Lysychansko-Toshkivskay area of Ukraine, determine the magnitude of the resources and their economic value.
| 3.0 | DEFINITIONS |
The following definitions are derived from of the United States Securities and Exchange Commission Rule 4-10 of Regulation S-X Part 210.
RESERVES are estimated remaining quantities of oil and natural gas and related substances anticipated to be economically, as of a given date, by application of development projects to known accumulations. In addition, there must exist, or there must be a reasonable expectation that there will exist, the legal right to produce or a revenue interest in the production, installed means of delivering oil and gas or related substances to market, and all permits and financing required to implement the project. Reserves are further classified according to the level of certainty associated with the estimates and may be sub classified based on development and production status.
PROVED RESERVES. Proved oil and gas reserves are those quantities of oil or gas, which, by analysis of geoscience and engineering data, can be estimated with reasonable certainty to be economically producible – from a given date forward, from known reservoirs, and under existing economic condition, operating methods, and government regulations – prior to the time at which contracts providing the right to operate expire, unless evidence indicates that renewal is reasonably certain, regardless of whether deterministic or probabilistic methods were used for the estimation. The project to extract the hydrocarbons must have commenced or the operator must be reasonably certain that it will commence the project within a reasonable time.
PRODUCTION is the cumulative quantity of petroleum that has been recovered at a given date.
| 7 |
Great East, Lysychansko-Toshkivskay, Ukraine, N151-101, 2014
| 4.0 | PRODUCT PRICES |
The product prices were derived from the current (December 2013) sales price for gas within Ukraine and escalated the price at 1.5% per year in subsequent years.
Table 1, Product Prices
| Year Forecast |
Natural Gas, ($US/Mcf) | |
| Constant Price | Forecast Price | |
| 1 | $10.97 | $10.97 |
| 2 | $10.97 | $11.19 |
| 3 | $10.97 | $11.41 |
| 4 | $10.97 | $11.64 |
| 5 | $10.97 | $11.87 |
| 6 | $10.97 | $12.11 |
| 7 | $10.97 | $12.35 |
| 8 | $10.97 | $12.60 |
| 9 | $10.97 | $12.85 |
| 10 | $10.97 | $13.11 |
| Thereafter escalated at 2% per year | ||
| 5.0 | SUBSOIL FEE (ROYALTY) |
Production is subject to a subsoil fee (royalty) of 25%.
| 6.0 | CAPITAL EXPENDITURES AND OPERATING COSTS |
Capital expenditures have been based on the proposed exploration and development program (Table 17). Operating costs for gas wells are estimated at $500/month/well.
| 7.0 | ABANDONMENT AND RESTORATION |
Abandonment and restoration costs have not been taken into account in the cash flows as there is no history upon which to base the costs.
| 8.0 | ABBREVIATIONS AND CONVERSIONS |
In this document, the abbreviations set forth below have the following meanings:
| Oil, Natural Gas Liquids and Natural Gas | |||
| atm | atmospheres | Co/100m | degrees Celsius per 100 meters |
| m3/tonne | cubic meters per tonne | mD | MilliDarcy 10-3 Darcy |
| MPa | MegaPascal 106 Pascal | CBM | Coalbed methane |
| Bcf | billion cubic feet | Gt | gigatonnes (tonnes x 109) |
| Bm3 | billion cubic meters | Mcf | thousand cubic feet |
| bbl | barrel | MMcf | million cubic feet |
| bbls | barrels | Mcfd | thousand cubic feet per day |
| Mbbls | thousands of barrels | MMcfd | million cubic feet per day |
| MMbbls | million barrels | MMt | million tonnes |
| Mstb | 1,000 stock tank barrels | bopd | barrels of oil per day |
| Bcf | billion cubic feet | stb | stock tank barrels |
| GJ | gigajoule | GIIP | Gas Initially In Place |
| PPIP | Petroleum Initially In Place | $000s | thousands of dollars |
| m3 | cubic meters | Mm3 | thousand cubic meters |
| MMm3 | million cubic meters | ||
| 8 |
Great East, Lysychansko-Toshkivskay, Ukraine, N151-101, 2014
Calculations of Discovered Petroleum-Initially-In-Place (PIIP) for the Tomashevskay structure is listed below in Tables 2 and 3. Two examples of the PIIP in the Tomashevskoya South dome are illustrated. Table 2 is based on a specific well, A3335a, analyzed by a third party. Table 3 is based on the average of a wide range of parameters from several wells drilled on the structure.
Table 2, Tomashevskay South Dome Input parameters
| Zone | h6+ | 500
all |
G3 | 600SS | 600LS | 700 |
| Area, km2 | 8.9 | 8.9 | 8.9 | 8.9 | 8.9 | 8.9 |
| Net Pay, m | 24 | 6 | 14 | 13 | 7 | 12 |
| Porosity, % | 10 | 10 | 8 | 9 | 4 | 7 |
| Hydrocarbon Saturation, % | 54 | 59 | 39 | 43 | 20 | 32 |
| Gas Recovery Efficiency, % | 57 | 85 | 41 | 77 | 73 | 75 |
| Gas Expansion Factor | 48 | 50 | 55 | 56 | 57 | 67 |
| PIIP, MMm3 | 543 | 150 | 218 | 246 | 28 | 164 |
| PIIP, Bft3 | 19 | 5 | 8 | 9 | 1 | 6 |
| Recoverable GIP, MMm3 | 309 | 127 | 89 | 189 | 21 | 123 |
| Recoverable GIP, Bft3 | 11 | 4 | 3 | 7 | 1 | 4 |
| Total PIIP, MMm3 | 1348 | |||||
| Total PIIP, Bcf | 48 | |||||
| Total Recoverable PIIP, MMm3 | 859 | |||||
| Total Recoverable PIIP, Bft3 | 30 | |||||
| 9 |
Great East, Lysychansko-Toshkivskay, Ukraine, N151-101, 2014
Table 3 Volumetric estimates Lysychansko-Toshkivskay License
| max | ||||||||||||||
| TD, | P, | CH4, | Porosity, | PIIP, | PIIP, | Recovery | ||||||||
| Structure | m | km2 | T, m | Atm | Temp.oR | % | % | MMm3 | Bcf | % | MMm3 | Bcf | Rank | |
| Proven | ||||||||||||||
| 1 | Tomashevskay South | 450 | 8 | 38 | 40 | 538.8 | 90 | 9 | 951 | 34 | 0.75 | 713 | 25 | producing |
| 2 | Tomashevskay North | 400 | 9 | 25 | 61.4 | 537 | 74 | 9 | 891 | 32 | 0.7 | 624 | 22 | undeveloped |
Table 4, Summary of Reserves
| Estimated Reserves | Average | |||||
| Gross | Net to Company | Per Location (160 acres) | ||||
| MMm3 | Bcf | MMm3 | Bcf | MMm3 | Bcf | |
| Category | ||||||
| Proved | 713 | 25 | 535 | 19 | 43 | 6 |
| Undeveloped | 624 | 22 | 468 | 17 | 34 | 5 |
Table 5, Acreage and Wells
| Structure | Size, acre | Gross acres | Net Acres | Producing wells | Non-
producing well(s) |
Gross/Net
wells* |
| Developed | ||||||
| Tomashevskay North | 2,100 | 2,100 | 2,100 | 0 | 3 | 3 |
| Tomashevskay South | 1,977 | 1,977 | 1,977 | 2 | 5 | 7 |
| Total | 4,077 | 4,077 | 4,077 | |||
| Undeveloped | 99,954 | 99,954 | 99,954 | 0 | 0 | |
| Total | 104,031 | 104,031 | 104,031 | 2 | 8 | 10 |
* Company has 100% interest in property, thus net=gross ownership.
| 10 |
Great East, Lysychansko-Toshkivskay, Ukraine, N151-101, 2014
 Map
No. 3773 Rev. 5 UNITED NATIONS Department of Field Support September 2008 Cartographic Section
Map
No. 3773 Rev. 5 UNITED NATIONS Department of Field Support September 2008 Cartographic Section
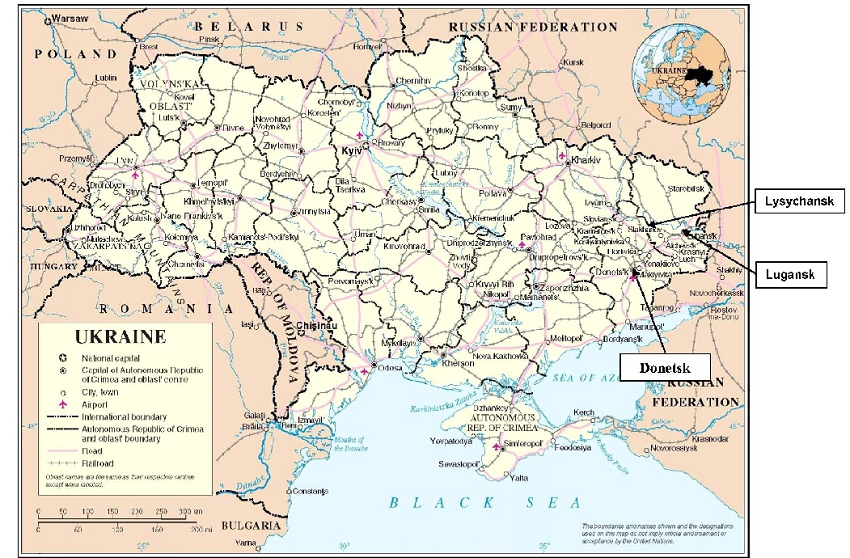
Figure 2, Location Map
| 11 |
| 9.0 | INTRODUCTION |
The statement of resource data and other oil and gas information set out below has an effective date of January 1, 2014 and a preparation date of October 2014. The resource data set forth below follows the format found in the Canadian Oil and Gas Evaluation Handbook (COGEH) and the reserves definitions are those defined by the SEC which vary from those contained in NI 51-101 and the COGEH.
Information required to be disclosed is listed below. A more detailed discussion regarding the project is presented in the Executive Summary and subsequent sections.
| (a) | The subject resources are categorized as Discovered Petroleum Initially In Place (PIIP) Reserves . | |
| (b) | The expected product is natural gas. | |
| (c) | The subject property is located in the southeastern area of Ukraine within the Donetsk Basin. | |
| (d) | The risk on the property is the possibility of encountering a gas reservoir which is not capable of delivering at economic rates. | |
| (e) | There is some political risk because of the influence of the Russian Federation in the region. |
The standards of NI 51-101 differ from the standards of the SEC. The SEC generally permits U.S. reporting oil and gas companies in their filings with the SEC, to disclose only proved and probable reserves, net of royalties and interests of others.
The geologic risk of recovering these resources has not been incorporated in the future net revenue forecast.
| 12 |
Great East, Lysychansko-Toshkivskay, Ukraine, N151-101, 2014
The Resource Data summarizes the natural gas resources from the property on which Great East Energy Inc. (the “Company” or “Great East”) has permission to operate within the area outlined and the net present values of future net revenue for these resources discovered or developed using constant prices and costs and forecast prices and costs. Additional information not required by the SEC has been supplied to provide additional information which is relevant to the readers of this information.
It should not be assumed that the estimates of future net revenues presented in the tables below represent the fair market value of the Company’s resources. There is no assurance that the constant prices and cost assumptions and forecast prices and cost assumptions will be attained and variances could be material. The recovery and resource estimates of oil and natural gas provided herein are estimates only and there is no guarantee that the estimated resources will be recovered. Actual recovery of natural gas may be greater or less than the estimates provided herein (see Section 20.0 Notes and Definitions).
10.0 Executive Summary
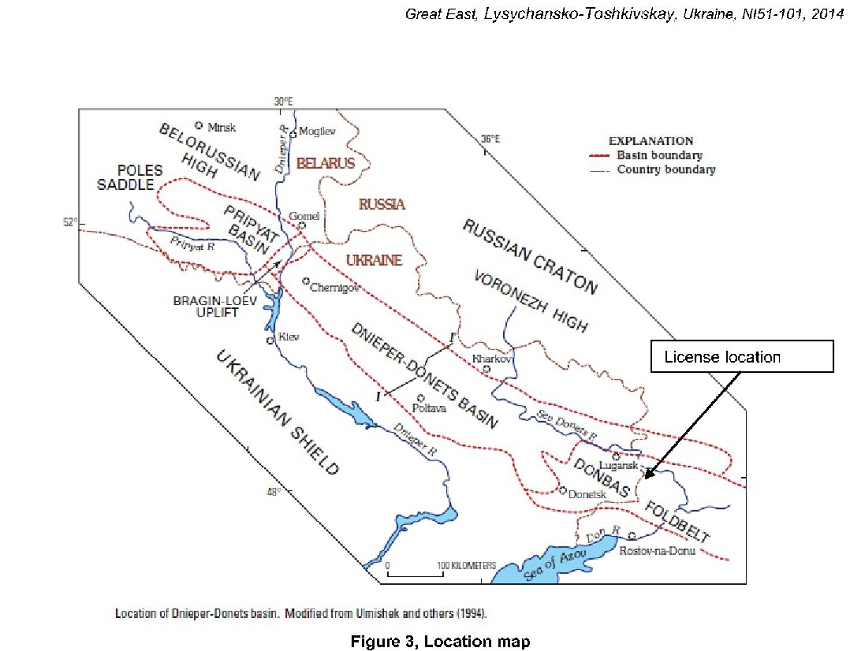
Great East has received special permission to conduct geological investigations and experimental industrial development in the Lysychansko-Toshkivskay area in the Donetsk Basin in Ukraine (Figures 2, 3, Tables 6, 7).
Table 6, Ukraine license
| name | km2 | Gross
acres |
Net
acres |
depth m | approx.
geog. coordinates latitude/longitude |
| Lysychansko-
Toshkivskay |
421 | 104,030 | 104,030 | unlimited | 48°50’30"N/38°12’30”E |
Table 7, license coordinates
| Point | Latitude | Longitude | ||
| 1 | 49001'50.00"N | 380 07'17.00"E | ||
| 2 | 480 05'05.00"N | 380 08'03.00"E | ||
| 3 | 480 01'04.00"N | 380 09'47.00"E | ||
| 4 | 480 02'15.00"N | 380 04'33.00"E | ||
| 5 | 48008'53.00"N | 38000'60.00"E | ||
| 6 | 480 08'45.00"N | 380 02'50.00"E | ||
| 7 | 480 01'18.00"N | 380 05'18.00"E | ||
| 8 | 480 03'36.00"N | 380 01'39.00"E | ||
| 9 | 480 06'10.00"N | 38031'10.00"E | ||
| 10 | 480 02'07.00"N | 380 09'10.00"E | ||
| 11 | 480 01'33.00"N | 380 07'20.00"E | ||
| 12 | 480 02'43.00"N | 380 04'28.00"E | ||
| 13 | 480 08'30.00"N | 380 08'40.00"E | ||
| 14 | 49000'55.00"N | 380 05'15.00"E |
In 1999, Ukraine coal mines generated approximately 2,060 million cubic meters (73 Bcf) of methane of which 1,981 million cubic meters (70 Bcf) were lost to the atmosphere. In 1999, the government of Ukraine drafted a national energy program with the stated objective of achieving, among other objectives, production of methane sufficient to satisfy local needs. The Lysychansko-Toshkivskay project is a result of that policy. As a consequence of this policy there is a tax exemption in effect until January 2020 for mining activities and coal gas deposits. Thus, in the cash flow statement, no after tax figures are created.
| 13 |
Great East, Lysychansko-Toshkivskay, Ukraine, N151-101, 2014
The resources for the project are classified as Reserves, Proven and Probable. The hydrocarbon in place will be gas.
The economic cases (Tables 19 through 26) in the Appendix of the report are the best estimate of potential revenue, production and recovery and utilize forecast prices as of December 2014, for a single well. The most likely case is based upon production records from two producing wells on the property. The revenue stream is with the cost of the well included in the capital costs and cost recovery is performed in the analysis.
Coal fields within the Donetsk basin are well documented and data is available for determining the resource base. The basin provides approximately 95.4% of the Ukraine’s coal production. Values have been attributed to sands which occur within the section, and other areas within the basin have been noted as being charged with gas (see Section 17.1). Coal metamorphism in the Donetsk Basin has led to the formation of a significant methane resource, which by estimates provided by Ukraine and Western CBM professionals, could be as high as 117 trillion cubic meters (U.S. EPA, 2001). Sand bodies adjacent to the coal beds and at deeper horizons are gas charged targets.
The production history over the last ten years of the two wells drilled on the license (Table 15) has been used to estimate flow rates and decline rates for the cash flow statements. Several (5) other wells have been drilled on the license but have not been put into production.
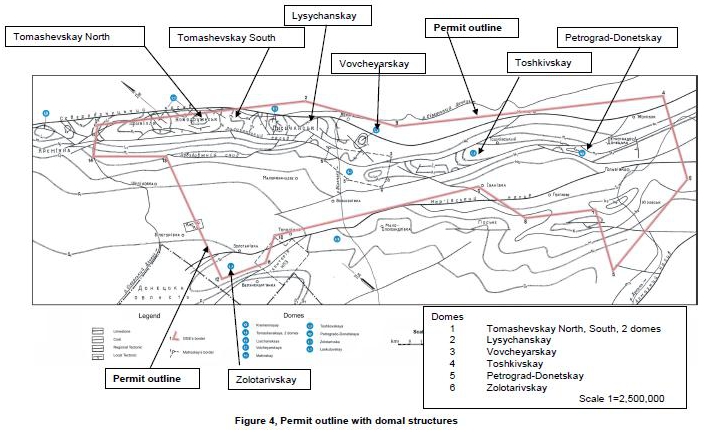
The license encompasses seven domal structures as follows:
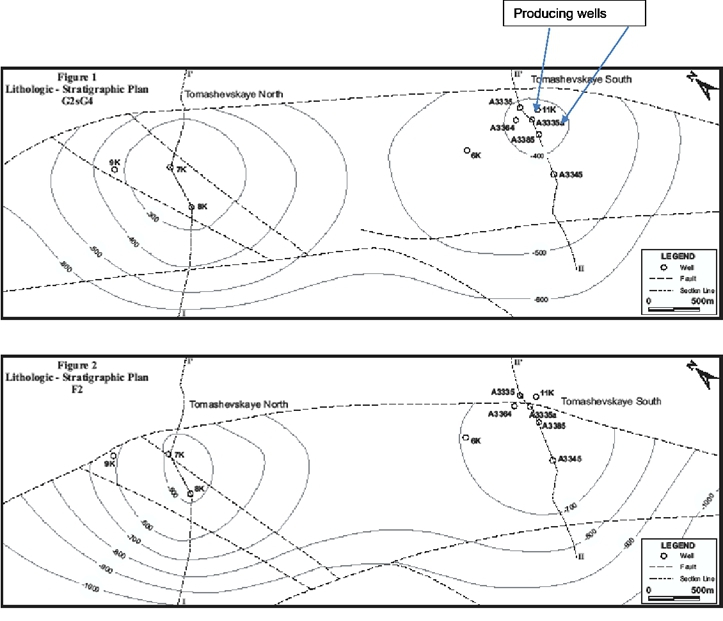
Tomashevskay South containing wells # A3335, A3335a, A3335b, A33455, A3364 (11K) 6K.
Tomashevskay North containing wells #7K, 8K, 9K
Lysychanskay
Vovcheyarskay
Toshkivskay
Petrograd-Donetskay
Zolotarivskay
The Tomashevskay structure was the basis for the calculation of reserves as it has a history of production.
The area of the dome was determined by one of the productive horizons, usually the bottom-most horizon and a specific contour line.
Table 8, Domal structures
| Domes | Size,km2 | Size, acre |
| Tomashevskay North | 8.5 | 2,100 |
| Tomashevskay South | 8 | 1,977 |
| Toshkivskay | 15 | 3,706 |
| Lysychanskay | 8 | 1,977 |
| Vovcheyarskay | 6 | 1,482 |
| Zolotarivskay | within
GEEI area 10/ total 16 |
within
GEEI area 2,470/ total 3,954 |
| Petrograd-Donetskay | 7 | 1,730 |
| 14 |
Great East, Lysychansko-Toshkivskay, Ukraine, N151-101, 2014
To summarize for the following information is included:
| a) | Pursuant to the Agreement, the Company has a Special Permit to carry out geological investigation and experimental industrial development within 421 km2 in the Lysychansko-Toshkivskay area in the Donetsk Basin. |
| b) | All resources are in Ukraine. |
| c) | All future production is anticipated to be gas. |
| d) | The area is located is highly developed with respect to infrastructure. |
| e) | The license overlies an area in which extensive coal mining has been and is still being carried out. |
| f) | The risks are the undefined production potential, confirmation of economic hydrocarbon production in the license area, the license life and product prices. |
| g) | The current license has a term of five years. Subsequent to this term an application must be made for a production license. |
It is recommended that the Company carry out an exploratory/development drilling/seismic program to determine the content and deliverability gas from gas bearing units within the license. For an expanded discussion of the program, see Section 19.1.
The report was prepared by a “Qualified Reserves Evaluator” who is independent of the Company.
This report has been prepared for the Company at the request of Mr. Timur Khromaev, Director, Chief Executive Officer, Chief Financial Officer and Treasurer of the Great East Energy Inc.
Table 9, Present Value of Current Production, Constant Prices
| Combined A3335a and 11K | ||||||||||||
| BT($000s) | tax($000s) | AT($000s) | ||||||||||
| Net present Value @ 0% | $ | 431 | $ | 12 | $ | 419 | ||||||
| Net present Value @ 5% | $ | 373 | $ | 9 | $ | 365 | ||||||
| Net Present Value @ 10% | $ | 328 | $ | 6 | $ | 321 | ||||||
| Net Present Value @ 15% | $ | 291 | $ | 5 | $ | 287 | ||||||
| Net Present Value @ 20% | $ | 262 | $ | 3 | $ | 259 | ||||||
Table 10, Present Values Cases for single new well
| Initial Flow Rate 250 Mcfd | Initial Flow Rate 250 Mcfd | |||||||
| Constant price | Escalated price | |||||||
| Net cash flow with cost recovery | Before tax ($000s) | Before tax ($000s) | ||||||
| Net present Value @ 0% | $ | 1,488 | $ | 1,583 | ||||
| Net present Value @ 5% | $ | 1,097 | $ | 1,162 | ||||
| Net Present Value @ 10% | $ | 817 | $ | 864 | ||||
| Net Present Value @ 15% | $ | 611 | $ | 645 | ||||
| Net Present Value @ 20% | $ | 454 | $ | 481 | ||||
| 15 |
Great East, Lysychansko-Toshkivskay, Ukraine, N151-101, 2014
Table 11, Present Value Cases for Development/Exploration Program (after taxes)
| constant price | escalated prices | |||||||||||||||
| recover costs | no cost recovery | recover costs | no cost recovery | |||||||||||||
| $000s | $000s | $000s | $000s | |||||||||||||
| $ | 85,354 | $ | 171,878 | net present value @ 0% | $ | 132,289 | $ | 218,740 | ||||||||
| $ | 41,426 | $ | 111,677 | net present value @ 5% | $ | 62,534 | $ | 133,578 | ||||||||
| $ | 19,500 | $ | 77,808 | met present value @ 10% | $ | 33,068 | $ | 88,526 | ||||||||
| $ | 7,970 | $ | 57,295 | net present value @ 15% | $ | 16,293 | $ | 62,766 | ||||||||
| $ | 1,673 | $ | 44,091 | net present value @ 20% | $ | 7,179 | $ | 46,999 | ||||||||
| 16 |
Great East, Lysychansko-Toshkivskay, Ukraine, N151-101, 2014
| 17 |
Great East, Lysychansko-Toshkivskay, Ukraine, N151-101, 2014
| 18 |
Great East, Lysychansko-Toshkivskay, Ukraine, N151-101, 2014
| 19 |
Great East, Lysychansko-Toshkivskay, Ukraine, N151-101, 2014
| 20 |
Great East, Lysychansko-Toshkivskay, Ukraine, N151-101, 2014
11.0 NATURAL GAS RESOURCES AND NET PRESENT VALUE OF FUTURE NET REVENUE
Following the guidelines of National Instrument 51-101 Standards of Disclosure for Oil and Gas Activities, and the SEC/SPE standards for reserves, the author B.L. Whelan, P. Geo., prepared a report (the “Report”) dated October, 2014, subsequently revised December 31, 2014. The Report evaluated as of January 1, 2014, the Lysychansk-Toshkivskay license, in which the Company can acquire an interest, with respect to potential natural gas resources and the net present value of future net revenue attributable to such resources as evaluated in the Report based on constant and forecast price and cost assumptions. The tables summarize the data contained in the Report and as result may contain slightly different numbers than such report due to rounding. The net present value of future net revenue attributable to the Company’s resources is stated without provision for interest cost and general and administrative costs, but after providing for the estimated royalties, production costs, development costs, and abandonment costs for only those wells assigned resources by the author.
The Report is based on data supplied by the Company, public documents and the author’s opinion of reasonable practices in the industry. The extent and character of ownership and of all factual data pertaining to the Company’s properties were supplied by the Company and accepted without further investigation. The author accepted this data as presented and did not conduct title searches or field inspections.
The undiscounted or discounted net present value of future net revenue attributable to the Company’s resources estimated by the author may not represent the fair market value of those resources. Other assumptions and qualifications relating to costs, prices for future production and other matters are summarized within the Report. The recovery and resource estimates of the Company’s natural gas resources provided within the Report are estimates only and there is no guarantee that the estimated resources will be recovered. Actual resources may be greater or less than the estimates provided in the Report.
All amounts are in United States dollars unless otherwise noted. The following tables are derived from the most likely case scenario. The cash flows generated are for single wells, current production and for the development/exploration proposed program utilizing constant and escalated product prices.
11.1 CLASSIFICATION OF RESOURCES
The resources stated in the report are Petroleum Initially In Place (PIIP) and the stated recoverable portion is considered Reserves and Prospective Resources.
The classification of the various structures is based upon the following criteria:
1 Tomashevskay South, Proven Reserves, is based on the history of production from the A335a and 11K wells (Table 18) and the occurrence of gas zones within several other wells on the structure.
2 Tomashevskay North, Probable Reserves, is based on the history of production from the 7K and 8K wells which has water influx but the structure has recognized gas zones within several other wells on the structure.
3 The remaining domal structures, Prospective Resources, based on the presence throughout the license of underlying coal beds, gas seeps, ventilated gas, but no wells for definition of zones. Prospective Resources are not reserves
| 21 |
Great East, Lysychansko-Toshkivskay, Ukraine, N151-101, 2014
11.2 TOTAL FUTURE NET REVENUE (UNDISCOUNTED) BASED ON FORECAST PRICES AND COSTS WITH COST RECOVERY
Table 12, Total future net revenue (undiscounted) based on forecast prices and costs with cost recovery,
single well
| Revenue | Royalties | Operating Costs | Well
Costs Workover |
Future Net Revenue Before Income Taxes | Future
Net Revenue After Income Taxes |
| ($000s) | ($000s) | ($000s) | ($000s) | ($000s) | ($000s) |
| Potential production 250 Mcfd | |||||
| $3,464 | $866 | $116 | $800 | $1,683 | $1,407 |
Table 13 Total future net revenue (undiscounted) based on forecast prices and costs with cost recovery, development/exploration program
| Revenue | Royalties | Operating Costs | Well
Costs |
Future
Net Revenue After Income Taxes |
| ($000s) | ($000s) | ($000s) | ($000s) | ($000s) |
| $361,074 | $90,269 | $4,050 | $102,350 | $132,289 |
12.0 PRICING ASSUMPTIONS
12.1 PRICING ASSUMPTIONS – FORECAST PRICES AND COSTS
The author employed the local price of $10.97 as of December, 2014, held constant and escalated at 2%/year in estimating the Company’s resources data.
Table 14, Sales prices
| Year
Forecast |
Natural
Gas, ($US/Mcf) | |
| Constant Price | Forecast Price | |
| 1 | $10.97 | $10.97 |
| 2 | $10.97 | $11.19 |
| 3 | $10.97 | $11.41 |
| 4 | $10.97 | $11.64 |
| 5 | $10.97 | $11.87 |
| 6 | $10.97 | $12.11 |
| 7 | $10.97 | $12.35 |
| 8 | $10.97 | $12.60 |
| 9 | $10.97 | $12.85 |
| 10 | $10.97 | $13.11 |
| Thereafter
escalated at 2% | ||
| 22 |
Great East, Lysychansko-Toshkivskay, Ukraine, N151-101, 2014
13.0 RECONCILIATION OF COMPANY NET RESERVES BY PRINCIPAL PRODUCT TYPE BASED ON FORECAST PRICES AND COSTS
No reconciliation has been performed as no reserves were previously determined.
14.0 UNDEVELOPED RESOURCES
The following discussion generally describes the basis upon which the Company attributes Prospective Resources for undrilled structures on the license and its plan for developing those Prospective Resources (Section 19).
The assignment of Prospective Resources was made on the basis of:
| 1. | The presence of coal bed methane being vented over an indeterminate number of years but more than 20 years. | |
| 2. | The presence of gas in all wells drilled to date on the license. | |
| 3. | The presence of two wells that have produced from the license on the Tomashevskay structure as test wells for gas production. | |
| 4. | The history of gas being ventilated from the various coal operations in the region. |
14.1 RISK AND UNCERTAINTY
In the present case there is evidence that the named formations, i.e. the sands and limestones, have hydrocarbons in place and that they have been, in one instance, economically produced. The risk involved is whether the members as a whole contains sufficient recoverable hydrocarbons to justify the resource assigned to it. This risk is mitigated by the record of vented gases from the various properties and the production history from the A3335 well (Table 18).
14.2 PROSPECT ANALYSIS
| Risk components | % | |||
| Source | 100 | |||
| Reservoir | 100 | |||
| Trap, seal | 90 | |||
| Timing, migration | 100 | |||
| Geological success | 90 | |||
| Commerciality | 70 | |||
| Commercial success | 63 |
15.0 RECONCILIATION OF CHANGES IN NET PRESENT VALUE OF FUTURE RESERVES DISCOUNTED AT 10%, FORECAST PRICES ($000)
No reserves have been previously determined, thus there is no reconciliation.
| 23 |
Great East, Lysychansko-Toshkivskay, Ukraine, N151-101, 2014
16.0 SIGNIFICANT FACTORS OR UNCERTAINTIES AFFECTING RESOURCES DATA
The estimation of resources requires judgment and decisions based upon available geological, geophysical, engineering and economic data. These estimates can change substantially as additional information from ongoing development activities and production performance becomes available and as economic and political conditions impact gas prices and costs change. The Company’s estimates are based on current production forecasts, prices and economic conditions. All of the Company’s resources are evaluated by an independent person, the author, an independent consulting geologist.
As circumstances change and additional data becomes available, resource estimates change. Based on new information, resource estimates are reviewed and revised, either upward or downward, as warranted. Although reasonable efforts have been made by the Company to ensure resource estimates are accurate, revisions arise as new information becomes available. As new geological, production and economic information is incorporated into the process of estimating the accuracy of the resource estimates improves. Such revisions can be either positive or negative.
17.0
OIL AND GAS PROPERTIES
Pursuant to an agreement the Company has a license to operate geological investigations and experimental industrial development in the Lysychansko-Toshkivskay Project, Ukraine.
17.1 GENERAL
The Donetsk Basin is one of the major coal fields in the world with over 95% of Ukraine’s coal production from the basin. The basin is estimated to contain proven coal reserves of 52 Gt with an additional resource base of 42 Gt (Privalov V.A. et al, 2003). The basin contains more than 300 coal seams of which 130 seams have a thickness of greater than 0.45m. The basin is 150 km wide and extends approximately 500 km from eastern Ukraine into the Rostov region of Russia. Almost all of the coal fields in the basin are characterized by high CBM content with most of the methane sorbed onto microporous surfaces of the coal beds and dispersed coaly matter in the encompassing host rock. Data obtained from the Toshkivskay Mine was used as the model for calculations of Petroleum-Initially-In-Place (PIIP) as the Toshkivskay Mine has considerable published data.
Multiple sandstone beds, separated by shales, coals, and carbonates are present in the Carboniferous section (Figure 5). The thickness of reservoir beds ranges from several meters to 75m. Reservoir properties of sandstones vary significantly, depending on the facies, composition and diagenetic changes (Ulmishek, G., 2001). As these sandstones are the principal reservoir for oil and gas in other areas of the basin, the potential of the sands is the objective during the proposed drilling program. “In addition, for both CMM and CBM recovery projects, the methane contained within non-coal interbeds can represent a significant source of additional methane. Therefore, it is important to consider these sources when assessing resource potential as well as in the development of the extraction programs”. (EPA, Triplett, J. eta al.).
17.2 GEOLOGY
In general, the Donetsk Basin is bounded on the north and southwest by outcrops of the bottom coal seams. The eastern boundary is represented by a general pinch-out of the coal seams, and the southern boundary by crystalline rocks of the Ukrainian shield. To the northwest of the basin, a general depression of the coal beds can be found that reaches the depth of 1,800m (EPA, 2001).
Search http://www.epa.gov/cmop/docs/ukraine_handbook.pdf for a complete description of the basin. Extracts from various reports which deal with the properties of interest are included below.
| 24 |
Great East, Lysychansko-Toshkivskay, Ukraine, N151-101, 2014
The basin is principally a Late Devonian rift that is overlain by Carboniferous to Early Permian postrift sag (Ulmishek, G.F., USGS, 2007). The sedimentary succession of the basin consists of four tectono-stratigraphic sequences (Figure 8):
| 1. | The prerift platform sequence includes Middle Devonian to lower Frasnian, mainly clastic rocks that were deposited in an extensive intercratonic basin. | |
| 2. | The Upper Devonian sequence is composed of marine carbonate, clastic and volcanic rocks and two salt formations of Frasnian and Famennian age that are deformed into salt domes and plugs. | |
| 3. | The postrift sag sequence consists of Carboniferous and Lower Permian clastic marine and alluvial deltaic rocks. The basin was affected by strong compression in Early Permian time when the southeastern basin area was uplifted and deeply eroded and the Donetsk fold belt was formed. | |
| 4. | The postrift platform sequence includes Triassic through Tertiary rocks that were deposited in a shallow platform depression that extended far beyond the Dnieper-Donetsk basin boundaries. |
17.2.1 DONBASS DEVELOPMENT AREA
The Donbas area contains the Lysychansko-Toshkivskay area and includes 5 operating mines and 11 closed mines. The relevant area is located in the Lugansk region. The lease area has a SE-NW orientation and the largest nearby town is Lysychanskaya. Ninety percent of the area is used for agricultural purposes or is not cultivated, and is owned by individuals, farmers or municipal bodies. The large (700mm diameter) Donetsk – Mariupol pipeline runs to the east of the lease.
17.2.2 Lysychansko-Toshkivskay
The Lysychansko-Toshkivskay license is located 165 km north-northeast of Donetsk. The data utilized to generate the regional resource figures was partially derived from the information published on the Toshkivskay mine (Table 15, 16) which lies within the license and has similar geological properties and well information. The stratigraphic sequence is monotonous throughout the license and has been delineated by multiple drill holes which were drilled to evaluate the coal seams throughout the area. No electric logs were rum on the holes as they were slim-hole drill holes drilled as stratigraphic tests. The information derived was used to map the sedimentary sequence which, as stated, was constantly regular and disturbed only by faulting.
Table 15 General Information, Toshkivskay Mine
| Total mineable reserves, thousand tonnes | 45,639 | |||
| Mineable reserves, active mine levels, thousand tonnes | 30,153 | |||
| Total mining area, km2 | 15 | |||
| Depth of shafts, m | 486 | |||
| Mining capacity, tonnes/day | 181 | |||
| Coal seam gas content, m3/tonne | 8.0 | |||
| Pressure gradient, MPa/1000m | No data | |||
| Porosity, sandstone | 12.8-0.8 | |||
| Permeability, sandstone, mD | 13.33 | |||
| Total methane resources, million m3 | 400 | |||
| Methane liberated by mine ventilation, million m3/year | 0.658 |
| 25 |
Great East, Lysychansko-Toshkivskay, Ukraine, N151-101, 2014
Table 16, Coal methane liberated at decontamination, Toshkivskay Mine
| Year | Methane
liberated at ventilation Mm3/year |
Coal
production thousand tonnes /year |
| 2003 | 142 | 18.9 |
| 2004 | 32 | 37.1 |
| 2005 | 509 | 60.0 |
| 2006 | 559 | 61.5 |
| 2007 | 334 | 61.6 |
| 2008 | 605 | 61.9 |
| 2009 | 2,210 | 172.5 |
| 2010 | 1,740 | 139.5 |
| 2011 | 742 | 66.2 |
| 2012 | 462 | 42.1 |
| 26 |
Great East, Lysychansko-Toshkivskay, Ukraine, N151-101, 2014
| 27 |
Great East, Lysychansko-Toshkivskay, Ukraine, N151-101, 2014
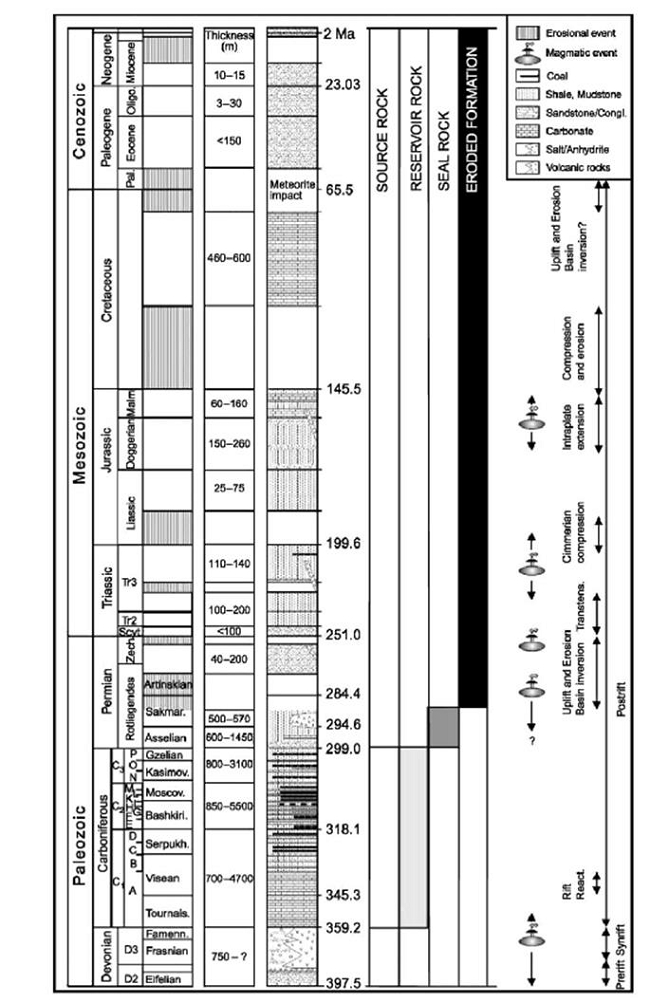
Figure 9, Chrono- and lithostratigraphy of the Donbass fold belt showing the distribution of source rocks, potential reservoirs, sealing beds and eroded formations in the study area. Major magmatic and tectonic events are also shown (Alsaab, D., et al, 2008).
| 28 |
Great East, Lysychansko-Toshkivskay, Ukraine, N151-101, 2014
17.3 PRODUCTION
Two wells have been placed on production to test for natural gas in the sands present (see Section 24.0). There are numerous vents for degasification of the mines from which volumes have been recorded.
17.4 RESERVOIR CHARACTERISTICS
See Table 3, Section 8.
18.0 COSTS TO BE INCURRED
18.1 LEASE COSTS
Pursuant to the Agreement, the buy-in costs for the Company on the license is less than $1,000 (U.S.).
19.0 EXPLORATION AND DEVELOPMENT ACTIVITIES
19.1 EXPLORATION AND DEVELOPMENT COSTS
Table 17, Schedule of exploration and development
| Year | 1 | 2 | 3 | 4 | Total costs, $000 | ||||
| type | Rework/
Prod'n |
Prod’n | Prod'n Expl'n/ | Prod'n | Expl'n/
Prod'n |
Expl'n/
Prod'n |
Expl'n | Expl'n/
Prod'n |
|
| wells | 2** | 3 | 2* | 4 | 2* | 1 | 2* | 2 | |
| depth, m | 500m | 800m | 2500m | 1500m | 2500m | 2500m | 2500m | 2500m | |
| location | Tomash | Tomash | Zolot | Tomash | Zolot | Toshk | Toshk | PD | |
| output, Mm3/d | 8 | 2 | 20 | 4 | 20 | 20 | 20 | ||
| output, Mcf/d | 280 | 70 | 705 | 140 | 705 | 705 | 705 | ||
| decline, % | 20 | 10 | 15 | 10 | 15 | 15 | 15 | ||
| cost, $000 | $700 | $2,150 | $5,400 | $7,900 | $5,400 | $2,700 | $5,300 | $5,300 | $34,850 |
| seismic, $000 | $500 | $500 | $1,000 | ||||||
| facilities, $000 | $1,200 | $1,200 | $1,200 | $1,200 | $4,800 | ||||
| cost in year, $000 | $700 | $3,350 | $7,100 | $7,900 | $5,400 | $4,400 | $5,300 | $6,500 | $40,650 |
| PD - Petrograd-Donetsk dome, Tomash - Tomashevskay domes, Toshk - Toshkivskay dome, Zolot - Zolotarivskay dome | |||||||||
| * depending on result of previous well | |||||||||
| **In year 1, deepen well 7K, cost $400k for exploration purposes, then plug back to produce from upper horizon at cost of $150k; rework of well 1G | |||||||||
| 29 |
Great East, Lysychansko-Toshkivskay, Ukraine, N151-101, 2014
19.2 CAPITAL COSTS
No capital costs were incurred by the Company during 2013.
19.3 OPERATING COSTS
For future cash flow purposes operating costs were estimated to be $500 per month per well once the new well is underway. No transportation costs were assigned as the Company owns the pipeline.
20.0 FORWARD CONTRACTS
None. Present production is sold to local end users.
21.0 ABANDONMENT AND RECLAMATION COSTS
The estimated abandonment costs are estimated to be $10,000 but were not included in the cash flow because of the indeterminate well life and lack of data on abandonment costs.
22.0 TAX HORIZON
A tax of 18% is levied on profits..
23.0 PRODUCTION ESTIMATES
Production rates for CBM vary significantly depending upon the basin in which they are exploited. As examples, the following basins within North America have production rates per well as follows:
| Powder River basin | 319 - 266 Mcfd |
| Alberta | 75 Mcfd |
| Black Warrior Basin | 20 – 1,000 Mcfd |
| Raton Basin | 300 Mcfd |
The rates used for the economic analysis in this Report were selected based on a general average from various basins and the production history of the A3335a well on the Tomashevskay South dome. The producing well, 11K on the Tomashevskay North dome has a poor history of production because of a rapid draw down resulting in formation damage and water entry. The estimates of future production is 250 Mcf/day/well initially, declining 25% in year 1, and 10% in subsequent years.
24.0 PRODUCTION HISTORY
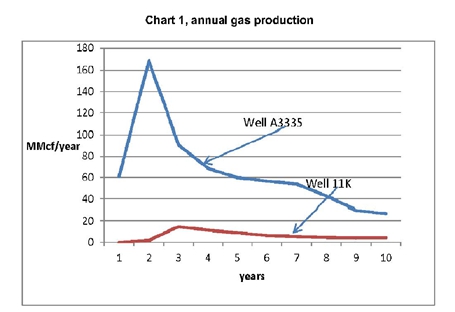
Two wells have been placed on production for natural gas. The production history is tabulated in Table 18 and Chart 1 (Appendix). Venting from coal mining operations has been carried out for an indeterminate but substantial period (Table 16).
| 30 |
Great East, Lysychansko-Toshkivskay, Ukraine, N151-101, 2014
Table 17, Production history
| Annual Production MMcf | ||||||||||||
| Well | 2003 | 2004 | 2005 | 2006 | 2007 | 2008 | 2009 | 2010 | 2011 | 2012 | 2013 | 2014 |
| A3335a | 61.1 | 168.7 | 90.7 | 68.6 | 59.8 | 56.6 | 53.9 | 42.7 | 29.8 | 26.8 | 24.6 | 20.1 |
| 11K | 0 | 1.75 | 14.8 | 11.4 | 8.8 | 6.3 | 5.22 | 4.46 | 3.99 | 4.24 | 3.89 | 3.8 |
| Daily Gas Flow, Mcf/d | ||||||||||||
| A3335a | 531 | 441.4 | 287 | 205 | 171 | 152 | 138 | 120 | 101 | 87.9 | 70.3 | 57.5 |
| 11K | 0 | 56.5 | 35.3 | 30 | 23.8 | 18.4 | 14.1 | 12.7 | 13.1` | 12.7 | 11.8 | 10.8 |
Future discounted cash flows for the two currently producing wells see Tables 20, 21, 22.
24.1 AVERAGE DAILY PRODUCTION
See Table 17 above.
24.2 PRICES RECEIVED, ROYALTIES PAID, PRODUCTION COSTS AND NETBACKS
The sales prices used in the economic runs are those for gas sales within the Donetsk Basin. An estimate of netbacks follows:
| Price received/Mcf | $ | 10.97 | ||
| Royalty (25%) | $ | 2.74 | ||
| Production costs ($500/m) | $ | 0.13 | ||
| Netback | $ | 8.10 |
25.0 PRODUCTION VOLUME BY FIELD
To date there are only two wells which have produced as a result of development. Total production to the end of 2014 was 779 MMcf.
26.0 RECOMMENDATIONS
It is recommended that the drilling and testing program be carried out over the Lysychansko-Toshkivskay license to a minimum depth of 800 m and a maximum depth of 2500m in order to:
| 1. | determine the potential for deliverability of natural gas from the sand intervals. | |
| 2. | obtain petrophysical data to determine the reservoir characteristics and contents of the sandstone formations which are prevalent in the section of the Lysychansko-Toshkivskay license, | |
| 3. | obtain drawdown parameters, | |
| 4. | determine the spacing pattern for future development of the Lysychansko-Toshkivskay license, | |
| 5. | penetrate below the major fault underlying the Tomashevskay structure, and | |
| 6. | determine the optimum depth to drill wells. | |
| 7. | add compressors to existing wells |
It is recommended that several test wells be drilled on the Lysychansko-Toshkivskay license for a total expenditure of $8.15 million (see Table 17). This will satisfy the objectives set out above and the requirements of the Agreement. Upon confirmation that the potential for reasonable production is present, it is recommended that a continuous drill program be carried out to efficiently produce the resource.
| 31 |
Great East, Lysychansko-Toshkivskay, Ukraine, N151-101, 2014
27.0 REFERENCES
Alsaab, D, Elie, M., Izart, A, Sachsenhofer, R. F. Predicting methane accumulations generated from humic carboniferous coals in the Donbas fold belt (Ukraine), 2007 AAPG Bulletin, August 2008, v. 92; no. 8; p. 10-29 – 1053.
Coal Mine Methane and Coalbed Methane Development in the Donetsk Region, Ukraine, by Advanced Resources International, Inc., May 2008, for Donetsk Regional Administration and U.S. Trade and Development Agency.
Coal Mine Methane in Ukraine: Opportunities for Production and Investment in the Donetsk Coal Basin, by Partnership for Energy and Environmental Reform for U.S. Environmental Protection Agency, Triplett, J., Filippov, A., Pisarenko A., 2001.
Canadian Oil and Gas Evaluation Handbook, (COGEH), Volume 1, Reserves Definitions and Evaluation Practices and Procedures, Second Edition, September 1, 2007, Society of Petroleum Evaluation Engineers (Calgary Chapter) and Canadian Institute of Mining, Metallurgy & Petroleum (Petroleum Society).
Marathon Oil, Power Point, 2006, Donbass, Ukraine: Estimation of Tomashevskiy and Lysychansko-Toshkivskiy licensed blocks
Mavor, Matt, and Nelson, C.R., 1997, Coalbed Reservoir Gas-In-Place Analysis, Gas Research Institute Report No. GRI-97/0263; Chicago,
Illinois.
Privalov, V.A., Zhykalyak, M.V., Panova, E.A., 2003 Geologic Controls on Coalbed Occurrence in the Donets Basin (Ukraine), www.coalinfo.net.cn/coalbed/meeting/2203/papers/coal-mining/cm054.pdf.
Swindell, Gary S., Powder River Basin Coalbed Methane Wells, Reserves and Rates, SPE.
Ulmishek, Gregory F., 2001, Petroleum Geology and Resources of the Dnieper-Donets Basin, Ukraine and Russia, USGS Bulletin 2201-E.
| 32 |
Great East, Lysychansko-Toshkivskay, Ukraine, N151-101, 2014
28.0 CERTIFICATE OF QUALIFICATIONS
I, Barry l. Whelan, of the city of Vancouver, Province of British Columbia, do hereby certify:
| 1. | That I did prepare a review of the properties held by Great East Energy Inc. |
| 2. | That I am a Professional Geoscientist in the Province of British Columbia and that I have in excess of forty years experience as a Geologist, fifteen years with Gulf Oil Corporation and twenty five years as a Consulting Geologist. |
| 3. | That I have experience in exploration and development geology in North America, South America, Asia, Africa and Europe. |
| 4. | That I have performed evaluations of a similar type to this evaluation continuously starting in 1970 with Gulf Oil Corporation and subsequently as a consultant to individuals and companies since 1980. |
| 5. | That I have conducted the evaluation in accordance with generally accepted industry standards. |
| 6. | That I have no interest, direct or indirect, nor do I expect to receive any direct or indirect interest in the property evaluated in this report or in Great East Energy Inc. |
| 7. | That a personal field inspection of the properties was made from October 15th to the 23rd, 2013. The report was generated by material from Great East Energy Inc., conversations with the technical staff of Great East Energy Inc. and public records. |
| 8. | That Great East Energy Inc. provided ownership data and the terms of the Agreement. |
Dated at Vancouver, British Columbia on the 30th of December, 2014
| |
||
BARRY L. WHELAN”, P. GEO |

| 33 |
Great East, Lysychansko-Toshkivskay, Ukraine, N151-101, 2014
APPENDIX
| 34 |
Great East, Lysychansko-Toshkivskay, Ukraine, N151-101, 2014
| 35 |
Great East, Lysychansko-Toshkivskay, Ukraine, N151-101, 2014
Table 19, Forecast cash flow, single well, 250 Mcfd
| Great East | ||||||||||||
| Constant Prices | ||||||||||||
| Ukraine | SUMMARY | |||||||||||
| Initial flow rate 250 Mcfd | RESERVES AND ECONOMICS | |||||||||||
| 100% W.I.,75% N.R.I. | As of December 2014 | |||||||||||
| All amounts in $US | CONSTANT PRICES | |||||||||||
| Gross Gas | Net Gas | |||||||||||
| Year | Prod | to Company | Price | revenue | Royalty | Gas | Op Costs | Future BT | Taxes | Future Atax | Cumulative | |
| Mcf | Mcf | $/Mcf | $000s | $000s | Transm. | Cash Flow | 20% | Cash Flow | Total | |||
| (100% WI) | (75% NRI.) | (100% WI) | (25%) | 000$ | 000$ | $000s | $000s | $000s | $000s | |||
| 2015 | 1 | 80,938 | 60,703 | $10.97 | $888 | $222 | $81 | $6.00 | $666 | $0 | $666 | $666 |
| 2016 | 2 | 68,797 | 51,598 | $10.97 | $755 | $189 | $69 | $6.09 | $566 | $0 | $566 | $1,232 |
| 2017 | 3 | 58,477 | 43,858 | $10.97 | $641 | $160 | $58 | $6.18 | $481 | $0 | $481 | $1,713 |
| 2018 | 4 | 49,706 | 37,279 | $10.97 | $545 | $136 | $50 | $6.27 | $409 | $0 | $409 | $2,122 |
| 2019 | 5 | 42,250 | 31,687 | $10.97 | $463 | $116 | $42 | $6.37 | $348 | $0 | $348 | $2,470 |
| 2020 | 6 | 35,912 | 26,934 | $10.97 | $394 | $98 | $36 | $6.46 | $295 | $59 | $236 | $2,706 |
| 2021 | 7 | 30,526 | 22,894 | $10.97 | $335 | $84 | $31 | $6.56 | $251 | $50 | $201 | $2,907 |
| 2022 | 8 | 25,947 | 19,460 | $10.97 | $285 | $71 | $26 | $6.66 | $213 | $43 | $171 | $3,078 |
| 2023 | 9 | 22,055 | 16,541 | $10.97 | $242 | $60 | $22 | $6.76 | $181 | $36 | $145 | $3,223 |
| 2024 | 10 | 18,746 | 14,060 | $10.97 | $206 | $51 | $19 | $6.86 | $154 | $31 | $123 | $3,346 |
| 2025 | 11 | 15,935 | 11,951 | $10.97 | $175 | $44 | $16 | $6.96 | $131 | $26 | $105 | $3,451 |
| 2026 | 12 | 13,544 | 10,158 | $10.97 | $149 | $37 | $14 | $7.07 | $111 | $22 | $89 | $3,540 |
| 2027 | 13 | 11,513 | 8,635 | $10.97 | $126 | $32 | $12 | $7.17 | $95 | $19 | $76 | $3,616 |
| 2028 | 14 | 9,786 | 7,339 | $10.97 | $107 | $27 | $10 | $7.28 | $81 | $16 | $64 | $3,680 |
| 2029 | 15 | 8,318 | 6,238 | $10.97 | $91 | $23 | $8 | $7.39 | $68 | $14 | $55 | $3,735 |
| 492,448 | 369,336 | $5,402 | $1,351 | $492 | $100.09 | $4,052 | $316 | $3,735 | ||||
| BT($000s) | Tax ($000s) | AT ($000s) | ||||||||||
| Net present Value @ 0% | $4,052 | $316 | $3,735 | |||||||||
| Net present Value @ 5% | $3,190 | $204 | $2,986 | |||||||||
| Net Present Value @ 10% | $2,608 | $136 | $2,472 | |||||||||
| Net Present Value @ 15% | $2,196 | $93 | $2,103 | |||||||||
| Net Present Value @ 20% | $1,887 | $65 | $1,823 | |||||||||
| 36 |
Great East, Lysychansko-Toshkivskay, Ukraine, N151-101, 2014
Table 20, Forecast cash flow, current production A3555a
| Great East | Well # A3335a | ||||||||||||
| Constant Prices | SUMMARY | ||||||||||||
| Ukraine | RESERVES AND ECONOMICS | ||||||||||||
| Initial flow rate 75 Mcfd | As of December, 2014 | ||||||||||||
| 100% W.I.,75% N.R.I. | CONSTANT PRICES | ||||||||||||
| All amounts in $US | |||||||||||||
| Gross Gas | Net Gas to company | ||||||||||||
| Year | Prod | Price | Revenue | Royalty | Net | Cumulative | Op Costs | Future
Btax |
Taxes | Future Atax | Cumulative | ||
| Mcf | Mcf | $/Mcf | $000s | $000s | Revenue | Total | Cash Flow | 0.2 | Cash Flow | Cash Flow | |||
| (100% WI) | (75% NRI.) | (100% WI) | (25%) | $000s | $000s | 000$ | 000$ | 000$ | $000s | $000s | |||
| 2015 | 1 | 24,281 | 18,211 | $10.97 | $266 | $67 | $200 | $200 | $6 | $194 | $0 | $194 | $194 |
| 2016 | 2 | 20,639 | 15,479 | $10.97 | $226 | $57 | $170 | $370 | $6 | $164 | $0 | $164 | $358 |
| 2017 | 3 | 15,479 | 15,479 | $10.97 | $170 | $42 | $127 | $497 | $6 | $121 | $0 | $121 | $479 |
| 2018 | 4 | 11,609 | 11,609 | $10.97 | $127 | $32 | $96 | $592 | $6 | $90 | $0 | $90 | $568 |
| 2019 | 5 | 8,707 | 8,707 | $10.97 | $96 | $24 | $72 | $664 | $6 | $66 | $0 | $66 | $634 |
| 2020 | 6 | 6,530 | 6,530 | $10.97 | $72 | $18 | $54 | $718 | $6 | $48 | $10 | $38 | $672 |
| 2021 | 7 | 4,898 | 4,898 | $10.97 | $54 | $13 | $40 | $758 | $6 | $34 | $7 | $27 | $700 |
| 2022 | 8 | 3,673 | 3,673 | $10.97 | $40 | $10 | $30 | $788 | $6 | $24 | $5 | $19 | $719 |
| 2023 | 9 | 2,755 | 2,755 | $10.97 | $30 | $8 | $23 | $811 | $6 | $17 | $3 | $13 | $732 |
| 2024 | 10 | 2,066 | 2,066 | $10.97 | $23 | $6 | $17 | $828 | $6 | $11 | $2 | $9 | $741 |
| 2025 | 11 | 1,550 | 1,550 | $10.97 | $17 | $4 | $13 | $841 | $6 | $7 | $1 | $5 | $747 |
| 2026 | 12 | 1,162 | 1,162 | $10.97 | $13 | $3 | $10 | $850 | $6 | $4 | $1 | $3 | $749 |
| 103,351 | 92,121 | $1,134 | $283 | $850 | $72 | $778 | $29 | $749 | |||||
| BT($000s) | tax($000s) | AT($000s) | |||||||||||
| Net present Value @ 0% | $778 | $23 | $749 | ||||||||||
| Net present Value @ 5% | $663 | $20 | $643 | ||||||||||
| Net Present Value @ 10% | $575 | $14 | $561 | ||||||||||
| Net Present Value @ 15% | $507 | $10 | $497 | ||||||||||
| Net Present Value @ 20% | $453 | $8 | $445 | ||||||||||
| 37 |
Great East, Lysychansko-Toshkivskay, Ukraine, N151-101, 2014
Table 21, Forecast cash flow, current production 11K
| Great Eastern | |||||||||||||
| Constant Prices | Well 11K | ||||||||||||
| Ukraine | SUMMARY | ||||||||||||
| Initial flow rate 12 Mcfd | RESERVES AND ECONOMICS | ||||||||||||
| 100% W.I.,75% N.R.I. | As of December, 2014 | ||||||||||||
| All amounts in $US | CONSTANT PRICES | ||||||||||||
| Gross Gas | Net Gas to company | ||||||||||||
| Year | Prod | Price | Revenue | Royalty | Net | Cumulative | Op Costs | Future Btax | Taxes | Future Atax | Cumulative | ||
| Mcf | Mcf | $/Mcf | $000s | $000s | Revenue | Total | Cash Flow | 0.2 | Cash Flow | Cash Flow | |||
| (100% WI) | (75% NRI.) | (100% WI) | (25%) | $000s | $000s | 000$ | 000$ | 000$ | $000s | $000s | |||
| 2015 | 1 | 15,313 | 11,484 | $10.97 | $168 | $42 | $126 | $126 | $6 | $120 | $0 | $120 | $120 |
| 2016 | 2 | 11,484 | 8,613 | $10.97 | $126 | $25 | $101 | $227 | $6 | $95 | $0 | $95 | $215 |
| 2017 | 3 | 8,613 | 6,460 | $10.97 | $94 | $19 | $76 | $302 | $6 | $69 | $0 | $69 | $284 |
| 2018 | 4 | 6,460 | 4,845 | $10.97 | $71 | $14 | $57 | $359 | $6 | $50 | $0 | $50 | $335 |
| 2019 | 5 | 4,845 | 3,634 | $10.97 | $53 | $11 | $43 | $402 | $6 | $36 | $0 | $36 | $371 |
| 2020 | 6 | 3,634 | 2,725 | $10.97 | $40 | $8 | $32 | $433 | $6 | $25 | $5 | $20 | $391 |
| 2021 | 7 | 2,725 | 2,044 | $10.97 | $30 | $6 | $24 | $457 | $7 | $17 | $3 | $14 | $405 |
| 2022 | 8 | 2,044 | 1,533 | $10.97 | $22 | $4 | $18 | $475 | $7 | $11 | $2 | $9 | $414 |
| 2023 | 9 | 1,533 | 1,150 | $10.97 | $17 | $3 | $13 | $489 | $7 | $7 | $1 | $5 | $419 |
| 56,651 | 42,488 | $621 | $133 | $489 | $57 | $431 | $12 | $419 | |||||
| Combined A3335a and 11K | |||||||||||||
| BT($000s) | tax($000s) | AT($000s) | |||||||||||
| Net present Value @ 0% | $431 | $12 | $419 | ||||||||||
| Net present Value @ 5% | $373 | $9 | $365 | ||||||||||
| Net Present Value @ 10% | $328 | $6 | $321 | ||||||||||
| Net Present Value @ 15% | $291 | $5 | $287 | ||||||||||
| Net Present Value @ 20% | $262 | $3 | $259 | ||||||||||
| 38 |
Great East, Lysychansko-Toshkivskay, Ukraine, N151-101, 2014
Table 22, Forecast cash flow, combined current production
| Great East | Combined A3335a and 11K | ||||||||||||
| Constant Prices | SUMMARY | ||||||||||||
| Ukraine | RESERVES AND ECONOMICS | ||||||||||||
| Initial flow rate 87 Mcfd | As of December, 2014 | ||||||||||||
| 100% W.I.,75% N.R.I. | CONSTANT PRICES | ||||||||||||
| All amounts in $US | |||||||||||||
| Gross Gas | Net Gas to company | ||||||||||||
| Year | Prod | Price | Revenue | Royalty | Net | Cumulative | Op Costs | Future Btax | Taxes | Future Atax | Cumulative | ||
| Mcf | Mcf | $/Mcf | $000s | $000s | Revenue | Total | Cash Flow | 0.2 | Cash Flow | Cash Flow | |||
| (100% WI) | (75% NRI.) | (100% WI) | (25%) | $000s | $000s | 000$ | 000$ | 000$ | $000s | $000s | |||
| 2015 | 1 | 39,594 | 29,695 | $10.97 | $434 | $109 | $326 | $326 | $6 | $320 | $0 | $320 | $320 |
| 2016 | 2 | 33,655 | 25,241 | $10.97 | $369 | $92 | $277 | $603 | $6 | $271 | $0 | $271 | $591 |
| 2017 | 3 | 25,241 | 25,241 | $10.97 | $277 | $69 | $208 | $810 | $6 | $202 | $0 | $202 | $792 |
| 2018 | 4 | 18,931 | 18,931 | $10.97 | $208 | $52 | $156 | $966 | $6 | $150 | $0 | $150 | $942 |
| 2019 | 5 | 14,198 | 14,198 | $10.97 | $156 | $39 | $117 | $1,083 | $6 | $111 | $0 | $111 | $1,053 |
| 2020 | 6 | 10,649 | 10,649 | $10.97 | $117 | $29 | $88 | $1,171 | $6 | $82 | $16 | $65 | $1,118 |
| 2021 | 7 | 7,986 | 7,986 | $10.97 | $88 | $22 | $66 | $1,236 | $6 | $60 | $12 | $48 | $1,166 |
| 2022 | 8 | 5,990 | 5,990 | $10.97 | $66 | $16 | $49 | $1,285 | $6 | $43 | $9 | $35 | $1,201 |
| 2023 | 9 | 4,492 | 4,492 | $10.97 | $49 | $12 | $37 | $1,322 | $6 | $31 | $6 | $25 | $1,225 |
| 2024 | 10 | 3,369 | 3,369 | $10.97 | $37 | $9 | $28 | $1,350 | $6 | $22 | $4 | $17 | $1,243 |
| 2025 | 11 | 2,527 | 2,527 | $10.97 | $28 | $7 | $21 | $1,371 | $6 | $15 | $3 | $12 | $1,255 |
| 2026 | 12 | 1,895 | 1,895 | $10.97 | $21 | $5 | $16 | $1,387 | $6 | $10 | $2 | $8 | $1,262 |
| 168,527 | 150,215 | $1,849 | $462 | $1,387 | $72 | $1,315 | $52 | $1,262 | |||||
| BT($000s) | tax($000s) | AT($000s) | |||||||||||
| Net present Value @ 0% | $1,315 | $52 | $1,262 | ||||||||||
| Net present Value @ 5% | $1,114 | $36 | $1,078 | ||||||||||
| Net Present Value @ 10% | $964 | $25 | $938 | ||||||||||
| Net Present Value @ 15% | $847 | $18 | $829 | ||||||||||
| Net Present Value @ 20% | $755 | $13 | $741 | ||||||||||
| 39 |
Great East, Lysychansko-Toshkivskay, Ukraine, N151-101, 2014
Table 23, Forecast Cash Flow, Constant Price, Sequential Drill Program, Cost Recovery
| Great East | BT($000s) | ||||||||||||
| Constant Prices | SUMMARY | Net present Value @ 0% | $85,354 | ||||||||||
| Ukraine | RESERVES AND ECONOMICS | Net present Value @ 5% | $41,426 | ||||||||||
| Initial flow rate 250 Mcfd/w ell | As of December, 2014 | Net Present Value @ 10% | $19,500 | ||||||||||
| 100% W.I.,75% N.R.I. | CONSTANT PRICES | Net Present Value @ 15% | $7,970 | ||||||||||
| All amounts in $US | with cost recovery | Net Present Value @ 20% | $1,673 | ||||||||||
| decline 25% year 1, 10% thereafter | |||||||||||||
| Gross Gas | |||||||||||||
| Year | new | total | Prod | Price | revenue | Royalty | Net | Op Costs* | Capital | Future Btax | Taxes | Future Atax | Cumulative |
| wells | # of wells | Mcf | $000s | $000s | Revenue | Expense | Cash Flow | 18% | Cash Flow | Cash Flow | |||
| (100% WI) | $/Mcf | (100% WI) | (25%) | $000s | $000s | $000s | $000s | $000s | $000s | $000s | |||
| 2014 | 0 | 2 | 23,942 | $10.97 | $263 | $66 | $197 | $36 | $0 | $161 | $29 | $132 | $132 |
| 2015 | 7 | 9 | 689,063 | $10.97 | $7,559 | $1,890 | $5,669 | $54 | $11,150 | -$5,535 | $0 | -$5,535 | -$5,403 |
| 2016 | 7 | 16 | 1,156,094 | $10.97 | $12,682 | $3,171 | $9,512 | $96 | $17,700 | -$8,284 | $0 | -$8,284 | -$13,687 |
| 2017 | 4 | 20 | 1,346,734 | $10.97 | $14,774 | $3,693 | $11,080 | $120 | $11,800 | -$840 | $0 | -$840 | -$14,527 |
| 2018 | 4 | 24 | 1,518,311 | $10.97 | $16,656 | $4,164 | $12,492 | $144 | $11,800 | $548 | $99 | $449 | -$14,077 |
| 2019 | 4 | 28 | 1,672,730 | $10.97 | $18,350 | $4,587 | $13,762 | $168 | $11,800 | $1,794 | $323 | $1,471 | -$12,606 |
| 2020 | 4 | 32 | 1,811,707 | $10.97 | $19,874 | $4,969 | $14,906 | $192 | $11,800 | $2,914 | $524 | $2,389 | -$10,217 |
| 2021 | 4 | 36 | 1,936,786 | $10.97 | $21,247 | $5,312 | $15,935 | $216 | $11,800 | $3,919 | $705 | $3,214 | -$7,003 |
| 2022 | 4 | 40 | 2,049,358 | $10.97 | $22,481 | $5,620 | $16,861 | $240 | $11,800 | $4,821 | $868 | $3,953 | -$3,050 |
| 2023 | 1 | 41 | 1,920,984 | $10.97 | $21,073 | $5,268 | $15,805 | $246 | $2,650 | $12,909 | $2,324 | $10,585 | $7,535 |
| 2024 | 41 | 1,728,886 | $10.97 | $18,966 | $4,741 | $14,224 | $246 | $13,978 | $2,516 | $11,462 | $18,998 | ||
| 2025 | 41 | 1,555,997 | $10.97 | $17,069 | $4,267 | $12,802 | $246 | $12,556 | $2,260 | $10,296 | $29,294 | ||
| 2026 | 41 | 1,400,398 | $10.97 | $15,362 | $3,841 | $11,522 | $246 | $11,276 | $2,030 | $9,246 | $38,540 | ||
| 2027 | 41 | 1,260,358 | $10.97 | $13,826 | $3,457 | $10,370 | $246 | $10,124 | $1,822 | $8,301 | $46,841 | ||
| 2028 | 41 | 1,134,322 | $10.97 | $12,444 | $3,111 | $9,333 | $246 | $9,087 | $1,636 | $7,451 | $54,292 | ||
| 2029 | 41 | 1,020,890 | $10.97 | $11,199 | $2,800 | $8,399 | $246 | $8,153 | $1,468 | $6,686 | $60,978 | ||
| 2030 | 41 | 918,801 | $10.97 | $10,079 | $2,520 | $7,559 | $246 | $7,313 | $1,316 | $5,997 | $66,975 | ||
| 2031 | 41 | 826,921 | $10.97 | $9,071 | $2,268 | $6,803 | $246 | $6,557 | $1,180 | $5,377 | $72,352 | ||
| 2032 | 41 | 744,229 | $10.97 | $8,164 | $2,041 | $6,123 | $246 | $5,877 | $1,058 | $4,819 | $77,171 | ||
| 2033 | 41 | 669,806 | $10.97 | $7,348 | $1,837 | $5,511 | $246 | $5,265 | $948 | $4,317 | $81,488 | ||
| 2034 | 41 | 602,825 | $10.97 | $6,613 | $1,653 | $4,960 | $246 | $4,714 | $848 | $3,865 | $85,354 | ||
| 25,989,140 | 285,101 | 71,275 | 213,826 | 4,218 | 102,300 | 107,308 | 21,954 | 85,354 | |||||
| 40 |
Great East, Lysychansko-Toshkivskay, Ukraine, N151-101, 2014
Table 24, Forecast Cash Flow, Constant Price, No Cost Recovery
| Great East | BT($000s) | |||||||||||
| Constant Prices | SUMMARY | Net present Value @ 0% | $171,878 | |||||||||
| Ukraine | RESERVES AND ECONOMICS | Net present Value @ 5% | $111,677 | |||||||||
| Initial flow rate 250 Mcfd/w ell | As of December, 2014 | Net Present Value @ 10% | $77,808 | |||||||||
| 100% W.I.,75% N.R.I. | CONSTANT PRICES | Net Present Value @ 15% | $57,295 | |||||||||
| All amounts in $US | no cost recovery | Net Present Value @ 20% | $44,091 | |||||||||
| decline 25% year 1, 10% thereafter | ||||||||||||
| Gross Gas | ||||||||||||
| Year | new | total | Prod | Price | revenue | Royalty | Net | Op Costs | Future Btax | Taxes | Future Atax | Cumulative |
| wells | # of wells | Mcf | $000s | $000s | Revenue | Cash Flow | 18% | Cash Flow | Cash Flow | |||
| (100% WI) | $/Mcf* | (100% WI) | (25%) | $000s | $000s | $000s | $000s | $000s | $000s | |||
| 2014 | 0 | 2 | 23,942 | $10.97 | $263 | $66 | $197 | $36 | $161 | $29 | $132 | $132 |
| 2015 | 7 | 9 | 689,063 | $10.97 | $7,559 | $1,890 | $5,669 | $54 | $5,615 | $1,011 | $4,605 | $4,737 |
| 2016 | 7 | 16 | 1,156,094 | $10.97 | $12,682 | $3,171 | $9,512 | $96 | $9,416 | $1,695 | $7,721 | $12,457 |
| 2017 | 4 | 20 | 1,346,734 | $10.97 | $14,774 | $3,693 | $11,080 | $120 | $10,960 | $1,973 | $8,987 | $21,445 |
| 2018 | 4 | 24 | 1,518,311 | $10.97 | $16,656 | $4,164 | $12,492 | $144 | $12,348 | $2,223 | $10,125 | $31,570 |
| 2019 | 4 | 28 | 1,672,730 | $10.97 | $18,350 | $4,587 | $13,762 | $168 | $13,594 | $2,447 | $11,147 | $42,718 |
| 2020 | 4 | 32 | 1,811,707 | $10.97 | $19,874 | $4,969 | $14,906 | $192 | $14,714 | $2,648 | $12,065 | $54,783 |
| 2021 | 4 | 36 | 1,936,786 | $10.97 | $21,247 | $5,312 | $15,935 | $216 | $15,719 | $2,829 | $12,890 | $67,672 |
| 2022 | 4 | 40 | 2,049,358 | $10.97 | $22,481 | $5,620 | $16,861 | $240 | $16,621 | $2,992 | $13,629 | $81,302 |
| 2023 | 1 | 41 | 1,920,984 | $10.97 | $21,073 | $5,268 | $15,805 | $246 | $15,559 | $2,801 | $12,758 | $94,060 |
| 2024 | 41 | 1,728,886 | $10.97 | $18,966 | $4,741 | $14,224 | $246 | $13,978 | $2,516 | $11,462 | $105,522 | |
| 2025 | 41 | 1,555,997 | $10.97 | $17,069 | $4,267 | $12,802 | $246 | $12,556 | $2,260 | $10,296 | $115,818 | |
| 2026 | 41 | 1,400,398 | $10.97 | $15,362 | $3,841 | $11,522 | $246 | $11,276 | $2,030 | $9,246 | $125,064 | |
| 2027 | 41 | 1,260,358 | $10.97 | $13,826 | $3,457 | $10,370 | $246 | $10,124 | $1,822 | $8,301 | $133,366 | |
| 2028 | 41 | 1,134,322 | $10.97 | $12,444 | $3,111 | $9,333 | $246 | $9,087 | $1,636 | $7,451 | $140,817 | |
| 2029 | 41 | 1,020,890 | $10.97 | $11,199 | $2,800 | $8,399 | $246 | $8,153 | $1,468 | $6,686 | $147,502 | |
| 2030 | 41 | 918,801 | $10.97 | $10,079 | $2,520 | $7,559 | $246 | $7,313 | $1,316 | $5,997 | $153,499 | |
| 2031 | 41 | 826,921 | $10.97 | $9,071 | $2,268 | $6,803 | $246 | $6,557 | $1,180 | $5,377 | $158,877 | |
| 2032 | 41 | 744,229 | $10.97 | $8,164 | $2,041 | $6,123 | $246 | $5,877 | $1,058 | $4,819 | $163,696 | |
| 2033 | 41 | 669,806 | $10.97 | $7,348 | $1,837 | $5,511 | $246 | $5,265 | $948 | $4,317 | $168,013 | |
| 2034 | 41 | 602,825 | $10.97 | $6,613 | $1,653 | $4,960 | $246 | $4,714 | $848 | $3,865 | $171,878 | |
| 25,989,140 | 285,101 | 71,275 | 213,826 | $4,218 | 209,608 | 37,729 | 171,878 | |||||
| 41 |
Great East, Lysychansko-Toshkivskay, Ukraine, N151-101, 2014
Table 25, Forecast Cash Flow, Escalated Price, Staggered Drill Program, Cost Recovery
| Great East | BT($000s) | ||||||||||||
| Escalated Prices | SUMMARY | Net present Value @ 0% | $132,289 | ||||||||||
| Ukraine | RESERVES AND ECONOMICS | Net present Value @ 5% | $62,534 | ||||||||||
| Initial flow rate 250 Mcfd/w ell | As of December, 2014 | Net Present Value @ 10% | $33,068 | ||||||||||
| 100% W.I.,75% N.R.I. | ESCALATED PRICES | Net Present Value @ 15% | $16,293 | ||||||||||
| All amounts in $US | with cost recovery | Net Present Value @ 20% | $7,179 | ||||||||||
| decline 25% year 1, 10% thereafter | |||||||||||||
| Gross Gas | |||||||||||||
| Year | new | total | Prod | Price | revenue | Royalty | Net | Op Cost | Capital | Future Btax | Taxes | Future Atax | Cumulative |
| wells | # of wells | Mcf | $000s | $000s | Revenue | Expense | Cash Flow | 18% | Cash Flow | Cash Flow | |||
| (100% WI) | $/Mcf* | (100% WI) | (25%) | $000s | 000$ | 000$ | 000$ | 000$ | $000s | $000s | |||
| 2014 | 0 | 2 | 23,942 | $10.97 | $263 | $66 | $197 | $36 | $0 | $161 | $29 | $132 | $132 |
| 2015 | 7 | 9 | 689,063 | $10.97 | $7,559 | $1,890 | $5,669 | $54 | $11,150 | -$5,535 | $0 | -$5,535 | -$5,403 |
| 2016 | 7 | 16 | 1,156,094 | $11.19 | $12,936 | $3,234 | $9,702 | $96 | $17,700 | -$8,094 | $0 | -$8,094 | -$13,497 |
| 2017 | 4 | 20 | 1,346,734 | $11.41 | $15,371 | $3,843 | $11,528 | $120 | $11,800 | -$392 | $0 | -$392 | -$13,889 |
| 2018 | 4 | 24 | 1,457,061 | $11.64 | $16,962 | $4,241 | $12,722 | $144 | $11,800 | $778 | $140 | $638 | -$13,251 |
| 2019 | 4 | 28 | 1,617,605 | $11.87 | $19,208 | $4,802 | $14,406 | $168 | $11,800 | $2,438 | $439 | $1,999 | -$11,252 |
| 2020 | 28 | 1,455,844 | $12.11 | $17,633 | $4,408 | $13,225 | $168 | $13,057 | $2,350 | $10,706 | -$546 | ||
| 2021 | 4 | 32 | 1,616,510 | $12.35 | $19,970 | $4,993 | $14,978 | $192 | $11,800 | $2,986 | $537 | $2,448 | $1,903 |
| 2022 | 32 | 1,454,859 | $12.60 | $18,333 | $4,583 | $13,750 | $192 | $13,558 | $2,440 | $11,117 | $13,020 | ||
| 2023 | 4 | 36 | 1,615,623 | $12.85 | $20,766 | $5,191 | $15,574 | $216 | $11,800 | $3,558 | $640 | $2,918 | $15,938 |
| 2024 | 36 | 1,454,061 | $13.11 | $19,063 | $4,766 | $14,297 | $216 | $14,081 | $2,535 | $11,547 | $27,484 | ||
| 2025 | 4 | 40 | 1,921,155 | $13.37 | $25,690 | $6,423 | $19,268 | $240 | $11,800 | $7,228 | $1,301 | $5,927 | $33,411 |
| 2026 | 40 | 1,729,039 | $13.64 | $23,584 | $5,896 | $17,688 | $240 | $17,448 | $3,141 | $14,307 | $47,718 | ||
| 2027 | 1 | 41 | 1,709,260 | $13.91 | $23,780 | $5,945 | $17,835 | $246 | $2,700 | $14,889 | $2,680 | $12,209 | $59,928 |
| 2028 | 41 | 1,538,334 | $14.19 | $21,830 | $5,458 | $16,373 | $246 | $16,127 | $2,903 | $13,224 | $73,152 | ||
| 2029 | 41 | 1,384,501 | $14.47 | $20,040 | $5,010 | $15,030 | $246 | $14,784 | $2,661 | $12,123 | $85,275 | ||
| 2030 | 41 | 1,246,051 | $14.76 | $18,397 | $4,599 | $13,798 | $246 | $13,552 | $2,439 | $11,112 | $96,387 | ||
| 2031 | 41 | 1,121,446 | $15.06 | $16,888 | $4,222 | $12,666 | $246 | $12,420 | $2,236 | $10,185 | $106,572 | ||
| 2032 | 41 | 1,009,301 | $15.36 | $15,504 | $3,876 | $11,628 | $246 | $11,382 | $2,049 | $9,333 | $115,904 | ||
| 2033 | 41 | 908,371 | $15.67 | $14,232 | $3,558 | $10,674 | $246 | $10,428 | $1,877 | $8,551 | $124,456 | ||
| 2034 | 41 | 817,534 | $15.98 | $13,065 | $3,266 | $9,799 | $246 | $9,553 | $1,720 | $7,833 | $132,289 | ||
| 27,272,387 | 361,074 | 90,269 | 270,806 | 4,050 | 102,350 | 164,406 | 32,117 | 132,289 | |||||
| 42 |
Great East, Lysychansko-Toshkivskay, Ukraine, N151-101, 2014
Table 26, Forecast Cash Flow, Escalated Price, Staggered Drill Program, No Cost Recove
| Great East | BT($000s) | |||||||||||
| Escalated Prices | SUMMARY | Net present Value @ 0% | $218,740 | |||||||||
| Ukraine | RESERVES AND ECONOMICS | Net present Value @ 5% | $133,578 | |||||||||
| Initial flow rate 250 Mcfd/w ell | As of December, 2014 | Net Present Value @ 10% | $88,526 | |||||||||
| 100% W.I.,75% N.R.I. | ESCALATED PRICES | Net Present Value @ 15% | $62,766 | |||||||||
| All amounts in $US | no cost recovery | Net Present Value @ 20% | $46,999 | |||||||||
| decline 25% year 1, 10% thereafter | ||||||||||||
| Gross Gas | ||||||||||||
| Year | new | total | Prod | Price | revenue | Royalty | Net | Op Costs | Future Btax | Taxes | Future Atax | Cumulative |
| wells | # of wells | Mcf | 2% escalation | $000s | $000s | Revenue | Cash Flow | 18% | Cash Flow | Cash Flow | ||
| (100% WI) | $/Mcf | (100% WI) | (25%) | $000s | 000$ | 000$ | 000$ | $000s | $000s | |||
| 2014 | 0 | 2 | 23,942 | $10.97 | $263 | $66 | $197 | $36 | $161 | $29 | $132 | $132 |
| 2015 | 7 | 9 | 689,063 | $10.97 | $7,559 | $1,890 | $5,669 | $54 | $5,615 | $1,011 | $4,605 | $4,737 |
| 2016 | 7 | 16 | 1,156,094 | $11.19 | $12,936 | $3,234 | $9,702 | $96 | $9,606 | $1,729 | $7,877 | $12,613 |
| 2017 | 4 | 20 | 1,346,734 | $11.41 | $15,371 | $3,843 | $11,528 | $120 | $11,408 | $2,053 | $9,354 | $21,968 |
| 2018 | 4 | 24 | 1,457,061 | $11.64 | $16,962 | $4,241 | $12,722 | $144 | $12,578 | $2,264 | $10,314 | $32,282 |
| 2019 | 4 | 28 | 1,617,605 | $11.87 | $19,208 | $4,802 | $14,406 | $168 | $14,238 | $2,563 | $11,675 | $43,957 |
| 2020 | 28 | 1,455,844 | $12.11 | $17,633 | $4,408 | $13,225 | $168 | $13,057 | $2,350 | $10,706 | $54,663 | |
| 2021 | 4 | 32 | 1,616,510 | $12.35 | $19,970 | $4,993 | $14,978 | $192 | $14,786 | $2,661 | $12,124 | $66,788 |
| 2022 | 32 | 1,454,859 | $12.60 | $18,333 | $4,583 | $13,750 | $192 | $13,558 | $2,440 | $11,117 | $77,905 | |
| 2023 | 4 | 36 | 1,615,623 | $12.85 | $20,766 | $5,191 | $15,574 | $216 | $15,358 | $2,764 | $12,594 | $90,499 |
| 2024 | 36 | 1,454,061 | $13.11 | $19,063 | $4,766 | $14,297 | $216 | $14,081 | $2,535 | $11,547 | $102,045 | |
| 2025 | 4 | 40 | 1,921,155 | $13.37 | $25,690 | $6,423 | $19,268 | $240 | $19,028 | $3,425 | $15,603 | $117,648 |
| 2026 | 40 | 1,729,039 | $13.64 | $23,584 | $5,896 | $17,688 | $240 | $17,448 | $3,141 | $14,307 | $131,955 | |
| 2027 | 1 | 41 | 1,709,260 | $13.91 | $23,780 | $5,945 | $17,835 | $246 | $17,589 | $3,166 | $14,423 | $146,378 |
| 2028 | 41 | 1,538,334 | $14.19 | $21,830 | $5,458 | $16,373 | $246 | $16,127 | $2,903 | $13,224 | $159,602 | |
| 2029 | 41 | 1,384,501 | $14.47 | $20,040 | $5,010 | $15,030 | $246 | $14,784 | $2,661 | $12,123 | $171,725 | |
| 2030 | 41 | 1,246,051 | $14.76 | $18,397 | $4,599 | $13,798 | $246 | $13,552 | $2,439 | $11,112 | $182,838 | |
| 2031 | 41 | 1,121,446 | $15.06 | $16,888 | $4,222 | $12,666 | $246 | $12,420 | $2,236 | $10,185 | $193,022 | |
| 2032 | 41 | 1,009,301 | $15.36 | $15,504 | $3,876 | $11,628 | $246 | $11,382 | $2,049 | $9,333 | $202,355 | |
| 2033 | 41 | 908,371 | $15.67 | $14,232 | $3,558 | $10,674 | $246 | $10,428 | $1,877 | $8,551 | $210,906 | |
| 2034 | 41 | 817,534 | $15.98 | $13,065 | $3,266 | $9,799 | $246 | $9,553 | $1,720 | $7,833 | $218,740 | |
| 27,272,387 | 361,074 | 90,269 | 270,806 | $4,050 | 266,756 | 48,016 | 218,740 | |||||
| 43 |
Great East, Lysychansko-Toshkivskay, Ukraine, N151-101, 2014
44