Attached files
| file | filename |
|---|---|
| EX-10.1.22 - EX-10.1.22 - DIGITALGLOBE, INC. | dgi-20141231ex10122a0cc.htm |
| EX-10.1.23 - EX-10.1.23 - DIGITALGLOBE, INC. | dgi-20141231ex10123dace.htm |
| EX-21.1 - EX-21.1 - DIGITALGLOBE, INC. | dgi-20141231ex21141f6bf.htm |
| EX-10.1.24 - EX-10.1.24 - DIGITALGLOBE, INC. | dgi-20141231ex101242fe7.htm |
| EX-31.2 - EX-31.2 - DIGITALGLOBE, INC. | dgi-20141231ex3128daba7.htm |
| EX-23.1 - EX-23.1 - DIGITALGLOBE, INC. | dgi-20141231ex231b967c8.htm |
| EX-10.8.3 - EX-10.8.3 - DIGITALGLOBE, INC. | dgi-20141231ex108394386.htm |
| EX-10.1.21 - EX-10.1.21 - DIGITALGLOBE, INC. | dgi-20141231ex101213d48.htm |
| EX-31.1 - EX-31.1 - DIGITALGLOBE, INC. | dgi-20141231ex311f53378.htm |
| EX-10.8.2 - EX-10.8.2 - DIGITALGLOBE, INC. | dgi-20141231ex10825c847.htm |
| EX-32.2 - EX-32.2 - DIGITALGLOBE, INC. | dgi-20141231ex3225fe05f.htm |
| EXCEL - IDEA: XBRL DOCUMENT - DIGITALGLOBE, INC. | Financial_Report.xls |
| EX-10.8.1 - EX-10.8.1 - DIGITALGLOBE, INC. | dgi-20141231ex1081be47a.htm |
| EX-32.1 - EX-32.1 - DIGITALGLOBE, INC. | dgi-20141231ex321f7c5b9.htm |
UNITED STATES
SECURITIES AND EXCHANGE COMMISSION
Washington, D.C. 20549
FORM 10-K
(Mark one)
☒ANNUAL REPORT PURSUANT TO SECTION 13 OR 15(d) OF THE SECURITIES EXCHANGE ACT OF 1934
For the fiscal year ended December 31, 2014
OR
☐TRANSITION REPORT PURSUANT TO SECTION 13 OR 15(d) OF THE SECURITIES EXCHANGE ACT OF 1934
For the transition period from: to
Commission File No. 001-34299
DIGITALGLOBE, INC.
(Exact name of registrant as specified in its charter)
|
Delaware |
|
31-1420852 |
|
(State or other jurisdiction of incorporation or organization) |
|
(I.R.S. Employer Identification No.) |
|
|
|
|
|
1601 Dry Creek Drive, Suite 260 |
|
80503 |
|
(Address of principal executive office) |
|
(Zip Code) |
(303) 684-4000
(Registrant’s telephone number, including area code)
Securities registered pursuant to Section 12(b) of the Act:
|
Common Stock, par value $0.001 per share |
|
New York Stock Exchange |
|
(Title of each class) |
|
(Name of each exchange on which registered) |
Securities registered pursuant to Section 12(g) of the Act: Not Applicable
Indicate by check mark if the registrant is a well-known seasoned issuer, as defined in Rule 405 of the Securities Act. Yes ☒ No ☐
Indicate by check mark if the registrant is not required to file reports pursuant to Section 13 or 15(d) of the Act. Yes ☐ No ☒
Indicate by check mark whether the registrant (1) has filed all reports required to be filed by Section 13 or 15(d) of the Securities Exchange Act of 1934 during the preceding 12 months (or for such shorter period that the registrant was required to file such reports) and (2) has been subject to such filing requirements for the past 90 days. Yes ☒ No ☐
Indicate by check mark whether the registrant has submitted electronically and posted on its corporate Web site, if any, every Interactive Data File required to be submitted and posted pursuant to Rule 405 of Regulation S-T (§232.405 of this chapter) during the preceding 12 months (or for such shorter period that the registrant was required to submit and post such files). Yes ☒ No ☐
Indicate by check mark if disclosure of delinquent filers pursuant to Item 405 of Regulation S-K is not contained herein, and will not be contained, to the best of the registrant’s knowledge, in definitive proxy or information statements incorporated by reference in Part III of this Form 10-K or any amendment to this Form 10-K. ☐
Indicate by check mark whether the registrant is a large accelerated filer, an accelerated filer, or a smaller reporting company. (See definitions of “large accelerated filer”, “accelerated filer” and “smaller reporting company” in Rule 12b-2 of the Exchange Act).
|
Large accelerated filer ☒ |
|
Accelerated filer ☐ |
|
Non-accelerated filer ☐ |
|
Smaller reporting company ☐ |
Indicate by check mark whether the registrant is a shell company (as defined in Rule 12b-2 of the Act). Yes ☐ No ☒
State the aggregate market value of the voting and non-voting common equity held by non-affiliates computed by reference to the price at which the common equity was last sold, or the average bid and asked price of such common equity, as of the last business day of the registrant’s most recently completed second fiscal quarter: The aggregate market value of the registrant’s common stock held by non-affiliates, computed by reference to the closing sale price of $27.80 as reported by the New York Stock Exchange on June 30, 2014 was $2.1 billion.
The number of shares of the registrant’s common stock, $0.001 par value, outstanding as of February 19, 2015 (latest practicable date) was 72,545,985 shares.
Documents Incorporated by Reference: Portions of the registrant’s Definitive Proxy Statement for the 2015 Annual Meeting of Stockholders are incorporated by reference into Part III.
TABLE OF CONTENTS
1
SPECIAL NOTE REGARDING FORWARD-LOOKING STATEMENTS
Certain statements contained herein and in other of our reports, filings, and public announcements may contain or incorporate forward-looking statements within the meaning of the Private Securities Litigation Reform Act of 1995, as amended. Forward-looking statements relate to future events or our future financial performance. We generally identify forward-looking statements by terminology such as “may,” “will,” “should,” “expects,” “plans,” “anticipates,” “could,” “intends,” “target,” “projects,” “contemplates,” “believes,” “estimates,” “predicts,” “potential” or “continue” or the negative of these terms or other similar words, although not all forward-looking statements contain these words.
Any forward-looking statements are based upon our historical performance and on our current plans, estimates and expectations. The inclusion of this forward-looking information should not be regarded as a representation by us that the future plans, estimates or expectations will be achieved. Such forward-looking statements are subject to various risks and uncertainties and assumptions. A number of important factors could cause our actual results or performance to differ materially from those indicated by such forward looking statements, including: the loss, reduction or change in terms of any of our primary contracts or decisions by customers not to exercise renewal options; the availability of government funding for our products and services both domestically and internationally; changes in government and customer priorities and requirements (including cost-cutting initiatives, the potential deferral of awards, terminations or reduction of expenditures to respond to the priorities of Congress and the administration, or budgetary cuts resulting from Congressional committee recommendations or automatic sequestration under the Budget Control Act of 2011); the risk that U.S. government sanctions against specified companies and individuals in Russia may limit our ability to conduct business with potential or existing customers; the risk that anticipated benefits and synergies from the strategic combination of the Company and GeoEye, Inc. cannot be fully realized or may take longer to realize than expected; the outcome of pending or threatened litigation; the loss or impairment of any of our satellites; delays in the construction and launch of any of our satellites or our ability to achieve and maintain full operational capacity of all our satellites; delays in implementation of planned ground system and infrastructure enhancements; loss or damage to the content contained in our imagery archives (“ImageLibrary”); interruption or failure of our ground system and other infrastructure; decrease in demand for our imagery products and services; increased competition, including possibly from companies with substantial financial and other resources and services, that may reduce our market share or cause us to lower our prices; our inability to fully integrate acquisitions or to achieve planned synergies; changes in satellite imaging technology; our failure to obtain or maintain required regulatory approvals and licenses; changes in U.S. or foreign law or regulation that may limit our ability to distribute our imagery products and services; the costs associated with being a public Company; and other important factors, all as described more fully in our filings with the U.S. Securities and Exchange Commission (“SEC”), including this Annual Report on Form 10-K.
We undertake no obligation to update any forward-looking statement to reflect events or circumstances after the date on which the statement is made or to reflect the occurrence of unanticipated events. Readers are cautioned not to place undue reliance on any of these forward looking statements.
References in this filing to “DigitalGlobe,” “Company,” “we,” “us,” and “our” refer to DigitalGlobe, Inc. and its consolidated subsidiaries.
“DigitalGlobe,” “GeoEye,” and other trademarks of ours appearing in this annual report are our property. Trade names and trademarks of other companies used in this annual report are for informational purposes only.
2
Overview
DigitalGlobe is a leading global provider of geospatial information products and services sourced from its own advanced satellite constellation. Its products and services support users in a wide variety of fields including defense, intelligence and homeland security, mapping and analysis, environmental monitoring, oil and gas exploration and infrastructure management. Each day users depend on DigitalGlobe’s data, information, technology and expertise to better understand our changing planet in order to save lives, resources and time.
We were originally incorporated as EarthWatch on September 30, 1993 under the laws of the State of Colorado and reincorporated in the State of Delaware on August 21, 1995. On August 22, 2002, we changed our name to DigitalGlobe, Inc. Our common stock has been listed on the New York Stock Exchange (“NYSE”) and traded under the symbol “DGI” since our initial public offering in May 2009.
On January 31, 2013, we completed our acquisition of 100% of the outstanding stock of GeoEye, Inc. (“GeoEye”), a leading provider of geospatial intelligence solutions. Our acquisition of GeoEye broadened our service offerings, enabled us to optimize our satellite orbits and collection of imagery, strengthened our production and analytics capabilities, increased the scale of our existing operations and diversified our customer and product mix.
Industry Overview
The geospatial information services industry consists of private sector and public sector companies, agencies and research institutions that produce products, services and information to display, analyze and interpret geospatial information. The geospatial industry is experiencing significant change and growth as geospatial technology is integrated with internet, telecommunication and other information technology systems. Military and intelligence, civil government and commercial customers have been using imagery and analysis products in a wide variety of applications, including:
|
· |
national defense needs; |
|
· |
humanitarian and relief support in response to natural disasters; |
|
· |
environmental observation and support for climate change monitoring; |
|
· |
internet mapping services for desktop and mobile devices; |
|
· |
design and planning for infrastructure projects, such as asset management, surveying and charting; and |
|
· |
analytic services for industries such as oil and gas, mining, agriculture and financial services. |
We believe there are significant opportunities for continued growth as customers across a wide range of industries realize the benefits of timely and accurate imagery and geospatial analysis on a global scale.
Competition
We compete against various private sector companies and foreign state-sponsored entities that provide satellite and aerial imagery, and related products and services to the commercial market. Our major existing and potential competitors for satellite imagery and information include:
|
· |
companies with satellites including Airbus Defense and Space, ImageSat International N.V., Blackbridge AG (previously known as RapidEye), Planet Labs, Skybox Imaging (owned by Google, Inc.), and Urthecast; |
|
· |
foreign governments that sell their data commercially; |
|
· |
companies that provide geospatial analytic information and services; |
3
|
· |
aggregators of imagery and imagery-related products and services, including Apple, Google and Microsoft; and |
|
· |
aerial providers of high-resolution imagery, whose offerings provide certain benefits over satellite-based imagery, including better resolution and accuracy. |
We compete on the basis of:
|
· |
the technical capabilities of our satellites, such as size of collection area, collection speed, revisit time, resolution, accuracy and spectral diversity; |
|
· |
satellite availability for tasked orders; |
|
· |
the size, comprehensiveness and relevance of our ImageLibrary; |
|
· |
distribution platform and tools that enable customers to easily access and integrate imagery; |
|
· |
value added services, including advanced imagery production and analysis; |
|
· |
timeliness and ready availability of imagery products and services that can be deployed quickly and cost-effectively; and |
|
· |
price. |
For risks associated with competition, see Item 1A, Risk Factors.
Business Strategy
Our long-term business strategy includes two components: (1) grow revenue from our core satellite imagery products and services; and (2) grow revenue from our emerging higher-value information products derived from our imagery, geospatial analytic software and expert services to obtain insight from our imagery. The key elements that we believe will enable us to achieve our long-term business strategy both through organic growth and through acquisitions include:
Grow revenue from the U.S. Government. The U.S. Government provided 60.4% of our 2014 revenue, led by the EnhancedView contract (“EnhancedView Contract”) with the United States National Geospatial-Intelligence Agency (“NGA”), which represents 55.3% of our 2014 revenue. Our EnhancedView Contract has a full potential value of $3.6 billion over the ten year life of the contract and includes a Service Level Agreement (“EnhancedView SLA” or “SLA”), infrastructure enhancements, and other services. Additionally, we provide value added services, such as Global Enhanced GEOINT Delivery (“GEGD”), and analytics solutions to the U.S. Government. The services we provide enable the U.S. Government to serve war-fighters, intelligence officers, first responders and other government users of imagery.
We expect to grow our revenue with the U.S. Government by increasing revenue with the NGA, attracting new U.S. Government customers, and introducing new offerings to better meet U.S. Government customers’ needs. We will accomplish this by seeking new ways to support the U.S. Government with value added services and other innovative products.
Grow revenue from Diversified Commercial customers. Today, Diversified Commercial represents 39.6% of our 2014 revenue. Our largest Diversified Commercial customer type is the Direct Access Program (“DAP”), which comprises 17.0% of our business. Other Diversified Commercial represents 22.6% of our business and includes customers in international defense and intelligence, international civil government, location-based services, energy, and other industry verticals.
We expect to grow Diversified Commercial revenue through current customers, attracting new customers and introducing new products to better meet all of our customers’ needs. We expect to reach new customers by increasing our penetration in existing customer verticals, as well as growing our position in new customer verticals. We will continue to invest in offerings that enable our customers to gain new insights that will help them better support their business objectives. In 2014, the U.S. Department of Commerce approved resolution relief that allows DigitalGlobe to sell imagery to all of its customers at up to 0.25m panchromatic and 1.0m multispectral ground sample distance
4
beginning February 22, 2015. As a result, DigitalGlobe has set a new technical bar for commercial satellite imagery, and our customers will have access to the highest available resolution, revisit rate, capacity, and spectral diversity with our constellation. We expect to continue to introduce new products derived from imagery at scale that enable among other things, automated feature extraction, agriculture boundaries and crop health, land cover classification (e.g., minerals, trees) and seabed mapping.
Strive to achieve operational excellence and drive increasing customer satisfaction. We continue to advance our capabilities, product quality and customer experience enabling growth and margin expansion. We continue to optimize and develop our satellite constellation and ground terminal network in order to increase the capability of our constellation. In 2014, we successfully launched WorldView-3, an industry-leading satellite that brings unique new capabilities to our customers, including industry-best 30cm resolution. We have made investments in our imagery production capabilities that enable us to serve higher quality and quantities of processed imagery via our web services infrastructure, including classified facilities for our U.S. Government customers. We continue to improve our platform capabilities to make imagery and information within our ImageLibrary searchable and easy to access. We continue to concentrate on our quality program that focuses on our products and customer experience on four dimensions, Accuracy, Currency, Completeness and Consistency, aimed at addressing the specific needs of each customer segment that we serve. Additionally, we conduct a formal customer satisfaction program to measure and track our performance.
Behave according to our Purpose, Vision and Values to drive performance. Our corporate Purpose as shown below is “Seeing a Better World — By giving our customers the power to see the Earth clearly and in new ways, we enable them to make our world a better place.” We are relentlessly committed to helping our customers save lives, resources, and time and to achieving our Vision to “by 2020, be the indispensable source of information about our changing planet.” Our Values (integrity, respect, mission and team before self, curiosity and innovation and results matter) guide our actions. Our Purpose, Vision, and Values unite us, creating a working environment that enables us to perform the best work of our careers. Our people are paramount to our continued success, and we continue to attract and develop talent to embrace our Purpose, Vision and Values, achieve our strategy and grow our business.
5
Products and Services
We offer earth imagery products comprised of imagery from our constellation of high-resolution satellites, as well as satellite and aerial imagery acquired from third party suppliers. We also provide geospatial information and insight services in which we combine our earth imagery, analytic expertise and innovative technology to deliver integrated solutions. We process our imagery to varying levels according to our customers’ specifications and deliver our products using the distribution method that best suits our customers’ needs. Customers can purchase satellite or aerial images that are archived in our ImageLibrary, place custom orders to task our satellites for a specific area of interest, or as a bundle of imaging and data for a region or type of location, such as cities, ports, harbors or airports.
Satellite Imagery
Customers specify how they want the imagery content that they are purchasing from us to be produced. Types of images collected are as follows:
|
· |
Panchromatic – black and white imagery that provides the highest resolution band from our constellation. |
|
· |
4-Band Visible and Near Infrared – includes the Red, Green, Blue and Near Infrared bands. These bands approximate the colors the human eye can see, and just beyond the visible into the near infrared. |
|
· |
8-Band Visible and Near Infrared – includes the four bands above plus Coastal Blue, Yellow, Red-Edge, and Near Infrared 2. The near infrared bands support applications such as monitoring crop health and moisture content. |
|
· |
8-Band Short Wave Infrared – this unique WorldView-3 imaging capability (in addition to WorldView-3’s 8-Band Visible and Near Infrared capability) enables applications such as mineral and material detection and visibility through obstructions such as smoke and dust. |
We deliver our satellite imagery content at the following processing levels:
|
· |
Basic imagery - includes the least amount of processing. |
|
· |
Standard imagery – includes radiometric and geometric correction. Radiometric correction enables images to appear uniformly illuminated with the appropriate level of brightness. Geometric correction allows a user to identify the latitudinal, longitudinal and altitudinal location of any point in an image. |
|
· |
Ortho-rectified imagery – includes radiometric, geometric and topographic correction. Topographic correction accounts for terrain and projects images onto the earth as they would be seen by the human eye. |
|
· |
Mosaic imagery products - which merges multiple imagery scenes, collected at different times and dates, into a single seamless imagery product. |
|
· |
Stereo imagery – which consist of two images collected from two different viewpoints along the satellite orbit track that are produced as basic products, but can be viewed in stereo (“3D”) using specialized software. Stereo imagery products are used for the creation of digital elevation maps, for the more accurate creation of 3D maps and flight simulations. |
Direct Access Program
DAP customers are able to directly task and receive imagery from certain of our satellites within local and regional geographic boundaries of interest. We sell these customers facilities enabling them to download and process imagery directly from our satellites. The DAP is designed to meet the enhanced information and operational security needs of a select number of defense and intelligence customers and certain commercial customers. All of our DAP agreements are subject to approval by the U.S. Government.
6
Information Products
We offer many customer-ready information products that are designed to enable customers to understand and analyze specific geographies of interest. Examples of these products include the Basemap product suite, which allows customers to access imagery at various processing levels over our hosted network. Our pansharpening image processing allows us to combine higher resolution black and white imagery with lower resolution color imagery to create high resolution color imagery, which is included in our Basemap product. The Basemap product suite includes add-on imagery or information layers, such as Basemap +Daily, which places an imagery layer containing our most current imagery on top of the Basemap, or Basemap +Vivid (formerly known as Advanced Country Coverage), which is an orthomosaic of imagery processed to provide visually seamless, largely cloud free and color balanced imagery over the Basemap.
Insight Products and Services
Customers are increasingly looking for analytic solutions to derive insights from imagery. These insight products and services help our customers combine imagery and information derived from imagery with other sources of geospatial information to deliver integrated intelligence solutions. We provide analytic solutions that accurately document change and enable geospatial modeling and analysis that helps our customers predict where events will occur to help our customers protect lives, make resource allocation decisions and save time. These services support the U.S. government, international governments, non-government organizations, not-for-profit organizations and other commercial customers.
Product Delivery
We offer a range of on- and off-line distribution options designed to enable customers to easily access and integrate our imagery into their business operations and applications, including desktop software applications and web services that provide for direct on-line access to our ImageLibrary. For example, through our Global Basemap, Spatial On Demand, and GEGD services, we provide hosted on-line access to our imagery for both commercial and government customers. Other distribution options include File Transfer Protocol (“FTP”) and physical media, such as DVD and hard drives.
Customers
We have one reportable segment in which we provide imagery and imagery information products and services to customers around the world. We sell our products and services through a combination of direct and indirect channels, consisting of a global network of resellers, strategic partners, direct enterprise sales and web services to two groups of customers: U.S. Government and Diversified Commercial.
U.S. Government
U.S. Government revenue is sourced from multiple U.S. Government agencies, primarily focused on defense and intelligence, with the NGA as our largest customer. The NGA serves as the primary U.S. Government procurement agency for geospatial information and purchases imagery products and services on behalf of various agencies within the U.S. Government, including defense, intelligence and law enforcement agencies.
EnhancedView
On August 6, 2010, DigitalGlobe entered into the EnhancedView Contract with the NGA. The EnhancedView Contract has a ten-year term, inclusive of nine one-year renewal options exercisable by the NGA, and is subject to Congressional appropriations and the right of the NGA to terminate or suspend the contract at any time.
EnhancedView Service Level Agreement
The EnhancedView SLA totals $2.8 billion over the term of the contract, of which $250.0 million was paid per year ($20.8 million monthly) for the first four contract years commencing on September 1, 2010, and $300.0 million is payable per year ($25.0 million monthly) for the remaining six years of the contract beginning on September 1, 2014. The NGA has exercised the first four options, collectively extending the SLA through August 31, 2015. We believe it is
7
the NGA’s intention to exercise the remaining options, subject to annual appropriation of funding and the federal budget process, which funding contains an inherent level of uncertainty in the current budget environment.
During the first quarter of 2014, DigitalGlobe and the NGA agreed to certain modifications of the EnhancedView Contract that included, among other changes, flexibility in the timing of the imaging capacity step-up in part to accommodate a potential delay of no greater than four months in the launch of WorldView-3. Step-up in the monthly cash payments was not changed, and increased from $20.8 million per month to $25.0 million per month beginning on September 1, 2014.
Each monthly EnhancedView SLA payment is subject to a performance penalty of up to 4% depending upon the Company’s performance against pre-defined performance criteria. A performance penalty is assessed in any month the NGA determines that not all of the performance criteria were met. The Company retains the full monthly cash payment; however, the penalty amount is applied to mutually agreed future products and services or to a pro-rated extension of the EnhancedView SLA beyond the current contract period. There were no penalties during the years ended December 31, 2014. Cumulative penalties over the life of the EnhancedView Contract total $0.4 million, or 0.04%, of our total cash receipts under the contract, all of which was applied to other products.
The Company recognizes revenue for the EnhancedView SLA using a proportional performance method. Under this method, revenue is recognized based on the estimated amount of imaging capacity made available to the NGA in any given period compared to the total estimated imaging capacity to be provided over the life of the contract. On October 1, 2014, WorldView-3 became fully operational and increased constellation capacity was made available to the NGA. Also effective as of that date, we began recognizing revenue at a higher annualized rate of $337.1 million per year for the SLA.
EnhancedView Value Added and Other Services
The EnhancedView Contract also provides up to $750.0 million for value added products and services, infrastructure enhancements, and other services, including the option for the NGA to require the Company to lower the altitude of WorldView-2 from its current altitude of 770 kilometers to an altitude of 496 kilometers. Value added products and services enable us to meet the NGA’s more advanced imagery requirements using our production and dissemination capabilities. In 2014, we recognized $84.6 million in revenue for value-added products and services and have recognized $194.2 million cumulatively since the inception of the EnhancedView Contract.
NextView
In connection with our NextView agreement with the NGA, which was entered into in September 2003 and was the predecessor to our current EnhancedView Contract, we received $266.0 million to offset the construction costs of WorldView-1, which was recorded as deferred revenue when received. When WorldView-1 reached full operational capability (“FOC”) in November 2007, we began recognizing the deferred revenue on a straight-line basis over the estimated useful life of WorldView-1, originally expected to end in the second quarter of 2018. In the fourth quarter of 2014, the Company extended the estimated useful life of WorldView-1through the fourth quarter of 2020, and on a prospective basis adjusted the period over which we recognize this revenue as well. This change reduced the recognition of NextView deferred revenue by $10.4 million annually and $2.6 million per quarter. Based on the estimated useful life of WorldView-1, we recognized $22.9 million of revenue related to the pre-FOC payments for the year ended December 31, 2014 and $25.5 million each of the years ended December 31, 2013 and 2012. Cumulatively, since WorldView-1 reached FOC, we have recognized $177.2 million of pre-FOC revenue, and at December 31, 2014 had deferred revenue remaining of $88.8 million, expected to be amortized through the fourth quarter of 2020.
DigitalGlobe Intelligence Solutions
DigitalGlobe Intelligence Solutions supports a wide range of customers who require multiple forms of geospatial intelligence to facilitate decision making. We work with many defense and intelligence customers to provide embedded analytic services, foundational geospatial data and unique technology solutions that support military intelligence missions around the globe. While we primarily support U.S. Government customers, many of our capabilities also
8
support intelligence requirements from international governments, non-government organizations and commercial customers.
Diversified Commercial
Diversified Commercial includes customers in the Direct Access Program, international defense and intelligence, international civil government, location-based services (“LBS”), energy, and other industry verticals.
Direct Access Program
We earn revenue from sales of DAP facilities, service fees to access our satellite constellation, as well as other imagery and information product sales. As of December 31, 2014, we had DAP agreements in ten countries. In 2014, we generated $111.3 million in revenue from our DAP customers representing 17.0% of our total revenue.
Other Diversified Commercial
We sell imagery and information services to international civil governments for use in applications such as infrastructure planning, taxation, rescue and recovery services, forestry and agriculture, and to providers of location-based services including internet portals, connected devices and digital mapmakers, who use our imagery products and services to expand their products and services. We sell imagery and information services to energy customers to enable efficient discovery, production and development of energy resources. Customers in other industry verticals represent mining, utilities, agriculture, retail, manufacturing, financial services and global development organizations that purchase our imagery, information and insight services for a wide variety of applications.
We typically sell to international civil government and industry verticals customers through our global resellers and partners, and we primarily sell directly to international defense and intelligence customers, energy customers and providers of LBS. Our diversified commercial revenue is generated through annual and multi-year contracts, which may include one-time data deliveries.
Satellite Constellation and Ground System Operations
In-orbit Satellites
On August 13, 2014, DigitalGlobe successfully launched WorldView-3, the world’s highest resolution and most capable commercial earth observation satellite. On October 1, 2014, the Company completed the needed calibrations on WorldView-3 to enable it to provide visible spectrum imagery to its customers. As anticipated, Quickbird stopped capturing commercial images on December 17, 2014 and de-orbited on January 27, 2015. Additionally, in the first quarter of 2015, the Company stopped making new IKONOS imagery commercially available and committed to a plan to decommission the satellite.
9
The following table summarizes the primary characteristics of the in-orbit operational satellites in our constellation as of December 31, 2014:
|
|
|
|
|
|
|
Annual Collection |
|
|
|
|
|
|
|
|
|
|
Capacity (million |
|
Orbital Altitude |
|
|
Satellite |
|
Launch Date |
|
Best Ground Resolution |
|
square kilometers) |
|
(kilometers) |
|
|
WorldView-3 |
|
August 2014 |
|
31-centimeters black and white, or color 1.24-meter multi-spectral |
|
248 |
|
617 |
|
|
WorldView-2 |
|
October 2009 |
|
46-centimeters black and white, or color 1.84-meter multi-spectral |
|
427 |
|
770 |
|
|
WorldView-1 |
|
September 2007 |
|
50-centimeters black and white |
|
569 |
|
496 |
|
|
GeoEye-1 |
|
September 2008 |
|
41-centimeters black and white, or color 1.64-meter multi-spectral |
|
128 |
|
681 |
|
|
IKONOS |
|
September 1999 |
|
82-centimeters black and white, or color 3.28-meter multi-spectral |
|
36 |
|
681 |
|
|
|
|
Expected End |
|
Original Cost |
|
Net Book Value |
|
||
|
Satellite |
|
of Depreciable Life |
|
(millions) |
|
(millions) |
|
||
|
WorldView-3 |
|
Q1 2026 |
|
$ |
649.5 |
|
$ |
635.4 |
|
|
WorldView-2 |
|
Q4 2022 |
|
|
463.2 |
|
|
255.3 |
|
|
WorldView-1 |
|
Q4 2020 |
|
|
473.2 |
|
|
156.4 |
|
|
GeoEye-1 |
|
Q1 2018 |
|
|
211.8 |
(1) |
|
130.6 |
|
|
QuickBird |
|
Q2 2014 |
|
|
174.4 |
|
|
— |
|
|
IKONOS |
|
Q3 2013 |
|
|
1.0 |
(1) |
|
— |
|
|
(1) |
Fair value as of January 31, 2013, the acquisition date of GeoEye. |
Satellites Under Construction
During the fourth quarter of 2014, we completed certain enhancements to WorldView-4 and placed the satellite in storage. While in storage, we will evaluate the satellite for further potential enhancements. We do not anticipate that the imaging technology and capabilities of the WorldView-4 satellite will experience any significant obsolescence during the satellite storage period. We intend to launch and place into service our WorldView-4 satellite in mid-2016 for additional capacity as a result of anticipated incremental growth opportunities.
Satellite Insurance
We procure insurance covering risks associated with our satellite operations including the partial or total impairment of the functional capacity of the satellite. We insure certain satellites in our constellation to the extent that insurance is available at acceptable premiums. In 2014, we did not insure the IKONOS or QuickBird satellites against functional capacity impairment, given the stage of their useful lives. While in storage, our WorldView-4 satellite insurance is
10
provided by the third-parties that are providing the construction services. As of December 31, 2014, we maintained the following insurance coverage on our satellite constellation:
|
|
|
|
|
Coverage |
|
|
|
Satellite |
|
Policy Period |
|
(in millions) |
|
|
|
WorldView-3 (1) |
|
8/2014 - 8/2019 |
|
$ |
340.0 |
|
|
WorldView-2 |
|
10/2014 - 10/2015 |
|
|
220.0 |
|
|
WorldView-1 |
|
10/2014 - 10/2015 |
|
|
220.0 |
|
|
GeoEye-1 |
|
10/2014 - 10/2015 |
|
|
200.0 |
|
|
(1) |
Inclusive of 1-year, 3-year and 5-year in-orbit insurance coverage of $215.0 million, $40.0 million and $85.0 million, respectively |
Satellite insurance premiums, corresponding to the launch and in-orbit commissioning period prior to the satellite being placed into service, are capitalized in the original cost of the satellite and are amortized over the estimated useful life of the asset. The remainder of the insurance premiums that are not capitalized as part of the satellite are recorded as prepaid expenses that are amortized ratably over the related policy periods and included as selling, general and administrative costs.
Ground Terminals and Image Processing Facilities
As of December 31, 2014, we owned or leased 13 operational remote ground terminals (“RGT”) located throughout the world. Each ground terminal is strategically placed to optimize contact with our satellites on their orbital paths. Each of our satellites orbits the earth approximately 15 times per day, communicating with one or more of our ground terminals. Our image processing facility at our Longmont, Colorado headquarters houses the hardware and software systems and personnel required to operate and control our satellites as well as process, store and distribute our imagery. Operational control of our satellites and all data related processing, storing and distribution are primarily managed from our facility in Longmont, Colorado.
Intellectual Property
We rely on licenses of certain intellectual property to conduct our business operations, including certain proprietary rights from third parties to enable us to operate our satellites, ground terminals, collection systems and other various components of our systems. In addition, we actively pursue internal development of intellectual property. We have registered, and applied for the registration of, U.S. and international trademarks, service marks, domain names and copyrights. Additionally, we have been issued and have filed for U.S. and international patent applications covering certain of our proprietary technology and processes.
Regulation
Operations
The satellite operations portion of our business is highly regulated. The Department of Commerce (“DoC”), pursuant to the National and Commercial Space Programs Act of 2010 (successor legislation to the 1992 Land Remote Sensing Policy Act, as amended), has the primary regulatory authority over our industry. The DoC delegated responsibility for satellite remote sensing operations to NOAA. Each of our satellites is required to be individually licensed for operation by NOAA. We currently have licenses for all in-orbit satellites (“NOAA licenses”). Our NOAA licenses require us to obtain prior approval from NOAA for any significant and substantial foreign agreements, and generally require us to operate our satellite system in a manner that is consistent with U.S. national security and foreign policy objectives. In addition, the NOAA licenses allow the U.S. Government to suspend our imaging activities in certain cases, if deemed necessary, for national security reasons. The NOAA licenses are valid for the operational life of the satellites, provided that we comply with the licensing terms.
11
The launch of our satellites and the communication links, both uplink and downlink, are regulated by the U.S. Federal Communications Commission (“FCC”). FCC licenses must be obtained for each individual satellite. The FCC is the governmental agency with primary authority in the United States over the commercial use of the satellite frequency spectrum. We currently have the requisite licensing authority from the FCC to operate all in-orbit satellites. The FCC has also granted licenses to operate ground terminals for our satellites. The FCC’s rules and regulations and terms of our licenses require that we comply with various operating conditions and requirements. Failure to comply with these or other conditions or requirements could lead to sanctions, up to and including revocation, cancellation or non-renewal of our licenses. In addition to the FCC’s requirements, our satellites must undergo the frequency coordination and registration process of the International Telecommunications Union (“ITU”), as well as a variety of other federal and international regulations.
Sales
Satellite imagery does not require an export license in order to be sold internationally. Our ability to sell certain imagery products and value added services may be subject to sanctions or embargoes imposed by the U.S. Government against particular entities or individuals, against other countries or by foreign government regulation.
Direct access to the satellites under the DAP constitute significant and substantial foreign agreements under our NOAA license and require approval from NOAA under the terms of our NOAA license. In addition, we or our suppliers must obtain export licenses from the Department of State (“DoS”) for the export of certain equipment and related technology necessary to enable the DAP access. The ground terminal equipment and related technology necessary to allow access to the satellites are controlled under the International Traffic in Arms Regulations (“ITAR”). The approval process for these sales usually takes approximately two to three months, and there is no obligation on the part of either NOAA or the DoS to approve any transaction. In addition to required U.S. Government approvals, the export of equipment from Canada by our DAP equipment supplier, MacDonald Dettwiler & Associated Ltd., is subject to Canadian export license requirements. Our DAP customers may also be required to obtain additional approvals from the government of the country in which the ground terminal is to be operated.
Ownership
We are obligated under our NOAA licenses to monitor and report increases in foreign ownership of common stock of the Company, and any agreement for ownership of 20% or greater of our common stock is subject to NOAA approval. We are also required to report certain common stock foreign ownership levels to the Defense Security Service and to comply with certain rules and regulations to mitigate foreign influence as part of maintaining our facility security clearances. Our facility security clearance allows us to perform work on U.S. Government classified contracts. A transfer to foreign ownership also could trigger other requirements including filings with, and review by, the Committee on Foreign Investment in the United States pursuant to the Exon-Florio provision. Depending on the country of origin and identity of foreign owners, other restrictions and requirements may also arise.
Business Seasonality
We have historically experienced higher revenues in the second half of the year, peaking in the fourth quarter, due in part to the procurement cycles of U.S. and international governments as well as increased demand from commercial customers. However, historical seasonal patterns should not be considered a reliable indicator of our future revenues or financial performance.
Employees
As of December 31, 2014, we had 1,339 full-time employees.
We currently do not have any collective bargaining agreements with our employees. We have employment agreements with certain of our key employees.
12
Environmental Regulation
Our operations are regulated under various federal, state, local and international laws governing the environment, including laws governing the discharge of pollutants into the soil, air and water, the management and disposal of hazardous substances and wastes, and the cleanup of contaminated sites. We have infrastructures in place to ensure that our operations are in compliance with all applicable environmental regulations. We do not believe that the costs of compliance with these laws and regulations will have a material adverse effect on our capital expenditures, operating results or competitive position. The imposition of more stringent standards or requirements under environmental laws or regulations or a determination that we are responsible for the release of hazardous substances at our sites could result in expenditures in excess of amounts currently estimated to be required for such matters. While no material exposures have been identified to date that we are aware of, there can be no assurance that additional environmental matters will not arise in the future, or that costs will not be incurred with respect to sites as to which no problem is currently known.
Company Address and Website
Our website can be accessed at http://www.digitalglobe.com. The website contains information about us and our operations. Through a link on the Investor Relations section of our website, copies of our filings with the SEC on Forms 8-K, 10-Q and 10-K can be viewed and downloaded free of charge as soon as reasonably practicable after the reports have been filed or furnished with the SEC. The information on our website is not incorporated by reference and is not a part of this Annual Report on Form 10-K. Additionally, the SEC maintains a website that contains reports, proxy and information statements, and other information regarding our filings at http://www.sec.gov. Our principal executive offices are located at 1601 Dry Creek Drive, Suite 260, Longmont, Colorado, 80503.
Risks
Our business is subject to many risks. The occurrence of any of the following risks could materially and adversely affect our business, financial condition, prospects, results of operations and cash flows. Additional risks and uncertainties not currently known to us or that we currently deem to be immaterial may also materially adversely affect our business, prospects, financial condition, results of operations and cash flows.
Risks Related To Our Business
The loss or reduction in scope of any one of our primary contracts will materially reduce our revenue. The majority of our revenue is currently derived from a single contract with a U.S. Government agency that can be terminated at any time.
We derived 68.6% of our revenue from our top five customers in 2014. These contracts may be terminated in the future, or may not be renewed or extended, and the loss of any one of these customers would materially reduce our net revenue and could have a material adverse effect on our business financial condition and results of operations.
We generated 55.3% of our revenue through the NGA and 38.9% from the EnhancedView SLA in 2014. Our contracts with U.S. Government agencies are subject to risks of termination or reduction in scope due to changes in U.S. Government policies, priorities or funding level commitments to various agencies. Under the EnhancedView SLA, we are obligated to make a portion of the image tasking capacity of the WorldView constellation available to the NGA, including specified priority access rights. To support requirements under the EnhancedView Contract, we launched and placed into service our fully commissioned WorldView-3 satellite in October 2014, and we are investing in infrastructure to integrate certain of our operations more closely with the NGA. Beginning September 1, 2013, the NGA has the option to require us to lower the altitude of WorldView-2 from its current altitude of 770 kilometers to an altitude of 496 kilometers, subject to receipt of all required regulatory approvals. The lowering of the orbital altitude could result in a decrease in the amount of square kilometers collected by WorldView-2. While we believe the decrease in collection capability would be offset by improved data capture capabilities on the ground resulting from the expansion of our ground terminal network, there can be no assurance that our current collection capability will be maintained. Our ability
13
to service other customers could be negatively impacted if we are unable to maintain our current collection capacity. In addition, any inability on our part to meet the performance requirements of the EnhancedView Contract could result in a breach of our contract with the NGA. A breach of our contract with the NGA or reduction in service to our other customers could have a material adverse effect on our business, financial condition and results of operations.
The NGA may also terminate or suspend our contracts, including the EnhancedView Contract, at any time with or without cause. Although our NGA contracts generally involve fixed annual minimum commitments, such commitments are subject to annual Congressional appropriations and the federal budget process, and as a result, the NGA may not continue to fund these contracts at current or anticipated levels. In addition, the sequestration process under the Budget Control Act of 2011 (PL 112-25) could have an adverse impact on the timing and amount of appropriations available for defense programs, including EnhancedView. Under the terms of the Budget Control Act, discretionary spending is capped, and any breach of the caps would result in automatic, across-the-board spending cuts, known as sequestration. The Budget Control Act assumed that spending cap recommendations would be recommended to Congress by the Joint Select Committee on Deficit Reduction. This Committee failed to come to agreement, and accordingly sequestration was implemented during 2014. Sequestration did not have a material effect on our financial position or results of operations during 2014. However, future reductions in the current EnhancedView program or other current or future business with the Department of Defense resulting from sequestration could have a material adverse effect on our business, financial condition and results of operations.
Any program delays encountered in implementing the infrastructure enhancements required to support the EnhancedView Contract, may affect our ability to meet our obligations under the EnhancedView Contract resulting in a reduction of scope or termination of the contract, and may otherwise require us to increase our reliance on our existing satellites to meet our business needs, which could have a material adverse effect on our business, financial condition and results of operations.
The manufacturing, testing, launching and operation of satellites involves complex processes and technology. We rely on third party contractors for the manufacturing, testing, launch and operation of our satellites, as well as solutions for any anomalies encountered while in orbit. Many factors, including, but not limited to, availability of parts, subcontractor and supplier delays and anomalies discovered in orbit, may result in significant challenges to our business. For example, during orbit, satellites may experience technical difficulties communicating with the ground terminals or collecting imagery in the same quality or volume that was intended. The failure to mitigate any technical difficulties could affect our ability to meet our obligations under the EnhancedView Contract and may otherwise limit the anticipated volume of imagery products and services available to meet our business needs, which could have a material adverse effect on our business, financial condition and results of operations.
In addition, the EnhancedView Contract obligates us to meet certain capacity and timeliness of delivery requirements. To meet these requirements, we have expanded our network of ground terminals around the world. Our ground terminals are vulnerable to damage or interruption from human error, intentional bad acts, earthquakes, hurricanes, floods, fires, war, terrorist attacks, power losses, hardware failures, systems failures, telecommunications failures and similar events. The occurrence of any of the foregoing could result in lengthy interruptions in our services and/or damage our reputation, which could have a material adverse effect on our financial condition and results of operations.
Interruption or failure of our infrastructure could hurt our ability to effectively perform our daily operations and provide our products and services, which could damage our reputation and harm our operating results.
The availability of our products and services depends on the continuing operation of our satellite operations infrastructure, information technology and communications systems. Any downtime, damage to or failure of our systems could result in interruptions in our service, which could reduce our revenue and profits. Our systems are vulnerable to damage or interruption from floods, fires, power loss, telecommunications failures, computer viruses, computer denial of service attacks or other attempts to harm our systems. We do not currently maintain a back-up production facility from which we can continue to collect, process and deliver imagery in the event of the loss of our primary capabilities. In the event we are unable to collect, process and deliver imagery from our primary facility in Longmont, Colorado, our daily operations and operating results would be materially and adversely affected. In addition, our ground terminal centers are vulnerable to damage or interruption from human error, intentional bad acts, earthquakes, hurricanes, floods, fires, war,
14
terrorist attacks, power losses, hardware failures, systems failures, telecommunications failures and similar events. The occurrence of any of the foregoing could result in lengthy interruptions in our services and/or damage our reputation, which could have a material adverse effect on our financial condition and results of operations.
We face competition that may cause us to have to reduce our prices or to lose market share.
Our products and services compete with satellite and aerial imagery and related products and services offered by a range of private and government providers. Our current or future competitors may have greater financial, personnel and other resources than we have. Existing competitors include Airbus Defense and Space, ImageSat International N.V., Blackbridge AG (previously known as RapidEye), Planet Labs, Skybox Imaging (owned by Google, Inc.), Urthecast, foreign governments including India, South Korea, Taiwan and others that sell their data commercially, as well as numerous aggregators of imagery and imagery-related products and services, including Apple, Google and Microsoft. In addition, we compete against a number of manned and unmanned aerial providers of high-resolution imagery, whose offerings provide certain benefits over satellite-based imagery, including better resolution and accuracy. The value of our imagery may also be diluted by earth imagery that is available free of charge.
The U.S. Government and foreign governments also may develop, construct, launch and operate their own imagery satellites, which could reduce their need to rely on commercial suppliers. In addition, such governments could sell or provide free of charge earth imagery from their satellites in the commercial market and thereby compete with our imagery products and services. Also, governments may at times make our imagery freely available for humanitarian purposes, which could impair our revenue growth with non-governmental organizations. These governments could also subsidize the development, launch and operation of imagery satellites by our current or future competitors.
Our competitors or potential competitors with greater resources than ours could, in the future, offer satellite-based imagery or other products and services with more attractive features than our products and services. The emergence of new remote imaging technologies or the continued growth of low-cost imaging satellites, could negatively affect our marketing efforts. More importantly, if competitors develop and launch satellites or other imagery content sources with more advanced capabilities and technologies than ours, or offer services at lower prices than ours, our business and results of operations could be harmed. Due to competitive pricing pressures, new product introductions by us or our competitors or other factors, the average selling price of our products and services may further decrease. If we are unable to offset decreases in our average selling prices by increasing our sales volumes or by adjusting our product mix, our revenue and operating margins may decline and our financial position may be harmed.
We are dependent on resellers of our imagery for a portion of our revenue. If these resellers fail to market or sell our products and services successfully, our business would be harmed.
In 2014, we generated $63.5 million, or 9.7%, of our total revenue from foreign and domestic resellers. We rely on foreign resellers and partners to market and sell the majority of our products and services in the international market. We have intensified our efforts to further develop our operations in overseas markets, however, our foreign resellers and partners may not have the skill or experience to develop regional commercial markets for our imagery products and services, or may have competing interests that negatively affect their sales of our products and services. If we fail to enter into reseller agreements on a timely basis or if our resellers and partners fail to market and sell our imagery products and services successfully, these failures could negatively impact our business, financial condition and results of operations.
We rely on a single vendor or a limited number of vendors to provide certain key products or services to us and the inability of these key vendors to meet our needs could have a material adverse effect on our business.
Historically, we have contracted with a single vendor or a limited number of vendors to provide certain key products or services to us such as construction of our satellites and launch vehicles, operation of a satellite, and management of certain DAP facilities. If these vendors are unable to meet our needs because they fail to perform adequately, are unable to match new technological requirements or problems, or are unable to dedicate engineering and other resources necessary to provide the services contracted for, our business, financial position and results of operations may be adversely affected. While alternative sources for these products and services exist, we may not be able to develop these
15
alternative sources quickly and cost-effectively, which could materially impair our ability to operate our business. Furthermore, our vendors may request changes in pricing, payment terms or other contractual obligations, which could cause us to make substantial additional investments.
Breach of our system security measures or loss of our secure facility clearance and accreditation could result in interruption, delay or suspension of our ability to provide our products and services, and could result in loss of current and future business, including our U.S. Government contracts.
A breach of our system security could materially adversely affect our business. Our business involves the transmission and storage of large quantities of electronic data, including the imagery comprising our ImageLibrary. In addition, our business is becoming increasingly web-based, allowing our customers to access and take delivery of imagery from our ImageLibrary over the Internet. From time to time, we have experienced computer viruses and other forms of third party attacks on our systems that, to date, have not had a material adverse effect on our business. We cannot assure you, however, that future attacks will not materially adversely affect our business.
Despite the implementation and continued upgrading of security measures, our network infrastructure may be vulnerable to computer viruses, unauthorized third party access or other problems caused by third parties, which could lead to interruptions, delays or suspension of our operations, loss of imagery from our ImageLibrary, as well as the loss or compromise of technical information or customer information. Inappropriate use of the Internet by third parties, including attempting to gain unauthorized access to information or systems could also potentially jeopardize the overall security of our systems and could deter certain customers from doing business with us. In addition, a security breach that involved classified or other sensitive government information or certain controlled technical information, could subject us to civil or criminal penalties and could result in loss of our secure facility clearance and other accreditations, loss of our government contracts, loss of access to classified information, loss of export privileges or debarment as a government contractor.
Because the techniques used to obtain unauthorized access, or to otherwise infect or sabotage systems change frequently and often are not recognized until launched against a target, we may be unable to anticipate these techniques or to implement adequate preventative measures. We may also need to expend significant resources to protect against security breaches. The risk that these types of events could seriously harm our business is likely to increase as we expand the number of web based products and services we offer as well as increase the number of countries within which we do business.
Changes in U.S. Government policy regarding use of commercial data providers, or material delay or cancellation of planned U.S. Government EnhancedView programs may have a material adverse effect on our revenue and our ability to achieve our growth objectives.
Current U.S. Government policy encourages the U.S. Government’s use of commercial data providers to support U.S. national security objectives. We are considered by the U.S. Government to be a commercial data provider. U.S. Government policy is subject to change and any change in policy away from supporting the use of commercial data providers to meet U.S. Government imagery needs could materially affect our revenue and our ability to achieve our growth objectives.
If our satellites fail to operate as intended, our ability to collect imagery and market our products and services successfully could be materially and adversely affected.
Our satellites employ advanced technologies and sensors that are exposed to severe environmental stresses in space that could affect our satellites’ performance. Hardware component problems in space could lead to deterioration in performance or loss of functionality of a satellite, with attendant costs and revenue losses. In addition, human operators may execute improper implementation commands that may negatively impact a satellite’s performance. Exposure of our satellites to an unanticipated catastrophic event, such as a meteor shower or a collision with space debris, could reduce the performance of, or completely destroy, the affected satellite.
16
We cannot assure you that our satellites will continue to operate successfully in space throughout their expected operational lives. Even if a satellite is operated properly, technical flaws in that satellite’s sensors or other technical deficiencies or anomalies could significantly hinder its performance, which could materially affect our ability to collect imagery and market our products and services successfully. While some anomalies are covered by insurance policies, others are not or may not be covered, or may be subject to large deductibles.
If we suffer a partial or total loss of a deployed satellite, we would need a significant amount of time and would incur substantial expense to replace that satellite. We may experience other problems with our satellites that may reduce their performance. During any period of time in which a satellite is not fully operational, we may lose most or all of the revenue that otherwise would have been derived from that satellite. In addition, we may not have on hand, or be able to obtain in a timely manner, the necessary funds to cover the cost of any necessary satellite replacement. Our inability to repair or replace a defective satellite or correct any other technical problem in a timely manner could result in a significant loss of revenue.
Satellites have limited operational lives and are expensive to replace. Loss of, or damage to, a satellite may require us to seek additional financing from outside sources, which we may be unable to obtain on favorable terms, if at all.
We determine a satellite’s useful life, or its expected operational life, using a complex calculation involving the probabilities of failure of the satellite’s components from design or manufacturing defects, environmental stresses, estimated remaining fuel or other causes. The expected end of the depreciable lives of our in-orbit satellites at December 31, 2014 were as follows:
|
|
|
Expected End of |
|
|
Satellite |
|
Depreciable Life |
|
|
WorldView-3 |
|
Q1 2026 |
|
|
WorldView-2 |
|
Q4 2022 |
|
|
WorldView-1 |
|
Q4 2020 |
|
|
GeoEye-1 |
|
Q1 2018 |
|
|
QuickBird |
|
Q2 2014 |
(1) |
|
IKONOS |
|
Q3 2013 |
(1) |
|
(1) |
IKONOS and QuickBird are fully depreciated. |
The expected operational lives of these satellites are affected by a number of factors, including the quality of design and construction, the supply of fuel, the expected gradual environmental degradation of solar panels, the durability of various satellite components and the orbits and space environments in which the satellites are placed and operated. The failure of satellite components could cause damage to or loss of the use of a satellite before the end of its expected operational life. Electrostatic storms or collisions with other objects could also damage our satellites. We cannot assure you that each satellite will remain in operation until the end of its expected operational life. Furthermore, we expect the performance of each satellite to decline gradually near the end of its expected operational life. We can offer no assurance that our satellites will maintain their prescribed orbits or remain operational.
We anticipate using funds generated from operations to fund the construction and launch of any future satellites, including WorldView-4. If we do not generate sufficient funds from operations, we may need to obtain additional financing from outside sources to deploy any future satellites. If we do not generate sufficient funds from operations and cannot obtain financing, we will not be able to deploy any future satellites or be able to replace any of our operating satellites at the end of their operational lives. We cannot assure that we will be able to generate sufficient funds from operations or raise additional capital on favorable terms or on a timely basis, if at all, to develop or deploy additional high-resolution satellites.
Limited insurance coverage and availability may prevent us from obtaining insurance to cover all risks of loss.
We intend to insure certain satellites in our constellation to the extent that insurance remains available at acceptable premiums. The insurance proceeds received in connection with a partial or total impairment of the functional capacity of
17
any of our satellites would not be sufficient to cover the replacement cost, if we choose to do so, of an equivalent high-resolution satellite. In addition, this insurance will not protect us against all losses to our satellites due to specified exclusions, deductibles and material change limitations and it may be difficult to insure against certain risks, including a partial deterioration in satellite performance and satellite re-entry.
As of December 31, 2014, we maintained $640.0 million of insurance coverage on our WorldView-1, WorldView-2 and GeoEye-1 satellites for the policy period from October 2014 to October 2015 and $340.0 million of insurance coverage for our WorldView-3 satellite for the policy period from August 2014 to August 2019. In 2014, we did not insure our IKONOS or QuickBird satellites against functional capacity impairment, given the stage of their useful lives. Satellites under construction are insured through the third-parties who are providing the construction services. While our WorldView-4 satellite is in storage at the third party construction site, the insurance is included in the storage and maintenance fees.
The price and availability of insurance has fluctuated significantly since we began offering commercial services in 2001. Although we have historically been able to obtain insurance coverage for our in-orbit satellites, we cannot guarantee that we will be able to do so in the future. Although we intend to maintain insurance for our operating satellites, any determination we make as to whether to obtain insurance coverage will depend on a variety of factors, including the availability of insurance in the market, the cost of available insurance and the redundancy of our operating satellites. Insurance market conditions or factors outside our control at the time we are in the market for the required insurance, such as failure of a satellite using similar components, could cause premiums to be significantly higher than current estimates and could reduce amounts of available coverage. Higher premiums on insurance policies will increase our costs and consequently reduce our operating income by the amount of such increased premiums. If the terms of in-orbit insurance policies become less favorable than those currently available, there may be limits on the amount of coverage that we can obtain or we may not be able to obtain insurance at all. Even if obtained, our in-orbit operations insurance will not cover any loss in revenue incurred as a result of a partial or total satellite loss.
We are highly dependent upon our ImageLibrary and our failure or inability to protect and maintain the earth imagery content stored in our ImageLibrary could have a material adverse effect on our business, financial condition and results of operations.
Our operations depend upon our ability to maintain and protect our earth imagery content and our ImageLibrary against damage that may be caused by fire and other natural disasters, power failures, telecommunications failures, terrorist attacks, unauthorized intrusion, computer viruses, equipment malfunction or inadequacy, firewall breach or other events. The satellite imagery content we collect is downloaded directly to our facilities and then stored in our ImageLibrary for sale to customers. Our aerial imagery is collected and processed by our aerial suppliers and then delivered to us to be uploaded to our ImageLibrary. We back up our imagery and permanently store it with a third party data storage provider. Notwithstanding precautions we have taken to protect our ImageLibrary, there can be no assurance that a natural disaster or other event would not result in a prolonged interruption in our ability to provide access to or deliver imagery from our ImageLibrary to our customers. The temporary or permanent loss or disruption of access to our ImageLibrary could impair our ability to supply current and future customers with imagery content, have a negative impact on our revenue and cause harm to our reputation. Any impairment in our ability to supply our customers with imagery content could affect our ability to retain or attract customers, which would have a material adverse effect on our business, financial condition and results of operations.
The market may not accept our imagery products and services. You should not rely upon our historic growth rates as an indicator of future growth.
Our success depends on existing markets accepting our imagery products and services and our ability to develop new markets. Our business plan is based on the assumption that we will generate significant future revenue from sales of imagery products and services produced from our satellites and our other imagery content sources. The commercial sale of high-resolution earth imagery and related products and services is a relatively new industry. Consequently, it is difficult to predict the ultimate size of the markets and the acceptance by the markets of our products and services. Our business strategy and projections rely on a number of assumptions, some or all of which may be incorrect. Actual markets could vary materially from the potential markets that we have identified.
18
We cannot accurately predict whether our products and services will achieve significant market acceptance or whether there will be a market for our products and services on terms we find acceptable. Market acceptance of our commercial high-resolution earth imagery and related products and services depends on a number of factors, including the quality, scope, timeliness, sophistication, price and the availability of substitute products and services. Lack of significant market acceptance of our offerings, or other products and services that utilize our products and services, delays in acceptance, failure of certain markets to develop or our need to make significant investments to achieve acceptance by the market would negatively affect our business, financial condition and results of operations.
We may not continue to grow in line with historical rates or at all. If we are unable to achieve sustained growth, we may be unable to execute our business strategy, expand our business or fund other liquidity needs and our prospects, financial condition and results of operations could be materially and adversely affected.
Global economic conditions may adversely impact our business, operating results or financial condition.
Disruption and volatility in global financial markets may lead to increased rates of default and bankruptcy and may negatively impact consumer spending levels. These macroeconomic developments could adversely affect our business, operating results or financial condition. Current or potential customers, including foreign governments, may delay or decrease spending on our products and services as their business and/or budgets are impacted by economic conditions. The inability of current and potential customers to pay us for our products and services may adversely affect our earnings and cash flows.
Our international business exposes us to risks relating to increased regulation and political or economic instability in foreign markets, which could adversely affect our revenue.
In 2014, approximately 30.2% of our revenue was derived from international sales and we intend to continue to pursue international contracts. International operations are subject to certain risks, such as:
|
· |
changes in domestic and foreign governmental regulations and licensing requirements; |
|
· |
deterioration of relations between the United States and a particular foreign country; |
|
· |
increases in tariffs and taxes and other trade barriers; |
|
· |
changes in political and economic stability, including fluctuations in the value of foreign currencies, which may make payment in U.S. dollars, as provided for under some of our existing contracts, more expensive for foreign customers; |
|
· |
effects of austerity programs or similar significant budget reduction programs; |
|
· |
potential preferences by prospective customers to purchase from local (non U.S.) sources; and |
|
· |
difficulties in obtaining or enforcing judgments in foreign jurisdictions. |
These risks are beyond our control and could have a material and adverse effect on our business.
U.S. government sanctions against certain companies and individuals in Russia may limit our ability to conduct business with potential or existing customers.
We currently derive a portion of our revenue (less than 2%) from Russia. Recently, the U.S. government imposed sanctions through several executive orders restricting U.S. companies from conducting business with specified Russian companies and individuals. While we believe that the executive orders currently do not preclude us from conducting business with our existing customers in Russia, U.S. government sanctions may be expanded in the future. In addition, our business could be harmed if Russia imposed retaliatory sanctions on U.S. companies operating in Russia. If we become unable to conduct business with potential or existing customers, our business could be adversely impacted.
19
We depend upon our ability to attract, train and retain employees. Our inability to do so, or the loss of key personnel, would seriously harm our business.
Because of the specialized nature of our business, we rely heavily on our ability to attract and retain qualified scientific, technical, sales, marketing and managerial personnel. The loss of one or more of our senior management personnel could result in the loss of knowledge, experience and technical expertise within the satellite imagery sector, which would be detrimental to us if we cannot recruit suitable replacements in a timely manner. The competition for qualified personnel in the commercial high-resolution earth imagery industry is intense. Due to this intense competition, we may be unable to continue to attract and retain the qualified personnel necessary for the development of our business or to recruit suitable replacement personnel. The loss of the services of any member of our senior management or the inability to hire or retain experienced management personnel could adversely affect our ability to execute our business plan and harm our operating results.
Risks Related to Acquisitions
To integrate acquired businesses we must implement our management information systems, operating systems and internal controls and assimilate and manage the personnel of the acquired operations. The integration of acquired businesses may not be successful and could result in disruption to other parts of our business. Also, the integration of acquired businesses may require that we incur significant restructuring charges.
Acquisitions involve numerous risks and challenges, including:
|
· |
diversion of management’s attention from the normal operation of our business; |
|
· |
potential loss of key employees and customers of the acquired companies; |
|
· |
disruption of business relationships with current customers; |
|
· |
uncertainties that may impair our ability to attract, retain and motivate key personnel; |
|
· |
difficulties managing and integrating operations; |
|
· |
the potential for deficiencies in internal controls at acquired companies; |
|
· |
increases in our expenses and working capital requirements; and |
|
· |
exposure to unanticipated liabilities of acquired companies. |
Any future acquisitions may require additional equity financing, which could be dilutive to our existing stockholders, or additional debt financing, which could increase our leverage and potentially affect our credit ratings. Any downgrades in our credit ratings associated with an acquisition could adversely affect our ability to borrow by resulting in more restrictive borrowing terms. As a result of the foregoing, we also may not be able to complete acquisitions in the future.
These and other factors may harm our ability to achieve anticipated levels of profitability at acquired operations or realize other anticipated benefits of an acquisition, and could adversely affect our business and operating results.
Our acquisition of GeoEye resulted in significant goodwill and other intangible assets being recorded on our balance sheet. If the carrying value of our goodwill or intangible assets is not recoverable, an impairment loss may be recognized, which would adversely affect our financial results.
As a result of our merger with GeoEye, we recorded goodwill and other intangible assets on our consolidated balance sheet as of January 31, 2013. It is not possible at this time to determine if any future impairment would result, or if it does, whether such charge would be material to the remaining assets. If such a charge is necessary, it may have a material adverse effect on our financial results.
20
We incurred substantial transaction, integration and restructuring costs in connection with our acquisition of GeoEye.
We incurred transaction costs in connection with our acquisition of GeoEye and debt issuance costs in connection with the refinancing of the indebtedness of both companies. Additional integration and restructuring costs have been incurred in the course of combining the operations of DigitalGlobe and GeoEye. We cannot be certain that the elimination of duplicative costs or the realization of other expected efficiencies related to the integration of the two businesses will offset the transaction, integration and restructuring costs in the near term, or at all.
Any additional future acquisitions by us would subject us to additional business, operating and financial risks, the impact of which cannot presently be evaluated, and could adversely impact our capital structure or financial position.
From time to time in the future we may pursue other acquisition opportunities. To the extent we acquire a business that is highly leveraged or is otherwise subject to a high level of risk, we may be affected by the currently unascertainable risks of that business. Accordingly, there is no current basis for you to evaluate the possible merits or risks of any particular business or assets that we may acquire. In addition, the financing of any future acquisition completed by us could adversely impact our capital structure or financial position, as any such financing could include the issuance of additional securities or the borrowing of additional funds. Except as required by law or applicable securities exchange listing standards, we do not expect to ask our shareholders to vote on any proposed acquisition.
We may pursue acquisitions, investments, strategic alliances and joint ventures, which could affect our results of operations.
We may engage in various transactions, including purchases or sales of assets, acquisitions of businesses, or enter into investments or contractual arrangements, such as strategic alliances or joint ventures. These transactions may be intended to result in the realization of cost savings, the generation of cash, the generation of income or the reduction of risk. We cannot assure you that we will be able to identify suitable acquisition, investment, alliance or joint venture opportunities or that we will be able to consummate any such transactions or relationships on terms and conditions acceptable to us, or that such transactions or relationships will be successful.
In addition, upon consummation of an acquisition, investment, strategic alliance or joint venture, we may face challenges with integration efforts, including the combination and development of product and service offerings, sales and marketing approaches and establishment of combined operations. There can be no assurance that an acquired business will perform as expected; that we will not incur unforeseen obligations or liabilities; that the business will generate sufficient cash flow to support the indebtedness, if incurred, to acquire them or the expenditures needed to develop them; or that the rate of return from such businesses will justify the decision to invest the capital. Any future acquisitions, investments, strategic alliances or joint ventures may require additional debt or equity financing, which, in the case of debt financing, would increase our leverage and potentially affect our creditworthiness. Any deterioration in our creditworthiness or our future credit ratings associated with an acquisition could adversely affect our ability to borrow by resulting in more restrictive borrowing terms.
Risks Related To Legal And Regulatory Matters
Changes in U.S. or foreign laws and regulations could have a material adverse effect on our operations and financial condition.
Our industry is highly regulated due to the sensitive nature of satellite technology. We cannot assure you that the laws and regulations governing our business and operations, including the distribution of satellite imagery, will not change in the future. Our business and operating results may be materially and adversely affected if we are required to alter our business operations to comply with such changes or if our ability to sell our products and services on a global basis is reduced or restricted due to increased U.S. or foreign government regulation.
Our international operations are subject to the U.S. Foreign Corrupt Practices Act (“FCPA”), which generally prohibits U.S. companies and their intermediaries from making corrupt payments to foreign officials for the purpose of obtaining
21
or keeping business or otherwise obtaining favorable treatment, and requires companies to maintain adequate record-keeping and internal accounting practices to accurately reflect the transactions of the company. The FCPA applies to companies, individual directors, officers, employees and agents. Under the FCPA, U.S. companies may be held liable for actions taken by strategic or local partners or representatives. If we or our agents fail to comply with the requirements of the FCPA, or similar anti-bribery laws in other jurisdictions, governmental authorities in the United States or elsewhere, as applicable, could seek to impose civil and/or criminal penalties, which could have a material adverse effect on our business, financial condition and results of operations.
Failure to obtain or maintain regulatory approvals could result in service interruptions or could impede us from executing our business plan.
NOAA Approvals. Our business requires licenses from NOAA. Under our NOAA licenses, the U.S. Government reserves the right to interrupt service or limit our ability to distribute satellite images when foreign policy or U.S. national security interests are affected. In addition, NOAA has the right to review and approve the terms of certain of our agreements with international customers, including our DAP customers. We currently have the necessary approvals for our existing international customers. However, such reviews in the future could delay or prohibit us from executing new international agreements. The inability to get approvals for DAP customers could materially affect our ability to establish and grow our DAP business. In addition, should we not get approvals in a timely manner, our products and services may not be competitive.
Export Approvals. The ground station equipment and related technology that is purchased by certain of our DAP customers is controlled under the ITAR. We, or our suppliers, must obtain export licenses from the Department of State, and in some cases from foreign government agencies, in order to export ground station equipment and related technology to our DAP customers. Export licenses can take up to three months or longer to be processed and neither the Department of State nor any corresponding foreign government agency are obligated to approve any license application. Our inability or the inability of our suppliers to get required export approvals for equipment and technology supporting the DAP could materially affect our ability to establish and grow our DAP business.
FCC Approvals. Our operation of satellites and ground terminals also requires licenses from the FCC. The FCC regulates the construction, launch and operation of our satellites, the use of satellite frequency spectrum and the licensing of our ground terminals located within the United States. We are also subject to the FCC’s rules and regulations and the terms of our licenses, which require us to comply with various operating conditions and requirements. The current licenses of our satellites expire between 2023 and 2024 and those of our ground terminals expire between 2019 and 2024. While the FCC generally renews licenses routinely, there can be no assurance that our licenses will be renewed at their expiration dates on favorable terms or without adverse conditions. Failure to renew these licenses could have a material and adverse effect on our ability to generate revenue and conduct our business as currently expected.
International Registration and Approvals. The use of satellite frequency spectrum internationally is subject to the rules and requirements of the ITU. Additionally, satellite operators must abide by the specific laws of the countries in which downlink services are provided from the satellite to ground terminals within such countries. The FCC has coordinated the operations for each of our satellites pursuant to the ITU requirements.
Coordination of our satellites with other satellite systems is required by the ITU to help prevent harmful frequency interference from or into existing or planned satellite operations. We do not expect significant issues relating to the coordination of our satellites due to the nature of satellite imaging operations.
Our foreign DAP customers are responsible for securing necessary licenses and operational authority to use the required spectrum in each country into which we will downlink high resolution commercial earth imagery. If such customers are not successful in obtaining the necessary approvals, we will not be able to distribute real-time imagery to those customers. Our inability to offer real-time access service in a significant number of foreign countries could negatively affect our business. In addition, regulatory provisions in countries where we wish to operate may impose unduly burdensome restrictions on our operations. Our business may also be adversely affected if the national authorities where we plan to operate adopt treaties, regulations or legislation unfavorable to foreign companies.
22
Government audits of our contracts could result in a decrease in our earnings and/or have a negative effect on our cash position following an audit adjustment.
Our government contracts are subject to cost audits, which may occur several years after the period to which the audit relates. If an audit identifies significant unallowable costs, we could incur a material charge to our earnings or reduction in our cash position.
Risks Related To Our Indebtedness And Investment In Our Common Stock
We have a substantial amount of indebtedness, which may adversely affect our cash flow and our ability to operate our business, including our ability to incur additional indebtedness.
In connection with our acquisition of GeoEye, on January 31, 2013, we entered into a new seven-year $550.0 million senior secured term loan facility, a five-year $150.0 million senior secured revolving credit facility and issued $600.0 million of senior notes, the proceeds of which, along with cash on hand, were used to pay the cash consideration under the merger agreement, to refinance certain of our debt and GeoEye’s outstanding debt assumed in the business combination and pay fees and expenses related to the transactions. Our indebtedness could have several consequences, including:
|
· |
increasing our vulnerability to adverse economic, industry or competitive developments; |
|
· |
requiring a substantial portion of cash flow from operations to be dedicated to the payment of principal and interest on our indebtedness, therefore reducing our ability to use our cash flow to fund our operations, capital expenditures, return of capital to shareholders through our share repurchase program, and future business opportunities; |
|
· |
restricting us from making strategic acquisitions; |
|
· |
limiting our ability to obtain additional financing for working capital, capital expenditures, product development, debt service requirements, acquisitions and general corporate or other purposes; and |
|
· |
limiting our flexibility in planning for, or reacting to, changes in our business or the industry in which we operate, placing us at a competitive disadvantage compared to our competitors who are less highly leveraged and who, therefore, may be able to take advantage of opportunities that our leverage prevents us from exploiting. |
Our senior secured credit facility and senior notes contain a number of restrictions and covenants that, among other things, limit our ability to incur additional indebtedness, make investments, pay dividends or make distributions to our stockholders, grant liens on our assets, sell assets, enter into a new or different line of business, enter into transactions with our affiliates, merge or consolidate with other entities or transfer all or substantially all of our assets and enter into sale and leaseback transactions.
Our ability to comply with these restrictions and covenants in the future is uncertain and will be affected by the levels of cash flow from our operations and events or circumstances beyond our control. Our failure to comply with any of the restrictions and covenants under our senior secured credit facilities and senior notes could cause all of our existing indebtedness to be immediately due and payable. If our indebtedness is accelerated, we may not be able to repay our indebtedness or borrow sufficient funds to refinance it. If our indebtedness is in default for any reason, our business, financial condition and results of operations could be materially and adversely affected.
As of December 31, 2014, our total indebtedness was $1,140.4 million. Our balance as of December 31, 2014 was $1,137.6 million which was net of discounts of $2.8 million and represented 45.7% of our total capitalization. Our indebtedness increases the possibility that we may be unable to generate sufficient cash to pay, when due, the principal, interest or other amounts due with respect to our indebtedness.
23
We expect that the price of our common stock will fluctuate substantially.
The market price of our common stock has been, and is likely to continue to be, volatile. Factors that could contribute to the volatility of our stock include, but are not limited to:
|
· |
termination or expiration of one or more of our key contracts, or a change in scope or purchasing levels under one or more of our contracts, including the EnhancedView Contract, our DAP contracts or other large contracts; |
|
· |
unfounded rumors and leaks of information, or formal announcements regarding federal budget cuts, including, but not limited to, reduction in budgets affecting the Department of Defense; |
|
· |
failure of our satellites to operate as designed; |
|
· |
loss or damage to any of our satellites; |
|
· |
changes in U.S. or foreign governmental regulations or in the status of our regulatory approvals, clearances or future applications; |
|
· |
our announcements or our competitors’ announcements regarding new products or services, enhancements, significant contracts, acquisitions or strategic investments; |
|
· |
changes in the availability of insurance; |
|
· |
changes in earnings estimates or recommendations by securities analysts, if any, who cover our common stock; |
|
· |
changes in our published forecast of future results of operations; |
|
· |
fluctuations in our quarterly financial results or the quarterly financial results of companies perceived to be similar to us; |
|
· |
success of competitive products and services; |
|
· |
changes in our capital structure, such as future issuances or repurchases of securities, sales of large blocks of common stock by our stockholders or the incurrence of additional debt; |
|
· |
investors’ general perception of us, including any perception of misuse of sensitive information; |
|
· |
changes in general global economic and market conditions; |
|
· |
changes in industry conditions; |
|
· |
business disruptions, costs and future events related to shareholder activism; |
|
· |
changes in regulatory and other dynamics; and |
|
· |
our ability to successfully integrate the operations of GeoEye. |
In addition, in recent years, the stock market has experienced significant price and volume fluctuations that have particularly affected the market prices of equity securities of many companies in the technology sector, which have often been unrelated to their operating performance or prospects for future operations. These broad fluctuations may adversely impact the market price of our common stock. Future market movements may materially and adversely affect the market price of our common stock.
Provisions in our amended and restated certificate of incorporation and amended and restated by-laws and Delaware law might discourage, delay or prevent a change of control of our company or changes in our management and, therefore, depress the trading price of our common stock.
Provisions of our amended and restated certificate of incorporation and amended and restated by-laws and Delaware law may discourage, delay or prevent a merger, acquisition or other change in control that stockholders may consider favorable. These provisions may also prevent or frustrate attempts by our stockholders to replace or remove our management. These provisions include: the existence of a classified board of directors; limitations on the removal of directors; advance notice requirements for stockholder proposals and director nominations; the inability of stockholders
24
to act by written consent or to call special meetings; the ability of our board of directors to make, alter or repeal our by-laws; and provisions that permit the redemption of stock from foreign stockholders where necessary, in the judgment of our board of directors, to protect our licenses and registrations.
We do not currently intend to pay dividends on our common stock.
We have never declared or paid any cash dividends on our common stock and do not anticipate paying cash dividends on our common stock. In addition, our current credit facilities and indenture place restrictions on our ability to pay any dividends. We anticipate that we will retain all of our future earnings, if any, for use in the development and expansion of our business, return of capital to shareholders through our share repurchase program, and for general corporate purposes. Any determination to pay dividends on our common stock in the future will be at the discretion of our board of directors.
If we are unable to repurchase our stock at intended levels, our reputation and stock price may be harmed.
On July 23, 2014, the Company’s Board of Directors authorized a program to repurchase up to $75.0 million of the Company’s outstanding common stock through December 31, 2015. On December 18, 2014, the Board of Directors authorized an additional $130.0 million share repurchase through the end of 2015, raising the total authorization to $205.0 million.The stock repurchase program may require the use of a significant portion of our cash earnings. As a result, we may not retain a sufficient amount of cash to fund our operations or finance future growth opportunities, new product development initiatives and unanticipated capital expenditures which could adversely affect our financial performance. Our ability to repurchase stock will depend on our ability to generate sufficient cash flows from operations in the future. This ability may be subject to certain economic, financial, competitive and other factors that are beyond our control. The stock repurchase program does not obligate the Company to acquire any stock, and it may be limited or terminated at any time without notice. Any failure to repurchase stock after we have announced our intention to do so may negatively impact our reputation and investor confidence in us, and may negatively impact our stock price.
ITEM 1B.UNRESOLVED STAFF COMMENTS
None.
The properties used in our operations consist principally of production facilities, administrative and executive offices, and satellite ground terminals. As of December 31, 2014, we leased or owned approximately 945,000 square feet of office and operations space. This space includes our principal production facilities, administrative and executive offices in Longmont, Colorado, Thornton, Colorado and Herndon, Virginia as well as our future headquarters building in Westminster, Colorado. We also lease satellite ground terminals, a data center and have smaller administrative offices and sales offices located in the United States and internationally.
From time to time, we are a party to various litigation matters incidental to the conduct of our business. We are not presently party to any legal proceedings the resolution of which, we believe, would have a material adverse effect on our business, operating results, financial condition or cash flows.
ITEM 4.MINE SAFETY DISCLOSURES
Not applicable.
25
ITEM 5.MARKET FOR REGISTRANT’S COMMON EQUITY, RELATED STOCKHOLDER MATTERS AND ISSUER PURCHASES OF EQUITY SECURITIES
Our common stock has been listed on the NYSE and traded under the symbol “DGI” since our initial public offering in May 2009. The following table sets forth, for the periods indicated, the high and low sales prices in dollars on the NYSE for our common stock based on the daily closing prices.
|
|
|
High |
|
Low |
|
||
|
2014 |
|
|
|
|
|
|
|
|
Fourth Quarter |
|
$ |
31.34 |
|
$ |
24.07 |
|
|
Third Quarter |
|
|
31.61 |
|
|
26.15 |
|
|
Second Quarter |
|
|
32.90 |
|
|
26.14 |
|
|
First Quarter |
|
|
42.67 |
|
|
28.21 |
|
|
|
|
|
|
|
|
|
|
|
2013 |
|
|
|
|
|
|
|
|
Fourth Quarter |
|
$ |
42.09 |
|
$ |
29.72 |
|
|
Third Quarter |
|
|
34.07 |
|
|
30.20 |
|
|
Second Quarter |
|
|
32.05 |
|
|
26.50 |
|
|
First Quarter |
|
|
29.68 |
|
|
25.54 |
|
At December 31, 2014, there were approximately 249 stockholders of record of our common stock. This figure does not reflect beneficial ownership of shares held in nominee/street name.
Performance Measurement Comparison of Stockholder Return
The graph below compares the yearly percentage change in our cumulative total stockholder return on our common stock with the cumulative total return of the S&P Composite 500 Stock Index, the Russell 2000 and our peer group, for the period from December 31, 2009 through December 31, 2014. It assumes $100 was invested at market close on December 31, 2009 and that any dividends have been reinvested.
In 2014, we changed our peer group to better reflect technology companies of our size and complexity. Our new peer group consists of Acxiom Corporation, Advisory Board Company, comScore, Inc., Corporate Executive Board Company, CoStar Group Inc., FactSet Research Systems, Inc., Fair Isaac Corporation, FLIR Systems, Inc., Forrester Research, Inc., Gartner, Inc., IHS, Inc., Iridium Communications, Inc., KEYW Holding Corporation, Kratos Defense & Security Solutions, NeuStar, Inc., Orbital Sciences Corporation, Qlik Technologies, Inc., Trimble Navigation Limited, Verisk Analytics, Inc., and ViaSat, Inc.
Our peer group in 2013 consisted of Acxiom Corporation, Corporate Executive Board Company, Costar Group, Inc., Equifax, Inc., FactSet Research Systems, Inc., Fair Isaac Corporation, FLIR Systems, Inc., Gartner, Inc., IHS,
26
Inc., Iridium Communications, Inc., Kratos Defense & Security Solutions, Inc., Loral Space & Communications, Inc., NCI, Inc., Orbital Sciences Corporation, Trimble Navigation Limited, Verisk Analytics, Inc., and ViaSat, Inc.
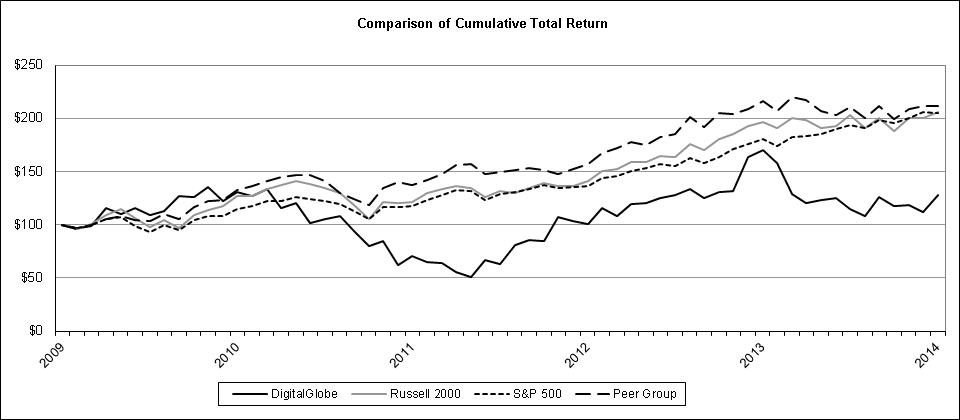
|
Total Return Analysis |
|
12/31/2009 |
|
12/31/2010 |
|
12/31/2011 |
|
12/31/2012 |
|
12/31/2013 |
|
12/31/2014 |
|
||||||
|
DigitalGlobe, Inc. |
|
$ |
100.00 |
|
$ |
131.03 |
|
$ |
70.70 |
|
$ |
100.99 |
|
$ |
170.04 |
|
$ |
127.98 |
|
|
Russell 2000 |
|
|
100.00 |
|
|
126.85 |
|
|
121.56 |
|
|
141.43 |
|
|
196.34 |
|
|
205.95 |
|
|
S&P 500 |
|
|
100.00 |
|
|
115.06 |
|
|
117.49 |
|
|
136.30 |
|
|
180.44 |
|
|
205.14 |
|
|
Peer Group |
|
|
100.00 |
|
|
132.13 |
|
|
136.76 |
|
|
156.80 |
|
|
216.29 |
|
|
211.74 |
|
This performance graph shall not be deemed “filed” for purposes of Section 18 of the Securities Exchange Act of 1934 (“Exchange Act”), or otherwise subject to the liabilities under that section and shall not be deemed to be incorporated by reference into any filing of DigitalGlobe, Inc. under the Securities Act of 1933, as amended, or the Exchange Act.
Dividends
Since inception, we have not declared or paid any cash dividends on our common stock and do not anticipate paying cash dividends on our common stock. We anticipate that we will retain all of our future earnings, if any, for use in the development and expansion of our business, for our stock repurchase program and for general corporate purposes. Any determination to pay dividends in the future will be at the discretion of our Board of Directors and will be subject to restrictive covenants contained in our financing facilities and dependent on then-existing conditions, including our financial condition and results of operations, contractual restrictions, capital requirements and other factors. In addition, our senior secured credit facilities and senior notes contain certain limitations on our ability to distribute cash dividends to our common stockholders in the future.
Cumulative dividends on the Series A convertible preferred stock are payable at a rate of five percent per annum on the $1,000 liquidation preference per share. At the Company’s option, dividends may be declared and paid in cash out of funds legally available, when, as and if declared by the Board of Directors or the Audit Committee of the Company. If not paid in cash, an amount equal to the cash dividends due is added to the liquidation preference. Dividends payable in cash are recorded in current liabilities. All dividends payable, whether in cash or as an addition to the liquidation preference, are recorded as a reduction to our retained earnings. We paid quarterly dividends of $1.0 million for each of the three month periods ended March 31, 2014, June 30, 2014, September 30, 2014 and December 31, 2014. As of December 31, 2014, we had $1.0 million of unpaid dividends. These dividends were paid on January 2, 2015.
27
Issuer Purchases of Equity Securities
On July 23, 2014, the Company’s Board of Directors authorized a program to repurchase up to $75.0 million of the Company’s outstanding common stock through December 31, 2015. On December 18, 2014, the Board of Directors increased the total amount authorized under the stock repurchase program by $130.0 million through the end of 2015, raising the total authorization to $205.0 million. As of December 31, 2014, we have repurchased 2,726,749 shares, or $75.1 million, at an average purchase price of $27.53. The amount purchased to date and the average share price for repurchases includes broker transaction fees.
The Company may repurchase shares through open market purchases, privately negotiated transactions, structured or derivative transactions such as puts, calls, options, forwards, collars, accelerated share repurchase transactions (with or without collars), other equity contracts or other methods of acquiring shares and pursuant to Rule 10b5-1, in each case on such terms and at such times as shall be permitted by applicable securities laws and determined by management. The stock repurchase program does not obligate the Company to acquire any stock, and it may be limited or terminated at any time without notice.
Share repurchase activity during the quarter ended December 31, 2014 was as follows:
|
|
|
|
|
|
|
|
|
|
|
|
|
|
|
|
|
|
|
|
Total Number |
|
|
Approximate |
|
|
|
|
|
|
|
|
of Shares |
|
|
Dollar Value |
|
|
|
Total |
|
|
Average |
|
Purchased as Part |
|
|
of Shares That |
|
|
|
Number |
|
|
Price |
|
of Publicly |
|
|
May Yet be |
|
|
|
of Shares |
|
|
Paid Per |
|
Announced |
|
|
Purchased |
|
|
|
Purchased |
|
|
Share |
|
Program |
|
|
Under Program |
|
October 1, 2014 to October 31, 2014 |
|
175,543 |
|
$ |
28.51 |
|
|
|
|
|
|
November 1, 2014 to November 30, 2014 |
|
474,405 |
|
|
28.46 |
|
|
|
|
|
|
December 1, 2014 to December 31, 2014 |
|
1,580,931 |
|
|
26.28 |
|
|
|
|
|
|
Total |
|
2,230,879 |
|
$ |
26.92 |
|
2,726,749 |
|
$ |
130,000,000 |
ITEM 6.SELECTED FINANCIAL DATA
The selected consolidated financial information set forth below for each of the years ended December 31, 2014, 2013, 2012, 2011 and 2010 has been derived from our audited Consolidated Financial Statements. The information below should be read in conjunction with “Management’s Discussion and Analysis of Financial Condition and Results of Operations” and the Consolidated Financial Statements and Notes thereto in Items 7 and 8, respectively, of this report.
28
Summary Financial Data
|
|
|
Year Ended December 31, |
|||||||||||||
|
(in millions, except per share data) |
|
2014 |
|
2013(1) |
|
2012 |
|
2011 |
|
2010 |
|||||
|
Revenue |
|
$ |
654.6 |
|
|
612.7 |
|
$ |
421.4 |
|
$ |
339.5 |
|
$ |
322.5 |
|
Income (loss) before income taxes |
|
|
25.4 |
|
|
(105.8) |
|
|
65.9 |
|
|
(46.0) |
|
|
6.8 |
|
Net income (loss) |
|
|
18.5 |
|
|
(68.3) |
|
|
39.0 |
|
|
(28.1) |
|
|
2.5 |
|
Net income (loss) available to common shareholders |
|
|
13.9 |
|
|
(71.9) |
|
|
39.0 |
|
|
(28.1) |
|
|
2.5 |
|
Earnings (loss) per share: |
|
|
|
|
|
|
|
|
|
|
|
|
|
|
|
|
Basic |
|
$ |
0.19 |
|
$ |
(1.00) |
|
$ |
0.85 |
|
$ |
(0.61) |
|
$ |
0.05 |
|
Diluted |
|
$ |
0.18 |
|
$ |
(1.00) |
|
$ |
0.84 |
|
$ |
(0.61) |
|
$ |
0.05 |
|
Total assets |
|
|
3,095.2 |
|
|
3,203.0 |
|
|
1,577.5 |
|
|
1,451.6 |
|
|
1,268.1 |
|
Capital leases |
|
|
3.0 |
|
|
1.0 |
|
|
— |
|
|
— |
|
|
— |
|
Long-term debt, excluding current portion |
|
|
1,132.1 |
|
|
1,137.1 |
|
|
478.6 |
|
|
481.6 |
|
|
346.1 |
|
Stockholders’ equity |
|
|
1,353.5 |
|
|
1,383.3 |
|
|
539.4 |
|
|
487.4 |
|
|
498.9 |
|
(1) |
On January 31, 2013 the Company completed its acquisition of 100% of the outstanding common stock of GeoEye, a provider of geospatial intelligence solutions. The results of GeoEye’s operations were included in the Company’s consolidated financial results beginning on the acquisition date. |
ITEM 7.MANAGEMENT’S DISCUSSION AND ANALYSIS OF FINANCIAL CONDITION AND RESULTS OF OPERATIONS
Overview
DigitalGlobe is a leading global provider of geospatial information products and services sourced from its own advanced satellite constellation. Its products and services support users in a wide variety of fields including defense, intelligence and homeland security, mapping and analysis, environmental monitoring, oil and gas exploration and infrastructure management. Each day users depend on DigitalGlobe’s data, information, technology and expertise to better understand our changing planet in order to save lives, resources and time.
Our principal customers include those in U.S. and foreign governments, defense and intelligence, location-based services (“LBS”), energy, and other industry verticals. The imagery that forms the foundation of our products, services and analysis is collected daily from our constellation of high-resolution imaging satellites and maintained in our ImageLibrary.
We believe that our ImageLibrary is the largest, most up-to-date and comprehensive archive of high-resolution earth imagery commercially available, containing more than 5.4 billion square kilometers of imagery, an area the equivalent of 36 times the landmass of the earth, accumulated since 1999. As of December 31, 2014, our collection capacity capability was approximately 1.4 billion square kilometers of imagery per year or the equivalence of roughly 9 times the earth’s land surface area and offers intraday revisit around the globe.
2014 Highlights
Recent Satellite Developments
In June 2014, the U.S. Department of Commerce granted us permission to sell the highest resolution imagery possible from our satellite constellation. As a result, DigitalGlobe has set a new technical bar for commercial satellite imagery,
29
and our customers will have access to the highest available resolution and most capable constellation. The resolution of our constellation is as follows:
|
Satellite |
|
Best Ground Resolution |
|
|
WorldView-3(1) |
|
31-centimeters |
|
|
WorldView-2 |
|
46-centimeters |
|
|
WorldView-1 |
|
50-centimeters |
|
|
GeoEye-1 |
|
41-centimeters |
|
|
IKONOS |
|
82-centimeters |
|
|
(1) |
Best ground resolution made commercially available, commencing on February 22, 2015, pursuant to the terms of our revised NOAA license received in June 2014 |
On August 13, 2014, DigitalGlobe successfully launched WorldView-3, the world’s highest resolution and most capable commercial earth observation satellite. On October 1, 2014, the Company completed the needed calibrations on WorldView-3 to enable it to provide visible spectrum imagery to its customers. As a result of this significant increase in constellation capacity made available to NGA, we have begun recognizing revenue from the EnhancedView SLA at an increased annualized rate of $337.1 million. Additionally, the Company began depreciating the WorldView-3 satellite based on an initial useful life of 11.5 years, resulting in depreciation expense of $56.5 million annually beginning on October 1, 2014.
As of October 1, 2014, the lives of each of WorldView-1 and WorldView-2 were extended to 13.0 years from 10.5 and 11.0 years, respectively. This change in estimate results in a reduction in annual depreciation of $18.4 million and $10.2 million on our WorldView-1 and WorldView-2 satellites, respectively, over their remaining estimated useful lives. In addition, this change results in a $10.4 million annual decrease in non-cash amortization of NextView deferred revenue, as the period of recognition was extended over the remaining useful life of WorldView-1, and a $1.4 million annual decrease in non-cash amortization of certain DAP deferred revenue, to reflect the extension of the period of recognition over the remaining useful life of WorldView-2.
During the fourth quarter of 2014, we completed certain enhancements to WorldView-4 and placed the satellite in storage. While in storage, we will evaluate the satellite for further potential enhancements. Costs of storage are expensed as incurred, and during the storage period we will not capitalize interest to the satellite. We do not anticipate that the imaging technology and capabilities of the WorldView-4 satellite will experience any significant obsolescence during the satellite storage period because satellite image technology does not change significantly over time, and include the WV-4 satellite in our assessment of impairment of our satellite constellation long-lived asset group. We intend to launch and place into service our WorldView-4 satellite in mid-2016 for additional capacity as a result of anticipated incremental growth opportunities. Once placed into service, it will be removed from construction-in-progress and recorded as a fixed asset.
Share Repurchase Program
On July 23, 2014, the Company’s Board of Directors authorized a program to repurchase up to $75.0 million of the Company’s outstanding common stock through December 31, 2015. On December 18, 2014, the Board of Directors increased the total amount authorized under the stock repurchase program by $130.0 million through the end of 2015, raising the total authorization to $205.0 million. As of December 31, 2014, we have repurchased 2,726,749 shares, or $75.1 million, at an average purchase price of $27.53. Refer to Item 5 “Issuer Purchases of Equity Securities” for further detail.
2013 Highlights
On January 31, 2013, we completed the acquisition of 100% of the outstanding stock of GeoEye, Inc., a leading provider of geospatial intelligence solutions in a stock and cash transaction valued at approximately $1.4 billion. The acquisition
30
of GeoEye increased the scale of our existing operations, diversified our customer base and product mix, broadened our service offerings, enabled us to optimize our satellite orbits and collection of imagery, and strengthened our production and analytics capabilities. Refer to Note 4 “Business Acquisitions” to the Consolidated Financial Statements for further discussion. We incurred the following combination-related costs in conjunction with the acquisition of GeoEye during the years ended December 31, 2014 and 2013:
|
|
|
For the year ended December 31, 2014 |
|
For the year ended December 31, 2013 |
|
||||||||||||||
|
(in millions) |
|
Expensed |
|
Capitalized |
|
Total |
|
Expensed |
|
Capitalized |
|
Total |
|
||||||
|
Restructuring costs |
|
$ |
1.1 |
|
$ |
— |
|
$ |
1.1 |
|
$ |
40.1 |
|
$ |
— |
|
$ |
40.1 |
|
|
Integration costs |
|
|
12.9 |
|
|
30.7 |
|
|
43.6 |
|
|
29.2 |
|
|
22.6 |
|
|
51.8 |
|
|
Acquisition costs |
|
|
— |
|
|
— |
|
|
— |
|
|
20.6 |
|
|
— |
|
|
20.6 |
|
|
Debt-related costs |
|
|
— |
|
|
— |
|
|
— |
|
|
17.8 |
|
|
36.6 |
|
|
54.4 |
|
|
Total combination-related costs |
|
$ |
14.0 |
|
$ |
30.7 |
|
$ |
44.7 |
|
$ |
107.7 |
|
$ |
59.2 |
|
$ |
166.9 |
|
During the first quarter of 2013, we initiated a series of restructuring activities intended to improve our operational efficiency as a result of our acquisition of GeoEye. These restructuring activities, which were completed in March 2014, primarily consisted of reducing redundant workforce, consolidating office and production facilities, consolidating certain ground terminals and systems, and other exit costs, including contract termination charges.
Integration costs that are expensed consist primarily of professional fees incurred to assist us with system and process improvements associated with integrating operations. Capitalized costs relating to integration primarily consist of property, equipment and leasehold improvements necessary to consolidate operations. Integration-related spend ceased in the third quarter of 2014.
Acquisition costs were costs incurred to effect the acquisition, such as advisory, legal, accounting, consulting and other professional fees.
Debt-related costs were attributable to entering into a seven-year $550.0 million Senior Secured Term Loan Facility and a five-year $150.0 million Senior Secured Revolving Credit Facility, in addition to issuing $600.0 million of 5.25% Senior Notes due 2021. The proceeds were used to refinance our $500.0 million senior secured term loan and our $100.0 million senior secured revolving credit facility, and fund the discharge and redemption of GeoEye’s $400.0 million 9.625% Senior Secured Notes due 2015 and $125.0 million 8.625% Senior Secured Notes due 2016 we assumed in the acquisition.
Synergies from our acquisition of GeoEye are principally from labor cost reductions and operational infrastructure savings resulting from our restructuring and integration efforts as compared with the pre-acquisition combined operating expenses of GeoEye and DigitalGlobe, including adjustments for planned expenditures related to project commitments, infrastructure investments and compensation increases. These synergies, however, are partially offset by higher operating costs associated with growth in our business.
31
Backlog
The following table represents our backlog as of December 31, 2014:
|
|
|
Backlog to be recognized |
|
||||
|
(in millions) |
|
Next 12 Months |
|
Life of Contracts |
|
||
|
U.S. Government: |
|
|
|
|
|
|
|
|
EnhancedView SLA |
|
$ |
337.1 |
|
$ |
1,910.0 |
|
|
Amortization of pre-FOC payments related to NextView |
|
|
15.1 |
|
|
88.7 |
|
|
Other revenue and value added services |
|
|
71.1 |
|
|
141.8 |
|
|
Total U.S. Government |
|
|
423.3 |
|
|
2,140.5 |
|
|
|
|
|
|
|
|
|
|
|
Diversified Commercial: |
|
|
|
|
|
|
|
|
DAP |
|
|
34.7 |
|
|
86.9 |
|
|
Other Diversified Commercial(1) |
|
|
85.6 |
|
|
130.4 |
|
|
Total Diversified Commercial |
|
|
120.3 |
|
|
217.3 |
|
|
|
|
|
|
|
|
|
|
|
Total Backlog |
|
$ |
543.6 |
|
$ |
2,357.8 |
|
|
(1) |
Other Diversified Commercial backlog consists of firm orders, minimum commitments under signed customer contracts, remaining amounts under pre-paid subscriptions, firm fixed price reimbursement and funded and unfunded task orders from Diversified Commercial customers. |
Backlog consists of all contractual commitments, including those under the anticipated ten-year term of the EnhancedView Contract with the NGA, amounts committed under DAP agreements, firm orders, remaining pre-paid subscriptions and task orders from our government customers. Our backlog also includes amounts of obligated funding on indefinite delivery/indefinite quantity (“IDIQ”) contracts for products and services that we believe we are qualified to provide.
The EnhancedView Contract is structured as a ten-year term, inclusive of nine annual renewal options that may be exercised by the NGA. Although the NGA may terminate the contract at any time and is not obligated to exercise any of the remaining five renewal options, we include the full remaining term in backlog. We believe it is the NGA’s intention to exercise the remaining options, subject only to annual Congressional appropriation of funding and the federal budget process. Such funding contains an inherent level of uncertainty in the current budget environment.
The amortization of pre-FOC payments related to our NextView agreement with the NGA will be recognized over the expected useful life of WorldView-1. The recognition of this revenue has no effect on our ability to generate additional revenue from the usage of the satellite, and we do not consider it a reduction in our capacity to generate additional sales. Beginning in the fourth quarter of 2014, the period of recognition was extended to reflect the extension of the useful life of WorldView-1 by 2.5 years, to the fourth quarter of 2020, and the remaining deferred revenue balance will be recognized over the longer remaining term on a prospective basis. This change will reduce the future recognition of NextView revenue by $10.4 million annually.
Although backlog reflects business that is considered to be firm, terminations, amendments or cancellations may occur, which could result in a reduction in our total backlog. In addition, failure to receive task orders under IDIQ contracts could also result in a reduction in our total backlog. Any such terminations, amendments or cancellations of contractual commitments, or failure to receive task orders under IDIQ contracts may also negatively impact the timing of our realization of backlog.
32
Results of Operations
The following tables summarize our historical results of operations for the years ended December 31, 2014, 2013 and 2012:
|
|
|
For the year ended December 31, |
|
|||||||
|
(in millions) |
|
2014 |
|
2013 |
|
2012 |
|
|||
|
Historical results of operations: |
|
|
|
|
|
|
|
|
|
|
|
U.S. Government revenue |
|
$ |
395.3 |
|
$ |
358.1 |
|
$ |
259.6 |
|
|
Diversified Commercial revenue |
|
|
259.3 |
|
|
254.6 |
|
|
161.8 |
|
|
Total revenue |
|
|
654.6 |
|
|
612.7 |
|
|
421.4 |
|
|
Cost of revenue excluding depreciation and amortization |
|
|
160.4 |
|
|
175.3 |
|
|
81.6 |
|
|
Selling, general and administrative |
|
|
221.5 |
|
|
257.3 |
|
|
149.2 |
|
|
Depreciation and amortization |
|
|
238.5 |
|
|
224.8 |
|
|
114.6 |
|
|
Restructuring charges |
|
|
1.1 |
|
|
40.1 |
|
|
— |
|
|
Loss on abandonment of asset |
|
|
1.2 |
|
|
— |
|
|
— |
|
|
Income (loss) from operations |
|
|
31.9 |
|
|
(84.8) |
|
|
76.0 |
|
|
Loss from early extinguishment of debt |
|
|
— |
|
|
(17.8) |
|
|
— |
|
|
Other income (expense), net |
|
|
0.6 |
|
|
0.2 |
|
|
(1.0) |
|
|
Interest expense, net |
|
|
(7.1) |
|
|
(3.4) |
|
|
(9.1) |
|
|
Income (loss) before income taxes |
|
|
25.4 |
|
|
(105.8) |
|
|
65.9 |
|
|
Income tax (expense) benefit |
|
|
(6.9) |
|
|
37.5 |
|
|
(26.9) |
|
|
Net income (loss) |
|
$ |
18.5 |
|
$ |
(68.3) |
|
$ |
39.0 |
|
We operate in a single segment in which we use a common infrastructure and technology to collect, process and distribute those imagery products and services to customers around the world.
During the first quarter of 2015, we expect changes in certain reporting relationships between our Chief Operating Decision Maker (“CODM”) and other members of management. If those changes occur, we would likely modify our internal reporting to provide information to the CODM and certain of his direct reports consistent with a revised management structure. Accordingly, during the first half of 2015 we expect to reevaluate the definition of our operating segments, reportable segments, and reporting units. This reevaluation could result in changes to our reportable segments. It also could result in the reallocation of goodwill to reporting units. If we reallocate goodwill during an interim reporting period we will perform an interim goodwill impairment test at that time, as required by generally accepted accounting principles.
Revenue
The following table summarizes revenue as percentage of total revenue for U.S. Government and Diversified Commercial customers:
|
|
|
|
|
|
|
|
|
|
|
|
|
|
For the year ended December 31, |
|
||||||
|
|
|
2014 |
|
|
2013 |
|
|
2012 |
|
|
U.S. Government |
|
60.4 |
% |
|
58.4 |
% |
|
61.6 |
% |
|
Diversified Commercial |
|
39.6 |
|
|
41.6 |
|
|
38.4 |
|
|
Total revenue |
|
100.0 |
% |
|
100.0 |
% |
|
100.0 |
% |
33
The following table summarizes our percentage of direct sales and reseller and partner sales:
|
|
|
|
|
|
|
|
|
|
|
|
|
|
For the year ended December 31, |
|
||||||
|
|
|
2014 |
|
|
2013 |
|
|
2012 |
|
|
Direct |
|
90.3 |
% |
|
87.7 |
% |
|
85.4 |
% |
|
Reseller and Partner |
|
9.7 |
|
|
12.3 |
|
|
14.6 |
|
|
Total revenue |
|
100.0 |
% |
|
100.0 |
% |
|
100.0 |
% |
Total U.S. and international sales were as follows:
|
|
|
For the year ended December 31, |
|
|||||||
|
(in millions) |
|
2014 |
|
2013 |
|
2012 |
|
|||
|
U.S. |
|
$ |
456.8 |
|
$ |
423.8 |
|
$ |
295.8 |
|
|
International |
|
|
197.8 |
|
|
188.9 |
|
|
125.6 |
|
|
Total revenue |
|
$ |
654.6 |
|
$ |
612.7 |
|
$ |
421.4 |
|
Our principal source of revenue is the licensing of earth imagery products and provision of other services to end users, resellers and partners.
We have organized our sales leadership and marketing efforts around two customer groups (i) U.S. Government and (ii) Diversified Commercial. Revenue recognized for services provided to U.S. Government customers consists primarily of the EnhancedView SLA, amortization of pre-FOC payments related to the NextView agreement and other value added services. Diversified Commercial consists of revenue generated from the following types of customers: DAP, other international defense and intelligence, international civil government, location-based services, energy, and other industry verticals.
U.S. Government Revenue
|
|
|
For the year ended December 31, |
|
Percentage change |
|
|||||||||
|
|
|
|
|
|
|
|
|
|
|
|
2014 vs. |
|
2013 vs. |
|
|
($ in millions) |
|
2014 |
|
2013 |
|
2012 |
|
2013 |
|
2012 |
|
|||
|
U.S. Government Revenue: |
|
|
|
|
|
|
|
|
|
|
|
|
|
|
|
EnhancedView SLA |
|
$ |
254.7 |
|
$ |
227.3 |
|
$ |
201.3 |
|
12.1 |
% |
12.9 |
% |
|
Other revenue and value added services |
|
|
117.7 |
|
|
105.3 |
|
|
32.8 |
|
11.8 |
|
221.0 |
|
|
Amortization of pre-FOC payments related to NextView |
|
|
22.9 |
|
|
25.5 |
|
|
25.5 |
|
(10.2) |
|
— |
|
|
Total U.S. Government revenue |
|
$ |
395.3 |
|
$ |
358.1 |
|
$ |
259.6 |
|
10.4 |
% |
37.9 |
% |
|
|
|
|
|
|
|
|
|
|
|
|
|
|
|
|
|
Revenue as a Percent of Total |
|
|
|
|
|
|
|
|
|
|
|
|
|
|
|
EnhancedView SLA |
|
|
64.4 |
% |
|
63.5 |
% |
|
77.5 |
% |
|
|
|
|
|
Other revenue and value added services |
|
|
29.8 |
|
|
29.4 |
|
|
12.7 |
|
|
|
|
|
|
Amortization of pre-FOC payments related to NextView |
|
|
5.8 |
|
|
7.1 |
|
|
9.8 |
|
|
|
|
|
|
|
|
|
100.0 |
% |
|
100.0 |
% |
|
100.0 |
% |
|
|
|
|
|
Direct and Reseller Sales |
|
|
|
|
|
|
|
|
|
|
|
|
|
|
|
Direct |
|
|
99.9 |
% |
|
99.6 |
% |
|
99.8 |
% |
|
|
|
|
|
Reseller and Partner |
|
|
0.1 |
|
|
0.4 |
|
|
0.2 |
|
|
|
|
|
|
|
|
|
100.0 |
% |
|
100.0 |
% |
|
100.0 |
% |
|
|
|
|
Our U.S. Government customers focus on image quality, including resolution, accuracy, spectral diversity, frequency of area revisit and coverage, as well as ensuring availability of a certain amount of our capacity as they integrate our products and services into their operational planning. Our customers typically operate under contracts with purchase commitments through which we receive monthly or quarterly payments in exchange for delivering specific orders to the customer. Our revenue from customers in the U.S. Government has historically been largely from service level agreements and tasking orders, with a smaller portion from sales of imagery from our ImageLibrary. We sell to the U.S.
34
Government primarily through direct sales, with sales arising from sub-contract relationships to a lesser extent, and we expect this trend to continue.
The U.S. Government, through the NGA, purchases our imagery products and services on behalf of various entities within the U.S. Government, including the military and other government agencies. EnhancedView SLA revenue comprised 38.9%, 37.1%, and 47.8% of our revenue for 2014, 2013 and 2012, respectively. We also sell to other U.S. defense and intelligence customers, including defense and intelligence contractors who provide an additional outlet for our imagery by providing value-added services with our imagery to deliver a final end product to a customer. Other revenue and value added services comprised 18.0%, 17.2%, and 7.8% of our revenue for 2014, 2013 and 2012, respectively.
U.S Government revenue increased $37.2 million, or 10.4%, from 2013 to 2014. EnhancedView revenue increased $27.4 million as a result of WorldView-3 becoming fully operational, which increased constellation capacity made available to the NGA, commencing October 1, 2014. Other revenue and value added services increased $12.4 million primarily due to expanded services delivered under GEGD. These increases were partially offset by a decrease of $2.6 million in the non-cash amortization of pre-FOC payments relating to NextView, as the period over which these payments are amortized was extended to reflect the new useful life of WorldView-1.
U.S Government revenue increased $98.5 million, or 37.9%, from 2012 to 2013. EnhancedView revenue increased $26.0 as a result of increased imaging capacity made available to NGA. Other revenue and value added services increased $72.5 million primarily due to the delivery of expanded services, including daily global imagery collections on a broadened web based service provided as part of GEGD and our intelligence solutions services obtained as part of the GeoEye acquisition.
Diversified Commercial Revenue
|
|
|
For the year ended December 31, |
|
Percentage change |
|
|||||||||
|
|
|
|
|
|
|
|
|
|
|
|
2014 vs. |
|
2013 vs. |
|
|
($ in millions) |
|
2014 |
|
2013 |
|
2012 |
|
2013 |
|
2012 |
|
|||
|
Diversified Commercial Revenue |
|
|
|
|
|
|
|
|
|
|
|
|
|
|
|
DAP |
|
$ |
111.3 |
|
$ |
100.8 |
|
$ |
54.1 |
|
10.4 |
% |
86.3 |
% |
|
Other diversified commercial |
|
|
148.0 |
|
|
153.8 |
|
|
107.7 |
|
(3.8) |
|
42.8 |
|
|
Total commercial revenue |
|
$ |
259.3 |
|
$ |
254.6 |
|
$ |
161.8 |
|
1.8 |
% |
57.4 |
% |
|
|
|
|
|
|
|
|
|
|
|
|
|
|
|
|
|
Revenue as a Percent of Total |
|
|
|
|
|
|
|
|
|
|
|
|
|
|
|
DAP |
|
|
42.9 |
% |
|
39.6 |
% |
|
33.4 |
% |
|
|
|
|
|
Other diversified commercial |
|
|
57.1 |
|
|
60.4 |
|
|
66.6 |
|
|
|
|
|
|
|
|
|
100.0 |
% |
|
100.0 |
% |
|
100.0 |
% |
|
|
|
|
|
|
|
|
|
|
|
|
|
|
|
|
|
|
|
|
|
Direct and Reseller Sales |
|
|
|
|
|
|
|
|
|
|
|
|
|
|
|
Direct |
|
|
75.7 |
% |
|
70.9 |
% |
|
62.5 |
% |
|
|
|
|
|
Reseller and Partner |
|
|
24.3 |
|
|
29.1 |
|
|
37.5 |
|
|
|
|
|
|
|
|
|
100.0 |
% |
|
100.0 |
% |
|
100.0 |
% |
|
|
|
|
Our Diversified Commercial customers are located throughout the world and purchase our products and services through contracts that span one or more years, which may include one-time data deliveries, depending on the solution that best suits their application. We sell to these customers through a combination of direct sales and through resellers.
We have DAP agreements in 10 countries, earning revenue from sales of the DAP facility hardware and software, as well as from service fees to access our satellite constellation. The revenue to access our satellite constellation is recognized over time based on minutes of actual usage. The revenue and costs associated with the sales of a DAP facility are deferred until we commission into operation the ground terminal and can provide contractually specified access to our satellites. The facilities related revenue and costs are then recognized ratably over the customer relationship period, which is based on the estimated useful life of the satellite being accessed, except when deferred contract costs are in
35
excess of deferred revenue, in which case the excess costs are recognized over the initial contract period. If more than one satellite is used, generally the satellite with the longest remaining useful life is used as the basis for the amortization of deferred revenue and deferred costs.
Other Diversified Commercial revenue also arises from customers in international defense and intelligence, international civil government, LBS, energy, and other industry verticals, who use our content for mapping, monitoring, analysis and planning activities.
Diversified Commercial revenue increased $4.7 million, or 1.8%, from 2013 to 2014. DAP revenue increased $10.5 million primarily due to the impact of activating additional direct access customers. This was offset by a decrease in other diversified commercial revenue of $5.8 million primarily due to lower revenue from customers in Russia of $14.5 million and a one-time data delivery totaling $5.9 million, partially offset by growth primarily within our energy vertical.
Diversified Commercial revenue increased $92.8 million, or 57.4%, from 2012 to 2013 principally as a result of revenue generated from additional customer relationships obtained from the acquisition of GeoEye.
Expenses
The following table summarizes our results of operations as a percentage of total revenue:
|
|
|
For the year Ended December 31, |
|
||||||
|
|
|
2014 |
|
|
2013 |
|
|
2012 |
|
|
Expenses as a percentage of revenue: |
|
|
|
|
|
|
|
|
|
|
Revenue |
|
100.0 |
% |
|
100.0 |
% |
|
100.0 |
% |
|
Cost of revenue, excluding depreciation and amortization |
|
24.5 |
|
|
28.6 |
|
|
19.4 |
|
|
Selling, general and administrative |
|
33.8 |
|
|
42.0 |
|
|
35.4 |
|
|
Depreciation and amortization |
|
36.4 |
|
|
36.7 |
|
|
27.2 |
|
|
Restructuring charges |
|
0.2 |
|
|
6.5 |
|
|
— |
|
|
Loss on abandonment of asset |
|
0.2 |
|
|
— |
|
|
— |
|
|
Income (loss) from operations |
|
4.9 |
|
|
(13.8) |
|
|
18.0 |
|
|
Loss from early extinguishment of debt |
|
— |
|
|
(2.9) |
|
|
— |
|
|
Other income (expense), net |
|
0.1 |
|
|
— |
|
|
(0.2) |
|
|
Interest expense, net |
|
(1.1) |
|
|
(0.6) |
|
|
(2.2) |
|
|
Income (loss) before income taxes |
|
3.9 |
|
|
(17.3) |
|
|
15.6 |
|
|
Income tax (expense) benefit |
|
(1.1) |
|
|
6.2 |
|
|
(6.4) |
|
|
Net income (loss) |
|
2.8 |
% |
|
(11.1) |
% |
|
9.2 |
% |
Cost of Revenue
The following table summarizes our cost of revenue, excluding depreciation and amortization:
|
|
|
For the year ended December 31, |
|
Percentage change |
|
|||||||||
|
|
|
|
|
|
|
|
|
|
|
|
2014 vs. |
|
2013 vs. |
|
|
($ in millions) |
|
2014 |
|
2013 |
|
2012 |
|
2013 |
|
2012 |
|
|||
|
Labor and labor related costs |
|
$ |
68.7 |
|
$ |
71.5 |
|
$ |
30.9 |
|
(3.9) |
% |
131.4 |
% |
|
Facilities, subcontracting and equipment costs |
|
|
71.0 |
|
|
79.2 |
|
|
34.7 |
|
(10.4) |
|
128.2 |
|
|
Consulting and professional fees |
|
|
5.9 |
|
|
10.2 |
|
|
1.0 |
|
(42.2) |
|
* |
|
|
Aerial imagery |
|
|
4.8 |
|
|
7.9 |
|
|
8.3 |
|
(39.2) |
|
(4.8) |
|
|
Other direct costs |
|
|
10.0 |
|
|
6.5 |
|
|
6.7 |
|
53.8 |
|
(3.0) |
|
|
Total cost of revenue, excluding depreciation and amortization |
|
$ |
160.4 |
|
$ |
175.3 |
|
$ |
81.6 |
|
(8.5) |
% |
114.8 |
% |
* Not meaningful
36
There is not a significant direct relationship between our cost of revenue and changes in our revenue. Our cost of revenue consists primarily of the cost of personnel, as well as the costs of operating our satellites, retrieving information from the satellites and processing the data retrieved. Costs of acquiring aerial imagery from third parties have been capitalized and are amortized on an accelerated basis as a cost of revenue.
Cost of revenue decreased $14.9 million, or 8.5%, from 2013 to 2014. Labor and labor related costs decreased $2.8 million primarily as a result of our restructuring efforts, partially offset by an additional month of expenses for employees assumed in connection with the GeoEye acquisition totaling $3.2 million. Facilities, subcontracting and equipment costs decreased $8.2 million primarily due to the consolidation of ground terminals and related telecommunication contracts in connection with the GeoEye acquisition, partially offset by an additional month of expense associated with the remaining ground terminals acquired totaling $2.0 million. Consulting and professional fees decreased $4.3 million primarily due to reduced services needed to support the integration of GeoEye. Aerial imagery consists of costs associated with previously purchased aerial imagery, which are amortized on an accelerated basis. Other direct costs increased $3.5 million primarily from imagery purchased in fulfillment of contracts within our energy vertical.
Cost of revenue increased $93.7 million, or 114.8% from 2012 to 2013. This increase was due to additional expense primarily resulting from the acquisition of GeoEye, consisting of higher labor related costs of $40.6 million and higher facilities, subcontracting and equipment costs of $44.5 million, which are primarily associated with operating additional ground terminals and DAP facilities. Consulting and professional fees increased $9.2 million primarily related to growth in the business, in addition to the integration of GeoEye. Inclusive in these changes are integration related costs of $2.1 million incurred in 2013.
Selling, General and Administrative Expenses
The following table summarizes our selling, general and administrative expenses:
|
|
|
For the year ended December 31, |
|
Percentage change |
|
|||||||||
|
|
|
|
|
|
|
|
|
|
|
|
2014 vs. |
|
2013 vs. |
|
|
($ in millions) |
|
2014 |
|
2013 |
|
2012 |
|
2013 |
|
2012 |
|
|||
|
Acquisition costs |
|
$ |
— |
|
$ |
20.6 |
|
$ |
19.9 |
|
* |
% |
3.5 |
% |
|
Labor and labor related costs |
|
|
128.4 |
|
|
120.8 |
|
|
80.4 |
|
6.3 |
|
50.2 |
|
|
Consulting and professional fees |
|
|
44.6 |
|
|
63.5 |
|
|
17.8 |
|
(29.8) |
|
256.7 |
|
|
Rent and facilities |
|
|
11.4 |
|
|
14.6 |
|
|
7.6 |
|
(21.9) |
|
92.1 |
|
|
Satellite insurance |
|
|
9.8 |
|
|
12.4 |
|
|
9.7 |
|
(21.0) |
|
27.8 |
|
|
Other costs |
|
|
27.3 |
|
|
25.4 |
|
|
13.8 |
|
7.5 |
|
84.1 |
|
|
Total selling, general and administrative |
|
$ |
221.5 |
|
$ |
257.3 |
|
$ |
149.2 |
|
(13.9) |
% |
72.5 |
% |
* Not meaningful
Selling, general and administrative expenses decreased $35.8 million, or 13.9%, from 2013 to 2014. Acquisition costs of $20.6 million were incurred in 2013 related to the GeoEye acquisition. Labor and labor related costs increased $7.6 million primarily from an increase in current year headcount, including contractor conversions, to support growth in our business, and a $3.4 million increase in non-combination related severance expenses, partially offset by an additional month of expenses for employees assumed in connection with the GeoEye acquisition totaling $2.5 million. Consulting and professional fees decreased $18.9 million primarily due to reduced services needed to support the integration of GeoEye. Rent and facilities decreased $3.2 million primarily due to the consolidation of facilities and related telecommunication contracts following our acquisition of GeoEye. The $2.6 million decrease in satellite insurance is primarily due to a reduction in current year rates to insure our in-orbit satellites, partially offset by $1.2 million in WorldView-3 launch insurance expense.
Selling, general and administrative expenses increased $108.1 million, or 72.5%, from 2012 to 2013. We incurred $20.6 million in acquisition costs incurred to close the GeoEye acquisition. Labor costs increased $40.4 million primarily as a result of the acquisition of GeoEye. Professional fees increased $45.7 million to support the integration of GeoEye and
37
growth of the business. Rent and facility costs increased $7.0 million primarily due to additional facilities acquired in the GeoEye acquisition. Other costs increased $11.6 million primarily due to higher software licenses, support and maintenance fees of $4.2 million, higher hardware support and maintenance costs of $1.5 million and higher marketing related costs of $1.4 million primarily due to the acquisition of GeoEye. Inclusive in these changes are integration related costs which totaled approximately $27.1 million, $24.5 million of which related to consulting and professional fees, incurred in 2013.
Depreciation and Amortization
|
|
|
For the year ended December 31, |
|||||||||||||||||||||
|
(in millions) |
|
2014 |
|
2013 |
|
2012 |
|||||||||||||||||
|
Depreciation and amortization |
|
$ |
238.5 |
|
$ |
224.8 |
|
$ |
114.6 | ||||||||||||||
Depreciation and amortization increased $13.7 million, or 6.1%, from 2013 to 2014 primarily due to $14.1 million in expense incurred following the launch and commissioning of WorldView-3 and an additional month of expense for property, equipment and intangible assets assumed in the GeoEye acquisition totaling $7.1 million, partially offset by a $7.2 million decrease in expense as a result of the extension of the useful lives of our WorldView-1 and WorldView-2 satellites.
Depreciation and amortization increased $110.2 million, or 96.2%, from 2012 to 2013 principally due to property, equipment and intangible assets obtained in connection with our acquisition of GeoEye. In addition, we recognized increased depreciation when certain of our construction in process projects were placed into service during 2013. The most significant of these new assets integrates our infrastructure more securely with the U.S. Government, which we placed into service in the first quarter of 2013.
Restructuring Charges
|
|
|
For the year ended December 31, |
||||||||||||||||||||
|
(in millions) |
|
2014 |
|
2013 |
|
2012 |
||||||||||||||||
|
Restructuring charges |
|
$ |
1.1 |
|
$ |
40.1 |
|
$ |
- |
|||||||||||||
We incurred restructuring charges of $1.1 million and $40.1 million in 2014 and 2013, respectively, in conjunction with our acquisition of GeoEye. The restructuring activities were intended to realign our infrastructure with demand by our customers so as to optimize our operational efficiency. We believe that the restructuring enhanced our ability to provide cost-effective customer service offerings, which enabled us to retain and expand our existing relationships with customers and attract new business. These restructuring activities primarily consisted of reducing redundant workforce, consolidating office and production facilities, consolidating certain ground terminals and systems and other exit costs.
Loss from Early Extinguishment of Debt
|
|
|
For the year ended December 31, |
|||||||
|
(in millions) |
|
2014 |
|
2013 |
|
2012 |
|||
|
Loss from early extinguishment of debt |
|
$ |
- |
|
$ |
(17.8) |
|
$ |
- |
In connection with the acquisition of GeoEye, we entered into the 2013 Credit Facility, issued Senior Notes and retired our previous credit facility. We recorded a loss of $17.8 million during 2013 due to the write-off of $12.8 million of unamortized deferred financing fees and debt discount associated with the previous credit facility and $5.0 million of fees paid in connection with the 2013 Credit Facility and Senior Notes.
Interest Expense, net
|
|
|
For the year ended December 31, |
|||||||
|
(in millions) |
|
2014 |
|
2013 |
|
2012 |
|||
|
Interest expense, net |
|
$ |
(7.1) |
|
$ |
(3.4) |
|
$ |
(9.1) |
38
Our interest charges consist primarily of expense on borrowings used to finance satellite construction, which are capitalized as a cost of our satellite construction.
Interest expense, net increased $3.7 million, or 108.8%, from 2013 to 2014 primarily as a result of 87.8% of interest capitalized to capital projects in 2014 compared to 93.4% in 2013. Following the launch and commissioning of our WorldView-3 satellite on October 1, 2014, we are no longer capitalizing interest on the cost basis of the satellite. Subsequent to placing WorldView-4 in storage late in the fourth quarter of 2014, we are no longer capitalizing interest on the cost basis of that satellite.
Interest expense, net decreased $5.7 million, or 62.6%, from 2012 to 2013 primarily as a result of 93.4% of interest capitalized to capital projects in 2013 compared to 72.2% in 2012. In 2013, the increase in accumulated costs primarily associated with our WorldView-3 and WorldView-4 satellites, resulted in the increased rate of capitalization.
Income Tax (Expense) Benefit
|
|
|
For the year ended December 31, |
|||||||
|
(in millions) |
|
2014 |
|
2013 |
|
2012 |
|||
|
Income tax (expense) benefit |
|
$ |
(6.9) |
|
$ |
37.5 |
|
$ |
(26.9) |
Income tax benefit decreased $44.4 million from 2013 to 2014 principally due to pre-tax profits generated in 2014 compared to a pre-tax loss reported in 2013. In 2014, we had an overall effective tax rate of 27.3%. The effective tax rate differed from the statutory federal rate of 35.0% primarily due to the release of a $2.4 million FIN 48 reserve upon completion of an IRS examination.
Income tax expense decreased $64.4 million from 2012 to 2013 principally due to having a pre-tax loss in 2013 compared to pre-tax income in 2012. In 2013, we had an effective overall tax rate of 35.4%. The effective tax rate differed from the statutory federal rate of 35.0% primarily due to state taxes, the effects of non-deductible stock based compensation and discrete items related to the vesting of equity based compensation, 2012 research and development tax credits resulting from tax law changes enacted in January 2013, and non-deductible costs related to our acquisition of GeoEye.
Balance Sheet Measures
Total assets decreased $70.6 million, or 2.2%, from 2013 to 2014 primarily due to $75.1 million in cash spent on our share repurchase initiative.
Total liabilities decreased $40.8 million, or 2.3% from 2013 to 2014 primarily due to a reduction in liabilities associated with combination-related costs incurred as part of our prior year acquisition of GeoEye.
Liquidity and Capital Resources
As of December 31, 2014, we had $117.8 million in cash and cash equivalents. We believe that the combination of funds currently available to us and funds expected to be generated from operations will be adequate to finance our operations and development activities for the next twelve months. If the U.S. Government, our largest customer, was not to renew or extend the EnhancedView SLA at similar levels or similar terms, we believe we would be able to maintain operations at a reduced level with existing cash and cash equivalents for at least the next twelve months. Furthermore, we believe we are adequately reserved for receivables denominated in U.S. dollars from foreign customers experiencing fluctuations in the value of foreign currencies.
39
In summary, our cash flows were:
|
|
|
For the year ended December 31, |
|
|||||||
|
(in millions) |
|
2014 |
|
2013 |
|
2012 |
|
|||
|
Net cash provided by operating activities |
|
$ |
224.9 |
|
$ |
112.3 |
|
$ |
264.5 |
|
|
Net cash used in investing activities |
|
|
(264.6) |
|
|
(794.5) |
|
|
(216.0) |
|
|
Net cash (used in) provided by financing activities |
|
$ |
(71.6) |
|
$ |
665.1 |
|
$ |
(0.8) |
|
Operating Activities
Cash provided by operating activities increased $112.6 million from 2013 to 2014 primarily due to generating net income of $18.5 million in 2014 compared to a net loss of $68.3 million in 2013. The 2013 net loss was principally due to costs incurred in connection with our acquisition of GeoEye.
Cash provided by operating activities decreased $152.2 million from 2012 to 2013 primarily due to the net loss incurred in 2013 of $68.3 million compared to net income in 2012 of $39.0 million. The net loss was primarily due to restructuring and acquisition related costs totaling $89.9 million and loss from extinguishment of debt of $17.8 million in 2013. We generated cash from operating activities in 2013 despite recording a net loss primarily as a result of recognizing non-cash expenses, principally depreciation and amortization totaling $224.8 million.
Investing Activities
Cash used in investing activities decreased $529.9 million from 2013 to 2014 principally due to the prior year acquisition of GeoEye, net of cash acquired totaling $524.0 million and a $53.1 million decrease in current year capital expenditures primarily resulting from placing our WorldView-3 satellite into service in August 2014. These decreases were partially offset by the current year acquisition of Spatial Energy, net of cash acquired totaling $35.7 million.
Cash used in investing activities increased $578.5 million from 2012 to 2013 primarily due to $524.0 million in cash expenditures for the acquisition of GeoEye, in addition to $63.1 million increase in capital expenditures primarily related to the construction of the WorldView-3 and WorldView-4 satellites and related infrastructure.
Financing Activities
Cash provided by financing activities decreased $736.7 million from 2013 to 2014 principally due to the prior year debt refinancing in connection with our acquisition of GeoEye, in addition to our current year share repurchase initiative.
Cash provided by financing activities increased $665.9 million from 2012 to 2013 primarily due to $632.6 million in net proceeds from refinancing our debt in connection with the acquisition of GeoEye, less principal payments of $4.1 million related to the refinanced debt. In addition, we received $39.6 million in cash proceeds from the exercise of stock options.
Off-Balance Sheet Arrangements, Contractual Obligations, Guaranty and Indemnification Obligations
Off-Balance Sheet Arrangements
We had no off-balance sheet arrangements as of December 31, 2014.
40
Contractual Obligations
We have various contractual obligations impacting our liquidity. The following represents our contractual obligations as of December 31, 2014:
|
|
|
Payments Due by Period |
|
|||||||||||||
|
|
|
|
|
|
Less Than |
|
1-3 |
|
4-5 |
|
More Than |
|
||||
|
($ in millions) |
|
Total |
|
1 Year |
|
Years |
|
Years |
|
5 Years |
|
|||||
|
Operating leases |
|
$ |
149.1 |
|
$ |
8.3 |
|
$ |
22.3 |
|
$ |
23.6 |
|
$ |
94.9 |
|
|
Capital leases |
|
|
3.4 |
|
|
1.0 |
|
|
1.8 |
|
|
0.6 |
|
|
— |
|
|
Long-term debt principal payments |
|
|
1,140.4 |
|
|
5.5 |
|
|
11.0 |
|
|
11.0 |
|
|
1,112.9 |
|
|
Long-term debt interest payments |
|
|
310.6 |
|
|
52.1 |
|
|
103.5 |
|
|
102.7 |
|
|
52.3 |
|
|
Contractual obligations |
|
|
147.0 |
|
|
62.0 |
|
|
85.0 |
|
|
— |
|
|
— |
|
|
Total |
|
$ |
1,750.5 |
|
$ |
128.9 |
|
$ |
223.6 |
|
$ |
137.9 |
|
$ |
1,260.1 |
|
Contractual obligations are remaining amounts due on long-term contracts primarily relating to the procurement and construction of our WorldView-4 satellite, including the launch vehicle, and operational commitments related to our ground systems. Our operating leases are primarily for office space in the United States and includes the lease for our future corporate headquarters building in Westminster, Colorado. We generally believe leasing office space is more cost-effective than purchasing real estate for our existing operating locations.
We had $9.6 million of uncertain tax positions, which are not reflected in the table above since it is unclear when, or if, these liabilities will be paid.
Long-term debt principal and interest payment obligations are to be made over the lives of our senior secured term loan and unsecured senior notes. Please see Note 8 of the Notes to Consolidated Financial Statements included in Item 8 of this Annual Report on Form 10-K for further details.
Guaranty and Indemnification Obligations
We enter into agreements in the ordinary course of business with resellers and others. Most of these agreements require us to indemnify the other party against third-party claims alleging that one of our products infringes or misappropriates a patent, copyright, trademark, trade secret or other intellectual property right. Certain of these agreements require us to indemnify the other party against claims relating to property damage, personal injury or acts or omissions by us, our employees, agents or representatives. In addition, from time to time we have made guarantees regarding the performance of our systems to our customers.
Non-GAAP Disclosures
Reconciliation of Net Cash Flows Provided by Operating Activities to Free Cash Flow
|
|
|
For the year ended December 31, |
|
|||||||
|
(in millions) |
|
2014 |
|
2013 |
|
2012 |
|
|||
|
Net cash flows provided by operating activities |
|
$ |
224.9 |
|
$ |
112.3 |
|
$ |
264.5 |
|
|
Net cash flows used in investing activities |
|
|
(264.6) |
|
|
(794.5) |
|
|
(216.0) |
|
|
Acquisition of businesses, net of cash acquired |
|
|
35.7 |
|
|
524.0 |
|
|
— |
|
|
Free cash flow |
|
$ |
(4.0) |
|
$ |
(158.2) |
|
$ |
48.5 |
|
Free cash flow is defined as net cash flows provided by operating activities less net cash flows used in investing activities (excluding acquisition of businesses, net of cash acquired). Free cash flow is not a recognized term under U.S. GAAP and may not be defined similarly by other companies. Free cash flow should not be considered an alternative to “operating income (loss),” “net income (loss),” “net cash flows provided by (used in) operating activities” or any other measure determined in accordance with U.S. GAAP. Since free cash flow includes investments in operating assets, we believe this non-GAAP liquidity measure is useful in addition to the most comparable U.S. GAAP measure — “net cash flows provided by (used in) operating activities” because it provides information about the amount of cash generated
41
before acquisitions of businesses that is then available to repay debt obligations, make investments, fund acquisitions, and for certain other activities. There are limitations to using non-U.S. GAAP financial measures, including the difficulty associated with comparing companies in different industries that use similar performance measures whose calculations may differ from ours.
Reconciliation of Net income (loss) to EBITDA and Adjusted EBITDA:
|
|
|
For the year ended December 31, |
|
|||||||
|
(in millions) |
|
2014 |
|
2013 |
|
2012 |
|
|||
|
Net income (loss) |
|
$ |
18.5 |
|
$ |
(68.3) |
|
$ |
39.0 |
|
|
Depreciation and amortization |
|
|
238.5 |
|
|
224.8 |
|
|
114.6 |
|
|
Interest expense, net |
|
|
7.1 |
|
|
3.4 |
|
|
9.1 |
|
|
Income tax expense (benefit) |
|
|
6.9 |
|
|
(37.5) |
|
|
26.9 |
|
|
EBITDA |
|
|
271.0 |
|
|
122.4 |
|
|
189.6 |
|
|
Loss on abandonment of asset |
|
|
1.2 |
|
|
— |
|
|
— |
|
|
Loss from early extinguishment of debt |
|
|
— |
|
|
17.8 |
|
|
— |
|
|
Restructuring charges (1) |
|
|
1.1 |
|
|
40.1 |
|
|
— |
|
|
Integration costs (1) |
|
|
12.9 |
|
|
29.2 |
|
|
— |
|
|
Acquisition costs (1) |
|
|
— |
|
|
20.6 |
|
|
19.9 |
|
|
Adjusted EBITDA |
|
$ |
286.2 |
|
$ |
230.1 |
|
$ |
209.5 |
|
|
(1) |
Restructuring, acquisition and integration costs consist of charges related to the acquisition of GeoEye. |
EBITDA and Adjusted EBITDA are not recognized terms under U.S. GAAP and may not be defined similarly by other companies. EBITDA and Adjusted EBITDA should not be considered alternatives to net income as indications of financial performance or as alternatives to cash flow from operations as measures of liquidity. There are limitations to using non-U.S. GAAP financial measures, including the difficulty associated with comparing companies in different industries that use similar performance measures whose calculations may differ from ours.
EBITDA and Adjusted EBITDA are key measures used in our internal operating reports by management and our Board of Directors to evaluate the performance of our operations and are also used by analysts, investment banks and lenders for the same purpose. EBITDA, excluding certain acquisition costs, is a measure being used as a key element of the company-wide bonus incentive plan.
We believe that the presentation of EBITDA and Adjusted EBITDA enables a more consistent measurement of period to period performance of our operations, and EBITDA facilitates comparison of our operating performance to companies in our industry. We believe that EBITDA and Adjusted EBITDA measures are particularly important in a capital intensive industry such as ours, in which our current period depreciation is not a good indication of our current or future period capital expenditures. The cost to construct and launch a satellite and to build the related ground infrastructure may vary greatly from one satellite to another, depending on the satellite’s size, type and capabilities. For example, our QuickBird satellite cost significantly less than our WorldView-1, WorldView-2 and WorldView-3 satellites. Current depreciation expense is not indicative of the revenue generating potential of the satellites.
EBITDA excludes interest income, interest expense and income taxes because these items are associated with our capitalization and tax structures. EBITDA also excludes depreciation and amortization expense because these non-cash expenses reflect the impact of prior capital expenditure decisions which are not indicative of future capital expenditure requirements.
Adjusted EBITDA further adjusts EBITDA to exclude the loss on the early extinguishment of debt and the loss on abandonment of asset because these are not related to our primary operations. Additionally, it excludes restructuring costs, acquisition costs and integration costs as these are non-core items. Restructuring costs are costs incurred to realize efficiencies from the acquisition with GeoEye, such as reducing excess workforce, consolidating facilities and systems, and relocating ground terminals. Acquisition costs are costs incurred to effect the acquisition, such as advisory, legal,
42
accounting, consulting and other professional fees. Integration costs consist primarily of professional fees incurred to assist us with system and process improvements associated with integrating operations. Loss on early extinguishment of debt is related to entering into the 2013 Credit Facility and Senior Notes, the proceeds of which were used to refinance our $500.0 million senior secured term loan and $100.0 million senior secured revolving credit facility, and to fund the discharge and redemption of GeoEye’s $525.0 million senior secured notes that we assumed in the acquisition.
We use EBITDA and Adjusted EBITDA in conjunction with traditional U.S. GAAP operating performance measures as part of our overall assessment of our performance and we do not place undue reliance on these non-GAAP measures as our only measures of operating performance. EBITDA and Adjusted EBITDA should not be considered as substitutes for other measures of financial performance reported in accordance with U.S. GAAP.
Critical Accounting Policies and Estimates
The preparation of consolidated financial statements and related disclosures in conformity with accounting principles generally accepted in the United States of America requires management to make judgments, assumptions and estimates that affect the amounts reported. Note 2, “Summary of Significant Accounting Policies” of the Notes to our Consolidated Financial Statements in Part II, Item 8 of this Form 10-K describes the significant accounting policies and methods used in the preparation of the Company’s consolidated financial statements. The policies and estimates discussed in this section are considered “critical” because they had or could have a material impact on our financial statements, and because they require significant judgments, assumptions or estimates. We base our estimates on historical experience and other assumptions that we believe to be reasonable under the circumstances. Actual results may differ from these estimates, and such differences could be material. We have reviewed these critical accounting policies and related disclosures with the Audit Committee of the Company’s Board of Directors.
Revenue Recognition
Application of U.S. GAAP related to the measurement and recognition of revenue requires the use of judgments and estimates. Specifically, judgment is used in interpreting complex arrangements with nonstandard terms and conditions and determining when all criteria for revenue recognition have been met. In addition, the Company enters into contracts that contain multiple deliverables. Judgment is required to properly identify the units of accounting in transactions with multiple deliverables and to determine how revenue shall be allocated to those units of accounting. The Company has not historically been able to establish vendor-specific objective evidence of fair value or third-party evidence of selling price when allocating consideration as part of a multiple-element arrangement due to the unique nature of our products and services and lack of visibility into competitor pricing. Therefore, relative selling prices are determined on the basis of the best estimate of the selling price (“BESP”). The Company’s process for determining BESP involves judgment and considers multiple factors that may vary depending on the unique facts and circumstances related to each deliverable. Factors considered include, but are not limited to market conditions, competitive landscape, geographic or regional specific factors, internal costs, profit margin objectives and pricing practices used by the Company.
Satellite Useful Lives
The estimated useful life over which we depreciate a satellite is determined once the satellite has been placed into orbit. The initial determination of the satellite useful life involves a complex calculation that considers random part failure probabilities, expected component degradation and cycle life, predicted fuel consumption, and other factors. WorldView-3, which was launched in August 2014, has been assigned an initial useful life of 11.5 years. Depreciation on WorldView-3 commenced when the satellite was placed into service on October 1, 2014.
At least annually, or more frequently should facts and circumstances indicate, the Company performs an assessment of the remaining useful lives of its satellites. The assessment evaluates on-orbit performance, remaining fuel, remaining anticipated component cycle life and durability, environmental and operational stresses and other factors that may impact the satellite’s useful life. Any change in the useful lives of satellites is accounted for on a prospective basis from the date of change, generally as of the first day of the quarter in which the change is made.
43
As a result of the Company’s satellite life review, the Company extended the useful lives of each of WorldView-1 and WorldView-2 to 13 years. The useful life extensions resulted in non-cash reductions to depreciation expense prospectively from October 1, 2014 of approximately $7 million per quarter.
Certain cash payments received in connection with our NextView contract prior to WorldView-1 being placed into service were deferred and are being recognized to revenue over the life of WorldView-1. The useful life extension of WorldView-1 lengthened the period over which this deferred revenue is being recognized, resulting in non-cash reductions to revenue prospectively from October 1, 2014 of $2.6 million per quarter.
Satellite useful lives are also used by the Company as a proxy for determining the estimated customer relationship period when evaluating the duration over which to amortize upfront fees in DAP contracts. In the event a DAP customer has access to multiple satellites under the same arrangement, the longest-lived satellite life is generally used. Therefore, any change in the estimated useful lives of our satellites would also impact upfront fee revenues and deferred contract costs on a prospective basis from the date of change. The extension of the life of WorldView-2 during 2014 had an immaterial impact to revenue recognized on upfront fees and deferred contract costs for the year ended December 31, 2014.
Goodwill
Goodwill is tested annually for impairment as of October 1. The Company determines fair value of its single reporting unit using the Company’s market capitalization, which exceeded the carrying value of the reporting unit by 54% in 2014. The Company corroborates this fair value assessment using a discounted cash flow analysis. Determining fair value using a discounted cash flow analysis requires the use of significant judgments, including judgments about the amount and timing of future sales and operating costs, capital expenditures, discount rates, perpetual growth rates, and working capital changes. There was no goodwill impairment recognized by the Company for the years ended December 31, 2014, 2013, or 2012.
Intangible Assets
Intangible assets are recorded at their fair value at the time of acquisition. Determining the fair value of an intangible asset may require the use of significant management estimates and assumptions including expected future cash flows and discount rates. Management’s estimates are based upon assumptions believed to be reasonable, but which are inherently uncertain and unpredictable.
Valuation of Long-Lived Assets
The carrying amount of long-lived assets and finite-lived intangible assets to be held and used in the business are reviewed for impairment when events or circumstances warrant such a review. Indicators of impairment include: 1) a significant change in the extent or manner in which an asset is used, 2) a significant adverse change in the operations of the Company’s satellites, 3) a change in government spending or customer demand that could affect the value of the asset group, 4) a significant decline in the observable market value of an asset group, or 5) a significant decline in the Company’s stock price.
Our satellite constellation and related assets, including satellites under construction, are evaluated as a single asset group whenever facts or circumstances indicate that the carrying value may not be recoverable. If indicators of impairment are identified, recoverability of long-lived assets is measured by comparing their carrying amount to the projected cash flows the assets are expected to generate. Determining whether an impairment has occurred typically requires the use of significant estimates and assumptions, including the allocation of cash flows to assets or asset groups and, if required, an estimate of fair value for those assets or asset groups. There were no impairments of long-lived assets during the years ended December 31, 2014, 2013 or 2012.
Income Taxes
The current provision for income taxes represents actual or estimated amounts payable or refundable on tax returns filed each year. Deferred tax assets and liabilities are recognized for the estimated future tax effects attributable to the
44
temporary differences between the financial statement carrying amounts of existing assets and liabilities and their respective tax bases, as well as operating loss and tax credit carryforwards. The carrying value of deferred tax assets may be reduced by a valuation allowance if, based upon the judgmental assessment of available evidence, it is deemed more likely than not that some or all of the deferred tax assets will not be realizable.
The Company utilizes a two-step approach to recognizing and measuring uncertain tax positions (tax contingencies). The first step is to evaluate the tax position for recognition by determining if the weight of available evidence indicates it is more likely than not that the position will be sustained on audit, including resolution of related appeals or litigation processes. The second step is to measure the tax benefit as the largest amount that is more than 50% likely of being realized upon ultimate settlement. The Company considers many factors when evaluating and estimating its tax positions and tax benefits, which may require periodic adjustments and which may not accurately forecast actual outcomes.
The recognition of a valuation allowance or uncertain tax position would result in a reduction to net income and could have a material impact on our effective tax rate, results of operations and financial position in any given period.
Recent and Pending Accounting Pronouncements
See Note 2 to the Consolidated Financial Statements for a full description of recent accounting pronouncements and our expectation of their impact on our Consolidated Financial Statements.
ITEM 7A.QUANTITATIVE AND QUALITATIVE DISCLOSURES ABOUT MARKET RISK
We are exposed to market risks from changes in interest rates under our 2013 Credit Facility. The 2013 Credit Facility provides for a $550.0 million Senior Secured Term Loan Facility and a $150.0 million Senior Secured Revolving Credit Facility. At the closing of the 2013 Credit Facility, we borrowed the full amount of the Senior Secured Term Loan Facility. As of December 31, 2014, we had not drawn any amounts under the Senior Secured Revolving Credit Facility.
Borrowings under the 2013 Credit Facility bear interest at an adjusted LIBOR rate, plus a 2.75% margin subject to a 1.0% LIBOR floor. The LIBOR margin becomes 2.5% when our ratio of total debt to Adjusted EBITDA (as defined in the 2013 Credit Agreement) is 2.5:1.00 or lower. The Senior Secured Term Loan Facility currently bears interest based upon the LIBOR-based rate. The Company also pays a commitment fee of between 37.5 to 50.0 basis points, payable quarterly, on the average daily unused amount of the revolving credit facility based on our leverage ratio.
Based upon the amounts outstanding under the Senior Secured Term Loan Facility as of December 31, 2014 and assuming that the Senior Secured Term Loan Facility is outstanding for a full calendar year, a 100 basis point increase in interest rates would result in an increase in our annual interest expense under the Senior Secured Term Loan Facility of approximately $5.4 million. We may decide in the future to engage in various hedging transactions in order to hedge the interest rate risk under our Senior Secured Credit Facility but have not done so at this time.
We are exposed to various market risks that arise from transactions entered into in the normal course of business. Certain contractual relationships with customers and vendors mitigate risks from currency exchange rate changes that arise from normal purchasing and normal sales activities.
We do not currently have any material foreign currency exposure. Our revenue contracts are primarily denominated in U.S. dollars and the majority of our purchase contracts are denominated in U.S. dollars. Fluctuations in the value of foreign currencies may make payment in U.S. dollars, as provided for under some of our existing contracts, more difficult for foreign customers.
45
ITEM 8.FINANCIAL STATEMENTS AND SUPPLEMENTARY DATA
INDEX TO CONSOLIDATED FINANCIAL STATEMENTS
|
|
Page |
| 47 | |
|
|
|
| 48 | |
|
|
|
| 49 | |
|
|
|
| 50 | |
|
|
|
| 51 | |
|
|
|
| 52 |
46
Report of Independent Registered Public Accounting Firm
To the Board of Directors and Stockholders of DigitalGlobe, Inc.
In our opinion, the accompanying consolidated balance sheets and the related consolidated statements of operations, stockholders’ equity, and cash flows present fairly, in all material respects, the financial position of Digital Globe, Inc. and its subsidiaries at December 31, 2014 and 2013, and the results of their operations and their cash flows for each of the three years in the period ended December 31, 2014 in conformity with accounting principles generally accepted in the United States of America. Also in our opinion, the Company maintained, in all material respects, effective internal control over financial reporting as of December 31, 2014, based on criteria established in Internal Control - Integrated Framework (2013) issued by the Committee of Sponsoring Organizations of the Treadway Commission (COSO). The Company's management is responsible for these financial statements, for maintaining effective internal control over financial reporting and for its assessment of the effectiveness of internal control over financial reporting, included in Management's Report on Internal Control over Financial Reporting under Item 9A. Our responsibility is to express opinions on these financial statements and on the Company's internal control over financial reporting based on our integrated audits. We conducted our audits in accordance with the standards of the Public Company Accounting Oversight Board (United States). Those standards require that we plan and perform the audits to obtain reasonable assurance about whether the financial statements are free of material misstatement and whether effective internal control over financial reporting was maintained in all material respects. Our audits of the financial statements included examining, on a test basis, evidence supporting the amounts and disclosures in the financial statements, assessing the accounting principles used and significant estimates made by management, and evaluating the overall financial statement presentation. Our audit of internal control over financial reporting included obtaining an understanding of internal control over financial reporting, assessing the risk that a material weakness exists, and testing and evaluating the design and operating effectiveness of internal control based on the assessed risk. Our audits also included performing such other procedures as we considered necessary in the circumstances. We believe that our audits provide a reasonable basis for our opinions.
A company’s internal control over financial reporting is a process designed to provide reasonable assurance regarding the reliability of financial reporting and the preparation of financial statements for external purposes in accordance with generally accepted accounting principles. A company’s internal control over financial reporting includes those policies and procedures that (i) pertain to the maintenance of records that, in reasonable detail, accurately and fairly reflect the transactions and dispositions of the assets of the company; (ii) provide reasonable assurance that transactions are recorded as necessary to permit preparation of financial statements in accordance with generally accepted accounting principles, and that receipts and expenditures of the company are being made only in accordance with authorizations of management and directors of the company; and (iii) provide reasonable assurance regarding prevention or timely detection of unauthorized acquisition, use, or disposition of the company’s assets that could have a material effect on the financial statements.
Because of its inherent limitations, internal control over financial reporting may not prevent or detect misstatements. Also, projections of any evaluation of effectiveness to future periods are subject to the risk that controls may become inadequate because of changes in conditions, or that the degree of compliance with the policies or procedures may deteriorate.
/s/ PricewaterhouseCoopers LLP
Denver, Colorado
February 26, 2015
47
DigitalGlobe, Inc.
Consolidated Statements of Operations
|
|
|
|
|
|
|
|
|
|
|
|
|
|
|
For the year ended December 31, |
|
|||||||
|
(in millions, except per share amounts) |
|
2014 |
|
2013 |
|
2012 |
|
|||
|
Revenue |
|
$ |
654.6 |
|
$ |
612.7 |
|
$ |
421.4 |
|
|
Costs and expenses: |
|
|
|
|
|
|
|
|
|
|
|
Cost of revenue, excluding depreciation and amortization |
|
|
160.4 |
|
|
175.3 |
|
|
81.6 |
|
|
Selling, general and administrative |
|
|
221.5 |
|
|
257.3 |
|
|
149.2 |
|
|
Depreciation and amortization |
|
|
238.5 |
|
|
224.8 |
|
|
114.6 |
|
|
Restructuring charges |
|
|
1.1 |
|
|
40.1 |
|
|
— |
|
|
Loss on abandonment of asset |
|
|
1.2 |
|
|
— |
|
|
— |
|
|
Income (loss) from operations |
|
|
31.9 |
|
|
(84.8) |
|
|
76.0 |
|
|
Loss from early extinguishment of debt |
|
|
— |
|
|
(17.8) |
|
|
— |
|
|
Other income (expense), net |
|
|
0.6 |
|
|
0.2 |
|
|
(1.0) |
|
|
Interest expense, net |
|
|
(7.1) |
|
|
(3.4) |
|
|
(9.1) |
|
|
Income (loss) before income taxes |
|
|
25.4 |
|
|
(105.8) |
|
|
65.9 |
|
|
Income tax (expense) benefit |
|
|
(6.9) |
|
|
37.5 |
|
|
(26.9) |
|
|
Net income (loss) |
|
|
18.5 |
|
|
(68.3) |
|
|
39.0 |
|
|
Preferred stock dividends |
|
|
(4.0) |
|
|
(3.6) |
|
|
— |
|
|
Net income (loss) less preferred stock dividends |
|
|
14.5 |
|
|
(71.9) |
|
|
39.0 |
|
|
Income allocated to participating securities |
|
|
(0.6) |
|
|
— |
|
|
— |
|
|
Net income (loss) available to common stockholders |
|
$ |
13.9 |
|
$ |
(71.9) |
|
$ |
39.0 |
|
|
|
|
|
|
|
|
|
|
|
|
|
|
Earnings (loss) per share: |
|
|
|
|
|
|
|
|
|
|
|
Basic earnings (loss) per share |
|
$ |
0.19 |
|
$ |
(1.00) |
|
$ |
0.85 |
|
|
Diluted earnings (loss) per share |
|
$ |
0.18 |
|
$ |
(1.00) |
|
$ |
0.84 |
|
|
Weighted-average common shares outstanding: |
|
|
|
|
|
|
|
|
|
|
|
Basic |
|
|
74.9 |
|
|
71.8 |
|
|
46.1 |
|
|
Diluted |
|
|
75.9 |
|
|
71.8 |
|
|
46.4 |
|
The accompanying notes are an integral part of these Consolidated Financial Statements.
48
DigitalGlobe, Inc.
|
|
|
As of December 31, |
|
||||
|
(in millions, except par value) |
|
2014 |
|
2013 |
|
||
|
ASSETS |
|
|
|
|
|
|
|
|
CURRENT ASSETS: |
|
|
|
|
|
|
|
|
Cash and cash equivalents |
|
$ |
117.8 |
|
$ |
229.1 |
|
|
Restricted cash |
|
|
2.3 |
|
|
6.9 |
|
|
Accounts receivable, net of allowance for doubtful accounts of $0.5 and $2.4, respectively |
|
|
133.6 |
|
|
116.3 |
|
|
Short-term deferred contract costs |
|
|
9.1 |
|
|
10.0 |
|
|
Prepaid and current assets |
|
|
22.6 |
|
|
23.8 |
|
|
Deferred taxes (Note 13) |
|
|
24.1 |
|
|
5.9 |
|
|
Total current assets |
|
|
309.5 |
|
|
392.0 |
|
|
Property and equipment, net of accumulated depreciation of $1,095.5 and $880.6, respectively |
|
|
2,174.7 |
|
|
2,177.5 |
|
|
Goodwill |
|
|
484.5 |
|
|
459.3 |
|
|
Intangible assets, net of accumulated amortization of $19.5 and $8.7, respectively |
|
|
43.0 |
|
|
39.9 |
|
|
Aerial image library, net of accumulated amortization of $46.1 and $41.3, respectively |
|
|
4.3 |
|
|
9.1 |
|
|
Long-term restricted cash |
|
|
4.0 |
|
|
4.5 |
|
|
Long-term deferred contract costs |
|
|
41.8 |
|
|
44.9 |
|
|
Other assets |
|
|
33.4 |
|
|
38.6 |
|
|
Total assets |
|
$ |
3,095.2 |
|
$ |
3,165.8 |
|
|
LIABILITIES AND STOCKHOLDERS’ EQUITY |
|
|
|
|
|
|
|
|
CURRENT LIABILITIES: |
|
|
|
|
|
|
|
|
Accounts payable |
|
$ |
4.4 |
|
$ |
20.9 |
|
|
Current portion of long-term debt |
|
|
5.5 |
|
|
5.5 |
|
|
Other accrued liabilities |
|
|
62.2 |
|
|
80.3 |
|
|
Current portion of deferred revenue |
|
|
91.0 |
|
|
81.3 |
|
|
Total current liabilities |
|
|
163.1 |
|
|
188.0 |
|
|
Deferred revenue |
|
|
335.1 |
|
|
374.6 |
|
|
Long-term debt, net of discount |
|
|
1,132.1 |
|
|
1,137.1 |
|
|
Long-term deferred tax liability, net (Note 13) |
|
|
101.9 |
|
|
80.0 |
|
|
Other liabilities |
|
|
9.5 |
|
|
2.8 |
|
|
Total liabilities |
|
$ |
1,741.7 |
|
$ |
1,782.5 |
|
|
COMMITMENTS AND CONTINGENCIES (NOTE 17) |
|
|
|
|
|
|
|
|
STOCKHOLDERS’ EQUITY |
|
|
|
|
|
|
|
|
DigitalGlobe, Inc. stockholders' equity: |
|
|
|
|
|
|
|
|
Series A convertible preferred stock, $0.001 par value, 0.08 shares authorized; 0.08 issued and outstanding at December 31, 2014 and 2013 |
|
|
— |
|
|
— |
|
|
Common stock; $0.001 par value; 250.0 shares authorized; 76.1 shares issued and 73.2 shares outstanding at December 31, 2014 and 75.5 shares issued and 75.3 shares outstanding at December 31, 2013 |
|
|
0.2 |
|
|
0.2 |
|
|
Treasury stock, at cost; 2.9 shares at December 31, 2014 and 0.2 shares at December 31, 2013 |
|
|
(80.1) |
|
|
(3.5) |
|
|
Additional paid-in capital |
|
|
1,484.0 |
|
|
1,457.5 |
|
|
Accumulated deficit |
|
|
(52.4) |
|
|
(70.9) |
|
|
Total DigitalGlobe, Inc. stockholders' equity |
|
|
1,351.7 |
|
|
1,383.3 |
|
|
Noncontrolling interest |
|
|
1.8 |
|
|
— |
|
|
Total stockholders’ equity |
|
|
1,353.5 |
|
|
1,383.3 |
|
|
Total liabilities and stockholders’ equity |
|
$ |
3,095.2 |
|
$ |
3,165.8 |
|
The accompanying notes are an integral part of these Consolidated Financial Statements.
49
DigitalGlobe, Inc.
Consolidated Statements of Cash Flows
|
|
|
|
|
|
|
|
|
|
|
|
|
|
|
For the year ended December 31, |
|
|||||||
|
(in millions) |
|
2014 |
|
2013 |
|
2012 |
|
|||
|
CASH FLOWS FROM OPERATING ACTIVITIES: |
|
|
|
|
|
|
|
|
|
|
|
Net income (loss) |
|
$ |
18.5 |
|
$ |
(68.3) |
|
$ |
39.0 |
|
|
Adjustments to reconcile net income (loss) to net cash provided by operating activities: |
|
|
|
|
|
|
|
|
|
|
|
Depreciation and amortization expense |
|
|
238.5 |
|
|
224.8 |
|
|
114.6 |
|
|
Amortization of aerial image library, deferred contract costs and lease incentive |
|
|
14.7 |
|
|
16.9 |
|
|
17.9 |
|
|
Non-cash stock-based compensation expense, net of capitalized stock-based compensation expense |
|
|
18.1 |
|
|
23.0 |
|
|
9.2 |
|
|
Excess tax benefit from share-based compensation |
|
|
(3.0) |
|
|
— |
|
|
— |
|
|
Amortization of debt issuance costs and accretion of debt discount, net of capitalized interest |
|
|
1.9 |
|
|
3.6 |
|
|
3.7 |
|
|
Write-off of debt issuance costs and debt discount |
|
|
— |
|
|
12.8 |
|
|
— |
|
|
Deferred income taxes |
|
|
6.7 |
|
|
(31.4) |
|
|
17.2 |
|
|
Loss on disposal of assets and other |
|
|
1.1 |
|
|
(0.3) |
|
|
1.0 |
|
|
Changes in working capital, net of assets acquired and liabilities assumed in business combinations: |
|
|
|
|
|
|
|
|
|
|
|
Accounts receivable, net |
|
|
(14.7) |
|
|
(10.4) |
|
|
(16.3) |
|
|
Deferred contract costs |
|
|
(7.2) |
|
|
(19.1) |
|
|
(0.5) |
|
|
Other current and non-current assets |
|
|
2.0 |
|
|
(2.2) |
|
|
(10.4) |
|
|
Accounts payable |
|
|
(23.1) |
|
|
0.1 |
|
|
0.9 |
|
|
Accrued liabilities |
|
|
4.2 |
|
|
(37.5) |
|
|
14.6 |
|
|
Deferred revenue |
|
|
(32.8) |
|
|
14.1 |
|
|
73.6 |
|
|
Cash fees paid for early extinguishment of long-term debt and debt discount |
|
|
— |
|
|
(13.8) |
|
|
— |
|
|
Net cash flows provided by operating activities |
|
|
224.9 |
|
|
112.3 |
|
|
264.5 |
|
|
CASH FLOWS FROM INVESTING ACTIVITIES: |
|
|
|
|
|
|
|
|
|
|
|
Construction in progress additions |
|
|
(222.2) |
|
|
(273.8) |
|
|
(210.7) |
|
|
Property and equipment additions |
|
|
(11.8) |
|
|
(13.3) |
|
|
(10.7) |
|
|
Acquisition of businesses, net of cash acquired |
|
|
(35.7) |
|
|
(524.0) |
|
|
— |
|
|
Decrease in restricted cash |
|
|
5.1 |
|
|
16.6 |
|
|
5.4 |
|
|
Net cash flows used in investing activities |
|
|
(264.6) |
|
|
(794.5) |
|
|
(216.0) |
|
|
CASH FLOWS FROM FINANCING ACTIVITIES: |
|
|
|
|
|
|
|
|
|
|
|
Proceeds from issuance of debt |
|
|
— |
|
|
1,150.0 |
|
|
— |
|
|
Repayment of debt |
|
|
(5.5) |
|
|
(485.3) |
|
|
(5.0) |
|
|
Payment of debt issuance costs |
|
|
— |
|
|
(36.2) |
|
|
— |
|
|
Repurchase of common stock |
|
|
(75.1) |
|
|
— |
|
|
— |
|
|
Proceeds from exercise of stock options |
|
|
11.1 |
|
|
39.6 |
|
|
4.2 |
|
|
Preferred stock dividend payment |
|
|
(4.0) |
|
|
(3.0) |
|
|
— |
|
|
Excess tax benefit from share-based compensation |
|
|
3.0 |
|
|
— |
|
|
— |
|
|
Principal payments on capital lease obligations |
|
|
(1.1) |
|
|
— |
|
|
— |
|
|
Net cash flows (used in) provided by financing activities |
|
|
(71.6) |
|
|
665.1 |
|
|
(0.8) |
|
|
Net (decrease) increase in cash and cash equivalents |
|
|
(111.3) |
|
|
(17.1) |
|
|
47.7 |
|
|
Cash and cash equivalents, beginning of period |
|
|
229.1 |
|
|
246.2 |
|
|
198.5 |
|
|
Cash and cash equivalents, end of period |
|
$ |
117.8 |
|
$ |
229.1 |
|
$ |
246.2 |
|
|
SUPPLEMENTAL CASH FLOW INFORMATION: |
|
|
|
|
|
|
|
|
|
|
|
Cash paid for interest, net of capitalized amounts of $49.5, $38.1 and $24.4, respectively |
|
$ |
— |
|
$ |
— |
|
$ |
5.4 |
|
|
Cash paid (refunded) for income taxes |
|
|
(11.0) |
|
|
13.9 |
|
|
1.5 |
|
|
NON-CASH INVESTING AND FINANCING ACTIVITIES: |
|
|
|
|
|
|
|
|
|
|
|
Changes to non-cash property, equipment and construction in progress accruals, including interest |
|
$ |
16.5 |
|
$ |
(12.9) |
|
$ |
9.0 |
|
|
Additions to capital lease obligations |
|
|
(3.1) |
|
|
(0.9) |
|
|
— |
|
|
Issuance of shares of common and convertible preferred stock for acquisition of business |
|
|
— |
|
|
837.8 |
|
|
— |
|
|
Stock-based compensation awards issued in acquisition of business, net of income taxes |
|
|
— |
|
|
13.4 |
|
|
— |
|
|
Non-cash preferred stock dividend accrual |
|
|
(1.0) |
|
|
(1.0) |
|
|
— |
|
The accompanying notes are an integral part of these Consolidated Financial Statements.
50
DigitalGlobe, Inc.
Consolidated Statements of Stockholders’ Equity
|
|
|
|
|
|
|
|
|
|
|
|
|
|
|
|
|
|
|
|
Total |
|
|
|
|
|
|
||
|
|
|
|
|
|
|
|
|
|
|
|
|
|
|
|
|
|
|
|
DigitalGlobe, Inc. |
|
|
|
|
Total |
|
||
|
|
|
Common Stock |
|
Treasury Stock |
|
Additional |
|
Accumulated |
|
Stockholders’ |
|
Noncontrolling |
|
Stockholders’ |
|
||||||||||||
|
(in millions) |
|
Shares |
|
Amount |
|
Shares |
|
Amount |
|
Paid-in |
|
Deficit |
|
Equity |
|
Interest |
|
Equity |
|
||||||||
|
Balance at December 31, 2011 |
|
46.4 |
|
$ |
0.2 |
|
|
(0.1) |
|
$ |
(1.2) |
|
$ |
530.0 |
|
$ |
(41.6) |
|
$ |
487.4 |
|
$ |
— |
|
$ |
487.4 |
|
|
Stock issued upon exercise of stock options and stock grants |
|
0.8 |
|
|
— |
|
|
— |
|
|
— |
|
|
3.8 |
|
|
— |
|
|
3.8 |
|
|
— |
|
|
3.8 |
|
|
Surrender of common stock to cover employees’ minimum tax liability for vested awards |
|
— |
|
|
— |
|
|
— |
|
|
(0.8) |
|
|
— |
|
|
— |
|
|
(0.8) |
|
|
— |
|
|
(0.8) |
|
|
Stock-based compensation expense, net of forfeitures |
|
— |
|
|
— |
|
|
— |
|
|
— |
|
|
10.0 |
|
|
— |
|
|
10.0 |
|
|
— |
|
|
10.0 |
|
|
Net income |
|
— |
|
|
— |
|
|
— |
|
|
— |
|
|
— |
|
|
39.0 |
|
|
39.0 |
|
|
— |
|
|
39.0 |
|
|
Balance at December 31, 2012 |
|
47.2 |
|
|
0.2 |
|
|
(0.1) |
|
|
(2.0) |
|
|
543.8 |
|
|
(2.6) |
|
|
539.4 |
|
|
— |
|
|
539.4 |
|
|
Issuance of common stock for acquisition |
|
25.9 |
|
|
— |
|
|
— |
|
|
— |
|
|
723.8 |
|
|
— |
|
|
723.8 |
|
|
— |
|
|
723.8 |
|
|
Issuance of Series A convertible preferred stock for acquisition |
|
— |
|
|
— |
|
|
— |
|
|
— |
|
|
114.0 |
|
|
— |
|
|
114.0 |
|
|
— |
|
|
114.0 |
|
|
Fair value of vested options and restricted stock assumed in acquisition |
|
0.4 |
|
|
— |
|
|
— |
|
|
— |
|
|
22.4 |
|
|
— |
|
|
22.4 |
|
|
— |
|
|
22.4 |
|
|
Stock issued upon exercise of stock options and stock grants |
|
2.0 |
|
|
— |
|
|
— |
|
|
— |
|
|
39.6 |
|
|
— |
|
|
39.6 |
|
|
— |
|
|
39.6 |
|
|
Surrender of common stock to cover employees’ minimum tax liability for vested awards |
|
— |
|
|
— |
|
|
(0.1) |
|
|
(1.5) |
|
|
(6.2) |
|
|
— |
|
|
(7.7) |
|
|
— |
|
|
(7.7) |
|
|
Stock-based compensation expense, net of forfeitures |
|
— |
|
|
— |
|
|
— |
|
|
— |
|
|
23.7 |
|
|
— |
|
|
23.7 |
|
|
— |
|
|
23.7 |
|
|
Preferred stock dividends |
|
— |
|
|
— |
|
|
— |
|
|
— |
|
|
(3.6) |
|
|
— |
|
|
(3.6) |
|
|
— |
|
|
(3.6) |
|
|
Net loss |
|
— |
|
|
— |
|
|
— |
|
|
— |
|
|
— |
|
|
(68.3) |
|
|
(68.3) |
|
|
— |
|
|
(68.3) |
|
|
Balance at December 31, 2013 |
|
75.5 |
|
|
0.2 |
|
|
(0.2) |
|
|
(3.5) |
|
|
1,457.5 |
|
|
(70.9) |
|
|
1,383.3 |
|
|
— |
|
|
1,383.3 |
|
|
Stock issued upon exercise of stock options and stock grants |
|
0.6 |
|
|
— |
|
|
— |
|
|
— |
|
|
11.1 |
|
|
— |
|
|
11.1 |
|
|
— |
|
|
11.1 |
|
|
Surrender of common stock to cover employees’ minimum tax liability for vested awards |
|
— |
|
|
— |
|
|
— |
|
|
(1.5) |
|
|
(2.5) |
|
|
— |
|
|
(4.0) |
|
|
— |
|
|
(4.0) |
|
|
Repurchase of common stock |
|
— |
|
|
— |
|
|
(2.7) |
|
|
(75.1) |
|
|
— |
|
|
— |
|
|
(75.1) |
|
|
— |
|
|
(75.1) |
|
|
Stock-based compensation expense, net of forfeitures |
|
— |
|
|
— |
|
|
— |
|
|
— |
|
|
18.9 |
|
|
— |
|
|
18.9 |
|
|
— |
|
|
18.9 |
|
|
Preferred stock dividends |
|
— |
|
|
— |
|
|
— |
|
|
— |
|
|
(4.0) |
|
|
— |
|
|
(4.0) |
|
|
— |
|
|
(4.0) |
|
|
Tax benefit associated with share-based awards |
|
— |
|
|
— |
|
|
— |
|
|
— |
|
|
3.0 |
|
|
— |
|
|
3.0 |
|
|
— |
|
|
3.0 |
|
|
Noncontrolling interest |
|
— |
|
|
— |
|
|
— |
|
|
— |
|
|
— |
|
|
— |
|
|
— |
|
|
1.8 |
|
|
1.8 |
|
|
Net income |
|
— |
|
|
— |
|
|
— |
|
|
— |
|
|
— |
|
|
18.5 |
|
|
18.5 |
|
|
— |
|
|
18.5 |
|
|
Balance at December 31, 2014 |
|
76.1 |
|
$ |
0.2 |
|
|
(2.9) |
|
$ |
(80.1) |
|
$ |
1,484.0 |
|
$ |
(52.4) |
|
$ |
1,351.7 |
|
$ |
1.8 |
|
$ |
1,353.5 |
|
The accompanying notes are an integral part of these Consolidated Financial Statements.
51
DigitalGlobe is a leading global provider of geospatial information products and services sourced from its own advanced satellite constellation. Its products and services support users in a wide variety of fields including defense, intelligence and homeland security, mapping and analysis, environmental monitoring, oil and gas exploration and infrastructure management. Each day users depend on DigitalGlobe’s data, information, technology and expertise to better understand our changing planet in order to save lives, resources and time.
NOTE 2.Summary of Significant Accounting Policies and Recent Accounting Pronouncements
Principles of Consolidation and Basis of Presentation
The Consolidated Financial Statements include the accounts of DigitalGlobe, Inc. and its wholly owned subsidiaries. Intercompany accounts and transactions have been eliminated in consolidation. The Consolidated Financial Statements have been prepared in accordance with accounting principles generally accepted in the United States of America (“U.S. GAAP”). Certain prior year amounts were reclassified to conform to our current year presentation.
Use of Estimates
The preparation of financial statements in conformity with U.S. GAAP requires management to make estimates and assumptions that affect the amounts of assets and liabilities at the reporting date, and amounts of revenue and expenses during the periods presented. Due to the inherent uncertainties in making estimates, actual results could differ from those estimates and such differences may be material to the Consolidated Financial Statements.
Revenue Recognition
Revenue is recognized when the following criteria have been met: persuasive evidence of an arrangement exists, delivery has occurred or services have been rendered, the fee is fixed or determinable and the collection of funds is reasonably assured. The Company records deferred revenue when it receives payments in advance of the delivery of products or the performance of services.
The Company enters into certain revenue arrangements that consist of multiple deliverables of its products and services. The majority of revenue recorded by the Company for multiple deliverable arrangements relates to the EnhancedView Contract, Value Added Services, and the Direct Access Program (“DAP”), discussed in detail below. The Company allocates arrangement consideration to the deliverables on the basis of their relative selling prices. In such circumstances, we use a hierarchy to determine the selling prices to be used for allocating revenue: (i) vendor-specific objective evidence of fair value (“VSOE”), (ii) third-party evidence of selling price (“TPE”), and (iii) best estimate of the selling price (“BESP”). The Company generally uses BESP to allocate revenue as we have been unable to establish VSOE or TPE due to the unique nature of our products and services and lack of visibility into competitor pricing.
The Company’s revenue is primarily generated from: (i) the Company’s EnhancedView Contract with the U.S. Government and various value added service arrangements awarded under EnhancedView, (ii) DAP revenue, (iii) the licensing of imagery and imagery-related products, and (iv) certain other arrangements as described in further detail below.
EnhancedView Contract – The EnhancedView Contract contains multiple deliverables, including a service level agreement (“SLA”), infrastructure enhancements and other services. The Company determined that these deliverables do not qualify as separate units of account due to a lack of standalone value. The Company recognizes revenue for this single unit of accounting using a proportional performance method. Under this method, revenue is recognized based on satellite capacity made available to the NGA in a particular period compared to the total capacity to be made available over the term of the
52
contract. Capacity made available (and revenue) has increased over the term of the arrangement as a result of the installation of additional regional ground terminals and the October 1, 2014 commissioning of WorldView-3. Each monthly SLA payment is subject to a performance penalty depending upon the Company’s performance against pre-defined performance criteria. Revenue in the amount of any performance penalty is deferred when assessed and recognized when mutually agreeable future products or services are delivered.
Value Added Services Awarded Under the EnhancedView Contract - From time to time, the NGA awards certain contracts for value added services whereby the Company meets NGA’s more advanced imagery requirements. The largest such arrangement is GEGD, which, among other things, provides for the delivery of certain orthorectified imagery and imagery-related products and services. Revenue is recognized for this multiple element arrangement as the Company’s contractual obligations are satisfied. Due to the nature of the hosting requirements as provided by the EnhancedView SLA, certain consideration is being deferred and recognized over the term of the EnhancedView contract.
DAP - DAP arrangements generally include construction of the direct access facility, access to the satellite to task and download imagery, and facility maintenance services. The facility is generally delivered at the beginning of the contractual period of performance, and access and maintenance services span over one or several years. DAP arrangements are typically assessed as multiple element arrangements. Revenue related to satellite access is recognized as minutes are consumed by the customer, while maintenance revenue is recognized ratably over the maintenance period. The DAP facility does not have standalone value without the ongoing access service. Therefore, any up-front fees related to the facility are recorded as deferred revenue and amortized ratably over the estimated customer relationship period, for which the useful life of the longest-lived satellite accessed by the customer is generally used.
Licensing of Imagery – Revenue is recognized for imagery licenses depending on the nature of how the imagery is delivered and whether or not the Company has a continuing obligation.
|
· |
Imagery delivered offline (i.e., via DVD/hard-drive or FTP) is typically contracted for as a one-time delivery. Revenue is recognized when the imagery is physically delivered to the customer, or in the case of FTP delivery, when the customer is able to directly download the imagery provided that all other revenue recognition criteria have been met. If the Company has a continuing obligation to refresh previously delivered imagery, the Company allocates a portion of the contractual consideration to the separate deliverables on the basis of their relative selling prices and recognizes the allocated revenue as delivery occurs. |
|
· |
Imagery delivered online is typically hosted on either the Company’s hosting platform or a 3rd party hosting platform. Revenue is generally recognized ratably over the hosting period. |
Certain contracts with customers include terms and conditions related to customer acceptance of deliverables. Typically, acceptance terms are objective, and revenue is recognized upon delivery provided all other revenue recognition criteria have been met. However, some of the Company’s arrangements include acceptance terms that are subjective. When acceptance terms are subjective, revenue recognition is deferred until explicit acceptance is received from the Customer and all other revenue recognition criteria have been met.
Subscription-Based Sales – Certain of the Company’s products are sold on a subscription basis in which the Customer is given access via the cloud to a subset of imagery and/or imagery-related products. Generally, the Customer receives access to whatever imagery is then available as well as certain new imagery captured over their area of interest during the contractual period with no guaranteed minimum quantity of new imagery to be delivered. The Company recognizes revenue for subscription-based products on a ratable basis over the subscription period.
Royalties – For certain of the Company’s agreements customers pay royalties for incorporating our imagery products into their value added products for commercial distribution. Royalty revenue is either recognized as reported by the Customer if the Company has satisfied all of its contractual obligations or, in the event the Company has a continuing obligation, royalty revenue is recognized proportionately over the period in which that obligation will be satisfied.
53
Intelligence Solutions Products and Services – Through Intelligence Solutions, the Company provides, among other services, embedded analytic services, foundational geospatial data, and unique technology solutions that primarily support the U.S. government and military intelligence missions around the globe. Such arrangements are typically contracted for on a time and materials basis and revenue is recognized on the basis of time plus reimbursable costs incurred during the period.
Reseller Revenue – The Company maintains a vast network of both domestic and foreign reseller partners who sell our products and services to end users. Revenue under these arrangements is generally recognized, net of any reseller discounts, as the products and services are delivered to the reseller provided all other revenue recognition criteria have been met. If the Company has a continuing obligation to the reseller or their end user, revenue is recognized on a systematic basis mirroring the pattern of that obligation.
NextView Revenue – In connection with the Company’s NextView agreement with the NGA (the predecessor contract to the EnhancedView contract), the Company received $266.0 million to offset the construction costs of WorldView-1, which was recorded as deferred revenue when received. When WorldView-1 reached FOC in November 2007, the Company began recognizing the deferred revenue on a straight-line basis over the estimated useful life of the WorldView-1 satellite.
Property and Equipment
Property and equipment, including internal use software, are recorded at cost. Property and equipment acquired in a business combination are recorded at their fair value at the date of acquisition. Repair and maintenance costs are expensed as incurred. Significant improvements that extend the useful life or add functionality are capitalized. Depreciation is recognized once an asset is placed in service on a straight-line basis over the estimated useful life of the related asset. Leasehold improvements are amortized over the shorter of the lease term or their estimated useful lives.
Satellite costs associated with the design, construction, launch, and commissioning phases of the satellite are capitalized. The Company capitalizes interest, launch insurance and in-orbit insurance costs that are incurred during these periods. Insurance costs incurred after a satellite is placed into service are recognized as expense ratably over the related policy periods and are included in selling, general and administrative costs. The costs to construct and test ground systems, which are primarily comprised of hardware and software and allow for communication to the Company’s satellites, are also capitalized. Costs related to the Company’s satellites are included in construction in progress until in-orbit testing is complete and the satellite is placed into service. The Company depreciates the cost of a satellite once it is placed into service over its estimated useful life using the straight-line method of depreciation as the Company anticipates that the satellite will provide consistent levels of imagery over its estimated life.
In certain instances, the Company may construct a satellite but choose to store it for a period of time prior to launch. When a satellite is placed into storage, storage costs and all other incremental costs that result from placing the satellite into storage will be expensed as incurred. Capitalization of interest will cease during the period in which the satellite is in storage and during which no additional enhancements are being made. When the satellite is removed from storage in preparation for launch, incremental costs incurred to launch the satellite and perform in-orbit testing prior to the satellite reaching FOC will be capitalized as these costs are necessary to place the satellite into service.
The Company reviews the expected useful life of its satellites annually, or when events or circumstances indicate an earlier reevaluation is required. When an adjustment is made to the estimated useful life of a satellite, the remaining carrying amount of the satellite is depreciated prospectively over its adjusted remaining useful life.
Deferred Contract Costs
The Company defers certain direct costs incurred in the construction or significant upgrade of direct access facilities built for DAP customers, consisting of hardware, software and labor. The deferred contract costs are recognized as expense over the same period as the related deferred revenue arising from up-front payments for the DAP, which is the
54
estimated customer relationship period, except when deferred contract costs are in excess of related deferred revenues, in which case the excess costs are recognized over the initial contract period.
DigitalGlobe capitalized certain internal support costs and other expenditures reimbursable under the NextView agreement incurred in the construction and development of its WorldView-1 satellite and related ground systems. These costs were not capitalized as fixed assets, but were accounted for as deferred contract costs. When WorldView-1 reached FOC, the Company began amortizing the related deferred contract costs ratably over the expected life of the satellite, the same period over which NextView Revenues are being recognized.
Goodwill
Goodwill represents the excess of purchase price over the fair value of net assets acquired in a business combination. Goodwill is tested annually for impairment in the fourth quarter, or more frequently if events or circumstances change that would indicate that the carrying amount may not be recoverable. When the fair value of a reporting unit falls below its carrying amount, an impairment charge is recorded. Fair value of the Company’s single reporting unit is determined using the Company’s market capitalization and is further substantiated using a discounted cash flow analysis.
Intangible Assets
Intangible assets (identified as technology, customer lists, trademarks, U.S. Federal Communications Commission licenses and other) are recorded at fair value at the time of acquisition. Finite-lived intangible assets are stated at cost less accumulated amortization. Amortization is recorded using the straight-line method, which approximates the expected pattern of economic benefit, over the estimated useful lives of the assets.
Valuation of Long-Lived Assets
Property and equipment and other long-lived assets are tested for impairment whenever events or changes in circumstances indicate that the carrying amount may not be recoverable. The Company measures recoverability by comparing the carrying amount to the projected cash flows the assets are expected to generate. An impairment loss is recognized to the extent that carrying value exceeds fair value.
If a satellite were to fail during launch or while in-orbit, the resulting loss would be charged to expense in the period it is determined that the satellite is not recoverable. The amount of any such loss would be reduced to the extent of insurance proceeds estimated to be received.
Cash and Cash Equivalents
All highly liquid investments with maturities of three months or less at the date of purchase are classified as cash equivalents. The Company’s cash equivalents consist of U.S. Treasury money market investments.
Restricted cash primarily consists of contractually restricted amounts under certain of the Company’s lease agreements as well as performance bonds issued by the Company under DAP.
Fair Values of Financial Instruments
The fair value guidance establishes a three-level valuation hierarchy for disclosure of fair value measurements based on the transparency of inputs to the valuation of an asset or liability as of the measurement date. A financial instrument’s categorization within the valuation hierarchy is based upon the lowest level of input that is significant to the fair value measurement.
|
· |
Level 1 — quoted prices (unadjusted) for identical assets or liabilities in active markets. |
55
|
· |
Level 2 — quoted prices for similar assets and liabilities in active markets, and inputs that are observable for the asset or liability, either directly or indirectly, for substantially the full term of the financial instrument. |
|
· |
Level 3 — unobservable inputs when little or no market data is available. |
The carrying value for cash and cash equivalents, receivables, other current assets, and accounts payable and accrued liabilities approximates fair value. Fair value of our long-term debt is estimated using inputs that incorporate certain active market quotations for similar, but not identical, assets based upon trading activity among lenders as well as other indirect inputs.
Allowance for Doubtful Accounts
The Company estimates an allowance for doubtful accounts for its receivables based on historical experience, aging analysis, credit quality of our customers, current economic conditions and other factors that may affect customers’ ability to pay.
Share-Based Compensation
Share-based compensation, including grants of employee stock options and restricted stock-based awards, is measured at the grant date based on the fair value of the award. The Company estimates the fair value of stock options on the grant date using a Black-Scholes valuation model. Share based compensation for restricted stock awards (“RSAs”) and restricted stock units (“RSUs”) is measured based on the closing fair market value of the Company’s common stock on the date of grant. For performance stock units (“PSUs”), the vesting of which is contingent upon the achievement of certain performance metrics, certain portions of grants are measured based on the closing price of the Company’s stock on the date of grant and a portion valued using a Monte Carlo simulation. The Company recognizes share-based compensation cost on a straight-line basis over the award’s requisite service period.
Income Taxes
Deferred tax assets and liabilities are recognized for the estimated future tax effects attributable to the temporary differences between the financial statement carrying amounts of existing assets and liabilities and their respective tax bases as well as operating loss and tax credit carryforwards. The effect on deferred tax assets and liabilities of a change in enacted tax laws is recognized as an adjustment to the tax provision or benefit in the period of enactment. Valuation allowances are established to reduce deferred tax assets to the amount that will more likely than not be realized. To the extent that a determination is made to establish or adjust a valuation allowance, the expense or benefit is recorded in the period in which the determination is made.
The Company utilizes a two-step approach to recognizing and measuring uncertain tax positions (tax contingencies). The first step is to evaluate the tax position for recognition by determining if the weight of available evidence indicates it is more likely than not that the position will be sustained on audit, including resolution of related appeals or litigation processes. The second step is to measure the tax benefit as the largest amount that is more than 50% likely of being realized upon ultimate settlement. The Company considers many factors when evaluating and estimating its tax positions and tax benefits, which may require periodic adjustments and which may not accurately forecast actual outcomes. The Company includes interest and penalties related to its tax contingencies as part of the provision for income taxes.
Judgment is required in determining the provision for income taxes. Additionally, the income tax provision is based on calculations and assumptions that are subject to examination by a number of different tax authorities, and to changes in tax law and rates in many jurisdictions. We adjust our income tax provision in the period in which it becomes probable that actual results will differ from our estimates.
56
Recent Accounting Pronouncements
In May 2014, the Financial Accounting Standards Board issued Accounting Standards Update 2014-09, Revenue from Contracts with Customers (Topic 606) (“ASU 2014-09”), which supersedes nearly all existing revenue recognition guidance under U.S. GAAP. ASU 2014-09 provides for a single five-step model to be applied to all revenue contracts with customers and significantly expands disclosure requirements. ASU 2014-09 permits two methods of adoption: retrospectively to each prior reporting period presented or retrospectively with the cumulative effect of initially applying the new standard recognized at the date of initial application. The new standard is effective beginning on January 1, 2017 for the Company and early adoption is not permitted. The Company continues to evaluate the impact of ASU 2014-09 and available adoption methods on our consolidated financial statements.
NOTE 3.Deferred Revenue
A rollforward of the deferred revenue balance from December 31, 2013 to December 31, 2014 is as follows:
|
|
|
U.S. Government |
|
Diversified Commercial |
|
|
|
|
|||||||||||
|
|
|
|
|
|
|
|
|
Pre-FOC |
|
|
|
|
|
|
|
|
|
|
|
|
|
|
|
|
|
|
|
|
Payments |
|
|
|
|
|
|
|
|
|
|
|
|
|
|
Enhanced |
|
Value Added |
|
Related To |
|
|
|
|
|
|
|
|
|
|
|||
|
(in millions) |
|
View SLA |
|
Services |
|
NextView |
|
DAP |
|
Other |
|
Total |
|
||||||
|
Balance, December 31, 2013 |
|
$ |
194.3 |
|
$ |
99.3 |
|
$ |
111.7 |
|
$ |
45.7 |
|
$ |
4.9 |
|
$ |
455.9 |
|
|
Deferred revenue acquired in Spatial Energy acquisition |
|
|
— |
|
|
— |
|
|
— |
|
|
— |
|
|
2.8 |
|
|
2.8 |
|
|
Cash collections |
|
|
270.4 |
|
|
56.8 |
|
|
— |
|
|
64.1 |
|
|
54.7 |
|
|
446.0 |
|
|
Revenue recognized from deferred revenue |
|
|
(254.7) |
|
|
(78.4) |
|
|
(22.9) |
|
|
(70.4) |
|
|
(52.2) |
|
|
(478.6) |
|
|
Balance, December 31, 2014 |
|
$ |
210.0 |
|
$ |
77.7 |
|
$ |
88.8 |
|
$ |
39.4 |
|
$ |
10.2 |
|
$ |
426.1 |
|
EnhancedView SLA
Deferred revenue related to the EnhancedView SLA arises as a result of revenue recognition occurring based on a proportional performance model whereby recognition prior to October 1, 2014 was less than cash payments made in the corresponding period. Subsequent to October 1, 2014 as a result of a material increase in capacity made available to the NGA we began to recognize more revenue than we received in cash. We will continue to recognize more revenue than we receive in cash through the end of the ten-year term of the EnhancedView SLA (inclusive of renewal periods), at which point all deferred revenue will have been recognized. There was no deferred revenue arising from performance penalties during the year ended December 31, 2014.
U.S. Government Value Added Services (“VAS”)
The majority of U.S. Government VAS deferred revenue relates to GEGD. Certain requirements of this arrangement include hosting imagery products over different periods of performance. Revenue on these hosted products is deferred and recognized over the related hosting period.
NextView
Cash payments received from NGA to offset the construction costs of WorldView-1 as part of the NextView contract were recorded as deferred revenue when received and are being recognized as revenue ratably over the estimated life of WorldView-1. Beginning in the fourth quarter of 2014, the period of recognition was extended until the fourth quarter of 2020 to reflect the longer useful life of WorldView-1 and the remaining deferred revenue balance will be recognized over the extended remaining term on a prospective basis. This change will reduce the recognition of NextView deferred revenue by $10.4 million annually and $2.6 million per quarter over the remaining useful life of WorldView-1.
57
Direct Access Program
Deferred revenue under the DAP is comprised of up-front fees paid by the customer for the facility, as well as prepaid access minutes and maintenance.
Other Agreements
The Company enters into various commercial relationships that sometimes include obligations that are paid for in advance and recognized in subsequent reporting periods. These obligations are typically related to the hosting of imagery or the obligation to refresh previously delivered imagery.
NOTE 4.Business Acquisitions
On January 31, 2013, DigitalGlobe completed its acquisition of 100% of the outstanding stock of GeoEye, Inc. (“GeoEye”), a leading provider of geospatial intelligence solutions in a stock and cash transaction valued at approximately $1.4 billion. The acquisition of GeoEye broadened the Company’s service offerings, enabled it to optimize satellite orbits and collection of imagery, strengthened its production and analytics capabilities, increased the scale of its existing operations and diversified its customer base and product mix. The results of operations of GeoEye have been included in the Company’s Consolidated Financial Statements as of the acquisition date.
GeoEye common stockholders received approximately 25.9 million shares of DigitalGlobe’s common stock, valued at the Company’s stock price at the date of acquisition, and $92.8 million in cash in exchange for their shares of GeoEye common stock. In addition, each share of GeoEye’s Series A Convertible Preferred Stock was converted into one newly-designated share of Series A Preferred Stock of DigitalGlobe and $4.10 in cash for each share of GeoEye common stock into which such share of GeoEye Series A Convertible Preferred Stock was convertible. As a result, DigitalGlobe issued 80,000 shares of Series A Preferred Stock and paid approximately $11.0 million in cash to GeoEye’s Series A Convertible Preferred stockholder. The Company also assumed the awards outstanding under GeoEye’s equity incentive plans. The Company incurred total acquisition costs of $33.5 million related to the acquisition of GeoEye, of which $20.6 million was incurred in 2013. Immediately following the acquisition, the former GeoEye stockholders owned approximately 35% of DigitalGlobe’s common stock.
In accordance with the terms of the GeoEye Senior Secured Notes agreements, during the three months ended March 31, 2013, the Company redeemed the outstanding balances of GeoEye’s $400.0 million 9.625% Senior Secured Notes due in 2015 and $125.0 million 8.625% Senior Secured Notes due in 2016 and paid fees and expenses associated with the redemption totaling approximately $55.3 million and accrued interest of $16.4 million.
The total purchase price for the acquisition of GeoEye was as follows:
|
(in millions) |
|
Amount |
|
|
|
Net cash received |
|
$ |
(76.2) |
|
|
DigitalGlobe common stock |
|
|
723.8 |
|
|
DigitalGlobe Series A convertible preferred stock |
|
|
114.0 |
|
|
DigitalGlobe equity awards issued to replace GeoEye equity awards |
|
|
22.4 |
|
|
Long-term debt issued to redeem GeoEye’s long-term debt, including early termination penalties and accrued interest |
|
|
596.7 |
|
|
Aggregate purchase price |
|
$ |
1,380.7 |
|
The fair value of GeoEye’s property and equipment was estimated using a market approach from prices and other relevant information generated by market transactions involving comparable assets. The fair value of GeoEye’s satellites
58
was estimated using a replacement cost approach and was based on the amount that would be required to replace the service capacity of the assets. Under the replacement cost approach, the Company estimated the cost of a similar satellite having the nearest equivalent utility to the satellite being valued. The Company then adjusted this value, as necessary, for physical depreciation, functional obsolescence or economic obsolescence. As of the acquisition date, identifiable intangible assets, excluding technology, were measured at fair value primarily using various income approaches, which required a forecast of expected future cash flows, either for the use of a relief-from royalty method or a multi-period excess earnings method. Technology was valued using a cost approach.
The goodwill primarily represents the value expected from the synergies created through the operational enhancement benefits and competitive advantage resulting from the integration of GeoEye. None of the goodwill associated with this acquisition is deductible for tax purposes.
The following represents DigitalGlobe’s final allocation of the total purchase price to the acquired assets and liabilities assumed from GeoEye at the completion of the one year measurement period:
|
|
|
December 31, |
|
|
|
(in millions) |
|
2014 |
|
|
|
Current assets, net of cash acquired |
|
$ |
89.0 |
|
|
Property, plant and equipment, including satellite constellation |
|
|
975.4 |
|
|
Identifiable intangible assets: |
|
|
|
|
|
Technology |
|
|
26.0 |
|
|
Customer relationships |
|
|
14.0 |
|
|
Trademarks |
|
|
5.0 |
|
|
FCC licenses and other |
|
|
2.5 |
|
|
Other noncurrent assets |
|
|
4.6 |
|
|
Current liabilities |
|
|
(51.1) |
|
|
Deferred revenue |
|
|
(12.1) |
|
|
Long-term deferred tax liability, net |
|
|
(119.2) |
|
|
Fair value of acquired assets and assumed liabilities |
|
|
934.1 |
|
|
Goodwill |
|
|
446.6 |
|
|
Aggregate purchase price |
|
$ |
1,380.7 |
|
The following unaudited pro forma financial information presents the combined results of DigitalGlobe and GeoEye for the period presented, as though the acquisition of GeoEye had occurred on January 1, 2013.
|
|
|
Years ended December 31, |
|
||||||
|
(in millions, except per share data) |
|
2013 |
|
2012 |
|
||||
|
Operating revenue |
|
$ |
622.5 |
|
|
$ |
882.3 |
|
|
|
Net (loss) income |
|
|
(63.4) |
|
|
|
65.0 |
|
|
|
Net (loss) income available to common stockholders |
|
|
(67.4) |
|
|
|
63.6 |
|
|
|
Basic (loss) income per common share |
|
$ |
(0.91) |
|
|
$ |
0.88 |
|
|
|
Diluted (loss) income per common share |
|
$ |
(0.91) |
|
|
$ |
0.87 |
|
|
This pro forma information reflects certain adjustments to DigitalGlobe’s previously reported operating results, primarily including elimination of non-recurring transaction costs, increased amortization of stock-based compensation, increased amortization expense related to identifiable intangible assets recorded as part of the acquisition, changes to depreciation expense as a result of the fair value adjustment to property and equipment, decreased interest expense due to lower interest rates on long-term debt, and related income tax effects.
59
The pro forma information for the year ended December 31, 2012 includes approximately $288.0 million of revenue from GeoEye’s major contracts, principally the EnhancedView SLA with NGA, which ended in the fourth quarter of 2012. The pro forma information does not reflect the actual results of operations had the acquisition been consummated at January 1, 2012, nor is it necessarily indicative of present or future operating results. The pro forma information does not give effect to any potential revenue enhancements, cost synergies or other operating efficiencies that could result from the acquisition other than those realized subsequent to the January 31, 2013 acquisition date.
Other Acquisitions
In February 2014, the Company acquired Spatial Energy, LLC to grow its existing oil and gas industry vertical for an aggregate cash consideration, net of cash acquired, of $35.7 million. Of the total purchase price, $25.7 million was allocated to goodwill, of which $19.0 million is deductible for tax purposes, $13.9 million to acquired intangible assets and $3.9 million to net liabilities assumed.
In February 2013, the Company acquired Tomnod, Inc. for an aggregate cash consideration, net of cash acquired, of $4.0 million, of which $3.3 million was allocated to goodwill, $1.1 million to acquired intangible assets and $0.4 million to net liabilities assumed. Goodwill is not deductible for tax purposes.
Pro forma results for the Company’s other acquisitions have not been presented as such results would not be materially different from the Company’s actual results.
NOTE 5.Property and Equipment
Property and equipment was comprised of the following:
|
|
|
Depreciable Life |
|
December 31, |
|
||||||
|
(in millions) |
|
(in years) |
|
2014 |
|
2013 |
|
||||
|
Satellites |
|
9 |
- |
13 |
|
$ |
1,973.1 |
|
$ |
1,323.6 |
|
|
Construction in progress |
|
|
- |
|
|
|
765.1 |
|
|
1,283.9 |
|
|
Computer equipment and software |
|
3 |
- |
12 |
|
|
376.2 |
|
|
307.7 |
|
|
Machinery and equipment, including ground terminals |
|
|
5 |
|
|
|
109.3 |
|
|
98.6 |
|
|
Furniture, fixtures and other |
|
3 |
- |
7 |
|
|
39.9 |
|
|
37.9 |
|
|
Land and buildings |
|
|
34 |
|
|
|
6.6 |
|
|
6.4 |
|
|
Total property and equipment |
|
|
|
|
|
|
3,270.2 |
|
|
3,058.1 |
|
|
Accumulated depreciation and amortization |
|
|
|
|
|
|
(1,095.5) |
|
|
(880.6) |
|
|
Property and equipment, net |
|
|
|
|
|
$ |
2,174.7 |
|
$ |
2,177.5 |
|
As of December 31, 2014, the Company operates a constellation of five in-orbit and fully commissioned satellites and one classified as an asset under construction. QuickBird stopped capturing commercial images on December 17, 2014, as a result of its anticipated de-orbit. Additionally, in the first quarter of 2015, the Company stopped making new IKONOS
60
imagery commercially available and committed to a plan to decommission the satellite.The IKONOS, GeoEye-1 and WorldView-4 satellites were added from our acquisition of GeoEye. The net book value of each satellite is as follows:
|
|
|
|
|
|
As of December 31, 2014 |
|
As of December 31, 2013 |
|
||||||||||||||
|
|
|
Depreciable |
|
|
Gross |
|
|
|
|
Net |
|
Gross |
|
|
|
|
Net |
|
||||
|
|
|
Life |
|
|
Carrying |
|
Accumulated |
|
Book |
|
Carrying |
|
Accumulated |
|
Book |
|
||||||
|
(in millions) |
|
(in years) |
|
|
Amount |
|
Depreciation |
|
Value |
|
Amount |
|
Depreciation |
|
Value |
|
||||||
|
QuickBird |
|
12.2 |
|
|
$ |
174.4 |
|
$ |
(174.4) |
|
$ |
— |
|
$ |
174.4 |
|
$ |
(173.8) |
|
$ |
0.6 |
|
|
IKONOS |
|
9.0 |
(1) |
|
|
1.0 |
|
|
(1.0) |
|
|
— |
|
|
1.0 |
|
|
(1.0) |
|
|
— |
|
|
GeoEye-1 |
|
9.0 |
(1) |
|
|
211.8 |
|
|
(81.2) |
|
|
130.6 |
|
|
211.8 |
|
|
(38.8) |
|
|
173.0 |
|
|
WorldView-1 |
|
13.0 |
|
|
|
473.2 |
|
|
(316.8) |
|
|
156.4 |
|
|
473.2 |
|
|
(276.2) |
|
|
197.0 |
|
|
WorldView-2 |
|
13.0 |
|
|
|
463.2 |
|
|
(207.9) |
|
|
255.3 |
|
|
463.2 |
|
|
(168.5) |
|
|
294.7 |
|
|
WorldView-3 |
|
11.5 |
|
|
|
649.5 |
|
|
(14.1) |
|
|
635.4 |
|
|
— |
|
|
— |
|
|
— |
|
|
Satellites, net |
|
|
|
|
$ |
1,973.1 |
|
$ |
(795.4) |
|
$ |
1,177.7 |
|
$ |
1,323.6 |
|
$ |
(658.3) |
|
$ |
665.3 |
|
|
(1) |
Remaining depreciable life determined as of January 31, 2013, the acquisition date of GeoEye, was 0.5 years for IKONOS and 5 years for GeoEye-1. |
As of October 1, 2014, as a result of our annual review of our satellites’ remaining useful lives, the lives of WorldView-1 and WorldView-2 were each extended to 13.0 years from 10.5 and 11.0 years, respectively. This change in estimate resulted in a reduction in depreciation expense of approximately $4.6 million related to WorldView-1 and $2.6 million related to WorldView-2 for the year ended December 31, 2014.
On August 13, 2014, DigitalGlobe successfully launched WorldView-3, the world’s highest resolution and most capable commercial earth observation satellite. On October 1, 2014, the Company completed the needed calibrations on WorldView-3 to enable it to provide visible spectrum imagery to its customers and began depreciating the satellite based on an initial useful life of 11.5 years.
Depreciation expense for property and equipment was $227.7 million, $216.1 million and $114.6 million for the years ended December 31, 2014, 2013 and 2012, respectively.
Construction in progress is primarily comprised of the WorldView-4 satellite, ground station construction, infrastructure projects, internally developed software costs and capitalized interest.
NOTE 6.Goodwill and Intangibles
The following table summarizes the changes to goodwill during the year ended December 31, 2014:
|
(in millions) |
|
Amount |
|
|
|
Balance, December 31, 2012 |
|
$ |
8.7 |
|
|
Acquisitions |
|
|
450.6 |
|
|
Balance, December 31, 2013 |
|
|
459.3 |
|
|
Purchase accounting adjustment |
|
|
(0.7) |
|
|
Historical correction to purchase accounting |
|
|
0.2 |
|
|
Acquisition |
|
|
25.7 |
|
|
Balance, December 31, 2014 |
|
$ |
484.5 |
|
61
The following table summarizes intangible assets for the year ended December 31, 2014:
|
|
|
|
|
|
|
As of December 31, 2014 |
|
As of December 31, 2013 |
|
||||||||||||||
|
|
|
|
|
|
|
Gross |
|
|
|
|
Net |
|
Gross |
|
|
|
|
Net |
|
||||
|
|
|
Useful Life |
|
Carrying |
|
Accumulated |
|
Carrying |
|
Carrying |
|
Accumulated |
|
Carrying |
|
||||||||
|
(in millions) |
|
(in years) |
|
Amount |
|
Amortization |
|
Amount |
|
Amount |
|
Amortization |
|
Amount |
|
||||||||
|
Intangible assets: |
|
|
|
|
|
|
|
|
|
|
|
|
|
|
|
|
|
|
|
|
|
|
|
|
Technology |
|
3 |
- |
5 |
|
$ |
27.2 |
|
$ |
(10.6) |
|
$ |
16.6 |
|
$ |
26.9 |
|
$ |
(5.0) |
|
$ |
21.9 |
|
|
Customer relationships |
|
10 |
- |
12 |
|
|
27.0 |
|
|
(3.4) |
|
|
23.6 |
|
|
14.0 |
|
|
(1.1) |
|
|
12.9 |
|
|
Trademarks |
|
|
3 |
|
|
|
5.6 |
|
|
(3.4) |
|
|
2.2 |
|
|
5.0 |
|
|
(1.5) |
|
|
3.5 |
|
|
FCC licenses and other |
|
2 |
- |
20 |
|
|
2.7 |
|
|
(2.1) |
|
|
0.6 |
|
|
2.7 |
|
|
(1.1) |
|
|
1.6 |
|
|
Total |
|
|
|
|
|
$ |
62.5 |
|
$ |
(19.5) |
|
$ |
43.0 |
|
$ |
48.6 |
|
$ |
(8.7) |
|
$ |
39.9 |
|
Intangible asset amortization expense was $10.8 million, $8.7 million and $0 million for the years ended December 31, 2014, 2013 and 2012, respectively.
The estimated future annual amortization expense for acquired intangible assets is as follows:
|
(in millions) |
|
|
|
|
|
Fiscal Years Ending December 31, |
|
Amount |
|
|
|
2015 |
|
$ |
10.1 |
|
|
2016 |
|
|
8.2 |
|
|
2017 |
|
|
7.7 |
|
|
2018 |
|
|
2.9 |
|
|
2019 |
|
|
2.5 |
|
|
Thereafter |
|
|
11.6 |
|
|
Total amortization expense |
|
$ |
43.0 |
|
NOTE 7.Other Accrued Liabilities
|
|
|
As of December 31, |
|
||||
|
(in millions) |
|
2014 |
|
2013 |
|
||
|
Compensation and other employee benefits |
|
$ |
22.1 |
|
$ |
23.0 |
|
|
Construction in progress accruals |
|
|
2.8 |
|
|
19.0 |
|
|
Accrued interest |
|
|
16.6 |
|
|
13.2 |
|
|
Other accrued expense |
|
|
20.7 |
|
|
25.1 |
|
|
Total |
|
$ |
62.2 |
|
$ |
80.3 |
|
Compensation and other employee benefits primarily include payroll, incentive compensation and vacation. Construction in progress accruals relate primarily to the construction of our satellites and related ground stations. Other accruals are primarily comprised of commissions, consulting and professional fees, restructuring costs, accrued taxes and capital lease obligations.
62
NOTE 8.Debt
The following table provides a summary of the Company’s long-term debt:
|
(in millions) |
|
December 31, 2014 |
|
December 31, 2013 |
||
|
Term Loan due February 1, 2020 |
|
$ |
540.4 |
|
$ |
545.9 |
|
Senior Notes due February 1, 2021 |
|
|
600.0 |
|
|
600.0 |
|
Total borrowings |
|
|
1,140.4 |
|
|
1,145.9 |
|
Less: unamortized discounts |
|
|
(2.8) |
|
|
(3.3) |
|
Total borrowings, net |
|
|
1,137.6 |
|
|
1,142.6 |
|
Less: current maturities of long-term debt |
|
|
(5.5) |
|
|
(5.5) |
|
Total long-term debt, net |
|
$ |
1,132.1 |
|
$ |
1,137.1 |
In connection with the acquisition of GeoEye on January 31, 2013, the Company issued $600 million of Senior Notes (“Senior Notes”) and entered into a $550.0 million Senior Secured Term Loan Facility (“Term Loan”) and a $150.0 million Senior Secured Revolving Credit Facility (“Revolving Credit Facility” and, together with the Term Loan, the “2013 Credit Facility”). The net proceeds were used, along with cash on hand, to refinance the Company’s 2011 $500.0 million senior secured term loan and $100.0 million senior secured revolving credit facility, to fund the discharge and redemption of GeoEye’s $400.0 million 9.625% Senior Secured Notes due 2015 and $125.0 million 8.625% Senior Secured Notes due 2016 assumed in connection with the acquisition of GeoEye, to pay the cash consideration under the merger agreement with GeoEye, and to pay fees and expenses related to the foregoing transactions.
Senior Notes
The Senior Notes were issued at par and mature on February 1, 2021. Interest is payable on February 1 and August 1 of each year at a fixed annual interest rate of 5.25%. The Company may redeem the Senior Notes in whole at any time on or after February 1, 2017 or from time to time in part at specified redemption prices. The Senior Notes are senior unsecured obligations, ranking equally in right of payment with all of the Company’s existing and future unsecured and unsubordinated indebtedness and are senior to its existing and future subordinated indebtedness.
Term Loan
The Term Loan requires quarterly principal payments of $1.375 million, which began on June 30, 2013 and will continue through February 1, 2020. Borrowings under the Term Loan bear interest at an adjusted LIBOR rate, plus a 2.75% margin subject to a 1.0% LIBOR floor. The LIBOR margin becomes 2.5% when our ratio of total debt to Adjusted EBITDA is 2.5:1.0 or lower. The Company’s obligations under the 2013 Credit Facility are guaranteed by certain of its existing and future direct and indirect wholly-owned domestic subsidiaries. The Company’s obligations and the obligations of the guarantor subsidiaries under the 2013 Credit Facility are collateralized by substantially all of the Company’s assets and the assets of the guarantor subsidiaries.
Credit Facility
The interest rate on the Revolving Credit Facility is equivalent to the rate on the Term Loan. On a quarterly basis, the Company will also pay a commitment fee of between 37.5 to 50.0 basis points, based on the average daily unused amount of the Revolving Credit Facility based on the Company’s leverage ratio. For the years ended December 31, 2014 and 2013, the Company had not drawn any amounts under the Revolving Credit Facility.
Debt Covenants
The 2013 Credit Facility contains affirmative and negative covenants that we believe are usual and customary for a senior secured credit agreement. The negative covenants include, among other things, limitations on asset sales, mergers
63
and acquisitions, indebtedness, liens, dividends, investments and transactions with its affiliates. The 2013 Credit Facility also requires that the Company comply with a maximum leverage ratio and minimum interest coverage ratio. As of December 31, 2014, we were in compliance with our debt covenants.
The following table represents the Company’s future debt payments as of December 31, 2014:
|
|
|
Long-term debt |
|
|
|
|
|
(excluding interest |
|
|
|
(in millions) |
|
payments) |
|
|
|
2015 |
|
$ |
5.5 |
|
|
2016 |
|
|
5.5 |
|
|
2017 |
|
|
5.5 |
|
|
2018 |
|
|
5.5 |
|
|
2019 |
|
|
5.5 |
|
|
Thereafter |
|
|
1,112.9 |
|
|
Total |
|
$ |
1,140.4 |
|
Interest Expense, net
The following table summarizes the Company’s interest expense, net.
|
|
|
For the years ended December 31, |
|
|||||||
|
(in millions) |
|
2014 |
|
2013 |
|
2012 |
|
|||
|
Interest |
|
$ |
52.6 |
|
$ |
50.6 |
|
$ |
29.5 |
|
|
Accretion of debt discount, deferred financing amortization and line of credit fees |
|
|
7.2 |
|
|
6.9 |
|
|
4.3 |
|
|
Capitalized interest |
|
|
(52.5) |
|
|
(53.7) |
|
|
(24.4) |
|
|
Interest expense |
|
|
7.3 |
|
|
3.8 |
|
|
9.4 |
|
|
Interest income |
|
|
(0.2) |
|
|
(0.4) |
|
|
(0.3) |
|
|
Interest expense, net |
|
$ |
7.1 |
|
$ |
3.4 |
|
$ |
9.1 |
|
Restricted Cash and Letters of Credit
DigitalGlobe had $1.2 million of restricted cash under the lease agreement for its headquarters in Longmont, Colorado for each of the years ended December 31, 2014, 2013 and 2012. Additionally, the Company had $1.1 million of restricted cash under the lease agreement for its office location in Herndon, Virginia for each of the years ended December 31, 2014 and 2013. At December 31, 2014, 2013 and 2012, the Company had $4.0 million, $9.1 million and $10.9 million, respectively, in letters of credit and performance guarantees used in the ordinary course of business to support advanced payments from customers under certain DAP contracts.
64
NOTE 9.Fair Value of Financial Instruments
The following table provides information about the assets and liabilities measured at fair value on a recurring basis as of December 31, 2014 and 2013:
|
|
|
Quoted Prices |
|
Other |
|
Significant |
|
|||
|
|
|
In Active |
|
Observable |
|
Unobservable |
|
|||
|
|
|
Markets |
|
Inputs |
|
Inputs |
|
|||
|
(in millions) |
|
(Level 1) |
|
(Level 2) |
|
(Level 3) |
|
|||
|
Cash equivalents at December 31, 2014 |
|
$ |
78.3 |
|
$ |
— |
|
$ |
— |
|
|
Cash equivalents at December 31, 2013 |
|
|
79.1 |
|
|
— |
|
|
— |
|
|
Senior Notes at December 31, 2014 |
|
|
— |
|
|
567.0 |
|
|
— |
|
|
Senior Notes at December 31, 2013 |
|
|
— |
|
|
585.0 |
|
|
— |
|
|
Senior Secured Term Loan Facility at December 31, 2014 |
|
|
— |
|
|
535.0 |
|
|
— |
|
|
Senior Secured Term Loan Facility at December 31, 2013 |
|
|
— |
|
|
547.9 |
|
|
— |
|
NOTE 10.Stock-Based Compensation
The Company grants equity compensation awards from the 2007 Employee Stock Option Plan, as amended (“2007 Plan”). Under the 2007 Plan employees, officers, directors and consultants may be granted qualified and nonqualified stock options to purchase shares of the Company’s common stock, restricted stock, unrestricted shares, stock appreciation rights or shares of the stock itself. To date, issued equity awards have consisted of stock options, restricted stock and unrestricted shares. Under the 2007 Plan, the Company is authorized to issue an aggregate total of 8.8 million shares. The 2007 Plan expires in 2022.
In connection with the acquisition of GeoEye, the Company issued equity awards to replace the outstanding GeoEye options, restricted stock awards and restricted stock unit awards with similar equity instruments for the Company’s common stock.
The number of shares available for grant at December 31, 2014, 2013 and 2012 was 2.7 million, 3.3 million and 3.3 million, respectively.
The Company recognized total stock-based compensation during the years ended December 31, 2014, 2013 and 2012 of $18.9 million, $23.7 million and $10.0 million, respectively. Stock-based compensation capitalized to assets under construction for the years ended December 31, 2014, 2013 and 2012 was $0.8 million, $0.7 million and $0.8 million, respectively.
Stock Options
There were no options granted to employees during the year ended December 31, 2014. During the year ended December 31, 2013, other than the replacement options granted in connection with the acquisition of GeoEye, the Company did not grant stock options.
65
The fair value of the Company’s stock options granted to employees during 2012 was estimated using the following assumptions:
|
|
|
For the year ended December 31, |
|
|||
|
|
|
2012 |
|
|||
|
Expected dividend yield |
|
|
|
0.0 |
% |
|
|
Expected stock price volatility |
|
51.8 |
- |
53.0 |
% |
|
|
Risk-free interest rate |
|
0.7 |
- |
0.9 |
% |
|
|
Expected life of options (years) |
|
|
|
5.0 |
|
|
Expected Dividend Yield. The Company has not paid dividends on its common stock in the past nor does the Company expect to do so; as such, the dividend yield used was zero.
Expected Stock Price Volatility. The expected volatility was determined based on a weighted-average of several comparable companies within the Company’s industry and the Company’s own volatility covering a look back period of five years.
Risk-free Interest Rate. The risk-free rate was based on the five-year Treasury note rate.
Expected Life of Options. The expected term of options granted was determined based on the Company’s historical experience with similar awards.
A summary of stock option activity for the years ended December 31, 2014, 2013 and 2012 is presented below:
|
|
|
|
|
|
|
|
|
|
|
|
|
|
|
|
Options Outstanding |
|
||||||||
|
|
|
|
|
|
|
|
Weighted- |
|
|
|
|
|
|
|
|
|
|
|
|
Average |
|
|
|
|
|
|
|
|
|
|
|
|
Remaining |
|
Aggregate |
|
|
|
|
|
Number |
|
Weighted- |
|
Contractual |
|
Intrinsic |
|
||
|
|
|
of Options |
|
Average |
|
Term |
|
Value |
|
||
|
|
|
(in millions) |
|
Exercise Price |
|
(in years) |
|
(in millions)(1) |
|
||
|
Outstanding — December 31, 2011 |
|
3.5 |
|
$ |
23.49 |
|
7.11 |
|
$ |
0.3 |
|
|
Granted |
|
1.0 |
|
|
11.97 |
|
|
|
|
|
|
|
Exercised |
|
(0.3) |
|
|
14.29 |
|
|
|
|
|
|
|
Forfeited/Expired |
|
(0.5) |
|
|
22.24 |
|
|
|
|
|
|
|
Outstanding — December 31, 2012 |
|
3.7 |
|
|
21.06 |
|
7.09 |
|
|
16.9 |
|
|
Granted in GeoEye acquisition (Note 4) |
|
1.4 |
|
|
17.69 |
|
|
|
|
|
|
|
Exercised |
|
(2.2) |
|
|
19.56 |
|
|
|
|
|
|
|
Forfeited/Expired |
|
(0.3) |
|
|
23.21 |
|
|
|
|
|
|
|
Outstanding — December 31, 2013 |
|
2.6 |
|
|
20.23 |
|
6.15 |
|
|
54.4 |
|
|
Granted |
|
— |
|
|
— |
|
|
|
|
|
|
|
Exercised |
|
(0.6) |
|
|
19.70 |
|
|
|
|
|
|
|
Forfeited/Expired |
|
(0.1) |
|
|
17.61 |
|
|
|
|
|
|
|
Outstanding — December 31, 2014 |
|
1.9 |
|
|
20.52 |
|
5.45 |
|
$ |
20.3 |
|
|
|
|
|
|
|
|
|
|
|
|
|
|
|
Vested and Expected to Vest — December 31, 2014 |
|
1.9 |
|
|
20.52 |
|
5.45 |
|
$ |
20.3 |
|
|
Exercisable — December 31, 2014 |
|
1.5 |
|
|
22.22 |
|
4.98 |
|
$ |
13.1 |
|
|
(1) |
Represents the total pretax intrinsic value for stock options with an exercise price less than the Company’s calculated common stock price that option holders would have realized had they exercised their options as of that date. |
66
The weighted-average grant-date fair values for option awards granted was $12.38 and $5.38 for the years ended December 31, 2013 and 2012, respectively.
The intrinsic value of stock options exercised, calculated as the difference between the exercise price and the market price on date of grant, for years ended December 31, 2014, 2013 and 2012 was $6.6 million, $22.6 million, of which $14.2 million related to stock options assumed in the GeoEye acquisition, and $2.0 million, respectively. As of December 31, 2014, total unrecognized compensation expense, net of estimated forfeitures, related to unvested stock options was $1.6 million to be recognized over a weighted-average period of 1.0 year.
Restricted Stock Awards
A summary of restricted stock activity for the years ended December 31, 2014, 2013 and 2012 is presented below:
|
|
|
|
|
Weighted- |
|
|
|
|
|
Number |
|
Average Grant |
|
|
|
(in millions, except for weighted average grant date fair values) |
|
of Shares |
|
Date Fair Value |
|
|
|
Non-vested at December 31, 2011 |
|
0.4 |
|
$ |
27.55 |
|
|
Granted |
|
0.5 |
|
|
14.61 |
|
|
Forfeited |
|
(0.1) |
|
|
21.32 |
|
|
Vested |
|
(0.2) |
|
|
26.84 |
|
|
Non-vested at December 31, 2012 |
|
0.6 |
|
|
17.52 |
|
|
Granted in GeoEye acquisition (Note 4) |
|
0.5 |
|
|
27.97 |
|
|
Forfeited |
|
(0.1) |
|
|
23.65 |
|
|
Vested |
|
(0.5) |
|
|
24.80 |
|
|
Non-vested at December 31, 2013 |
|
0.5 |
|
|
18.25 |
|
|
Granted |
|
— |
|
|
— |
|
|
Forfeited |
|
(0.1) |
|
|
17.69 |
|
|
Vested |
|
(0.2) |
|
|
17.92 |
|
|
Non-vested at December 31, 2014 |
|
0.2 |
|
$ |
16.48 |
|
As of December 31, 2014, 2013 and 2012, total unrecognized compensation expense, net of estimated forfeitures, related to unvested restricted stock awards was $2.1 million to be recognized over a weighted-average period of 1.2 years. The total fair value of restricted stock awards vested for the years ended December 31, 2014, 2013 and 2012 was $5.6 million, $15.9 million and $3.8 million, respectively.
67
Restricted Stock Units
A summary of restricted stock unit activity for the years ended December 31, 2014, 2013 and 2012 is shown below:
|
|
|
|
|
Weighted- |
|
|
|
|
|
|
|
Average |
|
|
|
|
|
|
|
Grant |
|
|
|
|
|
Number |
|
Date Fair |
|
|
|
(in millions, except for weighted average grant date fair values) |
|
of Shares |
|
Value |
|
|
|
Non-vested at December 31, 2011 |
|
— |
|
$ |
— |
|
|
Granted |
|
0.1 |
|
|
15.82 |
|
|
Forfeited/Canceled |
|
— |
|
|
— |
|
|
Non-vested at December 31, 2012 |
|
0.1 |
|
|
15.82 |
|
|
Granted |
|
0.8 |
|
|
30.73 |
|
|
Granted in GeoEye acquisition (Note 4) |
|
0.3 |
|
|
27.97 |
|
|
Forfeited/Canceled |
|
— |
|
|
— |
|
|
Vested |
|
(0.4) |
|
|
28.11 |
|
|
Non-vested at December 31, 2013 |
|
0.8 |
|
|
31.12 |
|
|
Granted |
|
0.8 |
|
|
37.62 |
|
|
Forfeited/Canceled |
|
(0.1) |
|
|
37.10 |
|
|
Vested |
|
(0.2) |
|
|
29.22 |
|
|
Non-vested at December 31, 2014 |
|
1.3 |
|
$ |
34.67 |
|
As of December 31, 2014, total unrecognized compensation expense, net of estimated forfeitures, related to unvested restricted stock units, including units with a performance condition measured at target, was approximately $24.0 million to be recognized over a weighted-average period of 2.3 years. The total fair value of restricted stock units vested during the year ended December 31, 2014, 2013 and 2012 was $6.3 million, $10.6 million and $0 million, respectively.
Of the non-vested restricted stock units outstanding at December 31, 2014, 2013 and 2012, approximately 0.1 million, 0.2 million and 0.1 million shares, respectively, are performance share units where vesting is contingent upon meeting both a service requirement and either a Company financial performance condition or a Company stock market performance condition. The number of shares granted with the financial performance condition that ultimately will vest are based on a measurement of the Company’s average annual return on invested capital as determined over the three year vesting period of the awards. The number of shares granted with the Company stock market condition that ultimately will vest are based on a measurement of the change in the Company’s average stock price compared to the change in value in the Russell 2000 stock index as determined over the three year vesting period of the awards. The awards granted with a stock market performance condition were valued at the grant date at $54.10 per share using a Monte Carlo simulation. For both types of awards, the number of shares that ultimately vest could range from 50% to 200% of the target amount, or zero percent if the minimum threshold is not achieved.
During the years ended December 31, 2014, 2013 and 2012, certain participants elected to have the Company withhold shares to pay for minimum taxes due at the time their restricted stock vested. Under the DigitalGlobe equity compensation plans shares withheld to pay taxes is accounted for as treasury stock. Under the terms of the equity compensation plans assumed from GeoEye, shares tendered or withheld to pay the employees’ minimum tax liability are cancelled and made available for re-issuance, thus classified as a reduction in additional paid-in capital. The quantity and value of the shares withheld were immaterial.
68
NOTE 11.Stockholders’ Equity
Share Repurchase Program
On July 23, 2014, the Company’s Board of Directors authorized a program to repurchase up to $75.0 million of the Company’s outstanding common stock through December 31, 2015. On December 18, 2014, the Board of Directors increased the total amount authorized under the stock repurchase program by $130.0 million through the end of 2015, raising the total authorization to $205.0 million. As of December 31, 2014, we have repurchased 2,726,749 shares, or $75.1 million, at an average purchase price of $27.53.
The Company may repurchase shares through open market purchases, privately negotiated transactions, structured or derivative transactions such as puts, calls, options, forwards, collars, accelerated share repurchase transactions (with or without collars), other equity contracts or other methods of acquiring shares and pursuant to Rule 10b5-1, in each case on such terms and at such times as shall be permitted by applicable securities laws and determined by management. The stock repurchase program does not obligate the Company to acquire any stock, and it may be limited or terminated at any time without notice.
Series A Convertible Preferred Stock
In January 2013, upon the closing of the acquisition of GeoEye, the Company issued 80,000 shares of Series A Convertible Preferred Stock (“Series A Preferred Stock”) with a par value of $0.001 per share to Cerberus Satellite, LLC. In March 2014, Cerberus Satellite, LLC transferred the 80,000 shares of Series A Preferred Stock to Citigroup Global Markets, Inc.
Cumulative dividends on the Series A Preferred Stock are payable at a rate of five percent per annum on the $1,000 liquidation preference per share. At the Company’s option, dividends may be declared and paid in cash out of funds legally available when declared by the Board of Directors or the Audit Committee of the Company. If not paid in cash, an amount equal to the cash dividends due is added to the liquidation preference. The Company declared dividends on the Series A Preferred Stock of $4.0 million during the year ended December 31, 2014 and $4.0 million, of which $0.4 million was recorded by GeoEye as a pre-acquisition obligation, during the year ended December 31, 2013.
The Series A Preferred Stock is convertible at the option of the holders, at a conversion price of $26.17 per common share, which would convert to 3.1 million shares of common stock of the Company. If at any time after September 22, 2016 the weighted average price of the Company’s common stock exceeds $45.80 per share, in effect for 30 consecutive trading days, the Company has the option to redeem all of the Series A Preferred Stock at an amount equal to the liquidation preference plus accrued dividends as of the redemption date.
Non-Controlling Interest
In connection with the acquisition of Spatial Energy completed in February 2014, the Company obtained a majority interest in a subsidiary, and control of the subsidiary’s board of directors. A third party investor owns approximately 25% of the outstanding shares of the subsidiary. Accordingly, the Consolidated Financial Statements include the financial position of this subsidiary as of December 31, 2014 and the results of operations of this subsidiary since the date of acquisition. The Company has recognized the carrying value of the non-controlling interest as a component of stockholders’ equity. The operating results of the subsidiary attributable to the non-controlling interest are immaterial for all of the periods presented and are included in Other income, net.
Comprehensive Income
For each of the years ended December 31, 2014, 2013 and 2012, there were no material differences between net income (loss) and comprehensive income (loss).
69
NOTE 12.Earnings Per Share
Basic earnings (loss) per share (“EPS”) is computed by dividing the net income (loss) available to common stockholders by the weighted average number of common shares outstanding for the period excluding issued, but unvested, restricted shares. Diluted EPS is computed by giving effect to all dilutive potential common stock outstanding during the period, including stock options and restricted stock awards. The Company includes as potential common shares the weighted average dilutive effects of outstanding stock options and restricted shares using the treasury stock method. Securities that contain non-forfeitable rights to dividend equivalents, whether paid or unpaid, are participating securities and are required to be included in the computation of basic EPS and dilutive EPS pursuant to the two-class method. Net losses are not allocated to the Company’s participating securities. The shares of the Company’s Series A Preferred Stock are participating securities.
The following table sets forth the number of weighted-average shares used to compute basic and diluted EPS:
|
|
|
For the year ended December 31, |
|
|||||||
|
(in millions, except per share amounts) |
|
2014 |
|
2013 |
|
2012 |
|
|||
|
Earnings (loss) per share: |
|
|
|
|
|
|
|
|
|
|
|
Net income (loss) |
|
$ |
18.5 |
|
$ |
(68.3) |
|
$ |
39.0 |
|
|
Preferred stock dividends |
|
|
(4.0) |
|
|
(3.6) |
|
|
— |
|
|
Net income (loss) less preferred stock dividends |
|
|
14.5 |
|
|
(71.9) |
|
|
39.0 |
|
|
Income allocated to participating securities |
|
|
(0.6) |
|
|
— |
|
|
— |
|
|
Net income (loss) available to common stockholders |
|
$ |
13.9 |
|
$ |
(71.9) |
|
$ |
39.0 |
|
|
Basic weighted-average number of common shares outstanding |
|
|
74.9 |
|
|
71.8 |
|
|
46.1 |
|
|
Weighted-average common share equivalents from stock options, restricted stock and convertible preferred stock |
|
|
1.0 |
|
|
— |
|
|
0.3 |
|
|
Diluted weighted-average number of common shares outstanding |
|
|
75.9 |
|
|
71.8 |
|
|
46.4 |
|
|
Earnings (loss) per share: |
|
|
|
|
|
|
|
|
|
|
|
Basic |
|
$ |
0.19 |
|
$ |
(1.00) |
|
$ |
0.85 |
|
|
Diluted |
|
$ |
0.18 |
|
$ |
(1.00) |
|
$ |
0.84 |
|
The potential common shares from the conversion of Series A Preferred Stock that were excluded from the computation of diluted EPS, due to their anti-dilutive impact on weighted common share equivalents, were 3.1 million, 3.1 million and 0 million for the years ended December 31, 2014, 2013 and 2012, respectively. The number of options and non-vested restricted stock awards that were assumed to be repurchased under the treasury stock method were 2.9 million, 4.4 million and 3.9 million for the years ended December 31, 2014, 2013 and 2012, respectively.
70
NOTE 13.Income Taxes
The (expense) benefit for income taxes reflected in the statements of operations consisted of:
|
|
|
For the year ended December 31, |
|
||||||||||
|
(in millions) |
|
2014 |
|
2013 |
|
2012 |
|
||||||
|
Current: |
|
|
|
|
|
|
|
|
|
|
|
|
|
|
Federal |
|
$ |
— |
|
|
$ |
— |
|
|
$ |
— |
|
|
|
State |
|
|
0.1 |
|
|
|
8.2 |
|
|
|
(8.7) |
|
|
|
Foreign |
|
|
(0.3) |
|
|
|
(2.1) |
|
|
|
(0.9) |
|
|
|
Total current |
|
|
(0.2) |
|
|
|
6.1 |
|
|
|
(9.6) |
|
|
|
Deferred: |
|
|
|
|
|
|
|
|
|
|
|
|
|
|
Federal |
|
|
(6.3) |
|
|
|
30.0 |
|
|
|
(20.8) |
|
|
|
State |
|
|
(0.4) |
|
|
|
1.4 |
|
|
|
3.5 |
|
|
|
Total deferred |
|
|
(6.7) |
|
|
|
31.4 |
|
|
|
(17.3) |
|
|
|
Income tax (expense) benefit |
|
$ |
(6.9) |
|
|
$ |
37.5 |
|
|
$ |
(26.9) |
|
|
The Company’s effective tax rate was 27.3%, 35.4% and 40.8% for the years ended December 31, 2014, 2013 and 2012, respectively. The (expense) benefit for income taxes differs from the amount computed by applying the U.S. federal income tax rate of 35% to income or loss before income taxes as follows:
|
|
|
For the year ended December 31, |
|
|||||||
|
(in millions) |
|
2014 |
|
2013 |
|
2012 |
|
|||
|
Federal income tax (expense) benefit |
|
$ |
(8.9) |
|
$ |
37.0 |
|
$ |
(23.0) |
|
|
Non-deductible stock-based compensation |
|
|
(0.2) |
|
|
(1.1) |
|
|
(1.3) |
|
|
State income tax (expense) benefit, net of federal impact |
|
|
(0.3) |
|
|
1.9 |
|
|
(1.8) |
|
|
State tax benefit due to tax ruling |
|
|
— |
|
|
5.3 |
|
|
— |
|
|
Stock-based compensation shortfalls |
|
|
— |
|
|
(2.1) |
|
|
(0.8) |
|
|
Change in reserves |
|
|
2.4 |
|
|
— |
|
|
— |
|
|
Research and experimentation tax credit |
|
|
1.4 |
|
|
1.4 |
|
|
0.6 |
|
|
Non-deductible acquisition costs |
|
|
— |
|
|
(5.9) |
|
|
— |
|
|
Other |
|
|
(1.3) |
|
|
1.0 |
|
|
(0.6) |
|
|
Income tax (expense) benefit |
|
$ |
(6.9) |
|
$ |
37.5 |
|
$ |
(26.9) |
|
71
The Company’s deferred tax assets and liabilities consisted of the following:
|
|
|
As of December 31, |
|
||||
|
(in millions) |
|
2014 |
|
2013 |
|
||
|
Current deferred tax assets (liabilities), net: |
|
|
|
|
|
|
|
|
Compensation accruals |
|
$ |
6.6 |
|
$ |
6.9 |
|
|
Net operating loss carryforwards |
|
|
17.5 |
|
|
— |
|
|
Other |
|
|
— |
|
|
(1.0) |
|
|
Total current deferred tax asset |
|
|
24.1 |
|
|
5.9 |
|
|
Long-term deferred tax assets (liabilities), net |
|
|
|
|
|
|
|
|
Net operating loss carryforwards |
|
|
88.9 |
|
|
136.1 |
|
|
Research and development tax credits |
|
|
29.9 |
|
|
26.2 |
|
|
Deferred revenue |
|
|
138.2 |
|
|
131.9 |
|
|
Fixed and intangible assets |
|
|
(369.5) |
|
|
(381.9) |
|
|
Other |
|
|
12.4 |
|
|
10.3 |
|
|
Valuation allowance |
|
|
(1.8) |
|
|
(2.6) |
|
|
Total long-term deferred tax (liabilities), net |
|
|
(101.9) |
|
|
(80.0) |
|
|
Net deferred tax liability |
|
$ |
(77.8) |
|
$ |
(74.1) |
|
At December 31, 2014, the Company had net operating loss (“NOL”) carryforwards for federal and state income tax purposes of approximately $275.8 million and $463.7 million, respectively. Included in this NOL is approximately $11.4 million attributable to tax deductions related to equity compensation in excess of compensation recognized for financial reporting. If unused, the NOL carryforwards will begin to expire during the years 2018 to 2033. A portion of our net NOL carryforwards are subject to the Internal Revenue Code Section 382 limitations; however, we expect to fully utilize all our NOL carryforwards in future periods.
At December 31, 2014, the Company had approximately $6.1 million of foreign tax credit (“FTC”) carryforwards, and federal and state research and development (“R&D”) tax credits of approximately $37.7 million and $1.5 million, respectively. If not used, the FTC carryforwards will expire between 2019 and 2024, and the R&D credit carryforwards will expire between 2019 and 2034. We believe that it is more likely than not that we will fully realize our FTC and federal R&D tax credit assets. A valuation allowance has been placed on the state R&D credit asset as we believe it is not more likely than not that these credits will be realized.
The valuation allowance on deferred tax assets decreased $0.8 million in 2014 primarily due to the release of a portion of the allowance upon the disposition of a minority investment and the use of certain state tax credits during the year.
The tax years 1998 through 2013 remain open to examination by the United States taxing jurisdictions to which we are subject. The Company recognizes accrued interest and penalties related to unrecognized tax benefits as a component of tax expense. The Company did not have any accrued interest or penalties recorded at December 31, 2014. The Company does not anticipate a material change to the unrecognized tax benefits within the next 12 months. If any of the unrecognized tax benfits were recognized it would affect the effective tax rate.
72
A reconciliation of the Company’s unrecognized tax benefits is as follows:
|
(in millions) |
|
2014 |
|
2013 |
|
2012 |
|
|||
|
Balance as of January 1 |
|
$ |
11.5 |
|
$ |
5.7 |
|
$ |
5.4 |
|
|
Additions: |
|
|
|
|
|
|
|
|
|
|
|
Current year tax positions |
|
|
0.3 |
|
|
0.6 |
|
|
0.3 |
|
|
Prior year tax positions |
|
|
0.2 |
|
|
— |
|
|
— |
|
|
Additions due to acquisitions |
|
|
— |
|
|
5.2 |
|
|
— |
|
|
Decreases: |
|
|
|
|
|
|
|
|
|
|
|
Settlement with taxing authority |
|
|
(2.4) |
|
|
— |
|
|
— |
|
|
Balance as of December 31 |
|
$ |
9.6 |
|
$ |
11.5 |
|
$ |
5.7 |
|
While management believes the Company has adequately provided for all tax positions, amounts asserted by taxing authorities could materially differ from its accrued positions as a result of uncertain and complex application of tax regulations. Additionally, the recognition and measurement of certain tax benefits includes estimates and judgment by management and inherently includes subjectivity. Accordingly, additional provisions on tax-related matters could be recorded in the future as revised estimates are made or the underlying matters are settled or otherwise resolved.
In connection with the preparation of the Company’s Unaudited Condensed Consolidated Financial Statements for the quarter ended March 31, 2014, the Company determined that it had incorrectly classified a $37.2 million deferred tax asset as a current asset that should have been classified as a noncurrent asset at December 31, 2013. The Company concluded that the impact of the error was not material to the previously issued financial statements. However, the Company has elected to revise its previously issued December 31, 2013 Consolidated Balance Sheet to facilitate comparison among periods. The deferred tax current asset and long-term deferred tax liability, net balances were $43.1 million and $117.2 million as originally reported, respectively, and were revised to $5.9 million and $80.0 million, respectively, as of December 31, 2013.
NOTE 14.Restructuring Charges
During the first quarter of 2013, following the acquisition of GeoEye, the Company initiated a series of restructuring activities intended to align its infrastructure with customer demand so as to optimize operational efficiency. The Company believes the restructuring enhanced its ability to provide cost-effective customer service offerings, which it anticipates will continue to enable it to retain and expand its existing relationships with customers and attract new business. These restructuring activities primarily consisted of reducing redundant workforce, consolidating office and production facilities, consolidating certain ground terminals and systems and other exit costs.
The restructuring costs totaled $1.1 million and $40.1 million for the years ended December 31, 2014 and December 31, 2013, respectively.
The components of the restructuring liability, which are included in other current liabilities, were as follows:
|
(in millions) |
|
Severance |
|
Facilities |
|
Other costs |
|
Total |
|
||||
|
Balance, December 31, 2012 |
|
$ |
— |
|
$ |
— |
|
$ |
— |
|
$ |
— |
|
|
Provision for restructuring charges |
|
|
26.0 |
|
|
0.5 |
|
|
4.1 |
|
|
30.6 |
|
|
Cash payments |
|
|
(23.7) |
|
|
(0.5) |
|
|
(4.0) |
|
|
(28.2) |
|
|
Balance, December 31, 2013 |
|
|
2.3 |
|
|
— |
|
|
0.1 |
|
|
2.4 |
|
|
Provision for restructuring charges |
|
|
0.3 |
|
|
0.7 |
|
|
0.1 |
|
|
1.1 |
|
|
Cash payments |
|
|
(2.6) |
|
|
(0.7) |
|
|
(0.2) |
|
|
(3.5) |
|
|
Balance, December 31, 2014 |
|
$ |
— |
|
$ |
— |
|
$ |
— |
|
$ |
— |
|
73
NOTE 15.Benefit Plan
The Company maintains a 401(k) Savings and Retirement Plan (the “401(k) Plan”), a tax-qualified plan covering substantially all of the Company’s employees. Employees may elect to contribute, subject to certain limitations, up to 60% of their annual compensation to the 401(k) Plan. The 401(k) Plan provides that the Company may contribute matching contributions to the 401(k) Plan at the discretion of the Company’s management as approved by the Board of Directors. The Company recorded approximately $4.6 million, $3.7 million and $2.2 million of matching contribution expense for the years ended December 31, 2014, 2013 and 2012, respectively.
NOTE 16.Related Party Transactions
In June 2012, the Company made an investment of approximately $0.3 million for a less than 20% ownership interest in a joint venture in China. During the years ended December 31, 2014, 2013 and 2012, the joint venture purchased $9.2 million, $11.3 million and $14.7 million in products and services from DigitalGlobe, respectively. Amounts owed to the Company by the joint venture at December 31, 2014 and 2013 were $4.6 million and $6.7 million, respectively.
NOTE 17.Commitments and Contingencies
The Company enters into agreements in the ordinary course of business with resellers and others. Most of these agreements require the Company to indemnify the other party against third-party claims alleging that one of its products infringes or misappropriates a patent, copyright, trademark, trade secret or other intellectual property right. Certain of these agreements require the Company to indemnify the other party against claims relating to property damage, personal injury or acts or omissions by the Company, its employees, agents or representatives. In addition, from time to time the Company has made guarantees regarding the performance of its systems to its customers. The majority of these agreements do not limit the maximum potential future payments the Company could be obligated to make. The Company evaluates and estimates potential losses from such indemnification based on the likelihood that the future event will occur. To date, the Company has not incurred any material costs as a result of such obligations and has not accrued any material liabilities related to such indemnification and guarantees in the Company’s financial statements.
The Company is subject to legal proceedings, claims and litigation arising in the ordinary course of business. The Company defends itself vigorously against any such claims. Although the outcome of these matters is currently not determinable, management does not expect that the ultimate costs to resolve these matters will have a material adverse effect on its consolidated financial position, results of operations or cash flows.
The Company is obligated under certain non-cancelable operating leases for office space and equipment. As of December 31, 2014, the Company leased approximately 945,000 square feet of office and operations space. This space includes the Company’s principal production facilities, administrative and executive offices in Longmont, Colorado, Thornton, Colorado and Herndon, Virginia, as well as the Company’s future headquarters building in Westminster, Colorado. The Company also leases satellite terminals, a data center and has smaller administrative offices and sales offices located in the United States and internationally.
Rent expense, net of sublease income, was $7.1 million, $7.5 million and $3.4 million for the years ended December 31, 2014, 2013 and 2012, respectively.
74
Future minimum lease payments under all non-cancelable capital and operating leases, net of aggregate future minimum non-cancelable sublease rentals are summarized below:
|
(in millions) |
|
Capital |
|
Operating |
|
Other |
|
|||
|
For the year ending December 31, |
|
Leases |
|
Leases |
|
Commitments |
|
|||
|
2015 |
|
$ |
1.0 |
|
$ |
8.5 |
|
$ |
62.0 |
|
|
2016 |
|
|
0.9 |
|
|
10.6 |
|
|
85.0 |
|
|
2017 |
|
|
0.9 |
|
|
11.7 |
|
|
— |
|
|
2018 |
|
|
0.4 |
|
|
11.8 |
|
|
— |
|
|
2019 |
|
|
0.2 |
|
|
11.8 |
|
|
— |
|
|
2020 and thereafter |
|
|
— |
|
|
94.9 |
|
|
— |
|
|
Subtotal |
|
|
3.4 |
|
|
149.3 |
|
|
147.0 |
|
|
Sublease rentals |
|
|
— |
|
|
(0.2) |
|
|
— |
|
|
Total |
|
$ |
3.4 |
|
$ |
149.1 |
|
$ |
147.0 |
|
In addition to operating lease commitments, other contractual commitments related to the manufacture and delivery of key components for the Company’s EnhancedView program are included in the table above.
NOTE 18.Significant Customers and Geographic Information
The Company operates in a single segment, in which it provides imagery and imagery information products and services to customers around the world. The Company uses common infrastructure and technology to collect, process and distribute its imagery products and services to all customers. The Company measures performance based on consolidated operating results and achievement of individual performance goals.
DigitalGlobe has organized its sales leadership and marketing efforts around two customer groups (i) U.S. Government and (ii) Diversified Commercial. Revenue recognized for products or services provided to U.S. Government customers consist primarily of the EnhancedView SLA, amortization of pre-FOC payments related to the NextView agreement and other value added services. Diversified Commercial revenue arises from sales to customers in the Company’s Direct Access Program, international defense and intelligence markets, civil governments, providers of location-based services and other industry vertical markets. The following table summarizes revenue for these two groups:
|
(in millions) |
|
For the year ended December 31, |
|
|||||||
|
Revenue |
|
2014 |
|
2013 |
|
2012 |
|
|||
|
U.S. Government |
|
$ |
395.3 |
|
$ |
358.1 |
|
$ |
259.6 |
|
|
Diversified Commercial |
|
|
259.3 |
|
|
254.6 |
|
|
161.8 |
|
|
Total |
|
$ |
654.6 |
|
$ |
612.7 |
|
$ |
421.4 |
|
We classify revenue geographically according to the ship to address. Total U.S. and international sales were as follows:
|
(in millions) |
|
For the year ended December 31, |
|
|||||||
|
Revenue |
|
2014 |
|
2013 |
|
2012 |
|
|||
|
U.S. |
|
$ |
456.8 |
|
$ |
423.8 |
|
$ |
295.8 |
|
|
International |
|
|
197.8 |
|
|
188.9 |
|
|
125.6 |
|
|
Total |
|
$ |
654.6 |
|
$ |
612.7 |
|
$ |
421.4 |
|
75
Revenue percentages from all customers whose net revenue exceeded 10% of the total Company net revenue were as follows:
|
|
|
For the year ended December 31, |
|
||||
|
Customer |
|
2014 |
|
2013 |
|
2012 |
|
|
U.S. Government |
|
60.4 |
% |
58.4 |
% |
61.6 |
% |
Percentages of accounts receivable, net of allowance for doubtful accounts for all customers whose receivable exceeded 10% of the net accounts receivable were as follows:
|
|
|
As of December 31, |
|
||||
|
Customer |
|
2014 |
|
2013 |
|
2012 |
|
|
U.S. Government (1) |
|
49.5 |
% |
43.3 |
% |
31.7 |
% |
|
(1) |
U.S. Government accounts receivable does not include amounts due from third-party U.S. Government contractors. |
NOTE 19.Allowance for Doubtful Accounts
A rollforward of the Company’s allowance for doubtful accounts is as follows:
|
|
|
|
|
|
|
|
|
|
|
|
|
|
|
|
|
|
|
|
|
Additions |
|
|
|
|
|
|
|
|
|
|
|
Balance at |
|
(Reductions) |
|
Write-offs |
|
Balance at |
|
||||
|
|
|
Beginning |
|
Charged to |
|
and |
|
End of |
|
||||
|
(in millions) |
|
of Period |
|
Operations |
|
Adjustments |
|
Period |
|
||||
|
December 31, 2014 |
|
$ |
2.4 |
|
$ |
0.5 |
|
$ |
(2.4) |
|
$ |
0.5 |
|
|
December 31, 2013 |
|
$ |
2.9 |
|
$ |
0.3 |
|
$ |
(0.8) |
|
$ |
2.4 |
|
|
December 31, 2012 |
|
$ |
3.6 |
|
$ |
2.7 |
|
$ |
(3.4) |
|
$ |
2.9 |
|
NOTE 20.Quarterly Results from Operations (Unaudited)
The following table relates to the Company’s results of operations for each quarter of the years ended December 31, 2014 and 2013. Net (loss) income available to common stockholders and net (loss) earnings per share are computed independently for each quarter presented. Therefore, the sum of the quarterly net (loss) income available to common
76
shareholders and the quarterly earnings (loss) per share may not equal the total net (loss) income available to common shareholders or the total (loss) earnings per share amounts for the year, respectively.
|
|
|
2014 |
|
||||||||||
|
|
|
For the Quarters Ended |
|
||||||||||
|
(in millions, except per share amounts) |
|
March 31, |
|
June 30, |
|
September 30, |
|
December 31, |
|
||||
|
Revenue |
|
$ |
156.5 |
|
$ |
157.8 |
|
$ |
154.6 |
|
$ |
185.7 |
|
|
Cost of revenue, excluding depreciation and amortization |
|
|
39.5 |
|
|
41.1 |
|
|
40.9 |
|
|
38.9 |
|
|
Selling, general and administrative |
|
|
53.0 |
|
|
58.4 |
|
|
55.8 |
|
|
54.3 |
|
|
Depreciation and amortization |
|
|
57.6 |
|
|
57.6 |
|
|
57.7 |
|
|
65.6 |
|
|
Restructuring charges |
|
|
1.1 |
|
|
— |
|
|
— |
|
|
— |
|
|
Loss on abandonment of asset |
|
|
1.2 |
|
|
— |
|
|
— |
|
|
— |
|
|
Income (loss) from operations |
|
|
4.1 |
|
|
0.7 |
|
|
0.2 |
|
|
26.9 |
|
|
Other income, net |
|
|
0.1 |
|
|
— |
|
|
0.1 |
|
|
0.4 |
|
|
Interest expense, net |
|
|
— |
|
|
— |
|
|
— |
|
|
(7.1) |
|
|
Income (loss) before income taxes |
|
|
4.2 |
|
|
0.7 |
|
|
0.3 |
|
|
20.2 |
|
|
Income tax (expense) benefit |
|
|
(3.8) |
|
|
4.3 |
|
|
0.6 |
|
|
(8.0) |
|
|
Net income (loss) |
|
|
0.4 |
|
|
5.0 |
|
|
0.9 |
|
|
12.2 |
|
|
Preferred stock dividends |
|
|
(1.0) |
|
|
(1.0) |
|
|
(1.0) |
|
|
(1.0) |
|
|
Net (loss) income less preferred stock dividends |
|
|
(0.6) |
|
|
4.0 |
|
|
(0.1) |
|
|
11.2 |
|
|
Income allocated to participating securities |
|
|
— |
|
|
(0.1) |
|
|
— |
|
|
(0.5) |
|
|
Net (loss) income available to common stockholders |
|
$ |
(0.6) |
|
$ |
3.9 |
|
$ |
(0.1) |
|
$ |
10.7 |
|
|
Basic (loss) earnings per share |
|
$ |
(0.01) |
|
$ |
0.05 |
|
$ |
0.00 |
|
$ |
0.14 |
|
|
Diluted (loss) earnings per share |
|
$ |
(0.01) |
|
$ |
0.05 |
|
$ |
0.00 |
|
$ |
0.14 |
|
|
|
|
2013 |
|
||||||||||
|
|
|
For the quarters ended |
|
||||||||||
|
(in millions, except per share amounts) |
|
March 31, |
|
June 30, |
|
September 30, |
|
December 31, |
|
||||
|
Revenue |
|
$ |
127.6 |
|
$ |
150.6 |
|
$ |
164.8 |
|
$ |
169.7 |
|
|
Cost of revenue, excluding depreciation and amortization |
|
|
40.9 |
|
|
47.3 |
|
|
46.7 |
|
|
40.4 |
|
|
Selling, general and administrative |
|
|
79.8 |
|
|
64.5 |
|
|
60.6 |
|
|
52.4 |
|
|
Depreciation and amortization |
|
|
47.3 |
|
|
59.0 |
|
|
59.4 |
|
|
59.1 |
|
|
Restructuring charges |
|
|
20.3 |
|
|
13.6 |
|
|
3.1 |
|
|
3.1 |
|
|
(Loss) income from operations |
|
|
(60.7) |
|
|
(33.8) |
|
|
(5.0) |
|
|
14.7 |
|
|
Loss from early extinguishment of debt |
|
|
(17.8) |
|
|
— |
|
|
— |
|
|
— |
|
|
Other income (expense), net |
|
|
0.3 |
|
|
0.1 |
|
|
0.1 |
|
|
(0.3) |
|
|
Interest (expense) income, net |
|
|
(1.4) |
|
|
(1.4) |
|
|
(0.7) |
|
|
0.1 |
|
|
(Loss) income before income taxes |
|
|
(79.6) |
|
|
(35.1) |
|
|
(5.6) |
|
|
14.5 |
|
|
Income tax benefit |
|
|
19.0 |
|
|
14.1 |
|
|
3.8 |
|
|
0.6 |
|
|
Net (loss) income |
|
|
(60.6) |
|
|
(21.0) |
|
|
(1.8) |
|
|
15.1 |
|
|
Preferred stock dividends |
|
|
(0.6) |
|
|
(1.0) |
|
|
(1.0) |
|
|
(1.0) |
|
|
Net (loss) income less preferred stock dividends |
|
|
(61.2) |
|
|
(22.0) |
|
|
(2.8) |
|
|
14.1 |
|
|
Income allocated to participating securities |
|
|
— |
|
|
— |
|
|
— |
|
|
(0.5) |
|
|
Net (loss) income available to common stockholders |
|
$ |
(61.2) |
|
$ |
(22.0) |
|
$ |
(2.8) |
|
$ |
13.6 |
|
|
Basic (loss) earnings per share |
|
$ |
(0.96) |
|
$ |
(0.30) |
|
$ |
(0.04) |
|
$ |
0.18 |
|
|
Diluted (loss) earnings per share |
|
$ |
(0.96) |
|
$ |
(0.30) |
|
$ |
(0.04) |
|
$ |
0.18 |
|
77
NOTE 21.Subsequent Event
We evaluate subsequent events that have occurred after the balance sheet date but before the financial statements are issued. There are two types of subsequent events: (1) recognized, or those that provide additional evidence about conditions that existed at the date of the balance sheet, including the estimates inherent in the process of preparing financial statements, and (2) non-recognized, or those that provide evidence about conditions that did not exist at the date of the balance sheet but arose after that date. We identified the following as a non-recognized subsequent event:
In February 2015, the Company initiated a restructuring plan. Under the restructuring plan, the Company expects to reduce global headcount, rationalize its real estate footprint, and undertake other efficiency initiatives. The Company may spend up to approximately $15.0 million as a result of these efforts.
78
ITEM 9.CHANGES IN AND DISAGREEMENTS WITH ACCOUNTANTS ON ACCOUNTING AND FINANCIAL DISCLOSURE
None.
ITEM 9A.CONTROLS AND PROCEDURES
Evaluation of Disclosure Controls and Procedures
Under the supervision of and with the participation of management, including our Chief Executive Officer and Chief Financial Officer, we conducted an evaluation of the effectiveness of the design and operation of our disclosure controls and procedures, as defined in Rules 13a-15(e) and 15d-15(e) of the Securities and Exchange Act of 1934, as amended (the “Exchange Act”), as of December 31, 2014. Based on this evaluation, our Chief Executive Officer and Chief Financial Officer have concluded that our disclosure controls and procedures were effective as of December 31, 2014 to ensure that information required to be disclosed by us in the reports we file or submit under the Exchange Act was recorded, processed, summarized and reported, within the time periods specified in the SEC’s rules and forms, and such information was accumulated and communicated to management, including our Chief Executive Officer and Chief Financial Officer, to allow timely decisions regarding required disclosure.
Management’s Report on Internal Control over Financial Reporting
Our management is responsible for establishing and maintaining adequate internal control over financial reporting, as defined in Exchange Act Rule 13a-15(f) and 15d-15(f). Internal control over financial reporting is a process designed under the supervision of our Chief Executive Officer and Chief Financial Officer, and effected by our Board of Directors, management and other personnel to provide reasonable assurance regarding the reliability of financial reporting and the preparation of DigitalGlobe’s Consolidated Financial Statements for external purposes in accordance with generally accepted accounting principles.
We conducted an evaluation of the effectiveness of our internal control over financial reporting based on the framework in “Internal Control — Integrated Framework” (the “2013 Framework”) issued by the Committee of Sponsoring Organizations of the Treadway Commission (“COSO”). Based on this evaluation, our management concluded that our internal control over financial reporting was effective as of December 31, 2014.
The effectiveness of our internal control over financial reporting as of December 31, 2014 has been audited by PricewaterhouseCoopers LLP, an independent registered public accounting firm, as stated in their report which appears in this Annual Report on Form 10-K.
Changes in Internal Control over Financial Reporting
There have been no changes in internal control over financial reporting during the quarter ended December 31, 2014 that have materially affected, or are reasonably likely to materially affect, our internal control over financial reporting.
Limitations on the Effectiveness of Controls
Internal control over financial reporting has inherent limitations; it is a process that involves human diligence and compliance and is subject to lapses in judgment and breakdowns resulting from human failures. Internal control over financial reporting also can be circumvented by collusion or improper management override. Because of such limitations, internal control over financial reporting cannot prevent or detect all misstatements, whether unintentional errors or fraud. However, these inherent limitations are known features of the financial reporting process. Therefore, it is possible to design into the process safeguards to reduce, though not eliminate, this risk.
None.
79
ITEM 10.DIRECTORS, EXECUTIVE OFFICERS AND CORPORATE GOVERNANCE
Information regarding our directors, including the audit committee and audit committee financial experts and executive officers and compliance with Section 16(a) of the Exchange Act will be included in our definitive proxy statement for the 2015 Annual Meeting of Stockholders (the “Proxy Statement”) and is incorporated herein by reference.
We have adopted a Code of Ethics and Business Conduct that governs our senior officers, including our Chief Executive Officer and Chief Financial Officer, and employees. Copies of our Code of Ethics and Business Conduct are available on our website at www.digitalglobe.com. We will post to our website any amendments to the Code of Ethics and Business Conduct and any waivers that are required to be disclosed by the rules of either the SEC or the NYSE. The information on our website is not incorporated by reference and is not a part of this report.
Copies of our Corporate Governance Guidelines and the charters of our Audit Committee, Compensation Committee and Governance and Nominating Committee are available on our website.
ITEM 11.EXECUTIVE COMPENSATION
The information required by this item will be included in the Proxy Statement and is incorporated herein by reference.
ITEM 12.SECURITY OWNERSHIP OF CERTAIN BENEFICIAL OWNERS AND MANAGEMENT AND RELATED STOCKHOLDER MATTERS
The information required by this item, including information relating to security ownership of certain beneficial owners of our common stock and of our management, will be included in the Proxy Statement and is incorporated herein by reference.
ITEM 13.CERTAIN RELATIONSHIPS AND RELATED TRANSACTIONS, AND DIRECTOR INDEPENDENCE
The information required by this item, including information under the caption “Certain Relationships and Related Transactions” in the Proxy Statement and information regarding director independence, will be included in the Proxy Statement and is incorporated herein by reference.
ITEM 14.PRINCIPAL ACCOUNTING FEES AND SERVICES
The information required by this item, including information under the caption “Independent Registered Public Accounting Firm Fees and Services” in the Proxy Statement, will be included in the Proxy Statement and is incorporated herein by reference.
80
ITEM 15.EXHIBITS AND FINANCIAL STATEMENT SCHEDULES
|
(a) |
List of documents filed as part of this report: |
|
(1) |
Consolidated Financial Statements and Report of Independent Registered Public Accounting Firm. See the Index to Financial Statements and Financial Statement Schedules set forth in Part II, Item 8 of this report. |
|
(2) |
Financial Statement Schedules |
“Schedule II: Valuation and Qualifying Accounts” is included in the financial statements. See allowance for doubtful accounts in Note 19, “Allowance for Doubtful Accounts” and income tax valuation allowance in Note 13, “Income Taxes” of the Notes to Consolidated Financial Statements in Item 8, “Financial Statements and Supplementary Data.”
|
(b) |
Exhibits |
The exhibit list required by this Item is incorporated by reference to the Exhibit Index filed as part of this report.
81
SIGNATURES
Pursuant to the requirements of Section 13 or 15(d) of the Securities Exchange Act of 1934, the registrant has duly caused this report to be signed on its behalf by the undersigned, thereunto duly authorized.
|
|
DigitalGlobe, Inc. |
|
|
February 26, 2015 |
|
|
|
|
By: |
/s/ Fred Graffam |
|
|
|
Name: Fred Graffam |
|
|
|
Title: Senior Vice President, |
|
|
|
Interim Chief Financial Officer |
Pursuant to the requirements of the Securities Exchange Act of 1934, this report has been signed by the following persons in the capacities and on the dates indicated.
|
Signature |
|
Title |
|
Date |
|
|
|
|
|
|
|
/s/ Jeffrey R. Tarr |
|
President and Chief Executive Officer |
|
February 26, 2015 |
|
Jeffrey R. Tarr |
|
(Principal Executive Officer), Director |
|
|
|
|
|
|
|
|
|
/s/ Fred Graffam |
|
Senior Vice President, |
|
February 26, 2015 |
|
Fred Graffam |
|
Interim Chief Financial Officer |
|
|
|
|
|
|
|
|
|
/s/ Nathan M. Troup |
|
Chief Accounting Officer |
|
February 26, 2015 |
|
Nathan M. Troup |
|
(Principal Accounting Officer) |
|
|
|
|
|
|
|
|
|
/s/ General Howell M. Estes III |
|
Director |
|
February 26, 2015 |
|
General Howell M. Estes III |
|
|
|
|
|
|
|
|
|
|
|
/s/ Nick S. Cyprus |
|
Director |
|
February 26, 2015 |
|
Nick S. Cyprus |
|
|
|
|
|
|
|
|
|
|
|
/s/ Roxanne Decyk |
|
Director |
|
February 26, 2015 |
|
Roxanne Decyk |
|
|
|
|
|
|
|
|
|
|
|
/s/ Martin C. Faga |
|
Director |
|
February 26, 2015 |
|
Martin C. Faga |
|
|
|
|
|
|
|
|
|
|
|
/s/ Lawrence A. Hough |
|
Director |
|
February 26, 2015 |
|
Lawrence A. Hough |
|
|
|
|
|
|
|
|
|
|
|
/s/ Warren C. Jenson |
|
Director |
|
February 26, 2015 |
|
Warren C. Jenson |
|
|
|
|
|
|
|
|
|
|
|
/s/ Kimberly Till |
|
Director |
|
February 26, 2015 |
|
Kimberly Till |
|
|
|
|
|
/s/ James M. Whitehurst |
|
Director |
|
February 26, 2015 |
|
James M. Whitehurst |
|
|
|
|
|
|
|
|
|
|
|
/s/ Eddy Zervigon |
|
Director |
|
February 26, 2015 |
|
Eddy Zervigon |
|
|
|
|
82
INDEX TO EXHIBITS
|
|
|
|
|
Incorporated by Reference |
|
|
||||||
|
Exhibit No |
|
Exhibit Description |
|
Form |
|
SEC File No. |
|
Exhibit |
|
Filing Date |
|
Filed |
|
2.1** |
|
Agreement and Plan of Merger, dated as of July 22, 2012, by and among DigitalGlobe, Inc., 20/20 Acquisition Sub, Inc., WorldView, LLC and, GeoEye, Inc. |
|
8-K |
|
001-34299 |
|
2.1 |
|
7/23/12 |
|
|
|
|
|
|
|
|
|
|
|
|
|
|
|
|
|
2.2 |
|
Amendment No. 1 to Agreement and Plan of Merger, dated as of August 30, 2012, by and among DigitalGlobe, Inc., 20/20 Acquisition Sub, Inc., WorldView, LLC and, GeoEye, Inc. |
|
8-K |
|
001-34299 |
|
2.1 |
|
8/30/12 |
|
|
|
|
|
|
|
|
|
|
|
|
|
|
|
|
|
3.1 |
|
Amended and Restated Certificate of Incorporation of DigitalGlobe, Inc., as filed with the Secretary of the State of Delaware. |
|
10-K |
|
001-34299 |
|
3.1 |
|
02/24/10 |
|
|
|
|
|
|
|
|
|
|
|
|
|
|
|
|
|
3.2 |
|
Amended and Restated Bylaws of DigitalGlobe, Inc., effective October 22, 2013. |
|
8-K |
|
001-34299 |
|
3.1 |
|
10/28/13 |
|
|
|
|
|
|
|
|
|
|
|
|
|
|
|
|
|
3.3 |
|
Certificate of Designations, Preferences and Rights of Series A Convertible Preferred Stock of DigitalGlobe, Inc., as filed with the Secretary of the State of Delaware. |
|
8-K |
|
001-34299 |
|
3.1 |
|
01/31/13 |
|
|
|
|
|
|
|
|
|
|
|
|
|
|
|
|
|
4.1 |
|
Specimen Common Stock Certificate of DigitalGlobe, Inc. |
|
S-1 |
|
333-150235 |
|
4.1 |
|
05/13/09 |
|
|
|
|
|
|
|
|
|
|
|
|
|
|
|
|
|
4.2 |
|
Indenture, dated as of January 31, 2013, among DigitalGlobe, Inc., certain subsidiaries of DigitalGlobe, Inc., as guarantors thereto, and U.S. Bank National Association, as trustee. |
|
8-K |
|
001-34299 |
|
4.1 |
|
1/31/13 |
|
|
|
|
|
|
|
|
|
|
|
|
|
|
|
|
|
4.3 |
|
Form of 5.25% Senior Note due 2021 (included in Exhibit 4.2). |
|
8-K |
|
001-34299 |
|
4.2 |
|
1/31/13 |
|
|
|
|
|
|
|
|
|
|
|
|
|
|
|
|
83
|
|
|
|
|
Incorporated by Reference |
|
|
||||||
|
Exhibit No |
|
Exhibit Description |
|
Form |
|
SEC File No. |
|
Exhibit |
|
Filing Date |
|
Filed |
|
4.4 |
|
Registration Rights Agreement, dated as of January 31, 2013, among DigitalGlobe, Inc., certain subsidiaries of DigitalGlobe, Inc., and Morgan Stanley & Co. LLC, as representative of the several initial purchasers of the 5.25% Senior Notes due 2021 of DigitalGlobe, Inc. |
|
8-K |
|
001-34299 |
|
4.3 |
|
1/31/13 |
|
|
|
|
|
|
|
|
|
|
|
|
|
|
|
|
|
10.1.1# |
|
EnhancedView Imagery Acquisition Contract #HM021010C0002, dated August 6, 2010, by and between DigitalGlobe, Inc. and National Geospatial-Intelligence Agency. |
|
10-Q/A |
|
001-34299 |
|
10.1 |
|
5/24/11 |
|
|
|
|
|
|
|
|
|
|
|
|
|
|
|
|
|
10.1.2# |
|
Amendment to EnhancedView Imagery Acquisition Contract #HM021010C0002, by and between DigitalGlobe, Inc. and National Geospatial-Intelligence Agency, dated July 25, 2011. |
|
10-Q/A |
|
001-34299 |
|
10.1 |
|
2/24/12 |
|
|
|
|
|
|
|
|
|
|
|
|
|
|
|
|
|
10.1.3# |
|
Amendment to EnhancedView Imagery Acquisition Contract #HM021010C0002, by and between DigitalGlobe, Inc. and National Geospatial-Intelligence Agency, dated October 31, 2011. |
|
10-K |
|
001-34299 |
|
10.4 |
|
2/29/12 |
|
|
|
|
|
|
|
|
|
|
|
|
|
|
|
|
|
10.1.4# |
|
Amendment to EnhancedView Imagery Acquisition Contract #HM021010C0002, by and between DigitalGlobe, Inc. and National Geospatial-Intelligence Agency, dated February 15, 2012. |
|
10-Q |
|
001-34299 |
|
10.46 |
|
5/1/12 |
|
|
|
|
|
|
|
|
|
|
|
|
|
|
|
|
|
10.1.5# |
|
Modification P00024 to Contract #HM021010C0002, by and between DigitalGlobe, Inc. and National Geospatial-Intelligence Agency, dated as of July 24, 2012. |
|
10-Q |
|
001-34299 |
|
10.52 |
|
10/31/12 |
|
|
|
|
|
|
|
|
|
|
|
|
|
|
|
|
|
10.1.6# |
|
Modification P00032 to Contract #HM021010C0002, by and between DigitalGlobe, Inc. and National Geospatial-Intelligence Agency, dated as of December 26, 2012. |
|
10-K |
|
001-34299 |
|
10.53 |
|
2/26/13 |
|
|
|
|
|
|
|
|
|
|
|
|
|
|
|
|
84
|
|
|
|
|
Incorporated by Reference |
|
|
||||||
|
Exhibit No |
|
Exhibit Description |
|
Form |
|
SEC File No. |
|
Exhibit |
|
Filing Date |
|
Filed |
|
10.1.7# |
|
Modifications Nos. P00033 and P00034 to Contract #HM021010C0002, by and between DigitalGlobe, Inc. and National Geospatial-Intelligence Agency. |
|
10-Q |
|
001-34299 |
|
10.56 |
|
5/7/13 |
|
|
|
|
|
|
|
|
|
|
|
|
|
|
|
|
|
10.1.8# |
|
Modification Nos. P00035-38 to Contract #HM021010C002, by and between DigitalGlobe, Inc. and National Geospatial-Intelligence Agency. |
|
10-Q |
|
001-34299 |
|
10.60 |
|
8/6/13 |
|
|
|
|
|
|
|
|
|
|
|
|
|
|
|
|
|
10.1.9# |
|
EnhancedView Imagery Acquisition Contract #HM021010CN002, by and between DigitalGlobe, Inc. and National Geospatial-Intelligence Agency, dated September 1, 2013 and Modification P00001 |
|
10-Q |
|
001-34299 |
|
10.2 |
|
10/31/13 |
|
|
|
|
|
|
|
|
|
|
|
|
|
|
|
|
|
10.1.10# |
|
Modification P00002 to Contract #HM021010CN002, by and between DigitalGlobe, Inc. and National Geospatial-Intelligence Agency. |
|
10-K |
|
011-34299 |
|
10.1.10 |
|
2/26/14 |
|
|
|
|
|
|
|
|
|
|
|
|
|
|
|
|
|
10.1.11# |
|
Modification P00003 to Contract #HM021010CN002, by and between DigitalGlobe, Inc. and National Geospatial-Intelligence Agency. |
|
10-K |
|
011-34299 |
|
10.1.11 |
|
2/26/14 |
|
|
|
|
|
|
|
|
|
|
|
|
|
|
|
|
|
10.1.12# |
|
Modification P00004 to Contract #HM021010CN002, by and between DigitalGlobe, Inc. and National Geospatial-Intelligence Agency. |
|
10-Q |
|
011-34299 |
|
10.1 |
|
5/1/14 |
|
|
|
|
|
|
|
|
|
|
|
|
|
|
|
|
|
10.1.13# |
|
Modification P00005 to Contract #HM021010CN002, by and between DigitalGlobe, Inc. and National Geospatial-Intelligence Agency. |
|
10-Q |
|
011-34299 |
|
10.2 |
|
5/1/14 |
|
|
|
|
|
|
|
|
|
|
|
|
|
|
|
|
|
10.1.14# |
|
Modification P00006 to Contract #HM021010CN002, by and between DigitalGlobe, Inc. and National Geospatial-Intelligence Agency. |
|
10-Q |
|
011-34299 |
|
10.3 |
|
5/1/14 |
|
|
|
|
|
|
|
|
|
|
|
|
|
|
|
|
85
|
|
|
|
|
Incorporated by Reference |
|
|
||||||
|
Exhibit No |
|
Exhibit Description |
|
Form |
|
SEC File No. |
|
Exhibit |
|
Filing Date |
|
Filed |
|
10.1.15# |
|
Modification P0007 to Contract #HM021010CN002, by and between DigitalGlobe, Inc. and National Geospatial-Intelligence Agency. |
|
10-Q |
|
011-34299 |
|
10.4 |
|
5/1/14 |
|
|
|
|
|
|
|
|
|
|
|
|
|
|
|
|
|
10.1.16# |
|
Modification P00008 to Contract #HM021010CN002, by and between DigitalGlobe, Inc. and National Geospatial-Intelligence Agency. |
|
10-Q |
|
011-34299 |
|
10.1 |
|
7/31/14 |
|
|
|
|
|
|
|
|
|
|
|
|
|
|
|
|
|
10.1.17# |
|
Modification P00009 to Contract #HM021010CN002, by and between DigitalGlobe, Inc. and National Geospatial-Intelligence Agency. |
|
10-Q |
|
011-34299 |
|
10.2 |
|
7/31/14 |
|
|
|
|
|
|
|
|
|
|
|
|
|
|
|
|
|
10.1.18# |
|
Modification P00010 to Contract #HM021010CN002, by and between DigitalGlobe, Inc. and National Geospatial-Intelligence Agency. |
|
10-Q |
|
011-34299 |
|
10.3 |
|
7/31/14 |
|
|
|
|
|
|
|
|
|
|
|
|
|
|
|
|
|
10.1.19# |
|
Modification P00011 to Contract #HM021010CN002, by and between DigitalGlobe, Inc. and National Geospatial-Intelligence Agency. |
|
10-Q |
|
011-34299 |
|
10.4 |
|
7/31/14 |
|
|
|
|
|
|
|
|
|
|
|
|
|
|
|
|
|
10.1.20# |
|
Modification P00012 to Contract #HM021010CN002, by and between DigitalGlobe, Inc. and National Geospatial-Intelligence Agency. |
|
10-Q |
|
011-34299 |
|
10.1 |
|
10/30/14 |
|
|
|
|
|
|
|
|
|
|
|
|
|
|
|
|
|
10.1.21# |
|
Modification P00013 to Contract #HM021010CN002, by and between DigitalGlobe, Inc. and National Geospatial-Intelligence Agency. |
|
|
|
|
|
|
|
|
|
X |
|
|
|
|
|
|
|
|
|
|
|
|
|
|
|
10.1.22# |
|
Modification P00014 to Contract #HM021010CN002, by and between DigitalGlobe, Inc. and National Geospatial-Intelligence Agency. |
|
|
|
|
|
|
|
|
|
X |
|
|
|
|
|
|
|
|
|
|
|
|
|
|
86
|
|
|
|
|
Incorporated by Reference |
|
|
||||||
|
Exhibit No |
|
Exhibit Description |
|
Form |
|
SEC File No. |
|
Exhibit |
|
Filing Date |
|
Filed |
|
10.1.23# |
|
Modification P00015 to Contract #HM021010CN002, by and between DigitalGlobe, Inc. and National Geospatial-Intelligence Agency. |
|
|
|
|
|
|
|
|
|
X |
|
|
|
|
|
|
|
|
|
|
|
|
|
|
|
10.1.24# |
|
Modification P00016 to Contract #HM021010CN002, by and between DigitalGlobe, Inc. and National Geospatial-Intelligence Agency. |
|
|
|
|
|
|
|
|
|
X |
|
|
|
|
|
|
|
|
|
|
|
|
|
|
|
10.2.1# |
|
WorldView-3 Satellite Purchase Agreement #60150, dated September 1, 2010, by and between DigitalGlobe, Inc. and Ball Aerospace & Technologies Corp. |
|
10-Q/A |
|
001-34299 |
|
10.2 |
|
5/24/11 |
|
|
|
|
|
|
|
|
|
|
|
|
|
|
|
|
|
10.2.2# |
|
Amendment No. 1 to WorldView-3 Satellite Purchase Agreement #60150, by and between DigitalGlobe, Inc. and Ball Aerospace & Technologies Corp. |
|
10-K |
|
001-34299 |
|
10.5.1 |
|
2/29/12 |
|
|
|
|
|
|
|
|
|
|
|
|
|
|
|
|
|
10.2.3# |
|
Amendment No. 3 to WorldView-3 Satellite Purchase Agreement #60150, by and between DigitalGlobe, Inc. and Ball Aerospace & Technologies Corp. |
|
10-K |
|
001-34299 |
|
10.5.2 |
|
2/29/12 |
|
|
|
|
|
|
|
|
|
|
|
|
|
|
|
|
|
10.2.4# |
|
Amendment No. 4 to WorldView-3 Satellite Purchase Agreement #60150, by and between DigitalGlobe, Inc. and Ball Aerospace & Technologies Corp. |
|
10-K |
|
001-34299 |
|
10.5.3 |
|
2/29/12 |
|
|
|
|
|
|
|
|
|
|
|
|
|
|
|
|
|
10.2.5# |
|
Amendment No. 5 to WorldView-3 Satellite Purchase Agreement #60150, by and between DigitalGlobe, Inc. and Ball Aerospace & Technologies Corp. |
|
10-K |
|
001-34299 |
|
10.5.4 |
|
2/29/12 |
|
|
|
|
|
|
|
|
|
|
|
|
|
|
|
|
|
10.2.6# |
|
Amendment No. 6 to WorldView-3 Satellite Purchase Agreement #60150, by and between DigitalGlobe, Inc. and Ball Aerospace & Technologies Corp. |
|
10-Q |
|
001-34299 |
|
10.45 |
|
5/1/12 |
|
|
|
|
|
|
|
|
|
|
|
|
|
|
|
|
87
|
|
|
|
|
Incorporated by Reference |
|
|
||||||
|
Exhibit No |
|
Exhibit Description |
|
Form |
|
SEC File No. |
|
Exhibit |
|
Filing Date |
|
Filed |
|
10.2.7# |
|
Amendments Nos. 7 and 8 to WorldView-3 Satellite Purchase Agreement #60150, by and between DigitalGlobe, Inc. and Ball Aerospace & Technologies Corp. |
|
10-K |
|
001-34299 |
|
10.5.5 |
|
2/26/13 |
|
|
|
|
|
|
|
|
|
|
|
|
|
|
|
|
|
10.2.8# |
|
Amendments No. 9 to WorldView-3 Satellite Purchase Agreement #60150, by and between DigitalGlobe, Inc. and Ball Aerospace & Technologies Corp. |
|
10-Q |
|
001-34299 |
|
10.5.6 |
|
5/7/13 |
|
|
|
|
|
|
|
|
|
|
|
|
|
|
|
|
|
10.2.9# |
|
Amendment No. 10 to WorldView-3 Satellite Purchase Agreement #60150, by and between DigitalGlobe, Inc. and Ball Aerospace & Technologies Corp. |
|
10-Q |
|
001-34299 |
|
10.5.7 |
|
8/6/13 |
|
|
|
|
|
|
|
|
|
|
|
|
|
|
|
|
|
10.2.10# |
|
Amendment No. 11 to WorldView-3 Satellite Purchase Agreement #60150, by and between DigitalGlobe, Inc. and Ball Aerospace & Technologies Corp. |
|
10-Q |
|
001-34299 |
|
10.5 |
|
7/31/14 |
|
|
|
|
|
|
|
|
|
|
|
|
|
|
|
|
|
10.3.1# |
|
WorldView-3 Instrument Purchase Agreement #60151, dated September 1, 2010, by and between DigitalGlobe, Inc. and ITT Space Systems, LLC. |
|
10-Q/A |
|
001-34299 |
|
10.3 |
|
5/24/11 |
|
|
|
|
|
|
|
|
|
|
|
|
|
|
|
|
|
10.3.2# |
|
Modifications #1-5 and 7-12 to WorldView-3 Instrument Purchase Agreement #60151, by and between DigitalGlobe, Inc. and ITT Space Systems, LLC. |
|
10-K |
|
001-34299 |
|
10.6.1 |
|
2/29/12 |
|
|
|
|
|
|
|
|
|
|
|
|
|
|
|
|
|
10.3.3# |
|
Modifications #13, 14, 16 and 17 to WorldView-3 Instrument Purchase Agreement #60151, by and between DigitalGlobe, Inc. and ITT Space Systems, LLC. |
|
10-K |
|
001-34299 |
|
10.6.2 |
|
2/26/13 |
|
|
|
|
|
|
|
|
|
|
|
|
|
|
|
|
|
10.3.4# |
|
Modifications Nos. 18, 19 and 20 to WorldView-3 Instrument Purchase Agreement #60151, by and between DigitalGlobe, Inc. and ITT Space Systems, LLC. |
|
10-Q |
|
001-34299 |
|
10.6.3 |
|
5/7/13 |
|
|
|
|
|
|
|
|
|
|
|
|
|
|
|
|
88
|
|
|
|
|
Incorporated by Reference |
|
|
||||||
|
Exhibit No |
|
Exhibit Description |
|
Form |
|
SEC File No. |
|
Exhibit |
|
Filing Date |
|
Filed |
|
10.3.5# |
|
Modifications Nos. 21, 22, 23, 24 and 25 to WorldView-3 Instrument Purchase Agreement #60151, by and between DigitalGlobe, Inc. and ITT Space Systems, LLC. |
|
10-Q |
|
001-34299 |
|
10.6.4 |
|
8/6/13 |
|
|
|
|
|
|
|
|
|
|
|
|
|
|
|
|
|
10.3.6# |
|
Modification No. 26 to WorldView-3 Instrument Purchase Agreement #60151, by and between DigitalGlobe, Inc. and ITT Space Systems, LLC. |
|
10-Q |
|
001-34299 |
|
10.1 |
|
10/31/13 |
|
|
|
|
|
|
|
|
|
|
|
|
|
|
|
|
|
10.3.7# |
|
Modifications Nos. 27 and 28 to WorldView-3 Instrument Purchase Agreement #60151, by and between DigitalGlobe, Inc. and ITT Space Systems, LLC. |
|
10-Q |
|
001-34299 |
|
10.5 |
|
5/1/14 |
|
|
|
|
|
|
|
|
|
|
|
|
|
|
|
|
|
10.4 |
|
Credit and Guaranty Agreement, dated October 12, 2011, among DigitalGlobe, Inc., the guarantors and lenders named therein, Morgan Stanley Senior Funding, Inc., J.P. Morgan Securities, LLC and J.P. Morgan Chase Bank, N.A., as administrative agent and as collateral agent. |
|
8-K |
|
001-34299 |
|
10.1 |
|
10/13/11 |
|
|
|
|
|
|
|
|
|
|
|
|
|
|
|
|
|
10.5 |
|
Office Lease, dated March 19, 2008, by and between DigitalGlobe, Inc. and K/B Fund IV. |
|
S-1 |
|
333-150235 |
|
10.6 |
|
4/14/08 |
|
|
|
|
|
|
|
|
|
|
|
|
|
|
|
|
|
10.6 |
|
First Amendment to Office Lease, dated September 10, 2004, by and between K/B Fund IV and DigitalGlobe, Inc. |
|
10-K |
|
001-34299 |
|
10.7 |
|
2/28/11 |
|
|
|
|
|
|
|
|
|
|
|
|
|
|
|
|
|
10.7 |
|
First Amendment to Lease, dated April 18, 2005, by and between Hub Properties Trust and DigitalGlobe, Inc. |
|
10-K |
|
001-34299 |
|
10.8 |
|
2/28/11 |
|
|
|
|
|
|
|
|
|
|
|
|
|
|
|
|
|
10.8 |
|
First Amendment to Lease dated October 14, 2011, by and between Hub Properties Trust and DigitalGlobe, Inc. |
|
10-K |
|
001-34299 |
|
10.10 |
|
2/29/12 |
|
|
|
|
|
|
|
|
|
|
|
|
|
|
|
|
89
|
|
|
|
|
Incorporated by Reference |
|
|
||||||
|
Exhibit No |
|
Exhibit Description |
|
Form |
|
SEC File No. |
|
Exhibit |
|
Filing Date |
|
Filed |
|
10.8.1 |
|
Fourth Amendment to Lease dated May 28, 2013, by and between Hub Properties Trust and DigitalGlobe, Inc. |
|
|
|
|
|
|
|
|
|
X |
|
|
|
|
|
|
|
|
|
|
|
|
|
|
|
10.8.2 |
|
Fifth Amendment to Lease dated May 28, 2013, by and between Hub Properties Trust and DigitalGlobe, Inc. |
|
|
|
|
|
|
|
|
|
X |
|
|
|
|
|
|
|
|
|
|
|
|
|
|
|
10.8.3 |
|
Sixth Amendment to Lease dated October 29, 2014, by and between Hub Properties Trust and DigitalGlobe, Inc. |
|
|
|
|
|
|
|
|
|
X |
|
|
|
|
|
|
|
|
|
|
|
|
|
|
|
10.9* |
|
Employment Agreement by and between DigitalGlobe, Inc. and Yancey L. Spruill, dated as of June 1, 2008. |
|
S-1 |
|
333-150235 |
|
10.11 |
|
3/24/09 |
|
|
|
|
|
|
|
|
|
|
|
|
|
|
|
|
|
10.9.1* |
|
Separation Agreement, dated April 29, 2014, between DigitalGlobe, Inc. and Yancey L. Spruill |
|
8-K |
|
001-34299 |
|
10.1 |
|
5/1/14 |
|
|
|
10.10* |
|
Employment Agreement by and between DigitalGlobe, Inc. and Jeffrey R. Tarr, dated as of February 22, 2011. |
|
8-K |
|
001-34299 |
|
10.1 |
|
2/28/11 |
|
|
|
|
|
|
|
|
|
|
|
|
|
|
|
|
|
10.10.1* |
|
Employment Agreement by and between DigitalGlobe, Inc. and Jeffrey R. Tarr, effective as of July 23, 2014. |
|
8-K |
|
001-34299 |
|
10.1 |
|
7/29/14 |
|
|
|
10.11* |
|
Amended and Restated 1999 Equity Incentive Plan. |
|
S-1 |
|
333-150235 |
|
10.18 |
|
4/14/08 |
|
|
|
|
|
|
|
|
|
|
|
|
|
|
|
|
|
10.12* |
|
2007 Employee Stock Option Plan, as amended. |
|
10-K |
|
001-34299 |
|
10.26 |
|
2/29/12 |
|
|
|
|
|
|
|
|
|
|
|
|
|
|
|
|
|
10.13* |
|
Amended and Restated 2007 Employee Stock Option Plan. |
|
8-K |
|
001-34299 |
|
10.1 |
|
5/25/12 |
|
|
|
|
|
|
|
|
|
|
|
|
|
|
|
|
|
10.14* |
|
Form of Amendment to Executive Employment Agreement. |
|
8-K |
|
001-34299 |
|
10.2 |
|
10/29/10 |
|
|
|
|
|
|
|
|
|
|
|
|
|
|
|
|
|
10.15* |
|
Form of Incentive Stock Option Award Agreement, 25% vest on the first year anniversary of the grant date and monthly thereafter. |
|
10-K |
|
001-34299 |
|
10.29 |
|
2/28/11 |
|
|
|
|
|
|
|
|
|
|
|
|
|
|
|
|
90
|
|
|
|
|
Incorporated by Reference |
|
|
||||||
|
Exhibit No |
|
Exhibit Description |
|
Form |
|
SEC File No. |
|
Exhibit |
|
Filing Date |
|
Filed |
|
10.16* |
|
Form of Incentive Stock Option Award Agreement, 25% vest annually. |
|
10-K |
|
001-34299 |
|
10.30 |
|
2/28/11 |
|
|
|
|
|
|
|
|
|
|
|
|
|
|
|
|
|
10.17* |
|
Form of Non-Qualified Stock Option Award Agreement, 25% vest on the first year anniversary of the grant date and monthly thereafter. |
|
10-K |
|
001-34299 |
|
10.31 |
|
2/28/11 |
|
|
|
|
|
|
|
|
|
|
|
|
|
|
|
|
|
10.18* |
|
Form of Non-Qualified Stock Option Award Agreement, 25% vest annually. |
|
10-K |
|
001-34299 |
|
10.32 |
|
2/28/11 |
|
|
|
|
|
|
|
|
|
|
|
|
|
|
|
|
|
10.19* |
|
Form of Restricted Stock Award Agreement, 25% vest annually. |
|
10-K |
|
001-34299 |
|
10.33 |
|
2/28/11 |
|
|
|
|
|
|
|
|
|
|
|
|
|
|
|
|
|
10.20* |
|
Executive Compensation and Equity Awards. |
|
8-K |
|
001-34299 |
|
10.1 |
|
3/12/12 |
|
|
|
|
|
|
|
|
|
|
|
|
|
|
|
|
|
10.21* |
|
Executive Success Sharing Plan, effective as of January 1, 2012. |
|
8-K |
|
001-34299 |
|
10.2 |
|
3/12/12 |
|
|
|
|
|
|
|
|
|
|
|
|
|
|
|
|
|
10.22* |
|
Form of Incentive Stock Option Award Agreement. |
|
8-K |
|
001-34299 |
|
10.3 |
|
3/12/12 |
|
|
|
|
|
|
|
|
|
|
|
|
|
|
|
|
|
10.23* |
|
Form of Incentive Stock Option Award Agreement with double trigger acceleration. |
|
8-K |
|
001-34299 |
|
10.4 |
|
3/12/12 |
|
|
|
|
|
|
|
|
|
|
|
|
|
|
|
|
|
10.24* |
|
Form of Nonqualified Stock Option Award Agreement. |
|
8-K |
|
001-34299 |
|
10.5 |
|
3/12/12 |
|
|
|
|
|
|
|
|
|
|
|
|
|
|
|
|
|
10.25* |
|
Form of Nonqualified Stock Option Award Agreement with double trigger acceleration |
|
8-K |
|
001-34299 |
|
10.6 |
|
3/12/12 |
|
|
|
|
|
|
|
|
|
|
|
|
|
|
|
|
|
10.26* |
|
Form of Restricted Stock Award Agreement |
|
8-K |
|
001-34299 |
|
10.7 |
|
3/12/12 |
|
|
|
|
|
|
|
|
|
|
|
|
|
|
|
|
|
10.27* |
|
Form of Restricted Stock Award Agreement with double trigger acceleration |
|
8-K |
|
001-34299 |
|
10.8 |
|
3/12/12 |
|
|
|
|
|
|
|
|
|
|
|
|
|
|
|
|
|
10.28* |
|
Form of Performance Share Unit Award Agreement |
|
8-K |
|
001-34299 |
|
10.9 |
|
3/12/12 |
|
|
|
|
|
|
|
|
|
|
|
|
|
|
|
|
91
|
|
|
|
|
Incorporated by Reference |
|
|
||||||
|
Exhibit No |
|
Exhibit Description |
|
Form |
|
SEC File No. |
|
Exhibit |
|
Filing Date |
|
Filed |
|
10.29 |
|
Cerberus Agreement, dated as of July 22, 2012, by and among DigitalGlobe, Inc., Cerberus Capital Management, L.P., Cerberus Partners II, L.P., Cerberus Series Four Holdings, LLC, and Cerberus Satellite LLC. |
|
8-K |
|
001-34299 |
|
10.1 |
|
7/23/12 |
|
|
|
|
|
|
|
|
|
|
|
|
|
|
|
|
|
10.30 |
|
Voting Agreement, dated as of July 22, 2012, by and among DigitalGlobe, Inc., Cerberus Capital Management, L.P., Cerberus Partners II, L.P., Cerberus Series Four Holdings, LLC, and Cerberus Satellite LLC. |
|
8-K |
|
001-34299 |
|
10.2 |
|
7/23/12 |
|
|
|
|
|
|
|
|
|
|
|
|
|
|
|
|
|
10.31 |
|
Credit Agreement, dated January 31, 2013, by and among DigitalGlobe, Inc., the guarantors party thereto, the lenders named therein and JPMorgan Chase Bank, N.A., as administrative agent and as collateral agent. |
|
8-K |
|
001-34299 |
|
10.1 |
|
1/31/13 |
|
|
|
|
|
|
|
|
|
|
|
|
|
|
|
|
|
10.32 |
|
Registration Rights Agreement, dated January 31, 2013 by and between DigitalGlobe, Inc., Cerberus Satellite LLC, Cerberus Partners II, L.P., and Cerberus Series Four Holdings, LLC. |
|
8-K |
|
001-34299 |
|
10.2 |
|
1/31/13 |
|
|
|
|
|
|
|
|
|
|
|
|
|
|
|
|
|
10.33 |
|
GeoEye, Inc. 2010 Omnibus Incentive Plan. |
|
10-K |
|
001-33015 |
|
10.22 |
|
3/15/11 |
|
|
|
|
|
|
|
|
|
|
|
|
|
|
|
|
|
10.34 |
|
Amendment to GeoEye, Inc. 2010 Omnibus Incentive Plan. |
|
10-Q |
|
001-33015 |
|
10.1 |
|
8/2/11 |
|
|
|
|
|
|
|
|
|
|
|
|
|
|
|
|
|
10.35* |
|
2006 Omnibus Stock and Performance Incentive Plan Of ORBIMAGE Holdings Inc. |
|
10-K |
|
001-33015 |
|
10.1 |
|
3/15/07 |
|
|
|
|
|
|
|
|
|
|
|
|
|
|
|
|
|
10.36* |
|
Form of Indemnification Agreements for Directors and Executive Officers. |
|
8-K |
|
001-34299 |
|
10.1 |
|
10/3/13 |
|
|
|
|
|
|
|
|
|
|
|
|
|
|
|
|
|
10.37* |
|
Form of Restricted Share Unit Award Agreement. |
|
10-Q |
|
001-34299 |
|
10.3 |
|
10/3/13 |
|
|
|
|
|
|
|
|
|
|
|
|
|
|
|
|
92
|
|
|
|
|
Incorporated by Reference |
|
|
||||||
|
Exhibit No |
|
Exhibit Description |
|
Form |
|
SEC File No. |
|
Exhibit |
|
Filing Date |
|
Filed |
|
10.38* |
|
Form of Performance Share Unit Award Agreement. |
|
10-Q |
|
001-34299 |
|
10.4 |
|
10/3/13 |
|
|
|
|
|
|
|
|
|
|
|
|
|
|
|
|
|
10.39* |
|
Deferred Compensation Plan, effective October 1, 2013. |
|
10-K |
|
001-34299 |
|
10.41 |
|
2/26/14 |
|
|
|
|
|
|
|
|
|
|
|
|
|
|
|
|
|
21.1 |
|
Subsidiaries of the Registrant. |
|
|
|
|
|
|
|
|
|
X |
|
|
|
|
|
|
|
|
|
|
|
|
|
|
|
23.1 |
|
Consent of PricewaterhouseCoopers LLP, Independent Registered Public Accounting Firm. |
|
|
|
|
|
|
|
|
|
X |
|
|
|
|
|
|
|
|
|
|
|
|
|
|
|
31.1 |
|
Certification of the Company’s Chief Executive Officer pursuant to Section 302 of the Sarbanes-Oxley Act of 2002. |
|
|
|
|
|
|
|
|
|
X |
|
|
|
|
|
|
|
|
|
|
|
|
|
|
|
31.2 |
|
Certification of the Company’s Chief Financial Officer pursuant to Section 302 of the Sarbanes-Oxley Act of 2002. |
|
|
|
|
|
|
|
|
|
X |
|
|
|
|
|
|
|
|
|
|
|
|
|
|
|
32.1 |
|
Certification of the Company’s Chief Executive Officer pursuant to Section 906 of the Sarbanes-Oxley Act of 2002. |
|
|
|
|
|
|
|
|
|
X |
|
|
|
|
|
|
|
|
|
|
|
|
|
|
|
32.2 |
|
Certification of the Company’s Chief Financial Officer pursuant to Section 906 of the Sarbanes-Oxley Act of 2002. |
|
|
|
|
|
|
|
|
|
X |
|
|
|
|
|
|
|
|
|
|
|
|
|
|
|
101 |
|
The following materials for the DigitalGlobe, Inc. Annual Report on Form 10-K for the year ended December 31, 2014, filed on February 26, 2015, Commission File No. 001-34299, formatted in eXtensible Business Reporting Language (XBRL): (i.) Audited Consolidated Statements of Operations (ii.) Audited Consolidated Balance Sheets (iii.) Audited Consolidated Statements of Cash Flows (iv.) Audited Consolidated Statements of Stockholders’ Equity and Statement of Comprehensive Income (Loss) (v.) Related notes, tagged or blocks of text |
|
|
|
|
|
|
|
|
|
X |
93
#Certain portions of this exhibit have been omitted by redacting a portion of the text. This exhibit has been filed separately with the U.S. Securities and Exchange Commission pursuant to a request for confidential treatment.
* Management contract or compensatory plan arrangement.
** This filing excludes schedules and exhibits pursuant to Item 601(b)(2) of Regulation S-K, which the registrant agrees to furnish supplementally to the U.S. Securities and Exchange Commission upon request.
94