Attached files
| file | filename |
|---|---|
| EX-21.1 - EX-21.1 - HOMEAWAY INC | d846217dex211.htm |
| EX-31.2 - EX-31.2 - HOMEAWAY INC | d846217dex312.htm |
| EX-31.1 - EX-31.1 - HOMEAWAY INC | d846217dex311.htm |
| EX-32.1 - EX-32.1 - HOMEAWAY INC | d846217dex321.htm |
| EX-10.43 - EX-10.43 - HOMEAWAY INC | d846217dex1043.htm |
| EX-10.44 - EX-10.44 - HOMEAWAY INC | d846217dex1044.htm |
| EXCEL - IDEA: XBRL DOCUMENT - HOMEAWAY INC | Financial_Report.xls |
| EX-23.1 - EX-23.1 - HOMEAWAY INC | d846217dex231.htm |
Table of Contents
UNITED STATES
SECURITIES AND EXCHANGE COMMISSION
WASHINGTON, D.C. 20549
FORM 10-K
(Mark One)
| x | ANNUAL REPORT PURSUANT TO SECTION 13 OR 15(d) OF THE SECURITIES EXCHANGE ACT OF 1934 |
For the fiscal year ended December 31, 2014
OR
| ¨ | TRANSITION REPORT PURSUANT TO SECTION 13 OR 15(d) OF THE SECURITIES EXCHANGE ACT OF 1934 |
For the transition period from to
Commission file number 001-35215
HomeAway, Inc.
(Exact name of registrant as specified in its charter)
| Delaware | 20-0970381 | |
| (State or other jurisdiction of incorporation or organization) |
(I.R.S. Employer Identification No.) |
| 1011 W Fifth Street, Suite 300 Austin, Texas |
78703 | |
| (Address of principal executive offices) | (Zip code) |
(512) 684-1100
Registrant’s telephone number, including area code
Securities registered pursuant to Section 12(b) of the Act:
| Title of each class |
Name of each exchange on which registered | |
| Common Stock, $0.0001 par value per share | The NASDAQ Select Market LLC (Nasdaq Global Select Market) |
Securities registered pursuant to Section 12(g) of the Act:
None
Indicate by check mark if the registrant is a well-known seasoned issuer, as defined in Rule 405 of the Securities Act. Yes x No ¨
Indicate by check mark if the registrant is not required to file reports pursuant to Section 13 or Section 15(d) of the Act. Yes ¨ No x
Indicate by check mark whether the registrant: (1) has filed all reports required to be filed by Section 13 or 15(d) of the Securities Exchange Act of 1934 during the preceding 12 months (or for such shorter period that the Registrant was required to file such reports), and (2) has been subject to such filing requirements for the past 90 days. Yes x No ¨
Indicate by check mark whether the registrant has submitted electronically and posted on its corporate Web site, if any, every Interactive Data File required to be submitted and posted pursuant to Rule 405 of Regulation S-T (§232.405 of this chapter) during the preceding 12 months (or for such shorter period that the registrant was required to submit and post such files). Yes x No ¨
Indicate by check mark if disclosure of delinquent filers pursuant to Item 405 of Regulation S-K is not contained herein, and will not be contained, to the best of registrant’s knowledge, in definitive proxy or information statements incorporated by reference in Part III of this Form 10-K or any amendment to this Form 10-K. x
Indicate by check mark whether the registrant is a large accelerated filer, an accelerated filer, a non-accelerated filer, or a smaller reporting company. See the definitions of “large accelerated filer,” “accelerated filer” and “smaller reporting company” in Rule 12b-2 of the Exchange Act. (Check one):
| Large accelerated filer | x | Accelerated filer | ¨ | |||||
| Non-accelerated filer | ¨ | (Do not check if a smaller reporting company) | Smaller reporting company | ¨ | ||||
Indicate by check mark whether the registrant is a shell company (as defined in Rule 12b-2 of the Exchange Act). Yes ¨ No x
Based on the closing price of the registrant’s common stock on the last business day of the registrant’s most recently completed second fiscal quarter, which was June 30, 2014, the aggregate market value of its shares held by non-affiliates on that date was approximately $3,096,812,838.
On February 19, 2015, 94,533,802 shares of common stock were outstanding.
DOCUMENTS INCORPORATED BY REFERENCE
The information required by Part III of this Annual Report on Form 10-K, to the extent not set forth herein, is incorporated herein by reference from the registrant’s definitive proxy statement relating to the Annual Meeting of Shareholders to be held in 2015, which definitive proxy statement shall be filed with the Securities and Exchange Commission within 120 days after the end of the fiscal year to which this Annual Report on Form 10-K relates.
Table of Contents
Form 10-K
For the Fiscal Year Ended December 31, 2014
Table of Contents
PART I
FORWARD-LOOKING STATEMENTS
Discussions under the captions “Business,” “Risk Factors” and “Management’s Discussion and Analysis of Financial Condition and Results of Operations” in this Annual Report on Form 10-K contain forward-looking statements within the meaning of Section 27A of the Securities Act of 1933 and Section 21E of the Securities Exchange Act of 1934. These include statements that involve expectations, plans or intentions (such as those relating to future business, future results of operations or financial condition, new or planned features or services, or management strategies) based on our management’s current beliefs and assumptions. You can identify these forward-looking statements by words such as “may,” “will,” “would,” “should,” “could,” “expect,” “anticipate,” “believe,” “estimate,” “intend,” “plan” and other similar expressions. These forward-looking statements involve risks and uncertainties that could cause our actual results to differ materially from those expressed or implied in our forward-looking statements. Such risks and uncertainties include, among others, those discussed under the caption “Risk Factors” of this Annual Report on Form 10-K, as well as in our consolidated financial statements, related notes, and the other information appearing elsewhere in this report and our other filings with the Securities and Exchange Commission, or the SEC. Given these risks and uncertainties, you should not place undue reliance on these forward-looking statements. We do not intend, and, except as required by law, we undertake no obligation, to update any of our forward-looking statements after the date of this report to reflect actual results or future events or circumstances. Given these risks and uncertainties, readers are cautioned not to place undue reliance on such forward-looking statements.
Overview
HomeAway, Inc. and its subsidiaries (“HomeAway,” the “Company,” “we,” “us” and “our”) operate the world’s largest online marketplace for the vacation rental industry. Vacation rentals are fully furnished, privately owned residential properties, including homes, condominiums, villas and cabins, that property owners and managers rent to the public on a nightly, weekly or monthly basis. Our marketplace brings together millions of travelers seeking vacation rentals online with the property owners and managers of over one million vacation rental properties located in over 190 countries around the world. As of December 31, 2014, we operated our online marketplace through 40 websites in 22 languages, with leading websites in Australia, Europe, New Zealand, Singapore, South America and the United States. In 2014, our websites attracted approximately 884 million website visits. As of December 31, 2014, our global marketplace included approximately one million paid listings of vacation rentals. In addition to our online marketplace, we offer software solutions to property managers through our HomeAway Software for Professionals and Glad to Have You products.
Our ambition is to make every vacation rental in the world available to every traveler in the world through our online marketplace and to provide the most qualified inquiries and bookings to property owners and managers. Our online marketplace serves two major constituents: property owners and managers on one side and travelers on the other. Property owners and managers pay to provide detailed listings of their properties on our websites and reach a broad audience of travelers seeking vacation rentals. Listing fees paid by property owners and managers are either in the form of subscriptions that are generally for an annual period, or in the form of performance-based fees that allow for owners and managers to list their properties for free and pay us a commission for successful bookings. Travelers visit our marketplace and are able to search and compare our large and detailed inventory of listings to find vacation rentals meeting their requirements.
Historically, we have derived the majority of our revenue from the sale of subscriptions on our websites to property owners and professional property managers. In 2013, we launched a performance-based product that allows owners and managers to list their property on our marketplace and pay a commission per booking in lieu of a pre-paid subscription fee. At the end of 2014, this pay-per-booking product was available on a majority of HomeAway websites globally. In addition to the various products that comprise our listing revenues, we also
1
Table of Contents
generate revenue from the sale of ancillary products and services to owners and travelers, Internet display-based advertising on our websites, and property management software products.
The global vacation rental industry is large and growing, but also fragmented and inefficient. As we have grown, we have benefited from the network effect of having both a broad selection of vacation rental listings and a large audience of travelers. The broad selection of vacation rental listings attracts more travelers and the large audience of travelers in turn attracts more vacation rental listings from property owners and managers.
HomeAway, Inc. was incorporated in 2004 as CEH Holdings, Inc. in the State of Delaware. In 2006, we changed our name to HomeAway, Inc. Our principal executive offices are located at 1011 W. Fifth Street, Suite 300, Austin, Texas 78703 and our telephone number is (512) 684-1100. Our corporate website address is www.HomeAway.com. We do not incorporate the information contained on, or accessible through, our websites into this Annual Report on Form 10-K. We completed our initial public offering in July 2011, and our common stock is listed on The NASDAQ Global Select Market, or NASDAQ, under the symbol “AWAY.”
Acquisitions
Since our inception, we have acquired 22 businesses as part of our growth strategy. Each of these acquisitions has been accounted for using the acquisition method of accounting. Accordingly, the financial statements for these businesses have been included in our consolidated financial results since the applicable acquisition dates. The most recent acquisition was in March 2014, when we acquired Glad to Have You, Inc., the creator of a mobile guest management solution designed for property owners and managers to better manage and communicate with guests before, during and after their vacation rental stay.
Our acquisitions have presented, and certain of them continue to present, significant integration challenges. They require us to integrate new operations, offices and employees and to formulate and execute on marketing, product and technology strategies associated with the acquired businesses. In some cases, we continue to manage multiple brands and technology platforms of the acquired businesses, which has increased our cost of operations. Challenges of this nature are likely to arise if we acquire businesses in the future.
Products and Services
Products and Services for Property Owners and Managers
Paid Listings. Paid listings accounted for 83.3%, 85.0% and 85.0% of our revenue in 2014, 2013 and 2012, respectively. We define a paid listing as an advertisement for a property paid via subscription or on a performance basis and displayed on one or more websites. Although listings may be displayed on multiple sites, a paid listing is counted only one time on its native HomeAway brand, the website from which the listing originated.
Subscription-based listings are purchased in advance by property owners or managers as a form of advertising to promote their vacation rentals to prospective travelers on one or more of our websites, typically for one year. On our websites that offer tiered pricing to our property owners and managers, we generally offer five pricing levels – classic, bronze, silver, gold or platinum. Property owners and managers can pay for higher search results placement by purchasing a higher subscription level or tier; however, the results may also be sorted by the traveler based on location, type of property, size or other criteria. Performance-based listings allow property owners and managers to list a property with no initial upfront fees and instead pay commissions on traveler bookings generated on our websites.
Each listing includes a set of tools for the property owner or manager which enables them to manage an availability calendar, reservations, inquiries and the content of the listing. These tools allow the property owner or manager to create the listing by uploading photographs, text descriptions or lists of amenities, a map showing
2
Table of Contents
the location of the property, and property availability, all of which can be updated throughout the term of the listing. Each listing provides travelers the ability to use email or other methods to contact property owners and managers.
ReservationManager™. ReservationManager includes tools and services to help property owners and managers run their vacation rental businesses more efficiently. ReservationManager enables property owners and managers to respond to and manage inquiries, prepare and send rental quotes and payment invoices, allow travelers to book online, including being able to enter into rental agreements with travelers online, and process online payments via credit card or eCheck. Additionally, in some countries, through ReservationManager, property owners and managers can make value-added products such as property damage protection available to travelers for purchase. ReservationManager is provided at no additional charge to property owners and managers with paid listings on HomeAway.com, VRBO.com, HomeAway.co.uk, HomeAway.de and Abritel.fr, and we expect to offer this product on other websites in the coming years. Property owners and managers that elect to process online payments using ReservationManager are subject to a transaction fee.
Enhanced Listing Features. Property owners and managers may purchase additional enhancements to their listings to increase the marketing exposure of their properties on certain of our websites, such as:
| • | Cross-Sell Listings or Bundles: For an additional fee, property owners and managers can provide their full listings on more than one of our websites, including websites in other geographies. |
| • | Featured Listings, Special Offers and Deals: Property owners and managers may purchase additional enhancements to their listings to increase the marketing exposure of their vacation rentals on one or more of the websites comprising our online marketplace. These optional enhancements may include featuring a given vacation rental in the search result pages on our websites, enhancing the presentation of their listing in search results on our websites or promoting special price offers. |
| • | Luxury Listings: Qualified vacation rental properties with a paid listing on HomeAway.com are displayed on the HomeAway Luxury website, in addition to the website from which the listing originated. For property owners and managers with exceptional vacation rental properties and services, as determined by a third party, we believe Luxury Rentals from HomeAway provides an additional marketing channel to access our audience of highly targeted, experience-focused travelers. |
Property Management Software. Property managers can use our enterprise and web-based software solutions to manage inventory, reservations, and the check-in and check-out process, as well as schedule maid service and maintenance.
Third-Party Services. Through third parties, we offer property owners and managers several ancillary products and services. These products and services include credit card merchant processing, insurance products and tax return services, all of which are integrated into ReservationManager and our other property owner and manager tools. We generally receive a percentage of the revenue generated from the sale of these third-party products and services.
Redistribution of Listings. We make selected, online bookable properties available to online travel agencies, including Expedia, Travelocity and Priceline, as well as channel partners such as FlipKey.com and PerfectPlaces.com. These properties either have a paid listing on one of our websites or are using our software products for professional property managers. We are compensated in various ways for these services including receiving a percentage of the transaction value, charging a fee to the property owner or manager for making this inventory available to these partners, or charging a fee to the channel partner.
Property Owner and Manager Community. We provide resources for property owners and managers to seek advice and obtain answers to optimize their business, including a community site, email newsletters, online forums and online seminars. Through these resources, we provide helpful information on topics such as building a better listing, methods for increasing bookings, tips on managing the vacation rental process, safeguards against
3
Table of Contents
fraud, vacation rental regulations and other relevant industry news. We also provide sample contracts, forms and checklists without charge for use by property owners and managers.
Products and Services for Travelers
The following products and services are offered to travelers at no cost.
Search and Compare. Our online marketplace provides travelers with tools to search for and filter vacation rentals based on various criteria, such as location, type of property, number of bedrooms, amenities, price, availability or keywords.
Traveler Login. Travelers are able to create accounts on certain HomeAway websites that enable them to send inquiries to property owners and managers without having to fill in their information for each inquiry. They can also benefit from other features such as the ability to save lists of favorite properties and send them to family and friends.
Trust and Security. We use a combination of technology and human review to evaluate the content of listings and to screen for inaccuracies or fraud with the goal of providing only accurate and trustworthy information to travelers. Travelers who find and book a property listed on our websites may register their trips to qualify for fraud protection under our “Basic Rental Guarantee,” which provides them with financial protection in certain circumstances up to certain limits. Additionally, we provide a secure method of communication under our “HomeAway Secure Communications” system whereby communication between owners or property managers and the travelers who want to inquire about or book their properties occurs in a secure, authenticated environment on the HomeAway system rather than a third-party email platform. This system is currently available in the United States, and we expect to release this feature to other global websites in 2015.
Listing Reviews and Ratings. Travelers are invited to submit online reviews of the vacation rentals they have rented through our websites. These reviews are intended to convey the accuracy of the listing information found on our websites.
Traveler Community. Travelers who have made at least one inquiry on our websites receive regular communications, including notices about places of interest, special offers, new listings, and an email newsletter. The newsletter is available to any traveler who agrees to receive it and offers introductions to new destinations and vacation rentals, as well as tips and useful information when staying in vacation rentals.
Mobile Websites and Applications. We provide versions of our websites formatted for web browsers on smartphones and tablets so that property owners, managers and travelers can access our websites and tools from mobile devices.
Value-Added Services
We offer the following value-added services to property owners and managers as well as to travelers.
Carefree Rental Guarantee. In addition to the “Basic Rental Guarantee” described above, which is offered at no cost to travelers, we offer a “Carefree Rental Guarantee” in the United States for a fee, which provides additional financial protection above and beyond that provided by the “Basic Rental Guarantee.”
Insurance Products. We have contracted with third-party insurance providers to offer travelers insurance products for purchase to protect against unexpected events relating to their trips, such as property damage, trip cancellation, personal liability, medical fees and legal expenses.
Tax Filing Services. To assist our property owners and managers in complying with applicable tax regulations, we contract with a third party in the United States to offer tax preparation and filing services for our property owners and managers.
4
Table of Contents
Advertising
Display Advertising. We sell Internet display advertising on the majority of our websites. Advertisers, including those offering complementary products, are able to purchase advertising positions for a fee based upon the number of impressions and the placement of the advertisement on our websites.
Sponsorships and Site Integrations. We sell sponsorships and site integrations to selected advertisers on our online marketplace. Sponsors purchase a certain number of impressions for a fee, or in the case of site integrations, pay us on a cost-per-action basis.
Competition
The market to provide listing, searching and marketing services for the vacation rental industry is highly competitive and fragmented with limited barriers to entry. Each of the services we provide to property owners, managers and travelers is currently offered by competitors. Furthermore, vacation rentals are not typically marketed exclusively through any single channel, and our listing agreements are not exclusive, potentially allowing our competitors to aggregate a set of listings similar to ours. We believe we compete primarily on the basis of the quantity, quality, and nature of the properties offered on our websites. The majority of properties offered in our marketplace reflect a whole house or property rather than a room. In addition, we benefit from the quality of the direct relationships we have with property owners and managers, the volume of travelers who visit our websites, the number of inquiries provided to our property owners and managers, the global diversity of the vacation rentals available on our websites, the quality of our websites, the tools provided to our property owners and managers, customer service, brand identity, the success of our marketing programs and price.
Our principal competitors include:
| • | other vacation and short-term rental listing websites, such as TripAdvisor.com and Airbnb.com; |
| • | websites that list both rooms to rent as well as vacation rentals, such as Airbnb.com, Wimdu.com and HouseTrip.com; |
| • | professional property managers who charge a percentage of booking revenue for their services, such as Wyndam Worldwide Corp. and InterHome, AG; |
| • | hotels that offer larger rooms and amenities common in vacation rentals, such as Hyatt Vacation Clubs and Four Seasons Resorts; |
| • | websites that aggregate listings from property managers who advertise and take bookings on the behalf of property managers, such as VacationRoost and Perfect Places, Inc. in the United States and Atraveo and eDomizil in Europe; |
| • | online travel websites, such as those operated by Expedia.com, Hotels.com, Kayak.com, Booking.com, Orbitz.com, Priceline.com and Travelocity.com, have traditionally provided comprehensive travel services and may expand or are now expanding into the vacation rental category; |
| • | timeshare exchange companies, such as Interval International, Inc. and RCI, LLC; |
| • | large Internet companies, such as craigslist, Inc., eBay Inc., Google Inc., MSN.com and Yahoo!, which provide vacation rental listing or search services in addition to a wide variety of other products or services; and |
| • | offline publishers of classified vacation rental listings, including regional newspapers and travel-related magazines. |
For a discussion of the risks attendant to the highly competitive nature of our market, see the information under the heading “Risk Factors” under the caption “The market in which we participate is highly competitive, and we may be unable to compete successfully with our current or future competitors.”
5
Table of Contents
Seasonality
Property owners and managers tend to buy subscription listings when travelers are most likely to make vacation plans. The timing primarily depends on whether travelers are taking a winter or summer vacation and tends to vary by country. Historically, we have experienced the highest level of new and renewed subscription listings in the first quarter of the year, which is typically when travelers are making plans for summer vacations in the United States and Europe. The lowest level of new subscription listings and renewals has occurred in the third quarter. By the fourth quarter, we typically see property owners and managers of winter vacation destinations list and renew subscriptions in time to meet the needs of travelers planning those trips. Other vacation areas outside of the United States and Europe, such as Australia and Brazil, also have seasonality, which may not be reflected in the same quarters.
Seasonality may not be seen as prominently in our revenue due to the ratable recognition of subscription listing revenue. However, seasonality results in higher cash inflows during the first quarter as most subscriptions are annual and fully paid at the time of purchase. As performance-based listings grow, the seasonality of those commission-based transactions may result in higher revenues in the summer and winter vacation months. We also experience seasonality in the number of visitors to our websites, with the first quarter having the highest number of visitors. This is reflected in our quarterly financial results when we add customer service staff, hosting capabilities and increase marketing to support the increase.
Research and Development
We have developed proprietary systems architecture to create, maintain and operate our websites. This technology consists of internal development by our staff of designers, developers and engineers and software acquired or licensed from outside developers and companies. Our systems are designed to serve property owners, managers and travelers in an automated and scalable fashion. Our product development expenses were $77.1 million, $58.2 million and $43.2 million in the years ended December 31, 2014, 2013 and 2012, respectively.
Technology and Infrastructure
Our websites are hosted using a combination of third-party data centers distributed globally across multiple regions. Our systems architecture has been designed to manage increases in traffic on our websites through the addition of server and network hardware without making software changes. Our third-party data centers provide our online marketplace with scalable and redundant Internet connectivity and redundant power and cooling to our hosting environments. All of our third-party data centers provide synchronized copies of their databases on a daily basis to our offsite backup location in the United States. We use security methods to ensure the integrity of our networks and protection of confidential data collected and stored on our servers, and we have developed and use internal policies and procedures to protect the personal information of our property owners, managers and travelers using our websites that we collect and use as part of our normal operations. Access to our networks, and the servers and databases on which confidential data is stored, is protected by industry standard firewall technology. We test for unauthorized external access to the network daily using automated services and conduct periodic audits performed by outsourced security consultants. Physical access to our servers and related equipment is secured by limiting access to the data center to operations personnel only. Costs associated with our web hosting operation are included in cost of revenues.
Intellectual Property
Our intellectual property includes the content of our websites, our registered domain names, our registered and unregistered trademarks and our patent applications. We believe that our intellectual property is an essential asset of our business and that our registered domain names and our technology infrastructure currently give us a competitive advantage in the online market for vacation rental listings. We rely on a combination of trademark, copyright and trade secret laws in the United States, Australia, Brazil, Canada, Europe, Latin America, New Zealand and Singapore, as well as contractual provisions, to protect our proprietary technology and our
6
Table of Contents
brands. We currently have trademarks registered or pending in Australia, Canada, Europe, Mexico, New Zealand, South America and the United States for our name and certain words and phrases that we use in our business. We also rely on copyright laws to protect the appearance and design of our sites and applications, although to date we have not registered for copyright protection on any particular content. We have registered numerous Internet domain names related to our business in order to protect our proprietary interests. As of December 31, 2014 we had 20 patent applications and no issued patents. We also enter into confidentiality and invention assignment agreements with our employees and consultants and seek to control access to and distribution of our proprietary information in a commercially prudent manner. The efforts we have taken to protect our intellectual property may not be sufficient or effective, and, despite these precautions, it may be possible for other parties to copy or otherwise obtain and use the content of our websites or our brand names without authorization. Please see the information under the heading “Risk Factors” under the caption “If we do not adequately protect our intellectual property, our ability to compete could be impaired.”
Employees
We employed 1,780 full-time and part-time employees at December 31, 2014. Additionally, we use independent contractors and temporary personnel to supplement our workforce, particularly on a seasonal basis. Although we have works councils and statutory employee representation obligations in certain countries, our employees are not represented by a labor union and we consider our employee relations to be good. Competition for qualified personnel in our industry has historically been intense, particularly for software engineers, developers and other technical staff.
Segments
We operate as one operating segment consisting of products and services related to our online marketplace of rental listing websites. For a discussion of revenue, net income and total assets, see Part II, Item 8 of this Annual Report on Form 10-K.
Geographic Information
Financial information about geographic areas is set forth in Note 14 of the Notes to Consolidated Financial Statements included in Part II, Item 8 of this Annual Report on Form 10-K. For a discussion of the risks attendant to foreign operations, see the information under the heading “Risk Factors” under the caption “Our long-term success depends, in part, on our ability to expand our property owner, manager and traveler bases outside of the United States and, as a result, our business is susceptible to risks associated with international operations.”
Available Information
Our Internet address is www.HomeAway.com. Our investor relations website is located at http://investors.HomeAway.com. We make available free of charge on our investor relations website under the headings “Financial Information” and “SEC Filings” our Annual Reports on Form 10-K, Quarterly Reports on Form 10-Q, Current Reports on Form 8-K and amendments to those reports as soon as reasonably practicable after such materials are electronically filed with (or furnished to) the SEC. Information contained on our websites is not incorporated by reference into this Annual Report on Form 10-K. In addition, the public may read and copy materials we file with the SEC at the SEC’s Public Reference Room at 100 F Street, NE, Washington, DC 20549. The public may obtain information on the operation of the Public Reference Room by calling the SEC at 1-800-SEC-0330. In addition, the SEC maintains an Internet site, www.sec.gov, that includes filings of and information about issuers that file electronically with the SEC.
7
Table of Contents
Risks Related to Our Business
The following risk factors and other information included in this Annual Report on Form 10-K should be carefully considered. The risks and uncertainties described below are not the only ones we face. Additional risks and uncertainties not presently known to us or that we currently believe are immaterial may also impair our business, results of operations or financial condition.
If we are unable to attract and maintain a critical mass of vacation rental listings and travelers, whether due to competition or other factors, our marketplace will become less valuable to property owners and managers and to travelers, and our revenue and net income could decrease materially.
Most of our revenue is generated when owners or managers of vacation rentals pay us listing fees, by subscription or a booking commission, to list and market vacation rentals to travelers who visit our online marketplace. Accordingly, our success primarily depends on our ability to attract owners, managers, travelers and advertisers to our marketplace. If property owners and managers choose not to market their vacation rentals through our websites, or instead list them with a competitor, we may be unable to offer a sufficient supply and variety of vacation properties to attract travelers to our websites. Similarly, our volume of new listings and listing renewals may suffer if we are unable to attract travelers to our websites. If we are unable to attract owners and travelers to our websites, advertisers may not purchase display advertising on our websites. As a result of any of these events, the perceived usefulness of our online marketplace is likely to decline, and our revenue and net income could decrease materially.
Our business depends substantially on property owners and managers renewing their subscription listings. Because we recognize revenue over the term of the applicable agreement, the lack of subscription-based listing renewals may not immediately be reflected in our operating results.
Our business depends substantially on property owners and managers renewing their subscription listings. Any decline in our subscription listing renewals could harm our operating results. Property owners and managers generally market their vacation rentals on our websites pursuant to prepaid annual subscription listings with no obligation to renew. We may be unable to predict future listing renewal rates accurately, and our renewal rates may decline materially or fluctuate as a result of a number of factors. These factors include property owners’ decisions to sell or to cease renting their properties, their decisions to use the services of our competitors, or their dissatisfaction with our pricing, products, services or websites. Property owners and managers may not establish or renew subscription listings if we cannot generate visits from large numbers of travelers seeking, inquiring about or booking vacation rentals.
In addition, from time to time we make changes that impact our customers, including changes to listings’ available features, the software tools we offer owners and managers in their operations, our pricing, and the algorithms that determine the listings’ ranking in search query results. While such changes may be intended to improve customer satisfaction, there can be no guarantee that the changes will perform as expected or that property owners and managers will react positively and continue to renew their listings. For example, we offer different subscription levels on many of our websites and property owners and managers may not be satisfied with the subscription level they purchase. We also offer on certain websites the ability for property owners and managers to list on a commission basis without paying a subscription fee. Subscription-based customers may choose not to renew their subscriptions and list on a commission basis, which could result in decreased revenue. If property owners and managers do not renew their subscription listings at the same level or at all, or if we are forced to offer renewals on less favorable terms, our revenue could decline and our business could suffer.
We recognize subscription listing revenue ratably over the term of the applicable listing agreement, and the majority of our quarterly revenue represents revenue attributable to listings entered into during previous quarters. As a result, the effect of significant downturns in new or renewed subscription listings in a particular quarter will
8
Table of Contents
not be fully reflected in our results of operations until future periods. Our business model also makes it difficult for any rapid increase in new or renewed listings to increase our revenue in any one period because revenue from new and renewed subscription listings must be recognized over the applicable listing term.
Moreover, some of our property owners and managers may live in states or countries that give subscribers the right to cancel their subscriptions prior to expiration and receive refunds for the unused portions of their subscriptions. Termination of subscriptions in this manner may adversely affect our cash flows.
Our quarterly financial results and key operating metrics are subject to fluctuations. As a result, we could fail to meet our projections or the expectations of analysts or investors, which could cause our stock price to decline.
Our revenue, expenses, operating results and cash flows, as well as our key operating metrics, have fluctuated from quarter to quarter in the past and are likely to continue to do so in the future. These fluctuations are due to, or may result from, many factors, some of which are outside of our control and many of which are difficult to predict. These factors include:
| • | the quantity of vacation rental listings on our websites; |
| • | advertising costs for paid search keywords and other online or broad reach advertising and marketing initiatives; |
| • | the amount and timing of financing activities, operating expenses and capital expenditures; |
| • | changes in cash flow due to the seasonal nature of our listing renewals and new listing acquisition; |
| • | changes in cash flow due to customers purchasing commission-based listings, the timing and quantity of which are difficult to predict; |
| • | changes in revenue due to the irregular timing of commissions earned on our performance-based listings; |
| • | economic instability abroad and fluctuations in exchange rates; |
| • | changes by major online search engine companies in their search algorithms, which could increase expenses related to marketing and search engine optimization, or could cause our websites’ positions in search results to suffer; |
| • | the timing of revenue and expenses related to the licensing, development, acquisition and integration of technologies, products, services or businesses, including expenses for such strategic business acquisitions which may not be finally completed; |
| • | the timing and success of changes in our pricing or services; |
| • | the introduction and performance of new products or services; |
| • | the introduction of new products or services by our competitors; |
| • | development of or increases in fraud impacting our property owners and managers and travelers, including theft of online identities through phishing or other system security breaches; |
| • | declines or disruptions in the travel industry, particularly in regions where we generate substantial revenue; |
| • | changes in the timing of holidays or other vacation events; |
| • | litigation and settlement costs, including unforeseen attorneys’ fees and costs; |
| • | new accounting pronouncements and changes in accounting standards or practices, particularly any affecting the recognition of listing revenue or accounting for mergers and acquisitions; and |
9
Table of Contents
| • | new laws or regulations, or interpretations of existing laws or regulations, that harm our business models or restrict the vacation rental industry, the Internet, e-commerce, online payments, or online communications. |
Fluctuations in our quarterly operating results may, particularly if unforeseen, cause us to miss any projections we may have provided or may lead analysts or investors to change their valuation of our stock. In addition, such fluctuations may cause us to face short-term liquidity issues, impact our ability to retain or attract key personnel or cause other unanticipated issues. Any of these effects could cause our stock price to decline. As a result of the potential variability in our quarterly revenue and operating results, we believe that quarter-to-quarter comparisons of our revenue and operating results may not be meaningful and the results of any one quarter should not be relied upon as an indication of future performance.
If we are unable to continue to drive visitors to our websites from search engines, then traffic to our websites could decrease, which could negatively impact transactions on our websites and therefore cause our revenue to decrease.
Many visitors find our websites by searching for vacation rental information through Internet search engines. A critical factor in attracting visitors to our websites is how prominently we are displayed in response to search queries. Accordingly, we utilize search engine marketing, or SEM, as a means to provide a significant portion of our visitor acquisition. SEM includes both paid visitor acquisition (on a cost-per-click basis) and unpaid visitor acquisition, which is often referred to as organic search.
One method we employ to acquire visitors via organic search is commonly known as search engine optimization, or SEO. SEO involves developing our websites in order to rank highly in relevant search queries. In addition to SEM and SEO, we may also utilize other forms of marketing to drive visitors to our websites, including branded search, display advertising and email marketing.
The various search engine providers, such as Google and Bing, employ proprietary algorithms and other methods for determining which websites are displayed for a given search query and how highly websites rank. Search engine providers may change these methods in a way that may negatively affect the number of visitors to our websites and may do so without public announcement or detailed explanation. Therefore, the success of our SEO and SEM strategy depends, in part, on our ability to anticipate and respond to such changes in a timely and effective manner.
In addition, websites must comply with search engine guidelines and policies. These guidelines and policies are complex and may change at any time. If we fail to follow such guidelines and policies properly, the search engine may cause our content to rank lower in search results or could remove the content altogether. If we fail to understand and comply with these guidelines and policies and ensure our websites’ compliance, our SEO and SEM strategy may not be successful.
If we are listed less prominently or fail to appear in search result listings for any reason, including as a result of our failure to successfully execute our SEO and SEM strategy, it is likely that we will acquire fewer visitors to our websites. Fewer visitors to our websites could lead to property owners and managers becoming dissatisfied with our websites, as well as fewer travelers inquiring and booking through our websites, either or both of which could adversely impact our revenue. We may not be able to replace this traffic in a cost-effective manner from other channels, such as cost-per-click SEM or display or other advertising, or even at all. Any attempt to replace this traffic through other channels may increase our sales and marketing expenditures, which could adversely affect our operating results.
Unfavorable changes in, or interpretations of, government regulations or taxation of the evolving vacation rental, Internet and e-commerce industries could harm our operating results.
We operate in markets throughout the world, in jurisdictions which have various regulatory and taxation requirements that can affect our operations or regulate the rental activity of property owners and managers.
10
Table of Contents
Compliance with laws and regulations of different jurisdictions imposing different standards and requirements is very burdensome because each region in which we operate has different regulations with respect to licensing and other requirements for the listing of vacation rentals. Our online marketplace is accessed by property owners, managers and travelers in multiple states and foreign jurisdictions. Our business efficiencies and economies of scale depend on generally uniform treatment of property owners, managers and travelers across all jurisdictions in which we operate. Compliance requirements that vary significantly from jurisdiction to jurisdiction impose an added cost to our business and increased liability for compliance deficiencies. In addition, laws or regulations that may harm our business could be adopted, or reinterpreted in a manner that affects our activities, including but not limited to the regulation of personal and consumer information and real estate licensing requirements. Violations or new interpretations of these laws or regulations may result in penalties, negatively impact our operations and damage our reputation and business.
In addition, since we began our operations in 2005, there have been, and continue to be, regulatory developments that affect the vacation rental industry and the ability of companies like us to list those vacation rentals online. For example, some municipalities have adopted ordinances that limit the ability of property owners and managers to rent certain properties for fewer than 30 consecutive days and other cities may introduce similar regulations. Some cities also have fair housing or other laws governing whether and how properties may be rented, which they assert apply to vacation rentals. Many homeowners, condominium and neighborhood associations have adopted rules that prohibit or restrict short-term vacation rentals. In addition, many of the fundamental statutes and regulations that impose taxes or other obligations on travel and lodging companies were established before the growth of the Internet and e-commerce, which creates a risk of these laws being used in ways not originally intended that could burden property owners and managers or otherwise harm our business. These and other similar new and newly interpreted regulations could increase costs for, or otherwise discourage, owners and managers from listing on our websites, which could harm our business and operating results.
From time to time, we may become involved in challenges to, or disputes with government agencies regarding, these regulations. For example, some government agencies have asked us directly to comply with their regulations and provide owner and manager data to assist them in their enforcement and audit efforts. There can be no assurance that we will be successful in defending against the application of these laws and regulations. Further, if we were required to comply with regulations and government requests that negatively impact our relations with property owners, managers and travelers, our business, operations and financial results could be adversely impacted.
Additionally, new, changed, or newly interpreted or applied tax laws, statutes, rules, regulations or ordinances could increase our property owners’ and managers’ and our compliance, operating and other costs. This, in turn, could deter property owners and managers from renting their vacation properties, negatively affect our new listings and subscription renewals, or increase costs of doing business. Any or all of these events could adversely impact our business and financial performance.
Furthermore, as we expand or change the products and services that we offer or the methods by which we offer them, we may become subject to additional legal regulations, tax requirements or other risks. Regulators may seek to impose regulations and requirements on us even if we utilize third parties to offer the products or services. These regulations and requirements may apply to payment processing, insurance products or the various other products and services we may now or in the future offer or facilitate through our marketplace. Whether we comply with or challenge these additional regulations, our costs may increase and our business may otherwise be harmed.
If we are not able to maintain and enhance our HomeAway brand and the brands associated with each of our websites, our reputation and business may suffer.
It is critical for us to maintain and enhance our brand identity in order to attract and retain property owners, managers and travelers. The successful promotion of our brands will depend largely on our marketing and public relations efforts. We expect that the promotion of our brands will require us to make substantial investments, and,
11
Table of Contents
as our market becomes more competitive, these branding initiatives may become increasingly difficult and expensive. In addition, we may not be able to successfully build our HomeAway brand identity in the United States and overseas without losing value associated with, or decreasing the effectiveness of, our other brand identities. If we do not successfully maintain and enhance our brands, we could lose traveler traffic, which could, in turn, cause property owners and managers to terminate or elect not to renew their listings with us. In addition, our brand promotion activities may not be successful or may not yield revenue sufficient to offset their cost, which could adversely affect our reputation and business.
Our long-term success depends, in part, on our ability to expand our property owner, manager and traveler bases outside of the United States and, as a result, our business is susceptible to risks associated with international operations.
As our operations have expanded, we have acquired businesses or established offices around the world. As of December 31, 2014, we maintain offices in the United States, Europe, South America, Australia and Asia and operate websites in several additional countries and regions. We have limited operating and e-commerce experience in many foreign jurisdictions and are making significant investments to build our international operations. We plan to continue our efforts to expand globally, including acquiring international businesses and conducting business in jurisdictions where we do not currently operate, including increasing our focus on the Asia Pacific region. Managing a global organization is difficult, time consuming and expensive and any international expansion efforts that we undertake may not be profitable in the near or long term or otherwise be successful. In addition, conducting international operations subjects us to risks that we generally do not face in the United States. These risks include:
| • | the cost and resources required to localize our services, which requires the translation of our websites and their adaptation for local practices and legal and regulatory requirements; |
| • | adjusting the products and services we provide in foreign jurisdictions, as needed, to better address both the needs of local owners and travelers, and the threats of local competitors; |
| • | being subject to foreign laws and regulations, including those laws governing Internet activities, email messaging, collection and use of personal information, ownership of intellectual property, taxation and other activities important to our online business practices, which may be less developed, less predictable, more restrictive, and less familiar, and which may adversely affect financial results in certain regions; |
| • | competition with companies that understand the local market better than we do or who have pre-existing relationships with property owners, managers and travelers in those markets; |
| • | legal uncertainty regarding our liability for the transactions and content on our websites, including online bookings, property listings and other content provided by property owners and managers, including uncertainty resulting from unique local laws or a lack of clear precedent of applicable law; |
| • | lack of familiarity with and the burden of complying with a wide variety of other foreign laws, legal standards and foreign regulatory requirements, including invoicing, data collection and storage, financial reporting and tax compliance requirements, which are subject to unexpected changes; |
| • | laws and business practices that favor local competitors or prohibit or limit foreign ownership of certain businesses; |
| • | challenges associated with joint venture relationships and minority investments; |
| • | adapting to variations in foreign payment forms; |
| • | difficulties in managing and staffing international operations and establishing or maintaining operational efficiencies; |
| • | difficulties in establishing and maintaining adequate internal controls and security over our data and systems; |
12
Table of Contents
| • | currency exchange restrictions and fluctuations in currency exchange rates; |
| • | potentially adverse tax consequences, which may be difficult to predict, including the complexities of foreign value added tax systems and restrictions on the repatriation of earnings; |
| • | increased financial accounting and reporting burdens and complexities and difficulties in implementing and maintaining adequate internal controls; |
| • | political, social and economic instability abroad, war, terrorist attacks and security concerns in general; |
| • | the potential failure of financial institutions internationally; |
| • | reduced or varied protection for intellectual property rights in some countries; and |
| • | higher telecommunications and Internet service provider costs. |
Operating in international markets also requires significant management attention and financial resources. We cannot guarantee that our international expansion efforts in any or multiple territories will be successful. The investment and additional resources required to establish operations and manage growth in other countries may not produce desired levels of revenue or profitability and could instead result in increased costs.
The market in which we participate is highly competitive, and we may be unable to compete successfully with our current or future competitors.
The market to provide listing, search and marketing services for the vacation rental industry is very competitive and highly fragmented. In addition, the barriers to entry are low and new competitors may enter. All of the services that we provide to property owners, managers and travelers, including listing and search, are provided separately or in combination by current or potential competitors. Our competitors may adopt aspects of our business model, which could reduce our ability to differentiate our services. Additionally, current or new competitors may introduce new business models or services that we may need to adopt or otherwise adapt to in order to compete, which could reduce our ability to differentiate our business or services from those of our competitors. Furthermore, properties in the vacation rental industry are not typically marketed exclusively through any single channel, and our listing agreements are not typically exclusive. Accordingly, our competitors could aggregate a set of listings similar to ours. Increased competition could result in a reduction in revenue, rate of new listing acquisition, existing listings or market share.
There are thousands of vacation rental listing websites that compete directly with us for listings, travelers, or both, such as HouseTrips.com, Booking.com, Airbnb, @Leisure, InterHome, TripAdvisor and Wyndham Worldwide. Many of these competitors offer free or heavily discounted listings or focus on a particular geographic location or a specific type of rental property. Some of them also aggregate property listings obtained through various sources, including the websites of property managers some of whom also market their properties on our websites.
Competitors also operate websites directed at the wider fragmented travel lodging market, such as Airbnb (worldwide) and Wimdu (worldwide), by listing either rooms or the owner’s primary home. These properties increase both the number of rental opportunities available to travelers and the competition for the attention of the traveler. Some vacation rental property owners and managers also list on these websites, and consequently these companies currently compete with us to some extent.
We also compete with online travel agency websites, such as Expedia, Hotels.com, Kayak, Priceline, Booking.com, Orbitz and Travelocity, which have traditionally provided comprehensive travel services and some of whom are now expanding into the vacation rental category. We also compete with large Internet search companies, such as craigslist, eBay, Google, MSN.com and Yahoo!, which provide listing or advertising services in addition to a wide variety of other products or services. In addition, some competitors, such as Perfect Places, Inc. and VacationRoost, Inc. in the United States and Atraveo and eDomizil in Europe, predominately serve the
13
Table of Contents
professional property manager marketplace, and therefore have the ability to create more products and features targeted to property managers. Hotels, corporate travel providers, travel metasearch engines, travel content aggregators, mobile platform travel applications, social media websites, and even mobile computing hardware providers all also have the potential to increase their competitive presence in the areas of our business as well.
We believe we compete primarily on the basis of the quantity and quality of our listings, the quality of the direct relationships we have with property owners and managers, the volume of travelers who visit our websites, the number of inquiries provided to our property owners and managers, the global diversity of the vacation rentals available on our websites, the quality of our websites, the tools provided to our property owners and managers to assist them with their business, customer service, brand identity, the success of our marketing programs, and price. If current or potential property owners, managers or travelers choose to use any of these competitive offerings in lieu of ours, our revenue could decrease and we could be required to make additional expenditures to compete more effectively. Any of these events or results could harm our business, operating results and financial condition.
In addition, some of our current or potential competitors are larger and have more resources than we do. Many of our current and potential competitors enjoy substantial competitive advantages, such as greater name recognition in their markets, longer operating histories and larger marketing budgets, as well as substantially greater financial, technical and other resources. In addition, our current or potential competitors may have access to larger property owner, manager or traveler bases. As a result, our competitors may be able to respond more quickly and effectively than we can to new or changing opportunities, technologies, standards or owner, manager or traveler requirements. Furthermore, because of these advantages, existing and potential owners, managers and travelers might accept our competitors’ offerings, even if they may be inferior to ours. For all of these reasons, we may not be able to compete successfully against our current and future competitors.
If the businesses we have acquired or invested in do not perform as expected or we are unable to effectively integrate acquired businesses, our operating results and prospects could be harmed.
As of December 31, 2014, we have acquired 22 businesses and currently have equity investments in two companies. The businesses we have acquired or invested in may not perform as well as we expect. Failure to manage and successfully integrate recently acquired businesses and technologies could harm our operating results and our prospects. If the companies we have invested in do not perform well, our investments could become impaired and our financial results could be negatively impacted.
Our mergers and acquisitions involve numerous risks, including the following:
| • | difficulties in integrating and managing the combined operations, technologies, technology platforms and products of the acquired companies and realizing the anticipated economic, operational and other benefits in a timely manner, which could result in substantial costs and delays or other operational, technical or financial problems; |
| • | legal or regulatory challenges or post-acquisition litigation, which could result in significant costs or require changes to the businesses or unwinding of the transaction; |
| • | failure of the acquired company to achieve anticipated revenue, earnings or cash flow; |
| • | diversion of management’s attention or other resources from our existing business; |
| • | our inability to maintain the key customers and business relationships, and the reputations of acquired businesses; |
| • | uncertainty resulting from entering markets in which we have limited or no prior experience or in which competitors have stronger market positions; |
| • | our dependence on unfamiliar affiliates and partners of acquired businesses; |
14
Table of Contents
| • | unanticipated costs associated with pursuing acquisitions; |
| • | liabilities of acquired businesses, which may not be disclosed to us or which may exceed our estimates, including liabilities relating to non-compliance with applicable laws and regulations, such as data protection and privacy controls; |
| • | difficulties in assigning or transferring to us or our subsidiaries intellectual property licensed to companies we acquired; |
| • | difficulties in maintaining our internal standards, controls, procedures and policies including financial reporting requirements of the Sarbanes-Oxley Act of 2002 and extending these controls to acquired companies; |
| • | potential loss of key employees of the acquired companies; |
| • | difficulties in complying with antitrust and other government regulations; |
| • | challenges in integrating and auditing the financial statements of acquired companies that have not historically prepared financial statements in accordance with U.S. generally accepted accounting principles; and |
| • | potential accounting charges to the extent intangibles recorded in connection with an acquisition, such as goodwill, trademarks, customer relationships or intellectual property, are later determined to be impaired and written down in value. |
Moreover, we rely heavily on the representations and warranties provided to us by the sellers of acquired companies, including as they relate to creation, ownership and rights in intellectual property, existence of open source software and compliance with laws and contractual requirements. If any of these representations and warranties are inaccurate or breached, such inaccuracy or breach could result in costly litigation and assessment of liability for which there may not be adequate recourse against such sellers, in part due to contractual time limitations and limitations of liability.
If we are unable to introduce new or upgraded products, services or features that travelers or property owners and managers recognize as valuable, we may fail to drive additional travelers to our websites or retain existing and attract new property owners and managers. Our efforts to develop new and upgraded services and products could require us to incur significant costs.
In order to continue to attract travelers to our online marketplace and retain existing and attract new property owners and managers, we will need to continue to invest in the development of new products, services and features that both add value for travelers, property owners and managers and differentiate us from our competitors. The success of new products, services and features depends on several factors, including the timely completion, introduction and market acceptance of the product, service or feature. If travelers, property owners or managers do not recognize the value of our new services or features, they may choose not to utilize or list on our online marketplace.
Attempting to develop and deliver these new or upgraded products, services or features involves inherent hazards and difficulties, and is costly. Efforts to enhance and improve the ease of use, responsiveness, functionality and features of our existing websites have inherent risks, and we may not be able to manage these product developments and enhancements successfully. We cannot assure that we will succeed or that new or upgraded products, services or features will work as intended or provide value. In addition, some new or upgraded products, services or features may be difficult for us to market and may also involve unfavorable pricing. Even if we succeed, we cannot guarantee that our property owners and managers will respond favorably.
In addition to developing our own improvements, we may choose to license or otherwise integrate applications, content and data from third parties. The introduction of these improvements imposes costs on us and creates a risk that we may be unable to continue to access these technologies and content on commercially reasonable terms, or at all.
15
Table of Contents
We may be unable to effectively manage our growth.
Since our inception, we have experienced rapid growth. As our operations have expanded, we have grown from 87 employees at December 31, 2005 to 1,780 employees at December 31, 2014, of whom 720 were located outside the United States. This includes employees of entities for which we have a controlling interest. Our business is becoming increasingly complex, especially in light of the continued rapid evolution of our industry and e-commerce, and our reliance on multiple websites throughout the world. This complexity and our rapid growth have demanded, and will continue to demand, substantial resources and attention from our management. We expect to continue to increase headcount and to hire more specialized personnel in the future as we grow our business. We will need to continue to hire, train and manage additional qualified website developers, software engineers, client and account services personnel, and sales and marketing staff and improve and maintain our technology to properly manage our growth. If our new hires perform poorly, if we are unsuccessful in hiring, training, managing and integrating these new employees or if we are not successful in retaining our existing employees, our business may be harmed.
Further, to accommodate our expected growth we must add new hardware and software and improve and maintain our technology, systems and network infrastructure. Failure to effectively upgrade our technology or network infrastructure to support the expected increased listing and traveler traffic volume could result in unanticipated system disruptions, slow response times or poor experiences for property owners, managers or travelers. To manage the expected growth of our operations and personnel and to continue to support our public company financial reporting and internal control requirements, we will need to continue to improve our transaction processing and reporting, operational and financial systems, procedures and controls. These improvements will be particularly challenging if we acquire new operations with different systems. Our current and planned personnel, systems, procedures and controls may not be adequate to support our future operations. If we are unable to expand our operations and hire additional qualified personnel in an efficient manner, it could adversely affect property owner, manager, traveler or advertiser satisfaction and revenue and operating income as a result.
We have a relatively limited operating history and we operate in a rapidly evolving industry, which make it difficult to evaluate our current business and future prospects. If we fail to predict the manner in which our business will perform or how the market will develop, our business and prospects may suffer materially.
We began our operations in February 2005. Our relatively limited operating history, together with our rapidly changing industry, may make it difficult to evaluate our current business and our future prospects. We have encountered and will continue to encounter risks and difficulties frequently experienced by growing companies in rapidly changing industries. These include challenges in accurate financial planning and forecasting as we develop new products or strategic plans, such as our online booking initiative and value added services like insurance and property damage protection and payment processing capabilities, with little or no historical reference as a basis for such planning and forecasting. Our business and prospects should be considered in light of the risks and difficulties we may encounter as a company operating in a highly competitive environment where changes to our business, plans, and products may be required to respond to such changes.
In addition, the market for online vacation rentals is relatively new and, in many geographies, is unproven with little data or research available regarding the market and industry. It is uncertain whether the vacation rental market in many territories where we do business will continue to develop or if our services will achieve and sustain a level of demand and market acceptance sufficient for us to generate revenue, net income and cash flow growth, at anticipated levels or at all. Even in territories where we currently do business, we may need to focus on or offer different types of products and services in order to remain competitive. Our success will depend to a substantial extent on the willingness of property owners and managers to use commercial online rental property listing services. Some property managers have developed and use their own proprietary online listing services and, therefore, may be reluctant or unwilling to use our websites to market their properties. Furthermore, some travelers and property owners and managers may be reluctant or unwilling to use online listing services because of concerns regarding the security of data, the potential for fraudulent activity, including phishing, or the
16
Table of Contents
integrity of the online marketplace. If property owners and managers do not perceive the benefits of marketing their properties online, then our market may not develop as we expect, or it may develop more slowly than we expect, either of which could significantly harm our business and operating results. Moreover, our success will depend on travelers’ use of our online marketplace to search, locate and rent vacation rentals, which will depend on their willingness to use the Internet and their belief in the integrity of our websites. In addition, since we operate in unproven and unstudied markets, we have limited insight into trends that may develop in those markets and may affect our business. We may make errors in predicting and reacting to other relevant business trends, which could harm our business.
Changes in our effective tax rate could harm our future operating results.
We are subject to federal and state income taxes in the United States and in various foreign jurisdictions. Our provision for income taxes and our effective tax rate are subject to volatility and could be adversely affected by several circumstances, including:
| • | earnings being lower than anticipated in countries that have lower tax rates and higher than anticipated in countries that have higher tax rates; |
| • | effects of certain non-tax deductible expenses, including those arising from the requirement to expense stock options; |
| • | changes in the valuation of our deferred tax assets and liabilities; |
| • | expiration of or lapses in the research and development tax credit laws; |
| • | transfer pricing adjustments, including the effect of acquisitions on our intercompany research and development cost sharing arrangement and legal structure; |
| • | adverse outcomes resulting from any tax audit; |
| • | our ability to utilize our net operating losses and other deferred tax assets; and |
| • | changes in accounting principles or changes in tax laws and regulations, or the application of the tax laws and regulations, including possible U.S. changes to the taxation of earnings of our foreign subsidiaries, the deductibility of expenses attributable to foreign income, or the foreign tax credit rules. |
Significant judgment is required in the application of accounting guidance relating to uncertainty in income taxes. If tax authorities challenge our tax positions and any such challenges are settled unfavorably, it could adversely impact our provision for income taxes.
We are exposed to fluctuations in currency exchange rates.
Because we conduct a significant portion of our business outside the United States but report our results in U.S. dollars, we face exposure to adverse movements in currency exchange rates, which may cause our revenue and operating results to differ materially from expectations. In addition, fluctuation in our mix of U.S. and foreign currency denominated transactions may contribute to this effect as exchange rates vary. Moreover, as a result of these exchange rate fluctuations, revenue, cost of revenue, operating expenses and other operating results may differ materially from expectations when translated from the local currency into U.S. dollars upon consolidation. For example, if the U.S. dollar strengthens relative to foreign currencies our non-U.S. revenue would be adversely affected when translated into U.S. dollars. Conversely, a decline in the U.S. dollar relative to foreign currencies would increase our non-U.S. revenue when translated into U.S. dollars. Revenue in the year ended December 31, 2014 was negatively impacted by foreign currency translation of approximately $0.5 million, while revenue in the year ended December 31, 2013 was positively impacted by foreign currency translation of approximately $1.7 million. In addition, we maintain intercompany loans and payables which are subject to translation losses due to foreign exchange fluctuation. We may enter into hedging arrangements in order to manage foreign currency exposure but such activity may not completely eliminate fluctuations in our operating results.
17
Table of Contents
Our business depends on retaining and attracting capable management and operating personnel.
Our success depends in large part on our ability to attract and retain high-quality management and operating personnel, as well as skilled technical and marketing personnel, who are in high demand and are often subject to competing offers. Competition for qualified employees is intense in our industry, and the loss of even a few qualified employees, or an inability to attract, retain and motivate additional highly skilled employees required for the planned expansion of our business could harm our operating results and impair our ability to grow. To attract and retain key personnel, we use various measures, including an equity incentive program and incentive bonuses for executive officers and other key employees. However, some employees have been granted stock options with an exercise price that is or may become less than the market price, which reduces the incentive value of these grants. While we attempt to provide additional or different incentive compensation tools to mitigate this impact, the measures we employ to attract and maintain key personnel may not be effective enough to enable us to attract and retain the personnel we require to operate our business effectively.
If we fail to protect confidential information against security breaches, or if property owners, managers or travelers are reluctant to use our online marketplace because of privacy or security concerns, we might face additional costs, and activity on our websites could decline.
We collect and use personally identifiable information of property owners, managers and travelers in the operation of our business. Our systems may be vulnerable to computer viruses or physical or electronic break-ins that our security measures may not detect. Anyone that is able to circumvent our security measures could misappropriate confidential or proprietary information, cause interruption in our operations, damage our computers or those of our users, or otherwise damage our reputation and business. We may need to expend significant resources to protect against security breaches or to address problems caused by breaches. Security breaches of our systems, or even the systems of third parties we rely upon, such as credit card processors, could damage our reputation and expose us to litigation and possible liability under various laws and regulations. In addition, industry-wide incidents, or incidents specific to us, could deter people from using our online marketplace. Concern among property owners, managers and travelers regarding our use of personal information collected on our websites could keep them from using, or continuing to use, our online marketplace.
There are risks of security breaches both on and off our systems as we increase the types of technology we use to operate our marketplace, such as mobile applications. New and evolving technology systems and platforms may involve security risks that are difficult to predict and adequately guard against. In addition, third parties that process credit card transactions between us and property owners and managers maintain personal information collected from them. Such information could be stolen or misappropriated, and we could be subject to liability as a result. Further, property owners and managers may develop a lack of confidence in these third parties or in their ability to securely conduct credit card transactions on our websites or the Internet in general, which could adversely impact our business, revenue and operating results. Our property owners, managers and travelers may be harmed by such breaches and we may in turn be subject to costly litigation or regulatory compliance costs, and harm to our reputation and brand. Moreover, some property owners, managers and travelers may cease using our marketplace altogether.
The laws of some states and countries require businesses that maintain personal information about their residents in electronic databases to implement reasonable measures to keep that information secure. Our practice is to encrypt all sensitive information, but we do not know whether our current practice will be challenged under these laws. In addition, under certain of these laws, if there is a breach of our computer systems and we know or suspect that unencrypted personal data has been stolen, we are required to inform any user whose data was stolen, which could harm our reputation and business. Complying with the applicable notice requirements in the event of a security breach could result in significant costs. We may also be subject to contractual claims, investigation and penalties by regulatory authorities, and claims by persons whose information was disclosed.
Compounding these legal risks, many states and countries have enacted different and often contradictory requirements for protecting personal information collected and maintained electronically. Compliance with these
18
Table of Contents
numerous and contradictory requirements of is particularly difficult for us because we collect personal information from users in multiple jurisdictions. While we intend to comply fully with these laws, failure to comply could result in legal liability, cause us to suffer adverse publicity and lose business, traffic and revenue. If we were required to pay any significant amount of money in satisfaction of claims under these or similar laws, or if we were forced to cease our business operations for any length of time as a result of our inability to comply fully, our business, operating results and financial condition could be adversely affected.
In addition, third parties may target users of our websites directly with attempts to breach the security of their email accounts or management systems, such as through phishing attacks, which are fraudulent identity theft schemes designed to appear as legitimate emails from us or from our property owners and managers. Criminals may also employ other schemes aimed at defrauding our property owners, managers or travelers in ways that we may not anticipate or be able to adequately guard against. Although phishing attacks and other fraud schemes are generally not carried out through our systems, victims may nevertheless seek recovery from us. As a result, we may be required to defend ourselves in costly litigation and may suffer harm to our reputation, brand and business.
If we are unable to adapt to changes in technology, our business could be harmed.
Because property owners, managers and travelers can access our websites using a variety hardware and software platforms, we will need to continuously modify and enhance our service to keep pace with related technological changes. We may not be successful in developing necessary, functional and popular modifications and enhancements. Furthermore, uncertainties about the timing and nature of these necessary changes could result in unplanned research and development expenses. In addition, any failure of our online marketplace to operate effectively with future technologies could result in dissatisfaction from travelers, property owners, managers and advertisers, any of which could harm our business.
We may be subject to liability for the activities of our property owners and managers, which could harm our reputation and increase our operating costs.
We periodically receive complaints related to certain activities on our websites, including disputes over the authenticity of a vacation rental listing, unauthorized use of credit card and bank account information and identity theft, phishing attacks, potential breaches of system security, libel, and infringement of third-party copyrights, trademarks or other intellectual property rights. We have also experienced fraud by purported owners or managers listing properties which either do not exist or are significantly not as described in the listing. The methods used by perpetrators of fraud constantly evolve and are complex. Moreover, our trust and security measures may not detect all fraudulent activity. Consequently, we expect to continue to receive complaints from travelers and requests for reimbursement of their rental fees, as well as actual or threatened related legal action against us.
We may also be subject to claims of liability based on events that occur during travelers’ stays at vacation rentals, including those related to robbery, injury, death, and other similar incidents. As our websites become more integral to the rental transaction through our expanded e-commerce tools and offerings, the potential for these types of claims could increase. This in turn could increase our operating costs and adversely affect our business and results of operations, even if these claims do not result in liability, as we incur costs related to investigation and defense. The available terms and conditions of our websites specifically state that we are exempt from any liability to travelers relating to these matters. However, the enforceability of these terms varies from jurisdiction to jurisdiction, and the laws in this area are consistently evolving. If we are subject to liability or claims of liability relating to the acts of our property owners or managers, or due to fraudulent listings, we may be subject to negative publicity, incur additional expenses and be subject to liability, any of which could harm our business and our operating results.
19
Table of Contents
Loss or material modification of our credit card acceptance privileges could have a material adverse effect on our business and operating results. Credit card acceptance privileges involve additional potential costs relating to reimbursements and fraud.
A significant percentage of our property owners and managers pay for their listings by credit card. The loss of our credit card acceptance privileges could significantly limit the availability and desirability of our products and services. Moreover, if we fail to fully perform our contractual obligations we could be obligated to reimburse credit card companies for refunded payments that have been contested by the cardholders. In addition, even when we are in compliance with these obligations, we bear other expenses including those related to the acceptance of fraudulent credit cards. As a result of all of these risks, credit card companies may require us to set aside additional cash reserves, may increase the transaction fees they charge us, or may even refuse to renew our acceptance privileges.
In addition, credit card networks, such as Visa, MasterCard and American Express, have adopted rules and regulations that apply to all merchants who process and accept credit cards and include the Payment Card Industry Data Security Standards, or the PCI DSS. Under these rules, we are required to adopt and implement internal controls over the use, storage and security of card data. We assess our compliance with the PCI DSS rules on a periodic basis and make necessary improvements to our internal controls. Failure to comply may subject us to fines, penalties, damages and civil liability and could prevent us from processing or accepting credit cards. However, we cannot guarantee that compliance with these rules will prevent illegal or improper use of our payments systems or the theft, loss or misuse of the credit card data.
The loss of, or the significant modification of, the terms under which we obtain credit card acceptance privileges could have a material adverse effect on our business, revenue and operating results.
Our revenue, expenses and operating results could be affected by changes in travel, real estate and vacation rental markets, as well as general economic conditions.
Our business is particularly sensitive to trends in the travel, real estate and vacation rental markets, which are unpredictable, as well as trends in the general economy. Therefore, our operating results, to the extent they reflect changes in the broader travel, real estate and vacation rental industries, may be subject to significant fluctuations.
For example, changes in the travel industry, such as disruptions caused by war, terrorist attacks, natural disasters, weather bankruptcies or diseases could significantly reduce the willingness of potential travelers to plan vacation and other travel. Such disruptions that harm or destroy vacation homes could cause the property owners and managers of such homes to cancel or fail to renew their listings. Downturns in real estate markets may result in decreased new building rates and increases in foreclosures, which could also result in fewer vacation rentals available for listing. Also, since vacation travel is generally dependent on discretionary spending, negative general economic conditions could significantly reduce the overall amount that travelers spend on vacation travel. Additionally, property owners may choose or be forced to sell their vacation rentals during periods of economic slowdown or recession. Any or all of these factors could reduce the demand for vacation rentals and our services, reducing our revenue. This in turn could increase our need to make significant expenditures to continue to attract property owners, managers and travelers to our websites.
Vacation rentals are often located in popular vacation destinations around the world and utilized on a seasonal basis. Factors influencing the desirability of vacation rentals in a particular region or season could adversely affect our ability to obtain new listings and retain existing listings.
Vacation rentals are often located in popular vacation destinations and utilized on a seasonal basis. As a result, our listings involve properties that are often concentrated in particular regions, and our revenue is dependent upon our ability or willingness to list properties in those regions. If we became unable or unwilling to list properties in a particular region, our listings in the region could decline or cease to grow, and revenue and results of operations could be adversely impacted.
20
Table of Contents
In addition, factors influencing the desirability of vacation rentals in a particular region or during a specific season could adversely affect our ability to obtain new listings and retain existing listings. A significant natural disaster, political turmoil or other regional disturbance could reduce the number of available vacation rentals in that area, reducing our listing base and our revenue. In addition, if we do not have sufficient property listings in a newly popular vacation destination, we could fail to attract travelers to our websites and property owners and managers may opt to list their properties with a competitor having a greater presence in that area.
We could face liability for transactions and information on or accessible through our online marketplace.
A significant portion of the information available through our online marketplace is submitted by property owners and managers and third parties. We also allow third parties to advertise their products and services on our websites and include links to third-party websites. We could be exposed to liability with respect to this third-party information. Property owners and managers could assert that information concerning them on our websites contains errors or omissions and third parties could seek damages from us for losses incurred if they rely upon such incorrect information. We could also be subject to claims that such information is defamatory, libelous, or infringes on third-party copyrights and privacy and publicity rights. We might be subject to claims that by providing links to third party websites, we are liable for wrongful actions by those third parties. Even if these claims do not result in liability to us, we could incur significant costs in investigating and defending against these claims.
In addition, our services feature a property review platform, which allows travelers to post property reviews and other information about properties, property owners and managers. Although this feedback is generated by users and not by us, claims of libel, defamation or other injury have been made against other Internet service providers offering similar forums and may be made against us for content posted in this forum. Our potential liability for this information could require us to expend substantial resources to reduce our liability exposure and may limit the attractiveness of our online marketplace. Moreover, our general liability insurance may not cover all potential claims to which we are exposed and may not be adequate to indemnify us for all liability that may be imposed.
Property owner, manager or traveler complaints or negative publicity about our company, our services or our business activities could diminish use of our online marketplace.
Property owner, manager or traveler complaints or negative publicity about our company, our services or our business activities could severely diminish consumer confidence in and use of our online marketplace. Our measures to combat risks of fraud and breaches of privacy and security can damage relations with our property owners and managers, for instance when we remove listings which have repeatedly been reported as misleadingly described. These measures heighten the need for prompt and accurate customer service to resolve irregularities and disputes. Effective customer service requires significant personnel expense, and this expense, if not managed properly, could significantly impact our profitability. Failure to manage or train our customer service representatives properly could compromise our ability to handle property owner, manager and traveler complaints effectively. If we do not handle these complaints effectively, our reputation may suffer, and we may lose the confidence of property owners, managers and travelers. We may also be the subject of blog or forum postings that include inaccurate statements and create negative publicity. As a result of these complaints or negative publicity, property owners and managers may discontinue their listing with us or travelers may discontinue their use of our websites, and our business and results of operations could be adversely impacted.
If we do not adequately protect our intellectual property, our ability to compete could be impaired.
Our intellectual property includes the content of our websites, our registered domain names, our registered and unregistered trademarks and patent applications. We believe that our intellectual property is an essential asset of our business and that our domain names and our technology infrastructure currently give us a competitive advantage in the online market for vacation rental listings. If we do not adequately protect our intellectual property, our brand, reputation and perceived content value could be harmed, resulting in an impaired ability to compete effectively.
21
Table of Contents
To protect our intellectual property we rely on a combination of copyright, trademark, patent and trade secret laws, contractual provisions and our user policy and restrictions on disclosure. Upon discovery of potential infringement of our intellectual property, we promptly take action we deem appropriate to protect our rights. We regularly deliver cease and desist letters to parties who misappropriate our trademarks or content, such as aggregators of vacation rental listing content who use automated technology to download content from our online marketplace and display it on their websites without our permission. We also enter into confidentiality agreements with our employees and consultants and seek to control access to and distribution of our proprietary information in a commercially prudent manner. The efforts we have taken to protect our intellectual property may not be sufficient or effective, and, despite these precautions, it may be possible for other parties to copy or otherwise obtain and use the content of our websites without authorization. We may be unable to prevent competitors from acquiring domain names or trademarks that are similar to, infringe upon or diminish the value of our domain names, service marks and our other proprietary rights. Even if we do detect violations and decide to enforce our intellectual property rights, litigation may be necessary to enforce our rights, and any enforcement efforts we undertake could be time-consuming, expensive, distracting and result in unfavorable outcomes. A failure to protect our intellectual property in a cost-effective and meaningful manner could have a material adverse effect on our ability to compete.
As of December 31, 2014, we had 20 patent applications and no issued patents. Any future patents issued to us may be challenged, invalidated or circumvented, may not provide sufficiently broad protection or may not prove to be enforceable in actions against alleged infringers. Furthermore, effective patent, trademark, copyright and trade secret protection may not be available in every country in which our products are available over the Internet. In addition, the legal standards relating to the validity, enforceability and scope of protection of intellectual property rights are uncertain and still evolving.
We may be subject to claims that we violated intellectual property rights of others, which are extremely costly to defend and could require us to pay significant damages and limit our ability to operate.
Companies in the Internet and technology industries, and other patent and trademark holders seeking to profit from royalties in connection with grants of licenses, own large numbers of patents, copyrights, trademarks and trade secrets and frequently enter into litigation based on allegations of infringement or other violations of intellectual property rights. We have received and may continue to receive claims that we have violated other parties’ intellectual property rights. There may be intellectual property rights held by others, including issued or pending patents and trademarks, that cover significant aspects of our technologies, content, branding or business methods. Any intellectual property claim against us, regardless of merit, could be time-consuming and expensive to settle or litigate and could divert our management’s attention and other resources. These claims also could subject us to significant liability for damages and could result in our having to stop using technology, content, branding or business methods found to be in violation of another party’s rights. We might be required or may opt to seek a license for rights to intellectual property held by others, which may not be available on commercially reasonable terms, or at all. If we cannot license or develop technology, content, branding or business methods for any allegedly infringing aspect of our business, we may be unable to compete effectively. Even if a license is available, we could be required to pay significant royalties, which could increase our operating expenses. We may also be required to develop alternative non-infringing technology, content, branding or business methods, which could require significant effort and expense and be inferior. Any of these results could harm our operating results.
We currently rely on a small number of third-party service providers to host and deliver a significant portion of our services, and any interruptions or delays in services from these third parties could impair the delivery of our services and harm our business.
We rely on third-party service providers for numerous products and services, including payment processing services, data center services, web hosting services, insurance products for customers and travelers and some customer service functions. We rely on these companies to provide uninterrupted services and to provide their services in accordance with all applicable laws, rules and regulations.
22
Table of Contents
We use a combination of third-party data centers distributed globally across multiple regions to host our websites and core services. We do not control the operation of any of the third-party data center facilities we use. These facilities, including our co-location hosting center, may be subject to break-ins, computer viruses, denial-of-service attacks, sabotage, acts of vandalism and other misconduct. They are also vulnerable to damage or interruption from power loss, telecommunications failures, fires, floods, earthquakes, hurricanes, tornadoes and similar events. We currently do not have a comprehensive disaster recovery plan in place nor do our systems provide complete redundancy of data storage or processing. As a result, the occurrence of any of these events, a decision by our third-party service providers to close their data center facilities without adequate notice or other unanticipated problems could result in loss of data as well as a significant interruption in our services and harm to our reputation and brand. Additionally, our third-party data center facility agreements are of limited durations, and our third-party data center facilities have no obligation to renew their agreements with us on commercially reasonable terms, or at all. If we are unable to renew our agreements with these facilities on commercially reasonable terms, we may experience delays in the provisioning of our services until an agreement with another data center facility can be arranged. This shift to alternate data centers could take more than 24 hours depending on the nature of the event.
Furthermore, we depend on continuous and uninterrupted access to the Internet through third-party bandwidth providers to operate our business. If we lose the services of one or more of our bandwidth providers for any reason or if their services are disrupted, we could experience disruption in our services or we could be required to retain the services of a replacement bandwidth provider, which could harm our business and reputation.
Our operations are dependent on the availability of electricity, which also comes from third-party providers. If we or the third-party data center facilities that we use to deliver our services were to experience a major power outage, it could result in disruption of our services and harm to our business.
If these companies experience difficulties and are not able to provide services in a reliable and secure manner, if they do not operate in compliance with applicable laws, rules and regulations and, with respect to payment and card processing companies, if they are unable to effectively combat the use of fraudulent payments on our websites, our results of operations and financial positions could be materially and adversely affected. In addition, if such third-party service providers were to cease operations or face other business disruption either temporarily or permanently, or otherwise face serious performance problems, we could suffer increased costs and delays until we found or developed an equivalent replacement, any of which could have an adverse impact on our business and financial performance.
If we do not successfully implement any acquisition strategies, our operating results and prospects could be harmed.
We face competition within our industry for acquisitions of businesses, technologies and assets, and, in the future, such competition may become more intense. As such, even if we are able to identify an acquisition that we would like to consummate, we may not be able to complete the acquisition on commercially reasonable terms or at all because of such competition. Furthermore, if we enter into negotiations that are not ultimately consummated, those negotiations could result in diversion of management time and significant out-of-pocket costs. Even if we are able to complete such acquisitions, we may additionally expend significant amounts of cash or incur substantial debt to finance them, which indebtedness could result in restrictions on our business and use of available cash. In addition, we may finance or otherwise complete acquisitions by issuing equity or convertible debt securities, which could result in dilution of our existing stockholders. If we fail to evaluate and execute acquisitions successfully, we may not be able to realize their benefits. If we are unable to successfully address any of these risks, our business, financial condition or operating results could be harmed.
23
Table of Contents
We rely on assumptions and estimates and data from third parties to calculate certain of our key metrics, and real or perceived inaccuracies in such metrics may harm our reputation and negatively affect our business.
Certain key metrics, such as number of unique visitors, total traffic and number of listings, reviews and opinions, are calculated, in some cases, using internal company data and, in other cases, relying on data from third parties. While these numbers are based on what we believe to be reasonable calculations for the applicable periods of measurement, there are inherent challenges in measuring usage and user engagement across our large user base around the world. Accordingly, the calculations of our unique visitors may not accurately reflect the number of people actually using our platforms. In addition, our measures of growth may differ from estimates published by third parties or from similar metrics of our competitors due to differences in methodologies utilized by us and the third parties on which we rely for this data.
We are continually seeking to improve our ability to estimate these key metrics. We regularly review and adjust our processes for calculating our internal metrics to improve their accuracy. If our users, advertisers, partners and stockholders do not perceive our metrics to be accurate representations or if we discover material inaccuracies in our user metrics, our reputation may be harmed. This in turn could cause property owners, managers, travelers and advertisers not to use our products and services which could negatively affect our business and operating results.
Our culture emphasizes rapid innovation and prioritizes property owner, manager, and traveler experience over short-term financial results.
We have a culture that encourages rapid development and release of new and improved products, and generally prioritizes property owner, manager, and traveler experience over short-term financial results. We have taken actions in the past and may continue to make product or other decisions going forward that have the effect of reducing our short-term revenue or profitability if we believe that the decisions benefit long term-revenue and profitability through improved property owner, manager, and traveler experience and/or conversion rates and pricing. The short-term reductions in revenue or profitability could be more severe than we anticipate. These decisions may not produce the long-term benefits that we expect, in which case our growth, website experience, relationships with property owners, managers, and travelers and advertisers, and business and results of operations could be harmed.
Our failure to maintain effective internal controls could adversely affect our financial position and lower our stock price.
We are subject to reporting and other obligations under the Securities Exchange Act of 1934, including the requirements of Sarbanes-Oxley. These provisions require annual management assessments of the effectiveness of our internal controls over financial reporting and a report by our independent registered public accounting firm addressing our assessments. We also operate in a complex environment and expect these obligations, together with our rapid growth and expansion through acquisitions, to place significant demands on our management and administrative resources, including accounting and tax resources. Although we have expanded the size and depth of the finance and accounting staff in our U.S. and European headquarters, we may need to hire additional personnel. If we are unable to conclude that our internal control over financial reporting is effective, or if our independent registered public accounting firm is unable to attest that our management’s report is fairly stated or they are unable to express an opinion on our management’s assessment or on the effectiveness of our internal control over financial reporting, our investors could lose confidence in the accuracy and completeness of our financial reports.
We might require additional capital to support business growth, and this capital might not be available.
We intend to continue to make investments to support our business growth and may require additional funds to respond to business challenges, including the need to develop new products or services or enhance our existing products or services, enhance our operating infrastructure and acquire complementary businesses and
24
Table of Contents
technologies. Accordingly, we may need to engage in equity or debt financings to secure additional funds. If we raise additional funds through further issuances of equity or convertible debt securities, our existing stockholders could suffer significant dilution, and any new equity securities we issue could have rights, preferences and privileges superior to those of holders of our common stock. Any debt financing secured by us in the future could involve restrictive covenants relating to financial and operational matters, which may make it more difficult for us to obtain additional capital and to pursue business opportunities, including potential acquisitions. In addition, we may not be able to obtain additional financing on terms favorable to us, if at all. If we are unable to obtain adequate financing or financing on terms satisfactory to us, when we require it, our ability to continue to support our business growth and to respond to business challenges could be significantly limited.
We have significant indebtedness, which could adversely affect our business and financial condition.
As of December 31, 2014, the aggregate face value of our outstanding convertible senior promissory notes was $402.5 million. Risks relating to our indebtedness include:
| • | increasing our vulnerability to general adverse economic and industry conditions; |
| • | requiring us to dedicate a portion of our cash flow from operations to principal and interest payments on our indebtedness, thereby reducing the availability of cash flow to fund working capital, capital expenditures, acquisitions and investments and other general corporate purposes; |
| • | making it more difficult for us to optimally capitalize and manage the cash flow for our businesses; |
| • | limiting our flexibility in planning for, or reacting to, changes in our businesses and the markets in which we operate; |
| • | possibly placing us at a competitive disadvantage compared to our competitors that have less debt; |
| • | applying the accounting method for convertible debt securities that may be settled in cash, which requires the notes’ equity component to be included in the paid-in capital section of stockholders’ equity and the value of the equity component to be treated as a debt discount. The amortization of this discount will result in lower reported net income which in turn could adversely affect our reported financial results; |
| • | limiting our ability to borrow additional funds or to borrow funds at rates or on other terms that we finds acceptable; and |
| • | responding to the conditional conversion feature of the notes, which if triggered could adversely affect our liquidity if we elect to satisfy our conversion obligation through the payment of cash. |
Risks Related to the Ownership of our Common Stock
Our stock price may be volatile.
The market price of our common stock is likely to be volatile and could be subject to wide fluctuations in response to, among other things, the risk factors described in this section of this Annual Report on Form 10-K, and other factors beyond our control. Factors affecting the trading price of our common stock could include:
| • | variations in our operating results; |
| • | variations in operating results of similar companies and competitors; |
| • | changes in the estimates of our operating results or changes in recommendations by any securities analysts that elect to follow our common stock; |
| • | changes in our outlook for future operating results which are communicated to investors and analysts; |
| • | announcements of technological innovations, new products, services or service enhancements, strategic alliances or agreements by us or by our competitors; |
| • | marketing and advertising initiatives by us or our competitors; |
25
Table of Contents
| • | the gain or loss of listings; |
| • | threatened or actual litigation; |
| • | changes in our management; |
| • | recruitment or departures of key personnel; |
| • | market conditions in our industry, the travel industry and the economy as a whole; |
| • | the overall performance of the equity markets; |
| • | sales of shares of our common stock by existing stockholders; |
| • | the reports of industry research analysts who cover our competitors and us; |
| • | stock-based compensation expense under applicable accounting standards; and |
| • | adoption or modification of regulations, policies, procedures or programs applicable to our business. |
Furthermore, the stock markets have experienced price and volume fluctuations that have affected and continue to affect the market prices of equity securities of many companies. These fluctuations often have been unrelated or disproportionate to the operating performance of those companies. These broad market and industry fluctuations and general economic, political and market conditions, such as recessions, interest rate changes or international currency fluctuations, may negatively affect the market price of our common stock regardless of our actual operating performance. Each of these factors, among others, could harm the value of our common stock.
In the past, many companies that have experienced volatility in the market price of their stock have been subject to securities class action litigation. We may be the target of this type of litigation in the future. Securities litigation against us, regardless of the merits or outcome, could result in substantial costs and divert our management’s attention from other business concerns, which could materially harm our business.
If securities analysts and other industry experts do not continue to publish research or publish negative research about our business, our stock price and trading volume could decline.
The trading market for our common stock depends in part on the research, reports and other media that securities analysts and other industry experts publish about us or our business. If one or more of the analysts who covers us downgrades our stock or publishes negative research about our business, our stock price could decline. If one or more of these analysts ceases coverage of our company or fails to publish reports on us regularly, we could lose visibility in the stock market and demand for our stock could decrease, which could cause our stock price or trading volume to decline. If one or more industry analysts publish negative statements about our business, our stock price could decline.
We do not anticipate paying any dividends on our common stock.
We do not anticipate paying any cash dividends on our common stock in the foreseeable future. If we do not pay cash dividends, our stockholders could receive a return on their investment in our common stock only if the market price of our common stock has increased when they sell their shares.
Our charter documents, Delaware law, and the indenture governing our outstanding convertible senior promissory notes could prevent a takeover that stockholders consider favorable and could also depress the market price of our stock.
Our amended and restated certificate of incorporation and our amended and restated bylaws contain provisions that could delay or prevent a change in control of our company. These provisions could also make it more difficult for stockholders to elect directors and take other corporate actions. These provisions include:
| • | creating a classified board of directors whose members serve staggered three-year terms; |
| • | not providing for cumulative voting in the election of directors; |
26
Table of Contents
| • | authorizing our board of directors to issue, without stockholder approval, preferred stock with rights senior to those of our common stock; |
| • | prohibiting stockholder action by written consent; and |
| • | requiring advance notification of stockholder nominations and proposals. |
Similarly, the indenture governing our outstanding convertible promissory notes includes provisions that:
| • | prohibit us from engaging in certain mergers or acquisitions unless, among other things, the surviving entity assumes our obligations under the promissory notes; and |
| • | may require us under certain circumstances to repurchase all or a portion of these promissory notes, and in some cases repurchase the promissory notes subject to an additional make whole adjustment. |
Certain provisions under Delaware law, the provisions listed above, and other provisions included in our amended and restated certificate of incorporation and our amended and restated bylaws could discourage potential takeover attempts, reduce the price that investors might be willing to pay in the future for shares of our common stock and result in the market price of our common stock being lower than it would be without these provisions.
Item 1B. Unresolved Staff Comments.
None.
Our executive, administrative, and U.S. operating offices are primarily located in Austin, Texas where we lease approximately 230,000 square feet of office space.
As of December 31, 2014, we maintained additional offices outside of Austin with our largest leased facilities in Denver, Colorado; Seattle, Washington; Paris, France; Marseilles, France; Geneva, Switzerland; Madrid, Spain; London, England; and Sydney, Australia. We also we lease space for our data center and computer servers in the United States and the United Kingdom. We believe our current and planned office facilities and data center space adequate to meet our needs for the foreseeable future.
For additional information regarding obligations under operating leases, see Note 8 of the Notes to Consolidated Financial Statements included in Part II, Item 8 of this Annual Report on Form 10-K.
From time to time, we may become involved in litigation related to claims arising from the ordinary course of our business. We believe there are no claims or actions pending or threatened against us, the ultimate disposition of which would have a material adverse effect on us.
Item 4. Mine Safety Disclosures
Not applicable.
27
Table of Contents
PART II
Item 5. Market for Registrant’s Common Equity, Related Stockholder Matters and Issuer Purchases of Equity Securities.
Market Information
Our common stock is traded on the NASDAQ under the symbol “AWAY”. The following table sets forth for the periods indicated the high and low sales prices per share of our common stock as reported on by the NASDAQ.
| Sales Price Per Share in 2014 |
||||||||
| Year Ended December 31, 2014 |
Low | High | ||||||
| Fourth Quarter |
$ | 27.83 | $ | 36.19 | ||||
| Third Quarter |
$ | 31.21 | $ | 36.90 | ||||
| Second Quarter |
$ | 27.95 | $ | 39.37 | ||||
| First Quarter |
$ | 37.54 | $ | 48.90 | ||||
| Sales Price Per Share in 2013 |
||||||||
| Year Ended December 31, 2013 |
Low | High | ||||||
| Fourth Quarter |
$ | 27.27 | $ | 41.78 | ||||
| Third Quarter |
$ | 27.70 | $ | 34.00 | ||||
| Second Quarter |
$ | 28.01 | $ | 34.30 | ||||
| First Quarter |
$ | 21.35 | $ | 34.09 | ||||
On February 19, 2015, the last reported sales price of our common stock on the NASDAQ was $30.78 per share and there were 37 holders of record of our common stock. Because many of our shares of common stock are held by brokers and other institutions on behalf of stockholders, this number is not indicative of the total number of stockholders represented by these stockholders of record.
Dividend Policy
We have neither declared nor paid cash dividends on our common stock and do not expect to pay dividends on our common stock for the foreseeable future. We anticipate all of our earnings will be used for the operation and growth of our business. Any future determination to pay dividends on our common stock would be subject to the discretion of our board of directors and would depend upon various factors, including our results of operations, financial condition and liquidity requirements, restrictions that may be imposed by applicable law and our contracts, and other factors deemed relevant by our board of directors.
Performance Graph
Notwithstanding any statement to the contrary in any of our filings with the SEC, the following information shall not be deemed “filed” with the SEC or “soliciting material” under the Securities Exchange Act of 1934 and shall not be incorporated by reference into any such filings irrespective of any general incorporation language contained in such filing.
The following graph compares the total cumulative stockholder return on our common stock with the total cumulative return of the NASDAQ Composite Index and the S&P North American Technology Internet Index during the period commencing on June 29, 2011, the initial trading day of our common stock, and ending on December 31, 2014. The graph assumes a $100 investment at the beginning of the period in our common stock, the stocks represented in the NASDAQ Composite Index and the stocks represented in the S&P North American Technology Internet Index, and reinvestment of any dividends. The S&P North American Technology Internet
28
Table of Contents
Index is a modified-capitalization weighted index of 28 stocks representing the Internet industry, including Internet content and access providers, Internet software and services companies and e-commerce companies. Historical stock price performance should not be relied upon as an indication of future stock price performance.
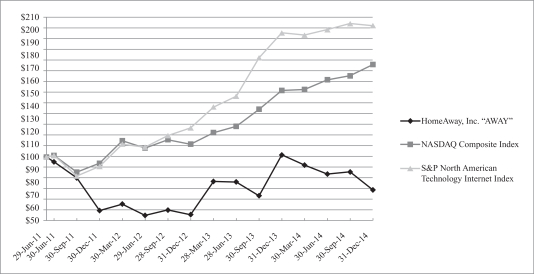
Equity Compensation Plan Information
For information regarding securities authorized for issuance under equity compensation plans, see Part III, Item 12 of this Annual Report on Form 10-K.
29
Table of Contents
Item 6. Selected Financial Data.
We have derived the consolidated statements of operations data for the years ended December 31, 2014, 2013 and 2012, and the consolidated balance sheet data as of December 31, 2014 and 2013, from our audited consolidated financial statements included elsewhere in this filing. We have derived the consolidated statement of operations data for the years ended December 31, 2011 and 2010 and the consolidated balance sheet data as of December 31, 2012, 2011 and 2010, from our audited consolidated financial statements not included in this filing. To obtain further information about our historical results, including our historical acquisitions, for which results of operations are included in our consolidated financial statements beginning on the dates of acquisition, you should read the following selected consolidated financial data in conjunction with our consolidated financial statements and related notes, the information in the section of this filing titled “Management’s Discussion and Analysis of Financial Condition and Results of Operations” and the other financial information included elsewhere in this filing. Our historical results are not necessarily indicative of our future results.
| Year Ended December 31, | ||||||||||||||||||||
| 2014 | 2013 | 2012 | 2011 | 2010 | ||||||||||||||||
| (in thousands except per share data) | ||||||||||||||||||||
| Consolidated Statements of Operations Data(1): |
|
|||||||||||||||||||
| Revenue: |
||||||||||||||||||||
| Listing |
$ | 371,939 | $ | 294,661 | $ | 238,413 | $ | 199,457 | $ | 152,890 | ||||||||||
| Other |
74,823 | 51,828 | 41,991 | 30,766 | 14,994 | |||||||||||||||
|
|
|
|
|
|
|
|
|
|
|
|||||||||||
| Total revenue |
446,762 | 346,489 | 280,404 | 230,223 | 167,884 | |||||||||||||||
| Operating income |
$ | 40,026 | $ | 33,821 | $ | 29,795 | $ | 22,681 | $ | 13,760 | ||||||||||
| Net income (loss) attributable to common stockholders |
$ | 13,384 | $ | 17,686 | $ | 14,961 | $ | (18,500 | ) | $ | (18,290 | ) | ||||||||
| Net income (loss) per share attributable to common stockholders: |
||||||||||||||||||||
| Basic |
$ | 0.14 | $ | 0.21 | $ | 0.18 | $ | (0.31 | ) | $ | (0.48 | ) | ||||||||
| Diluted |
$ | 0.14 | $ | 0.20 | $ | 0.18 | $ | (0.31 | ) | $ | (0.48 | ) | ||||||||
| Weighted average number of shares outstanding: |
||||||||||||||||||||
| Basic |
93,727 | 85,378 | 82,382 | 59,549 | 38,143 | |||||||||||||||
| Diluted |
96,481 | 88,259 | 84,942 | 59,549 | 38,143 | |||||||||||||||
| December 31, | ||||||||||||||||||||
| 2014 | 2013 | 2012 | 2011 | 2010 | ||||||||||||||||
| (in thousands) | ||||||||||||||||||||
| Consolidated Balance Sheet Data(1): |
||||||||||||||||||||
| Cash and cash equivalents |
$ | 292,325 | $ | 324,608 | $ | 189,478 | $ | 118,208 | $ | 65,697 | ||||||||||
| Working capital (deficit) |
634,543 | 220,429 | 121,990 | 72,331 | (20,484 | ) | ||||||||||||||
| Total assets |
1,530,128 | 1,080,672 | 722,675 | 604,631 | 489,742 | |||||||||||||||
| Convertible senior notes, net |
316,181 | — | — | — | — | |||||||||||||||
| Total liabilities |
588,578 | 246,733 | 205,642 | 163,622 | 127,851 | |||||||||||||||
| Total redeemable and convertible preferred stock |
— | — | — | — | 478,965 | |||||||||||||||
| Total stockholders’ equity (deficit) |
931,808 | 823,355 | 517,033 | 441,009 | (117,074 | ) | ||||||||||||||
| Year Ended December 31, | ||||||||||||||||||||
| 2014 | 2013 | 2012 | 2011 | 2010 | ||||||||||||||||
| (in thousands) | ||||||||||||||||||||
| Other Financial Data(1): |
||||||||||||||||||||
| Adjusted EBITDA(2) |
$ | 119,342 | $ | 96,722 | $ | 80,348 | $ | 66,756 | $ | 43,220 | ||||||||||
| Free cash flow(3) |
117,062 | 92,972 | 85,265 | 64,499 | 51,452 | |||||||||||||||
| Capital expenditures |
31,647 | 19,616 | 17,260 | 12,978 | 10,396 | |||||||||||||||
| Non-GAAP net income(4) |
64,393 | 49,820 | 40,617 | 29,237 | 32,186 | |||||||||||||||
30
Table of Contents
| (1) | The final results of acquired businesses are included in our consolidated financial statements beginning on the dates of acquisition. Acquisitions impacting the periods above include: AlugueTemporada.com.br in Brazil in March 2010; BedandBreakfast.com in the United States in March 2010; Escapia, Inc. in the United States in October 2010; Instant Software in the United States in October 2010; RealHolidays.com.au in Australia in April 2011; Second Porch, Inc. in the United States in April 2011; Toprural.com in Spain in April 2012; travelmob Pte. Ltd. in Singapore in August 2013; Bookabach Limited in New Zealand in November 2013; Stayz Pty Limited in Australia in December 2013; and Glad to Have You, Inc. in the United States March 2014. |
| (2) | We define Adjusted EBITDA as net income (loss) attributable to HomeAway, Inc. plus depreciation, amortization of intangible assets; stock-based compensation expense; interest expense (income); foreign exchange losses (gains); income tax expense (benefit); impact of noncontrolling interests, all net of income taxes. |
The following table presents a reconciliation of net income attributable to HomeAway, Inc. to Adjusted EBITDA:
| Year Ended December 31, | ||||||||||||||||||||
| 2014 | 2013 | 2012 | 2011 | 2010 | ||||||||||||||||
| (in thousands) | ||||||||||||||||||||
| Net income attributable to HomeAway, Inc. |
$ | 13,384 | $ | 17,686 | $ | 14,961 | $ | 6,178 | $ | 16,934 | ||||||||||
| Depreciation and amortization |
30,842 | 25,067 | 23,489 | 19,971 | 15,841 | |||||||||||||||
| Stock-based compensation |
48,518 | 37,887 | 27,033 | 23,933 | 13,512 | |||||||||||||||
| Interest expense |
13,333 | — | — | — | 22 | |||||||||||||||
| Interest income |
(1,728 | ) | (1,211 | ) | (928 | ) | (374 | ) | (208 | ) | ||||||||||
| Foreign exchange loss |
7,138 | 5,964 | 2,618 | 4,555 | 3,433 | |||||||||||||||
| Income tax expense (benefit) |
7,272 | 11,724 | 13,175 | 12,493 | (6,314 | ) | ||||||||||||||
| Impact of noncontrolling interests, net of tax |
583 | (395 | ) | — | — | — | ||||||||||||||
|
|
|
|
|
|
|
|
|
|
|
|||||||||||
| Adjusted EBITDA |
$ | 119,342 | $ | 96,722 | $ | 80,348 | $ | 66,756 | $ | 43,220 | ||||||||||
|
|
|
|
|
|
|
|
|
|
|
|||||||||||
The following table presents stock-based compensation and depreciation included in the respective line items in our Consolidated Statement of Operations:
| Year Ended December 31, | ||||||||||||||||||||
| 2014 | 2013 | 2012 | 2011 | 2010 | ||||||||||||||||
| (in thousands) | ||||||||||||||||||||
| Stock-based compensation: |
||||||||||||||||||||
| Cost of revenue |
$ | 3,245 | $ | 3,064 | $ | 2,675 | $ | 1,805 | $ | 861 | ||||||||||
| Product development |
13,174 | 9,515 | 5,642 | 5,023 | 2,424 | |||||||||||||||
| Sales and marketing |
10,805 | 8,488 | 6,629 | 6,292 | 1,730 | |||||||||||||||
| General and administrative |
21,294 | 16,820 | 12,087 | 10,813 | 8,497 | |||||||||||||||
|
|
|
|
|
|
|
|
|
|
|
|||||||||||
| Total |
$ | 48,518 | $ | 37,887 | $ | 27,033 | $ | 23,933 | $ | 13,512 | ||||||||||
|
|
|
|
|
|
|
|
|
|
|
|||||||||||
31
Table of Contents
| Year Ended December 31, | ||||||||||||||||||||
| 2014 | 2013 | 2012 | 2011 | 2010 | ||||||||||||||||
| (in thousands) | ||||||||||||||||||||
| Depreciation: |
||||||||||||||||||||
| Cost of revenue |
$ | 4,925 | $ | 4,268 | $ | 3,682 | $ | 2,703 | $ | 2,079 | ||||||||||
| Product development |
4,059 | 3,092 | 2,470 | 1,885 | 1,211 | |||||||||||||||
| Sales and marketing |
5,539 | 4,248 | 3,438 | 2,763 | 1,605 | |||||||||||||||
| General and administrative |
2,403 | 1,791 | 1,461 | 1,078 | 993 | |||||||||||||||
|
|
|
|
|
|
|
|
|
|
|
|||||||||||
| Total |
$ | 16,926 | $ | 13,399 | $ | 11,051 | $ | 8,429 | $ | 5,888 | ||||||||||
|
|
|
|
|
|
|
|
|
|
|
|||||||||||
| (3) | We define free cash flow as our cash provided by operating activities, adjusted for cash interest expense and excess tax benefit (expense) from stock-based compensation, and subtracting capital expenditures. For the purpose of calculating free cash flow, we consider purchases of property, equipment, leasehold improvements for our offices, and software licenses, including costs associated with internally developed software, as capital expenditures. |
The following table presents a summary of cash flows:
| Year Ended December 31, | ||||||||||||||||||||
| 2014 | 2013 | 2012 | 2011 | 2010 | ||||||||||||||||
| (in thousands) | ||||||||||||||||||||
| Cash provided by operating activities |
$ | 145,364 | $ | 104,362 | $ | 95,403 | $ | 76,972 | $ | 61,857 | ||||||||||
| Cash used in investing activities |
(537,676 | ) | (223,372 | ) | (57,975 | ) | (73,502 | ) | (81,031 | ) | ||||||||||
| Cash provided by (used in) financing activities |
369,501 | 252,047 | 33,000 | 51,630 | (5,952 | ) | ||||||||||||||
The following table presents a reconciliation of cash provided by operating activities to free cash flow:
| Year Ended December 31, | ||||||||||||||||||||
| 2014 | 2013 | 2012 | 2011 | 2010 | ||||||||||||||||
| (in thousands) | ||||||||||||||||||||
| Cash provided by operating activities |
$ | 145,364 | $ | 104,362 | $ | 95,403 | $ | 76,972 | $ | 61,857 | ||||||||||
| Cash paid for interest |
253 | — | — | — | — | |||||||||||||||
| Excess tax benefit (shortfall) from stock-based compensation |
3,092 | 8,226 | 7,122 | 505 | (9 | ) | ||||||||||||||
| Capital expenditures |
(31,647 | ) | (19,616 | ) | (17,260 | ) | (12,978 | ) | (10,396 | ) | ||||||||||
|
|
|
|
|
|
|
|
|
|
|
|||||||||||
| Free cash flow |
$ | 117,062 | $ | 92,972 | $ | 85,265 | $ | 64,499 | $ | 51,452 | ||||||||||
|
|
|
|
|
|
|
|
|
|
|
|||||||||||
| (4) | We define non-GAAP net income as our net income (loss) attributable to HomeAway, Inc. adjusted for changes to the redemption value of noncontrolling interests, and the after-tax effect of stock-based compensation, amortization of intangible assets, amortization of debt discount and issuance costs, net of amounts capitalized and the impact on noncontrolling interests of these items, utilizing a tax rate of 35%. The income tax effect of adjustments to non-GAAP net income assists investors in understanding the tax provision related to those adjustments using a tax rate of 35% related to ongoing operations. |
32
Table of Contents
The following table presents a reconciliation of net income attributable to HomeAway, Inc. to non-GAAP net income:
| Year Ended December 31, | ||||||||||||||||||||
| 2014 | 2013 | 2012 | 2011 | 2010 | ||||||||||||||||
| (in thousands) | ||||||||||||||||||||
| Net income attributable to HomeAway, Inc. |
$ | 13,384 | $ | 17,686 | $ | 14,961 | $ | 6,178 | $ | 16,934 | ||||||||||
| Add: |
||||||||||||||||||||
| Stock-based compensation |
48,518 | 37,887 | 27,033 | 23,933 | 13,512 | |||||||||||||||
| Amortization expense |
13,916 | 11,668 | 12,438 | 11,542 | 9,953 | |||||||||||||||
| Amortization of debt discount and issuance costs, net |
12,941 | — | — | — | — | |||||||||||||||
| Related tax effect |
(26,381 | ) | (17,343 | ) | (13,815 | ) | (12,416 | ) | (8,213 | ) | ||||||||||
| Changes to redemption value of noncontrolling interests |
2,421 | — | — | — | — | |||||||||||||||
| Impact on noncontrolling interest of non-GAAP adjustments |
(406 | ) | (78 | ) | — | — | — | |||||||||||||
|
|
|
|
|
|
|
|
|
|
|
|||||||||||
| Non-GAAP net income |
$ | 64,393 | $ | 49,820 | $ | 40,617 | $ | 29,237 | $ | 32,186 | ||||||||||
|
|
|
|
|
|
|
|
|
|
|
|||||||||||
Discussion of Non-GAAP Financial Measures
This Form 10-K contains non-GAAP financial measures: Adjusted EBITDA, free cash flow and non-GAAP net income, as defined above, as well as revenue adjusted for foreign currency, which we refer to as constant currency revenue. Revenue adjusted for foreign currency assumes foreign currency exchange rates used for translation based on the rates in effect for the comparable prior-year period. In order to compute our constant currency revenue, we divide our monthly U.S. dollar results by the applicable current year monthly average foreign exchange rates and then multiply those amounts by the applicable prior year monthly average foreign exchange rates. Adjusted EBITDA, free cash flow, non-GAAP net income and constant currency revenue are financial measures that are not calculated in accordance with accounting principles generally accepted in the United States, or GAAP. However, we believe that the use of Adjusted EBITDA, free cash flow, non-GAAP net income and constant currency revenue are useful to investors in evaluating our operating performance for the following reasons:
| • | our management uses adjusted EBITDA, free cash flow, non-GAAP net income and constant currency revenue in conjunction with GAAP financial measures as part of our assessment of our business and in communications with our board of directors concerning our financial performance; |
| • | Adjusted EBITDA, free cash flow, non-GAAP net income and constant currency revenue provide consistency and comparability with our past financial performance, facilitate period-to-period comparisons of operations, and also facilitate comparisons with other peer companies, many of which use similar non-GAAP financial measures to supplement their GAAP results; |
| • | securities analysts use Adjusted EBITDA, free cash flow, non-GAAP net income and constant currency revenue as supplemental measures to evaluate the overall operating performance of companies; and |
| • | Adjusted EBITDA and non-GAAP net income exclude non-cash charges, such as depreciation, amortization and stock-based compensation, because such non-cash expenses in any specific period may not directly correlate to the underlying performance of our business operations and can vary significantly between periods. |
Adjusted EBITDA, free cash flow, non-GAAP net income and constant currency revenue should not be reviewed in isolation. You should consider them in addition to, and not as substitutes for, measures of our financial performance reported in accordance with GAAP. Our Adjusted EBITDA, free cash flow, non-GAAP net income or constant currency revenue may not be comparable to similarly titled measures of other companies
33
Table of Contents
and because other companies may not calculate such measures in the same manner as we do. Adjusted EBITDA, free cash flow, non-GAAP net income and constant currency revenue have limitations as analytical tools. In addition, none of these measures reflect future requirements for contractual obligations.
Further limitations of Adjusted EBITDA include:
| • | this measure does not reflect changes in working capital; |
| • | this measure does not reflect interest income or interest expense; and |
| • | this measure does not reflect cash requirements for income taxes. |
34
Table of Contents
Item 7. Management’s Discussion and Analysis of Financial Condition and Results of Operations.
The following discussion and analysis of the financial condition and results of our operations should be read in conjunction with the consolidated financial statements and related notes included elsewhere in this filing. In addition to historical consolidated financial information, the following discussion contains forward-looking statements that reflect our plans, estimates and beliefs. These statements involve risks and uncertainties and our actual results could differ materially from those discussed below. See the “Forward Looking Statements” disclosure above for a discussion of the uncertainties, risks and assumptions associated with these statements. See also the “Risk Factors” disclosure above for additional discussion of such risks.
Overview
We operate the world’s largest online marketplace for the vacation rental industry, bringing together millions of travelers seeking vacation rentals online with the property owners and managers of over one million vacation rental properties located in over 190 countries around the world. Our portfolio includes leading vacation rental websites in Australia, Europe New Zealand, Singapore, South America and the United States. During 2014, our websites attracted approximately 884 million website visits, and as of December 31, 2014, our global marketplace included over one million paid listings. During 2014, we continued to focus on providing the largest selection of properties to travelers and the most qualified inquiries and bookings to property owners and managers.
The majority of our revenue is generated from our paid listing business. Our subscription listings generate the majority of our paid listing revenues and generally have annual terms. We improved monetization of our subscription listing base in 2014 through pricing and product changes including continued adoption of our tiered pricing structure and sales of bundled listings. This improved monetization can be seen in the increase in our average revenue per subscription listing in 2014. Tiered pricing allows property owners and managers with paid subscriptions to improve their position in search results by purchasing a higher subscription level, or tier. Bundled listings provide subscribers with the opportunity to purchase additional distribution on multiple HomeAway websites. We also offer performance-based pricing on some websites, which allows owners and managers to list their properties for free and pay us a commission for bookings. In order to grow our revenue from performance based listings, we will focus on increasing the number of bookings for these customers. Additionally, we believe that we can grow the number of paid listings and generate additional revenue.
We believe that having a large selection of qualified properties is necessary to attract and retain travelers. Our total paid listings grew in 2014 by 17.2% as we added more than 152,000 new paid listings, net of non-renewals, while performance-based listings grew by 71.0% as property owners and managers continued to adopt the new performance-based model. We expect that performance-based listings will continue to grow at a faster rate than subscriptions. Additionally, we are continually investing in product enhancements and property owner and manager communications to encourage high quality listings on our websites to ensure a positive experience for travelers.
Enablement of online booking capabilities on our websites has been and will continue to be a focus for our Company. While the inquiry process still remains important to many travelers in the selection of a vacation rental, we believe online bookable properties will provide a better experience for travelers and offers greater process efficiencies for many of our property owners and managers. We continue to see increased adoption of paid listings that are online bookable as well as increased adoption of our online payments platform, which is currently available on the majority of our websites.
We consider a listing to be online bookable when it has a fully updated calendar and rates, which allows the traveler to accurately estimate the cost of the stay. In some cases the booking will take place immediately and in other cases our owners and managers will require additional information before accepting or rejecting the booking request. As to payment processing, property owners and managers are encouraged but not required to use our payments platform which is continuously being improved to support multiple payment methods. This is
35
Table of Contents
important for our marketplace in our global environment. We also allow payments to be processed by offline or through integrated platforms. Property owners and managers, in some countries, can make value-added products available for purchase through our payments platform. We believe that adoption and increased use of our platform over time will allow us to earn more revenue from ancillary products while providing a more secure and efficient payment mechanism for travelers. We plan to introduce new products and services for travelers, property owners and managers which we believe will provide further opportunities to generate revenue through our marketplace.
We believe bringing travelers to our online marketplace is necessary to attract and retain vacation rental owners and managers. It is critical for us to increase the rate at which travelers book vacation rentals with our property owners and managers. To meet these challenges, which are even more important with the increase in performance-based listings, we are focused on a combination of marketing strategies including pay-per-click advertising, search engine optimization, and brand and display advertising, with a goal of driving more travelers and bookings to our websites as well as increasing the exposure of the vacation rental category. We expect spending in sales and marketing to increase over time as we add online and offline marketing campaigns to increase our brand awareness to travelers and property owners and managers, and as we increase our marketing support for our growing performance-based listing base. We are continuously investing in product enhancements to make it easier for travelers visiting our websites to search and find the right property, to inquire and to book their stay.
Our financial reporting currency is the U.S. Dollar and changes in foreign exchange rates significantly affect our reported results and consolidated trends. For example, if the U.S. Dollar strengthens year-over-year relative to currencies in our international locations, our consolidated revenues and operating expenses will be lower than if currencies had remained constant. Likewise, if the U.S. Dollar weakens year-over-year relative to currencies in our international locations, our consolidated revenues and operating expenses will be higher than if currencies had remained constant. We believe that our diversification beyond the U.S. economy through our international businesses benefits our stockholders over the long-term. We also believe it is useful to evaluate key operating results and growth rates before and after the effect of currency changes.
In addition, the re-measurement of our intercompany balances can result in significant gains and charges associated with the effect of movements in foreign currency exchange rates. Currency volatilities may continue, which may significantly impact (either positively or negatively) our reported results and consolidated trends and comparisons.
Acquisitions
Since our inception, we have acquired 22 businesses as part of our growth strategy. Our most recent acquisition was in March 2014, when we acquired Glad to Have You, Inc., a creator of a mobile guest management application designed for property owners and managers. The application is designed to better manage and communicate with guests before, during and after their vacation rental stay. We believe this acquisition will enable us to enhance our travelers’ vacation rental stay experience and provide our owners and managers with additional tools to manage their vacation rentals.
Our acquisitions have and will continue to present significant challenges as we integrate new operations, offices and employees and formulate and execute on marketing, product and technology strategies associated with the acquired businesses. In some cases, we continue to manage multiple brands and technology platforms of the acquired businesses, increasing our cost of operations. Challenges of this nature are likely to arise in future acquisitions.
Growth Opportunities and Trends
Our ability to further grow our revenue will depend largely on increasing the number of paid listings, increasing revenue per listing and increasing revenue from other products and services through our marketplace.
36
Table of Contents
Our achievement of these objectives will further depend on our ability to successfully enable more online bookable listings. Achieving growth in the number of paid listings involves our ability to increase our paid listing renewal rates, reach new property managers and owners through marketing or telesales activities or obtain new paid listings through geographic expansion, strategic acquisitions or investments. Increasing revenue per listing and revenue from other products and services will involve our ability to successfully drive adoption of tiered pricing, use of our payments platform, drive more bookings to our performance based listings and to successfully introduce new products to our marketplace.
In the future, we believe it will become more important to increase marketing investments to grow and further advertise our brand and products to travelers. We have seen other companies launch online businesses offering vacation rentals or other alternatives to hotels. We believe this growing favorable awareness of alternatives to hotels has and will continue to support growth in our business. However, we have also seen a trend of increased government regulation and taxation of the industry. We continue to monitor the effects of these trends and will take actions as necessary to mitigate their effects.
Key Financial Highlights
Since our commercial launch in 2005, our revenue growth has been attributable to our acquisitions of other online listings businesses, organic growth in the number of listings purchased by property owners and managers, increases in the average revenue we receive per listing due to additional features and price increases, and the introduction of additional products and services related to our marketplace. We view our market opportunity as global and have historically generated strong cash flows. Additionally, we have experienced predictable financial results because of our advance payment, subscription-based model and our high annual listing renewal rates. However, our revenue predictability may be affected as we develop new and alternative sources of revenue.
Key financial highlights for 2014 include the following:
| • | Total revenue was $446.8 million compared to $346.5 million in 2013, or an increase of 28.9%, and excluding the impact of foreign exchange rates, total revenue increased by 29.1%; |
| • | Percentage of total revenue from outside the United States was 41.3% in 2014, compared to 39.0% in 2013, and in 2014 included 33.4% from Europe and 7.9% from South America and Asia Pacific regions; |
| • | Listing revenue was $371.9 million compared to $294.7 million in 2013, or an increase of 26.2%, and contributed 83.3% and 85.0% of total revenue in 2014 and 2013, respectively; |
| • | Net income attributable to HomeAway, Inc. was $13.4 million, or $0.14 per diluted share, compared to $17.7 million, or $0.20 per diluted share, in 2013, or a decrease of 24.3% and reflective of incremental marketing and interest expenses in 2014; |
| • | Cash from operating activities was $145.4 million compared to $104.4 million in 2013, or an increase of 39.3%; |
| • | Adjusted EBITDA was $119.3 million compared to $96.7 million in 2013, or an increase of 23.4%; as a percentage of revenue, Adjusted EBITDA was 26.7%, a decrease of 120 basis points from 27.9% in 2013 and reflective of incremental marketing expense in 2014; |
| • | Free cash flow was $117.1 million compared to $93.0 million in 2013, or an increase of 25.9%; |
| • | Non-GAAP net income was $64.4 million, or $0.67 per diluted share, compared to non-GAAP net income of $49.8 million, or $0.56 per diluted share in 2013; and |
| • | Cash, cash equivalents and short-term investments as of December 31, 2014 were $813.2 million. |
For further discussion regarding Adjusted EBITDA, free cash flow, non-GAAP net income and constant currency revenue, along with reconciliations of such numbers to the most directly comparable financial measures
37
Table of Contents
calculated and presented in accordance with GAAP, please see the information under the caption “Selected Financial Data” in Item 6 of this Annual Report on Form 10-K.
Key Business Metrics
In addition to traditional financial and operational metrics, we use the following business metrics to monitor and evaluate results.
| Year Ended December 31, | ||||||||||||
| 2014 | 2013 | 2012 | ||||||||||
| Paid listings (in thousands): |
||||||||||||
| Subscription listings, end of period |
714 | 697 | 653 | |||||||||
| Performance listings, end of period |
329 | 193 | 59 | |||||||||
|
|
|
|
|
|
|
|||||||
| Total paid listings, end of period |
1,043 | 890 | 712 | |||||||||
| Paid listings, growth year-over-year |
17.2 | % | 25.0 | % | 11.0 | % | ||||||
| Average revenue per subscription listing |
$ | 479 | $ | 427 | $ | 378 | ||||||
| Average revenue per subscription listing, growth year-over-year |
12.2 | % | 13.0 | % | 3.6 | % | ||||||
| Subscription renewal rate, end of period |
71.7 | % | 72.5 | % | 73.8 | % | ||||||
| Visits to websites (in millions) |
884 | 752 | 600 | |||||||||
| Visits to websites, growth year-over-year |
17.6 | % | 25.6 | % | 20.9 | % | ||||||
Paid Listings. The vast majority of our revenue is derived from paid listings which we regularly track as a key revenue growth indicator and to identify trends in our business and industry. The growth in paid listings is due to our marketing and selling new and additional listings to property owners and managers, the introduction of performance-based listings, listings acquired in acquisitions and organic growth from property owners and managers who become aware of our websites and choose to market their properties. For the year, we added a significant number of performance-based listings.
When we migrate one of our websites to our global technology platform, property owners and managers that have listings on the pre-migrated website and on a website already on our global technology platform are able to consolidate their listings into one listing displayed on both websites. Additionally, platform consolidations allow property owners and managers to purchase bundled listings that include display on multiple websites that exist on the global technology platform. As a result of a website migration, we count each of these bundled listings as one listing. This impacts the comparability of our current period reported metrics to our previously reported metrics for paid listings, renewal rate and average revenue per listing. We migrated the VRBO.com website to our global technology platform in 2012 and in the second quarter of 2014, we migrated Homelidays.com to our global technology platform. Furthermore, we expect future platform migrations for certain of our websites, such as Stayz.com.au, to our global technology platform. When this occurs, property owners and managers who have purchased subscriptions on the website being migrated as well as other HomeAway websites will be given the opportunity to consolidate their listings through the purchase of a bundled listing. We expect these migrations to impact the comparability of future operating metrics.
As a result of consolidated and bundled listings, our paid listing counts will be lower because these listings previously would have been counted as multiple paid listings had they been purchased on multiple websites. The lower paid listing counts from consolidations and bundles will in turn lower our reported renewal rate. However, our bundled listing products generally have a higher overall price and we expect that they will increase our average revenue per listing. We will disclose and discuss the trends of the business resulting from these consolidated listings when there is a significant impact.
As the number of paid listings increases, we believe we will generate additional revenue while also expanding the value of the marketplace to travelers, thus increasing the likelihood travelers will find a property
38
Table of Contents
suitable to their needs. It is possible a specific property may be listed on more than one of our websites without indicating that the multiple listings refer to the same property.
Average Revenue per Subscription Listing. We compute average revenue per subscription listing as annualized subscription listing revenue divided by the average of paid subscription listings at the beginning and end of the period. We believe that trends in revenue per subscription listing, over an extended period, are important to understanding the value we bring to property owners and managers, and the overall health of our marketplace. As the majority of our listing business is generated from subscriptions, we use trends in revenue per subscription listing, as well as trends in paid listings, to formulate financial projections and make strategic business decisions. At a consolidated level, increases in revenue per subscription listing may increase our earnings or may be used for future investment. The average revenue per subscription listing may fluctuate based on the timing and nature of acquisitions, changes in our pricing, the impact of consolidated and bundled listing products, uptake and pricing of listing enhancements, seasonality, changes in brand and listing type mix, and the impact of foreign exchange rates on our listing revenue outside of the United States.
In order to increase revenue per subscription listing, we rely on increases in base pricing, adoption of tiered pricing and bundled listings for our property owners and managers. We began offering tiered pricing on HomeAway.com in the United States in 2011 and have continued to launch tiered pricing to our sites globally. In 2014, tiered pricing was launched on Homelidays.com in France and VacationRentals.com in the United States, bringing the total number of our websites that provide tiered pricing alternatives to ten. As we continue to implement tiered pricing on other websites, or change the prices or structure of tiered pricing, we may see an impact on listing sales in the period of the change and revenue thereafter.
Subscription Renewal Rate. The renewal rate for our subscription listings at the end of any period is defined as the percentage of those paid listings that were active at the end of the period ended twelve months prior that are still active as of the end of the reported period. Unique property subscription listings removed from property managers’ accounts and subsequently replaced with new subscription listings within the same property manager’s account listings are not considered as renewals in our renewal rate calculation. We include most subscription listings in our calculation of renewal rate, with the exception of subscriptions sold by BedandBreakfast.com, Toprural.com, and Bookabach.co.nz, which will remain excluded until we can further develop our systems. However, based on our review of other internal renewal rate data, we do not believe the exclusion of these brands from the renewal rate calculation materially impacts the result. We exclude pay-for-performance listings from our renewal rate analysis since they are not sold on a subscription basis.
Renewal of paid subscription listings is a key driver of revenue for our business. We track renewal rate in order to understand and improve property owners’ and managers’ satisfaction and to help us more accurately estimate our future revenue and cash flows. Our overall renewal rate decreased in 2014 due to lower renewal rates for our customers in Europe and decreased in 2013 due to the impact of consolidated listings. Lower renewal rates for our customers in Europe were a result of decreased demand attributable to the European economy and competitive pressures. After adjusting for consolidated listings, our renewal rate as of December 31, 2014 is estimated to be 72.6% compared to 74.8% in 2013. We continue to make product improvements and increase our investment in demand generation for property owners and managers in order to increase customer satisfaction and improve renewal rates. In addition, several other factors affect renewal rates including our property owners’ and managers’ ability to consolidate their listings, their ability to purchase geographic bundled listings and our use of promotional pricing to attract new subscribers. Our paid subscription listing renewal rate could also be impacted by property owners and managers who elect to list their properties through our pay-per-booking commission offering, rather than paying a subscription fee.
Visits to Websites. We view visits to websites as a key indicator of growth in our brand awareness among users and our ability to provide our property owners and managers with inquiries and bookings from travelers. Growth in visits to websites will be driven by our marketing strategies and has both a direct and indirect impact on our financial performance. We use a variety of tools to measure visits to our websites, including solutions
39
Table of Contents
from third parties such as Omniture and Google Analytics. We also review third-party published reports to measure our results against comparable companies; however, these reports are frequently inconsistent with our internal measurements.
We believe that certain quality initiatives aimed at reducing the number of visits required to secure a booking may have a negative impact on growth in visits while providing a positive experience for travelers, owners and managers. These initiatives include online booking, quotable rates, and continuous improvements to our search functionality to help travelers locate appropriate properties more quickly.
Critical Accounting Policies and Estimates
Our consolidated financial statements include the accounts of our U.S.-based operations and our partially and wholly-owned subsidiaries throughout the world and are prepared in accordance with U.S. GAAP. The preparation of these consolidated financial statements requires us to make estimates and assumptions that affect the reported amounts of assets, liabilities, revenue, costs and expenses, and related disclosures. On an ongoing basis, we evaluate our estimates and assumptions. To the extent there are material differences between these estimates and our actual results, our consolidated financial statements will be affected.
Our significant accounting policies are described in Note 2 to the accompanying consolidated financial statements. The methods, estimates and judgments we use in applying our accounting policies have a significant impact on our results of operations. Accordingly, we believe the policies listed below involve the greatest degree of complexity and judgment by our management and are the most critical for understanding and evaluating our financial condition and results of operations.
Revenue Recognition
We recognize revenue when persuasive evidence of an agreement exists, delivery has occurred, the sales price is fixed or determinable and collectability is reasonably assured. We account for sales incentives to customers as a reduction of revenue at the time the revenue is recognized from the related product sale. We also report revenue net of any sales tax collected.
We generate a significant portion of our revenue from customers for online advertising services related to the listing of their properties for rent, primarily on a subscription basis, over a fixed-term. We also generate revenue from commissions on bookings or traveler inquiries on our performance-based listings. Additional revenues are derived from local and national Internet display advertisers, licensing of property management software and the sales of support and ancillary products and services.
Payments for term-based paid subscriptions received in advance of services being rendered are recorded as deferred revenue and recognized ratably on a straight-line basis over the listing period. Revenue for performance-based listings is calculated as a percentage of the traveler booking or a fixed fee-per-inquiry stated in the arrangement and recognized when the service has been performed or as the customers’ refund privileges lapse. Payments received from sales of hosted software solutions and from sales of gift cards are also recorded as deferred revenue and recognized as revenue over the period commensurate with the delivery of the service or the expected use of the gift card, respectively.
Business Combinations
The purchase prices of acquired businesses have been allocated to the tangible and intangible assets acquired and liabilities assumed, based upon their estimated fair value at the date control is obtained. The difference between the purchase price and the fair value of the net assets acquired is recorded as goodwill.
Most of the businesses we have acquired did not have a significant amount of tangible assets. We typically identified the following identifiable intangible assets in each acquisition: trade name, customer relationships,
40
Table of Contents
internal software and non-compete agreements. Our valuation estimates used similar methodologies and assumptions as most of the businesses acquired were substantially the same and were acquired either simultaneously or within a short time period of each other. In making certain assumptions on valuation and useful lives, we considered the unique nature of each acquired asset.
Determining the estimated fair value of assets involves the use of significant estimates, judgment and assumptions, such as future cash flows and selection of comparable companies. Future changes in our assumptions or the interrelationship of those assumptions may negatively impact future valuations and could result in an impairment of goodwill or intangible assets that may have a material effect on our financial condition and operating results.
Definite-lived intangible assets are recorded at cost and amortized using a method that reflects our best estimate of the pattern in which the economic benefit of the related intangible asset is utilized.
Goodwill and indefinite-lived intangible assets, such as certain trade names, are not amortized and are subject to annual impairment tests during the fourth quarter, or whenever events or circumstances indicate impairment may have occurred. For goodwill and indefinite lived intangible assets, we complete what is referred to as the “Step 0” analysis which involves evaluating qualitative factors including macroeconomic conditions, industry and market considerations, cost factors, and overall financial performance. If our “Step 0” analysis indicates it is more likely than not that the fair value is less than the carrying amount, we would perform a quantitative two-step impairment test. The quantitative analysis compares the fair value of our reporting unit or indefinite-lived intangible assets to the carrying amounts, and an impairment loss is recognized equivalent to the excess of the carrying amount over the fair value.
Convertible senior notes and the related warrants and hedges
We issued convertible senior notes in March 2014. Upon issuance, we separated the Notes into liability and equity components. The carrying amount of the liability component was calculated by measuring the fair value of a similar liability that does not have an associated convertible feature. The carrying amount of the equity component representing the conversion option was determined by deducting the fair value of the liability component from the par value of the Notes as a whole. The excess of the principal amount of the liability component over its carrying amount (“debt discount”) is amortized to interest expense over the term of the Notes using the effective interest rate method. The equity component is not remeasured as long as it continues to qualify for equity classification.
In accounting for the transaction costs related to the Note issuance, we allocated the total amount incurred to the liability and equity components based on their relative values. Transaction costs attributable to the liability component are being amortized to expense over the term of the Notes using the effective interest rate method, and transaction costs attributable to the equity component were netted with the equity component in stockholders’ equity.
To minimize the impact of potential economic dilution upon conversion of the Notes, we entered into convertible note hedge transactions with respect to our common stock (the “Note Hedges”). The Note Hedges cover shares of our common stock at a strike price of $52.16 and are exercisable upon conversion of the Notes. The Note Hedges will expire upon the maturity of the Notes and are intended to reduce the potential economic dilution upon conversion of the Notes in the event that the market value per share of our common stock, as measured under the Notes, at the time of exercise is greater than the conversion price of the Notes. The purchase of the Note Hedges is recorded as a component of additional paid-in capital in our consolidated balance sheets.
Separately, in March 2014, we entered into warrant transactions (the “Warrants”), whereby we sold warrants to acquire, subject to anti-dilution adjustments, shares of our common stock at $81.14 per share. The Warrants have a term of five years from the date of issuance. If the average market value per share of our common stock
41
Table of Contents
for the reporting period, as measured under the Warrants, exceeds the strike price of the Warrants, the Warrants would have a dilutive effect on our earnings per share if we report net income. The sale of the Warrants is recorded as a component of additional paid-in capital in our consolidated balance sheets.
Stock-Based Compensation
We have stock-based compensation plans which allow for the issuance of stock-based awards, including stock options, restricted stock units and restricted stock awards. We account for stock-based compensation expense by amortizing the fair value of each stock-based award expected to vest over the requisite service or performance period. The fair value of restricted stock awards is based on the number of shares granted and the closing price of our common stock on the date of grant. The fair value of each stock option award is calculated on the date of grant using the Black-Scholes option-pricing model.
The Black-Scholes model requires various assumptions including fair value of the underlying stock, volatility, expected term, risk-free interest rate and expected dividends. We use our historical experience to estimate the expected forfeiture rate of awards, and only recognize expense for those awards expected to vest. To the extent the actual forfeiture rate is different from the estimate, stock-based compensation expense is adjusted accordingly. If any of the assumptions we use in estimating the fair value of awards change significantly or the actual forfeiture rate is different than the estimate, stock-based compensation expense may differ materially in the future.
Income Taxes
We account for income taxes in accordance with the liability method, whereby deferred tax asset and liability account balances are determined based on differences between financial reporting and the tax bases of assets and liabilities and are measured using the enacted tax rates and laws that will be in effect when the differences are expected to reverse. These differences result in deferred tax assets and liabilities, which are included in our consolidated balance sheets. We then assess the likelihood that the deferred tax assets will be recovered from future taxable income and the reversal of temporary taxable differences. A valuation allowance is established against deferred tax assets to the extent we believe that recovery is not likely. Significant judgment is required in determining any valuation allowance to be recorded. In assessing the need for a valuation allowance, we consider all available evidence, including past operating results, estimates of future taxable income, reversals of taxable temporary differences and the feasibility of tax planning over the periods in which the temporary differences are deductible. In the event we change our determination as to the amount of deferred tax assets that can be realized, we will adjust our valuation allowance with a corresponding impact to the provision for income taxes in the period in which the determination is made.
The difference between our effective income tax rate and the federal statutory rate is primarily a function of the mix of foreign versus U.S. income, the impact of foreign tax rates, uncertain tax positions, the research and experimentation credit and permanent differences, including stock-based compensation charges and non-deductible charges. Our provision for income taxes is subject to volatility and could be adversely impacted if earnings or tax rates differ from our expectations or if new tax laws are enacted in countries where we do business.
Significant judgment is required in evaluating any uncertain tax positions, including the timing and amount of deductions and allocations of income among various tax jurisdictions. We are required to identify, evaluate and measure all uncertain tax positions taken or to be taken on tax returns and to record liabilities for the amount of these positions that may not be sustained, or may only partially be sustained, upon examination by the relevant taxing authorities. Although we believe that our estimates and judgments are reasonable, actual results may differ from these estimates. Some or all of these judgments are subject to review by the taxing authorities. We adjust these reserves in light of changing facts and circumstances, such as the closing of an audit or the refinement of an estimate. To the extent that the final outcome of a matter is different than the amount recorded, such differences will impact the provision for income taxes in the period in which the determination is made. The provision for income taxes includes the impact of reserve provisions and changes to reserves that are considered appropriate, as well as any related net interest and penalties.
42
Table of Contents
Our provision for income taxes does not include provisions for U.S. income taxes and foreign withholding taxes associated with the repatriation of undistributed earnings of any of our foreign subsidiaries because we intend to invest our non-U.S. earnings permanently in foreign operations. If these earnings were distributed to the U.S. in the form of dividends or otherwise, or if the shares of the relevant foreign subsidiaries were sold or otherwise transferred, we would be subject to additional U.S. income taxes (subject to adjustment for foreign tax credits) and foreign withholding taxes.
Historically, we have generated most of our current taxable income outside of the United States due to net operating loss carryforwards and stock option deductions available for utilization in the United States. We will continue to expand our business outside of the United States, in which case, we will become subject to further taxation based on foreign statutory tax rates in those jurisdictions where we operate, and our effective tax rate may fluctuate as a result.
We maintain our European headquarters in Geneva, Switzerland to streamline our European operations. While this structure provides a lower tax rate in Europe as we shift investment to that region, regional earnings are lower than anticipated in jurisdictions with lower tax rates and higher than anticipated in countries with higher tax rates.
We have benefited from the U.S. research and experimentation tax credit incentive extended to taxpayers engaged in qualified research and experimental activities while carrying on a trade or business. The tax credit expired on December 31, 2014, and if not renewed under similar terms as in prior years, the result could have a material impact on our future financial results.
43
Table of Contents
Results of Operations
The following tables present our historical operating results and our historical operating results as a percentage of revenue.
| Year Ended December 31, | ||||||||||||
| 2014 | 2013 | 2012 | ||||||||||
| (in thousands, except per share data) | ||||||||||||
| Consolidated Statements of Operations Data: |
||||||||||||
| Revenue: |
||||||||||||
| Listing |
$ | 371,939 | $ | 294,661 | $ | 238,413 | ||||||
| Other |
74,823 | 51,828 | 41,991 | |||||||||
|
|
|
|
|
|
|
|||||||
| Total revenue |
446,762 | 346,489 | 280,404 | |||||||||
| Costs and expenses: |
||||||||||||
| Cost of revenue (exclusive of amortization shown separately below) |
67,612 | 54,638 | 45,342 | |||||||||
| Product development |
77,082 | 58,226 | 43,152 | |||||||||
| Sales and marketing |
154,995 | 112,967 | 93,366 | |||||||||
| General and administrative |
93,131 | 75,169 | 56,311 | |||||||||
| Amortization expense |
13,916 | 11,668 | 12,438 | |||||||||
|
|
|
|
|
|
|
|||||||
| Total costs and expenses |
406,736 | 312,668 | 250,609 | |||||||||
|
|
|
|
|
|
|
|||||||
| Operating income |
40,026 | 33,821 | 29,795 | |||||||||
| Other income (expense): |
||||||||||||
| Interest expense |
(13,333 | ) | — | — | ||||||||
| Interest income |
1,728 | 1,211 | 928 | |||||||||
| Other expense |
(7,182 | ) | (6,017 | ) | (2,587 | ) | ||||||
|
|
|
|
|
|
|
|||||||
| Total other income (expense) |
(18,787 | ) | (4,806 | ) | (1,659 | ) | ||||||
|
|
|
|
|
|
|
|||||||
| Income before income taxes |
21,239 | 29,015 | 28,136 | |||||||||
| Income tax expense |
(7,272 | ) | (11,724 | ) | (13,175 | ) | ||||||
|
|
|
|
|
|
|
|||||||
| Net income |
13,967 | 17,291 | 14,961 | |||||||||
| Less: Impact of noncontrolling interests, net of tax |
583 | (395 | ) | — | ||||||||
|
|
|
|
|
|
|
|||||||
| Net income attributable to HomeAway, Inc. |
13,384 | 17,686 | 14,961 | |||||||||
|
|
|
|
|
|
|
|||||||
| Net income per share attributable to HomeAway, Inc.: |
||||||||||||
| Basic |
$ | 0.14 | $ | 0.21 | $ | 0.18 | ||||||
| Diluted |
$ | 0.14 | $ | 0.20 | $ | 0.18 | ||||||
|
|
|
|
|
|
|
|||||||
| Weighted average number of shares outstanding: |
||||||||||||
| Basic |
93,727 | 85,378 | 82,382 | |||||||||
| Diluted |
96,481 | 88,259 | 84,942 | |||||||||
|
|
|
|
|
|
|
|||||||
44
Table of Contents
| Year Ended December 31, | ||||||||||||
| 2014 | 2013 | 2012 | ||||||||||
| Consolidated Statements of Operations as a Percentage of Revenue: |
||||||||||||
| Revenue: |
||||||||||||
| Listing |
83.3 | % | 85.0 | % | 85.0 | % | ||||||
| Other |
16.7 | 15.0 | 15.0 | |||||||||
|
|
|
|
|
|
|
|||||||
| Total revenue |
100.0 | 100.0 | 100.0 | |||||||||
| Costs and expenses: |
||||||||||||
| Cost of revenue (exclusive of amortization shown separately below) |
15.1 | 15.8 | 16.2 | |||||||||
| Product development |
17.3 | 16.8 | 15.4 | |||||||||
| Sales and marketing |
34.7 | 32.6 | 33.3 | |||||||||
| General and administrative |
20.8 | 21.7 | 20.1 | |||||||||
| Amortization expense |
3.1 | 3.4 | 4.4 | |||||||||
|
|
|
|
|
|
|
|||||||
| Total costs and expenses |
91.0 | 90.2 | 89.4 | |||||||||
|
|
|
|
|
|
|
|||||||
| Operating income |
9.0 | 9.8 | 10.6 | |||||||||
| Other income (expense): |
||||||||||||
| Interest expense |
(3.0 | ) | — | — | ||||||||
| Interest income |
0.4 | 0.3 | 0.3 | |||||||||
| Other expense |
(1.6 | ) | (1.7 | ) | (0.9 | ) | ||||||
|
|
|
|
|
|
|
|||||||
| Total other income (expense) |
(4.2 | ) | (1.4 | ) | (0.6 | ) | ||||||
|
|
|
|
|
|
|
|||||||
| Income before income taxes |
4.8 | 8.4 | 10.0 | |||||||||
| Income tax expense |
(1.6 | ) | (3.4 | ) | (4.7 | ) | ||||||
|
|
|
|
|
|
|
|||||||
| Net income |
3.1 | 5.0 | 5.3 | |||||||||
| Less: Impact of noncontrolling interests, net of tax |
0.1 | (0.1 | ) | — | ||||||||
|
|
|
|
|
|
|
|||||||
| Net income attributable to HomeAway, Inc. |
3.0 | % | 5.1 | % | 5.3 | % | ||||||
|
|
|
|
|
|
|
|||||||
Comparison of the Years Ended December 31, 2014 and 2013
Revenue
| Year Ended December 31, | ||||||||||||||||||||||||
| 2014 | 2013 | Change | ||||||||||||||||||||||
| Revenue |
Amount | Percentage of Revenue |
Amount | Percentage of Revenue |
Amount | Percent | ||||||||||||||||||
| (dollars in thousands) | ||||||||||||||||||||||||
| Listing |
$ | 371,939 | 83.3 | % | $ | 294,661 | 85.0 | % | $ | 77,278 | 26.2 | % | ||||||||||||
| Other |
74,823 | 16.7 | 51,828 | 15.0 | 22,995 | 44.4 | ||||||||||||||||||
|
|
|
|
|
|
|
|
|
|
|
|
|
|||||||||||||
| Total |
$ | 446,762 | 100.0 | % | $ | 346,489 | 100.0 | % | $ | 100,273 | 28.9 | % | ||||||||||||
|
|
|
|
|
|
|
|
|
|
|
|
|
|||||||||||||
| Year Ended December 31, | ||||||||||||||||||||||||
| 2014 | 2013 | Change | ||||||||||||||||||||||
| Revenue |
Amount | Percentage of Revenue |
Amount | Percentage of Revenue |
Amount | Percent | ||||||||||||||||||
| (dollars in thousands) | ||||||||||||||||||||||||
| United States |
$ | 262,412 | 58.7 | % | $ | 211,473 | 61.0 | % | $ | 50,939 | 24.1 | % | ||||||||||||
| International |
184,350 | 41.3 | 135,016 | 39.0 | 49,334 | 36.5 | ||||||||||||||||||
|
|
|
|
|
|
|
|
|
|
|
|
|
|||||||||||||
| Total |
$ | 446,762 | 100.0 | % | $ | 346,489 | 100.0 | % | $ | 100,273 | 28.9 | % | ||||||||||||
|
|
|
|
|
|
|
|
|
|
|
|
|
|||||||||||||
45
Table of Contents
While our overall revenue growth rate for 2014 was 28.9%, our organic revenue growth rate was 21.4%, due to revenue from our 2013 acquisitions of travelmob, Bookabach and Stayz, and the March 2014 acquisition of Glad to Have You which were not included in our organic revenue growth rate. We consider growth to be organic if generated from businesses owned for at least 12 months. Our comparative organic revenue growth rate during the year ended December 31, 2013 was 22.2%.
Listings Revenue
Our core listing business revenue increased primarily due to increases in new paid listings and average revenue per listing. During 2014, paid listings increased from 890,000 to 1.0 million primarily due to the introduction of pay-per-booking listings, but also due to marketing and selling new and additional listings to property owners and managers as well as organic growth from property owners and managers who become aware of our websites and choose to market their properties. Our average revenue per subscription listing was $479 in 2014 compared to $427 in 2013, an increase of $52, or 12.2%. We continued to improve monetization of our subscription listing base through continued adoption of our tiered pricing structure and an increase in bundled listings products.
Other Revenue
Other revenue increased by $23.0 million during 2014. Revenue from products focused on travelers and property owners, such as insurance products, the Carefree Rental Guarantee and software products, including related maintenance and training, increased by $15.6 million in 2014. Furthermore, revenue from Internet display advertising and merchant bank credit card royalties increased by $6.9 million in 2014.
Revenue Growth in Constant Currency
We invoice and collect payments in the Euro, British Pound, Brazilian Reis, Australian Dollar and Singapore Dollar, as well as other currencies. As a result, our total revenue is affected by changes in the value of the U.S. dollar relative to these other currencies. In order to provide a comparable framework for assessing our business performance, excluding the effect of foreign currency fluctuations, we analyze year-over-year revenue growth on a constant currency basis by calculating revenue in the current period using exchange rates from comparable prior period. In 2014, the year-over-year growth in listing revenue measured on a constant currency basis was 26.4%, compared with 26.2% as reported. The year-over-year growth in total revenue in 2014 measured on a constant currency basis was 29.1%, compared with 28.9% as reported.
Cost of Revenue
| Year Ended December 31, | ||||||||||||||||||||||||
| 2014 | 2013 | Change | ||||||||||||||||||||||
| Amount | Percentage of Revenue |
Amount | Percentage of Revenue |
Amount | Percent | |||||||||||||||||||
| (dollars in thousands) | ||||||||||||||||||||||||
| Cost of revenue |
$ | 67,612 | 15.1 | % | $ | 54,638 | 15.8 | % | $ | 12,974 | 23.7 | % | ||||||||||||
|
|
|
|
|
|
|
|
|
|
|
|
|
|||||||||||||
Compensation costs for our customer service and web-hosting personnel, including non-cash stock-based compensation, increased by $4.3 million due to 80 new customer support and web-hosting personnel in 2014 and the full year impact of adding 44 new customer support and web-hosting personnel in 2013. However, as a percentage of revenue, our compensation costs were lower by 0.9% in 2014 than in the 2013. With the increased headcount and higher investments in hosting equipment, we incurred a higher expense for facilities and depreciation of computer equipment, furniture and leasehold improvements, which increased by $1.6 million, or 19.5%. Other increases included $2.6 million in increases in equipment expenses, web hosting fees and merchant fees, $2.5 million in increases in contracting and professional fees and $1.2 million in increases in software licenses and maintenance for our corporate systems.
46
Table of Contents
We will continue to increase expenses across the organization to support our growth and expect our cost of revenue to grow in absolute dollars and remain relatively constant as a percentage of revenue in 2015.
Product Development
| Year Ended December 31, | ||||||||||||||||||||||||
| 2014 | 2013 | Change | ||||||||||||||||||||||
| Amount | Percentage of Revenue |
Amount | Percentage of Revenue |
Amount | Percent | |||||||||||||||||||
| (dollars in thousands) | ||||||||||||||||||||||||
| Product development |
$ | 77,082 | 17.3 | % | $ | 58,226 | 16.8 | % | $ | 18,856 | 32.4 | % | ||||||||||||
| Capitalized software development costs |
8,133 | 1.8 | 9,005 | 2.6 | (872 | ) | (9.7 | ) | ||||||||||||||||
|
|
|
|
|
|
|
|
|
|
|
|
|
|||||||||||||
| Total product and technology costs expensed and capitalized |
$ | 85,215 | 19.1 | % | $ | 67,231 | 19.4 | % | $ | 17,984 | 26.7 | % | ||||||||||||
|
|
|
|
|
|
|
|
|
|
|
|
|
|||||||||||||
Compensation costs for product and development personnel, including non-cash stock-based compensation, increased by $14.9 million due to 43 new employees in product development in 2014 and the full year impact of adding 94 new employees in 2013. Overall increases in headcount also drove higher facilities and depreciation expense of $2.1 million. Including capitalized software development costs, total product and development expenses decreased slightly as a percentage of revenue to 19.1% of revenue in 2014 due to lower spending on external professional contractors and services.
During 2015, we expect to incur higher product development expenses in absolute dollars and remain relatively consistent as a percentage of revenue, as we expand our team to develop new features and products and incur a full year impact of personnel hired in 2014.
Sales and Marketing
| Year Ended December 31, | ||||||||||||||||||||||||
| 2014 | 2013 | Change | ||||||||||||||||||||||
| Amount | Percentage of Revenue |
Amount | Percentage of Revenue |
Amount | Percent | |||||||||||||||||||
| (dollars in thousands) | ||||||||||||||||||||||||
| Sales and marketing |
$ | 154,995 | 34.7 | % | $ | 112,967 | 32.6 | % | $ | 42,028 | 37.2 | % | ||||||||||||
|
|
|
|
|
|
|
|
|
|
|
|
|
|||||||||||||
Compensation costs for sales and marketing personnel, including non-cash stock-based compensation, increased by $15.1 million due to 71 new employees in sales and marketing in 2014 and the full year impact of adding 121 new employees in 2013. Overall increases in headcount also drove higher facilities and depreciation expense of $2.8 million. Direct marketing expenses are the primary reason for the increase of sales and marketing expenses as a percentage of revenue in 2014 and increased by $21.3 million due to increased spending on pay-per-click, display advertising, affiliate marketing and broad reach television. Other increases included $2.0 million from travel expenses and professional fees.
During 2015, we expect to incur higher sales and marketing expenses in absolute dollars and as a percentage of revenue as we increase our marketing activities to generate additional traveler demand to paid listings and continue to build brand and category awareness as well as continue to build our sales team to serve professional property managers.
47
Table of Contents
General and Administrative
| Year Ended December 31, | ||||||||||||||||||||||||
| 2014 | 2013 | Change | ||||||||||||||||||||||
| Amount | Percentage of Revenue |
Amount | Percentage of Revenue |
Amount | Percent | |||||||||||||||||||
| (dollars in thousands) | ||||||||||||||||||||||||
| General and administrative |
$ | 93,131 | 20.8 | % | $ | 75,169 | 21.7 | % | $ | 17,962 | 23.9 | % | ||||||||||||
|
|
|
|
|
|
|
|
|
|
|
|
|
|||||||||||||
Compensation costs for general and administrative personnel, including non-cash stock-based compensation, increased by $11.7 million due to 44 new employees and executives in operations, finance, human resources, and legal in 2014 and the full year impact of adding 55 new employees in 2013. Overall increases in headcount also drove higher facilities and depreciation expense of $1.3 million. Other increases included $1.8 million in certain foreign operating taxes and $0.9 million of expense related to estimated claims under the Basic Rental Guarantee offered to travelers.
During 2015, we expect to incur higher general and administrative expenses in absolute dollars, but lower as a percentage of revenue, as we support the expansion of our business model, the growth of our business internationally and the ongoing requirements of being a publicly traded company.
Amortization
| Year Ended December 31, | ||||||||||||||||||||||||
| 2014 | 2013 | Change | ||||||||||||||||||||||
| Amount | Percentage of Revenue |
Amount | Percentage of Revenue |
Amount | Percent | |||||||||||||||||||
| (dollars in thousands) | ||||||||||||||||||||||||
| Amortization expense |
$ | 13,916 | 3.1 | % | $ | 11,668 | 3.4 | % | $ | 2,248 | 19.3 | % | ||||||||||||
|
|
|
|
|
|
|
|
|
|
|
|
|
|||||||||||||
The increase in amortization expense in 2014 included additional expense of $5.2 million from the addition of intangible assets from recent acquisitions, offset by a decrease of $3.0 million from certain intangible assets becoming fully amortized.
During 2015, we expect our amortization expenses to decrease in both absolute dollars and as a percentage of revenue as compared to 2014. However, amortization expense could increase as a result of future acquisition activity.
Other Income (Expense)
| Year Ended December 31, | ||||||||||||||||||||||||
| 2014 | 2013 | Change | ||||||||||||||||||||||
| Amount | Percentage of Revenue |
Amount | Percentage of Revenue |
Amount | Percent | |||||||||||||||||||
| (dollars in thousands) | ||||||||||||||||||||||||
| Other expense |
$ | (18,787 | ) | (4.2 | )% | $ | (4,806 | ) | (1.4 | )% | $ | (13,981 | ) | 290.9 | % | |||||||||
|
|
|
|
|
|
|
|
|
|
|
|
|
|||||||||||||
Other income (expense) in 2014 includes interest expense of $13.3 million, partially offset by interest income of $1.7 million, compared to $1.2 million of interest income in the previous year. The increase in interest expense is due to the Notes issued in March 2014 of which $13.1 million relates to the non-cash amortization of the debt discount and issuance costs. In addition, other income (expense) in 2014 includes approximately $7.1 million in losses from foreign currency related transactions, compared to losses of $6.0 million in 2013. These losses consist primarily of hedging costs and gains/losses on forward contracts used to hedge exposures related to intercompany loans and other assets and liabilities denominated in foreign currencies. These losses also include the re-measurement of certain intercompany loans and other assets and liabilities denominated in foreign currencies that are not hedged.
48
Table of Contents
Income Taxes
| Year Ended December 31, | ||||||||||||||||||||||||
| 2014 | 2013 | Change | ||||||||||||||||||||||
| Amount | Percentage of Revenue |
Amount | Percentage of Revenue |
Amount | Percent | |||||||||||||||||||
| (dollars in thousands) | ||||||||||||||||||||||||
| Income tax expense |
$ | (7,272 | ) | (1.6 | )% | $ | (11,724 | ) | (3.4 | )% | $ | 4,452 | (38.0 | )% | ||||||||||
|
|
|
|
|
|
|
|
|
|
|
|
|
|||||||||||||
The change in income tax expense from $11.7 million in 2013 to $7.3 million in 2014 is primarily related to a reduction in income before income taxes, a benefit related to the tax basis in intangibles resulting from the merger of subsidiaries in Spain, and a decrease in non-deductible expenses, specifically expenses related to acquisitions, offset by an increase in nondeductible stock-based compensation. In addition, there was an increase in our foreign tax rate differential benefit due to increased earnings in lower tax jurisdictions, specifically increased earnings of our Swiss subsidiary partially offset by increased losses in our subsidiary operating in Singapore, and an increase in income tax expense related to valuation allowances recorded in the year, primarily related to our subsidiaries in Switzerland and Singapore. Our effective tax rate in 2014 was 34.2% compared to an effective tax rate of 40.4% in 2013.
In both years, we benefited from the U.S. research and experimentation tax credit incentive extended to taxpayers engaged in qualified research and experimental activities while carrying on a trade or business. The tax credit expired on December 31, 2014, and if not renewed under similar terms as in prior years, the result could have a material impact on our future financial results.
Comparison of the Years Ended December 31, 2013 and 2012
Revenue
| Year Ended December 31, | ||||||||||||||||||||||||
| 2013 | 2012 | Change | ||||||||||||||||||||||
| Revenue |
Amount | Percentage of Revenue |
Amount | Percentage of Revenue |
Amount | Percent | ||||||||||||||||||
| (dollars in thousands) | ||||||||||||||||||||||||
| Listing |
$ | 294,661 | 85.0 | % | $ | 238,413 | 85.0 | % | $ | 56,248 | 23.6 | % | ||||||||||||
| Other |
51,828 | 15.0 | 41,991 | 15.0 | 9,837 | 23.4 | ||||||||||||||||||
|
|
|
|
|
|
|
|
|
|
|
|
|
|||||||||||||
| Total |
$ | 346,489 | 100.0 | % | $ | 280,404 | 100.0 | % | $ | 66,085 | 23.6 | % | ||||||||||||
|
|
|
|
|
|
|
|
|
|
|
|
|
|||||||||||||
| Year Ended December 31, | ||||||||||||||||||||||||
| 2013 | 2012 | Change | ||||||||||||||||||||||
| Revenue |
Amount | Percentage of Revenue |
Amount | Percentage of Revenue |
Amount | Percent | ||||||||||||||||||
| (dollars in thousands) | ||||||||||||||||||||||||
| United States |
$ | 211,473 | 61.0 | % | $ | 173,078 | 61.7 | % | $ | 38,395 | 22.2 | % | ||||||||||||
| International |
135,016 | 39.0 | 107,326 | 38.3 | 27,690 | 25.8 | ||||||||||||||||||
|
|
|
|
|
|
|
|
|
|
|
|
|
|||||||||||||
| Total |
$ | 346,489 | 100.0 | % | $ | 280,404 | 100.0 | % | $ | 66,085 | 23.6 | % | ||||||||||||
|
|
|
|
|
|
|
|
|
|
|
|
|
|||||||||||||
While our overall revenue growth rate for 2013 was 23.6%, our organic revenue growth rate was 22.2%. This difference was due to the fact that the acquisition of Toprural during 2012 and the 2013 acquisitions of travelmob, Bookabach and Stayz were not included in our organic revenue growth rate. We consider growth to be organic if generated from businesses we have owned for at least 12 months.
49
Table of Contents
Listings Revenue
Our core listing business revenue increased, primarily due to an increase in new listings and average revenue per listing. During 2013, paid listings increased from approximately 712,000 to 890,000 due to our marketing and selling new and additional listings to property owners and managers, the introduction of pay-per-booking listings, listings acquired in acquisitions and organic growth from property owners and managers who become aware of our websites and choose to market their properties. In addition, we added approximately 62,000 listings in the Asia Pacific region as part of our acquisitions of travelmob, Bookabach and Stayz. Our average revenue per listing was $368 in 2013 compared to $353 in 2012, an increase of $15, or 4.2%. We continued to improve monetization of our subscription listing base through continued adoption of our tiered pricing structure and from an increase in purchases of bundled listings products.
Other Revenue
Other revenue increased by $9.8 million in 2013 compared to 2012. Revenue from products focused on travelers, such as insurance products and the Carefree Rental Guarantee, generated increased revenue of $5.3 million. Furthermore, revenue from our owner reservation tool and the related merchant bank credit card royalties increased by $1.9 million. Revenue from our software products, including related maintenance and training, generated increased revenue of $0.9 million while revenue generated from our channel partners increased $1.2 million.
Revenue Growth in Constant Currency
During 2013, we invoiced and collected payments in the Euro, British Pound, Brazilian Reis, Australian Dollar and Singapore Dollar, as well as other currencies in their respective regions. As a result, our total revenue was affected by changes in the value of the U.S. dollar relative to these other currencies. In order to provide a comparable framework for assessing our business performance, excluding the effect of foreign currency fluctuations, we analyze year-over-year revenue growth on a constant currency basis by calculating revenue in the current period using exchange rates from the comparable prior period. In 2013, the year-over-year growth in listing revenue measured on a constant currency basis was 22.9%, compared with 23.6% as reported. The year-over-year growth in total revenue in 2013 measured on a constant currency basis was 23.0%, compared with 23.6% as reported.
Cost of Revenue
| Year Ended December 31, | ||||||||||||||||||||||||
| 2013 | 2012 | Change | ||||||||||||||||||||||
| Amount | Percentage of Revenue |
Amount | Percentage of Revenue |
Amount | Percent | |||||||||||||||||||
| (dollars in thousands) | ||||||||||||||||||||||||
| Cost of revenue |
$ | 54,638 | 15.8 | % | $ | 45,342 | 16.2 | % | $ | 9,296 | 20.5 | % | ||||||||||||
|
|
|
|
|
|
|
|
|
|
|
|
|
|||||||||||||
A large part of the increase in cost of revenue in 2013 was due to a $5.6 million increase in compensation costs, including non-cash stock-based compensation, for our customer service and web-hosting personnel. During 2013, we added 44 new customer support personnel and incurred a full year impact of adding 107 new employees in 2012. With the increased headcount and investment in hosting equipment, we incurred a higher expense for depreciation of computer equipment, furniture and facility leasehold improvements, which increased by $1.1 million, or 16.3%. Merchant fees are generally incurred as a percentage of credit card receipts and increased by $253,000. Direct expenses associated with web hosting increased by $356,000 as we added more computing capacity for increased growth in visits to our websites. Other increases included $1.5 million in software licenses and maintenance for our corporate systems and $554,000 in professional fees.
50
Table of Contents
Product Development
| Year Ended December 31, | ||||||||||||||||||||||||
| 2013 | 2012 | Change | ||||||||||||||||||||||
| Amount | Percentage of Revenue |
Amount | Percentage of Revenue |
Amount | Percent | |||||||||||||||||||
| (dollars in thousands) | ||||||||||||||||||||||||
| Product development |
$ | 58,226 | 16.8 | % | $ | 43,152 | 15.4 | % | $ | 15,074 | 34.9 | % | ||||||||||||
| Capitalized software development costs |
9,005 | 2.6 | 5,878 | 2.1 | 3,127 | 53.2 | ||||||||||||||||||
|
|
|
|
|
|
|
|
|
|
|
|
|
|||||||||||||
| Total product and technology costs expensed and capitalized |
$ | 67,231 | 19.4 | % | $ | 49,030 | 17.5 | % | $ | 18,201 | 37.1 | % | ||||||||||||
|
|
|
|
|
|
|
|
|
|
|
|
|
|||||||||||||
A large part of the increase in product and development expense in 2013 was due to a $16.6 million increase in compensation costs, including non-cash stock-based compensation, offset by an increase in capitalized software costs of $3.1 million. During 2013, we added 94 new employees in product development and incurred a full year impact of adding 77 new employees in 2012. Overall increases in headcount also drove higher facilities and depreciation expense of $1.2 million. Also, professional fees increased by $480,000 due to increased use of outsourced technology resources.
Sales and Marketing
| Year Ended December 31, | ||||||||||||||||||||||||
| 2013 | 2012 | Change | ||||||||||||||||||||||
| Amount | Percentage of Revenue |
Amount | Percentage of Revenue |
Amount | Percent | |||||||||||||||||||
| (dollars in thousands) | ||||||||||||||||||||||||
| Sales and marketing |
$ | 112,967 | 32.6 | % | $ | 93,366 | 33.3 | % | $ | 19,601 | 21.0 | % | ||||||||||||
|
|
|
|
|
|
|
|
|
|
|
|
|
|||||||||||||
Compensation costs for sales and marketing personnel, including non-cash stock-based compensation, increased by $14.2 million in 2013 due to 121 new employees in sales and marketing in 2013 and the full year impact of adding 80 new employees in 2012. Overall increases in headcount also drove higher facilities and depreciation expense of $1.6 million. Direct marketing expenses increased by $1.8 million due to higher expenses with online display marketing, affiliate marketing and pay-per-click advertising to support growth of the business. Other increases included $1.8 million from professional fees and travel expenses.
General and Administrative
| Year Ended December 31, | ||||||||||||||||||||||||
| 2013 | 2012 | Change | ||||||||||||||||||||||
| Amount | Percentage of Revenue |
Amount | Percentage of Revenue |
Amount | Percent | |||||||||||||||||||
| (dollars in thousands) | ||||||||||||||||||||||||
| General and administrative |
$ | 75,169 | 21.7 | % | $ | 56,311 | 20.1 | % | $ | 18,858 | 33.5 | % | ||||||||||||
|
|
|
|
|
|
|
|
|
|
|
|
|
|||||||||||||
A large part of the increase in general and administrative expenses in 2013 was due to a $10.3 million increase in compensation costs, including non-cash stock-based compensation. During 2013, we added 55 new employees and executives in operations, finance, human resources, and legal and incurred a full year impact of adding 29 new employees in 2012. Professional fees increased by $5.3 million, largely due to $4.2 million in one-time expenses related to the acquisitions of travelmob, Bookabach and Stayz. Other increases included $1.4 million related to the Basic Rental Guarantee offered to travelers, $637,000 from facilities expense and depreciation and $798,000 in equipment expense.
51
Table of Contents
Amortization
| Year Ended December 31, | ||||||||||||||||||||||||
| 2013 | 2012 | Change | ||||||||||||||||||||||
| Amount | Percentage of Revenue |
Amount | Percentage of Revenue |
Amount | Percent | |||||||||||||||||||
| (dollars in thousands) | ||||||||||||||||||||||||
| Amortization expense |
$ | 11,668 | 3.4 | % | $ | 12,438 | 4.4 | % | $ | (770 | ) | (6.2 | )% | |||||||||||
|
|
|
|
|
|
|
|
|
|
|
|
|
|||||||||||||
The decrease in amortization expense in 2013 included $2.4 million for certain intangible assets becoming fully amortized, partially offset by a $1.1 million increase from the addition of identifiable intangible assets from our 2013 acquisitions and a $576,000 increase as a result of amortizing certain previously indefinite-lived intangible assets.
Other Income (Expense)
| Year Ended December 31, | ||||||||||||||||||||||||
| 2013 | 2012 | Change | ||||||||||||||||||||||
| Amount | Percentage of Revenue |
Amount | Percentage of Revenue |
Amount | Percent | |||||||||||||||||||
| (dollars in thousands) | ||||||||||||||||||||||||
| Other expense |
$ | (4,806 | ) | (1.4 | )% | $ | (1,659 | ) | (0.6 | )% | $ | (3,147 | ) | 189.7 | % | |||||||||
|
|
|
|
|
|
|
|
|
|
|
|
|
|||||||||||||
Other income (expense) includes approximately $6.0 million in losses from foreign currency transactions, compared to losses of $2.6 million in 2012. These losses consist primarily of the re-measurement of intercompany loans and other assets and liabilities denominated in foreign currencies, including hedging costs and gains/losses on forward contracts. These losses were partially offset by interest income of $1.2 million, compared to $928,000 in 2012.
Income Taxes
| Year Ended December 31, | ||||||||||||||||||||||||
| 2013 | 2012 | Change | ||||||||||||||||||||||
| Amount | Percentage of Revenue |
Amount | Percentage of Revenue |
Amount | Percent | |||||||||||||||||||
| (dollars in thousands) | ||||||||||||||||||||||||
| Income tax expense |
$ | (11,724 | ) | (3.4 | )% | $ | (13,175 | ) | (4.7 | )% | $ | 1,451 | (11.0 | )% | ||||||||||
|
|
|
|
|
|
|
|
|
|
|
|
|
|||||||||||||
The change in income tax expense in 2013 is primarily related to a benefit of $3.2 million for the federal research and experimentation tax credit, a decrease in charges to record tax reserves, increased tax deductions related to stock-based compensation and the release of a valuation allowance for the Company’s existing Australian subsidiary, offset by $2.0 million of expense related to a prior period that was deferred and recognized in the current period, decreased earnings in lower tax jurisdictions and an increase in non-deductible expenses, including $1.5 million of expenses related to acquisitions.
Tax expense in 2013 contains $2.0 million in provisions for reserves, including $0.3 million associated with our global restructuring plan.
The federal research and experimentation tax credit was extended on January 2, 2013 by the signing of the American Taxpayer Relief Act of 2012 (“Relief Act”). The Relief Act retroactively extended this tax credit from January 1, 2012 through December 31, 2013. Additionally, we completed a research and experimentation credit
52
Table of Contents
study analyzing the value of the credit. As a result, an income tax benefit of $2.0 million related to prior years’ research and experimentation tax credit is reflected in our results of operations for the year ended December 31, 2013.
Seasonality and Quarterly Results
Our operating results may fluctuate for a variety of reasons, including seasonal factors and economic cycles that influence the vacation travel market. Property owners and managers tend to buy subscription listings at times when travelers are most likely to make vacation plans. The timing primarily depends on whether travelers are taking a winter or summer vacation and tends to vary by country. Historically, we have experienced the highest level of new and renewed subscription listings in the first quarter of the year, which is typically when travelers are making plans for summer vacations in the United States and Europe. The lowest level of new subscription listings and renewals has occurred in the third quarter. By the fourth quarter, we typically see property owners and managers of winter vacation destinations list and renew subscriptions in time to meet the needs of travelers planning those trips. Other vacation areas outside of the United States and Europe, such as Australia and Brazil, also have seasonality, but the seasonality may not be reflected in the same quarters. This seasonality results in higher cash flows during the first quarter as most listings are annual and fully paid subscription listings at the time of purchase, but may not be seen as prominently in our revenue due to ratable recognition of subscription listing revenue over the listing term.
As we introduce new products for property owners, managers and travelers, including our performance-based pay-per-booking product, the seasonality of those commission-based transactions may vary from the seasonality of our subscription listing sales, and this may result in higher revenues in the summer and winter months. We also experience seasonality in the number of visitors to our websites, with the first quarter having the highest number of visitors. This is reflected in our quarterly financial results when we add customer service staff, hosting capabilities and marketing expense to support the increase.
Our operating results may fluctuate due to a variety of factors, many of which are outside of our control. As a result, comparing our operating results on a period-to-period basis may not be meaningful and historical results may not be indicative of future performance.
Liquidity and Capital Resources
From our incorporation in 2004 until December 31, 2014, we financed our operations and acquisitions primarily through private placements of our capital stock and bank borrowings as well as from cash flow generated by the business. In March 2014, we issued $402.5 million in 0.125% convertible senior notes due April 2019 (the “Notes”) for net proceeds of $391.6 million after deducting underwriting discounts and other issuance expenses. Concurrent with the issuance of the Notes, we sold warrants to purchase shares of our common stock for cash consideration of $38.3 million, which was offset by the purchase of a convertible note hedge of $85.9 million. The net cash increase in March 2014 from these transactions was $344.0 million.
As of December 31, 2014, our cash, cash equivalents and short-term investments totaled $813.2 million, compared to $391.4 million at December 31, 2013. At December 31, 2014, this amount included assets held in certain of our foreign operations totaling approximately $98.0 million. If these assets were repatriated to the U.S., we may be subject to additional U.S. taxes in certain circumstances. We have not provided for these taxes because we consider these assets to be permanently reinvested in our foreign operations. We have no plans to repatriate the cumulative earnings of our foreign subsidiaries.
We actively monitor the third-party institutions and money market funds that hold these assets, primarily focusing on the preservation of principal while secondarily maximizing investment returns. We diversify our holdings among various financial institutions and money market funds to reduce our exposure to any single counterparty. To date, we have not experienced any material loss or lack of access to our cash or investments; however, we can provide no assurances that access to our cash or investments will not be impacted by future
53
Table of Contents
adverse conditions in the financial markets. We have our operating accounts on deposit with third party financial institutions in excess of the Federal Deposit Insurance Corporation insurance limits. While we continually monitor the balances in our operating accounts, these cash balances could be adversely impacted if the underlying financial institutions fail or by other adverse conditions in the financial markets.
The following table summarizes our cash flows for the periods indicated:
| Year Ended December 31, | ||||||||||||
| 2014 | 2013 | 2012 | ||||||||||
| (in thousands) | ||||||||||||
| Consolidated Statements of Cash Flow Data: |
||||||||||||
| Net cash provided by operating activities |
$ | 145,364 | $ | 104,362 | $ | 95,403 | ||||||
| Net cash used in investing activities |
(537,676 | ) | (223,372 | ) | (57,975 | ) | ||||||
| Net cash provided by financing activities |
369,501 | 252,047 | 33,000 | |||||||||
| Effect of exchange rate changes on cash |
(9,472 | ) | 2,093 | 842 | ||||||||
|
|
|
|
|
|
|
|||||||
| Net increase (decrease) in cash and cash equivalents |
(32,283 | ) | 135,130 | 71,270 | ||||||||
| Cash and cash equivalents at beginning of period |
324,608 | 189,478 | 118,208 | |||||||||
|
|
|
|
|
|
|
|||||||
| Cash and cash equivalents at end of period |
$ | 292,325 | $ | 324,608 | $ | 189,478 | ||||||
|
|
|
|
|
|
|
|||||||
Net Cash Provided by Operating Activities
A key driver of our cash from operations is the upfront collection of fees for new and renewed subscriptions. In 2014, cash was generated primarily through an increase in new and renewed subscription listings, resulting in higher upfront collection of listing fees and increased deferred revenue of $27.2 million. In 2014, we generated net income of $14.0 million. Included in our net income was depreciation expense of $16.9 million, amortization expense of $13.9 million, amortization of debt discount and transaction costs of $13.2 million, non-cash stock-based compensation expense of $48.5 million, excess tax benefit from stock-based compensation of $3.1 million and a decrease in non-cash deferred income taxes of $1.7 million. Net income, excluding these non-cash reductions, contributed $101.7 million to cash provided by operating activities during 2014.
In 2013, cash was generated primarily through an increase in new and renewed subscription listings, resulting in higher upfront collection of listing fees and increased deferred revenue of $21.2 million. In 2013, we generated net income of $17.3 million. Included in our net income was depreciation expense of $13.4 million, amortization expense of $11.7 million, non-cash stock-based compensation expense of $37.9 million, excess tax benefit from stock-based compensation of $8.2 million and a decrease in non-cash deferred income taxes of $1.5 million. Net income, excluding these non-cash reductions, contributed $70.6 million to cash provided by operating activities during 2013.
In 2012, cash was generated primarily through an increase in new and renewed listing subscriptions, resulting in higher upfront collection of listing fees and increased deferred revenue of $22.4 million. In 2012, we generated net income of $15.0 million. Included in our net income was depreciation expense of $11.1 million, amortization expense of $12.4 million, non-cash stock-based compensation expense of $27.0 million, excess tax benefit from stock-based compensation of $7.1 million and a decrease in non-cash deferred income taxes of $3.1 million. Net income, excluding these non-cash reductions, contributed $55.2 million to cash provided by operating activities during 2012.
The growth in our number of paid listings, the impact of other revenue and expenses, the timing and amount of future working capital changes and tax payments will affect the future amount of cash used in or provided by operating activities.
54
Table of Contents
Net Cash Used in Investing Activities
In 2014, we invested $16.8 million, net of cash acquired, in the acquisition of Glad to Have You, Inc. Capital expenditures were $31.6 million and included $8.1 million in capitalized software development costs. Purchases of short-term investments, net of proceeds received from the sale and maturities of short-term investments, were $461.7 million. We also increased our minority stake in a privately held company in China for $9.4 million and invested $15.0 million for a non-controlling equity interest in a privately-held company in the United States that operates a travel research application and website.
In 2013, we invested $205.5 million, net of cash acquired, for the acquisitions of travelmob, Bookabach and Stayz. Capital expenditures were $19.6 million and included $9.0 million in capitalized software development costs. The remaining amount of capital expenditures was comprised of computer equipment and software, furniture and tenant improvements for facilities. We purchased $129.8 million of short-term investments and received proceeds from the sales and maturities of marketable securities during the year of $139.2 million.
In 2012, we invested $16.2 million, net of cash acquired, for the acquisition of Toprural. Capital expenditures were $17.3 million and included $5.9 million in capitalized software development costs. The remaining amount of capital expenditures was comprised of computer equipment and software, furniture and tenant improvements for facilities. We purchased $57.1 million of short-term investments and received proceeds from the sale of short-term investments during the year of $40.4 million. We also purchased a minority stake in a privately-held company in China for $6.4 million.
As our business expands, we expect to invest in new computers and software for employees, for product development and to support the hosting of our websites. As we expand our facilities to support a growing employee base, we intend to purchase furniture and fixtures and invest in leasehold improvements. We may have acquisitions in the future that could have a material impact on our cash flows and operations. Our planned capital expenditures are not expected to exceed $36.0 million in 2015.
Net Cash Provided by Financing Activities
Cash provided by financing activities in 2014 was primarily comprised of $391.0 million in net proceeds from the issuance of the Notes. Additionally, we received proceeds of $38.3 million from the sale of warrants to acquire shares of our common stock and paid $85.9 million for a convertible note hedge transaction. Proceeds from the exercise of stock options to purchase common stock were $25.4 million in 2014. Additionally, $3.1 million of reduced cash outflow was related to excess tax benefits from stock-based compensation.
Cash provided by financing activities in 2013 was mainly comprised of $195.3 million of cash received from our follow-on offering of our common stock in December 2013, net of underwriting discounts and offering costs. Additionally, $48.5 million of cash was received from the exercise of employee stock options. Furthermore, excess tax benefit from the exercise of employee stock options was $8.2 million.
Cash provided by financing activities in 2012 was comprised of $25.9 million of cash received from the exercise of employee stock options. Additionally, excess tax benefit from the exercise of employee stock options was $7.1 million.
Capital Resources
Based on past performance and current expectations, we believe our existing cash and investments plus future cash generated from operations will be sufficient to satisfy our cash requirements through at least the next 12 months.
Our future capital requirements will depend on many factors, including our rate of revenue growth, the expansion of our marketing and sales activities, the extent of product development efforts, the introductions of
55
Table of Contents
new products and services, enhancements to existing products and services, potential acquisitions and the continuing market acceptance of our products and services. We may need to raise additional capital through future debt or equity financing to fund such activities. Additional financing may not be available at all or on favorable terms. We may enter into arrangements in the future with respect to investments in, or acquisitions of, complementary businesses, products, services or technologies which could also require additional equity or debt financing.
Contractual Obligations and Commitments
The following table summarizes our outstanding contractual obligations and commitments at December 31, 2014 (in thousands):
| Payments Due by Period | ||||||||||||||||||||
| Total | Less than 1 year |
1-3 years | 3-5 years | More than 5 years |
||||||||||||||||
| Convertible senior notes(1) |
$ | 402,500 | $ | — | $ | — | $ | 402,500 | $ | — | ||||||||||
| Interest |
2,264 | 503 | 1,006 | 755 | — | |||||||||||||||
| Operating leases(2) |
60,841 | 8,073 | 16,811 | 14,087 | 21,870 | |||||||||||||||
| Uncertain tax positions(3) |
9,332 | — | — | — | — | |||||||||||||||
|
|
|
|
|
|
|
|
|
|
|
|||||||||||
| Total |
$ | 474,937 | $ | 8,576 | $ | 17,817 | $ | 417,342 | $ | 21,870 | ||||||||||
|
|
|
|
|
|
|
|
|
|
|
|||||||||||
| (1) | For a discussion of the Notes due April 1, 2019, please see Note 7 in the Notes to Consolidated Financial Statements included in Part II, Item 8 of this Annual Report on Form 10-K. |
| (2) | We lease our facilities and certain office equipment under noncancellable operating leases. |
| (3) | We are unable to make a reasonably reliable estimate as to when or if cash settlement with taxing authorities will occur. For additional information regarding uncertain tax positions, see Note 12 of the Notes to Consolidated Financial Statements included in Part II, Item 8 of this Annual Report on Form 10-K. |
Off-Balance Sheet Arrangements
During the years ended December 31, 2014, 2013 and 2012, we did not, and we do not currently, have any relationships with unconsolidated entities or financial partnerships, including entities often referred to as structured finance or special purpose entities, which would have been established for the purpose of facilitating off-balance sheet arrangements or other contractually narrow or limited purposes that have, or are reasonably likely to have, a current or future material effect on our consolidated financial condition, results of operations, liquidity, capital expenditures or capital resources.
Recent Accounting Pronouncements
See Note 2 in the Notes to Consolidated Financial Statements included in Part II, Item 8 of this Annual Report on Form 10-K, for a full description of recent accounting pronouncements which is incorporated herein by reference.
56
Table of Contents
Item 7A. Quantitative and Qualitative Disclosures About Market Risk.
Quantitative and Qualitative Disclosures About Market Risk
We are exposed to market risk for the effect of interest rate changes, foreign currency fluctuations, and changes in the market value of our investments and the Notes. Information relating to quantitative and qualitative disclosures about market risk is set forth below and in Item 7 of Part II, “Management’s Discussion and Analysis of Financial Condition and Results of Operations – Liquidity and Capital Resources.”
Foreign currency exchange risk. We have foreign subsidiaries that generally use the local currency as their functional currency, which we translate into U.S. dollars for consolidation. Our results of operations and cash flows are subject to fluctuations due to changes in exchange rates involving the Australian dollar, Brazilian Reais, British pound, Euro, New Zealand dollar, Singapore dollar and Swiss Franc, among others. We currently enter into forward contracts to hedge fluctuations in the value of certain intercompany debt denominated in foreign currencies but do not enter into any other derivative financial instruments for trading or speculative purposes. Following our acquisition of Stayz.com.au, our intercompany debt denominated in foreign currencies has increased significantly.
Fluctuations in currency exchange rates could result in translation gains and losses when we consolidate our results and harm our business in the future. Because we conduct a significant and growing portion of our business outside the United States but report our results in U.S. dollars, we face exposure to adverse movements in currency exchange rates, which may cause our revenue and operating results to differ materially from expectations. For example, if the U.S. dollar strengthens relative to the Euro, British Pound, Brazilian Reis or Australian Dollar, our non-U.S. revenue and operating results would be adversely affected when translated into U.S. dollars. Conversely, a decline in the U.S. dollar relative to these foreign currencies would increase our non-U.S. revenue and operating results when translated into U.S. dollars.
The effect of an immediate 10% adverse change in exchange rates on foreign denominated cash and receivables as of December 31, 2014 would result in a loss of approximately $1.4 million and a reduction in value on the balance sheet of approximately $10.9 million.
Convertible senior notes and interest rate risk. In March 2014, we issued $402.5 million of 0.125% convertible senior notes due April 1, 2019. We carry this instrument at face value less unamortized discount on our balance sheet. Since this instrument bears interest at fixed rates, we have no financial statement risk associated with changes in interest rates. However, the fair value of this instrument fluctuates when interest rates change and when the market price of our stock fluctuates.
Investments and interest rate sensitivity. The primary objective of our investment activities is to preserve principal while also maximizing yields without significantly increasing risk. To achieve this objective and minimize our exposure to an adverse shift in interest rates, we invest in short-term, high-quality, interest-bearing securities. To provide a meaningful assessment of the interest rate risk associated with our investment portfolio, we performed a sensitivity analysis to determine the impact a change in interest rates would have on the value of our investment portfolio assuming a 100 basis point increase in interest rates. As of December 31, 2014, a hypothetical 100 basis point increase in interest rates across all maturities would result in a $4.2 million incremental decline in the fair market value of our portfolio.
We have non-controlling investments in the equity of privately-held companies in China and the United States. Since our ownership interest is less than 20 percent and we do not have the ability to exert significant influence, we account for these non-marketable equity investments using the cost method of accounting. As of December 31, 2014, the carrying value of these investments in China and the United States was $19.5 million and $15.0 million, respectively.
57
Table of Contents
Item 8. Financial Statements and Supplementary Data.
The information required by this item is incorporated by reference to the consolidated financial statements and accompanying notes set forth on pages F-1 through F-39 of this Annual Report on Form 10-K.
Item 9. Changes in and Disagreements With Accountants on Accounting and Financial Disclosure.
None.
Item 9A. Controls and Procedures.
Disclosure Controls and Procedures
The Company maintains a set of disclosure controls and procedures (as defined in Rules 13a-15(e) and 15d-15(e) of the Exchange Act) designed to ensure that information required to be disclosed by the Company in reports that it files or submits under the Exchange Act, is recorded, processed, summarized and reported within the time periods specified in the SEC’s rules and forms and is accumulated and communicated to the Company’s management, including the Chief Executive Officer and Chief Financial Officer, as appropriate to allow timely decisions regarding required disclosure. In accordance with Rule 13a-15(b) of the Exchange Act, as of the end of the period covered by this Annual Report on Form 10-K, an evaluation was carried out under the supervision and with the participation of the Company’s management, including its Chief Executive Officer and Chief Financial Officer, of the effectiveness of its disclosure controls and procedures. Based on that evaluation, the Company’s Chief Executive Officer and Chief Financial Officer concluded that the Company’s disclosure controls and procedures, as of December 31, 2014, the end of the period covered by this Annual Report on Form 10-K, were effective to provide reasonable assurance that information required to be disclosed by the Company in reports that it files or submits under the Exchange Act is recorded, processed, summarized and reported within the time periods specified in the SEC’s rules and forms and is accumulated and communicated to the Company’s management, including the Chief Executive Officer and Chief Financial Officer, as appropriate to allow timely decisions regarding required disclosure.
Management’s Report on Internal Control over Financial Reporting
Our management is responsible for establishing and maintaining adequate internal control over financial reporting (as defined in Rules 13a-15(f) and 15d-15(f) of the Exchange Act). Internal control over financial reporting is a process designed by, or under the supervision of, the issuer’s principal executive and principal financial officers, or persons performing similar functions, and effected by the issuer’s board of directors, management and other personnel, to provide reasonable assurance regarding the reliability of our financial reporting and the preparation of financial statements for external purposes in accordance with generally accepted accounting principles. Internal control over financial reporting includes those policies and procedures that (i) pertain to the maintenance of records that, in reasonable detail, accurately and fairly reflect the transactions and dispositions of the assets of the Company; (ii) provide reasonable assurance that transactions are recorded as necessary to permit preparation of financial statements in accordance with generally accepted accounting principles, and that receipts and expenditures of the Company are being made only in accordance with authorizations of management and directors of the Company; and (iii) provide reasonable assurance regarding prevention or timely detection of unauthorized acquisition, use or disposition of the Company’s assets that could have a material effect on the financial statements. Because of its inherent limitations, internal control over financial reporting may not prevent or detect misstatements. Also, projections of any evaluation of effectiveness to future periods are subject to the risk that controls may become inadequate because of changes in conditions, or that our degree of compliance with the policies or procedures may deteriorate.
Our management conducted an evaluation of the effectiveness of our internal control over financial reporting as of the end of the period covered by this Annual Report on Form 10-K based on the framework in Internal Control—Integrated Framework (COSO 2013) issued by the Committee of Sponsoring Organization of
58
Table of Contents
the Treadway Commission. Based on this evaluation, management concluded that the Company’s internal control over financial reporting was effective as of December 31, 2014.
Our independent registered public accounting firm, which has audited our consolidated financial statements, has also audited the effectiveness of the Company’s internal control over financial reporting as of December 31, 2014, as stated in their report, which is included in Item 15(a)(1) of this Annual Report on Form 10-K.
Changes in Internal Control over Financial Reporting
There were no changes in our internal control over financial reporting during the quarter ended December 31, 2014 that materially affected, or are reasonably likely to materially affect, our internal control over financial reporting.
Limitations on Controls
Our disclosure controls and procedures and internal control over financial reporting are designed to provide reasonable assurance of achieving their objectives as specified above. Management does not expect, however, that our disclosure controls and procedures or our internal control over financial reporting will prevent or detect all error and fraud. Any control system, no matter how well designed and operated, is based upon certain assumptions and can provide only reasonable, not absolute, assurance that its objectives will be met. Further, no evaluation of controls can provide absolute assurance that misstatements due to error or fraud will not occur or that all control issues and instances of fraud, if any, within the Company have been detected.
None.
59
Table of Contents
PART III
Item 10. Directors, Executive Officers and Corporate Governance.
Our executive officers and directors and their ages and positions as of December 31, 2014 are as follows:
| Name |
Age | Position | ||
| Brian H. Sharples | 54 | Co-Founder, Chief Executive Officer and Director | ||
| Lynn Atchison | 55 | Chief Financial Officer and Secretary | ||
| Brent Bellm | 43 | President and Chief Operating Officer | ||
| Ross A. Buhrdorf | 50 | Chief Technology Officer | ||
| Mariano Dima | 46 | Chief Marketing Officer | ||
| Thomas Hale | 46 | Chief Product Officer | ||
| Carl G. Shepherd | 62 | Co-Founder, Chief Strategy and Development Officer and Director | ||
| Charles (“Lanny”) Baker(2) | 48 | Director | ||
| Simon Breakwell(2) | 49 | Director | ||
| Jeffrey D. Brody(1) | 54 | Director | ||
| Kevin Krone(3) | 46 | Director | ||
| Simon Lehmann(2) | 44 | Director | ||
| Christopher (“Woody”) Marshall(1)(3) | 46 | Director | ||
| Tina Sharkey(1) | 50 | Director |
| (1) | Member of our Compensation Committee |
| (2) | Member of our Audit Committee |
| (3) | Member of our Nominating and Governance Committee |
Brian H. Sharples is one of our Co-Founders, has served as our Chief Executive Officer since our inception in April 2004 and has served as Chairman of the Board since March 2011. He has also served as our President from April 2004 until May 2014. Prior to joining us, Mr. Sharples was an angel investor from 2001 to 2004 and also served as Chief Executive Officer of Elysium Partners, Inc., a company in the vacation club ownership market, from 2002 to 2003. Mr. Sharples served as President and Chief Executive Officer of IntelliQuest Information Group, Inc., a supplier of marketing data and research to Fortune 500 technology companies, from 1996 to 2001, as President from 1991 to 1996, and as Senior Vice President from 1989 to 1991. Prior to IntelliQuest, Mr. Sharples was Chief Executive Officer of Practical Productions, Inc., an event-based automotive distribution business, from 1988 to 1989 and a consultant with Bain & Company from 1986 to 1988. Mr. Sharples also serves on the board of directors of RetailMeNot, Inc. Mr. Sharples holds a B.S. in math and economics from Colby College and an M.B.A. from the Stanford University Graduate School of Business.
Lynn Atchison has served as our Chief Financial Officer since August 2006. Prior to joining us, Ms. Atchison was Chief Financial Officer of Infoglide Software Corporation, an enterprise software provider, from February 2004 to August 2006. From October 2003 to January 2004, Ms. Atchison worked as a business consultant for Range Online Media, an Internet marketing firm. From May 1996 to April 2003, Ms. Atchison served as Chief Financial Officer and Vice President of Finance and Administration of Hoover’s, Inc., a provider of online business information. From November 1994 to April 1996, Ms. Atchison served as Chief Financial Officer of Travelogix, Inc., a provider of travel ticketing systems software. From May 1990 to November 1994, Ms. Atchison worked as a consultant providing controller functions for software, technology and non-profit organizations, including Trilogy Development, a provider of sales automation software, and Austin American Technology. Prior to that, Ms. Atchison worked for eight years as an accountant with Ernst & Young LLP. Ms. Atchison serves on the board of directors of Speed Commerce, Inc. Ms. Atchison holds a B.B.A. in accounting from Stephen F. Austin State University.
Brent Bellm has served as our Chief Operating Officer since June 2010 and as our President since May 2014. From October 2009 to June 2010, Mr. Bellm served as Vice President of Global Product and Experience of PayPal, Inc., an online payment services provider and subsidiary of eBay Inc., and as Chief Executive Officer of
60
Table of Contents
PayPal (Europe) Ltd. from October 2005 to September 2009. Before joining PayPal, Mr. Bellm served as Director of Corporate Strategy of eBay from April 2001 to December 2002. Previously, Mr. Bellm held positions at McKinsey & Company, focusing on the retail, e-commerce and payment industries, and at Goldman, Sachs & Co. Mr. Bellm holds a B.A. in economics and international relations from Stanford University and an M.B.A. from Harvard Business School.
Ross A. Buhrdorf has served as our Chief Technology Officer since July 2005. Prior to joining us, Mr. Buhrdorf served as Vice President of Engineering of BetweenMarkets, Inc., a platform for ensuring business-to-business information quality, from June 2004 to June 2005. From 2000 to 2004, Mr. Buhrdorf served as Vice President of Engineering of Salion, Inc., an enterprise CRM solution for supply-side manufacturing, and from 1997 to 2000 he served as Vice President of Engineering of Excite.com, a search engine company. Since 1993, Mr. Buhrdorf also has owned and consulted with a variety of software companies. Mr. Buhrdorf serves on the Board of Trustees for the Santa Fe Institute, a theoretical research institute, and the board of directors for NUVE, a startup focused on the Internet of everything. Mr. Buhrdorf holds a B.A. in computer science from the University of Texas at Austin.
Mariano Dima has served as our Chief Marketing Officer since July 2014. Prior to joining us, Mr. Dima worked for Visa Europe from 2007 to 2014, most recently as its Chief Marketing Officer. Previously, Mr. Dima had held a variety of marketing positions at Levi Strauss & Co., Vodafone Group plc, and PepsiCo, Inc. Mr. Dima holds a degree from the University of Buenos Aires.
Thomas Hale has served as our Chief Product Officer since June 2010. Prior to joining us, Mr. Hale served as Chief Product officer of Linden Research, Inc., an online game and virtual community provider, from October 2008 to May 2010. From December 2007 to October 2008, Mr. Hale served as an Entrepreneur in Residence at Redpoint Ventures, a venture capital firm. From September 1995 to October 2007, Mr. Hale held various positions, including Senior Vice President of the Knowledge Worker Business Unit at Adobe Systems Incorporated and Macromedia, Inc. Mr. Hale has served on the board of directors of IntraLinks, Inc., a provider of Software-as-a-Service solutions, since May 2008. He has also served on the board of ReachLocal, Inc. since December 2014. Mr. Hale holds a B.A. in history and literature from Harvard University.
Carl G. Shepherd is one of our Co-Founders and has served as our Chief Strategy and Development Officer since February 2005. Prior to joining us, Mr. Shepherd worked as a consultant from March 2003 to February 2005. Mr. Shepherd served as Executive Vice President and Chief Operating Officer of Hoover’s, Inc., a provider of online business information, from June 1997 to March 2003. From August 1995 to June 1997, Mr. Shepherd served as Vice President of Business Development of Human Code Inc., a software development company. From December 1992 to March 1995, Mr. Shepherd served as Chief Financial Officer of Hanley Wood, LLC, a trade magazine publisher. Mr. Shepherd has held positions with both consumer and trade magazine publishers, including Texas Monthly, Building and Remodeling and the Dallas Morning News. Previously, Mr. Shepherd was a senior manager with Andersen Consulting in New York. Mr. Shepherd holds a B.A. in business administration from Texas Christian University and an M.B.A. from the University of Texas at Austin.
Charles (“Lanny”) C. Baker has served as a director since April 2011. Mr. Baker has served as the Chief Executive Officer and President of ZipRealty, Inc., a provider of technology systems to real estate agents and brokerages, since October 2010 which was acquired by Realogy Holdings Corp. in August 2014. From December 2008 to October 2010, Mr. Baker served as the Executive Vice President and Chief Financial Officer of ZipRealty, Inc. From March 2005 to June 2007, Mr. Baker served as Senior Vice President and Chief Financial Officer of Monster Worldwide, Inc., an online recruitment services company. From June 1993 to March 2005, Mr. Baker served in positions of increasing responsibility in the Equity Research department at Smith Barney, a division of Citigroup, Inc., serving as Managing Director from January 2000 to March 2005. Mr. Baker serves on the board of directors of XO Group, Inc., a life stages media company targeting couples planning their weddings and lives together. Mr. Baker holds a B.A. in history from Yale College.
61
Table of Contents
Simon Breakwell has served as a director since August 2012. Since January 2014, Mr. Breakwell has served as a Venture Partner with Technology Crossover Ventures. From 2000 to April 2006, Mr. Breakwell served as the President, Founder and a director of Expedia International, Inc., a subsidiary of Expedia, Inc. Prior to becoming the President of Expedia International, Inc., Mr. Breakwell spent seven years in senior business roles in Expedia, Inc., the Travel Group (acquired by Expedia, Inc.) and British Airways. Mr. Breakwell holds an M.B.A. from Lancaster University and a B.A. from Portsmouth Polytechnic.
Jeffrey D. Brody has served as a director since January 2005. Mr. Brody is a founding partner of Redpoint Ventures. He also serves as a managing member of Brentwood Venture Capital. Mr. Brody serves on the boards of directors of several private companies including Kodiak Networks, The Receivables Exchange, Viajanet, Xango, PSafe, Beepi, and Bitgo. Mr. Brody was an early investor and director of Danger (acquired by Microsoft), Fraud Sciences (acquired by eBay), LifeSize Communications (acquired by Logitech), Concur Technologies (CNQR), Loopnet (LOOP), Zing Systems (acquired by OpenWave), ViaVideo (acquired by Polycom) and WebTV (acquired by Microsoft). Mr. Brody holds a B.S. in mechanical engineering from the University of California, Berkeley and an M.B.A. from the Stanford University Graduate School of Business.
Kevin Krone has served as a director since April 2013. Since December 1992, Mr. Krone has held various roles at Southwest Airlines, and since February 2013, has served as Southwest’s Vice President and Chief Marketing Officer. Mr. Krone is responsible for Southwest’s marketing strategies covering all sales and promotions, special event marketing, multicultural activities, partnership relationships, all field sales offices, advertising, Southwest’s award-winning frequent flyer program called Rapid Rewards, online marketing, distribution of Southwest’s products and product development. Previously, Mr. Krone had responsibility for local marketing, business development, as well as leadership over the developmental efforts on Southwest’s website, southwest.com. Mr. Krone received a B.A. in finance and an M.B.A. from the University of Illinois.
Simon Lehmann has served as a director since March 2014. Since December 2013, Mr. Lehmann has served as the Chief Executive Officer of Biketec AG. From October 2005 to February 2014, Mr. Lehmann served as the Chief Executive Officer of Interhome AG. Prior to Interhome, from January 2001 to September 2005, Mr. Lehmann held top management positions, most recently Executive Vice President of Sales and Commercial, with Swissport International. Since November 2012, Mr. Lehmann has served on the Board of directors of Inntopia.com.
Christopher (“Woody”) P. Marshall has served as a director since October 2008. Mr. Marshall is a General Partner at Technology Crossover Ventures, or TCV, a growth equity firm focused on information technology companies. Prior to joining TCV in 2008, Mr. Marshall spent 12 years as a Managing Partner at Trident Capital, a venture capital and private equity firm focused on the software, business services and Internet markets. Mr. Marshall also serves on the board of directors of XRS Corporation, a provider of fleet operations solutions to the transportation industry. Mr. Marshall holds a B.A. from Hamilton College and an M.B.A. from the J. L. Kellogg Graduate School of Management at Northwestern University.
Tina Sharkey has served as a director since December 2012. Ms. Sharkey is Chief Financial Officer of SherpaFoundry. From 2007 to 2012, Ms. Sharkey served as Chairman and Global President of BabyCenter LLC, a wholly-owned subsidiary of Johnson and Johnson. Prior to that, Ms. Sharkey held various positions, including Senior Vice President, General Manager, of America Online Inc. (from 2003 to 2006). From 2004 to 2006, Ms. Sharkey served as Senior Vice President and General Manager of a portfolio of AOL properties, including AOL.com and AOL Instant Messenger. Ms. Sharkey served as a director for ad:tech (from 2009), and served as a director for Baby Buggy, Inc. (from 2002 to 2009) and the Interactive Advertising Bureau (from 2007 to 2012). Ms. Sharkey holds a B.A. from the University of Pennsylvania.
Other information required by Part III, Item 10, will be included in the sections entitled “Proposal One: Election of Directors,” “Section 16(a) Beneficial Ownership Reporting Compliance,” “Certain Relationships and
62
Table of Contents
Related Party Transactions” and “Corporate Governance” in our Proxy Statement relating to our 2015 annual meeting of stockholders to be filed with the Securities and Exchange Commission within 120 days after the end of our fiscal year ended December 31, 2014, and is incorporated herein by reference.
Item 11. Executive Compensation.
Information required by Part III, Item 11, will be included in the section entitled “Executive Compensation” in our Proxy Statement relating to our 2015 annual meeting of stockholders to be filed with the Securities and Exchange Commission within 120 days after the end of our fiscal year ended December 31, 2014, and is incorporated herein by reference.
Item 12. Security Ownership of Certain Beneficial Owners and Management and Related Stockholder Matters.
Information required by Part III, Item 12, will be included in the sections entitled “Security Ownership of Certain Beneficial Owners and Management” and “Equity Compensation Plan Information” in our Proxy Statement relating to our 2015 annual meeting of stockholders to be filed with the Securities and Exchange Commission within 120 days after the end of our fiscal year ended December 31, 2014, and is incorporated herein by reference.
Item 13. Certain Relationships and Related Transactions, and Director Independence.
Information required by Part III, Item 13, will be included in the sections entitled “Certain Relationships and Related Party Transactions” and “Corporate Governance” in our Proxy Statement relating to our 2015 annual meeting of stockholders to be filed with the Securities and Exchange Commission within 120 days after the end of our fiscal year ended December 31, 2014, and is incorporated herein by reference.
Item 14. Principal Accounting Fees and Services.
Information required by Part III, Item 14, will be included in the section entitled “Proposal Two: Ratification of Selection of Independent Public Accounting Firm” in our Proxy Statement relating to our 2015 annual meeting of stockholders to be filed with the Securities and Exchange Commission within 120 days after the end of our fiscal year ended December 31, 2014, and is incorporated herein by reference.
63
Table of Contents
PART IV
Item 15. Exhibits, Financial Statement Schedules.
| (a) | Documents Filed with Report |
| (1) | Financial Statements. |
| Report of Independent Registered Public Accounting Firm |
F-2 | |||
| Consolidated Balance Sheets |
F-3 | |||
| Consolidated Statements of Operations |
F-4 | |||
| Consolidated Statements of Comprehensive Income |
F-5 | |||
| Consolidated Statements of Changes in Stockholders’ Equity (Deficit) |
F-6 | |||
| Consolidated Statements of Cash Flows |
F-7 | |||
| Notes to Consolidated Financial Statements |
F-8 | |||
| (2) | Financial Statement Schedules. |
The following financial statement schedule should be read in conjunction with the consolidated financial statements of HomeAway, Inc. filed as part of this Report:
| Schedule II—Valuation and Qualifying Accounts |
F-41 |
Schedules other than that listed above have been omitted since they are either not required or not applicable or because the information required is included in the consolidated financial statements included elsewhere herein or the notes thereto.
| (3) | Exhibits. |
The information required by this Item is set forth on the exhibit index that follows the signature page of this Annual Report on Form 10-K.
64
Table of Contents
SIGNATURES
Pursuant to the requirements of Section 13 or 15(d) of the Securities Exchange Act of 1934, the registrant has duly caused this report to be signed on its behalf by the undersigned, thereunto duly authorized.
Date: February 25, 2015
| HOMEAWAY, INC. |
| /s/ Brian H. Sharples |
| Brian H. Sharples |
| Chief Executive Officer |
POWER OF ATTORNEY
Each person whose individual signature appears below hereby authorizes and appoints Brian H. Sharples, Lynn Atchison and Melissa Frugé, and each of them, with full power of substitution and resubstitution and full power to act without the other, as his or her true and lawful attorney-in-fact and agent to act in his or her name, place and stead and to execute in the name and on behalf of each person, individually and in each capacity stated below, and to file any and all amendments to this Annual Report on Form 10-K, and to file the same, with all exhibits thereto, and other documents in connection therewith, with the Securities and Exchange Commission, granting unto said attorneys-in-fact and agents, and each of them, full power and authority to do and perform each and every act and thing, ratifying and confirming all that said attorneys-in-fact and agents or any of them or their or his substitute or substitutes may lawfully do or cause to be done by virtue thereof.
Pursuant to the requirements of the Securities Exchange Act of 1934, this report has been signed below by the following persons on behalf of the registrant and in the capacities and on the dates indicated.
| Signature |
Title |
Date | ||
| /s/ Brian H. Sharples Brian H. Sharples |
Director and Chief Executive Officer (principal executive officer) | February 25, 2015 | ||
| /s/ Lynn Atchison Lynn Atchison |
Chief Financial Officer and Secretary (principal financial officer and principal accounting officer) |
February 25, 2015 | ||
| /s/ Charles C. Baker Charles C. Baker |
Director | February 25, 2015 | ||
| /s/ Simon Breakwell Simon Breakwell |
Director | February 25, 2015 | ||
| /s/ Jeffrey D. Brody Jeffrey D. Brody |
Director | February 25, 2015 | ||
| /s/ Kevin Krone Kevin Krone |
Director | February 25, 2015 | ||
65
Table of Contents
| /s/ Christopher P. Marshall Christopher P. Marshall |
Director | February 25, 2015 | ||
| /s/ Tina Sharkey Tina Sharkey |
Director | February 25, 2015 | ||
| /s/ Carl G. Shepherd Carl G. Shepherd |
Director, Co-Founder and Chief Strategy and Development Officer | February 25, 2015 | ||
| /s/ Simon Lehmann Simon Lehmann |
Director | February 25, 2015 | ||
66
Table of Contents
INDEX TO CONSOLIDATED FINANCIAL STATEMENTS
| Page | ||||
| Consolidated Financial Statements: |
||||
| F-2 | ||||
| F-3 | ||||
| F-4 | ||||
| F-5 | ||||
| Consolidated Statements of Changes in Stockholders’ Equity (Deficit) |
F-6 | |||
| F-7 | ||||
| F-8 | ||||
| Financial Statement Schedules: |
||||
| F-41 | ||||
| All other schedules are omitted because they are not applicable or the required information is shown in the Consolidated Financial Statements or Notes thereto. |
||||
| Supplementary Financial Data: |
||||
| Selected Quarterly Financial Data (unaudited) for the two years ended December 31, 2014 |
F-42 | |||
F-1
Table of Contents
Report of Independent Registered Public Accounting Firm
To the Board of Directors and Stockholders of HomeAway, Inc.:
In our opinion, the consolidated financial statements listed in the accompanying index present fairly, in all material respects, the financial position of HomeAway, Inc. and its subsidiaries at December 31, 2014 and 2013, and the results of their operations and their cash flows for each of the three years in the period ended December 31, 2014 in conformity with accounting principles generally accepted in the United States of America. In addition, in our opinion, the financial statement schedule listed in the accompanying index presents fairly, in all material respects, the information set forth therein when read in conjunction with the related consolidated financial statements. Also in our opinion, the Company maintained, in all material respects, effective internal control over financial reporting as of December 31, 2014, based on criteria established in Internal Control—Integrated Framework (2013) issued by the Committee of Sponsoring Organizations of the Treadway Commission (COSO). The Company’s management is responsible for these financial statements and financial statement schedule, for maintaining effective internal control over financial reporting and for its assessment of the effectiveness of internal control over financial reporting, included in Management’s Report on Internal Control over Financial Reporting appearing under Item 9A. Our responsibility is to express opinions on these financial statements, on the financial statement schedule, and on the Company’s internal control over financial reporting based on our integrated audits. We conducted our audits in accordance with the standards of the Public Company Accounting Oversight Board (United States). Those standards require that we plan and perform the audits to obtain reasonable assurance about whether the financial statements are free of material misstatement and whether effective internal control over financial reporting was maintained in all material respects. Our audits of the financial statements included examining, on a test basis, evidence supporting the amounts and disclosures in the financial statements, assessing the accounting principles used and significant estimates made by management, and evaluating the overall financial statement presentation. Our audit of internal control over financial reporting included obtaining an understanding of internal control over financial reporting, assessing the risk that a material weakness exists, and testing and evaluating the design and operating effectiveness of internal control based on the assessed risk. Our audits also included performing such other procedures as we considered necessary in the circumstances. We believe that our audits provide a reasonable basis for our opinions.
A company’s internal control over financial reporting is a process designed to provide reasonable assurance regarding the reliability of financial reporting and the preparation of financial statements for external purposes in accordance with generally accepted accounting principles. A company’s internal control over financial reporting includes those policies and procedures that (i) pertain to the maintenance of records that, in reasonable detail, accurately and fairly reflect the transactions and dispositions of the assets of the company; (ii) provide reasonable assurance that transactions are recorded as necessary to permit preparation of financial statements in accordance with generally accepted accounting principles, and that receipts and expenditures of the company are being made only in accordance with authorizations of management and directors of the company; and (iii) provide reasonable assurance regarding prevention or timely detection of unauthorized acquisition, use, or disposition of the company’s assets that could have a material effect on the financial statements.
Because of its inherent limitations, internal control over financial reporting may not prevent or detect misstatements. Also, projections of any evaluation of effectiveness to future periods are subject to the risk that controls may become inadequate because of changes in conditions, or that the degree of compliance with the policies or procedures may deteriorate.
/s/ PricewaterhouseCoopers LLP
Austin, Texas
February 25, 2015
F-2
Table of Contents
Consolidated Balance Sheets
(In thousands, except for share and per share information)
| December 31, | ||||||||
| 2014 | 2013 | |||||||
| Assets |
||||||||
| Current assets: |
||||||||
| Cash and cash equivalents |
$ | 292,325 | $ | 324,608 | ||||
| Short-term investments |
520,844 | 66,798 | ||||||
| Accounts receivable, net of allowance for doubtful accounts of $663 and $1,038 as of December 31, 2014 and 2013, respectively |
23,189 | 20,375 | ||||||
| Income tax receivable |
1,900 | 3,340 | ||||||
| Prepaid expenses and other current assets |
17,913 | 9,309 | ||||||
| Deferred tax assets |
8,774 | 8,146 | ||||||
|
|
|
|
|
|||||
| Total current assets |
864,945 | 432,576 | ||||||
| Property and equipment, net |
56,173 | 39,807 | ||||||
| Goodwill |
493,671 | 507,611 | ||||||
| Intangible assets, net |
70,456 | 80,665 | ||||||
| Non-marketable investments |
35,285 | 10,112 | ||||||
| Deferred tax assets |
1,545 | 1,120 | ||||||
| Other non-current assets |
8,053 | 8,781 | ||||||
|
|
|
|
|
|||||
| Total assets |
$ | 1,530,128 | $ | 1,080,672 | ||||
|
|
|
|
|
|||||
| Liabilities, redeemable noncontrolling interests and stockholders’ equity |
||||||||
| Current liabilities: |
||||||||
| Accounts payable |
$ | 8,281 | $ | 3,539 | ||||
| Income tax payable |
1,344 | 1,992 | ||||||
| Accrued expenses |
50,255 | 54,625 | ||||||
| Deferred revenue |
170,522 | 151,991 | ||||||
|
|
|
|
|
|||||
| Total current liabilities |
230,402 | 212,147 | ||||||
| Convertible senior notes, net |
316,181 | — | ||||||
| Deferred revenue, less current portion |
3,179 | 2,983 | ||||||
| Deferred tax liabilities |
26,624 | 24,046 | ||||||
| Other non-current liabilities |
12,192 | 7,557 | ||||||
|
|
|
|
|
|||||
| Total liabilities |
588,578 | 246,733 | ||||||
|
|
|
|
|
|||||
| Commitments and contingencies (see Note 8) |
||||||||
| Redeemable noncontrolling interests (see Note 10) |
9,742 | 10,584 | ||||||
| Stockholders’ equity |
||||||||
| Common stock: $0.0001 par value; 350,000,000 shares authorized; 94,515,344 and 92,361,069 shares issued and outstanding as of December 31, 2014 and 2013, respectively |
9 | 9 | ||||||
| Additional paid-in capital |
1,022,586 | 908,632 | ||||||
| Accumulated other comprehensive loss |
(28,053 | ) | (6,747 | ) | ||||
| Accumulated deficit |
(62,734 | ) | (78,539 | ) | ||||
|
|
|
|
|
|||||
| Total stockholders’ equity |
931,808 | 823,355 | ||||||
|
|
|
|
|
|||||
| Total liabilities and stockholders’ equity |
$ | 1,530,128 | $ | 1,080,672 | ||||
|
|
|
|
|
|||||
The accompanying notes are an integral part of these financial statements.
F-3
Table of Contents
Consolidated Statements of Operations
(In thousands, except for per share information)
| Year Ended December 31, | ||||||||||||
| 2014 | 2013 | 2012 | ||||||||||
| Revenue: |
||||||||||||
| Listing |
$ | 371,939 | $ | 294,661 | $ | 238,413 | ||||||
| Other |
74,823 | 51,828 | 41,991 | |||||||||
|
|
|
|
|
|
|
|||||||
| Total revenue |
446,762 | 346,489 | 280,404 | |||||||||
| Costs and expenses: |
||||||||||||
| Cost of revenue (exclusive of amortization shown separately below) |
67,612 | 54,638 | 45,342 | |||||||||
| Product development |
77,082 | 58,226 | 43,152 | |||||||||
| Sales and marketing |
154,995 | 112,967 | 93,366 | |||||||||
| General and administrative |
93,131 | 75,169 | 56,311 | |||||||||
| Amortization expense |
13,916 | 11,668 | 12,438 | |||||||||
|
|
|
|
|
|
|
|||||||
| Total costs and expenses |
406,736 | 312,668 | 250,609 | |||||||||
|
|
|
|
|
|
|
|||||||
| Operating income |
40,026 | 33,821 | 29,795 | |||||||||
| Other income (expense): |
||||||||||||
| Interest expense |
(13,333 | ) | — | — | ||||||||
| Interest income |
1,728 | 1,211 | 928 | |||||||||
| Other expense, net |
(7,182 | ) | (6,017 | ) | (2,587 | ) | ||||||
|
|
|
|
|
|
|
|||||||
| Total other income (expense) |
(18,787 | ) | (4,806 | ) | (1,659 | ) | ||||||
|
|
|
|
|
|
|
|||||||
| Income before income taxes |
21,239 | 29,015 | 28,136 | |||||||||
| Income tax expense |
(7,272 | ) | (11,724 | ) | (13,175 | ) | ||||||
|
|
|
|
|
|
|
|||||||
| Net income |
13,967 | 17,291 | 14,961 | |||||||||
| Less: Impact of noncontrolling interests, net of tax |
583 | (395 | ) | — | ||||||||
|
|
|
|
|
|
|
|||||||
| Net income attributable to HomeAway, Inc. |
13,384 | 17,686 | 14,961 | |||||||||
|
|
|
|
|
|
|
|||||||
| Net income per share attributable to HomeAway, Inc.: |
||||||||||||
| Basic |
$ | 0.14 | $ | 0.21 | $ | 0.18 | ||||||
| Diluted |
$ | 0.14 | $ | 0.20 | $ | 0.18 | ||||||
|
|
|
|
|
|
|
|||||||
| Weighted average number of shares outstanding: |
||||||||||||
| Basic |
93,727 | 85,378 | 82,382 | |||||||||
| Diluted |
96,481 | 88,259 | 84,942 | |||||||||
|
|
|
|
|
|
|
|||||||
The accompanying notes are an integral part of these financial statements.
F-4
Table of Contents
Consolidated Statements of Comprehensive Income
(In thousands)
| Year Ended December 31, | ||||||||||||
| 2014 | 2013 | 2012 | ||||||||||
| Net income |
$ | 13,967 | $ | 17,291 | $ | 14,961 | ||||||
| Other comprehensive income (loss): |
||||||||||||
| Foreign currency translation adjustments (net of tax) |
(20,524 | ) | (1,198 | ) | 767 | |||||||
| Unrealized gain (loss) on short-term investments (net of tax) |
(782 | ) | (99 | ) | 263 | |||||||
|
|
|
|
|
|
|
|||||||
| Total other comprehensive income (loss) |
(21,306 | ) | (1,297 | ) | 1,030 | |||||||
| Less: Comprehensive loss attributable to noncontrolling interests |
(1,802 | ) | (395 | ) | — | |||||||
|
|
|
|
|
|
|
|||||||
| Comprehensive income (loss) attributable to HomeAway, Inc. |
$ | (5,537 | ) | $ | 16,389 | $ | 15,991 | |||||
|
|
|
|
|
|
|
|||||||
The accompanying notes are an integral part of these financial statements.
F-5
Table of Contents
Consolidated Statements of Changes in Stockholders’ Equity
(In thousands)
| Common Stock | Additional Paid-In Capital |
Accumulated Other Comprehensive Income (Loss) |
Accumulated Deficit |
Total Stockholders’ Equity |
||||||||||||||||||||
| Shares | Amount | |||||||||||||||||||||||
| Balance at December 31, 2011 |
80,685 | $ | 8 | $ | 558,667 | $ | (6,480 | ) | $ | (111,186 | ) | $ | 441,009 | |||||||||||
| Issuance of stock under Company plans, net of shares withheld for taxes |
2,756 | — | 25,878 | — | — | 25,878 | ||||||||||||||||||
| Stock-based compensation |
— | — | 27,033 | — | — | 27,033 | ||||||||||||||||||
| Excess tax benefits related to employee stock options, net |
— | — | 7,122 | — | — | 7,122 | ||||||||||||||||||
| Other comprehensive income |
— | — | — | 1,030 | — | 1,030 | ||||||||||||||||||
| Net income attributable to HomeAway, Inc. |
— | — | — | — | 14,961 | 14,961 | ||||||||||||||||||
|
|
|
|
|
|
|
|
|
|
|
|
|
|||||||||||||
| Balance at December 31, 2012 |
83,441 | 8 | 618,700 | (5,450 | ) | (96,225 | ) | 517,033 | ||||||||||||||||
| Issuance of stock under Company plans, net of shares withheld for taxes |
3,420 | 1 | 48,472 | — | — | 48,473 | ||||||||||||||||||
| Stock-based compensation |
— | — | 37,887 | — | — | 37,887 | ||||||||||||||||||
| Issuance of common stock in connection with follow-on offering, net of offering costs |
5,500 | — | 195,347 | — | — | 195,347 | ||||||||||||||||||
| Excess tax benefits related to employee stock options, net |
— | — | 8,226 | — | — | 8,226 | ||||||||||||||||||
| Other comprehensive loss |
— | — | — | (1,297 | ) | — | (1,297 | ) | ||||||||||||||||
| Net income attributable to HomeAway, Inc. |
— | — | — | — | 17,686 | 17,686 | ||||||||||||||||||
|
|
|
|
|
|
|
|
|
|
|
|
|
|||||||||||||
| Balance at December 31, 2013 |
92,361 | 9 | 908,632 | (6,747 | ) | (78,539 | ) | 823,355 | ||||||||||||||||
| Issuance of stock under Company plans, net of shares withheld for taxes |
2,154 | — | 25,386 | — | — | 25,386 | ||||||||||||||||||
| Stock-based compensation |
— | — | 48,518 | — | — | 48,518 | ||||||||||||||||||
| Equity component of convertible note issuance, net |
— | — | 87,303 | — | — | 87,303 | ||||||||||||||||||
| Purchase of convertible note hedge |
— | — | (85,853 | ) | — | — | (85,853 | ) | ||||||||||||||||
| Sale of warrants |
— | — | 38,278 | — | — | 38,278 | ||||||||||||||||||
| Excess tax benefits related to employee stock options, net |
— | — | 2,743 | — | — | 2,743 | ||||||||||||||||||
| Other comprehensive income (loss) |
— | — | — | (21,306 | ) | — | (21,306 | ) | ||||||||||||||||
| Net income attributable to HomeAway, Inc. (see Note 10) |
— | — | (2,421 | ) | — | 15,805 | 13,384 | |||||||||||||||||
|
|
|
|
|
|
|
|
|
|
|
|
|
|||||||||||||
| Balance at December 31, 2014 |
94,515 | $ | 9 | $ | 1,022,586 | $ | (28,053 | ) | $ | (62,734 | ) | $ | 931,808 | |||||||||||
|
|
|
|
|
|
|
|
|
|
|
|
|
|||||||||||||
The accompanying notes are an integral part of these financial statements.
F-6
Table of Contents
Consolidated Statements of Cash Flows
| (in thousands) | Year Ended December 31, | |||||||||||
| 2014 | 2013 | 2012 | ||||||||||
| Cash flows from operating activities |
||||||||||||
| Net income |
$ | 13,967 | $ | 17,291 | $ | 14,961 | ||||||
| Adjustments to reconcile net income to net cash provided by operating activities: |
||||||||||||
| Depreciation |
16,926 | 13,399 | 11,051 | |||||||||
| Amortization of intangible assets |
13,916 | 11,668 | 12,438 | |||||||||
| Amortization of debt discount and transaction costs |
13,176 | — | — | |||||||||
| Amortization of premiums on securities and other |
7,212 | 4,030 | 2,409 | |||||||||
| Stock-based compensation |
48,518 | 37,887 | 27,033 | |||||||||
| Excess tax benefit from stock-based compensation |
(3,092 | ) | (8,226 | ) | (7,122 | ) | ||||||
| Deferred income taxes |
(1,664 | ) | (1,455 | ) | (3,119 | ) | ||||||
| Unrealized foreign exchange (gain) loss |
6,183 | 2,450 | 817 | |||||||||
| Realized loss on foreign currency forwards |
328 | 2,926 | 1,910 | |||||||||
| Changes in operating assets and liabilities, net of assets and liabilities assumed in business combinations: |
||||||||||||
| Accounts receivable |
(3,625 | ) | (1,790 | ) | 251 | |||||||
| Income tax receivable |
571 | (2,506 | ) | (672 | ) | |||||||
| Prepaid expenses and other assets |
(4,386 | ) | 878 | (6,987 | ) | |||||||
| Accounts payable |
2,491 | (3,348 | ) | 3,376 | ||||||||
| Accrued expenses |
241 | 11,081 | 4,457 | |||||||||
| Income tax payable |
2,305 | (1,006 | ) | 11,486 | ||||||||
| Deferred revenue |
27,222 | 21,219 | 22,401 | |||||||||
| Other non-current liabilities |
5,075 | (136 | ) | 713 | ||||||||
|
|
|
|
|
|
|
|||||||
| Net cash provided by operating activities |
145,364 | 104,362 | 95,403 | |||||||||
|
|
|
|
|
|
|
|||||||
| Cash flows from investing activities |
||||||||||||
| Acquisition of businesses, net of cash acquired |
(17,847 | ) | (205,470 | ) | (16,207 | ) | ||||||
| Change in restricted cash |
(501 | ) | (492 | ) | 773 | |||||||
| Purchases of intangibles and other assets |
(473 | ) | (625 | ) | (251 | ) | ||||||
| Purchases of non-marketable investments |
(25,148 | ) | (3,667 | ) | (6,446 | ) | ||||||
| Purchases of short-term investments |
(575,606 | ) | (129,782 | ) | (57,080 | ) | ||||||
| Proceeds from maturities and redemptions of marketable securities |
109,516 | 46,679 | 40,406 | |||||||||
| Proceeds from sales of marketable securities |
4,358 | 92,527 | — | |||||||||
| Net settlement of foreign currency forwards |
(328 | ) | (2,926 | ) | (1,910 | ) | ||||||
| Purchases of property and equipment |
(31,647 | ) | (19,616 | ) | (17,260 | ) | ||||||
|
|
|
|
|
|
|
|||||||
| Net cash used in investing activities |
(537,676 | ) | (223,372 | ) | (57,975 | ) | ||||||
|
|
|
|
|
|
|
|||||||
| Cash flows from financing activities |
||||||||||||
| Repurchase of redeemable noncontrolling interests |
(1,461 | ) | — | — | ||||||||
| Proceeds from borrowings on convertible senior notes, net |
390,978 | — | — | |||||||||
| Proceeds from issuance of warrants |
38,278 | — | — | |||||||||
| Purchase of convertible note hedge |
(85,853 | ) | — | — | ||||||||
| Other financing activities |
(919 | ) | — | — | ||||||||
| Proceeds from exercise of options to purchase common stock |
25,386 | 48,473 | 25,878 | |||||||||
| Proceeds from follow-on offering, net of offering costs |
— | 195,348 | — | |||||||||
| Excess tax benefit from stock-based compensation |
3,092 | 8,226 | 7,122 | |||||||||
|
|
|
|
|
|
|
|||||||
| Net cash provided by financing activities |
369,501 | 252,047 | 33,000 | |||||||||
|
|
|
|
|
|
|
|||||||
| Effect of exchange rate changes on cash |
(9,472 | ) | 2,093 | 842 | ||||||||
|
|
|
|
|
|
|
|||||||
| Net increase (decrease) in cash and cash equivalents |
(32,283 | ) | 135,130 | 71,270 | ||||||||
| Cash and cash equivalents at beginning of year |
324,608 | 189,478 | 118,208 | |||||||||
|
|
|
|
|
|
|
|||||||
| Cash and cash equivalents at end of year |
$ | 292,325 | $ | 324,608 | $ | 189,478 | ||||||
|
|
|
|
|
|
|
|||||||
| Cash paid for interest |
$ | 253 | $ | — | $ | — | ||||||
| Cash paid for taxes |
$ | 1,385 | $ | 13,841 | $ | 9,105 | ||||||
| Supplemental disclosure of non-cash investing and financing activities |
||||||||||||
| Changes to accrued capital expenditures |
$ | 2,403 | $ | 317 | $ | 541 | ||||||
| Changes to redemption value of noncontrolling interests |
$ | 2,421 | $ | — | $ | — | ||||||
The accompanying notes are an integral part of these financial statements.
F-7
Table of Contents
Notes to Consolidated Financial Statements
1. Description of Business
HomeAway, Inc. (the “Company”) operates an online vacation rental property marketplace that enables property owners and managers to market properties available for rental to vacation travelers who rely on the Company’s websites to search for and find available properties. Property owners and managers pay listing fees to provide detailed listings of their properties on the Company’s websites and reach a broad audience of travelers seeking vacation rentals. Listing fees are typically annual subscriptions or payments on a performance basis, based on bookings or inquiries made by travelers to property owners and managers. A listing includes published detailed property listings, including photographs, descriptions, location, pricing, availability and contact information. The Company also sells, itself or through third parties, complementary products, including travel guarantees, insurance products and property management software and services. Travelers use the network of websites to search for vacation rentals that meet their desired criteria, including location, size and price. Travelers that find properties that meet their requirements through the Company’s marketplace are able to make reservations online or contact property owners and managers directly by phone or through form-based communication tools on the Company’s websites.
The Company is a Delaware corporation headquartered in Austin, Texas.
2. Summary of Significant Accounting Policies
Basis of Presentation
The accompanying consolidated financial statements include the accounts of HomeAway, Inc. and all of its wholly and majority-owned subsidiaries and have been prepared in accordance with accounting principles generally accepted in the United States. All significant intercompany transactions and balances have been eliminated in consolidation.
Business Segment
The Company has one operating segment consisting of various products and services related to its online marketplace of accommodation rental listings. The Company’s chief operating decision maker is considered to be the Chief Executive Officer. The chief operating decision maker allocates resources and assesses performance of the business and other activities at the single operating segment level.
Use of Estimates
The preparation of financial statements in conformity with GAAP requires management to make estimates and assumptions that affect the reported amounts of assets and liabilities and disclosure of contingent assets and liabilities at the date of the financial statements and the reported amounts of revenue and expenses during the reporting periods. Actual results could differ from those estimates. These differences could have a material effect on the Company’s future results of operations and financial position. Significant items subject to estimates and assumptions include certain revenues, the allowance for doubtful accounts, the fair value of short-term investments, the carrying amounts of goodwill and other indefinite-lived intangible assets, depreciation and amortization, the valuation of stock options, deferred income taxes and the fair value of noncontrolling interests.
F-8
Table of Contents
Fair Value of Financial Instruments
Fair value is defined as the price that would be received from the sale of an asset or paid to transfer a liability in an orderly transaction between market participants at the measurement date. To increase the comparability of fair value measures, the following hierarchy prioritizes the inputs to valuation methodologies used to measure fair value:
| Level 1: | Valuations based on quoted prices for identical assets and liabilities in active markets. | |
| Level 2: | Valuations based on observable inputs other than quoted prices included in Level 1, such as quoted prices for similar assets and liabilities in active markets, quoted prices for identical or similar assets and liabilities in markets that are not active, or other inputs that are observable or can be corroborated by observable market data. | |
| Level 3: | Valuations based on unobservable inputs reflecting the Company’s own assumptions, consistent with reasonably available assumptions made by other market participants. These valuations require significant judgment. | |
The following section describes the valuation methodologies used to measure certain financial assets and financial liabilities at fair value.
Cash Equivalents, Restricted Cash and Short-Term Investments
The Company’s cash equivalents, restricted cash and short-term investments classified as Level 1 are valued using quoted prices generated by market transactions involving identical assets. Short-term investments classified as Level 2 are valued using non-binding market consensus prices that are corroborated with observable market data; quoted market prices for similar instruments in active markets; or pricing models, such as a discounted cash flow model, with all significant inputs derived from or corroborated with observable market data. The Company did not hold any cash equivalents, restricted cash or short-term investments categorized as Level 3 as of December 31, 2014 or 2013.
Short-term investments include time deposits, corporate bonds, municipal bonds and commercial paper and are classified as available-for-sale and reported at fair value using the specific identification method. Unrealized gains and losses are excluded from earnings and reported as a component of other comprehensive income (loss), net of related estimated tax provisions or benefits. Additionally, the Company periodically assesses whether an other than temporary impairment loss on investments has occurred due to declines in fair value or other market conditions. Declines in fair value that are considered other than temporary are recorded as an impairment in the consolidated statement of operations. The Company did not record any impairments of its investments for any of the periods presented.
The carrying amounts of certain of the Company’s financial instruments, including cash and cash equivalents, accounts receivable, prepaid expenses and other current assets, accounts payable, accrued liabilities and deferred revenue approximate fair value because of the relatively short maturity of these instruments.
F-9
Table of Contents
The following table summarizes the basis used to measure certain financial assets at fair value on a recurring basis in the Company’s consolidated balance sheets at December 31, 2014 (in thousands):
| Balance as of December 31, 2014 |
Quoted Prices in Active Markets for Identical Assets (Level 1) |
Significant Other Observable Inputs (Level 2) |
Significant Unobservable Inputs (Level 3) |
|||||||||||||
| Assets |
||||||||||||||||
| Cash equivalents |
||||||||||||||||
| Money market funds |
$ | 183,008 | $ | 183,008 | $ | — | $ | — | ||||||||
| Municipal bonds |
1,001 | — | 1,001 | — | ||||||||||||
|
|
|
|
|
|
|
|
|
|||||||||
| Total cash equivalents |
184,009 | 183,008 | 1,001 | — | ||||||||||||
| Restricted cash |
||||||||||||||||
| Time deposits |
2,058 | — | 2,058 | — | ||||||||||||
|
|
|
|
|
|
|
|
|
|||||||||
| Total restricted cash |
2,058 | — | 2,058 | — | ||||||||||||
| Short-term investments |
||||||||||||||||
| Certificates of deposit |
21,726 | — | 21,726 | — | ||||||||||||
| Corporate bonds |
353,212 | — | 353,212 | — | ||||||||||||
| Municipal bonds |
140,406 | — | 140,406 | — | ||||||||||||
| International government bonds |
1,501 | — | 1,501 | — | ||||||||||||
| Commercial paper |
3,999 | — | 3,999 | — | ||||||||||||
|
|
|
|
|
|
|
|
|
|||||||||
| Total short-term investments |
520,844 | — | 520,844 | — | ||||||||||||
|
|
|
|
|
|
|
|
|
|||||||||
| Total financial assets |
$ | 706,911 | $ | 183,008 | $ | 523,903 | $ | — | ||||||||
|
|
|
|
|
|
|
|
|
|||||||||
The following table summarizes the basis used to measure certain financial assets at fair value on a recurring basis in the Company’s consolidated balance sheets at December 31, 2013 (in thousands):
| Balance as of December 31, 2013 |
Quoted Prices in Active Markets for Identical Assets (Level 1) |
Significant Other Observable Inputs (Level 2) |
Significant Unobservable Inputs (Level 3) |
|||||||||||||
| Assets |
||||||||||||||||
| Cash equivalents |
||||||||||||||||
| Money market funds |
$ | 26,451 | $ | 26,451 | $ | — | $ | — | ||||||||
|
|
|
|
|
|
|
|
|
|||||||||
| Total cash equivalents |
26,451 | 26,451 | — | — | ||||||||||||
| Restricted cash |
||||||||||||||||
| Money market funds |
758 | 758 | — | — | ||||||||||||
|
|
|
|
|
|
|
|
|
|||||||||
| Total restricted cash |
758 | 758 | — | — | ||||||||||||
| Short-term investments |
||||||||||||||||
| Time deposits |
2,054 | — | 2,054 | — | ||||||||||||
| Corporate bonds |
33,257 | — | 33,257 | — | ||||||||||||
| Municipal bonds |
31,487 | — | 31,487 | — | ||||||||||||
|
|
|
|
|
|
|
|
|
|||||||||
| Total short-term investments |
66,798 | — | 66,798 | — | ||||||||||||
|
|
|
|
|
|
|
|
|
|||||||||
| Total financial assets |
$ | 94,007 | $ | 27,209 | $ | 66,798 | $ | — | ||||||||
|
|
|
|
|
|
|
|
|
|||||||||
Cash and Cash Equivalents
Cash and cash equivalents include investments in money market funds, corporate and municipal bonds and time deposits that are readily convertible into cash. Cash and cash equivalents are stated at cost, which approximates fair value. The Company considers all highly liquid investments purchased with an original
F-10
Table of Contents
maturity date of three months or less to be cash equivalents. Cash and cash equivalents consisted of the following at December 31, 2014 and December 31, 2013 (in thousands):
| December 31, | ||||||||
| 2014 | 2013 | |||||||
| Demand deposit accounts |
$ | 108,316 | $ | 298,157 | ||||
| Money market funds |
183,008 | 26,451 | ||||||
| Municipal bonds |
1,001 | — | ||||||
|
|
|
|
|
|||||
| Total |
$ | 292,325 | $ | 324,608 | ||||
|
|
|
|
|
|||||
Restricted Cash
Restricted cash of $2,492,000 and $2,180,000 at December 31, 2014 and December 31, 2013, respectively, was held in accounts owned by the Company in conjunction with property license requirements, leased office space and to secure credit card availability and reimbursable direct debits due from the Company.
Short-term Investments
Short-term investments generally consist of marketable securities that have original maturities greater than ninety days as of the date of purchase. Investments in which the Company has the ability and intent, if necessary, to liquidate in order to support its current operations, including those with contractual maturities greater than one year from the date of purchase, are classified as short-term. The Company’s investment securities are classified as available-for-sale and are presented at estimated fair value with any unrealized gains and losses included in other comprehensive income (loss).
Cash flows from purchases, sales and maturities of available-for-sale securities are classified as cash flows from investing activities and reported gross, including any related premiums or discounts. Premiums related to purchases of available-for-sale securities were $13,187,000 and $8,065,000 during the year ended December 31, 2014 and 2013, respectively. Fair values are based on quoted market prices. Short-term investments consisted of the following at December 31, 2014 and December 31, 2013 (in thousands):
| December 31, 2014 | ||||||||||||||||
| Gross Cost |
Gross Unrealized Gains |
Gross Unrealized Losses |
Estimated Fair Value |
|||||||||||||
| Time deposits |
$ | 21,726 | $ | — | $ | — | $ | 21,726 | ||||||||
| Corporate bonds |
353,957 | 7 | (752 | ) | 353,212 | |||||||||||
| Municipal bonds |
140,455 | 45 | (94 | ) | 140,406 | |||||||||||
| International government bonds |
1,504 | — | (3 | ) | 1,501 | |||||||||||
| Commercial paper |
3,999 | — | — | 3,999 | ||||||||||||
|
|
|
|
|
|
|
|
|
|||||||||
| Total short-term investments |
$ | 521,641 | $ | 52 | $ | (849 | ) | $ | 520,844 | |||||||
|
|
|
|
|
|
|
|
|
|||||||||
| December 31, 2013 | ||||||||||||||||
| Gross Cost |
Gross Unrealized Gains |
Gross Unrealized Losses |
Estimated Fair Value |
|||||||||||||
| Time deposits |
$ | 2,055 | $ | — | $ | (1 | ) | $ | 2,054 | |||||||
| Corporate bonds |
33,274 | 33 | (50 | ) | 33,257 | |||||||||||
| Municipal bonds |
31,486 | 16 | (15 | ) | 31,487 | |||||||||||
|
|
|
|
|
|
|
|
|
|||||||||
| Total short-term investments |
$ | 66,815 | $ | 49 | $ | (66 | ) | $ | 66,798 | |||||||
|
|
|
|
|
|
|
|
|
|||||||||
F-11
Table of Contents
For fixed income securities that have unrealized losses as of December 31, 2014, the Company does not have the intent to sell any of these investments and it is not more likely than not that it will be required to sell any of these investments before recovery of the entire amortized cost basis. The Company has evaluated these fixed income securities and determined that no credit losses exist. Accordingly, the Company has determined that the unrealized losses on fixed income securities as of December 31, 2014 were temporary in nature.
The following table summarizes the contractual underlying maturities of the Company’s short-term investments at December 31, 2014 and December 31, 2013 (in thousands):
| December 31, 2014 | ||||||||||||
| Less than 1 Year |
1 to 3 Years | Total | ||||||||||
| Time deposits |
$ | 21,479 | $ | 247 | $ | 21,726 | ||||||
| Corporate bonds |
240,570 | 112,642 | 353,212 | |||||||||
| Municipal bonds |
87,615 | 52,791 | 140,406 | |||||||||
| International government bonds |
1,501 | — | 1,501 | |||||||||
| Commercial paper |
3,999 | — | 3,999 | |||||||||
|
|
|
|
|
|
|
|||||||
| Total short-term investments |
$ | 355,164 | $ | 165,680 | $ | 520,844 | ||||||
|
|
|
|
|
|
|
|||||||
| December 31, 2013 | ||||||||||||
| Less than 1 Year |
1 to 3 Years | Total | ||||||||||
| Time deposits |
$ | 500 | $ | 1,554 | $ | 2,054 | ||||||
| Corporate bonds |
11,164 | 22,093 | 33,257 | |||||||||
| Municipal bonds |
3,031 | 28,456 | 31,487 | |||||||||
|
|
|
|
|
|
|
|||||||
| Total short-term investments |
$ | 14,695 | $ | 52,103 | $ | 66,798 | ||||||
|
|
|
|
|
|
|
|||||||
Non-marketable Cost Investment
During the year ended December 31, 2014, the Company invested an additional $9,385,000 for a non-controlling equity interest in a privately-held company in China. As of December 31, 2014, the total carrying value of the Company’s investment in the privately-held company was $19,498,000. Also during 2014, the Company invested $15,000,000 for a non-controlling equity interest in a privately-held company in the United States that operates a travel research application and website.
The Company’s investment in these privately-held companies is reported using the cost method of accounting or marked down to fair value when an event or circumstance indicates an other-than-temporary decline in value has occurred. No event or circumstance indicating an other-than-temporary decline in value of the Company’s interest in the non-marketable cost investments was identified. These investments are recorded in other non-current assets on the consolidated balance sheets.
Accounts Receivable
Accounts receivable are generated from several sources. Amounts due from credit card merchants who process the Company’s credit card sales from property listings and remit the proceeds to the Company are the primary source of accounts receivable. Accounts receivable are also generated from Internet display advertising amounts due in the ordinary course of business as well as amounts due to the Company for property listings, other products purchased on account or amounts due from partners who provide products and services such as advertising the properties of our property owners and managers on their websites, insurance products and payment processing services. Accounts receivable outstanding longer than the contractual payment terms are considered past due. The Company determines its allowance for doubtful accounts by estimating losses on receivables based on known troubled accounts and historical experiences of losses incurred.
F-12
Table of Contents
Property and Equipment
Property and equipment are recorded at cost less accumulated depreciation. Depreciation is computed using the straight-line method over the estimated useful lives of the related assets. Computer equipment and purchased software are generally depreciated over three years. Furniture and fixtures are generally depreciated over five to ten years. Leasehold improvements are depreciated on a straight-line basis over the shorter of the contractual lease period or their estimated useful life. Upon disposal, property and equipment and the related accumulated depreciation are removed from the accounts and the resulting gain or loss is reflected in the statements of operations. Ordinary maintenance and repairs are charged to expense, while expenditures that extend the physical or economic life of the assets are capitalized.
The Company capitalizes certain internally developed software and website development costs. These capitalized costs were $36,038,000 and $30,523,000 at December 31, 2014 and December 31, 2013, respectively, and are included in property and equipment, net, in the consolidated balance sheets. Internally developed software costs are generally depreciated over five years.
The Company recorded depreciation expense on internally developed software and website development costs as follows for the years ended December 31, 2014, 2013 and 2012 (in thousands):
| Year Ended December 31, | ||||||||||||
| 2014 | 2013 | 2012 | ||||||||||
| Depreciation expense on internally developed software and website development costs |
$ | 5,471 | $ | 3,939 | $ | 2,874 | ||||||
Goodwill and Intangible Assets
Goodwill arises from business combinations and is measured as the excess of the purchase consideration over the sum of the acquisition-date fair values of tangible and identifiable intangible assets acquired, less any liabilities assumed. The Company uses estimates and assumptions to value assets acquired and liabilities assumed at the acquisition date, and these estimates are inherently uncertain and subject to refinement. As a result, during the measurement period, which may be up to one year from the acquisition date, adjustments to the assets acquired and liabilities assumed are recorded with the corresponding offset to goodwill. Upon the conclusion of the measurement period or final determination of the values of assets acquired or liabilities assumed, whichever comes first, any subsequent adjustments are recorded to the consolidated statements of operations.
Goodwill and intangible assets deemed to have indefinite useful lives, such as certain trade names, are not amortized. Tests for impairment of goodwill and indefinite-lived intangible assets are performed on an annual basis or when events or circumstances indicate that the carrying amount may not be recoverable.
Circumstances that could trigger an impairment test outside of the annual test include but are not limited to: a significant adverse change in the business climate or legal factors, adverse cash flow trends, an adverse action or assessment by a regulator, unanticipated competition, loss of key personnel, decline in stock price and the results of tests for recoverability of a significant asset group. The Company determined that no triggering event occurred during any of the periods presented.
For goodwill and indefinite lived intangible assets, the Company completes what is referred to as the “Step 0” analysis, which involves evaluating qualitative factors, including macroeconomic conditions, industry and market considerations, cost factors, and overall financial performance related to its goodwill and its indefinite lived intangible assets. If the Company’s “Step 0” analysis indicates that it is more likely than not that the fair value of a reporting unit or of an indefinite lived intangible asset is less than its carrying amount, then the Company would perform a quantitative two-step impairment test. The quantitative analysis compares the fair value of the Company’s reporting unit or indefinite-lived intangible assets to its carrying amount, and an
F-13
Table of Contents
impairment loss is recognized equivalent to the excess of the carrying amount over fair value. If, after assessing the totality of events or circumstances, the Company determines that it is more likely than not that the fair value of a reporting unit or indefinite lived intangible asset exceeds its carrying amount, then the quantitative impairment tests are unnecessary.
The Company performs an evaluation of goodwill and indefinite-lived intangible assets for impairment annually in the fourth quarter of its fiscal year.
The determination of whether or not goodwill or indefinite-lived intangible assets have become impaired involves a significant level of judgment. Changes in the Company’s strategy and/or market conditions could significantly impact these judgments and require adjustments to recorded amounts of goodwill or intangible assets.
No impairment of goodwill or indefinite-lived intangible assets was identified in any of the periods presented.
Identifiable intangible assets consist of trade names, customer listings, technology, domain names and contractual non-competition agreements associated with acquired businesses. Intangible assets with finite lives are amortized over their estimated useful lives on a straight-line basis and reviewed for impairment whenever events or changes in circumstances indicate that an asset’s carrying value may not be recoverable (see Note 4). The straight-line method of amortization represents the Company’s best estimate of the distribution of the economic value of the identifiable intangible assets.
Impairment of Long-lived Assets
The Company evaluates long-lived assets held for use, such as property and equipment, for impairment whenever events or changes in circumstances indicate the carrying value of an asset may not be recoverable. An impairment loss is recognized when estimated future undiscounted cash flows expected to result from the use of the asset plus net proceeds expected from disposition of the asset, if any, are less than the carrying value of the asset. When an impairment loss is recognized, the carrying amount of the asset is reduced to its estimated fair value in the period in which the determination is made. No material impairments of long-lived assets have been recorded during any of the periods presented.
Leases
The Company leases facilities in several countries around the world and certain equipment under non-cancelable lease agreements. The terms of certain lease agreements provide for rental payments on a graduated basis. Rent expense is recognized on a straight-line basis over the lease period and accrued as rent expense incurred but not paid.
Revenue Recognition
The Company recognizes revenue when persuasive evidence of an agreement exists, delivery has occurred, the sales price is fixed or determinable and collectability is reasonably assured. The Company accounts for sales incentives to customers as a reduction of revenue at the time that the revenue is recognized from the related product sale. The Company also reports revenue net of any sales tax collected.
The Company generates a significant portion of its revenue from customers purchasing online advertising services related to the listing of their properties for rent, primarily on a subscription basis over a fixed-term. The Company also generates revenue based on the number of traveler inquiries and reservation bookings for property listings on the Company’s websites, local and national Internet display advertisers, license of property management software and ancillary products and services.
F-14
Table of Contents
Payments for term-based subscriptions received in advance of services being rendered are recorded as deferred revenue and recognized on a straight-line basis over the listing period.
Revenue for inquiry-based contracts are determined on a fixed fee-per-inquiry as stated in the arrangement and recognized when the service has been performed.
The Company earns commission revenue for reservations made online through its websites, which is calculated as a percentage of the value of the reservation. This revenue is earned as the services are performed or as the customers’ refund privileges lapse and is included in listing revenue in the consolidated statement of operations.
Internet display advertising revenue is generated primarily from advertisements appearing on the Company’s websites. Depending upon the terms, revenue is earned each time an impression is delivered, a user clicks on an ad, a graphic ad is displayed, or a user clicks-through the ad and takes a specified action on the destination site.
The Company sells gift cards with no expiration date to travelers and does not charge administrative fees on unused cards. There is a portion of the gift card obligation that, based on historical redemption patterns, will not be used by the Company’s customers and is not required to be remitted to relevant jurisdictions (“breakage”). At the point of sale, the Company recognizes breakage as deferred revenue and amortizes it over 48 months based on historical redemption patterns. The Company also records commission revenue for each gift card sale over the same 48-month redemption period.
Through its professional software for bed and breakfasts and professional property managers, the Company makes selected, online bookable properties available to online travel agencies and channel partners. The Company receives a percentage of the transaction value or a fee from the property manager for making this inventory available, which is recognized when earned. This revenue is included in other revenue in the consolidated statement of operations.
The Company generates revenue from the licensing of software products, the sale of maintenance agreements and the sale of hosted software solutions. For software license sales, one year of maintenance is typically included as part of the initial purchase price of the bundled offering with annual renewals of the maintenance component of the agreement following in subsequent years.
The Company recognizes revenue from the sale of perpetual licenses upon delivery, which generally occurs upon electronic transfer of the license key that makes the product available to the purchaser.
As software is usually sold with maintenance, the amount of revenue allocated to the software license is determined by estimating the fair value of the maintenance and subtracting it from the total invoice or contract amount. Vendor-specific objective evidence, or VSOE, of the fair value of maintenance services is determined by the standard published list pricing for maintenance renewals, as the Company generally charges list prices for maintenance renewals. In determining VSOE, the Company requires that a substantial majority of the selling price for maintenance services fall within a reasonably narrow pricing range. Maintenance and support revenue is recognized ratably over the term of the agreement beginning on the activation date. Amounts that have been invoiced are recorded in accounts receivable and in deferred revenue or revenue, depending on whether the revenue recognition criteria have been met.
Sales of hosted software solutions are generally for a one-year period. Revenue is recognized on a straight-line basis over the contract term. Certain implementation services related to the hosting services are essential to the customer’s use of the hosting services. For sales of these hosting services where the Company is responsible for implementation, the Company recognizes implementation revenue ratably over the estimated period of the hosting relationship, which the Company considers to be three years. Recognition starts once the product has been made available to the customer.
F-15
Table of Contents
Training and consulting revenue is recognized upon delivery of the training or consulting services to the end customer.
The Company accounts for sales incentives to customers as a reduction of revenue at the time that the revenue is recognized from the related product sale. The Company also reports revenue net of any sales tax collected.
Cost of Revenue
Cost of revenue consists of salaries, benefits and related expenses and stock-based compensation of the Company’s customer service and web hosting personnel, merchant fees charged by credit card processors, costs associated with the hosting of the Company’s websites, costs associated with payments and reserves under the Company’s Carefree Rental Guarantee, allocated facility expenses and depreciation costs.
Advertising Expenses
The Company expenses all advertising costs as incurred. Advertising expenses included in sales and marketing expenses were approximately $59,978,000, $39,138,000 and $37,559,000 for the years ended December 31, 2014, 2013 and 2012, respectively.
Stock-Based Compensation
The cost of stock-based compensation is recognized in the financial statements based upon the estimated grant date fair value of the awards measured using the Black–Scholes valuation model. The fair value of restricted stock awards and units is determined based on the number of shares granted and the fair value of the Company’s common stock as of the grant date. Fair value is generally recognized as an expense on a straight-line basis, net of estimated forfeitures, over the employee requisite service period. When estimating forfeitures, the Company considers voluntary termination behaviors as well as trends of actual option forfeitures.
The Company uses the “with and without” approach in determining the order in which tax attributes are utilized. As a result, the Company only recognizes a tax benefit from stock-based awards in additional paid-in capital if an incremental tax benefit is realized after all other tax attributes currently available to the Company have been utilized. When tax deductions from stock-based awards are less than the cumulative book compensation expense, the tax effect of the resulting difference is charged first to additional paid-in capital to the extent of the Company’s pool of windfall tax benefits with any remainder recognized in income tax expense. The Company has determined that it has a sufficient windfall pool available and therefore no amounts have been recognized in income tax expense. In addition, the Company accounts for the indirect effects of stock-based awards on other tax attributes through the consolidated statements of operations.
The gross benefits of tax deductions in excess of recognized compensation costs are reported as financing cash inflows, but only when such excess tax benefits are realized by a reduction to current taxes payable.
The following table summarizes the excess tax benefit that the Company recorded for the years ended December 31, 2014, 2013 and 2012 (in thousands):
| Year Ended December 31, | ||||||||||||
| 2014 | 2013 | 2012 | ||||||||||
| Excess tax benefit from stock-based compensation, net |
$ | 2,743 | $ | 8,226 | $ | 7,122 | ||||||
This tax benefit has been recorded as additional paid-in capital on the Company’s consolidated balance sheets.
F-16
Table of Contents
Income Taxes
The Company recognizes income taxes using an asset and liability approach. This approach requires the recognition of deferred tax liabilities and assets for the future tax consequences of events that have been recognized in the Company’s consolidated financial statements or tax returns. The measurement of deferred taxes is based on provisions of the enacted tax law and the effects of future changes in tax laws or rates are not anticipated. A valuation allowance is recognized if, based on the weight of available evidence, it is more likely than not that some portion or all of the deferred tax asset will not be realized. Evaluating the need for an amount of a valuation allowance for deferred tax assets requires significant judgment and analysis of the positive and negative evidence available, including past operating results, estimates of future taxable income, reversals of existing taxable temporary differences and the feasibility of tax planning in order to determine whether all or some portion of the deferred tax assets will not be realized. Based on the available evidence and judgment, the Company has determined that it is more likely than not that certain loss carryforwards will not be realized; therefore, the Company has established a valuation allowance for such deferred tax assets to reduce the loss carryforward assets to amounts expected to be utilized.
The Company may be subject to income tax audits by the respective tax authorities in any or all of the jurisdictions in which the Company operates. The Company is currently undergoing an audit in the United States as well as at its subsidiary in the United Kingdom. Significant judgment is required in determining uncertain tax positions. The Company recognizes the benefit of uncertain income tax positions only if these positions are more likely than not to be sustained. Also, the recognized income tax benefit is measured at the largest amount that is more than 50% likely of being realized. The Company adjusts these reserves in light of changing facts and circumstances, such as the closing of an audit or the refinement of an estimate. Changes in recognition or measurement are reflected in the period in which the change in judgment occurs. The Company records interest and penalties related to unrecognized tax benefits as a component of income tax expense. The countries in which the Company may be subject to potential examination by tax authorities include Australia, Brazil, Colombia, France, Germany, Italy, the Netherlands, New Zealand, Singapore, Spain, Switzerland, Thailand, the United Kingdom and the United States.
The calculation of the Company’s tax liabilities involves the inherent uncertainty associated with the application of complex tax laws. As a multinational corporation, the Company conducts its business in many countries and is subject to taxation in many jurisdictions. The taxation of the Company’s business is subject to the application of various and sometimes conflicting tax laws and regulations as well as multinational tax conventions. The Company’s effective tax rate is highly dependent upon the geographic distribution of its worldwide earnings or losses, the tax regulations and tax rates in each geographic region, the availability of tax credits and carryforwards, and the effectiveness of its tax planning strategies. The application of tax laws and regulations is subject to legal and factual interpretation, judgment and uncertainty. Tax laws themselves are subject to change as a result of changes in fiscal policy, changes in legislation, and the evolution of regulations and court rulings. Consequently, taxing authorities may impose tax assessments or judgments against the Company that could materially impact its tax liability and/or its effective income tax rate. The Company believes it has adequately provided in its financial statements for additional taxes that it estimates may be assessed by the various taxing authorities. While the Company believes that it has adequately provided for all uncertain tax positions, amounts asserted by tax authorities could be greater or less than the Company’s accrued position. These tax liabilities, including the interest and penalties, are adjusted pursuant to a settlement with tax authorities, completion of audit, refinement of estimates or expiration of various statutes of limitation.
Foreign Currency Translation
The functional currency of the Company’s foreign subsidiaries is generally their respective local currency. The financial statements of the Company’s international operations are translated into U.S. dollars using the exchange rate at each balance sheet date for assets and liabilities, the historical exchange rate for stockholders’ equity, and a weighted average exchange rate for each period for revenue, expenses, and gains and losses.
F-17
Table of Contents
Foreign currency translation adjustments are recorded as a separate component of stockholders’ equity. Gains and losses from foreign currency denominated transactions are recorded in other income (expense) in the Company’s consolidated statements of operations.
The following table summarizes the foreign exchange loss that the Company recorded for the years ended December 31, 2014, 2013 and 2012 (in thousands):
| Year Ended December 31, | ||||||||||||
| 2014 | 2013 | 2012 | ||||||||||
| Foreign exchange loss |
$ | 7,138 | $ | 5,964 | $ | 2,618 | ||||||
Derivative Financial Instruments
As a result of the Company’s international operations, it is exposed to various market risks that may affect its consolidated results of operations, cash flows and financial position. These market risks include, but are not limited to, fluctuations in currency exchange rates. The Company’s primary foreign currency exposures are in Euros, British Pound Sterling and Australian Dollars. As a result, the Company faces exposure to adverse movements in currency exchange rates as the financial results of its operations are translated from local currency into U.S. dollars upon consolidation. Additionally, foreign exchange rate fluctuations on transactions denominated in currencies other than the functional currency result in gains and losses that are reflected in other income (expense) in the Company’s consolidated statements of operations.
The Company may enter into derivative instruments to hedge certain net exposures of nonfunctional currency denominated assets and liabilities, primarily related to intercompany loans, even though it does not elect to apply hedge accounting or hedge accounting does not apply. Gains and losses resulting from a change in fair value for these derivatives are reflected in the period in which the change occurs and are recognized on the consolidated statement of operations in other income (expense). Cash flows from these contracts are classified within cash flows from investing activities on the consolidated statements of cash flows.
The Company does not use financial instruments for trading or speculative purposes. The Company recognizes all derivative instruments on the balance sheet at fair value and its derivative instruments are generally short-term in duration. The Company is exposed to the risk that counterparties to derivative contracts may fail to meet their contractual obligations.
The following table shows the fair value and notional amounts of the Company’s outstanding or unsettled derivative instruments that are not designated as hedging instruments covering foreign currency exposures during the year ended December 31, 2014 and closing January 2, 2015 (in thousands):
| Balance Sheet Caption |
December 31, 2014 | |||||||||||||||
| Significant Other Observable Inputs (Level 2) |
U.S. Dollar Notional |
|||||||||||||||
| Gross Amount of Recognized Assets/Liabilities |
Gross Amounts Offset in the Balance Sheet |
Net Amount Presented in the Balance Sheet |
||||||||||||||
| Prepaid expenses and other current assets |
$ | 4,506 | $ | — | $ | 4,506 | $ | 157,164 | ||||||||
| Accrued expenses |
(67 | ) | — | (67 | ) | 11,562 | ||||||||||
|
|
|
|
|
|
|
|
|
|||||||||
| Total |
$ | 4,439 | $ | — | $ | 4,439 | $ | 168,726 | ||||||||
|
|
|
|
|
|
|
|
|
|||||||||
In addition to the notional amounts listed above, the Company also had $165,454,000 of derivatives entered into on December 31, 2014 with a closing date of April 2, 2015.
F-18
Table of Contents
The following table shows the fair value and notional amounts of the Company’s outstanding or unsettled derivative instruments that are not designated as hedging instruments covering foreign currency exposures during the year ended December 31, 2013 (in thousands):
| Balance Sheet Caption |
December 31, 2013 | |||||||||||||||
| Significant Other Observable Inputs (Level 2) |
U.S. Dollar Notional |
|||||||||||||||
| Gross Amount of Recognized Assets/Liability |
Gross Amounts Offset in the Balance Sheet |
Net Amount Presented in the Balance Sheet |
||||||||||||||
| Prepaid expenses and other current assets |
$ | 363 | $ | — | $ | 363 | $ | 20,520 | ||||||||
| Accrued expenses |
(979 | ) | — | (979 | ) | 84,292 | ||||||||||
|
|
|
|
|
|
|
|
|
|||||||||
| Total |
$ | (616 | ) | $ | — | $ | (616 | ) | $ | 104,812 | ||||||
|
|
|
|
|
|
|
|
|
|||||||||
Net Income Per Share Attributable to HomeAway, Inc.
Basic net income per share is computed by dividing net income attributable to HomeAway, Inc. by the weighted average number of common shares outstanding during the period. Diluted income per share is computed by dividing net income attributable to HomeAway, Inc. by the weighted average common shares outstanding plus potentially dilutive common shares. The dilutive effect of outstanding options, warrants and awards is reflected in diluted earnings per share by application of the treasury stock method.
Restricted stock awards provide the holder of unvested shares the right to participate in dividends declared on the Company’s common stock. Accordingly, these shares are included in the weighted average shares outstanding for the computation of basic earnings per share in periods of undistributed earnings. Restricted stock awards are excluded from the basic earnings per share in periods of undistributed losses as the holders are not contractually obligated to participate in the losses of the Company. Unvested restricted stock units do not provide the holder the right to participate in dividends declared on the Company’s common stock. Accordingly, these shares are excluded in the weighted average shares outstanding for the computation of basic earnings per share in periods of undistributed earnings or losses.
Comprehensive Income (Loss) Attributable to HomeAway, Inc.
Comprehensive income (loss) attributable to HomeAway, Inc. consists of net income (loss), cumulative foreign currency translation adjustments, unrealized gain (loss) on available-for-sale securities and comprehensive income (loss) attributable to noncontrolling interests.
Concentrations
Financial instruments that potentially expose the Company to concentrations of credit risk consist primarily of cash and cash equivalents and short-term investments. The Company’s cash is deposited in financial institutions. However, cash and cash equivalents may exceed federally insured limits from time to time. The Company has not experienced any losses on its deposits.
Reclassifications
Certain reclassifications have been made to prior periods’ consolidated balance sheets and statements of operations to conform to the current period presentation. These reclassifications did not result in any change in previously reported total revenue, net income, total assets or shareholders’ equity.
F-19
Table of Contents
Recent Accounting Pronouncements
In May 2014, the FASB issued ASU No. 2014-09, Revenue from Contracts with Customers, requiring an entity to recognize the amount of revenue to which it expects to be entitled for the transfer of promised goods or services to customers. The updated standard will replace most existing revenue recognition guidance in U.S. GAAP when it becomes effective and permits the use of either the retrospective or cumulative effect transition method. Early adoption is not permitted. The updated standard is effective for fiscal years, and interim reporting periods within those years, beginning after December 15, 2016. The Company has not yet selected a transition method and is currently evaluating the effect that the updated standard will have on its consolidated financial statements and related disclosures.
In August 2014, the FASB issued ASU No. 2014-15, Presentation of Financial Statements – Going Concern, Disclosure of Uncertainties about an Entity’s Ability to Continue as a Going Concern, related to the disclosures around going concern. The new standard provides guidance around management’s responsibility to evaluate whether there is substantial doubt about an entity’s ability to continue as a going concern and to provide related footnote disclosures. The new standard is effective for fiscal years, and interim periods within those fiscal years, beginning after December 15, 2016. Early adoption is permitted. The adoption of this standard is not expected to have a material impact on the Company’s financial statements.
3. Business Combinations
The following table summarizes the Company’s acquisitions during the years ended December 31, 2014, 2013 and 2012 with amounts shown below as fair values at each respective acquisition date (in thousands):
| Glad to Have You |
Stayz | Bookabach | travelmob | Toprural | ||||||||||||||||
| Year acquired |
2014 | 2013 | 2013 | 2013 | 2012 | |||||||||||||||
| Net tangible assets (liabilities) acquired |
||||||||||||||||||||
| Cash |
$ | 25 | $ | 4,942 | $ | 395 | $ | 63 | $ | 3,220 | ||||||||||
| Deferred revenue |
(65 | ) | (2,234 | ) | (350 | ) | (43 | ) | (2,269 | ) | ||||||||||
| Amounts payable to property owners |
— | (4,187 | ) | (194 | ) | (473 | ) | — | ||||||||||||
| Other |
17 | (365 | ) | 228 | (123 | ) | (315 | ) | ||||||||||||
|
|
|
|
|
|
|
|
|
|
|
|||||||||||
| Total tangible assets (liabilities) acquired |
(23 | ) | (1,844 | ) | 79 | (576 | ) | 636 | ||||||||||||
| Deferred tax liabilities |
(1,653 | ) | (5,313 | ) | (228 | ) | (513 | ) | (3,193 | ) | ||||||||||
| Trade name |
1,177 | 5,224 | 161 | 607 | 1,060 | |||||||||||||||
| Developed technology |
3,760 | 1,735 | 64 | 2,937 | 2,144 | |||||||||||||||
| Customer relationships |
1,643 | 18,288 | 446 | 1,123 | 7,440 | |||||||||||||||
| Goodwill |
11,647 | 177,777 | 3,514 | 16,833 | 11,190 | |||||||||||||||
| Non-competition agreements |
240 | 1,387 | 300 | 150 | — | |||||||||||||||
| Redeemable noncontrolling interests |
— | — | (1,938 | ) | (9,028 | ) | — | |||||||||||||
|
|
|
|
|
|
|
|
|
|
|
|||||||||||
| Aggregate purchase price |
16,791 | 197,254 | 2,398 | 11,533 | 19,277 | |||||||||||||||
| Less: cash acquired |
(25 | ) | (4,942 | ) | (395 | ) | (63 | ) | (3,220 | ) | ||||||||||
|
|
|
|
|
|
|
|
|
|
|
|||||||||||
| $ | 16,766 | $ | 192,312 | $ | 2,003 | $ | 11,470 | $ | 16,057 | |||||||||||
|
|
|
|
|
|
|
|
|
|
|
|||||||||||
F-20
Table of Contents
The following table summarizes the Company’s weighted-average amortization period, in total and by major finite-lived intangible asset class, by acquisition during the years ended December 31, 2014, 2013 and 2012 (in years):
| Glad to Have You |
Stayz | Bookabach | travelmob | Toprural | ||||||||||||||||
| Developed technology |
5.0 | 2.0 | 1.8 | 7.0 | 4.0 | |||||||||||||||
| Customer relationships |
8.0 | 11.0 | 11.0 | 13.0 | 8.0 | |||||||||||||||
| Non-competition agreements |
3.0 | 3.0 | 3.0 | 3.0 | — | |||||||||||||||
| Trade names |
10.0 | 10.0 | 10.0 | 10.0 | 10.0 | |||||||||||||||
|
|
|
|
|
|
|
|
|
|
|
|||||||||||
| Total weighted-average amortization period |
6.5 | 9.8 | 7.8 | 8.7 | 7.4 | |||||||||||||||
Tangible net assets (liabilities) were valued at their respective carrying amounts, which the Company believes approximate their current fair values at the respective acquisition dates due to their short durations.
The valuation of identifiable intangible assets acquired reflects management’s estimates based on, among other factors, use of established valuation methods. The value of the acquired trade names was determined using a relief from royalty method. Developed technology was valued on a combination of the income and market approach. Customer relationships were valued by projecting the estimated cash flow from the Company’s existing customer relationships. Non-competition agreements have been valued based on other arms’ length transactions between the Company and selling shareholders in past acquisitions or based on the present value of estimated future cash flows with and without this asset. Identifiable intangible assets with definite lives are amortized over the period of estimated benefit using the straight-line method and the estimated useful lives of two to thirteen years. The straight-line method of amortization represents the Company’s best estimate of the distribution of the economic value of the identifiable intangible assets. Goodwill represents the excess of the purchase price over the fair value of the net tangible and identifiable intangible assets acquired.
Redeemable noncontrolling interests are measured at fair value, at the date of acquisition, and classified as mezzanine equity due to the contingent redeemable feature. The Company has elected to recognize increases in the redemption value immediately as they occur and adjust the carrying amount of the noncontrolling interests to equal the redemption value at the end of each reporting period, however this adjustment will not reduce the noncontrolling interests below the initial amount recorded. See Note 10 for the reconciliation of the redeemable noncontrolling interests.
Glad to Have You, Inc.
In March 2014, the Company acquired Glad to Have You, Inc. (“Glad To Have You”), a United States company that is the creator of a mobile guest management solution for the vacation rental industry, for cash consideration of approximately $16,791,000. The direct acquisition costs incurred by the Company were not significant to the Company’s operating results, and all such costs were expensed as incurred and included in general and administrative expenses in the consolidated statement of operations.
Of the total consideration paid, $250,000 of the cash consideration was deposited in escrow as security for the benefit of the Company against breaches of representations and warranties, covenants and certain other expressly enumerated matters by the sellers. The escrow funds not used to satisfy such seller obligations will be released to the sellers two business days following the first anniversary date of the acquisition. In addition, $250,000 of the total cash consideration was deposited in escrow as security and pending final net working capital related purchase price adjustments. The net working capital related escrow funds were released in June 2014.
The acquired goodwill primarily represents synergies associated with adding Glad To Have You’s mobile applications to the Company’s marketplace of websites to provide property owners and managers with an additional way to manage and communicate with guests during their stay. Goodwill is not deductible for tax purposes. The acquired trade name has an estimated useful life of 10 years from the date of acquisition, the
F-21
Table of Contents
developed technology has an estimated useful life of 5 years from the date of acquisition and the customer relationships have an estimated useful life of 8 years from the date of acquisition. Non-compete agreements have an estimated useful life of 3 years. The total weighted average amortization period for the intangibles acquired is 6.5 years.
The results of Glad To Have You have been included in the Company’s consolidated results since the acquisition date in March 2014. Pro forma results of operations related to this acquisition have not been presented because Glad To Have You’s operating results up to and subsequent to the date of acquisition were not material to the Company’s consolidated financial statements.
Stayz
In December 2013, the Company acquired 100% of the outstanding stock of Stayz Pty Limited (“Stayz”), the leading online vacation rental marketplace in Australia, for total consideration of approximately $197,820,000. Consideration included $196,739,000 in cash paid directly to the sellers and $1,081,000 paid to the sellers in April 2014 based on completed working capital purchase price adjustments pursuant to the purchase agreement. The Company incurred approximately $3,802,000 in direct acquisition costs, all of which were expensed as incurred, and are included in general and administrative expenses in the consolidated statement of operations. The Company also entered into certain transitional service agreements with the prior owners of Stayz to have accounting, infrastructure and support services provided to the Company for a defined period of time in 2014. Amounts paid for these services are recorded as incurred and are included in the Company’s consolidated results as general and administrative expenses.
The acquisition of Stayz adds approximately 40,000 additional Australian-based properties to the HomeAway network and provides HomeAway a strong momentum to its pay-per-booking product offering.
The acquired goodwill primarily represents synergies associated with adding Stayz to the Company’s marketplace of websites to provide travelers with a broader inventory selection of vacation properties. Goodwill is not deductible for tax purposes.
The results of Stayz have been included in the Company’s consolidated results since the acquisition date in December 2013.
The following unaudited pro forma supplemental information presents an aggregated summary of the results of operations of the Company for the years ended December 31, 2013 and 2012, assuming the completion of the 2013 acquisition of Stayz occurred on January 1, 2012 (in thousands).
The unaudited pro forma supplemental information is based on estimates and assumptions that the Company believes are reasonable. Accordingly, the Company adjusted the pro forma results for quantifiable items such as direct acquisition costs, amortization of acquired intangible assets and the estimated tax provision of the pro form combined results. Further, during the quarter ended March 31, 2014 the Company revised the pro forma revenue and net income for the year ended December 31, 2013 by a decrease of $1.9 million and $1.3 million, respectively, based on adjustments of certain estimates, as the Company obtained additional information about the facts and circumstances that existed as of the acquisition date. The average foreign exchange rate during each of the presented years was used in preparing the supplemental information. The unaudited pro forma supplemental information prepared by the Company is not necessarily indicative of the results expected in future periods or the results that actually would have been realized had the acquired business and the Company been a combined company during the specified periods.
| Year Ended December 31, | ||||||||
| 2013 | 2012 | |||||||
| Pro forma total revenue |
$ | 370,620 | $ | 305,904 | ||||
| Pro forma net income |
28,687 | 17,855 | ||||||
F-22
Table of Contents
Bookabach
In November 2013, the Company acquired 55% of the outstanding stock of Bookabach Limited (“Bookabach”), a leading vacation rental website in New Zealand, for cash consideration of approximately $2,398,000. The Company incurred approximately $160,000 in direct acquisition costs, all of which were expensed as incurred, and are included in general and administrative expenses in the consolidated statement of operations.
Approximately $492,000 of the cash consideration was deposited in escrow as security for the benefit of the Company against breaches of representations and warranties, covenants and certain other expressly enumerated matters by the sellers. The escrow funds not used to satisfy such seller obligations will be released to the sellers on the second anniversary date of the acquisition.
Bookabach features more than 8,000 property listings located in New Zealand, Australia and the Pacific Islands including holiday homes and beach houses, also known as baches.
The acquired goodwill primarily represents synergies associated with adding Bookabach to the Company’s marketplace of websites to provide travelers with a broader inventory selection of vacation properties. Goodwill is not deductible for tax purposes.
The results of Bookabach have been included in the Company’s consolidated results since the acquisition date in November 2013. Pro forma results of operations related to this acquisition have not been presented since Bookabach’s operating results up to the date of acquisition were not material to the Company’s consolidated financial statements.
Under the terms of the acquisition agreement, the Company has a call option to purchase the remaining non-controlling interest of Bookabach in two installments on October 31, 2014 and June 30, 2015, respectively. In the event that the Company does not exercise one or both of its call options to purchase the remaining shares of Bookabach by such deadlines, the remaining Bookabach shareholders have two put options to require the Company to repurchase their remaining interest in two installments for which, if exercised, shall be deemed to occur on October 31, 2014 and June 30, 2015, respectively. The option was determined to have no value.
In accordance with the acquisition agreement, the remaining Bookabach shareholders exercised their first put option, effective October 2014, requiring the Company to purchase 20% of the outstanding equity held by noncontrolling shareholders for cash consideration of $1,461,000. Following this repurchase, the Company owns 75% of the outstanding stock of Bookabach.
In November 2014, the Company and the remaining Bookabach shareholders amended the acquisition agreement to extend the date of the second call option by the Company and the corresponding second put option by the remaining Bookabach shareholders from June 30, 2015 to June 30, 2016. Additionally, the formula for calculating the value of the second call and put option was amended to reflect the extension of time provided to the second option. The Company recorded the impact of the amendment as an increase in the noncontrolling interest value on the Company’s consolidated balance sheet.
travelmob
In August 2013, the Company acquired 100% of the outstanding stock of travelmob Pte. Ltd. (“travelmob”) for $20.0 million, net of cash acquired and concurrently sold a non-controlling interest in travelmob back to certain sellers for $8.5 million. The Company incurred approximately $284,000 in direct acquisition costs, all of which were expensed as incurred, and are included in general and administrative expenses in the consolidated statement of operations.
Travelmob features over 14,000 Asia Pacific region short-term rental listings including luxury villas, urban apartments, houseboats, a private island as well as shared spaces.
F-23
Table of Contents
The acquired goodwill represents synergies associated with adding travelmob to the Company’s marketplace of websites to provide travelers with a broader inventory selection of vacation properties to choose from and provides the Company with a platform to serve the Asian market. Goodwill is not deductible for tax purposes.
The results of travelmob have been included in the Company’s consolidated results since the acquisition date in August 2013. Pro forma results of operations related to this acquisition have not been presented since travelmob’s operating results up to the date of acquisition were not material to the Company’s consolidated financial statements.
Under the terms of the acquisition agreement and subsequent amendments, the Company also concurrently made a $7.0 million cash investment in the business resulting in the Company holding 68.5% of the outstanding stock and the non-controlling interest holding 31.5%, will loan travelmob up to S$13.0 million (approximately $9.6 million using exchange rates as of December 31, 2014) over the next few years and has a call option to purchase the remaining non-controlling interest of travelmob for the period defined in the agreement beginning on December 31, 2016. In the event the Company does not exercise its call option to purchase the remaining shares of travelmob by such deadline, the remaining travelmob shareholders have a put option to require the Company to repurchase their remaining interest for the period defined in the agreement beginning on February 1, 2017. The option was determined to have no value. In addition, certain other shares were reserved as part of an Employee Stock Options Plan (“ESOP”) in travelmob. Upon acquisition, the vested shares were measured at fair value and the amount attributable to the pre-combination service was included in the fair value of the noncontrolling interests.
Toprural
In April 2012, the Company acquired 100% of the outstanding stock of Top Rural S.L., the leading site for independently-owned rural accommodations in Southern Europe (the acquired business is referred to as “Toprural”), for cash consideration of approximately $19,277,000. The acquisition of Toprural further solidifies the Company’s market presence in Spain and Southern Europe and extends the Company’s reach to a desirable European traveler segment that seeks long weekend holidays to small towns or countryside destinations. The Company incurred approximately $285,000 in direct acquisition costs, all of which were expensed as incurred, and are included in general and administrative expenses in the consolidated statement of operations.
Approximately $2,670,000 of the cash consideration was deposited in escrow as security for the benefit of the Company against breaches of representations and warranties, covenants and certain other expressly enumerated matters by the sellers. The escrow funds were released to the sellers in two equal payments on the first and second anniversary dates of the acquisition.
The acquired goodwill primarily represents synergies associated with adding Toprural to the Company’s marketplace of websites to provide travelers with a broader inventory selection of vacation properties. Goodwill is not deductible for tax purposes.
The results of Toprural have been included in the Company’s consolidated results since the acquisition date in April 2012.
The following unaudited pro forma supplemental information presents an aggregated summary of the results of operations of the Company for the year ended December 31, 2012, assuming the completion of the 2012 acquisition of Toprural occurred on January 1, 2011.
The unaudited pro forma supplemental information is based on estimates and assumptions that the Company believes are reasonable. The average foreign exchange rate during the year was used in preparing the supplemental information. The unaudited pro forma supplemental information prepared by the Company is not
F-24
Table of Contents
necessarily indicative of the results expected in future periods or the results that actually would have been realized had the acquired business and the Company been a combined company during the specified periods.
| Year Ended December 31, |
||||
| 2012 | ||||
| Pro forma total revenue |
$ | 281,858 | ||
| Pro forma net income |
14,959 | |||
4. Goodwill and Other Intangible Assets
Goodwill
Changes in the Company’s goodwill balance for the years ended December 31, 2014 and 2013 are summarized in the table below (in thousands).
| Balance at December 31, 2012 |
$ | 312,412 | ||
| Acquired in business combinations |
198,124 | |||
| Foreign currency translation adjustment |
(2,925 | ) | ||
|
|
|
|||
| Balance at December 31, 2013 |
$ | 507,611 | ||
| Acquired in business combinations |
11,647 | |||
| Foreign currency translation adjustment |
(26,098 | ) | ||
| Post-acquisition goodwill adjustment for the Stayz acquisition |
511 | |||
|
|
|
|||
| Balance at December 31, 2014 |
$ | 493,671 | ||
|
|
|
Pursuant to its goodwill and intangible assets accounting policy, the Company records goodwill adjustments for the effect on goodwill of changes to net assets and liabilities acquired during the measurement period (up to one year from the date of an acquisition). The goodwill arising from the Stayz acquisition was increased by $511,000 up to $178,288,000 due to certain income taxes and changes in fair value estimates derived from additional information gained during the measurement period. Goodwill adjustments were not significant to the Company’s previously reported operating results or financial position. Therefore, the Company elected not to retrospectively adjust the acquisition date accounting and instead recorded the adjustment in the year ended December 31, 2014.
Intangible Assets
The Company’s intangible assets, excluding goodwill, consist of intangible assets acquired primarily in business combinations and were recorded at their estimated fair values on the date of acquisition. The finite-lived intangible assets that are being amortized are summarized in the table below (in thousands):
| December 31, 2014 | December 31, 2013 | |||||||||||||||||||||||||||
| Useful Life (Years) |
Gross Carrying Amount |
Accumulated Amortization |
Net Carrying Amount |
Gross Carrying Amount |
Accumulated Amortization |
Net Carrying Amount |
||||||||||||||||||||||
| Trade names and trademarks |
10 | $ | 30,316 | $ | (8,396 | ) | $ | 21,920 | $ | 30,066 | $ | (5,050 | ) | $ | 25,016 | |||||||||||||
| Developed technology |
2-8 | 21,293 | (13,231 | ) | 8,062 | 31,513 | (23,646 | ) | 7,867 | |||||||||||||||||||
| Customer relationships |
6-14 | 57,656 | (25,512 | ) | 32,144 | 80,510 | (41,739 | ) | 38,771 | |||||||||||||||||||
| Noncompete agreements and domain names |
2-5 | 2,224 | (923 | ) | 1,301 | 5,163 | (3,181 | ) | 1,982 | |||||||||||||||||||
|
|
|
|
|
|
|
|
|
|
|
|
|
|||||||||||||||||
| Total |
$ | 111,489 | $ | (48,062 | ) | $ | 63,427 | $ | 147,252 | $ | (73,616 | ) | $ | 73,636 | ||||||||||||||
|
|
|
|
|
|
|
|
|
|
|
|
|
|||||||||||||||||
F-25
Table of Contents
Amortization of noncompete agreements is recorded over the term of the agreements.
The following table summarizes the amortization expense that the Company recorded for the years ended December 31, 2014, 2013 and 2012 (in thousands):
| Year Ended December 31, | ||||||||||||
| 2014 | 2013 | 2012 | ||||||||||
| Amortization expense |
$ | 13,916 | $ | 11,668 | $ | 12,438 | ||||||
Expected future annual amortization expense for definite-lived intangible assets as of December 31, 2014 is as follows (in thousands):
| 2015 |
$ | 11,772 | ||
| 2016 |
9,132 | |||
| 2017 |
8,042 | |||
| 2018 |
7,738 | |||
| 2019 |
7,057 | |||
| Thereafter |
19,686 | |||
|
|
|
|||
| $ | 63,427 | |||
|
|
|
The Company has the following indefinite-lived intangible assets recorded in its consolidated balance sheets as of December 31, 2014 and 2013, respectively (in thousands):
| December 31, | ||||||||
| 2014 | 2013 | |||||||
| Trademarks, trade names and other |
$ | 7,029 | $ | 7,029 | ||||
5. Property and Equipment, net
Property and equipment consists of the following at December 31, 2014 and 2013, respectively, (in thousands):
| December 31, | ||||||||
| 2014 | 2013 | |||||||
| Computer equipment and purchased software |
$ | 31,566 | $ | 24,074 | ||||
| Internal-use software and website development costs |
36,038 | 30,523 | ||||||
| Furniture and fixtures |
7,915 | 5,999 | ||||||
| Leasehold improvements |
20,922 | 13,999 | ||||||
|
|
|
|
|
|||||
| 96,441 | 74,595 | |||||||
| Less accumulated depreciation |
(40,268 | ) | (34,788 | ) | ||||
|
|
|
|
|
|||||
| $ | 56,173 | $ | 39,807 | |||||
|
|
|
|
|
|||||
The following table summarizes the depreciation expense that the Company recorded for the years ended December 31, 2014, 2013 and 2012 (in thousands):
| Year Ended December 31, | ||||||||||||
| 2014 | 2013 | 2012 | ||||||||||
| Depreciation expense |
$ | 16,926 | $ | 13,399 | $ | 11,051 | ||||||
F-26
Table of Contents
6. Accrued Expenses
The Company’s accrued expenses are comprised of the following at December 31, 2014 and 2013, respectively (in thousands):
| December 31, | ||||||||
| 2014 | 2013 | |||||||
| Compensation and related benefits |
$ | 21,413 | $ | 21,700 | ||||
| Gift cards |
5,654 | 6,090 | ||||||
| Contracting, consulting and professional fees |
3,254 | 4,494 | ||||||
| Taxes |
4,954 | 3,425 | ||||||
| Marketing |
4,115 | 3,197 | ||||||
| Foreign exchange – forward contracts |
99 | 979 | ||||||
| Traveler guarantee liability |
1,790 | 956 | ||||||
| Other |
8,976 | 13,784 | ||||||
|
|
|
|
|
|||||
| Total |
$ | 50,255 | $ | 54,625 | ||||
|
|
|
|
|
|||||
7. Convertible Senior Notes
Convertible Senior Notes
| (In thousands) |
Par Value | Equity Component Recorded at Issuance |
Carrying Value of Convertible Senior Notes as of |
|||||||||||||
| December 31, 2014 |
December 31, 2013 |
|||||||||||||||
| 0.125% Convertible Senior Notes due April 1, 2019 |
$ | 402,500 | $ | 90,887 | (1) | $ | 316,181 | $ | — | |||||||
| (1) | This amount represents the equity component recorded at the initial issuance of the 0.125% convertible senior notes. |
In March 2014, the Company issued at par value $402.5 million of 0.125% convertible senior notes (the “Notes”) due April 1, 2019, unless earlier purchased by the Company or converted. Interest is payable semi-annually, in arrears on April 1 and October 1 of each year commencing October 1, 2014.
The Notes are governed by an indenture between the Company, as issuer, and U.S. Bank National Association, as trustee. The Notes are unsecured and do not contain any financial covenants or any restrictions on the payment of dividends, the incurrence of senior debt or other indebtedness, or the issuance or repurchase of securities by the Company.
If converted, holders will receive cash and/or shares of the Company’s common stock, at the Company’s election. The Company’s intent is to settle the principal amount of the Notes in cash upon conversion. As a result, upon conversion of the Notes, only the amounts payable in excess of the principal amounts of the Notes are considered in diluted earnings per share under the treasury stock method.
| Conversion Rate per $1,000 Par Value |
Initial Conversion Price per Share |
Free Convertibility Date |
||||||||||
| 0.125% Senior Notes |
19.1703 | $ | 52.16 | October 1, 2018 | ||||||||
Throughout the term of the Notes, the conversion rate may be adjusted upon the occurrence of certain events as described in the indenture governing the Notes. Holders of the Notes will not receive any cash payment
F-27
Table of Contents
representing accrued and unpaid interest upon conversion of a Note. Accrued but unpaid interest will be deemed to be paid in full upon conversion rather than cancelled, extinguished or forfeited. Holders may convert their Notes under the following circumstances:
| • | during any calendar quarter commencing after June 30, 2014, if, for at least 20 trading days during the 30 consecutive trading day period ending on the last trading day of the immediately preceding calendar quarter, the last reported sales price of the Company’s common stock for such trading day is greater than or equal to 130% of the applicable conversion price for the Notes on each applicable trading day; |
| • | during the five business day period after any five consecutive trading day period in which the trading price per $1,000 principal amount of the Notes is less than 98% of the product of the sale price of the Company’s common stock and the conversion rate; |
| • | upon the occurrence of specified corporate transactions described under the indenture governing the Notes, such as a consolidation, merger or binding share exchange; or |
| • | at any time on or after October 1, 2018. |
As of December 31, 2014, the Notes are not yet convertible.
Holders of the Notes have the right to require the Company to purchase with cash all or a portion of the Notes upon the occurrence of a fundamental change, such as a change of control, at a purchase price equal to 100% of the principal amount of the Notes plus accrued and unpaid interest. Following certain corporate transactions that constitute a fundamental change, the Company will increase the conversion rate for a holder who elects to convert the Notes in connection with such make-whole fundamental change.
In accounting for the issuance of the Notes, the Company separated the Notes into liability and equity components. The carrying amount of the liability component was calculated by measuring the fair value of a similar liability that does not have an associated convertible feature. The carrying amount of the equity component representing the conversion option was determined by deducting the fair value of the liability component from the par value of the Notes as a whole. The excess of the principal amount of the liability component over its carrying amount (“debt discount”) is amortized to interest expense over the term of the Notes. The equity component is not re-measured as long as it continues to meet the conditions for equity classification.
In accounting for the transaction costs related to the Note issuance, the Company allocated the total amount incurred to the liability and equity components based on their relative values. Transaction costs attributable to the liability component are being amortized to expense over the term of the Notes, and transaction costs attributable to the equity component were netted with the equity component in stockholders’ equity. Additionally, the Company recorded a deferred tax liability of $0.8 million in connection with the Notes.
The Notes consist of the following (in thousands):
| December 31, 2014 |
December 31, 2013 |
|||||||
| Liability component: |
||||||||
| Principal: |
||||||||
| 0.125% Senior Notes |
$ | 402,500 | $ | — | ||||
| Less: debt discount, net |
||||||||
| 0.125% Senior Notes |
(86,319 | ) | — | |||||
|
|
|
|
|
|||||
| Net carrying amount |
$ | 316,181 | $ | — | ||||
|
|
|
|
|
|||||
The Notes are included in the consolidated balance sheets within Convertible senior notes, net, which are classified as a noncurrent liability. The debt discount is amortized over the life of the Notes using the effective interest rate method.
F-28
Table of Contents
The total estimated fair value of the Company’s Notes at December 31, 2014 was $304.3 million. The fair value of the Notes was determined based on inputs that are observable in the market (Level 2).
Based on the closing price of the Company’s common stock of $29.78 on December 31, 2014, the if-converted value of the Notes was less than their principal amount.
Note Hedges
To minimize the impact of potential economic dilution upon conversion of the Notes, the Company entered into convertible note hedge transactions with respect to its common stock (the “Note Hedges”).
| Date | Purchase (in thousands) |
Shares underlying Note Hedges |
||||||||||
| Note Hedges |
March 2014 | $ | 85,853 | 7,716,049 | ||||||||
The Note Hedges cover shares of the Company’s common stock at a strike price that corresponds to the initial conversion price of the respective Notes, also subject to adjustment, and are exercisable upon conversion of the Notes. The Note Hedges will expire upon the maturity of the Notes. The Note Hedges are intended to reduce the potential economic dilution upon conversion of the Notes in the event that the market value per share of the Company’s common stock, as measured under the Notes, at the time of exercise is greater than the conversion price of the Notes. The Note Hedges are separate transactions and are not part of the terms of the Notes. Holders of the Notes will not have any rights with respect to the Note Hedges.
Warrants
| Date | Proceeds (in thousands) |
Shares | Strike Price |
|||||||||||||
| Warrants |
March 2014 | $ | 38,278 | 7,716,049 | $ | 81.14 | ||||||||||
Separately, in March 2014, the Company also entered into warrant transactions (the “Warrants”), whereby the Company sold warrants to acquire, subject to anti-dilution adjustments, shares of the Company’s common stock at $81.14 per share. The Warrants have a term of five years from the date of issuance. If the average market value per share of the Company’s common stock for the reporting period, as measured under the Warrants, exceeds the strike price of the Warrants, the Warrants would have a dilutive effect on the Company’s earnings per share if the Company reports net income. The Warrants were anti-dilutive for the year ended December 31, 2014. The Warrants are separate transactions, entered into by the Company and are not part of the terms of the Notes or Note Hedges. Holders of the Notes will not have any rights with respect to the Warrants.
Interest Expense
The following table sets forth total interest expense recognized related to the Notes for the years ended December 31, 2014, 2013 and 2012 (in thousands):
| Year Ended December 31, | ||||||||||||
| 2014 | 2013 | 2012 | ||||||||||
| 0.125% coupon |
$ | 378 | — | — | ||||||||
| Amortization of debt issuance costs |
39 | — | — | |||||||||
| Amortization of debt discount |
13,137 | — | — | |||||||||
|
|
|
|
|
|
|
|||||||
| Total |
$ | 13,554 | $ | — | $ | — | ||||||
|
|
|
|
|
|
|
|||||||
F-29
Table of Contents
8. Commitments and Contingencies
Leases
The Company leases its facilities and certain office equipment under noncancellable operating leases. Future minimum lease payments under noncancellable operating leases at December 31, 2014 are as follows (in thousands):
| 2015 |
$ | 8,073 | ||
| 2016 |
8,487 | |||
| 2017 |
8,324 | |||
| 2018 |
7,486 | |||
| 2019 |
6,601 | |||
| Thereafter |
21,870 | |||
|
|
|
|||
| Total minimum lease payments |
$ | 60,841 | ||
|
|
|
The following table summarizes the total rental expense that the Company recorded for the years ended December 31, 2014, 2013 and 2012 (in thousands):
| Year Ended December 31, | ||||||||||||
| 2014 | 2013 | 2012 | ||||||||||
| Rental expense |
$ | 6,994 | $ | 5,202 | $ | 4,492 | ||||||
Guarantees
The Company offers two guarantee products to travelers: Basic Rental Guarantee and Carefree Rental Guarantee. The Basic Rental Guarantee is offered to travelers that book a vacation rental property listed on any one of the Company’s websites to protect their vacation rental payments up to $1,000 against Internet fraud. Travelers may also purchase additional protection to cover 100% of vacation rental payments up to $10,000 against Internet fraud, misrepresentation, wrongful denial of entry, wrongful deposit loss or losses from phishing claims by the purchase of the Carefree Rental Guarantee. The Company does not maintain insurance from any third party for claims under these guarantees, and any amounts payable for claims made under these guarantees are payable by the Company. Amounts recorded for estimated future claims under the guarantees are based on historical experience and estimates of potential future claims are recorded either in cost of revenue or in general and administrative expense in the Company’s consolidated statement of operations depending on whether the expense is related to estimated claims under the Basic Rental Guarantee or to the Carefree Rental Guarantee.
Expected future claims for traveler guarantees, which are presented as a current liability in the Company’s consolidated balance sheets, and changes for the guarantees are as follows (in thousands):
| Traveler guarantee liability at December 31, 2012 |
$ | 566 | ||
| Costs accrued for new vacation rentals |
2,230 | |||
| Guarantee obligations honored |
(1,840 | ) | ||
|
|
|
|||
| Traveler guarantee liability at December 31, 2013 |
$ | 956 | ||
| Costs accrued for new vacation rentals |
3,576 | |||
| Guarantee obligations honored |
(2,742 | ) | ||
|
|
|
|||
| Traveler guarantee liability at December 31, 2014 |
$ | 1,790 | ||
|
|
|
The Company maintains a guarantee of £5,000,000 (approximately $7,800,000 as of December 31, 2014) in favor of a bank in the United Kingdom for extending credit to the Company in connection with the wholly owned United Kingdom subsidiary’s business of collecting its subscription revenue in advance via credit card payments.
F-30
Table of Contents
Legal
From time to time, the Company is involved in litigation relating to claims arising in the ordinary course of business. The Company assesses its potential liability by analyzing specific litigation and regulatory matters using available information. Views on estimated losses are developed by management in consultation with inside and outside counsel, which involves a subjective analysis of potential results and outcomes, assuming various combinations of appropriate litigation and settlement strategies. After taking all of the above factors into account, the Company determines whether an estimated loss from a contingency related to litigation should be accrued by assessing whether a loss is deemed probable and can be reasonably estimated. The Company further determines whether an estimated loss from a contingency related to litigation should be disclosed by assessing whether a material loss is deemed reasonably possible. Such disclosures will include an estimate of the additional loss or range of loss or will state that such an estimate cannot be made.
Management believes that there are no claims or actions pending or threatened against the Company, the ultimate disposition of which would have a material impact on the Company’s consolidated financial position, results of operations or cash flows.
9. Stockholders’ Equity and Stock-Based Compensation
Common Stock
The Company’s amended and restated certificate of incorporation, as amended in July 2011, authorizes 350,000,000 shares of common stock with a par value of $0.0001 per share. At December 31, 2014 and December 31, 2013, there were 94,515,344 and 92,361,069 shares of common stock issued and outstanding, respectively. Additionally, the amended certificate of incorporation authorizes the Company’s board of directors, without action by stockholders, to designate and issue up to 10,000,000 shares of preferred stock in one or more series. The board of directors may also designate the rights, preferences and privileges of each series of preferred stock, any or all of which may be greater than the rights of the common stock.
Follow-on Offering
On December 17, 2013, the Company closed a follow-on offering of 6,921,424 shares of its common stock, at $37.00 per share, before underwriting discounts and commissions. The Company sold 5,500,000 shares and existing stockholders sold an aggregate of 1,421,424 shares, including 902,794 shares as a result of the underwriters’ exercise of their over-allotment option to purchase additional shares. The offering generated net proceeds to the Company of approximately $195.3 million, after deducting underwriting discounts and other expenses incurred by the Company for the sale of common stock. The offer and sale of all of the shares in the offering were registered under the Securities Act pursuant to a registration statement on Form S-3 ASR, which became automatically effective on December 12, 2013. The Company did not receive any proceeds from the sale of shares by the selling stockholders.
Stock Compensation Plans
The Company maintains two stock-based compensation plans, the 2004 Stock Option Plan (the “2004 Plan”) and the 2011 Equity Incentive Plan (the “2011 Plan”), which are described below.
2004 Plan
At December 31, 2014, there were 3,475,715 options outstanding under the 2004 Plan. Following the effectiveness of the Company’s 2011 Plan in May 2011, no further awards have been made under the 2004 Plan, although each option previously granted under the 2004 Plan will remain outstanding subject to its terms. Any such shares of common stock that are subject to awards under the 2004 Plan which are forfeited or lapse unexercised and would otherwise have been returned to the share reserve under the 2004 Plan instead will be available for issuance under the 2011 Plan.
F-31
Table of Contents
2011 Plan
In May 2011, the Company adopted the 2011 Plan, providing for the granting of incentive stock options, as defined by the Internal Revenue Code, to employees and for the grant of non-statutory stock options, stock appreciation rights, restricted stock, restricted stock units, performance units and performance shares to employees, directors and consultants. The 2011 Plan also provides for the automatic grant of option awards to our non-employee directors. Shares of common stock reserved for issuance under the 2011 Plan consist of 20,932,095 shares of common stock. In addition, the number of shares available for issuance under the 2011 Plan will be increased annually on the first day of the Company’s fiscal year by an amount equal to the least of (a) four percent of the outstanding shares of the Company’s common stock as of the last day of the Company’s immediately preceding fiscal year or (b) such other amount as the Company’s board of directors may determine. At December 31, 2014, there were 4,124,581 options and 2,854,955 restricted stock units outstanding under the 2011 Plan.
Stock Option Activity
A summary of the Company’s stock option activity under all Plans is as follows:
| Number of Options Outstanding |
Weighted Average Exercise Price |
Weighted Average Remaining Contractual Term |
Aggregate Intrinsic Value |
|||||||||||||
| (years) | (in thousands) | |||||||||||||||
| Outstanding at December 31, 2012 |
10,404,703 | $ | 17.37 | 7.5 | $ | 57,020 | ||||||||||
| Granted |
1,756,630 | 30.18 | ||||||||||||||
| Exercised |
(3,186,491 | ) | 15.12 | |||||||||||||
| Forfeited |
(474,695 | ) | 22.87 | |||||||||||||
| Cancelled |
(20,885 | ) | 23.03 | |||||||||||||
|
|
|
|
|
|
|
|
|
|||||||||
| Outstanding at December 31, 2013 |
8,479,261 | $ | 20.49 | 7.1 | $ | 172,921 | ||||||||||
|
|
|
|
|
|
|
|
|
|||||||||
| Granted |
972,865 | 35.50 | ||||||||||||||
| Exercised |
(1,615,116 | ) | 15.84 | |||||||||||||
| Forfeited |
(236,714 | ) | 26.66 | |||||||||||||
| Cancelled |
— | — | ||||||||||||||
|
|
|
|
|
|
|
|
|
|||||||||
| Outstanding at December 31, 2014 |
7,600,296 | $ | 23.20 | 6.8 | $ | 57,663 | ||||||||||
|
|
|
|
|
|
|
|
|
|||||||||
| Vested and expected to vest |
||||||||||||||||
| At December 31, 2013 |
8,226,494 | $ | 20.31 | 7.1 | $ | 169,248 | ||||||||||
| At December 31, 2014 |
7,433,326 | $ | 23.02 | 6.8 | $ | 57,447 | ||||||||||
| Exercisable options |
||||||||||||||||
| At December 31, 2013 |
4,583,432 | $ | 16.82 | 6.2 | $ | 110,286 | ||||||||||
| At December 31, 2014 |
5,079,091 | $ | 20.06 | 6.1 | $ | 51,494 | ||||||||||
The Company issues shares from the 2004 Plan and the 2011 Plan reserves upon the exercise of stock options. Shares of common stock reserved and available for future stock option grants under the 2011 Plan were 13,952,559 shares at December 31, 2014.
The Company received $25,386,000 and $48,473,000 in cash from option exercises under the respective Plans in 2014 and 2013, respectively. The Company issued shares from amounts reserved under the respective Plans upon the exercise of these stock options. The Company does not currently expect to repurchase shares from any source to satisfy such obligation under any of the Company’s stock option Plans. The Company recognized a tax benefit of approximately $2,743,000, $8,226,000 and $7,122,000 from the exercise of stock options during the years ended December 31, 2014, 2013 and 2012, respectively. These tax benefits have been recorded in additional paid-in capital on the Company’s consolidated balance sheet as of December 31, 2014 and 2013.
F-32
Table of Contents
The weighted average grant date fair value of the options and restricted stock are summarized as follows:
| Year Ended December 31, | ||||||||||||
| 2014 | 2013 | 2012 | ||||||||||
| Per share of options granted |
$ | 13.46 | $ | 13.81 | $ | 12.07 | ||||||
| Per share of restricted stock and restricted stock units granted |
$ | 36.33 | $ | 29.36 | $ | 24.88 | ||||||
The aggregate intrinsic value of stock options exercised, represented in the stock option activity table above, was approximately $39,140,000, $52,949,000 and $40,394,000 during the years ended December 31, 2014, 2013 and 2012, respectively.
During 2014, 1,649,456 stock options vested with a weighted average grant date fair market value of $12.05 per share.
Restricted Stock Activity
A summary of the Company’s restricted stock activity under the 2004 Plan and 2011 Plan is as follows:
| Number of Awards Outstanding |
||||
| Unvested balances at December 31, 2012 |
806,317 | |||
| Awards granted |
1,658,132 | |||
| Awards vested |
(241,517 | ) | ||
| Awards forfeited |
(185,037 | ) | ||
|
|
|
|||
| Unvested balances at December 31, 2013 |
2,037,895 | |||
| Awards granted |
1,634,392 | |||
| Awards vested |
(565,733 | ) | ||
| Awards forfeited |
(251,599 | ) | ||
|
|
|
|||
| Unvested balances at December 31, 2014 |
2,854,955 | |||
|
|
|
|||
During 2014, 565,733 restricted stock awards and units vested with a weighted average grant date fair market value of $27.46 per share.
Accounting for Stock-Based Compensation
The Company uses the Black-Scholes option pricing model in valuing its stock options. The Black-Scholes model requires estimates regarding risk-free rate of return, dividend yields, expected term of the award, volatility and estimated forfeitures of awards during the service period.
The risk-free interest rate assumption used by the Company is based on observed market interest rates appropriate for the term of the Company’s employee options. During the years ended December 31, 2014, 2013 and 2012, the Company estimated expected term based on historical experience of similar awards, giving consideration to the contractual terms of the stock-based awards, vesting schedules and expectations of future employee behavior. The dividend yield assumption is based on historical and expected dividend payouts. The Company determined expected volatility of options granted using an average of the historical volatility measures of comparable companies from a representative industry peer group.
The Company uses historical data to estimate pre-vesting option forfeitures and records stock-based compensation expense only for those awards that are expected to vest. Changes in estimated forfeitures will be recognized through a cumulative catch-up adjustment in the period of change and will also impact the amount of
F-33
Table of Contents
stock-based compensation expense to be recognized in future periods. For options granted, the Company amortizes the fair value on a straight-line basis over the vesting period of the options.
The fair value of stock option grants has been estimated at the date of grant using the Black–Scholes option pricing model with the following weighted average assumptions:
| Year Ended December 31, | ||||||
| 2014 | 2013 | 2012 | ||||
| Risk-free interest rate |
1.62% to 1.78% | 0.65% to 1.41% | 0.78% to 1.32% | |||
| Expected term |
4.93 to 5.10 years | 5.32 to 5.57 years | 5.59 to 5.83 years | |||
| Dividend yield |
0.00% | 0.00% | 0.00% | |||
| Expected volatility |
38.70% to 42.50% | 46.90% to 50.80% | 50.60% to 55.40% | |||
The following table summarizes the total stock-based compensation expense for the years ended December 31, 2014, 2013 and 2012 (in thousands):
| Year Ended December 31, | ||||||||||||
| 2014 | 2013 | 2012 | ||||||||||
| Cost of revenue |
$ | 3,245 | $ | 3,064 | $ | 2,675 | ||||||
| Product development |
13,174 | 9,515 | 5,642 | |||||||||
| Sales and marketing |
10,805 | 8,488 | 6,629 | |||||||||
| General and administrative |
21,294 | 16,820 | 12,087 | |||||||||
|
|
|
|
|
|
|
|||||||
| $ | 48,518 | $ | 37,887 | $ | 27,033 | |||||||
|
|
|
|
|
|
|
|||||||
Total gross unrecognized compensation cost related to nonvested stock options and restricted stock was $95,989,000 and $84,248,000 as of December 31, 2014 and 2013, respectively. The Company expects to recognize the costs as of December 31, 2014 over a weighted average period of 2.36 years.
10. Redeemable Noncontrolling Interests
During the year ended December 31, 2013, the Company acquired 68.5% of the outstanding stock of travelmob Pte. Ltd. and 55% of the outstanding stock of Bookabach Limited. During the year ended December 31, 2014, the Company acquired 20% of the outstanding equity held by the remaining shareholders of Bookabach Limited. The redeemable noncontrolling interests are reported on the Consolidated Balance Sheets in mezzanine equity in “Redeemable noncontrolling interests.”
The Company recognizes changes to the redemption value of noncontrolling interests as they occur and adjusts the carrying value to equal the redemption value at the end of each reporting period accordingly.
Changes in the Company’s redeemable noncontrolling interests for the year ended December 31, 2014 and 2013 are as follows (in thousands):
| Balance at December 31, 2012 |
$ | — | ||
| Fair value at acquisition |
10,966 | |||
| Net loss attributable to noncontrolling interests |
(395 | ) | ||
| Currency translation adjustments |
13 | |||
|
|
|
|||
| Balance at December 31, 2013 |
$ | 10,584 | ||
| Net loss attributable to noncontrolling interests |
(1,839 | ) | ||
| Changes to redemption value of noncontrolling interests |
2,421 | |||
| Repurchase of redeemable noncontrolling interests |
(1,461 | ) | ||
| Currency translation adjustments |
37 | |||
|
|
|
|||
| Balance at December 31, 2014 |
$ | 9,742 | ||
|
|
|
F-34
Table of Contents
11. Accumulated Other Comprehensive Loss
Accumulated other comprehensive loss consists of the following at December 31, 2014 and 2013, respectively (in thousands):
| December 31, | ||||||||
| 2014 | 2013 | |||||||
| Foreign currency translation |
$ | (27,252 | ) | $ | (6,728 | ) | ||
| Unrealized losses on short-term investments |
(801 | ) | (19 | ) | ||||
|
|
|
|
|
|||||
| Total |
$ | (28,053 | ) | $ | (6,747 | ) | ||
|
|
|
|
|
|||||
12. Income Taxes
Income before income taxes includes the following components (in thousands):
| Year Ended December 31, | ||||||||||||
| 2014 | 2013 | 2012 | ||||||||||
| Domestic |
$ | 15,523 | $ | 27,817 | $ | 19,934 | ||||||
| Foreign |
5,716 | 1,198 | 8,202 | |||||||||
|
|
|
|
|
|
|
|||||||
| Total |
$ | 21,239 | $ | 29,015 | $ | 28,136 | ||||||
|
|
|
|
|
|
|
|||||||
The income tax expense (benefit) is comprised of the following (in thousands):
| Year Ended December 31, | ||||||||||||
| 2014 | 2013 | 2012 | ||||||||||
| Current |
||||||||||||
| Federal |
$ | — | $ | — | $ | — | ||||||
| State |
250 | 1,116 | 1,105 | |||||||||
| Foreign |
5,999 | 4,771 | 9,625 | |||||||||
| Deferred |
||||||||||||
| Federal |
5,502 | 7,733 | 7,976 | |||||||||
| State |
(831 | ) | 98 | (524 | ) | |||||||
| Foreign |
(5,879 | ) | (1,511 | ) | (5,425 | ) | ||||||
| Change in valuation allowance |
2,231 | (483 | ) | 418 | ||||||||
|
|
|
|
|
|
|
|||||||
| $ | 7,272 | $ | 11,724 | $ | 13,175 | |||||||
|
|
|
|
|
|
|
|||||||
During the three months ended December 31, 2014, the Company identified immaterial prior period accounting errors related to intercompany transactions and a Swiss foreign tax credit. The adjustments were not material to any prior period results of operations. Therefore, the Company recorded the correction in the same quarter it was identified, which increased income tax expense by approximately $796,000 during the three months ended December 31, 2014. The adjustments had no impact on cash flows from operations or total cash flows for the prior or current period.
F-35
Table of Contents
Deferred income taxes reflect the net effects of temporary differences between the carrying amounts of assets and liabilities for financial reporting purposes and the amounts used for income tax purposes. Deferred tax assets (liabilities) consist of the following (in thousands):
| December 31, | ||||||||
| 2014 | 2013 | |||||||
| Deferred tax assets: |
||||||||
| Net operating loss carryforward |
$ | 6,816 | $ | 6,760 | ||||
| Tax credits |
1,082 | 551 | ||||||
| Accrued liabilities |
8,960 | 6,615 | ||||||
| Stock compensation |
16,621 | 11,143 | ||||||
| Gift card deferred revenue and redemption liability |
1,451 | 1,346 | ||||||
| Other deferred revenue |
1,413 | 1,304 | ||||||
| Other |
959 | 310 | ||||||
|
|
|
|
|
|||||
| Total deferred tax assets |
37,302 | 28,029 | ||||||
| Deferred tax liabilities: |
||||||||
| Intangible assets |
(37,095 | ) | (34,473 | ) | ||||
| Property and equipment |
(12,170 | ) | (6,530 | ) | ||||
| Prepaid expenses |
(540 | ) | (907 | ) | ||||
| Other |
(1,339 | ) | (536 | ) | ||||
|
|
|
|
|
|||||
| Total deferred tax liabilities |
(51,144 | ) | (42,446 | ) | ||||
| Valuation allowance |
(2,463 | ) | (362 | ) | ||||
|
|
|
|
|
|||||
| Net deferred tax liabilities |
$ | (16,305 | ) | $ | (14,779 | ) | ||
|
|
|
|
|
|||||
In August 2013, in a series of transactions, the Company acquired 68.5% of the outstanding stock of travelmob Pte. Ltd. (see Note 3). A net deferred tax liability of approximately $513,000 was recorded upon the acquisition, primarily related to acquired intangibles, net of acquired net operating losses.
In November 2013, the Company acquired 55% of the outstanding stock of Bookabach Limited (see Note 3). A net deferred tax liability of approximately $228,000 was recorded upon the acquisition, primarily related to acquired intangibles. In November 2014, the Company acquired an additional 20% of the outstanding stock of Bookabach Limited.
In December 2013, the Company acquired 100% of the outstanding stock of Stayz Pty Limited (see Note 3). A net deferred tax liability of approximately $5,313,000 was recorded upon the acquisition, primarily related to acquired intangibles. Additionally, as a result of the acquisition, the Company released approximately $1,397,000 of valuation allowance against the net deferred tax assets of the Company’s existing Australian subsidiary based on revised estimates of future taxable income including Stayz.
In March 2014, the Company acquired 100% of the outstanding stock of Glad to Have You, Inc. (see Note 3). A net deferred tax liability of approximately $1,653,000 was recorded upon the acquisition, primarily related to acquired intangibles, net of acquired net operating losses.
A valuation allowance is established if, based on the Company’s review of both positive and negative evidence, it is more likely than not that all or a portion of the deferred tax asset will not be realized. The Company maintained a valuation allowance of approximately $2,463,000 and $362,000 at December 31, 2014 and December 31, 2013, respectively, primarily related to the uncertainty of the utilization of certain loss carryforwards as well as the inability to realize the benefit of basis differences in certain acquired intangible assets. After reviewing both positive and negative evidence, the Company determined that it is not more likely
F-36
Table of Contents
than not that the deferred tax assets of the Company’s subsidiaries in Singapore and Switzerland will be realized and recorded a valuation allowance against these assets of $1,920,000 in the year ended December 31, 2014 compared to $0 in the year ended December 31, 2013. There can be no assurance that the Company will meet its expectations of future taxable income. As a result, the amount of the deferred tax assets considered realizable could be reduced if estimates of future taxable income are reduced. Such an occurrence could materially adversely affect the Company’s results of operations and financial condition. The Company will continue to evaluate the ability to realize, by jurisdiction, its deferred tax assets and related valuation allowances.
The following is a summary of the Company’s loss carryforwards and their expiration at December 31, 2013 and 2014, respectively (in thousands):
| December 31, | ||||||||||
| Expiration | 2014 | 2013 | ||||||||
| Federal loss carryforwards |
2025-2034 | $ | 15,722 | $ | 8,474 | |||||
| State loss carryforwards |
2025-2034 | 396 | 447 | |||||||
| Federal research and development credit carryforwards |
2027-2034 | 8,386 | 6,050 | |||||||
| State research and development credit carryforwards |
2034 | 1,857 | 498 | |||||||
| Texas margin tax credit carryforwards |
Indefinite | 310 | 310 | |||||||
| Foreign loss carryforwards |
2018-Indefinite(1) | 26,046 | 25,690 | |||||||
| Foreign local loss carryforwards |
2018-2020 | 517 | 686 | |||||||
| Federal foreign tax credit carryforwards |
2020-2024 | 1,351 | 1,342 | |||||||
| (1) | Of the Company’s foreign net operating loss carryforwards, $11,697,000 will expire between 2018 and 2030 if not utilized, and $14,349,000 will carryforward indefinitely. |
The Company expects to record a credit to additional paid-in capital upon utilization of federal net operating loss and credit carryforwards of $10,323,000 and a credit to additional paid-in capital upon utilization of foreign net operating loss carryforwards of $750,000. In addition, all of the federal research and development tax credits will result in a credit to additional paid-in-capital when realized.
Under the Tax Reform Act of 1986, the amount of net operating losses and tax credits that can be carried forward may be limited in certain circumstances. Events that may cause changes in the Company’s tax carryovers include, but are not limited to, a cumulative ownership change of more than 50.0% over a three-year period. Certain of the Company’s operating losses that can be utilized in any one taxable year may be limited by future ownership changes. Currently, such a limitation exists on the net operating loss that was acquired in the Escapia, Second Porch and Glad to Have You acquisitions. A valuation allowance has been recorded to reduce the deferred tax asset to the value that the Company believes is more likely than not to be realized. A limitation also exists for losses attributable to the period of time before the February 1, 2005 Series A preferred stock financing transaction due to the deemed ownership change that occurred upon the issuance of those shares. The Company has not recorded a benefit for approximately $382,000 of net operating loss carryforwards that will expire unused.
F-37
Table of Contents
The following is a reconciliation of the amount of the income tax expense that results from applying the federal statutory income tax rate to income before income taxes to the reported income tax expense (in thousands):
| Year Ended December 31, | ||||||||||||
| 2014 | 2013 | 2012 | ||||||||||
| Federal tax expense at statutory rate |
$ | 7,433 | $ | 10,155 | $ | 9,848 | ||||||
| State taxes, net of federal tax benefit |
(552 | ) | 958 | 647 | ||||||||
| Foreign tax rate differential |
(2,166 | ) | (1,191 | ) | (2,481 | ) | ||||||
| Deferred charges |
1,908 | 1,959 | 1,582 | |||||||||
| Stock compensation |
2,430 | 566 | 1,679 | |||||||||
| Research and development credit |
(2,346 | ) | (3,220 | ) | — | |||||||
| Tax basis in Spanish intangibles |
(2,770 | ) | — | — | ||||||||
| Non-deductible expenses |
331 | 2,342 | 355 | |||||||||
| Other activity in unrecognized tax benefits |
816 | 540 | 2,325 | |||||||||
| Other |
(43 | ) | 98 | (1,198 | ) | |||||||
| Net increase (decrease) in valuation allowance |
2,231 | (483 | ) | 418 | ||||||||
|
|
|
|
|
|
|
|||||||
| $ | 7,272 | $ | 11,724 | $ | 13,175 | |||||||
|
|
|
|
|
|
|
|||||||
There was a tax benefit of $2,770,000 recorded in the year ended December 31, 2014 related to tax basis intangibles resulting from the merger of wholly owned subsidiaries of the Company in Spain.
Deferred U.S. income taxes and foreign withholding taxes are not provided on the undistributed cumulative earnings of foreign subsidiaries because those earnings are considered to be permanently reinvested in those operations. Any permanently reinvested earnings could become subject to additional U.S. taxes in certain circumstances (subject to an adjustment for foreign tax credits) and foreign withholding taxes if remitted to HomeAway, Inc. The determination of the amount of unrecognized tax liability is not practicable because of the complexities associated with multiple hypothetical calculations. There was approximately $28,012,000, $16,741,000 and $20,681,000 of cumulative earnings in the Company’s foreign subsidiaries as of December 31, 2014, 2013 and 2012, respectively.
The Company follows the guidance on accounting for uncertainty in income taxes, which prescribes a recognition threshold and measurement attribute for the financial statement recognition and measurement of a tax position taken or expected to be taken in a tax return and also provides guidance on derecognition, classification, interest and penalties, accounting in interim periods, disclosure and transition.
The aggregate changes in the balance of unrecognized tax benefits were as follows, excluding interest and penalties (in thousands):
| (in thousands) | Year Ended December 31, | |||||||||||
| 2014 | 2013 | 2012 | ||||||||||
| Balance, beginning of year |
$ | 7,555 | $ | 5,590 | $ | 3,658 | ||||||
| Increases for tax positions related to the current year |
2,130 | 1,013 | 1,815 | |||||||||
| Increases for tax positions related to prior years |
2,166 | 1,702 | 1,135 | |||||||||
| Decreases for tax positions related to prior years |
(556 | ) | (369 | ) | (739 | ) | ||||||
| Reductions due to lapsed statute of limitations |
(1,221 | ) | (381 | ) | (279 | ) | ||||||
|
|
|
|
|
|
|
|||||||
| Balance, end of year |
$ | 10,074 | $ | 7,555 | $ | 5,590 | ||||||
|
|
|
|
|
|
|
|||||||
Included in the balance of unrecognized tax benefits at December 31, 2014, 2013, and 2012 are $3,663,000, $3,177,000, and $1,242,000, respectively, of unrecognized tax benefits that are offset against related deferred tax assets. If the Company were to recognize the unrecognized tax benefits as of December 31, 2014, 2013, and 2012, $9,122,000, $7,555,000, and $5,265,000, respectively, would impact the effective tax rate.
F-38
Table of Contents
Management believes that an adequate provision has been made for any adjustments that may result from tax examinations. However, the outcome of tax audits cannot be predicted with certainty. If any issues addressed in the Company’s tax audits are resolved in a manner not consistent with management’s expectations, the Company could be required to adjust its provision for income taxes in the period such resolution occurs. Although timing of the resolution and closure of audits is not certain, as of December 31, 2014, there were approximately $1,611,000 of unrecognized tax benefits in several jurisdictions that the Company expects could decrease over the next 12 months due to the expiration of the respective statutes of limitation and $726,000 that could change over the next 12 months due to the conclusion of tax audits.
The Company includes interest and penalties related to unrecognized tax benefits as a component of income tax expense in the Consolidated Statement of Operations. Accrued interest and penalties are included within the related tax liability line in the consolidated balance sheet and were insignificant in all periods presented.
As of December 31, 2014, in the United States, the tax years 2011 through 2013 remain open to examination in the federal jurisdiction and most state jurisdictions. Tax years 2005 through 2010 remain open to adjustment due to net operating losses carried forward into open tax years. HomeAway, Inc. is currently under audit in the U.S., and two of the Company’s UK subsidiaries are currently under audit. Internationally, the following years remain open to examination:
| Jurisdiction |
Open Tax Years | |||
| Germany |
2011-2014 | |||
| France |
2012-2014 | |||
| Brazil |
2009-2014 | |||
| United Kingdom |
2011-2014 | |||
| Switzerland |
2010-2014 | |||
| Australia |
2010-2014 | |||
| Spain |
2010-2014 | |||
| Thailand |
2013-2014 | |||
| Singapore |
2011-2014 | |||
| New Zealand |
2010-2014 | |||
| Colombia |
2013-2014 | |||
| Italy |
2013-2014 | |||
13. Net Income Per Share Attributable to HomeAway, Inc.
The following table sets forth the computation of basic and diluted net income per share attributable to HomeAway, Inc. (in thousands except share and per share amounts):
| Year Ended December 31, | ||||||||||||
| 2014 | 2013 | 2012 | ||||||||||
| Numerator |
||||||||||||
| Net income attributable to HomeAway, Inc. |
$ | 13,384 | $ | 17,686 | $ | 14,961 | ||||||
|
|
|
|
|
|
|
|||||||
| Denominator |
||||||||||||
| Weighted average common shares outstanding-basic |
93,727 | 85,378 | 82,382 | |||||||||
| Dilutive effect of stock options, warrants and restricted stock units |
2,754 | 2,881 | 2,560 | |||||||||
|
|
|
|
|
|
|
|||||||
| Weighted average common shares outstanding-diluted |
96,481 | 88,259 | 84,942 | |||||||||
|
|
|
|
|
|
|
|||||||
| Net income per share attributable to HomeAway, Inc.: |
||||||||||||
| Basic |
$ | 0.14 | $ | 0.21 | $ | 0.18 | ||||||
| Diluted |
$ | 0.14 | $ | 0.20 | $ | 0.18 | ||||||
F-39
Table of Contents
The following common equivalent shares were excluded from the calculation of net income per share attributable to HomeAway, Inc. as their inclusion would have been anti-dilutive (in thousands):
| Year Ended December 31, | ||||||||||||
| 2014 | 2013 | 2012 | ||||||||||
| Stock options |
2,178 | 3,153 | 5,151 | |||||||||
| Restricted stock units |
57 | 4 | 7 | |||||||||
| Warrants |
7,716 | — | — | |||||||||
|
|
|
|
|
|
|
|||||||
| Total common equivalent shares excluded |
9,951 | 3,157 | 5,158 | |||||||||
|
|
|
|
|
|
|
|||||||
14. Domestic and Foreign Operations
The Company has operations in domestic and foreign regions, specifically in Europe, South America and the Asia Pacific region. Information about these operations is presented below (in thousands):
| Year Ended December 31, | ||||||||||||
| 2014 | 2013 | 2012 | ||||||||||
| Revenue: |
||||||||||||
| United States |
$ | 262,412 | $ | 211,473 | $ | 173,078 | ||||||
| France |
59,306 | 52,222 | 42,451 | |||||||||
| United Kingdom |
48,996 | 41,231 | 35,656 | |||||||||
| Australia |
25,888 | 3,300 | 1,141 | |||||||||
| Germany |
24,410 | 20,719 | 16,194 | |||||||||
| Other international |
25,750 | 17,544 | 11,884 | |||||||||
|
|
|
|
|
|
|
|||||||
| Total revenue |
$ | 446,762 | $ | 346,489 | $ | 280,404 | ||||||
|
|
|
|
|
|
|
|||||||
| Year Ended December 31, | ||||||||||||
| 2014 | 2013 | 2012 | ||||||||||
| Identifiable long-lived tangible assets: |
||||||||||||
| United States |
$ | 85,116 | $ | 43,673 | $ | 32,936 | ||||||
| International |
10,167 | 8,472 | 7,431 | |||||||||
|
|
|
|
|
|
|
|||||||
| Total identifiable long-lived tangible assets |
$ | 95,283 | $ | 52,145 | $ | 40,367 | ||||||
|
|
|
|
|
|
|
|||||||
Revenue attributed to the U.S. and international geographies are based upon the country in which the selling subsidiary of the Company is located.
Identifiable long-lived assets attributed to the U.S. and international geographies are based upon the country in which the asset is located or owned.
15. Employee Benefit Plans
The Company administers various employer-sponsored retirement plans in Colombia, France, Germany, Italy, Spain, Switzerland, the United Kingdom and the United States. The various plans allow for employer matching contributions to be made into the plans. Our total expense for these retirement plans is presented below (in thousands):
| Year Ended December 31, | ||||||||||||
| 2014 | 2013 | 2012 | ||||||||||
| Retirement plan contribution expense |
$ | 1,975 | $ | 1,907 | $ | 1,185 | ||||||
F-40
Table of Contents
FINANCIAL STATEMENT SCHEDULE
SCHEDULE II—VALUATION AND QUALIFYING ACCOUNTS
| Beginning Balance |
Additions | Write-offs | Ending Balance |
|||||||||||||
| (in thousands) | ||||||||||||||||
| Allowance for doubtful accounts: |
||||||||||||||||
| Year ended December 31, 2014 |
$ | 1,038 | $ | 471 | $ | (846 | ) | $ | 663 | |||||||
| Year ended December 31, 2013 |
633 | 980 | (575 | ) | 1,038 | |||||||||||
| Year ended December 31, 2012 |
425 | 647 | (439 | ) | 633 | |||||||||||
| Beginning Balance |
Additions | Reductions | Ending Balance |
|||||||||||||
| (in thousands) | ||||||||||||||||
| Deferred Tax Asset Valuation Allowance: |
||||||||||||||||
| Year ended December 31, 2014 |
$ | 362 | $ | 2,270 | $ | (169 | ) | $ | 2,463 | |||||||
| Year ended December 31, 2013 |
921 | 838 | (1,397 | ) | 362 | |||||||||||
| Year ended December 31, 2012 |
507 | 753 | (339 | ) | 921 | |||||||||||
F-41
Table of Contents
Selected Quarterly Financial Data
(Unaudited)
| For the Three Months Ended: | ||||||||||||||||||||||||||||||||
| March 31, 2013 |
June 30, 2013 |
September 30, 2013 |
December 31, 2013 |
March 31, 2014 |
June 30, 2014 |
September 30, 2014 |
December 31, 2014 |
|||||||||||||||||||||||||
| (in thousands, except per share amounts) | ||||||||||||||||||||||||||||||||
| Revenue |
$ | 79,464 | $ | 86,608 | $ | 90,148 | $ | 90,269 | $ | 105,682 | $ | 114,256 | $ | 117,112 | $ | 109,712 | ||||||||||||||||
| Net income (loss) attributable to HomeAway, Inc. |
$ | 5,295 | $ | 5,470 | $ | 8,478 | $ | (1,557 | ) | $ | 4,443 | $ | 3,867 | $ | 4,912 | $ | 162 | (1) | ||||||||||||||
| Net income (loss) per share—basic and diluted |
$ | 0.06 | $ | 0.06 | $ | 0.10 | $ | (0.02 | ) | $ | 0.05 | $ | 0.04 | $ | 0.05 | $ | 0.00 | |||||||||||||||
| Shares used in per share calculation—basic |
83,940 | 84,920 | 85,452 | 87,111 | 92,699 | 93,671 | 94,106 | 94,378 | ||||||||||||||||||||||||
| Shares used in per share calculation—diluted |
86,492 | 87,647 | 88,215 | 90,144 | 96,295 | 96,011 | 96,389 | 96,600 | ||||||||||||||||||||||||
F-42
Table of Contents
EXHIBIT INDEX
| Exhibit |
Exhibit Title | |
| 1.16 | Underwriting Agreement, dated as of December 11, 2013, by and among the Company, Deutsche Bank Securities Inc., J.P. Morgan Securities LLC, Goldman, Sachs & Co., Morgan Stanley & Co. LLC, Stifel, Nicolaus & Company, Incorporated, Pacific Crest Securities LLC and the Selling Stockholders. (Exhibit 1.1) | |
| 2.15 | Share Sale Agreement dated as of December 4, 2013 by and among HomeAway, Inc., HomeAway Australia Holdings Pty Ltd, Fairfax Media Limited and Fairfax Digital Pty Limited. (Exhibit 2.1) | |
| 3.11 | Amended and Restated Certificate of Incorporation. (Exhibit 3.2) | |
| 3.21 | Amended and Restated Bylaws. (Exhibit 3.4) | |
| 4.110 | Indenture between HomeAway, Inc. and U.S. Bank National Association dated March 31, 2014. (Exhibit 4.1) | |
| 4.21 | Amended and Restated Investors’ Rights Agreement dated March 10, 2011. (Exhibit 4.2) | |
| 4.31 | Warrant to Purchase Common Stock issued to Comerica Bank dated December 18, 2008, representing shares remaining after partial exercise of the original warrant issued on February 15, 2005. (Exhibit 4.5) | |
| 4.41 | Warrant to Purchase Common Stock issued to Entrepreneurs Foundation & Idea Network dated November 30, 2005. (Exhibit 4.6) | |
| 4.51 | Warrant to Purchase Common Stock issued to Comerica Bank dated December 2, 2005. (Exhibit 4.7) | |
| 10.11* | Form of Indemnification Agreement for directors and officers. (Exhibit 10.1B) | |
| 10.21* | 2004 Stock Plan, as amended. (Exhibit 10.2) | |
| 10.31* | Form of Stock Option Agreement for 2004 Stock Plan effective for grants made prior to April 3, 2009. (Exhibit 10.3A) | |
| 10.41* | Form of Stock Option Agreement for 2004 Stock Plan effective for grants made after April 3, 2009. (Exhibit 10.3B) | |
| 10.51* | Form of Restricted Stock Agreement for 2004 Stock Plan. (Exhibit 10.4) | |
| 10.61* | The HomeAway, Inc. Nonstatutory Share Option Plan (UK NSO Sub-Plan under 2004 Stock Plan). (Exhibit 10.5) | |
| 10.71* | The WVR Group, Inc. 2005 UK Enterprise Management Incentive Plan (UK EMI Sub-Plan under 2004 Stock Plan). (Exhibit 10.6) | |
| 10.81* | Form of Stock Option Agreement for 2004 Stock Plan (UK EMI Sub-Plan). (Exhibit 10.7) | |
| 10.91* | Incentive Plan for the Management of the German Subsidiary of the WVR Group, Inc. (German Sub-Plan under 2004 Stock Plan). (Exhibit 10.8) | |
| 10.101* | Form of Stock Option Agreement for 2004 Stock Plan (German Sub-Plan). (Exhibit 10.9) | |
| 10.111* | Addendum to 2004 Stock Plan containing terms and conditions for French option grants (French Sub-Plan under 2004 Stock Plan). (Exhibit 10.10) | |
| 10.121* | Form of Stock Option Agreement for 2004 Stock Plan (French Sub-Plan). (Exhibit 10.11) | |
| 10.131* | 2005 Stock Plan, as amended. (Exhibit 10.12) | |
| 10.141* | Form of Stock Option Agreement, as amended, for 2005 Stock Plan. (Exhibit 10.13) | |
| 10.151* | 2011 Equity Incentive Plan. (Exhibit 10.14) | |
| 10.1612* | 2011 Equity Incentive Plan French Sub-Plan. | |
Table of Contents
| Exhibit |
Exhibit Title | |
| 10.1712* | UK Schedule to the 2011 Equity Incentive Plan. | |
| 10.181* | Form of Stock Option Award Agreement approved for use under the 2011 Equity Incentive Plan. (Exhibit 10.15) | |
| 10.1912* | Form of Stock Option Award Agreement approved for use in France under the 2011 Equity Incentive Plan. | |
| 10.2012* | Form of Option Certificate approved for use under Part A of the UK Schedule of the 2011 Equity Incentive Plan. | |
| 10.217* | Form of Restricted Stock Unit Award Agreement approved for use under the 2011 Equity Incentive Plan. (Exhibit 10.17) | |
| 10.2212* | Form of Restricted Stock Unit Award Agreement approved for use in France under the 2011 Equity Incentive Plan. | |
| 10.231* | Executive Employment Agreement between the Registrant and Brian H. Sharples dated February 1, 2005. (Exhibit 10.16) | |
| 10.241* | Amendment to Executive Employment Agreement between the Registrant and Brian H. Sharples dated December 29, 2010. (Exhibit 10.17) | |
| 10.251* | Executive Employment Agreement between the Registrant and Brian H. Sharples dated May 27, 2011. (Exhibit 10.17A) | |
| 10.268* | Amendment to Executive Employment Agreement between the Registrant and Brian H. Sharples dated October 14, 2014. (Exhibit 10.1) | |
| 10.271* | Offer Letter between the Registrant and Lynn Atchison dated August 4, 2006. (Exhibit 10.18) | |
| 10.281* | Executive Employment Agreement between the Registrant and Lynn Atchison dated May 27, 2011. (Exhibit 10.18A) | |
| 10.298* | Amendment to Executive Employment Agreement between the Registrant and Lynn Atchison dated October 14, 2014. (Exhibit 10.2) | |
| 10.301* | Offer Letter between the Registrant and Carl G. Shepherd dated January 22, 2005. (Exhibit 10.19) | |
| 10.311* | Executive Employment Agreement between the Registrant and Carl G. Shepherd dated May 27, 2011. (Exhibit 10.19A) | |
| 10.328* | Amendment to Executive Employment Agreement between the Registrant and Carl G. Shepherd dated October 14, 2014. (Exhibit 10.6) | |
| 10.331* | Offer Letter between the Registrant and Thomas Hale dated June 14, 2010. (Exhibit 10.20) | |
| 10.341* | Amendment to Offer Letter between the Registrant and Thomas Hale dated December 29, 2010. (Exhibit 10.21) | |
| 10.351* | Executive Employment Agreement between the Registrant and Thomas Hale dated May 27, 2011. (Exhibit 10.21A) | |
| 10.368* | Amendment to Executive Employment Agreement between the Registrant and Thomas E. Hale dated October 14, 2014. (Exhibit 10.5) | |
| 10.371* | Offer Letter between the Registrant and Brent Bellm dated June 15, 2010. (Exhibit 10.22) | |
| 10.381* | Amendment to Offer Letter between the Registrant and Brent Bellm dated December 29, 2010. (Exhibit 10.23) | |
| 10.391* | Executive Employment Agreement between the Registrant and Brent Bellm dated May 27, 2011. (Exhibit 10.23A) | |
Table of Contents
| Exhibit |
Exhibit Title | |
| 10.408* | Amendment to Executive Employment Agreement between the Registrant and Brent Bellm dated October 14, 2014. (Exhibit 10.3) | |
| 10.411* | Executive Employment Agreement between the Registrant and Ross A. Buhrdorf dated May 27, 2011. (Exhibit 10.23B) | |
| 10.428* | Amendment to Executive Employment Agreement between the Registrant and Ross A. Buhrdorf dated October 14, 2014. (Exhibit 10.4) | |
| 10.43* | Offer Letter between the Registrant and Mariano Dima dated June 25, 2014. | |
| 10.44* | Executive Employment Agreement between the Registrant and Mariano Dima dated July 14, 2014. | |
| 10.451* | 2011 Executive Officer Performance Bonus Plan. (Exhibit 10.24) | |
| 10.462* | 2012 Executive Officer Performance Bonus Plan. (Exhibit 10.1) | |
| 10.474* | 2013 Executive Officer Performance Bonus Plan. (Exhibit 10.1) | |
| 10.489* | 2014 Executive Officer Performance Bonus Plan. (Exhibit 10.1) | |
| 10.491 | Office Lease Agreement between the Registrant and Fifth & Baylor, Ltd. dated August 1, 2008. (Exhibit 10.25) | |
| 10.5012 | Commercial Lease between HomeAway France and IVZ Immobilien Verwaltungs GmbH & Co. dated July 18, 2013. | |
| 10.513 | Lease Agreement between Domain Junction 2 LLC, Landlord, and the Registrant, Tenant, dated July 3, 2013. (Exhibit 10.1) | |
| 10.5211 | Purchase Agreement, dated March 25, 2014, by and among HomeAway, Inc. and J.P. Morgan Securities LLC and Deutsche Bank Securities Inc., as representatives of the initial purchasers named therein. (Exhibit 10.1) | |
| 10.5311 | Form of Convertible Note Hedge Confirmation. (Exhibit 10.2) | |
| 10.5411 | Form of Warrant Confirmation. (Exhibit 10.3) | |
| 21.1 | List of subsidiaries of the Registrant. | |
| 23.1 | Consent of PricewaterhouseCoopers LLP, Independent Registered Public Accounting Firm. | |
| 24.1 | Power of Attorney for Charles C. Baker, Simon Breakwell, Jeffrey D. Brody, Kevin Krone, Simon Lehmann, Christopher P. Marshall, Tina Sharkey and Carl G. Shepherd (see page 65 to this Annual Report on Form 10-K). | |
| 31.1 | Certification of Principal Executive Officer Required Under Rule 13a-14(a) and 15d-14(a) of the Securities Exchange Act of 1934, as amended. | |
| 31.2 | Certification of Principal Financial Officer Required Under Rule 13a-14(a) and 15d-14(a) of the Securities Exchange Act of 1934, as amended. | |
| 32.1 | Certification of Chief Executive Officer and Chief Financial Officer Required Under Rule 13a-14(a) and 15d-14(a) of the Securities Exchange Act of 1934, as amended, and 18 U.S.C. §1350 as adopted pursuant to Section 906 of The Sarbanes-Oxley Act of 2002. | |
| 101.INS | XBRL Instance Document | |
| 101.SCH | XBRL Taxonomy Extension Schema Document | |
| 101.CAL | XBRL Taxonomy Extension Calculation Linkbase Document | |
| 101.DEF | XBRL Taxonomy Extension Definition Linkbase Document | |
Table of Contents
| Exhibit |
Exhibit Title | |
| 101.LAB | XBRL Taxonomy Extension Label Linkbase Document | |
| 101.PRE | XBRL Taxonomy Extension Presentation Linkbase Document | |
| 1 | Incorporated by reference to the Registration Statement on Form S-1 (File No. 333-172783) as declared effective by the Securities and Exchange Commission on June 28, 2011. The number given in parentheses indicates the corresponding exhibit number in such Form S-1. |
| 2 | Incorporated by reference to the Current Report on Form 8-K filed by the Company on March 29, 2012. The number given in parentheses indicates the corresponding exhibit number in such Form 8-K. |
| 3 | Incorporated by reference to the Quarterly Report on Form 10-Q filed by the Company on July 31, 2013. The number given in parentheses indicates the corresponding exhibit number in such Form 10-Q. |
| 4 | Incorporated by reference to the Current Report on Form 8-K filed by the Company on March 8, 2013. The number given in parentheses indicates the corresponding exhibit number in such Form 8-K. |
| 5 | Incorporated by reference to the Current Report on Form 8-K filed by the Company on December 9, 2013. The number given in parentheses indicates the corresponding exhibit number in such Form 8-K. |
| 6 | Incorporated by reference to the Current Report on Form 8-K filed by the Company on December 13, 2013. The number given in parentheses indicates the corresponding exhibit number in such Form 8-K. |
| 7 | Incorporated by reference to the Annual Report on Form 10-K for the period ended December 31, 2011 filed by the Company on March 29, 2012. The number given in parentheses indicates the corresponding exhibit number in such Form 10-K. |
| 8 | Incorporated by reference to the Current Report on Form 8-K filed by the Company on October 16, 2014. The number given in parentheses indicates the corresponding exhibit number in such Form 8-K. |
| 9 | Incorporated by reference to the Current Report on Form 8-K filed by the Company on May 2, 2014. The number given in parentheses indicates the corresponding exhibit number in such Form 8-K. |
| 10 | Incorporated by reference to the Current Report on Form 8-K filed by the Company on April 1, 2014. The number given in parentheses indicates the corresponding exhibit number in such Form 8-K. |
| 11 | Incorporated by reference to the Current Report on Form 8-K filed by the Company on March 28, 2014. The number given in parentheses indicates the corresponding exhibit number in such Form 8-K. |
| 12 | Incorporated by reference to the Annual Report on Form 10-K for the period ended December 31, 2013 filed by the Company on February 26, 2014. The number given in parentheses indicates the corresponding exhibit number in such Form 10-K. |
| * | Management contract, compensatory plan or arrangement. |