Attached files
| file | filename |
|---|---|
| 8-K - 8-K - Cooper-Standard Holdings Inc. | a8-kjpmorganpresentation.htm |

1 J.P. Morgan Global High Yield & Leveraged Finance Conference February 25, 2015

2 2 Forward-Looking Statements There are a number of risks and uncertainties that could cause our actual results to differ materially from the forward-looking statements contained in this presentation. Important factors that could cause the Company's actual results to differ materially from the forward-looking statements made herein include, but are not limited to: prolonged or material contractions in automotive sales and production volumes, the Company's liquidity, the viability of the Company's supply base and the financial conditions of the Company's customers; loss of large customers or significant platforms; the Company's ability to obtain financing in the future; ability to generate sufficient cash to service all of the Company's indebtedness; operating and financial restrictions imposed on the Company by the term loan and credit agreement; underfunding of pension plans; availability and increasing volatility in costs of manufactured components and raw materials; escalating pricing pressures; the Company's ability to meet significant increases in demand; the Company's ability to successfully compete in the automotive parts industry; risks associated with the Company's non-U.S. operations; foreign currency exchange rate fluctuations; ability to control the operations of the Company's joint ventures for the Company’s sole benefit; effectiveness of continuous improvement programs and other cost savings plans; product liability, warranty and recall claims that may be brought against the Company; work stoppages or other labor conditions; natural disasters; ability to meet the Company's customers' needs for new and improved products on a timely or cost-effective basis; the possibility that the Company's acquisition strategy may not be successful; the ability of the Company's intellectual property portfolio to withstand legal challenges; a disruption in or the inability to successfully implement upgrades to the Company's information technology systems; environmental, health and safety laws and other laws and regulations; the possible volatility of the Company's annual effective tax rate; significant changes in discount rates and the actual return on pension assets and other factors; the possibility of future impairment charges to the Company's goodwill and long-lived assets; the concentration of stock ownership may allow a few owners to exert significant control over the Company; stock volatility; and dependence on the Company's subsidiaries for cash to satisfy the obligations of the holding Company.

Jeff Edwards Chairman and Chief Executive Officer Cooper Standard Overview

4 4 Cooper Standard (NYSE: CPS) 2014 Revenue: $3.244 billion (52% NA, 35% Europe, 8% Asia, 5% SA) $400+ million nonconsolidated JV Automotive Supplier Rank1: 67 Globally 41 North America 49 Europe Global Footprint: 97 facilities 10 technical centers 20 countries Employees: 27,000 + employees 1 Automotive News – 2013 Sealing Systems Fuel & Brake Delivery Systems Fluid Transfer Systems Anti-Vibration Systems Product Lines

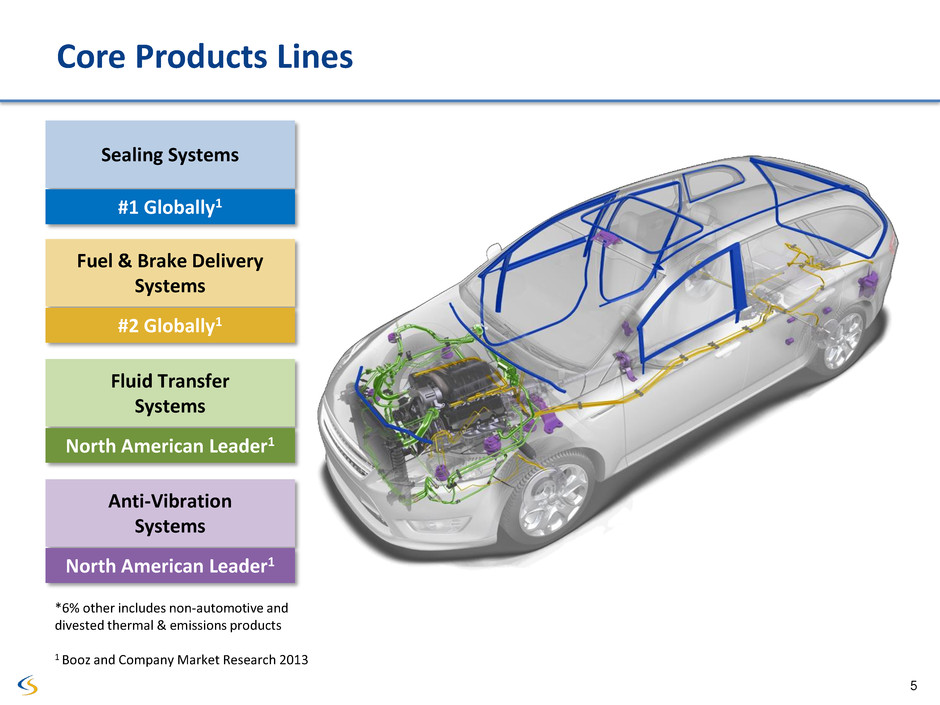
5 5 Core Products Lines Fuel & Brake Delivery Systems #2 Globally1 Fluid Transfer Systems North American Leader1 Anti-Vibration Systems North American Leader1 *6% other includes non-automotive and divested thermal & emissions products 1 Booz and Company Market Research 2013 Sealing Systems #1 Globally1

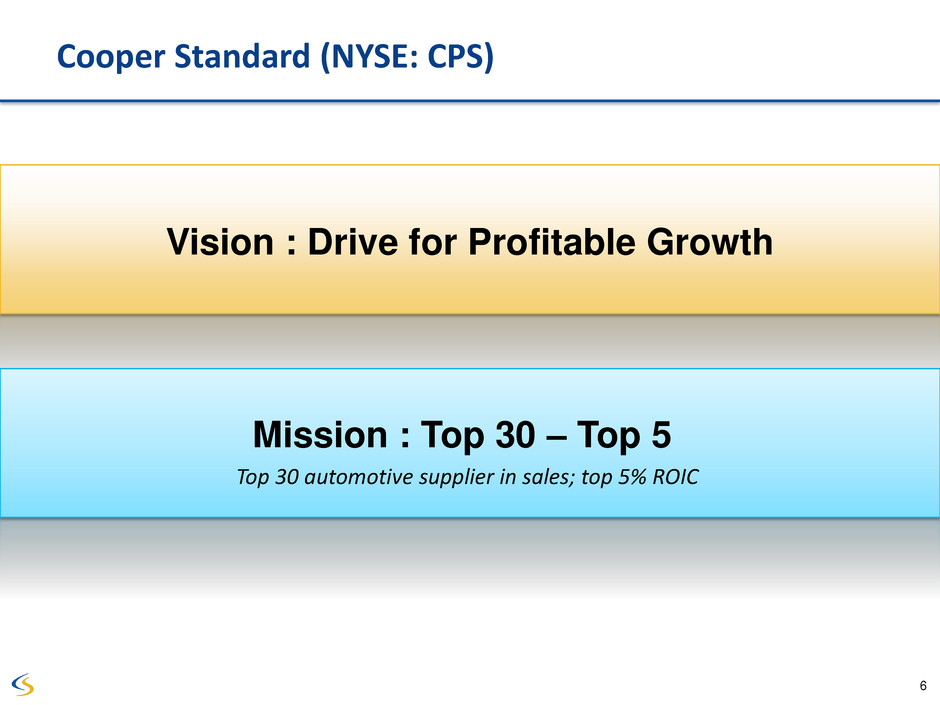
6 Vision : Drive for Profitable Growth Mission : Top 30 – Top 5 Cooper Standard (NYSE: CPS) Top 30 automotive supplier in sales; top 5% ROIC

7 7 Drive for Profitable Growth

8 8 Content Per Vehicle on Top Five Platforms Vehicle1 Content Per Vehicle2 Sealing F&B FTS AVS Ford F-150 ≈ $440 GM Silverado / Sierra/ Tahoe / Yukon / Escalade ≈ $170 Ford Focus / Escape 3 ≈ $95 Ford Fiesta / B Max / Ecosport 3 ≈ $130 Ford Mondeo / S-Max; Volvo S60 / V70; Tata Range Rover 4 ≈ $160 1 Ranking based on 2014 full year revenue 2 Approximate 3 Sales adjusted for cross platform products 4 This particular Volvo model is not global but the platform was designed as part of Ford’s global platform

9 9 World-Class Operations • Launched world-class operations initiative to drive improvement in ROIC: – Advantaged global footprint – Implemented best business practice tool – Standardization of process, equipment and product designs – Global supply chain structure to effectively leverage scale – Disciplined reviews with defined metric reporting • Target to close our performance gap to best-in-class benchmark plants by 30% per year

10 10 CPS Benchmark World-Class Operations Material Variable Overhead Fixed Overhead Total Labor Hours / Equivalent Unit CPS Benchmark Opportunity for Improvement CPS Benchmark CPS Benchmark

11 2 2 Restoring Competitive Advantage in Europe New regional management in place to accelerate performance Vertical integration Addressing commercial gaps Footprint optimization Revised restructuring plan Acquired 100 percent interest in Cooper Standard France JV Re-entered Spain market to support growth Serbia ramping up Cooper Standard facilities

12 12 Changchun Chongqing Huai-an Jingzhou Kunshan Shanghai Wuhu Guangzhou Shenyang Fengxian Accelerating Growth in China Huayu-Cooper Standard Transaction* Cooper Standard / INOAC JV* Majority-owned JV in Asia to accelerate fluid transfer systems growth Provides additional growth opportunities with Japanese OEMs in China and Southeast Asia Supports global platforms Cooper Standard to become majority (95%) owner of largest Chinese automotive sealing supplier Accelerates company’s sealing growth Provides additional growth opportunities with domestic Chinese automakers for across products lines Supports global platforms Qingpu * Subject to regulatory and other approvals Cooper Standard facilities

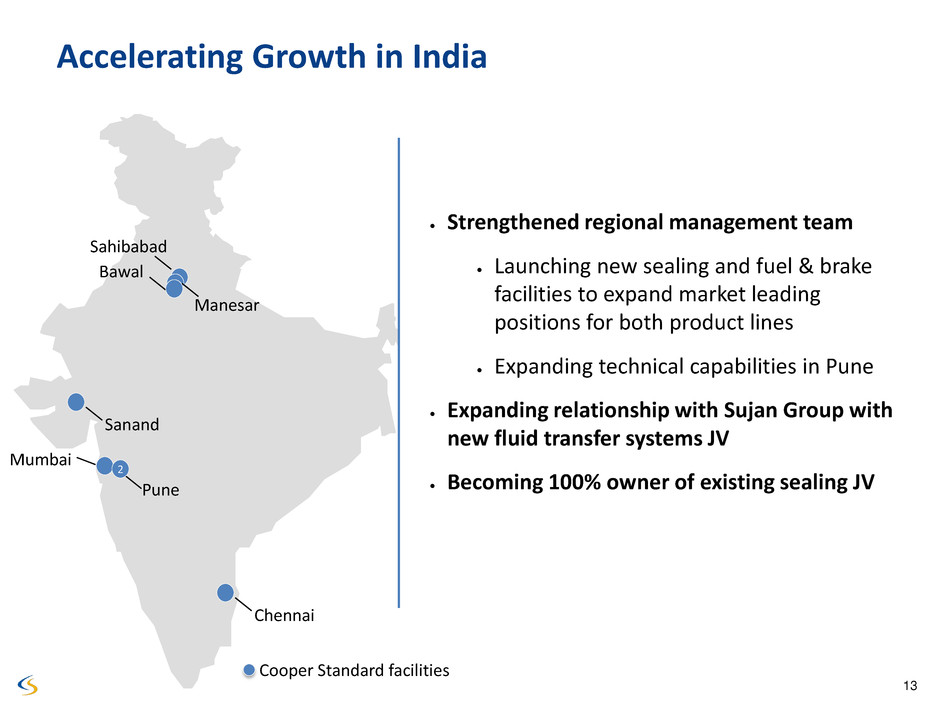
13 13 Accelerating Growth in India Bawal Chennai Sahibabad Manesar Mumbai Pune 2 Sanand Strengthened regional management team Launching new sealing and fuel & brake facilities to expand market leading positions for both product lines Expanding technical capabilities in Pune Expanding relationship with Sujan Group with new fluid transfer systems JV Becoming 100% owner of existing sealing JV Cooper Standard facilities

14 14 Technology Benefits Status Ultra Galfan Coating Increases product life for fuel and brake lines In production Quick Connect with Sensor Improves connections with sensor capability Booked orders ArmorHose™ Eliminates requirement for protective sleeves Booked orders Fortrex™ Material revolutionizing sealing and hose technology Offering to customers in 1st half of 2015 Bringing Innovations to Market

15 15 Revenue 2012 - 2017 $2.0 $2.5 $3.0 $3.5 $4.0 $4.5 2012 2013 2014 2015F 2016F 2017F Revenue Outpacing Industry Key Growth Drivers • Positioning to outpace competition on global platforms • Gaining significant China and North America market share • Developing new strategic partnerships • Commercializing break-through technology • Laser focused on filling product line white space across customer base Industry CAGR ≈ 3.4% CPS CAGR ≈ 5 - 6% Reflects Euro at 1.19 and Canadian dollar at .84 Industry CAGR calculated from January 2015 IHS Forecast $ Bi lli o n US D

16 16 Revenue Growth Note: Numbers subject to rounding 2014 Revenue by Product Lines - $3.2 billion Sealing 52% Fuel & Brake 20% Fluid Transfer 14% AVS 8% T&E Non- Automotive 2011-2014 Revenue by Customers * Others include Revenue to Tier ½ and commercial vehicle customers ($ million) OEM 2011 2014 2011- 2014 Change Tata Motors $ 45 $ 80 78% Daimler 75 133 76% Geely Motors 48 69 43% FCA 300 419 40% GM 404 508 26% BMW 50 59 19% Toyota 30 34 13% Ford 741 766 3% PSA 204 208 2% Renault/Nissan 107 103 -4% VAG 189 172 -9% Others* 660 694 5% $ 2,854 $ 3,244 14%

Allen Campbell Executive Vice President and Chief Financial Officer

Full Year Sales Growth Outpacing Market Note: Numbers subject to rounding (1) Source : January 2015 IHS Forecast / Full Year Q4 2013 - $794 Q4 2014 - $768 Full Year 2013 - $3,091 Full Year 2014 - $3,244 $ USD Millions Fourth Quarter Full Year $0 $100 $200 $300 $400 $500 North America Europe Asia Pacific South America $426 $270 $60 $38 $401 $259 $72 $36 $0 $250 $500 $750 $1,000 $1,250 $1,500 $1,750 North America Europe Asia Pacific South America $1,618 $1,076 $220 $177 $1,699 $1,138 $249 $158 Sales up 1.7x market (1)

19 19 Improved Q4 and FY 2014 Performance $ USD Millions, except Fully Diluted EPS / % Note: Numbers subject to rounding Fourth Quarter Full Year 2013 2014 2013 2014 $794.2 $767.9 Sales $3,090.5 $3,244.0 105.1 117.8 Gross Profit 472.7 509.4 13.2% 15.3% % Margin 15.3% 15.7% 72.6 73.1 SGA&E 293.4 301.7 14.6 7.1 Operating Profit 142.1 164.5 1.8% 0.9% % Margin 4.6% 5.1% ($20.8) ($12.8) Net Income (Loss) $47.9 $42.8 ($1.44) ($0.79) Fully Diluted EPS $2.24 $2.39 $58.7 $72.1 Adjusted EBITDA $287.4 $311.5 7.4% 9.4% % Margin 9.3% 9.6%

20 20 Full Year 2014 Cash Flow and Key Financial Ratios Liquidity Cash Balance as of December 31, 2013 $ 184.4 Cash generated 82.9 Cash Balance as of December 31, 2014 $ 267.3 ABL Revolver 180.0 Letters of Credit (35.6) Total Liquidity $ 411.7 Key Financial Ratios • Net Leverage $ 519 M • Net Leverage to Adjusted EBITDA 1.7 x • Interest Coverage Ratio 6.8 x $ USD Millions $184 $163 $267 $214 $43 $192 $68 $29 $7 $0 $100 $200 $300 $400 $500 12/31/2013 Cash Balance Cash from business Changes in operating assets & liabilities Capital expenditures Subtotal Financing activities M&A Other 12/31/2014 Cash Balance Note: Numbers subject to rounding EBITDA, Adjusted EBITDA and Financial Ratios are Non-GAAP measures. See appendix. (1) Other includes purchase of remaining equity interest of CS France JV , sale of fixed assets, foreign exchange, and others

21 21 Current Headwinds Impacting Business 1.9 2.0 2.1 2.2 2.3 Q1 Q2 Q3 Q4 0.5 1.0 1.5 Q1 Q2 Q3 Q4 USD/CAD EUR/USD Detroit 3 Light Vehicle Production Light Vehicle Production - Brazil m ill io n u n it s m ill io n u n it s 2013 2014 Source: IHS Automotive Source: IHS Automotive Source: Bloomberg 0.8 0.9 0.9 1.0 1.1 1.2 1.3 1.4 1.5 4.0 5.0 6.0 Q1 Q2 Q3 Q4 m ill io n u n it s Light Vehicle Production - Europe Foreign exchange volatility North America Vehicle Mix Europe Soft Production Volume Brazil Challenging economic environment Source: IHS Automotive

22 22 2015 Guidance North American production 17.4 million units European (including Russia) production 20.3 million units Average full year exchange rate 1 EUR = $1.19 USD 1 CAD = $0.84 USD • Revenue $3.3 - $3.4 billion • Capital Expenditure $185 - $210 million • Restructuring $35 - $45 million • Cash Tax $45 - $55 million • Adj. EBITDA Margin 50-75 bps improvement Key Assumptions

Q&A

Appendix

25 25 Note: Numbers subject to rounding Adj. EBITDA % Margin - Twelve Months Ended December 31, 2014 (1) Includes noncash restructuring and is net of noncontrolling interest. (2) Non-cash stock amortization expense and non-cash stock option expense for grants issued at time of the Company’s 2010 reorganization. (3) Impairment charges in 2014 related to fixed assets of $24.6 million and intangible assets of $1.7 million. (4) Loss on extinguishment of debt relating to the repurchase of our Senior Notes and Senior PIK Toggle Notes. (5) Gain on sale of thermal and emissions product line. (6) Settlement charges relating to the US pension plans that were amended to offer a one-time voluntary lump sum window to certain terminated vested participants. ($ USD Millions) Three Months Ended Twelve Months Ended 31-Mar-14 30-Jun-14 30-Sep-14 31-Dec-14 31-Dec-14 Net income (loss) $ 19.7 $ 13.2 $ 22.7 $ (12.8) $ 42.8 Income tax expense 12.1 4.4 18.9 7.4 42.8 Interest expense, net of interest income 15.0 10.9 9.4 10.3 45.6 Depreciation and amortization 28.3 28.5 28.0 27.9 112.6 EBITDA 75.1 57.0 79.0 32.8 243.8 Restructuring (1) 3.0 3.8 4.7 5.7 17.2 Stock-based compensation (2) 2.1 0.7 - - 2.8 Impairment Charges (3) - - - 26.3 26.3 Acquisition Costs - - 0.4 0.3 0.7 Loss on extinguishment of debt (4) 0.2 30.3 - - 30.5 Gain on divestiture (5) - - (17.9) 3.3 (14.6) Settlement charges (6) 3.6 3.6 Other 0.2 0.4 0.4 0.1 1.2 Adjusted EBITDA $ 80.6 $ 92.2 $ 66.6 $ 72.1 $ 311.5 Net Leverage Debt payable within one year $ 36.8 Long-term debt 749.1 Less: cash and cash equivalents (267.3) Net Leverage $ 518.6 Net Leverage Ratio 1.7 Interest coverage ratio 6.8 Sales $ 837.6 $ 857.6 $ 781.0 $ 767.9 $ 3,244.0 Adjusted EBITDA as a percent of Sales 9.6% 10.8% 8.5% 9.4% 9.6%

26 26 Adj. EBITDA % Margin - Twelve Months Ended December 31, 2013 ($ USD Millions) (1) Includes non-cash restructuring. (2) Proportionate share of restructuring costs related to Cooper Standard France joint venture. (3) Non-cash stock amortization expense and non-cash stock option expense for grants issued at time of the Company's 2010 reorganization. (4) Write-up of inventory to fair value for the Jyco acquisition. (5) Costs incurred in relation to the Jyco acquisition. Note: Numbers subject to rounding Three Months Ended Twelve Months Ended 31-Mar-13 30-Jun-13 30-Sep-13 31-Dec-13 31-Dec-13 Net income (loss) $20.7 $27.4 $20.6 $ (20.8) $47.9 Income tax expense 7.9 12.2 4.5 21.0 45.6 Interest expense, net of interest income 11.2 13.6 15.2 14.9 54.9 Depreciation and amortization 29.8 28.2 25.2 27.9 111.1 EBITDA 69.6 81.4 65.5 43.0 259.5 Restructuring (1) 4.8 1.0 1.9 14.0 21.7 Noncontrolling interest restructuring (2) (0.7) (0.1) - 0.3 (0.5) Stock-based compensation (3) 2.7 0.5 1.1 0.9 5.2 Inventory write-up (4) - - 0.3 - 0.3 Acquisition costs (5) - - 0.7 0.2 0.9 Other 0.3 (0.3) - 0.3 0.3 Adjusted EBITDA $76.7 $82.5 $69.5 $58.7 $287.4 Sales $747.6 $784.7 $764.1 $794.2 $3,090.5 Adjusted EBITDA as a percent of Sales 10.3% 10.5% 9.1% 7.4% 9.3%

27 27 Non-GAAP Financial Measures EBITDA and adjusted EBITDA are measures not recognized under Generally Accepted Accounting Principles (GAAP) which exclude certain non-cash and non-recurring items. Management considers EBITDA and adjusted EBITDA as key indicators of the Company's operating performance and believes that these and similar measures are widely used by investors, securities analysts and other interested parties in evaluating the Company's performance. Adjusted EBITDA is defined as net income adjusted to reflect income tax expense, interest expense net of interest income, depreciation and amortization, and certain non-recurring items that management does not consider to be reflective of the Company's core operating performance. When analyzing the company’s operating performance, investors should use EBITDA and adjusted EBITDA in addition to, and not as alternatives for, net income (loss), operating income, or any other performance measure derived in accordance with GAAP, or as an alternative to cash flow from operating activities as a measure of the company’s performance. EBITDA and adjusted EBITDA have limitations as analytical tools and should not be considered in isolation or as substitutes for analysis of the company’s results of operations as reported under GAAP. Other companies may report EBITDA and adjusted EBITDA differently and therefore Cooper Standard’s results may not be comparable to other similarly titled measures of other companies. In addition, in evaluating adjusted EBITDA, it should be noted that in the future Cooper Standard may incur expenses similar to or in excess of the adjustments in the above presentation. This presentation of adjusted EBITDA should not be construed as an inference that Cooper Standard's future results will be unaffected by unusual or non- recurring items.
