Attached files
| file | filename |
|---|---|
| EX-10.32 - EX-10.32 - CoreCivic, Inc. | d853180dex1032.htm |
| EXCEL - IDEA: XBRL DOCUMENT - CoreCivic, Inc. | Financial_Report.xls |
| EX-31.1 - EX-31.1 - CoreCivic, Inc. | d853180dex311.htm |
| EX-23.1 - EX-23.1 - CoreCivic, Inc. | d853180dex231.htm |
| EX-32.2 - EX-32.2 - CoreCivic, Inc. | d853180dex322.htm |
| EX-31.2 - EX-31.2 - CoreCivic, Inc. | d853180dex312.htm |
| EX-32.1 - EX-32.1 - CoreCivic, Inc. | d853180dex321.htm |
| EX-21.1 - EX-21.1 - CoreCivic, Inc. | d853180dex211.htm |
UNITED STATES
SECURITIES AND EXCHANGE COMMISSION
WASHINGTON, D.C. 20549
FORM 10-K
| x | ANNUAL REPORT PURSUANT TO SECTION 13 OR 15(d) OF THE SECURITIES EXCHANGE ACT OF 1934 |
For the fiscal year ended December 31, 2014
OR
| ¨ | TRANSITION REPORT PURSUANT TO SECTION 13 OR 15(d) OF THE SECURITIES EXCHANGE ACT OF 1934 |
Commission file number: 001-16109
CORRECTIONS CORPORATION OF AMERICA
(Exact name of registrant as specified in its charter)
| MARYLAND | 62-1763875 | |
| (State or other jurisdiction of incorporation or organization) |
(I.R.S. Employer Identification No.) |
10 BURTON HILLS BLVD., NASHVILLE, TENNESSEE 37215
(Address and zip code of principal executive office)
REGISTRANT’S TELEPHONE NUMBER, INCLUDING AREA CODE: (615) 263-3000
SECURITIES REGISTERED PURSUANT TO SECTION 12(B) OF THE ACT:
| Title of each class |
Name of each exchange on which registered | |
| Common Stock, $.01 par value per share | New York Stock Exchange |
SECURITIES REGISTERED PURSUANT TO SECTION 12(G) OF THE ACT: NONE
Indicate by check mark if the registrant is a well-known seasoned issuer, as defined in Rule 405 of the Securities Act. Yes x No ¨
Indicate by check mark if the registrant is not required to file reports pursuant to Section 13 or Section 15 (d) of the Act. Yes ¨ No x
Indicate by check mark whether the registrant (1) has filed all reports required to be filed by Section 13 or 15(d) of the Securities Exchange Act of 1934 during the preceding 12 months (or for such shorter period that the registrant was required to file such reports), and (2) has been subject to such filing requirements for the past 90 days. Yes x No ¨
Indicate by check mark whether the registrant has submitted electronically and posted on its corporate Web site, if any, every Interactive Data File required to be submitted and posted pursuant to Rule 405 of Regulation S-T during the preceding 12 months (or for such shorter period that the registrant was required to submit and post such files). Yes x No ¨
Indicate by check mark if disclosure of delinquent filers pursuant to Item 405 of Regulation S-K is not contained herein, and will not be contained, to the best of the registrant’s knowledge, in definitive proxy or information statements incorporated by reference in Part III of this Form 10-K or any amendment to this Form 10-K. [ ]
Indicate by check mark whether the registrant is a large accelerated filer, an accelerated filer, or a non-accelerated filer. See definition of “accelerated filer and large accelerated filer” in Rule 12b-2 of the Exchange Act. (Check one):
| Large accelerated filer | x | Accelerated filer | ¨ | |||
| Non-accelerated filer | ¨ (Do not check if a smaller reporting company) | Smaller reporting company | ¨ | |||
Indicate by check mark whether the registrant is a shell company (as defined in Rule 12b-2 of the Act.). Yes ¨ No x
The aggregate market value of the shares of the registrant’s Common Stock held by non-affiliates was approximately $3,792,269,339 as of June 30, 2014 based on the closing price of such shares on the New York Stock Exchange on that day. The number of shares of the registrant’s Common Stock outstanding on February 17, 2015 was 116,790,636.
DOCUMENTS INCORPORATED BY REFERENCE:
Portions of the registrant’s definitive Proxy Statement for the 2015 Annual Meeting of Stockholders, currently scheduled to be held on May 14, 2015, are incorporated by reference into Part III of this Annual Report on Form 10-K.
CORRECTIONS CORPORATION OF AMERICA
FORM 10-K
For the fiscal year ended December 31, 2014
TABLE OF CONTENTS
2
CAUTIONARY STATEMENT REGARDING
FORWARD-LOOKING INFORMATION
This Annual Report on Form 10-K contains statements that are forward-looking statements as defined within the meaning of the Private Securities Litigation Reform Act of 1995. Forward-looking statements give our current expectations of forecasts of future events. All statements other than statements of current or historical fact contained in this Annual Report, including statements regarding our future financial position, business strategy, budgets, projected costs, and plans, and objectives of management for future operations, are forward-looking statements. The words “anticipate,” “believe,” “continue,” “estimate,” “expect,” “intend,” “may,” “plan,” “projects,” “will,” and similar expressions, as they relate to us, are intended to identify forward-looking statements. These forward-looking statements are based on our current plans and actual future activities, and our results of operations may be materially different from those set forth in the forward-looking statements. In particular these include, among other things, statements relating to:
| • | general economic and market conditions, including the impact governmental budgets can have on our per diem rates and occupancy; |
| • | fluctuations in our operating results because of, among other things, changes in occupancy levels, competition, increases in costs of operations, fluctuations in interest rates, and risks of operations; |
| • | changes in the privatization of the corrections and detention industry and the public acceptance of our services; |
| • | our ability to obtain and maintain correctional facility management contracts, including, but not limited to, sufficient governmental appropriations, contract compliance, effects of inmate disturbances, and the timing of the opening of new facilities and the commencement of new management contracts as well as our ability to utilize current available beds and new capacity as development and expansion projects are completed; |
| • | increases in costs to develop or expand correctional facilities that exceed original estimates, or the inability to complete such projects on schedule as a result of various factors, many of which are beyond our control, such as weather, labor conditions, and material shortages, resulting in increased construction costs; |
| • | changes in government policy and in legislation and regulation of the corrections and detention industry that affect our business, including, but not limited to, California’s utilization of out-of-state private correctional capacity, and the impact of any changes to immigration reform and sentencing laws (Our policy prohibits us from engaging in lobbying or advocacy efforts that would influence enforcement efforts, parole standards, criminal laws, and sentencing policies.); |
| • | our ability to meet and maintain qualification for taxation as a real estate investment trust, or REIT; and |
| • | the availability of debt and equity financing on terms that are favorable to us. |
Any or all of our forward-looking statements in this Annual Report may turn out to be inaccurate. We have based these forward-looking statements largely on our current expectations and projections about future events and financial trends that we believe may
3
affect our financial condition, results of operations, business strategy, and financial needs. They can be affected by inaccurate assumptions we might make or by known or unknown risks, uncertainties and assumptions, including the risks, uncertainties and assumptions described in “Risk Factors.”
In light of these risks, uncertainties and assumptions, the forward-looking events and circumstances discussed in this Annual Report may not occur and actual results could differ materially from those anticipated or implied in the forward-looking statements. When you consider these forward-looking statements, you should keep in mind the risk factors and other cautionary statements in this Annual Report, including in “Management’s Discussion and Analysis of Financial Condition and Results of Operations” and “Business.”
Our forward-looking statements speak only as of the date made. We undertake no obligation to publicly update or revise forward-looking statements, whether as a result of new information, future events or otherwise. All subsequent written and oral forward-looking statements attributable to us or persons acting on our behalf are expressly qualified in their entirety by the cautionary statements contained in this Annual Report.
4
| ITEM 1. | BUSINESS. |
We are the nation’s largest owner of privatized correctional and detention facilities and one of the largest prison operators in the United States. As of December 31, 2014, we owned or controlled 52 correctional and detention facilities and managed an additional 12 facilities owned by our government partners, with a total design capacity of approximately 84,500 beds in 19 states and the District of Columbia.
We are a Real Estate Investment Trust, or REIT, specializing in owning, operating, and managing prisons and other correctional facilities and providing residential, community re-entry, and prisoner transportation services for governmental agencies. In addition to providing fundamental residential services, our facilities offer a variety of rehabilitation and educational programs, including basic education, faith-based services, life skills and employment training, and substance abuse treatment. These services are intended to reduce recidivism and to prepare offenders for their successful re-entry into society upon their release. We also provide or make available to offenders certain health care (including medical, dental, and mental health services), food services, and work and recreational programs.
We are a Maryland corporation formed in 1983. Our principal executive offices are located at 10 Burton Hills Boulevard, Nashville, Tennessee, 37215, and our telephone number at that location is (615) 263-3000. Our website address is www.cca.com. We make our Annual Reports on Form 10-K, Quarterly Reports on Form 10-Q, Current Reports on Form 8-K, and amendments to those reports under the Securities Exchange Act of 1934, as amended (the “Exchange Act”), available on our website, free of charge, as soon as reasonably practicable after these reports are filed with or furnished to the Securities and Exchange Commission, or the SEC. Information contained on our website is not part of this Annual Report.
We began operating as a REIT for federal income tax purposes effective January 1, 2013. Since that date, we have provided correctional services and conducted other operations through taxable REIT subsidiaries, or TRSs. A TRS is a subsidiary of a REIT that is subject to applicable corporate income tax and certain qualification requirements. Our use of TRSs enables us to comply with REIT qualification requirements while providing correctional services at facilities we own and at facilities owned by our government partners and to engage in certain other operations. A TRS is not subject to the distribution requirements applicable to REITs so it may retain income generated by its operations for reinvestment.
As a REIT, we generally are not subject to federal income taxes on our REIT taxable income and gains that we distribute to our stockholders, including the income derived from providing prison bed capacity and dividends we earn from our TRSs. However, our TRSs will be required to pay income taxes on their earnings at regular corporate income tax rates.
As a REIT, we generally are required to distribute annually to our stockholders at least 90% of our REIT taxable income (determined without regard to the dividends paid deduction and excluding net capital gains). Our REIT taxable income will not typically include income earned by our TRSs except to the extent our TRSs pay dividends to the REIT. Prior to our REIT reorganization, we operated as a C-corporation for federal income tax purposes. A REIT is not permitted to retain earnings and profits accumulated during the periods it was taxed as a C-corporation, and must make one or more distributions to stockholders that equal or exceed those accumulated amounts. To satisfy this requirement, on April 8, 2013, our
5
Board of Directors declared a special dividend to stockholders of $675.0 million, or $6.66 per share of common stock to distribute our accumulated earnings and profits attributable to tax periods ending prior to January 1, 2013. We paid the special dividend on May 20, 2013 to stockholders of record on April 19, 2013. The special dividend was composed of cash and shares of our common stock, at each stockholder’s election, subject to a cap on the total amount of cash equal to 20% of the aggregate amount of the special dividend, or $135.0 million. The balance of the special dividend was paid in the form of 13.9 million additional shares of our common stock.
Management and Operation of Correctional and Detention Facilities
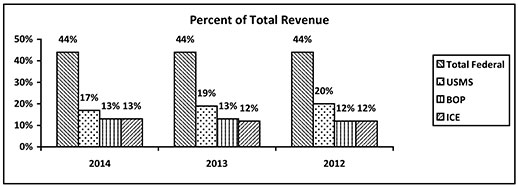
Our customers consist of federal, state, and local correctional and detention authorities. Federal correctional and detention authorities primarily consist of the Federal Bureau of Prisons, or the BOP, the United States Marshals Service, or the USMS, and the U.S. Immigration and Customs Enforcement, or ICE. Payments by federal correctional and detention authorities represented 44% of our total revenue for each of the years ended December 31, 2014, 2013, and 2012.
Our customer contracts typically have terms of three to five years and contain multiple renewal options. Most of our facility contracts also contain clauses that allow the government agency to terminate the contract at any time without cause, and our contracts are generally subject to annual or bi-annual legislative appropriations of funds.
We are compensated for providing prison bed capacity and correctional services at an inmate per diem rate based upon actual or minimum guaranteed occupancy levels. Occupancy rates for a particular facility are typically low when first opened or immediately following an expansion. However, beyond the start-up period, which typically ranges from 90 to 180 days, the occupancy rate tends to stabilize. For the years 2014, 2013, and 2012, the average compensated occupancy of our facilities, based on rated capacity, was 84%, 85%, and 88%, respectively, for all of the facilities we owned or managed, exclusive of facilities that have been presented as discontinued operations.
Operating Procedures
Pursuant to the terms of our customer contracts, we are responsible for the overall operations of our facilities, including staff recruitment, general administration of the facilities, facility maintenance, security, and supervision of the offenders. We are required by our customer contracts to maintain certain levels of insurance coverage for general liability, workers’ compensation, vehicle liability, and property loss or damage. We are also required to indemnify our customers for claims and costs arising out of our operations and, in certain cases, to maintain performance bonds and other collateral requirements. Approximately 90% of the eligible facilities we operated at December 31, 2014 were accredited by the American Correctional Association Commission on Accreditation. The American Correctional Association, or ACA, is an independent organization comprised of corrections professionals that establishes accreditation standards for correctional and detention institutions.
We are committed to equipping offenders in our care with the services, support, and resources necessary to return to the community as productive, contributing members of society. To that end, we provide a wide range of evidence-based re-entry programs and activities at our facilities. At most of the facilities we manage, offenders have the opportunity to enhance their basic education from literacy through the acquisition of the high school equivalency diploma endorsed by the respective state and, in some cases,
6
postsecondary educational achievements. In a number of our facilities, and in conjunction with the Mexican government, we offer an adult education curriculum recognized by a number of nations to which these offenders may return.
In addition, we offer a broad spectrum of vocational/technical education opportunities to equip individuals with marketable job skills. Our trade programs are certified by the National Center for Construction Education and Research, or NCCER. NCCER establishes the curriculum and certification for over 4,000 construction and trade organizations. Graduates of these programs enter the job market with certified skills that significantly enhance employability. For those with assessed substance use disorder needs, we offer evidence-based treatment programs such as the Residential Drug Addictions Treatment Program, or RDAP, with proven clinical outcomes. Our life skills programs prepare individuals for life after incarceration by teaching offenders how to successfully conduct a job search, how to manage their budget and financial matters, parenting skills, and relationship and family skills. Equally significant, we offer cognitive behavioral programs aimed at changing anti-social attitudes and behaviors of offenders, with a focus on altering the level of criminal thinking of offenders. Our Victim Impact Programs, available at a number of our facilities, seek to educate offenders on the negative effects upon others resulting from their criminal conduct. At a number of our facilities, we provide faith-based programs to those seeking spiritual growth and character development. Our facilities offer opportunities for religious worship and study for a variety of faith groups and belief systems. Across the country, these programs incorporate the use of thousands of volunteers, along with our staff, who assist in providing guidance, direction, and post-incarceration services to offenders. We believe that together these efforts help us achieve reductions in recidivism.
Through our community corrections facilities, we provide an array of services to offenders who are serving the last portion of their sentence while supervised in a community environment. We also offer services for alternative sentencing options that provide governmental agencies and the courts the ability to place sentenced offenders in a community corrections facility thereby allowing them the opportunity to maintain their employment. We offer housing and programs, with a key focus on employment, job readiness, and life skills, in order to help offenders successfully re-enter the community and reduce the risk of recidivism.
Outside agency standards, such as those established by the ACA, provide us with the industry’s most widely accepted operational guidelines. We have sought and received accreditation for 47 of the eligible facilities we operated as of December 31, 2014.
Beyond the standards provided by the ACA, our facilities are operated in accordance with a variety of company and facility-specific policies and procedures, as well as various contractual requirements. These policies and procedures reflect the high standards generated by a number of sources, including the ACA, The Joint Commission, the National Commission on Correctional Healthcare, the Occupational Safety and Health Administration, federal, state, and local government codes and regulations, established correctional procedures, and company-wide policies and procedures that may exceed these guidelines.
Prison Rape Elimination Act, or PREA, regulations were published in June 2012 and became effective in August 2013. All confinement facilities covered under the PREA standards must be audited at least every three years to be considered compliant with the PREA standards, with one-third of each facility type operated by an agency, or private organization on behalf of an agency, audited each year. These include adult prisons and jails, juvenile facilities, lockups (housing detainees overnight), and community confinement facilities, whether operated by the Department of Justice or unit of a state, local, corporate, or nonprofit authority.
7
Our facilities not only operate under these established standards, policies, and procedures, but they are consistently challenged by our management to exceed them. This challenge is presented, in large part, through our extensive Quality Assurance Program. Our Quality Assurance Division, or QAD, independently operates under the auspices of, and reports directly to, our Office of General Counsel. We have devoted significant resources to meeting outside agency and accrediting organization standards and guidelines. Our QAD provides governance for all efforts by our facilities to deliver high quality services and operations, with a commitment to continuous quality improvement.
The QAD collects and analyzes performance metrics across multiple databases. Through rigorous reporting and analyses of comprehensive, comparative statistics across disciplines, divisions, business units and our company as a whole, the QAD provides timely, independently generated performance and trend data to senior management.
The QAD also employs a team of full-time auditors, who are subject matter experts from all major disciplines within institutional operations. Annually, without advance notice, these auditors conduct rigorous, on site evaluations of each facility we operate. The audit teams use highly specialized, discipline-specific audit tools, containing over 1,600 audited items across fourteen major operational areas, in this detailed, comprehensive process. The results of these on-site evaluations are used to discern areas of operational strength and areas in need of management attention. The audit findings also comprise a major part of our continuous operational risk assessment and management process. Audit teams are also made available to work with facilities in specific areas of need, such as meeting requirements of new partner contracts or providing detailed training of new departmental managers.
The QAD management team coordinates overall operational auditing and compliance efforts across all CCA facilities. In conjunction with subject matter experts and other stakeholders having risk management responsibilities, the QAD management team develops performance measurement tools used in facility audits. The management team also provides governance of the corporate plan of action process which helps to ensure swift resolution of issues identified through internal and external facility reviews. Our QAD also contracts with teams of seasoned, ACA certified correctional auditors to help ensure continuous compliance with ACA standards at accredited facilities and to help ensure that our facilities are operating at the highest possible levels. Similarly, the QAD coordinates the work of certified PREA auditors to help ensure that all facilities operate in compliance with these important regulations.
Prisoner Transportation Services
We currently provide transportation services to governmental agencies through our wholly-owned TRS, TransCor America, LLC, or TransCor. During the years ended December 31, 2014, 2013, and 2012, TransCor generated total revenue of $4.4 million, $2.7 million, and $2.5 million, respectively, or approximately 0.3% of our total consolidated revenue in 2014 and 0.2% in both 2013 and 2012. We believe TransCor provides a complementary service to our core business that enables us to respond quickly to our customers’ transportation needs.
8
We are currently the nation’s largest owner and provider of outsourced correctional facilities and management services. We believe we manage nearly 41% of all beds under contract with private operators of correctional and detention facilities in the United States, most of which are in facilities we own and provide to our governmental customers. We believe we own approximately 61% of all privately owned prison beds in the United States. Under the direction of our partnership development department and senior management, we market our facilities and services to government agencies responsible for federal, state, and local correctional and detention facilities in the United States. Under the direction of our strategic development department, we pursue asset acquisitions and business combination transactions.
As indicated by the following chart, business from our federal customers, including primarily the BOP, USMS, and ICE, continues to be a significant component of our business. The BOP, USMS, and ICE were the only federal partners that accounted for 10% or more of our total revenue during the last three years.
Certain of our contracts with federal partners contain “take-or-pay” clauses that guarantee the federal partner access to a minimum bed capacity in exchange for a fixed monthly payment.
Business from our state customers, which constituted 48%, 49%, and 49% of total revenue during the years 2014, 2013, and 2012, respectively, decreased 4.2% from $826.1 million during 2013 to $791.8 million during 2014. The State of California Department of Corrections and Rehabilitation, or CDCR, accounted for 14%, 12%, and 12% of total revenue for 2014, 2013, and 2012, respectively, including revenue generated under an operating lease that commenced December 1, 2013, at our California City facility. The CDCR was our only state partner that accounted for 10% or more of our total revenue during these years.
Several of our state partners are projecting modest increases in tax revenues and improvements in their budgets which has resulted in our ability to secure recent per diem increases at certain facilities. We believe the long-term growth opportunities of our business remain very attractive as certain states consider efficiency and savings as well as offender programming opportunities we can provide as a tool to reduce recidivism. Further, we expect our partners to continue to face challenges in maintaining old facilities, and developing new facilities and additional capacity which could result in future demand for the solutions that we provide.
9
We believe that we can further develop our business by, among other things:
| • | Maintaining and expanding our existing customer relationships and continuing to fill existing beds within our facilities, while maintaining an adequate inventory of available beds that we believe provides us with flexibility and a competitive advantage when bidding for new management contracts; |
| • | Enhancing the terms of our existing contracts and expanding the services we provide under those contracts; |
| • | Pursuing additional opportunities to purchase and manage existing government-owned facilities; |
| • | Pursuing additional opportunities to lease our facilities to government and other third-party operators in need of correctional capacity; |
| • | Pursuing other asset acquisitions and business combinations through transactions with non-government third parties; |
| • | Maintaining and expanding our focus on community corrections and re-entry programming that align with the needs of our government partners; and |
| • | Establishing relationships with new customers who have either previously not outsourced their correctional facility management needs or have utilized other private enterprises. |
We generally receive inquiries from or on behalf of government agencies that are considering outsourcing the ownership and/or management of certain facilities or that have already decided to contract with a private enterprise. When we receive such an inquiry, we determine whether there is an existing need for our correctional facilities and/or services and whether the legal and political climate in which the inquiring party operates is conducive to serious consideration of outsourcing. Based on these findings, an initial cost analysis is conducted to further determine project feasibility.
Frequently, government agencies responsible for correctional and detention facilities and services procure space and services through solicitations or competitive procurements. As part of our process of responding to such requests, members of our management team meet with the appropriate personnel from the agency making the request to best determine the agency’s needs. If the project fits within our strategy, we submit a written response. A typical solicitation or competitive procurement requires bidders to provide detailed information, including, but not limited to, the space and services to be provided by the bidder, its experience and qualifications, and the price at which the bidder is willing to provide the facility and services (which services may include the purchase, renovation, improvement or expansion of an existing facility or the planning, design and construction of a new facility). The requesting agency selects a firm believed to be able to provide the requested bed capacity, if needed, and most qualified to provide the requested services and then negotiates the price and terms of the contract with that firm.
General
Our facilities can generally be classified according to the level(s) of security at such facility. Secure facilities are facilities having cells, rooms, or dormitories, a secure perimeter, and some form of external patrol. Non-secure facilities are facilities having open housing that
10
inhibit movement by their design. Minimum security facilities have open housing within an appropriately designed and patrolled institutional perimeter. Medium security facilities have either cells, rooms or dormitories, a secure perimeter, and some form of external patrol. Maximum security facilities have cells, a secure perimeter, and external patrol. Multi-security facilities have various areas encompassing minimum, medium or maximum security.
Our facilities can also be classified according to their primary function. The primary functional categories are:
| • | Correctional Facilities. Correctional facilities house and provide contractually agreed upon programs and services to sentenced adult prisoners, typically prisoners on whom a sentence in excess of one year has been imposed. |
| • | Detention Facilities. Detention facilities house and provide contractually agreed upon programs and services to (i) prisoners being detained by ICE, (ii) prisoners who are awaiting trial who have been charged with violations of federal criminal law (and are therefore in the custody of the USMS) or state criminal law, and (iii) prisoners who have been convicted of crimes and on whom a sentence of one year or less has been imposed. |
| • | Community Corrections. Residential re-entry facilities offer housing and programs to offenders who are serving the last portion of their sentence or who have been assigned to the facility in lieu of a jail or prison sentence, with a key focus on employment, job readiness, and life skills. |
| • | Residential Facilities. Residential facilities provide space and residential services in an open and safe environment to adults with children who illegally crossed the U.S. border and are awaiting the outcome of immigration hearings or the return to their home countries. As contractually agreed upon, residential facilities offer services including, but not limited to, educational programs, medical care, recreational activities, counseling, and access to religious and legal services. |
| • | Leased Facilities. Leased facilities are facilities that we own but do not manage and that are leased to third-party operators. |
Facilities and Facility Management Contracts
As of December 31, 2014, we owned or controlled 52 correctional and detention facilities in 16 states and the District of Columbia, three of which we leased to third-party operators. Additionally, we managed 12 correctional and detention facilities owned by government agencies. We also owned two corporate office buildings. Owned and managed facilities include facilities placed into service that we own or control via a lease and manage. Managed-only facilities include facilities we manage that are owned by a third party. The segment disclosures are included in Note 16 of the Notes to the Consolidated Financial Statements. The following table sets forth all of the facilities that, as of December 31, 2014, we (i) owned and managed, (ii) owned, but were leased to another operator, and (iii) managed but are owned by a government authority. The table includes certain information regarding each facility, including the term of the primary customer contract related to such facility, or, in the case of facilities we owned but leased to a third-party operator, the term of such lease.
11
| Facility Name |
Primary Customer |
Design Capacity (A) |
Security Level |
Facility Type (B) |
Term | Remaining Renewal Options (C) | ||||||||
| Owned and Managed Facilities: |
||||||||||||||
| Central Arizona Detention Center Florence, Arizona |
USMS | 2,304 | Multi | Detention | September 2018 | (2) 5 year | ||||||||
| Eloy Detention Center Eloy, Arizona |
ICE | 1,500 | Medium | Detention | Indefinite | — | ||||||||
| Florence Correctional Center Florence, Arizona |
USMS | 1,824 | Multi | Detention | September 2018 | (2) 5 year | ||||||||
| La Palma Correctional Center Eloy, Arizona |
State of California | 3,060 | Medium | Correctional | June 2016 | Indefinite | ||||||||
| Red Rock Correctional Center (D) Eloy, Arizona |
State of Arizona | 1,596 | Medium | Correctional | January 2024 | (2) 5 year | ||||||||
| Saguaro Correctional Facility Eloy, Arizona |
State of Hawaii | 1,896 | Medium | Correctional | June 2015 | (1) 1 year | ||||||||
| CAI Boston Avenue San Diego, California |
BOP | 120 | Non-secure | Community Corrections |
May 2015 | (1) 1 year | ||||||||
| CAI Ocean View San Diego, California |
County of San Diego |
483 | Non-secure | Community Corrections |
June 2015 | (2) 1 year | ||||||||
| San Diego Correctional Facility (E) San Diego, California |
ICE | 1,154 | Minimum/ Medium |
Detention | June 2017 | (2) 3 year | ||||||||
| Bent County Correctional Facility Las Animas, Colorado |
State of Colorado | 1,420 | Medium | Correctional | June 2016 | — | ||||||||
| Crowley County Correctional Facility Olney Springs, Colorado |
State of Colorado | 1,794 | Medium | Correctional | June 2016 | — | ||||||||
| Huerfano County Correctional Center Walsenburg, Colorado |
— | 752 | Medium | Correctional | — | — | ||||||||
| Kit Carson Correctional Center Burlington, Colorado |
State of Colorado | 1,488 | Medium | Correctional | June 2016 | — | ||||||||
| Coffee Correctional Facility (F) Nicholls, Georgia |
State of Georgia | 2,312 | Medium | Correctional | June 2015 | (19) 1 year | ||||||||
| Jenkins Correctional Center (F) Millen, Georgia |
State of Georgia | 1,124 | Medium | Correctional | June 2015 | (20) 1 year | ||||||||
| McRae Correctional Facility McRae, Georgia |
BOP | 1,978 | Medium | Correctional | November 2016 | (3) 2 year | ||||||||
| Stewart Detention Center Lumpkin, Georgia |
ICE | 1,752 | Medium | Detention | Indefinite | — | ||||||||
| Wheeler Correctional Facility (F) Alamo, Georgia |
State of Georgia | 2,312 | Medium | Correctional | June 2015 | (19) 1 year | ||||||||
| Leavenworth Detention Center Leavenworth, Kansas |
USMS | 1,033 | Maximum | Detention | December 2016 | (2) 5 year | ||||||||
| Lee Adjustment Center Beattyville, Kentucky |
State of Vermont | 816 | Minimum/ Medium |
Correctional | June 2015 | — | ||||||||
12
| Facility Name |
Primary Customer |
Design Capacity (A) |
Security Level |
Facility Type (B) |
Term | Remaining Renewal Options (C) | ||||||||
| Marion Adjustment Center St. Mary, Kentucky |
— | 826 | Minimum/ Medium |
Correctional | — | — | ||||||||
| Otter Creek Correctional Center (G) Wheelwright, Kentucky |
— | 656 | Minimum/ Medium |
Correctional | — | — | ||||||||
| Prairie Correctional Facility Appleton, Minnesota |
— | 1,600 | Medium | Correctional | — | — | ||||||||
| Adams County Correctional Center Adams County, Mississippi |
BOP | 2,232 | Medium | Correctional | July 2015 | (2) 2 year | ||||||||
| Tallahatchie County Correctional Facility (H) Tutwiler, Mississippi |
State of California |
2,672 | Medium | Correctional | June 2016 | Indefinite | ||||||||
| Crossroads Correctional Center (I) Shelby, Montana |
State of Montana |
664 | Multi | Correctional | June 2015 | (2) 2 year | ||||||||
| Nevada Southern Detention Center Pahrump, Nevada |
Office of the Federal Detention Trustee |
1,072 | Medium | Detention | September 2015 | (3) 5 year | ||||||||
| Elizabeth Detention Center Elizabeth, New Jersey |
ICE | 300 | Minimum | Detention | September 2015 | (6) 1 year | ||||||||
| Cibola County Corrections Center Milan, New Mexico |
BOP | 1,129 | Medium | Correctional | September 2016 | (2) 2 year | ||||||||
| New Mexico Women’s Correctional Facility Grants, New Mexico |
State of New Mexico |
596 | Multi | Correctional | June 2015 | (1) 1 year | ||||||||
| Torrance County Detention Facility Estancia, New Mexico |
USMS | 910 | Multi | Detention | Indefinite | — | ||||||||
| Lake Erie Correctional Institution (J) Conneaut, Ohio |
State of Ohio | 1,798 | Medium | Correctional | June 2032 | Indefinite | ||||||||
| Northeast Ohio Correctional Center Youngstown, Ohio |
BOP (K) | 2,016 | Medium | Correctional | May 2015 | — | ||||||||
| Queensgate Correctional Facility Cincinnati, Ohio |
— | 850 | Medium | — | — | — | ||||||||
| Cimarron Correctional Facility (L) Cushing, Oklahoma |
State of Oklahoma |
1,692 | Medium | Correctional | June 2015 | (4) 1 year | ||||||||
| Davis Correctional Facility (L) Holdenville, Oklahoma |
State of Oklahoma |
1,670 | Medium | Correctional | June 2015 | (4) 1 year | ||||||||
| Diamondback Correctional Facility Watonga, Oklahoma |
— | 2,160 | Medium | Correctional | — | — | ||||||||
| North Fork Correctional Facility Sayre, Oklahoma |
State of California |
2,400 | Medium | Correctional | June 2016 | Indefinite | ||||||||
| West Tennessee Detention Facility Mason, Tennessee |
USMS | 600 | Multi | Detention | September 2015 | (7) 2 year | ||||||||
| Shelby Training Center Memphis, Tennessee |
— | 200 | Secure | — | — | — | ||||||||
13
| Facility Name |
Primary Customer |
Design Capacity (A) |
Security Level |
Facility Type (B) |
Term | Remaining Renewal Options (C) | ||||||||
| Whiteville Correctional Facility (M) Whiteville, Tennessee |
State of Tennessee |
1,536 | Medium | Correctional | June 2016 | — | ||||||||
| Eden Detention Center Eden, Texas |
BOP | 1,422 | Medium | Correctional | April 2015 | (1) 2 year | ||||||||
| Houston Processing Center Houston, Texas |
ICE | 1,000 | Medium | Detention | March 2015 | — | ||||||||
| Laredo Processing Center Laredo, Texas |
ICE | 258 | Minimum/ Medium |
Detention | June 2018 | — | ||||||||
| Webb County Detention Center Laredo, Texas |
USMS | 480 | Medium | Detention | November 2017 | — | ||||||||
| Mineral Wells Pre-Parole Transfer Facility Mineral Wells, Texas |
— | 2,103 | Minimum | Correctional | — | — | ||||||||
| T. Don Hutto Residential Center Taylor, Texas |
ICE | 512 | Medium | Detention | January 2020 | Indefinite | ||||||||
| South Texas Family Residential Center (N) Dilley, Texas |
ICE | 480 | Non-secure | Residential | September 2018 | — | ||||||||
| D.C. Correctional Treatment Facility (O) Washington, D.C. |
District of Columbia |
1,500 | Medium | Detention | January 2017 | — | ||||||||
| Managed Only Facilities: |
||||||||||||||
| Citrus County Detention Facility Lecanto, Florida |
Citrus County, Florida |
760 | Multi | Detention | September 2015 | Indefinite | ||||||||
| Lake City Correctional Facility Lake City, Florida |
State of Florida |
893 | Secure | Correctional | June 2016 | Indefinite | ||||||||
| Marion County Jail Indianapolis, Indiana |
Marion County, Indiana |
1,030 | Multi | Detention | December 2017 | (1) 10 year | ||||||||
| Winn Correctional Center Winnfield, Louisiana |
State of Louisiana |
1,538 | Medium/ Maximum |
Correctional | June 2020 | — | ||||||||
| Silverdale Facilities Chattanooga, Tennessee |
Hamilton County, Tennessee |
1,046 | Multi | Detention | April 2016 | — | ||||||||
| South Central Correctional Center Clifton, Tennessee |
State of Tennessee |
1,676 | Medium | Correctional | June 2016 | (1) 2 year | ||||||||
| Metro-Davidson County Detention Facility Nashville, Tennessee |
Davidson County, Tennessee |
1,348 | Multi | Detention | January 2020 | — | ||||||||
| Hardeman County Correctional Facility Whiteville, Tennessee |
State of Tennessee |
2,016 | Medium | Correctional | May 2017 | — | ||||||||
| Bartlett State Jail Bartlett, Texas |
State of Texas |
1,049 | Minimum/ Medium |
Correctional | August 2015 | (1) 2 year | ||||||||
| Bradshaw State Jail Henderson, Texas |
State of Texas |
1,980 | Minimum/ Medium |
Correctional | August 2015 | (1) 2 year | ||||||||
| Lindsey State Jail Jacksboro, Texas |
State of Texas |
1,031 | Minimum/ Medium |
Correctional | August 2015 | (1) 2 year | ||||||||
14
| Facility Name |
Primary Customer |
Design Capacity (A) |
Security Level |
Facility Type (B) |
Term | Remaining Renewal Options (C) | ||||||||
| Willacy State Jail Raymondville, Texas |
State of Texas |
1,069 | Minimum/ Medium |
Correctional | August 2015 | (1) 2 year | ||||||||
| Leased Facilities: |
||||||||||||||
| California City Correctional Center California, City, California |
CDCR | 2,560 | Medium | Owned/Leased | December 2016 | Indefinite | ||||||||
| Leo Chesney Correctional Center Live Oak, California |
GEO Group |
240 | Minimum | Owned/Leased | September 2015 | — | ||||||||
| Bridgeport Pre-Parole Transfer Facility Bridgeport, Texas |
MTC | 200 | Medium | Owned/Leased | August 2015 | (1) 2 year | ||||||||
| (A) | Design capacity measures the number of beds and, accordingly, the number of offenders each facility is designed to accommodate. Facilities housing detainees on a short term basis may exceed the original intended design capacity due to the lower level of services required by detainees in custody for a brief period. From time to time, we may evaluate the design capacity of our facilities based on customers using the facilities, and the ability to reconfigure space with minimal capital outlays. As a result, the design capacity of certain facilities may vary from the design capacity previously presented. We believe design capacity is an appropriate measure for evaluating prison operations, because the revenue generated by each facility is based on a per diem or monthly rate per inmate housed at the facility paid by the corresponding contracting governmental entity. |
| (B) | We manage numerous facilities that have more than a single function (e.g., housing both long-term sentenced adult prisoners and pre-trial detainees). The primary functional categories into which facility types are identified were determined by the relative size of inmate populations in a particular facility on December 31, 2014. If, for example, a 1,000-bed facility housed 900 adult inmates with sentences in excess of one year and 100 pre-trial detainees, the primary functional category to which it would be assigned would be that of correctional facilities and not detention facilities. It should be understood that the primary functional category to which multi-user facilities are assigned may change from time to time. |
| (C) | Remaining renewal options represents the number of renewal options, if applicable, and the term of each option renewal. |
| (D) | Pursuant to the terms of a contract awarded by the state of Arizona in September 2012, the state of Arizona has an option to purchase the Red Rock facility at any time during the term of the contract, including extension options, based on an amortization schedule starting with the fair market value and decreasing evenly to zero over the twenty year term. |
| (E) | The facility is subject to a ground lease with the County of San Diego. Upon expiration of the lease in December 2015, ownership of the facility automatically reverts to the County of San Diego. During the second half of 2015, we expect to transfer the offenders at this facility to a new facility we are constructing in Otay Mesa, California. |
| (F) | These facilities are subject to purchase options held by the Georgia Department of Corrections, or GDOC, which grants the GDOC the right to purchase the facility for the lesser of the facility’s depreciated book value, as defined, or fair market value at any time during the term of the contract between the GDOC and us. |
| (G) | In January 2012, the governor of Kentucky submitted his proposed budget which included the transfer of the inmates previously held at our Otter Creek Correctional Center to a facility owned by the Commonwealth of Kentucky by the end of July 2012. The facility is subject to a deed of conveyance with the city of Wheelwright, Kentucky which includes provisions that allow assumption of ownership by the city of Wheelwright under the following occurrences: (1) we cease to operate the facility for more than two years, (2) our failure to maintain at least one employee for a period of sixty consecutive days, or (3) a conversion to a maximum security facility based upon classification by the Kentucky Corrections Cabinet. In December 2013, we entered into an agreement with the city of Wheelwright that extends the reversion by up to two years in exchange for $20,000 per month or until we resume operations, as defined in the agreement. |
| (H) | The facility is subject to a purchase option held by the Tallahatchie County Correctional Authority which grants Tallahatchie County Correctional Authority the right to purchase the facility at any time during the contract at a price generally equal to the cost of the premises less an allowance for amortization originally over a 20-year period. The amortization period was extended through 2050 in connection with an expansion completed during the fourth quarter of 2007. |
| (I) | The state of Montana has an option to purchase the facility generally at any time during the term of the contract with us at fair market value less the sum of a pre-determined portion of per diem payments made to us by the state of Montana. |
| (J) | The state of Ohio has the irrevocable right to repurchase the facility before we may resell the facility to a third party, or if we become insolvent or are unable to meet our obligations under the management contract with the state of Ohio, at a price generally equal to the fair market value, as defined in the Real Estate Purchase Agreement. |
15
| (K) | During December 2014, we were notified by the BOP that it elected not to renew its contract at this facility upon the scheduled expiration in May 2015. We currently expect to continue to house USMS detainees at this facility pursuant to a separate contract that expires December 31, 2016, while we continue to market the space that will become available. |
| (L) | These facilities are subject to purchase options held by the Oklahoma Department of Corrections, or ODC, which grants the ODC the right to purchase the facility at its fair market value at any time during the term of the contract with ODC. |
| (M) | The state of Tennessee has the option to purchase the facility in the event of our bankruptcy, or upon an operational or financial breach, as defined, at a price equal to the book value of the facility, as defined. |
| (N) | In September 2014, we began leasing this facility and the site upon which it is being constructed from a third-party lessor. ICE began housing the first residents at the facility in the fourth quarter of 2014, and the site is expected to be ready for full capacity at 2,400 beds during the second quarter of 2015. At December 31, 2014, there were 480 beds in service at this facility. |
| (O) | The District of Columbia has the right to purchase the facility at any time during the term of the contract at a price generally equal to the present value of the remaining lease payments for the premises. Upon expiration of the lease in 2017, ownership of the facility automatically reverts to the District of Columbia. |
Facilities Under Construction or Development
As more fully described hereafter in “Management’s Discussion and Analysis of Financial Condition and Results of Operations, or MD&A, – Liquidity and Capital Resources”, we have three facilities under construction or development. The 1,492-bed Otay Mesa Detention Center is being constructed in San Diego, California, and is expected to be completed in the third quarter of 2015. We plan to offer the Otay Mesa facility to house the existing federal inmate populations at the San Diego Correctional Facility upon expiration of the ground lease at that facility on December 31, 2015. The 2,552-bed Trousdale Turner Correctional Center is being constructed in Trousdale County, Tennessee, and is expected to be completed in the fourth quarter of 2015. Under an agreement with Trousdale County, we expect the intake of inmate populations from the state of Tennessee to begin at this facility in the first quarter of 2016. We lease the South Texas Family Residential Center and the site upon which it is being constructed from a third-party lessor. In addition to the lease payments under the lease agreement, we are investing in certain leasehold improvements and furniture, fixtures, and equipment at the facility. We expect to complete these additions by the end of the second quarter of 2015 when the 2,400-bed South Texas facility is expected to be ready for full occupancy.
We believe that we benefit from the following competitive strengths:
The Largest Private Prison Operator. Our recognition as the nation’s leading private prison owner and operator provides us with significant credibility with our current and prospective clients. We believe we manage nearly 41% of all privately managed prison beds in the United States. We believe we own approximately 61% of all privately owned prison beds in the United States. We pioneered modern-day private prisons with a list of notable accomplishments, such as being the first company to design, build, and operate a private prison, the first company to manage a private maximum-security facility under a direct contract with the federal government and, most recently, the first company to purchase a government-owned correctional facility from a governmental agency in the United States and to manage the facility for the government agency. In addition to providing us with extensive experience and institutional knowledge, our size also helps us deliver value to our customers by providing purchasing power and allowing us to achieve certain economies of scale.
Available Beds within Our Existing Facilities. As of December 31, 2014, we had approximately 6,000 beds at five core facilities that are vacant and immediately available to use. We consider our core facilities to be those that were designed for adult secure correctional purposes. We have staff throughout the organization actively engaged in
16
marketing this available capacity to existing and prospective customers. Historically, we have been successful in substantially filling our inventory of available beds and the beds that we have constructed. Filling these available beds would provide substantial growth in revenues, cash flow, and earnings per share.
Attractive REIT Profile. Key characteristics of our business make us a highly attractive REIT. As of December 31, 2014, we owned or controlled 52 correctional and detention facilities containing approximately 14 million square feet which, for the year ended December 31, 2014, generated 97% of our net operating income, or our operating income before general and administrative expenses, asset impairments, depreciation, and amortization. Land and buildings comprise over 90% of our gross fixed assets. These valuable assets are located in areas with high barriers to entry, particularly due to the unique permitting and zoning requirements for correctional and detention facilities. Further, these assets are constructed primarily of concrete and steel, generally requiring lower maintenance capital expenditures than other types of commercial properties.
Since our inception, we have constructed dozens of facilities, many of which we subsequently expanded. We provide space and services under contracts with federal, state, and local government agencies that generally have credit ratings of single-A or better. In addition, a majority of our contracts have terms between one and five years, and we have historically experienced customer retention in excess of 90%, which contributes to our relatively predictable and stable revenue base. This stream of revenue combined with our low maintenance capital expenditure requirement translates into steady predictable cash flow. We believe the REIT structure also provides us with greater access to capital and flexibility to pursue growth opportunities.
Development and Expansion Opportunities. The demand for prison bed capacity in the short-term has been affected by the budget challenges many of our government partners currently face. These challenges impede our customers’ ability to construct new prison beds of their own or update older facilities, which we believe could result in further need for private sector capacity solutions in the long-term. Though we primarily promote utilization of our available bed capacity, we intend to continue to pursue build-to-suit opportunities like our 2,552-bed Trousdale Turner Correctional Center under construction in Trousdale County, Tennessee, and alternative solutions like the recently announced 2,400-bed South Texas Family Residential Center whereby we identified a site and lessor to provide residential housing and administrative buildings for ICE.
Proven Senior Management Team. Our senior management team has applied their prior experience and diverse industry expertise to improve our operations, related financial results, and capital structure. Under our senior management team’s leadership, we have created new business opportunities with customers that have not previously utilized the private corrections sector, expanded relationships with existing customers, including all three federal correctional and detention agencies, converted to a REIT, and successfully completed numerous recapitalization and refinancing transactions, resulting in increases in shareholder value and profitability. Our senior management team has an average of 19 years of experience working in the corrections industry.
Financial Flexibility. As of December 31, 2014, we had cash on hand of $74.4 million and $358.7 million available under our $900.0 million revolving credit facility, with a total weighted average effective interest rate of 3.6% on all outstanding debt, while our total weighted average maturity on all outstanding debt was 5.2 years. For the year ended December 31, 2014, our fixed charge coverage ratio was 9.1x and our debt leverage was 3.1x. During the year ended December 31, 2014, we generated $423.6 million in cash through operating activities, and as of December 31, 2014, we had net working capital of $47.0 million.
17
Our primary business strategy is to provide prison bed capacity and quality corrections services, offer a compelling value, and increase occupancy and revenue, while maintaining our position as the leading owner, operator, and manager of privatized correctional and detention facilities. We intend to consider opportunities for growth, including potential acquisitions of businesses within our line of business and those that provide complementary services, provided we believe such opportunities will broaden our market and/or increase the services we can provide to our government partners.
Own and Operate High Quality Correctional and Detention Facilities. We believe that our government partners choose an outsourced correctional service provider based primarily on availability of beds, price, and the quality of services provided. Approximately 90% of the eligible facilities we operated as of December 31, 2014 are accredited by the ACA, an independent organization of corrections industry professionals that establishes standards by which a correctional facility may gain accreditation. We believe that this percentage compares favorably to the percentage of government-operated adult prisons that are accredited by the ACA. We have experienced wardens managing our facilities, with an average of 28 years of corrections experience and an average tenure of 16 years with us.
Offer Compelling Value. We believe that our government partners also seek a compelling value and service offering when selecting an outsourced correctional services provider. We believe that we offer a cost-effective alternative to our government partners by reducing their correctional services costs while allowing them to avoid long-term pension obligations for their employees and large capital investments in new prison beds. We attempt to improve operating performance and efficiency through the following key operating initiatives: (1) standardizing supply and service purchasing practices and usage; (2) implementing a standard approach to staffing and business practices in an effort to reduce our fixed expenses; (3) improving offender management, resource consumption, and reporting procedures through the utilization of numerous technological initiatives; (4) reconfiguring facility bed space to optimize capacity utilization; and (5) improving productivity and reducing employee turnover. Through ongoing company-wide initiatives, we continue to focus on efforts to contain costs and improve operating efficiencies, ensuring continuous delivery over the long-term.
Through our strong commitment to community corrections and re-entry programs, we offer our government partners additional compelling opportunities. Our evidence-based re-entry programs, including academic education, vocational training, substance abuse treatment, life skills training, and faith-based programming, are customizable based on partner needs and are applied utilizing best practices and/or industry standards. Through our efforts in community corrections and re-entry programs, we can provide consistency and common standards across facilities. We can also serve multiple levels of government on an as-needed basis, all toward reaching the goal we share with our government partners of providing offenders with the opportunity to succeed when they are released, making our communities safer, and, ultimately, reducing recidivism.
We also intend to continue to implement a wide variety of specialized services that address the unique needs of various segments of the offender population. Because the offenders in the facilities we operate differ with respect to security levels, ages, genders, and cultures, we focus on the particular needs of an offender population and tailor our services based on local conditions and our ability to provide services on a cost-effective basis.
18
Increase Occupancy and Revenue. Our industry benefits from significant economies of scale, resulting in lower operating costs per inmate as occupancy rates increase. We are pursuing a number of initiatives intended to increase our occupancy and revenue. Our competitive cost structure offers prospective government partners a compelling solution to incarceration. The unique budgetary challenges governments are facing may cause them to further rely on us to help reduce their costs, and also cause those states that have not previously utilized the private sector to turn to the private sector to help reduce their overall costs of incarceration. We are actively pursuing these opportunities. We are also focused on renewing and enhancing the terms of our existing contracts and expanding the services we provide under those contracts. We believe the long-term growth opportunities of our business remain very attractive as insufficient bed development by our government partners should result in future demand for additional bed capacity. Increases in occupancy could result in lower operating costs per inmate, resulting in higher operating margins, cash flow, and net income.
Own and Lease Correctional Facilities. As an alternative to providing “turn-key” correctional bed space and services to our government partners, we also offer our customers an attractive portfolio of prison facilities that can be leased for various correctional needs. During the fourth quarter of 2013, we entered into an agreement to lease our California City Correctional Center to the CDCR. The lease agreement includes a three-year base term with unlimited two-year renewal options upon mutual agreement. Annual base rent during the three-year base term is fixed at $28.5 million. After the three-year base term, the rent will be increased annually by the lesser of CPI (Consumer Price Index) or 2%. We are responsible for repairs and maintenance, property taxes and property insurance, while all other aspects and costs of facility operations are the responsibility of the CDCR. The lease of this facility provided California an immediate solution to help reach its population capacity goals, and exemplified our ability to react quickly to our partners’ needs with innovative and flexible solutions that make the best use of taxpayer dollars. We intend to pursue additional opportunities like those with the CDCR to lease prison facilities to government and other third-party operators in need of correctional capacity.
As of December 31, 2014, we had cash on hand of $74.4 million and $358.7 million available under our $900.0 million revolving credit facility. None of our outstanding debt requires scheduled principal payments, and we have no debt maturities until December 2017.
Despite a challenging economic environment over the past several years, we have been able to deploy capital resources to take advantage of targeted growth opportunities, including the acquisition, expansion, and development of new correctional facilities. During 2013, we completed the acquisition of Correctional Alternatives, Inc., or CAI, a privately held San Diego, California-based community corrections company that specializes in residential re-entry, home detention, and work furlough programs for San Diego County, the BOP, and United States Pretrial and Probation. We acquired CAI as a strategic investment in a complementary business that broadens the scope of solutions we provide, expanding the range of solutions from incarceration through release, and supporting our belief in helping offenders successfully transition to society. We intend to pursue opportunities similar to the acquisition of CAI that enable us to provide additional services to our government partners while resulting in earnings and cash flow growth.
We regularly evaluate alternative uses of our cash flow in order to provide value to our stockholders. From 2008 to 2011, we purchased a total of 28.4 million shares of our common stock at an aggregate cost of $508.2 million, at an average price of $17.91,
19
representing 22.6% of the total shares of our common stock outstanding prior to the commencement of the initial stock repurchase program authorized by our Board of Directors in 2008. Further, we repurchased this $508.2 million of our common stock while simultaneously improving our leverage ratios. In February 2012, our Board of Directors terminated the stock repurchase program and commenced a quarterly cash dividend beginning in the second quarter of 2012. The quarterly dividends were subsequently increased as a result of our conversion to a REIT effective January 1, 2013, as further described hereafter. We continue to consider stock repurchases as an alternative use of our cash flow. However, under our current REIT structure we retain less cash flow, as a substantial portion of our cash generated from operations must be distributed to shareholders as a dividend.
We reorganized our corporate structure to facilitate our qualification as a REIT for federal income tax purposes effective for our taxable year beginning January 1, 2013. To qualify and be taxed as a REIT, we generally are required to distribute annually to our stockholders at least 90% of our REIT taxable income (determined without regard to the dividends paid deduction and excluding net capital gains), and are subject to regular corporate income taxes to the extent we distribute less than 100% of our REIT taxable income (including capital gains) each year. The amount, timing and frequency of future distributions, however, will be at the sole discretion of our Board of Directors and will be declared based upon various factors, many of which are beyond our control, including our financial condition and operating cash flows, the amount required to maintain qualification and taxation as a REIT and reduce any income and excise taxes that we otherwise would be required to pay, limitations on distributions in our existing and future debt instruments, our ability to utilize net operating losses, or NOLs, to offset, in whole or in part, our REIT distribution requirements, limitations on our ability to fund distributions using cash generated through our TRSs and other factors that our Board of Directors may deem relevant. Because as a REIT we are required to distribute a substantial portion of our cash generated from operations to shareholders as a dividend, growth opportunities may require more external capital resources than were required prior to our conversion to a REIT. During 2014, our Board of Directors declared a quarterly dividend of $0.51 in each quarter totaling $239.1 million for the year, compared with a total of $221.2 million during 2013 and $60.2 million during 2012 (the year before our REIT conversion).
In addition to the cash on hand and availability under our revolving credit facility, we currently expect our REIT taxable income to be less than our cash flow, primarily due to the deductibility of non-cash expenses such as depreciation on our real estate assets. This liquidity provides us with the flexibility to (i) invest in additional facility acquisitions and developments, which could include acquisitions of facilities from government partners, third parties, or additional business combinations similar to the acquisition of CAI, (ii) pay down debt, (iii) increase dividends to our shareholders, (iv) or repurchase our common stock. We also have the flexibility to issue debt or equity securities from time to time when we determine that market conditions and the opportunity to utilize the proceeds from the issuance of such securities are favorable. Such opportunities could include, but are not limited to, build-to-suit or additional acquisition opportunities that exceed our undistributed cash flow and that generate favorable investment returns.
The Corrections and Detention Industry
We believe we are well-positioned to capitalize on government outsourcing of correctional management services because of our competitive strengths, business strategy, and financial flexibility. Notwithstanding the effects the current economy could have on our government partners’ demand for prison beds in the short term, we believe the long-term trends favor an increase in the outsourcing of correctional management services. The key reasons for this
20
outsourcing trend include (unless otherwise noted, statistical references were obtained from the “Bureau of Justice Statistics Bulletin” issued by the U.S. Department of Justice in September 2014):
United States Prison Population Trends. The growth of the prison population in the United States over the past decade, combined with a lack of new prison capacity constructed by the public sector, has led to overcrowding in the state and federal prison systems. In 2013, at least 20 states and the federal prison system reported operating at or above their highest capacity measure. The federal prison system was operating at 33% above capacity at December 31, 2013.
At year-end 2013, federal and state correctional authorities had jurisdiction over approximately 1.6 million prisoners. The annual growth rate of the federal and state prison population increased 0.3% for the year ended December 31, 2013. The imprisonment rate – the number of sentenced prisoners per 100,000 residents – decreased slightly from 480 prisoners per 100,000 U.S. residents in 2012 to 478 prisoners per 100,000 U.S. residents in 2013. During 2013, populations in state prisons increased 0.5%. According to a report issued in November 2014 by the Pew Charitable Trusts, the number of state prison inmates is expected to increase 3% by 2018, according to projections collected from 34 states. This translates into an increase in inmate populations of approximately 26,000, according to the report.
The total number of prisoners under federal jurisdiction decreased 0.9% for the year ended December 31, 2013, representing the first decrease in inmates under the jurisdiction of the BOP since 1980. This decrease could indicate a shift in public policy that may reduce the number of people incarcerated in the United States. For example, in July 2014, the U.S. Sentencing Commission voted unanimously to apply a reduction in the sentencing guideline levels applicable to most federal drug trafficking offenders retroactively, meaning that many offenders currently in prison could be eligible for reduced sentences beginning November 2015. Under the guidelines, no offender would be released unless a judge reviews the case to determine whether a reduced sentence poses a risk to public safety and is otherwise appropriate. As of December 31, 2014, the federal prison system was operating at 27.5% above capacity. A reduction in federal prison populations has resulted in an increase in the cost per inmate for the public sector as the fixed cost structure is allocated over a lower population, resulting in an even greater value proposition and opportunity for the private sector.
Lack of New Prison Construction. Capital expenditures for new construction, renovations, and major repairs have decreased at the state level. According to a Bureau of Justice Statistics report issued December 11, 2013, between 1992 and 2001, capital outlays varied between $2.7 billion and $4.0 billion, comprising between 5.0% and 10.3% of total corrections expenditures during those years. Between these same years, 32 states spent at least 20% of their total corrections expenditures on capital outlays. From 2002 to 2010, capital outlays made up $2.3 billion or less each year and less than 5% of state correctional expenditures. Between these same years, only two states spent at least 20% of their total corrections expenditures on capital outlays. Further, according to the “State Expenditure Report” issued in November 2014 by the National Association of State Budget Officers, or NASBO, which analyzed state spending for actual fiscal years 2012 and 2013, and estimated fiscal year 2014, total state spending on corrections, inclusive of capital expenditures, is expected to increase 4.5% from fiscal year 2012 to fiscal year 2014. However, according to the report, 37 states have estimated that, in fiscal year 2014, capital expenditures will make up less than 2% of their total spending on corrections.
21
Aging Public Prison Facilities. According to the Bureau of Justice Statistics “Census of State and Federal Correctional Facilities” published in 2008, there are approximately 290,000 state and federal prison beds in operation in public facilities that are more than 50 years old and almost 100,000 prison beds more than 100 years old. Prison facilities that are older are typically more inefficient to staff and are more expensive to operate, including higher capital expenditures for maintenance. States such as Georgia, Colorado and others have been shuttering old inefficient facilities and replacing capacity with newer more efficient private facilities.
Acceptance of Privatization. The prisoner population, excluding detention and jail populations, housed in privately managed facilities in the United States as of December 31, 2013 was approximately 133,000. At December 31, 2013, 19.1% of federal inmates and 6.8% of state inmates were held in private facilities. Since December 31, 2000, the number of federal inmates held in private facilities has increased approximately 165%, while the number of state inmates held in private facilities has increased approximately 22%. Eighteen states had at least 5% of their prison population held in private facilities at December 31, 2013. Five states housed at least 25% of their prison population in private facilities as of December 31, 2013.
Governmental Budgeting Constraints. We believe the outsourcing of prison management services to private operators allows governments to manage increasing inmate populations while simultaneously controlling correctional costs and improving correctional services. The use of facilities owned and managed by private operators allows governments to expand prison capacity without incurring large capital commitments or debt required to increase correctional capacity. Outsourcing correctional services to private operators also enables government agencies to avoid costly long-term pension obligations. We believe these advantages translate into significant cost savings for government agencies.
Business Regulations
The industry in which we operate is subject to extensive federal, state, and local regulations, including educational, health care, and safety regulations, which are administered by many governmental and regulatory authorities. Some of the regulations are unique to the corrections industry. Facility management contracts typically include reporting requirements, supervision, and on-site monitoring by representatives of the contracting governmental agencies. Corrections officers are customarily required to meet certain training standards and, in some instances, facility personnel are required to be licensed and subject to background investigation. Certain jurisdictions also require us to award subcontracts on a competitive basis or to subcontract with businesses owned by members of minority groups. Our facilities are also subject to operational and financial audits by the governmental agencies with which we have contracts. Failure to comply with these regulations and contract requirements can result in material penalties or non-renewal or termination of facility management contracts.
In addition, private prison managers are subject to government legislation and regulation attempting to restrict the ability of private prison managers to house certain types of inmates. Legislation has been enacted in several states, and has previously been proposed in the United States Congress, containing such restrictions. Although we do not believe that existing legislation will have a material adverse effect on us, there can be no assurance that future legislation would not have such an effect.
22
Environmental Matters
Under various federal, state, and local environmental laws, ordinances and regulations, a current or previous owner or operator of real property may be liable for the costs of removal or remediation of hazardous or toxic substances on, under, or in such property. Such laws often impose liability whether or not the owner or operator knew of, or was responsible for, the presence of such hazardous or toxic substances. As an owner of correctional and detention facilities, we have been subject to these laws, ordinances, and regulations as the result of our operation and management of correctional and detention facilities. Phase I environmental assessments have been obtained on substantially all of the properties we currently own. We are not aware of any environmental matters that are expected to materially affect our financial condition or results of operations; however, if such matters are detected in the future, the costs of complying with environmental laws may adversely affect our financial condition and results of operations.
Health Insurance Portability and Accountability Act of 1996 and Privacy and Security Requirements
In 1996, Congress enacted the Health Insurance Portability and Accountability Act of 1996, or HIPAA. HIPAA was designed to improve the portability and continuity of health insurance coverage, simplify the administration of health insurance, and protect the privacy and security of health-related information.
Privacy regulations promulgated under HIPAA regulate the use and disclosure of individually identifiable health information, whether communicated electronically, on paper, or orally. The regulations also provide patients with significant rights related to understanding and controlling how their health information is used or disclosed. Security regulations promulgated under HIPAA require that covered entities, including most health care providers, health clearinghouses, group health plans, and their business associates, implement administrative, physical, and technical safeguards to protect the security of individually identifiable health information that is maintained or transmitted electronically. These privacy and security regulations require the implementation of compliance training and awareness programs for our health care service providers and selected other employees primarily associated with our employee medical plans. Further, covered entities and their business associates must provide notification to affected individuals without unreasonable delay but not to exceed 60 days of discovery of a breach of unsecured protected health information. Notification must also be made to the U.S. Department of Health and Human Services, or DHHS, and, in certain situations involving large breaches, to the media. In a final rule released in January 2013, DHHS modified the breach notification requirement by creating a presumption that all non-permitted uses or disclosures of unsecured protected health information are breaches unless the covered entity or business associate establishes that there is a low probability the information has been compromised.
Violations of the HIPAA privacy and security regulations could result in significant civil and criminal penalties, and the American Recovery and Reinvestment Act of 2009, or ARRA, has strengthened the enforcement provisions of HIPAA. ARRA broadens the applicability of the criminal penalty provisions to employees of covered entities and requires DHHS to impose penalties for violations resulting from willful neglect. ARRA also increases the amount of the civil penalties, with penalties of up to $50,000 per violation for a maximum civil penalty of $1,500,000 in a calendar year for violations of the same requirement. Further, ARRA authorizes state attorneys general to bring civil actions for injunctions or damages in response to violations that threaten the privacy of state residents. In addition, under ARRA, DHHS is required to perform periodic HIPAA compliance audits of covered entities and their business associates. DHHS conducted compliance audits of 115 covered entities in 2012 and has announced its intent to conduct additional audits.
23
In addition, there are numerous legislative and regulatory initiatives at the federal and state levels addressing the privacy and security of patient health information and other identifying information. For example, federal and various state laws and regulations strictly regulate the disclosure of patient identifiable information related to substance abuse treatment. Further, various state laws and regulations require providers and other entities to notify affected individuals in the event of a data breach involving certain types of individually identifiable health or financial information, and these requirements may be more restrictive than the regulations issued under HIPAA and ARRA. These statutes vary and could impose additional penalties and compliance costs.
Healthcare reform could have an impact on our business
The Patient Protection and Affordable Care Act, as amended by the Health Care and Education Reconciliation Act of 2010 (collectively, the “Health Reform Law”) were signed into law in the United States. Certain of the provisions that have increased our healthcare costs since 2010 include the removal of annual plan limits, the expansion of dependent child coverage up to age 26, the mandate that health plans provide 100% coverage on expanded preventive care, and, in 2014, the removal of pre-existing condition exclusions. In addition, effective with the 2014 benefit year, we are subject to the three-year Transitional Reinsurance Fee, imposed in order to finance a temporary reinsurance fund established to stabilize individual premiums purchased through the federal and state insurance exchanges. Our healthcare costs may continue to be significantly affected in the future, depending upon regulatory guidance, elements of the law that are effective as of future dates, the impact the law could have on healthcare rates in general, and our response to these changes. While much of the added cost from the Health Reform Law occurred in 2014, we anticipate added costs in the future due to provisions being phased in over time. Changes to our healthcare cost structure could have an impact on our business and operating costs.
We maintain general liability insurance for all the facilities we operate, as well as insurance in amounts we deem adequate to cover property and casualty risks, workers’ compensation, and directors and officers liability. In addition, each of our leases with third parties provides that the lessee will maintain insurance on each leased property under the lessee’s insurance policies providing for the following coverages: (i) fire, vandalism, and malicious mischief, extended coverage perils, and all physical loss perils; (ii) comprehensive general public liability (including personal injury and property damage); and (iii) workers’ compensation. Under each of these leases, we have the right to periodically review our lessees’ insurance coverage and provide input with respect thereto.
Each of our management contracts and the statutes of certain states require the maintenance of insurance. We maintain various insurance policies including employee health, workers’ compensation, automobile liability, and general liability insurance. Because we are significantly self-insured for employee health, workers’ compensation, automobile liability, and general liability insurance, the amount of our insurance expense is dependent on claims experience, and our ability to control our claims experience. Our insurance policies contain various deductibles and stop-loss amounts intended to limit our exposure for individually significant occurrences. However, the nature of our self-insurance policies provides little protection for deterioration in overall claims experience or an increase in medical costs. We are continually developing strategies to improve the management of our future loss claims but can provide no assurance that these strategies will be successful. However, unanticipated
24
additional insurance expenses resulting from adverse claims experience or an increasing cost environment for general liability and other types of insurance could adversely impact our results of operations and cash flows.
As of December 31, 2014, we employed approximately 14,040 employees. Of such employees, approximately 385 were employed at our corporate offices and approximately 13,655 were employed at our facilities and in our inmate transportation business. We employ personnel in the following areas: clerical and administrative, facility administrators/wardens, security, medical, quality assurance, transportation and scheduling, maintenance, teachers, counselors, chaplains, and other support services.
Each of the facilities we currently operate is managed as a separate operational unit by the facility administrator or warden. All of these facilities follow a standardized code of policies and procedures.
We have not experienced a strike or work stoppage at any of our facilities. Approximately 1,030 employees at five of our facilities are represented by labor unions. In the opinion of management, overall employee relations are good.
The correctional and detention facilities we own, operate, or manage, as well as those facilities we own but are managed by other operators, are subject to competition for inmates from other private prison managers. We compete primarily on the basis of bed availability, cost, the quality and range of services offered, our experience in the design, construction, and management of correctional and detention facilities, and our reputation. We compete with government agencies that are responsible for correctional facilities and a number of privatized correctional service companies, including, but not limited to, The GEO Group, Inc. and Management and Training Corporation. We also compete in some markets with small local companies that may have a better knowledge of the local conditions and may be better able to gain political and public acceptance. Other potential competitors may in the future enter into businesses competitive with us without a substantial capital investment or prior experience. We may also compete in the future for new development projects with companies that have more financial resources than we have. Competition by other companies may adversely affect the number of inmates at our facilities, which could have a material adverse effect on the operating revenue of our facilities. In addition, revenue derived from our facilities will be affected by a number of factors, including the demand for inmate beds, general economic conditions, and the age of the general population.
| ITEM 1A. | RISK FACTORS. |
As the owner and operator of correctional and detention facilities, we are subject to certain risks and uncertainties associated with, among other things, the corrections and detention industry and pending or threatened litigation in which we are involved. In addition, we are also currently subject to risks associated with our indebtedness as well as our qualification as a REIT for federal income tax purposes effective for our taxable years beginning January 1, 2013. The risks and uncertainties set forth below could cause our actual results to differ materially from those indicated in the forward-looking statements contained herein and elsewhere. The risks described below are not the only risks we face. Additional risks and uncertainties not currently known to us or those we currently deem to be immaterial may also materially and adversely affect our business operations. Any of the following risks could materially adversely affect our business, financial condition, or results of operations.
25
Risks Related to Our Business and Industry
Our results of operations are dependent on revenues generated by our jails, prisons, detention, and residential facilities, which are subject to the following risks associated with the corrections and detention industry.
We are subject to fluctuations in occupancy levels, and a decrease in occupancy levels could cause a decrease in revenues and profitability. While a substantial portion of our cost structure is fixed, a substantial portion of our revenue is generated under facility ownership and management contracts that specify per diem payments based upon daily occupancy. We are dependent upon the governmental agencies with which we have contracts to provide inmates for our managed facilities. We cannot control occupancy levels at the facilities we operate. Under a per diem rate structure, a decrease in our occupancy rates could cause a decrease in revenue and profitability. Average compensated occupancy for our facilities in operation for 2014, 2013, and 2012 was 84%, 85%, and 88%, respectively. Occupancy rates may, however, decrease below these levels in the future. When combined with relatively fixed costs for operating each facility, a decrease in occupancy levels could have a material adverse effect on our profitability.
We are dependent on government appropriations and our results of operations may be negatively affected by governmental budgetary challenges. Our cash flow is subject to the receipt of sufficient funding of, and timely payment by, contracting governmental entities. If the appropriate governmental agency does not receive sufficient appropriations to cover its contractual obligations, it may terminate our contract or delay or reduce payment to us. Any delays in payment, or the termination of a contract, could have an adverse effect on our cash flow and financial condition. In addition, federal, state and local governments are constantly under pressure to control additional spending or reduce current levels of spending. Accordingly, we have been requested and may be requested in the future to reduce our existing per diem contract rates or forego prospective increases to those rates. Further, our government partners could reduce inmate population levels in facilities we own or manage to contain their correctional costs. In addition, it may become more difficult to renew our existing contracts on favorable terms or otherwise.
Competition for inmates may adversely affect the profitability of our business. We compete with government entities and other private operators on the basis of bed availability, cost, quality and range of services offered, experience in designing, constructing, and managing facilities, and reputation of management and personnel. While there are barriers to entering the market for the ownership and management of correctional and detention facilities, these barriers may not be sufficient to limit additional competition. In addition, our government customers may assume the management of a facility that they own and we currently manage for them upon the termination of the corresponding management contract or, if such customers have capacity at their facilities, may take inmates currently housed in our facilities and transfer them to government-run facilities. Since we are paid on a per diem basis with no minimum guaranteed occupancy under most of our contracts, the loss of such inmates and resulting decrease in occupancy would cause a decrease in our revenues and profitability.
Escapes, inmate disturbances, and public resistance to privatization of correctional and detention facilities could result in our inability to obtain new contracts or the loss of existing contracts. The operation of correctional and detention facilities by private entities has not achieved complete acceptance by either governments or the public. The movement toward privatization of correctional and detention facilities has also encountered resistance from certain groups, such as labor unions and others that believe that correctional and detention facilities should only be operated by governmental agencies.
26
Moreover, negative publicity about an escape, riot or other disturbance or perceived poor operational performance, contract compliance, or other conditions at a privately managed facility may result in adverse publicity to us and the private corrections industry in general. Any of these occurrences or continued trends may make it more difficult for us to renew or maintain existing contracts or to obtain new contracts, which could have a material adverse effect on our business.
We are subject to terminations, non-renewals, or competitive re-bids of our government contracts. We typically enter into facility contracts with governmental entities for terms of up to five years, with additional renewal periods at the option of the contracting governmental agency. Notwithstanding any contractual renewal option of a contracting governmental agency, 23 of our facility contracts with the customers listed under “Business – Facility Portfolio – Facilities and Facility Management Contracts” are currently scheduled to expire on or before December 31, 2015 but have renewal options (20), or are currently scheduled to expire on or before December 31, 2015 and have no renewal options (3). Although we generally expect these customers to exercise renewal options or negotiate new contracts with us, one or more of these contracts may not be renewed by the corresponding governmental agency. In addition, these and any other contracting agencies may determine not to exercise renewal options with respect to any of our contracts in the future. Our government partners can also re-bid contracts in a competitive procurement process upon termination or non-renewal of our contract. Competitive re-bids may result from the expiration of the term of a contract, including the initial term and any renewal periods, or the early termination of a contract. Competitive re-bids are often required by applicable federal or state procurement laws periodically in order to further competitive pricing and other terms for the government agency.
During December 2014, the BOP announced that it elected not to renew its contract with us at our owned and operated 2,016-bed Northeast Ohio Correctional Center. The current contract with the BOP at this facility is scheduled to expire on May 31, 2015. We currently expect to continue to house USMS detainees at this facility pursuant to a separate contract that expires December 31, 2016, while we continue to market the space that will become available.
Based on information available at this filing, notwithstanding the contract at the Northeast Ohio Correctional Center described above, we expect to renew all other contracts that have expired or are scheduled to expire within the next twelve months. We believe our renewal rate on existing contracts remains high as a result of a variety of reasons including, but not limited to, the constrained supply of available beds within the U.S. correctional system, our ownership of the majority of the beds we operate, and the quality of our operations.
Governmental agencies typically may terminate a facility contract at any time without cause or use the possibility of termination to negotiate a lower per diem rate. In the event any of our contracts are terminated or are not renewed on favorable terms or otherwise, we may not be able to obtain additional replacement contracts. The non-renewal, termination, or competitive re-bid of any of our contracts with governmental agencies could materially adversely affect our financial condition, results of operations and liquidity, including our ability to secure new facility contracts from others.
Our ability to secure new contracts to develop and manage correctional and detention facilities depends on many factors outside our control. Our growth is generally dependent upon our ability to obtain new contracts to develop and manage correctional and detention facilities. This possible growth depends on a number of factors we cannot control, including crime rates and sentencing patterns in various jurisdictions, governmental budgetary
27
constraints, and governmental and public acceptance of privatization. The demand for our facilities and services could be adversely affected by the relaxation of enforcement efforts, leniency in conviction or parole standards and sentencing practices or through the decriminalization of certain activities that are currently proscribed by criminal laws. For instance, any changes with respect to drugs and controlled substances or illegal immigration could affect the number of persons arrested, convicted, and sentenced, thereby potentially reducing demand for correctional facilities to house them. Immigration reform laws are currently a focus for legislators and politicians at the federal, state, and local level. Legislation has also been proposed in numerous jurisdictions that could lower minimum sentences for some non-violent crimes and make more inmates eligible for early release based on good behavior. Also, sentencing alternatives under consideration could put some offenders on probation with electronic monitoring who would otherwise be incarcerated. Similarly, reductions in crime rates or resources dedicated to prevent and enforce crime could lead to reductions in arrests, convictions and sentences requiring incarceration at correctional facilities. Our policy prohibits us from engaging in lobbying or advocacy efforts that would influence enforcement efforts, parole standards, criminal laws, and sentencing policies.
Moreover, certain jurisdictions recently have required successful bidders to make a significant capital investment in connection with the financing of a particular project, a trend that will require us to have sufficient capital resources to compete effectively. We may compete for such projects with companies that have more financial resources than we have. Further, we may not be able to obtain the capital resources when needed. A prolonged downturn in the financial credit markets could make it more difficult to obtain capital resources at favorable rates of return or obtain capital resources at all.
We may face community opposition to facility location, which may adversely affect our ability to obtain new contracts. Our success in obtaining new awards and contracts sometimes depends, in part, upon our ability to locate land that can be leased or acquired, on economically favorable terms, by us or other entities working with us in conjunction with our proposal to construct and/or manage a facility. Some locations may be in or near populous areas and, therefore, may generate legal action or other forms of opposition from residents in areas surrounding a proposed site. When we select the intended project site, we attempt to conduct business in communities where local leaders and residents generally support the establishment of a privatized correctional or detention facility. Future efforts to find suitable host communities may not be successful. We may incur substantial costs in evaluating the feasibility of the development of a correctional or detention facility. As a result, we may report significant charges if we decide to abandon efforts to develop a correctional or detention facility on a particular site. In many cases, the site selection is made by the contracting governmental entity. In such cases, site selection may be made for reasons related to political and/or economic development interests and may lead to the selection of sites that have less favorable environments.
Providing family residential services subjects us to certain unique or increased risks and difficulties compared to operating our other facilities. In September 2014, we signed an amended agreement to provide safe and humane residential housing, as well as educational opportunities, to women and children under the custody of ICE, who are awaiting their due process before immigration courts. Providing this type of residential service subjects us to new risks and uncertainties that could materially adversely affect our business, financial condition, or results of operations. For instance, the new contract mandates offender to staff ratios that are higher than our typical contract, requires services unique to this contract (e.g. child care and primary education services), and limits the use of security protocols and techniques typically utilized in correctional and detention settings. These operational risks and others associated with privately managing this type of residential facility could result in higher costs associated with staffing and lead to increased litigation. In addition, in January 2015, a class action lawsuit was filed in federal district court for the District of Columbia against the Secretary of the Department of Homeland Security, or DHS, and certain ICE officials. The complaint sought to certify a class of plaintiffs, consisting of Central American mothers and children who (i) have been or will be detained in ICE family detention facilities since June 2014, (ii) have been or will be determined to have a credible fear of persecution in their home country under federal asylum laws and (iii) are eligible for release on bond pursuant to certain federal statutes but have been or will be denied such release after being subject to an ICE custody determination that took deterrence of mass migration into account. In February 2015, the court certified the class and granted the plaintiffs’ motion for a preliminary injunction, enjoining DHS from detaining class members for the purpose of deterring future immigration to the United States and from considering deterrence of such immigration as a factor in such custody determinations until a final determination has been reached on the merits of the action. We have not received any instruction from ICE on what action they intend to take in response to the court order, or how and whether it will affect our contract at the South Texas Family Residential Center. However, it is possible that this or other lawsuits could adversely affect the contract, including changes to the contract that are less beneficial to us or which impose costs (such as to repurpose the facility for other detainees), or an outright termination of the contract. Any adverse decision with regard to this contract could materially affect our financial condition and results of operations.
28
We may incur significant start-up and operating costs on new contracts before receiving related revenues, which may impact our cash flows and not be recouped. When we are awarded a contract to provide or manage a facility, we may incur significant start-up and operating expenses, including the cost of constructing the facility, purchasing equipment and staffing the facility, before we receive any payments under the contract. These expenditures could result in a significant reduction in our cash reserves and may make it more difficult for us to meet other cash obligations. In addition, a contract may be terminated prior to its scheduled expiration and as a result we may not recover these expenditures or realize any return on our investment.
Failure to comply with facility contracts or with unique and increased governmental regulation could result in material penalties or non-renewal or termination of noncompliant contracts or our other contracts to provide or manage correctional and detention facilities. The industry in which we operate is subject to extensive federal, state, and local regulations, including educational, health care, and safety regulations, which are administered by many regulatory authorities. Some of the regulations are unique to the corrections industry, some are unique to government contractors, and the combination of regulations we face is unique and complex. Facility contracts typically include reporting requirements, supervision, and on-site monitoring by representatives of the contracting governmental agencies. Corrections officers are customarily required to meet certain training standards and, in some instances, facility personnel are required to be licensed and subject to background investigation. Certain jurisdictions also require us to award subcontracts on a competitive basis or to subcontract with certain types of businesses, such as small businesses and businesses owned by members of minority groups. Our facilities are also subject to operational and financial audits by the governmental agencies with which we have contracts. Federal regulations also require federal government contractors like us to self-report evidence of certain forms of misconduct. We may not always successfully comply with these regulations and contract requirements, and failure to comply can result in material penalties, including financial penalties, non-renewal or termination of noncompliant contracts or our other facility contracts, and suspension or debarment from contracting with certain government entities.
In addition, private prison managers are subject to government legislation and regulation attempting to restrict the ability of private prison managers to house certain types of inmates, such as inmates from other jurisdictions or inmates at medium or higher security levels. Legislation has been enacted in several states, and has previously been proposed in the United States Congress, containing such restrictions. Such legislation may have an adverse effect on us.
Our inmate transportation subsidiary, TransCor, is subject to regulations promulgated by the Departments of Transportation and Justice. TransCor must also comply with the Interstate Transportation of Dangerous Criminals Act of 2000, which covers operational aspects of transporting prisoners, including, but not limited to, background checks and drug testing of employees; employee training; employee hours; staff-to-inmate ratios; prisoner restraints; communication with local law enforcement; and standards to help ensure the safety of prisoners during transport. We are subject to changes in such regulations, which could result in an increase in the cost of our transportation operations.
On September 26, 2013, the Federal Communications Commission, or FCC, which regulates interstate communications, released a Report and Order and Further Notice of Proposed Rulemaking on the subject of rate reform for interstate inmate calling services, or the ICS Order. The ICS Order was effective on February 11, 2014, subject to a stay on certain portions as a result of a pending legal challenge to the ICS Order. The ICS Order has had a significant impact on the rates that may be charged for interstate inmate calling services, or
29
ICS, which include per-minute charges, per-call charges, and ancillary charges and other fees charged in connection with such service. Primarily as a result of the ICS Order, our telephone commission revenue decreased by $0.9 million from 2013 to 2014.
The Order applies directly to ICS providers who offer their services pursuant to contracts with correctional facilities, including those that we manage. The ICS Order places limits on rates that ICS providers can charge. Even though a portion of the order is subject to the stay noted above, in anticipation of the ICS Order, our ICS providers have complied by eliminating payments to correctional facilities that would be in violation of the ICS Order.
A number of legal challenges to the ICS Order are pending and additional future challenges are possible, any of which could alter or delay the FCC’s implementation of the ICS Order. In addition, based on the ICS Order and/or the outcome of its challenges, various state commissions may consider changes to their intrastate rates. Moreover, the ICS Order seeks comment on additional measures for rate reform and the FCC has indicated that further reform of interstate and intrastate ICS rates is likely forthcoming. On October 22, 2014, the FCC issued a Further Notice of Proposed Rulemaking, or FNPRM, which sought information from the public on various inmate calling-related topics. The FNPRM further re-affirmed the FCC’s intention to establish permanent rate caps for ICS, to consider, and likely impose, a total ban on commission payments to correctional facilities for interstate calling, and to impose rate caps and a commission ban on intrastate calling. Because the FCC revised the original due date for comments in response to the FNPRM, the FCC received comments and replies through late January 2015. The impact to our revenue is limited as a significant amount of commissions paid by our ICS providers are passed along to our customers or are reserved and used for the benefit of inmates in our care. Our failure to comply with, or changes to existing regulations or adoption of new regulations in, the areas discussed above could result in further increases to our costs or reductions in our revenue.
Government agencies may investigate and audit our contracts and, if any improprieties are found, we may be required to cure those improprieties, refund revenues we have received, to forego anticipated revenues, and we may be subject to penalties and sanctions, including prohibitions on our bidding in response to RFPs. Certain of the governmental agencies with which we contract have the authority to audit and investigate our contracts with them. As part of that process, government agencies may review our performance of the contract, our pricing practices, our cost structure and our compliance with applicable performance requirements, laws, regulations and standards. The regulatory and contractual environment in which we operate is complex and many aspects of our operations remain subject to manual processes and oversight that make compliance monitoring difficult and resource intensive. A governmental agency review could result in a request to cure a performance or compliance issue, and if we are unable to do so, the failure could lead to termination of the contract in question or other contracts that we have with that governmental agency. Similarly, for contracts that actually or effectively provide for certain reimbursement of expenses, if an agency determines that we have improperly allocated costs to a specific contract, we may not be reimbursed for those costs, and we could be required to refund the amount of any such costs that have been reimbursed. If a government audit asserts improper or illegal activities by us, we may be subject to civil and criminal penalties and administrative sanctions, including termination of contracts, forfeitures of profits, suspension of payments, fines and suspension or disqualification from doing business with certain government entities. In February 2014, we reached an agreement to pay $1.0 million in compensation to the state of Idaho regarding contractual disputes related to staffing at the Idaho Correctional Center stemming in part from an audit by the Idaho Department of Corrections. In addition to the potential civil and criminal penalties and administrative sanctions noted above, any adverse determination with respect to contractual or regulatory violations could negatively impact our ability to bid in response to RFPs in one or more jurisdictions.
30
We depend on a limited number of governmental customers for a significant portion of our revenues. We currently derive, and expect to continue to derive, a significant portion of our revenues from a limited number of governmental agencies. The loss of, or a significant decrease in, business from the BOP, ICE, USMS, or various state agencies could seriously harm our financial condition and results of operations. The three primary federal governmental agencies with correctional and detention responsibilities, the BOP, ICE, and USMS, accounted for 44% of our total revenues for the fiscal year ended December 31, 2014 ($724.2 million). The USMS accounted for 17% of our total revenues for the fiscal year ended December 31, 2014 ($285.4 million), BOP accounted for 13% of our total revenues for the fiscal year ended December 31, 2014 ($217.8 million), and ICE accounted for 13% of our total revenues for the fiscal year ended December 31, 2014 ($221.0 million). Although the revenue generated from each of these agencies is derived from numerous management contracts, the loss of one or more of such contracts could have a material adverse impact on our financial condition and results of operations. As previously described herein, during December 2014, the BOP notified us that they elected not to renew their contract at our Northeast Ohio Correctional Center upon its expiration in May 2015. We generated $40.2 million in revenue from the BOP during 2014 under this contract. We expect to continue to depend upon these federal agencies and a relatively small group of other governmental customers for a significant percentage of our revenues.
The CDCR accounted for 14% of our total revenues for the fiscal year ended December 31, 2014 ($236.9 million), including the revenue we generated at our California City facility under a lease. Our management and lease agreements with the CDCR, as well as the status of legal and legislative action regarding the state of California inmate populations, are more fully described hereafter in “MD&A – Results of Operations”.
We depend upon our senior management and our ability to attract and retain sufficient qualified personnel.
The success of our business depends in large part on the ability and experience of our senior management. The unexpected loss of any of these persons could materially adversely affect our business and operations.
In addition, the services we provide are labor-intensive. When we are awarded a facility management contract or open a new facility, we must hire operating management, correctional officers, and other personnel. The success of our business requires that we attract, develop, and retain these personnel. Our inability to hire sufficient qualified personnel on a timely basis or the loss of significant numbers of personnel at existing facilities could adversely affect our business and operations. Under many of our contracts, we are subject to financial penalties for insufficient staffing.
Adverse developments in our relationship with our employees could adversely affect our business, financial condition or results of operations.
As of December 31, 2014, we employed approximately 14,040 employees. Approximately 1,030 of our employees at five of our facilities, or approximately 7% of our workforce, are represented by labor unions. We have not experienced a strike or work stoppage at any of our facilities and in the opinion of management overall employee relations are good. New executive orders, administrative rules and changes in National Labor Relations could increase organizational activity at locations where employees are currently not represented by a labor organization. Increases in organizational activity or any future work stoppages could have a material adverse effect on our business, financial condition, or results of operations.
31
We are subject to necessary insurance costs.
Workers’ compensation, auto liability, employee health, and general liability insurance represent significant costs to us. Because we are significantly self-insured for workers’ compensation, auto liability, employee health, and general liability risks, the amount of our insurance expense is dependent on claims experience, our ability to control our claims experience, and in the case of workers’ compensation and employee health, rising health care costs in general. Unanticipated additional insurance costs could adversely impact our results of operations and cash flows, and the failure to obtain or maintain any necessary insurance coverage could have a material adverse effect on us.
We may be adversely affected by inflation.
Many of our facility contracts provide for fixed fees or fees that increase by only small amounts during their terms. If, due to inflation or other causes, our operating expenses, such as wages and salaries of our employees, insurance, medical, and food costs, increase at rates faster than increases, if any, in our fees, then our profitability would be adversely affected. See “MD&A – Inflation.”
We are subject to legal proceedings associated with owning and managing correctional and detention facilities.
Our ownership and management of correctional and detention facilities, and the provision of inmate transportation services by a subsidiary, expose us to potential third-party claims or litigation by prisoners or other persons relating to personal injury or other damages resulting from contact with a facility, its managers, personnel or other prisoners, including damages arising from a prisoner’s escape from, or a disturbance or riot at, a facility we own or manage, or from the misconduct of our employees. To the extent the events serving as a basis for any potential claims are alleged or determined to constitute illegal or criminal activity, we could also be subject to criminal liability. Such liability could result in significant monetary fines and could affect our ability to bid on future contracts and retain our existing contracts. In addition, as an owner of real property, we may be subject to a variety of proceedings relating to personal injuries of persons at such facilities. The claims against our facilities may be significant and may not be covered by insurance. Even in cases covered by insurance, our deductible (or self-insured retention) may be significant.
We are subject to risks associated with ownership of real estate.
Our ownership of correctional and detention facilities subjects us to risks typically associated with investments in real estate. Investments in real estate and, in particular, correctional and detention facilities have limited or no alternative use and thus, are relatively illiquid. Therefore, our ability to divest ourselves of one or more of our facilities promptly in response to changed conditions is limited. Investments in correctional and detention facilities, in particular, subject us to risks involving potential exposure to environmental liability and uninsured loss. Our operating costs may be affected by the obligation to pay for the cost of complying with existing environmental laws, ordinances and regulations, as well as the cost of complying with future legislation. In addition, although we maintain insurance for many types of losses, there are certain types of losses, such as losses from earthquakes and acts of terrorism, which may be either uninsurable or for which it may not be economically feasible to obtain insurance coverage, in light of the substantial costs associated with such insurance. As a result, we could lose both our capital invested in, and anticipated profits from, one or more of the facilities we own. Further, it is possible to experience losses that may exceed the limits of insurance coverage.
32
In addition, our focus on facility development and expansion poses additional risks, including cost overruns caused by various factors, many of which are beyond our control, such as weather, labor conditions, and material shortages, resulting in increased construction costs. Further, if we are unable to utilize this new bed capacity, our financial results could deteriorate.
Certain of our facilities are subject to options to purchase and reversions. Eleven of our facilities are subject to an option to purchase by certain governmental agencies. Such options are exercisable by the corresponding contracting governmental entity generally at any time during the term of the respective facility contract. Certain of these purchase options are based on the depreciated book value of the facility, which essentially results in the transfer of ownership of the facility to the governmental agency at the end of the life used for accounting purposes. See “Business – Facility Portfolio – Facilities and Facility Management Contracts.” If any of these options are exercised, there exists the risk that we will be unable to invest the proceeds from the sale of the facility in one or more properties that yield as much cash flow as the property acquired by the government entity. In addition, in the event any of these options is exercised, there exists the risk that the contracting governmental agency will terminate the management contract associated with such facility. For the year ended December 31, 2014, the eleven facilities currently subject to these options generated $344.9 million in revenue (20.9% of total revenue) and incurred $250.6 million in operating expenses. Certain of the options to purchase are exercisable at prices below fair market value. See “Business – Facility Portfolio – Facilities and Facility Management Contracts.”
In addition, the ownership of two of our facilities (one of which is also subject to an option to purchase) will, upon the expiration of certain ground leases in 2015 and 2017, revert to the respective governmental agency contracting with us. See “Business – Facility Portfolio – Facilities and Facility Management Contracts.” At the time of such reversion, there exists the risk that the contracting governmental agency will terminate the contract associated with such facility. For the year ended December 31, 2014, the facilities subject to reversion generated $71.1 million in revenue (4.3% of total revenue) and incurred $53.6 million in operating expenses.
Risks related to facility construction and development activities may increase our costs related to such activities. When we are engaged to perform construction and design services for a facility, we typically act as the primary contractor and subcontract with other companies who act as the general contractors. As primary contractor, we are subject to the various risks associated with construction (including, without limitation, shortages of labor and materials, work stoppages, labor disputes, and weather interference) which could cause construction delays. In addition, we are subject to the risk that the general contractor will be unable to complete construction at the budgeted costs or be unable to fund any excess construction costs, even though we require general contractors to post construction bonds and insurance. Under such contracts, we are ultimately liable for all late delivery penalties and cost overruns.
We may be adversely affected by the rising cost and increased difficulty of obtaining adequate levels of surety credit on favorable terms.
We are often required to post bid or performance bonds issued by a surety company as a condition to bidding on or being awarded a contract. Availability and pricing of these surety commitments are subject to general market and industry conditions, among other factors. Increases in surety costs could adversely affect our operating results if we are unable to effectively pass along such increases to our customers. We cannot assure you that we will have continued access to surety credit or that we will be able to secure bonds economically, without additional collateral, or at the levels required for any potential facility development
33
or contract bids. If we are unable to obtain adequate levels of surety credit on favorable terms, we would have to rely upon letters of credit under our revolving credit facility, which could entail higher costs even if such borrowing capacity was available when desired at the time, and our ability to bid for or obtain new contracts could be impaired.
Interruption, delay or failure of the provision of our technology services or information systems, or the compromise of the security thereof, could adversely affect our business, financial condition or results of operations.
Components of our business depend significantly on effective information systems and technologies. As with all companies that utilize information systems, we are vulnerable to negative impacts if the operation of those systems is interrupted, delayed, or certain information contained therein is compromised. As a matter of course, we exchange data with our government partners and other third-party providers. We employ industry-standard methodologies to ensure the availability and security of such systems and information. Despite the security measures we have in place, and any additional measures we may implement in the future, our facilities and systems, and those of our third-party service providers, could be vulnerable to security breaches, computer viruses, lost or misplaced data, programming errors, human errors, acts of vandalism, or other events. For example, several well-known companies have recently disclosed high-profile security breaches, involving sophisticated and highly targeted attacks on their company’s infrastructure or their customers’ data, which were not recognized or detected until after such companies had been affected notwithstanding the preventative measures they had in place. Any security breach or event resulting in the interruption, delay or failure of our services or information systems, or the misappropriation, loss, or other unauthorized disclosure of customer data or confidential information, including confidential information about our employees, whether by us directly or our third-party service providers, could damage our reputation, expose us to the risks of litigation and liability, disrupt our business, result in lost business, or otherwise adversely affect our results of operations.
Risks Related to Our Indebtedness
Our indebtedness could adversely affect our financial health and prevent us from fulfilling our obligations under our debt securities.
As of December 31, 2014, we had total indebtedness of $1,200.0 million. Our indebtedness could have important consequences. For example, it could:
| • | make it more difficult for us to satisfy our obligations with respect to our indebtedness; |
| • | increase our vulnerability to general adverse economic and industry conditions; |
| • | require us to dedicate a substantial portion of our cash flow from operations to payments on our indebtedness, thereby reducing the availability of our cash flow to fund working capital, capital expenditures, dividends, and other general corporate purposes; |
| • | limit our flexibility in planning for, or reacting to, changes in our business and the industry in which we operate; |
| • | place us at a competitive disadvantage compared to our competitors that have less debt; and |
| • | limit our ability to borrow additional funds or refinance existing indebtedness on favorable terms. |
34
Our revolving credit facility and other debt instruments have restrictive covenants that could affect our financial condition.
The indentures related to our aggregate original principal amount of $325.0 million 4.125% senior notes due 2020 and $350.0 million 4.625% senior notes due 2023, referred to herein as our senior notes, and our revolving credit facility, contain financial and other restrictive covenants that limit our ability to engage in activities that may be in our long-term best interests. Our ability to borrow under our revolving credit facility is subject to compliance with certain financial covenants, including leverage and interest coverage ratios. Our revolving credit facility includes other restrictions that, among other things, limit our ability to incur indebtedness; grant liens; engage in mergers, consolidations and liquidations; make asset dispositions, restricted payments and investments; enter into transactions with affiliates; and amend, modify or prepay certain indebtedness. The indentures related to our senior notes contain limitations on our ability to effect mergers and change of control events, as well as other limitations, including limitations on the sale of assets and limitations on liens.
Our failure to comply with these covenants could result in an event of default that, if not cured or waived, could result in the acceleration of all or a substantial portion of our debts. We do not have sufficient working capital to satisfy our debt obligations in the event of an acceleration of all or a significant portion of our outstanding indebtedness.
Servicing our indebtedness will require a significant amount of cash. Our ability to generate cash depends on many factors beyond our control.
Our ability to make payments on our indebtedness, to refinance our indebtedness, and to fund planned capital expenditures will depend on our ability to generate cash in the future. This, to a certain extent, is subject to general economic, financial, competitive, legislative, regulatory, and other factors that are beyond our control.
The risk exists that our business will be unable to generate sufficient cash flow from operations or that future borrowings will not be available to us under our revolving credit facility in an amount sufficient to enable us to pay our indebtedness, including our existing senior notes, or to fund our other liquidity needs. We may need to refinance all or a portion of our indebtedness, including our senior notes, on or before maturity. We may not, however, be able to refinance any of our indebtedness, including our revolving credit facility and including our senior notes, on commercially reasonable terms or at all.
We are required to repurchase all or a portion of our senior notes upon a change of control, and our revolving credit facility is subject to acceleration upon a change in control.
Upon certain change of control events, as that term is defined in the indentures for our senior notes, including a change of control caused by an unsolicited third party, we are required to make an offer in cash to repurchase all or any part of each holder’s notes at a repurchase price equal to 101% of the principal thereof, plus accrued interest. The source of funds for any such repurchase would be our available cash or cash generated from operations or other sources, including borrowings, sales of equity or funds provided by a new controlling person or entity. Sufficient funds may not be available to us, however, at the time of any change of control event to repurchase all or a portion of the tendered notes pursuant to this requirement. Our failure to offer to repurchase notes, or to repurchase notes tendered, following a change
35
of control will result in a default under the respective indentures, which could lead to a cross-default under our revolving credit facility and under the terms of our other indebtedness. In addition, our revolving credit facility which is subject to acceleration upon the occurrence of a change in control (as described therein), may prohibit us from making any such required repurchases. Prior to repurchasing the notes upon a change of control event, we must either repay outstanding indebtedness under our revolving credit facility or obtain the consent of the lenders under our revolving credit facility. If we do not obtain the required consents or repay our outstanding indebtedness under our revolving credit facility, we would remain effectively prohibited from offering to purchase the notes.
Despite current indebtedness levels, we may still incur more debt.
The terms of the indentures for our senior notes and our revolving credit facility restrict our ability to incur indebtedness; however, we may nevertheless incur additional indebtedness in the future and in the future, we may refinance all or a portion of our indebtedness, including our revolving credit facility, and may incur additional indebtedness as a result. As of December 31, 2014, we had $358.7 million of additional borrowing capacity available under our $900.0 million revolving credit facility. In addition, we may issue an indeterminate amount of debt securities from time to time when we determine that market conditions and the opportunity to utilize the proceeds from the issuance of such securities are favorable. If new debt is added to our and our subsidiaries’ current debt levels, the related risks that we and they now face could intensify.
Our access to capital may be affected by general macroeconomic conditions.
During the financial crisis in 2008 and 2009, several large financial institutions failed while others became dependent on the assistance of the federal government to continue to operate as going concerns. We can provide no assurance that the banks that have made commitments under our revolving credit facility will continue to operate as going concerns in the future. If any of the banks in the lending group were to fail, it is possible that the capacity under the revolving credit facility would be reduced. In the event that the availability under the revolving credit facility was reduced significantly, we could be required to obtain capital from alternate sources in order to continue with our business and capital strategies. Our options for addressing such capital constraints would include, but not be limited to (i) delaying certain capital expenditure projects, (ii) obtaining commitments from the remaining banks in the lending group or from new banks to fund increased amounts under the terms of the revolving credit facility, (iii) accessing the public capital markets, or (iv) reducing our dividend (but not less than amounts required to maintain our status as a REIT). Such alternatives could be on terms less favorable than under existing terms, which could have a material effect on our consolidated financial position, results of operations, or cash flows.
Rising interest rates would increase the cost of our variable rate debt.
We have incurred and expect in the future to incur indebtedness that bears interest at variable rates. Accordingly, increases in interest rates would increase our interest costs, which could have a material adverse effect on us and our ability to make distributions to our stockholders and pay amounts due on our debt or cause us to be in default under certain debt instruments. In addition, an increase in market interest rates may lead holders of our common stock to demand a higher yield on their shares from distributions by us, which could adversely affect the market price for our common stock.
36
Risks Related to our REIT Structure
If we fail to remain qualified as a REIT, we would be subject to corporate income taxes and would not be able to deduct distributions to stockholders when computing our taxable income.
We currently operate in a manner that is intended to allow us to qualify as a REIT for federal income tax purposes commencing with our taxable year beginning January 1, 2013. However, we cannot assure you that we have qualified or will remain qualified as a REIT. Qualification as a REIT requires us to satisfy numerous requirements established under highly technical and complex sections of the Internal Revenue Code of 1986, as amended, (the “Code”), which may change from time to time and for which there are only limited judicial and administrative interpretations, and involves the determination of various factual matters and circumstances not entirely within our control. For example, in order to qualify as a REIT, the REIT must derive at least 95% of its gross income in any year from qualifying sources. In addition, a REIT is required to distribute annually to its stockholders at least 90% of the REIT taxable income (determined without regard to the dividends paid deduction and by excluding capital gains) and must satisfy specified asset tests on a quarterly basis.
If we fail to qualify as a REIT in any taxable year, we would be subject to federal income tax (including any applicable alternative minimum tax) on our taxable income computed in the usual manner for corporate taxpayers without deduction for distributions to our stockholders and we may need to borrow additional funds or issue securities to pay such additional tax liability. Any such corporate income tax liability could be substantial and would reduce the amount of cash available for other purposes because, unless we are entitled to relief under certain statutory provisions, we would be taxable as a C-corporation, beginning in the year in which the failure occurs, and we would not be allowed to re-elect to be taxed as a REIT for the following four years.
Even if we remain qualified as a REIT, we may owe penalty taxes under certain circumstances.
Even though we qualify as a REIT, we will be subject to certain U.S. federal, state and local taxes on our income and property, on taxable income that we do not distribute to our stockholders, and on net income from certain “prohibited transactions”. In addition, the REIT provisions of the Code are complex and are not always subject to clear interpretation. For example, a REIT must derive 95% of its gross income in any year from qualifying sources, including rents from real property. Rents from real property includes amounts received for the use of limited amounts of personal property and for certain services. Whether amounts constitute rents from real property or other qualifying income may not be entirely clear in all cases. We may fail to qualify as a REIT if we exceed the permissible amounts of non-qualifying income unless such failures qualify under certain statutory relief provisions. Even if we qualify for statutory relief, we may be required to pay an excise or penalty tax (which could be significant in amount) in order to utilize one or more such relief provisions under the Code to maintain our qualification as a REIT. Furthermore, we conduct substantial activities through TRSs, and the income of those subsidiaries will be subject to U.S. federal income tax at regular corporate rates.
To maintain our REIT status, we may be forced to obtain capital during unfavorable market conditions, which could adversely affect our overall financial performance.
In order to qualify as a REIT, we will be required each year to distribute to our stockholders at least 90% of our REIT taxable income (determined without regard to the dividends paid deduction and by excluding any net capital gain) and we will be subject to tax to the extent
37
our net taxable income (including net capital gain) is not fully distributed. In addition, we will be subject to a 4% nondeductible excise tax on the amount, if any, by which distributions we pay in any calendar year are less than the sum of 85% of our ordinary income, 95% of our net capital gains, and 100% of our undistributed income from prior years. We intend to continue to make distributions to our shareholders to comply with the distribution requirements of the Code as well as to reduce our exposure to federal income taxes and the nondeductible excise tax. Differences in timing between the receipt of income and the payment of expenses to arrive at taxable income, along with the effect of required debt amortization payments, could require us to borrow funds on a short-term basis to meet the distribution requirements that are necessary to achieve the tax benefits associated with qualifying as a REIT. We may acquire additional capital through our issuance of securities senior to our common stock, including additional borrowings or other indebtedness or the issuance of additional securities. Issuance of such senior securities creates additional risks because leverage is a speculative technique that may adversely affect common stockholders. If the return on assets acquired with borrowed funds or other leverage proceeds does not exceed the cost of the leverage, the use of leverage could negatively affect our cash flow.
Additionally, the issuance of senior securities involves offering expenses and other costs, including interest payments, which are borne indirectly by our common stockholders. Fluctuations in interest rates could increase interest payments on our senior securities, and could reduce cash available for distribution on common stock. Increased operating costs, including the financing cost associated with any leverage, may reduce our total return to common stockholders. Rating agency guidelines applicable to any senior securities may impose asset coverage requirements, dividend limitations, voting right requirements (in the case of the senior equity securities), and other restrictions. Further, the terms of any senior securities or other borrowings may impose additional requirements, restrictions and limitations that are more stringent than those required by a rating agency that rates outstanding senior securities that may have an adverse effect on us and may affect our ability to pay distributions to our stockholders. On the other hand, we may not be able to raise such additional capital in the future on favorable terms or at all. Unfavorable economic conditions could increase our funding costs, limit our access to the capital markets or result in a decision by lenders not to extend credit to us.
Further, in order to maintain our REIT status, we may need to borrow funds to meet the REIT distribution requirements even if the then-prevailing market conditions are not favorable for these borrowings. These borrowing needs could result from differences in timing between the actual receipt of cash and inclusion of income for federal income tax purposes, or the effect of non-deductible capital expenditures, the creation of reserves or required debt or amortization payments. Our ability to access debt and equity capital on favorable terms or at all is dependent upon a number of factors, including general market conditions, the market’s perception of our growth potential, our current and potential future earnings and cash distributions and the market price of our securities. Issuance of debt or equity securities will expose us to typical risks associated with leverage, including increased risk of loss.
To the extent our ability to issue debt or other senior securities such as preferred stock is constrained, we may depend on issuance of additional shares of common stock to finance new investments. If we raise additional funds by issuing more shares of our common stock or senior securities convertible into, or exchangeable for, shares of our common stock, the percentage ownership of our stockholders at that time would decrease, and you may experience dilution.
38
There are uncertainties relating to our estimate of the E&P Distribution.
To qualify for taxation as a REIT effective for the year ended December 31, 2013, we were required to distribute to our stockholders on or before December 31, 2013, our undistributed accumulated earnings and profits attributable to taxable periods ending prior to January 1, 2013. On May 20, 2013, we distributed $675.0 million to shareholders of record as of April 19, 2013 in satisfaction of this requirement (the “E&P Distribution”). We believe that the total value of the E&P Distribution was sufficient to fully distribute our accumulated earnings and profits and that a portion of the E&P Distribution exceeded our accumulated earnings and profits. However, the amount of our accumulated earnings and profits is a complex factual and legal determination. We may have had less than complete information at the time we estimated our earnings and profits or may have interpreted the applicable law differently from the IRS. Substantial uncertainties exist relating to the computation of our undistributed accumulated earnings and profits, including the possibility that the IRS could, in auditing tax years through 2012, successfully assert that our taxable income should be increased, which could increase our pre-REIT accumulated earnings and profits. Thus, we could fail to satisfy the requirement that we distribute all of our pre-REIT accumulated earnings and profits by the close of our first taxable year as a REIT. Moreover, although there are procedures available to cure a failure to distribute all of our pre-REIT accumulated earnings and profits, we cannot now determine whether we would be able to take advantage of them or the economic impact to us of doing so.
Performing services through our TRSs may increase our overall tax liability relative to other REITs or subject us to certain excise taxes.
A TRS may hold assets and earn income, including income earned from the performance of correctional services, that would not be qualifying assets or income if held or earned directly by a REIT. We conduct a significant portion of our business activities through our TRSs. Our TRSs are subject to federal, foreign, state and local income tax on their taxable income, and their after-tax net income generally is available for distribution to us but is not required to be distributed to us. The TRS rules also impose a 100% excise tax on certain transactions between a TRS and its parent REIT that are not conducted on an arm’s-length basis. In addition, the TRS rules limit the deductibility of interest paid or accrued by a TRS to its parent REIT to ensure that the TRS is subject to an appropriate level of corporate income taxation. We believe our arrangements with our TRSs are on arm’s-length terms and intend to continue to operate in a manner that allows us to avoid incurring the 100% excise tax described above. There can be no assurance, however, that we will be able to avoid application of the 100% excise tax or the limitations on interest deductions discussed above.
The value of the securities we own in our TRS is limited under the REIT asset tests.
Under the Code, no more than 25% of the value of the gross assets of a REIT may be represented by securities of one or more TRSs. This limitation may affect our ability to increase the size of our TRSs’ operations and assets, and there can be no assurance that we will be able to comply with the 25% limitation. If we are unable to comply with the 25% limitation, we would fail to qualify as a REIT. Furthermore, our significant use of TRSs may cause the market to value shares of our common stock differently than the stock of other REITs, which may not use TRSs as extensively. Although we intend to monitor the value of our investments in TRSs, there can be no assurance that we will be able to comply with the 25% limitation discussed above.
39
We may be limited in our ability to fund distributions using cash generated through our TRSs.
At least 75% of gross income for each taxable year as a REIT must be derived from passive real estate sources and no more than 25% of gross income may consist of dividends from our TRSs and other non-real estate income. This limitation on our ability to receive dividends from our TRSs may affect our ability to fund cash distributions to our stockholders using cash from our TRSs. Moreover, our TRSs are not required to distribute their net income to us, and any income of our TRSs that is not distributed to us will not be subject to the REIT income distribution requirement.
REIT ownership limitations may restrict or prevent you from engaging in certain transfers of our common stock.
In order to satisfy the requirements for REIT qualification, no more than 50% in value of all classes or series of our outstanding shares of stock may be owned, actually or constructively, by five or fewer individuals (as defined in the Code to include certain entities) at any time during the last half of each taxable year beginning with our 2014 taxable year. To assist us in satisfying this share ownership requirement, our charter imposes ownership limits on each class and series of our shares of stock. Under applicable constructive ownership rules, any shares of stock owned by certain affiliated owners generally would be added together for purposes of the common stock ownership limits, and any shares of a given class or series of preferred stock owned by certain affiliated owners generally would be added together for purposes of the ownership limit on such class or series.
If anyone transfers shares of our common stock in a manner that would violate the ownership limits, or prevent us from qualifying as a REIT under the federal income tax laws, those shares of common stock instead would be transferred to a trust for the benefit of a charitable beneficiary and will be either redeemed by us or sold to a person whose ownership of the shares will not violate the ownership limit. If this transfer to a trust fails to prevent such a violation or fails to permit our continued qualification as a REIT, then the initial intended transfer would be null and void from the outset. The intended transferee of those shares will be deemed never to have owned the shares. Anyone who acquires shares in violation of the ownership limit or the other restrictions on transfer bears the risk of suffering a financial loss when the shares of common stock are redeemed or sold if the market price of our shares of common stock falls between the date of purchase and the date of redemption or sale.
Complying with REIT requirements may cause us to forego otherwise attractive opportunities or liquidate otherwise attractive investments.
To qualify as a REIT for federal income tax purposes, we must continually satisfy tests concerning, among other things, the sources of our income, the nature and diversification of our assets, the amounts we distribute to our stockholders and the ownership of our common stock. If we fail to comply with one or more of the asset tests at the end of any calendar quarter, we must correct the failure within 30 days after the end of the calendar quarter or qualify for certain statutory relief provisions to avoid losing our REIT qualification and suffering adverse tax consequences. In order to meet these tests, we may be required to forego investments we might otherwise make or to liquidate otherwise attractive investments. Thus, compliance with the REIT requirements may hinder our performance and reduce amounts available for distribution to our stockholders.
40
The tax imposed on REITs engaging in “prohibited transactions” may limit our ability to engage in transactions which would be treated as sales for federal income tax purposes.
A REIT’s net income from prohibited transactions is subject to a 100% penalty tax. In general, prohibited transactions are sales or other dispositions of property, other than foreclosure property, held primarily for sale to customers in the ordinary course of business. Although we do not intend to hold any properties that would be characterized as held for sale to customers in the ordinary course of our business, unless a sale or disposition qualifies under certain statutory safe harbors, such characterization is a factual determination and no guarantee can be given that the IRS would agree with our characterization of our properties or that we will always be able to make use of the available safe harbors.
We have not established a minimum distribution payment level, and we may be unable to generate sufficient cash flows from our operations to make distributions to our stockholders at any time in the future.
We are generally required to distribute to our stockholders at least 90% of our net taxable income (excluding net capital gains) each year to qualify as a REIT under the Code. To the extent we satisfy the 90% distribution requirement but distribute less than 100% of our net taxable income (including net capital gains), we will be subject to federal corporate income tax on our undistributed net taxable income. We intend to distribute at least 100% of our net taxable income (excluding net capital gains). However, our ability to make distributions to our stockholders may be adversely affected by the issues described in the risk factors set forth in this annual report. Subject to satisfying the requirements for REIT qualification, we intend to continue to make regular quarterly distributions to our stockholders. Our Board of Directors has the sole discretion to determine the timing, form and amount of any distributions to our stockholders. Our Board of Directors makes determinations regarding distributions based upon, among other factors, our historical and projected results of operations, financial condition, cash flows and liquidity, satisfaction of the requirements for REIT qualification and other tax considerations, capital expenditure and other expense obligations, debt covenants, contractual prohibitions or other limitations and applicable law and such other matters as our Board of Directors may deem relevant from time to time. Among the factors that could impair our ability to make distributions to our stockholders are:
| • | our inability to realize attractive returns on our investments; |
| • | unanticipated expenses that reduce our cash flow or non-cash earnings; |
| • | decreases in the value of the underlying assets; and |
| • | the fact that anticipated operating expense levels may not prove accurate, as actual results may vary from estimates. |
As a result, it is possible that we will not be able to continue to make distributions to our stockholders or that the level of any distributions we do make to our stockholders will achieve a market yield or increase or even be maintained over time, any of which could materially and adversely affect the market price of our shares of common stock. Distributions could be dilutive to our financial results and may constitute a return of capital to our investors, which would have the effect of reducing each shareholder’s basis in its shares of common stock. We also could use borrowed funds or proceeds from the sale of assets to fund distributions.
41
Dividends payable by REITs, including us, generally do not qualify for the reduced tax rates available for some dividends.
“Qualified dividends” payable to U.S. stockholders that are individuals, trusts and estates generally are subject to tax at preferential rates. Subject to limited exceptions, dividends payable by REITs are not eligible for these reduced rates and are taxable at ordinary income tax rates. The more favorable rates applicable to regular corporate qualified dividends could cause investors who are individuals, trusts and estates to perceive investments in REITs to be relatively less attractive than investments in the stocks of non-REIT corporations that pay dividends, which could adversely affect the value of the shares of REITs, including the shares of our common stock.
Distributions that we make to our stockholders are treated as dividends to the extent of our earnings and profits as determined for federal income tax purposes and are generally taxable to our stockholders as ordinary income. However, our dividends are eligible for the lower rate applicable to “qualified dividends” to the extent they are attributable to income that was previously subject to corporate income tax, such as the dividends we receive from our TRSs. Also, a portion of our distributions may be designated by us as long-term capital gains to the extent that they are attributable to capital gain income recognized by us. Our distributions may constitute a return of capital to the extent that they exceed our earnings and profits as determined for federal income tax purposes. A return of capital generally is not taxable, but has the effect of reducing the basis of a shareholder’s investment in our shares of common stock. Any such distributions that exceed a shareholder’s tax basis in our shares of common stock generally will be taxable as capital gains.
We could have potential deferred and contingent tax liabilities from our REIT conversion that could limit, delay or impede future sales of our properties.
Even though we qualify for taxation as a REIT, if we acquire any asset from a corporation which is or has been a C-Corporation in a transaction in which the basis of the asset in our hands is less than the fair market value of the asset (including as a result of the REIT conversion), in each case determined at the time we acquired the asset, and we subsequently recognize gain on the disposition of the asset during the ten-year period beginning on the date on which we acquired the asset, then we will be required to pay tax at the highest regular corporate tax rate on this gain to the extent of the excess of (a) the fair market value of the asset over (b) its adjusted basis in the asset, in each case determined as of the date on which we acquired the asset. These requirements could limit, delay or impede future sales of our properties. We currently do not expect to sell any asset if the sale would result in the imposition of a material tax liability. We cannot, however, assure you that we will not change our plans in this regard.
Legislative or regulatory action affecting REITs could adversely affect us or our stockholders.
In recent years, numerous legislative, judicial and administrative changes have been made to the federal income tax laws applicable to investments in REITs and similar entities. At any time, the federal income tax laws governing REITs or the administrative interpretations of those laws may be amended. Changes to the tax laws, regulations and administrative interpretations, which may have retroactive application, could adversely affect us and may impact our taxation or that of our stockholders. Accordingly, we cannot assure you that any such change will not significantly affect our ability to qualify for taxation as a REIT or the federal income tax consequences to us of such qualification.
42
Other Risks Related to Our Securities
The market price of our equity securities may vary substantially, which may limit our stockholders’ ability to liquidate their investment.
The trading prices of equity securities issued by REITs have historically been affected by changes in market interest rates. One of the factors that may influence the price of our common stock in public trading markets is the annual yield from distributions on our common stock as compared to yields on other financial instruments. An increase in market interest rates, or a decrease in our distributions to stockholders, may lead prospective purchasers of our shares to demand a higher annual yield, which could reduce the market price of our equity securities.
Other factors that could affect the market price of our equity securities include the following:
| • | actual or anticipated variations in our quarterly results of operations; |
| • | changes in market valuations of companies in the corrections or detention industries; |
| • | changes in expectations of future financial performance or changes in estimates of securities analysts; |
| • | fluctuations in stock market prices and volumes; |
| • | issuances of common shares or other securities in the future; and |
| • | announcements by us or our competitors of acquisitions, investments or strategic actions. |
The number of shares of our common stock available for future sale could adversely affect the market price of our common stock.
We cannot predict the effect, if any, of future sales of common stock, or the availability of common stock for future sale, on the market price of our common stock. Sales of substantial amounts of common stock (including stock issued under equity compensation plans), or the perception that these sales could occur, may adversely affect prevailing market prices for our common stock.
Future offerings of debt or equity securities ranking senior to our common stock or incurrence of debt (including under our revolving credit facility) may adversely affect the market price of our common stock.
If we decide to issue debt or equity securities in the future ranking senior to our common stock or otherwise incur indebtedness (including under our revolving credit facility), it is possible that these securities or indebtedness will be governed by an indenture or other instrument containing covenants restricting our operating flexibility and limiting our ability to make distributions to our stockholders. Additionally, any convertible or exchangeable securities that we issue in the future may have rights, preferences and privileges, including with respect to distributions, more favorable than those of our common stock and may result in dilution to owners of our common stock. Because our decision to issue debt or equity securities in any future offering or otherwise incur indebtedness will depend on market conditions and other factors beyond our control, we cannot predict or estimate the amount, timing or nature of our future offerings or financings, any of which could reduce the market price of our common stock and dilute the value of our common stock.
43
Our issuance of preferred stock could adversely affect holders of our common stock and discourage a takeover.
Our Board of Directors has the authority to issue up to 50.0 million shares of preferred stock without any action on the part of our stockholders. Our Board of Directors also has the authority, without stockholder approval, to set the terms of any new series of preferred stock that may be issued, including voting rights, dividend rights, liquidation rights and other preferences superior to our common stock. In the event that we issue shares of preferred stock in the future that have preferences superior to our common stock, the rights of the holders of our common stock or the market price of our common stock could be adversely affected. In addition, the ability of our Board of Directors to issue shares of preferred stock without any action on the part of our stockholders may impede a takeover of us and discourage or prevent a transaction favorable to our stockholders.
Our charter and bylaws and Maryland law could make it difficult for a third party to acquire our company.
The Maryland General Corporation Law and our charter and bylaws contain provisions that could delay, deter, or prevent a change in control of our company or our management. These provisions could also discourage proxy contests and make it more difficult for our stockholders to elect directors and take other corporate actions. These provisions:
| • | authorize us to issue “blank check” preferred stock, which is preferred stock that can be created and issued by our Board of Directors, without stockholder approval, with rights senior to those of common stock; |
| • | provide that directors may be removed with or without cause only by the affirmative vote of at least a majority of the votes of shares entitled to vote thereon; and |
| • | establish advance notice requirements for submitting nominations for election to the Board of Directors and for proposing matters that can be acted upon by stockholders at a meeting. |
We are also subject to anti-takeover provisions under Maryland law, which could delay or prevent a change of control. Together, these provisions of our charter and bylaws and Maryland law may discourage transactions that otherwise could provide for the payment of a premium over prevailing market prices for our common stock, and also could limit the price that investors are willing to pay in the future for shares of our common stock.
| ITEM 1B. | UNRESOLVED STAFF COMMENTS. |
None.
| ITEM 2. | PROPERTIES. |
The properties we owned at December 31, 2014 are described under Item 1 and in Note 4 of the Notes to the Consolidated Financial Statements contained in this Annual Report, as well as in Schedule III in Part IV to this Annual Report.
| ITEM 3. | LEGAL PROCEEDINGS. |
The information required under this section is described in Note 15 of the Notes to the Consolidated Financial Statements contained in this Annual Report.
44
| ITEM 4. | MINE SAFETY DISCLOSURES |
None.
| ITEM 5. | MARKET FOR REGISTRANT’S COMMON EQUITY, RELATED STOCKHOLDER MATTERS AND ISSUER PURCHASES OF EQUITY SECURITIES. |
Market Price of and Distributions on Capital Stock
Our common stock is traded on the New York Stock Exchange, or NYSE, under the symbol “CXW.” On February 17, 2015 the last reported sale price of our common stock was $40.11 per share and there were approximately 3,500 registered holders and approximately 48,000 beneficial holders, respectively, of our common stock.
The following table sets forth, for the fiscal quarters indicated, the range of high and low sales prices of the common stock.
Common Stock
| SALES PRICE | ||||||||
| HIGH | LOW | |||||||
| FISCAL YEAR 2014 |
||||||||
| First Quarter |
$ | 34.73 | $ | 30.37 | ||||
| Second Quarter |
$ | 33.79 | $ | 30.77 | ||||
| Third Quarter |
$ | 36.09 | $ | 32.05 | ||||
| Fourth Quarter |
$ | 38.60 | $ | 32.74 | ||||
| SALES PRICE | ||||||||
| HIGH | LOW | |||||||
| FISCAL YEAR 2013 |
||||||||
| First Quarter |
$ | 39.31 | $ | 36.11 | ||||
| Second Quarter |
$ | 41.40 | $ | 32.25 | ||||
| Third Quarter |
$ | 35.75 | $ | 31.10 | ||||
| Fourth Quarter |
$ | 38.13 | $ | 31.86 | ||||
During 2013 and 2014, CCA’s Board of Directors declared the following quarterly dividends on its common stock:
| Declaration Date |
Record Date |
Payable Date |
Per Share |
|||||
| February 22, 2013 |
April 3, 2013 | April 15, 2013 | $ | 0.53 | ||||
| May 16, 2013 |
July 3, 2013 | July 15, 2013 | $ | 0.48 | ||||
| August 16, 2013 |
October 2, 2013 | October 15, 2013 | $ | 0.48 | ||||
| December 12, 2013 |
January 2, 2014 | January 15, 2014 | $ | 0.48 | ||||
| February 20, 2014 |
April 2, 2014 | April 15, 2014 | $ | 0.51 | ||||
| May 15, 2014 |
July 2, 2014 | July 15, 2014 | $ | 0.51 | ||||
| August 14, 2014 |
October 2, 2014 | October 15, 2014 | $ | 0.51 | ||||
| December 11, 2014 |
January 2, 2015 | January 15, 2015 | $ | 0.51 | ||||
In addition, on April 8, 2013, CCA’s Board of Directors declared a special dividend to shareholders of $675.0 million, or approximately $6.66 per share of common stock, in
45
connection with CCA’s previously announced plan to qualify and convert to a REIT for federal income tax purposes effective as of January 1, 2013. The special dividend was paid in satisfaction of requirements that CCA distribute its previously undistributed accumulated earnings and profits attributable to tax periods ending prior to January 1, 2013. CCA paid the special dividend on May 20, 2013 to shareholders of record as of April 19, 2013.
Each CCA shareholder could elect to receive payment of the special dividend either in all cash, all shares of CCA common stock or a combination of cash and CCA common stock, with the total amount of cash payable to shareholders limited to a maximum of 20% of the total value of the special dividend, or $135.0 million. The total amount of cash elected by shareholders exceeded 20% of the total value of the special dividend. As a result, the cash payment was prorated among those shareholders who elected to receive cash, and the remaining portion of the special dividend was paid in shares of CCA common stock. The total number of shares of CCA common stock distributed pursuant to the special dividend was 13.9 million and was determined based on shareholder elections and the average closing price per share of CCA common stock on the New York Stock Exchange for the three trading days after May 9, 2013, or $38.90 per share.
In order to qualify as a REIT, we are required each year to distribute to our stockholders at least 90% of our REIT taxable income (determined without regard to the dividends paid deduction and excluding net capital gains) and we will be subject to tax to the extent our net taxable income (including net capital gains) is not fully distributed. While we intend to continue paying regular quarterly cash dividends at levels expected to fully distribute our annual REIT taxable income, future dividends will be paid at the discretion of our Board of Directors and will depend on our future earnings, our capital requirements, our financial condition, alternative uses of capital, the annual distribution requirements under the REIT provisions of the Code and on such other factors as our Board of Directors may consider relevant.
Issuer Purchases of Equity Securities
None.
| ITEM 6. | SELECTED FINANCIAL DATA. |
The following selected financial data for the five years ended December 31, 2014, was derived from our consolidated financial statements and the related notes thereto after any applicable reclassification of discontinued operations. This data should be read in conjunction with our audited consolidated financial statements, including the related notes, and “Management’s Discussion and Analysis of Financial Condition and Results of Operations.” Our audited consolidated financial statements, including the related notes, as of December 31, 2014 and 2013, and for the years ended December 31, 2014, 2013, and 2012 are included in this Annual Report.
46
CORRECTIONS CORPORATION OF AMERICA AND SUBSIDIARIES
SELECTED HISTORICAL FINANCIAL INFORMATION
(in thousands, except per share data)
| For the Years Ended December 31, | ||||||||||||||||||||
| 2014 | 2013 | 2012 | 2011 | 2010 | ||||||||||||||||
| STATEMENT OF OPERATIONS: |
||||||||||||||||||||
| Revenues |
$ | 1,646,867 | $ | 1,694,297 | $ | 1,723,657 | $ | 1,688,805 | $ | 1,628,217 | ||||||||||
|
|
|
|
|
|
|
|
|
|
|
|||||||||||
| Expenses: |
||||||||||||||||||||
| Operating |
1,156,135 | 1,220,351 | 1,217,051 | 1,158,269 | 1,120,094 | |||||||||||||||
| General and administrative |
106,429 | 103,590 | 88,935 | 91,227 | 84,148 | |||||||||||||||
| Depreciation and amortization |
113,925 | 112,692 | 113,063 | 107,568 | 103,073 | |||||||||||||||
| Asset impairments |
30,082 | 6,513 | — | — | — | |||||||||||||||
|
|
|
|
|
|
|
|
|
|
|
|||||||||||
| 1,406,571 | 1,443,146 | 1,419,049 | 1,357,064 | 1,307,315 | ||||||||||||||||
|
|
|
|
|
|
|
|
|
|
|
|||||||||||
| Operating income |
240,296 | 251,151 | 304,608 | 331,741 | 320,902 | |||||||||||||||
|
|
|
|
|
|
|
|
|
|
|
|||||||||||
| Other (income) expense: |
||||||||||||||||||||
| Interest expense, net |
39,535 | 45,126 | 58,363 | 72,940 | 71,127 | |||||||||||||||
| Expenses associated with debt refinancing transactions |
— | 36,528 | 2,099 | — | — | |||||||||||||||
| Other (income) expense |
(1,204 | ) | (100 | ) | (333 | ) | 305 | 42 | ||||||||||||
|
|
|
|
|
|
|
|
|
|
|
|||||||||||
| 38,331 | 81,554 | 60,129 | 73,245 | 71,169 | ||||||||||||||||
|
|
|
|
|
|
|
|
|
|
|
|||||||||||
| Income from continuing operations before income taxes |
201,965 | 169,597 | 244,479 | 258,496 | 249,733 | |||||||||||||||
| Income tax (expense) benefit |
(6,943 | ) | 134,995 | (87,513 | ) | (96,166 | ) | (93,495 | ) | |||||||||||
|
|
|
|
|
|
|
|
|
|
|
|||||||||||
| Income from continuing operations |
195,022 | 304,592 | 156,966 | 162,330 | 156,238 | |||||||||||||||
| (Loss) income from discontinued operations, net of taxes |
— | (3,757 | ) | (205 | ) | 180 | 955 | |||||||||||||
|
|
|
|
|
|
|
|
|
|
|
|||||||||||
| Net income |
$ | 195,022 | $ | 300,835 | $ | 156,761 | $ | 162,510 | $ | 157,193 | ||||||||||
|
|
|
|
|
|
|
|
|
|
|
|||||||||||
| Basic earnings per share: |
||||||||||||||||||||
| Income from continuing operations |
$ | 1.68 | $ | 2.77 | $ | 1.58 | $ | 1.55 | $ | 1.39 | ||||||||||
| (Loss) income from discontinued operations, net of taxes |
— | (0.03 | ) | — | — | 0.01 | ||||||||||||||
|
|
|
|
|
|
|
|
|
|
|
|||||||||||
| Net income |
$ | 1.68 | $ | 2.74 | $ | 1.58 | $ | 1.55 | $ | 1.40 | ||||||||||
|
|
|
|
|
|
|
|
|
|
|
|||||||||||
| Diluted earnings per share: |
||||||||||||||||||||
| Income from continuing operations |
$ | 1.66 | $ | 2.73 | $ | 1.56 | $ | 1.54 | $ | 1.38 | ||||||||||
| (Loss) income from discontinued operations, net of taxes |
— | (0.03 | ) | — | — | 0.01 | ||||||||||||||
|
|
|
|
|
|
|
|
|
|
|
|||||||||||
| Net income |
$ | 1.66 | $ | 2.70 | $ | 1.56 | $ | 1.54 | $ | 1.39 | ||||||||||
|
|
|
|
|
|
|
|
|
|
|
|||||||||||
| Weighted average common shares outstanding: |
||||||||||||||||||||
| Basic |
116,109 | 109,617 | 99,545 | 104,736 | 112,015 | |||||||||||||||
| Diluted |
117,312 | 111,250 | 100,623 | 105,535 | 112,977 | |||||||||||||||
| December 31, | ||||||||||||||||||||
| 2014 | 2013 | 2012 | 2011 | 2010 | ||||||||||||||||
| BALANCE SHEET DATA: |
||||||||||||||||||||
| Total assets |
$ | 3,127,191 | $ | 3,007,425 | $ | 2,974,742 | $ | 3,019,631 | $ | 2,983,228 | ||||||||||
| Total debt |
$ | 1,200,000 | $ | 1,205,000 | $ | 1,111,545 | $ | 1,245,014 | $ | 1,156,568 | ||||||||||
| Total liabilities |
$ | 1,645,691 | $ | 1,504,918 | $ | 1,453,122 | $ | 1,611,609 | $ | 1,512,357 | ||||||||||
| Stockholders’ equity |
$ | 1,481,500 | $ | 1,502,507 | $ | 1,521,620 | $ | 1,408,022 | $ | 1,470,871 | ||||||||||
47
| ITEM 7. | MANAGEMENT’S DISCUSSION AND ANALYSIS OF FINANCIAL CONDITION AND RESULTS OF OPERATIONS. |
The following discussion should be read in conjunction with the consolidated financial statements and notes thereto appearing elsewhere in this report. This discussion contains forward-looking statements that involve risks and uncertainties. Our actual results may differ materially from those anticipated in these forward-looking statements as a result of certain factors, including, but not limited to, those described under “Risk Factors” and included in other portions of this report.
As of December 31, 2014, we owned or controlled 52 correctional and detention facilities and managed an additional 12 facilities owned by our government partners, with a total design capacity of approximately 84,500 beds in 19 states and the District of Columbia. We are the nation’s largest owner of privatized correctional and detention facilities and one of the largest prison operators in the United States. Our size and experience provide us with significant credibility with our current and prospective customers, and enable us to generate economies of scale in purchasing power for food services, health care and other supplies and services we offer to our government partners.
We are a Real Estate Investment Trust, or REIT. We began operating as a REIT for federal income tax purposes effective January 1, 2013. See “Item 1. Business – Overview” for a description of how we are organized and provide correctional services and conduct other operations through taxable REIT subsidiaries, or TRSs, in order to comply with REIT qualification requirements. We believe that operating as a REIT maximizes our ability to create stockholder value given the nature of our assets, helps lower our cost of capital, draws a larger base of potential stockholders, provides greater flexibility to pursue growth opportunities, and creates a more efficient operating structure.
Our Business
We are compensated for providing correctional bed space and operating and managing prisons and correctional facilities at an inmate per diem rate based upon actual or minimum guaranteed occupancy levels. The expansion of the prison population in the United States has led to overcrowding in the federal and state prison systems, providing us with opportunities for growth. Federal, state, and local governments are constantly under budgetary constraints putting pressure on governments to control correctional budgets, including per diem rates our customers pay to us as well as pressure on appropriations for building new prison capacity. Our federal partners have continued to manage their budgets under Continuing Resolutions which has created short-term challenges and lead to reductions in inmate populations. Several of our state partners are projecting modest increases in tax revenues and improvements in their budgets which has resulted in our ability to secure recent per diem increases at certain facilities. However, all of our state partners have balanced budget requirements, which may force them to further reduce their expenses if their tax revenues, which typically lag the overall economy, do not meet their expectations. Additionally, actions to manage their expenses could include reductions in inmate populations.
We believe the long-term growth opportunities of our business remain very attractive as certain states consider efficiency, savings, and offender programming opportunities we can provide. Further, we expect our partners to continue to face challenges in maintaining old facilities, and developing new facilities and additional capacity which could result in future demand for the solutions we provide.
48
Governments continue to experience many significant spending demands which have constrained correctional budgets limiting their ability to expand existing facilities or construct new facilities. We believe the outsourcing of prison management services to private operators allows governments to manage increasing inmate populations while simultaneously controlling correctional costs and improving correctional services. We believe our customers discover that partnering with private operators to provide residential services to their offenders introduces competition to their prison system, resulting in improvements to the quality and cost of corrections services throughout their correctional system. Further, the use of facilities owned and managed by private operators allows governments to expand correctional capacity without incurring large capital commitments and allows them to avoid long-term pension obligations for their employees.
We also believe that having beds immediately available to our partners provides us with a distinct competitive advantage when bidding on new contracts. While we have been successful in winning contract awards to provide management services for facilities we do not own, and will continue to pursue such management contracts selectively, we believe the most significant opportunities for growth are in providing our government partners with available beds within facilities we currently own or that we develop. We also believe that owning the facilities in which we provide management services enables us to more rapidly replace business lost compared with managed-only facilities, since we can offer the same beds to new and existing customers and, with customer consent, may have more flexibility in moving our existing inmate populations to facilities with available capacity. Our management contracts generally provide our customers with the right to terminate our management contracts at any time without cause.
We have staff throughout the organization actively engaged in marketing our available capacity to existing and prospective customers. Historically, we have been successful in substantially filling our inventory of available beds and the beds that we have constructed. Filling these available beds would provide substantial growth in revenues, cash flow, and earnings per share. However, we can provide no assurance that we will be able to fill our available beds.
The demand for capacity in the short-term has been affected by the budget challenges many of our government partners currently face. As a result, certain government partners have reduced the number of inmates housed in our facilities by consolidating inmate populations within their jail system, placing inmates on early parole, and/or modifying criminal laws and sentencing practices. At the same time, these challenges impede our customers’ ability to construct new prison beds of their own or update older facilities, which we believe could result in further need for private sector capacity solutions in the long-term. We intend to continue to pursue build-to-suit opportunities like our 2,552-bed Trousdale Turner Correctional Center under construction in Trousdale County, Tennessee, and alternative solutions like the recently announced 2,400-bed South Texas Family Residential Center whereby we identified a site and lessor to provide residential housing and administrative buildings for the U.S. Immigration and Customs Enforcement, or ICE. In the long-term, however, we would like to see continued and meaningful utilization of our available capacity and better visibility from our customers before we add any additional capacity on a speculative basis.
We also remain steadfast in our efforts to contain costs. Approximately 62% of our operating expenses consist of salaries and benefits. The turnover rate for correctional officers for our company, and for the corrections industry in general, remains high. We remain focused on workers’ compensation and medical benefits costs for our employees due to continued rising healthcare costs throughout the country and the uncertainty of the impact of the Patient
49
Protection and Affordable Care Act on future healthcare costs. Reducing these staffing costs requires a long-term strategy to control such costs, and we continue to dedicate resources to enhance our benefits, provide training and career development opportunities to our staff and attract and retain quality personnel. Through ongoing company-wide initiatives, we continue to focus on efforts to contain costs and improve operating efficiencies, ensuring continuous delivery of quality services over the long-term.
Through the combination of our initiatives to increase our revenues by taking advantage of our available beds as well as delivering new bed capacity through new facility construction and expansion opportunities, and our strategies to contain our operating expenses, we believe we will be able to maintain our competitive advantage and continue to improve the quality services we provide to our customers at an economical price, thereby producing value to our stockholders.
The consolidated financial statements are prepared in conformity with accounting principles generally accepted in the United States. As such, we are required to make certain estimates, judgments and assumptions that we believe are reasonable based upon the information available. These estimates and assumptions affect the reported amounts of assets and liabilities at the date of the consolidated financial statements and the reported amounts of revenue and expenses during the reporting period. A summary of our significant accounting policies is described in Note 2 to our audited financial statements. The significant accounting policies and estimates which we believe are the most critical to aid in fully understanding and evaluating our reported financial results include the following:
Asset impairments. The primary risk we face for asset impairment charges, excluding goodwill, is associated with correctional facilities we own. As of December 31, 2014, we had $2.7 billion in property and equipment, including $119.3 million in long-lived assets, excluding equipment, at five idled core correctional facilities. We consider our core facilities to be those that were designed for adult secure correctional purposes. The impairment analyses we performed for each of these facilities excluded the net book value of equipment, as a substantial portion of the equipment is easily transferrable to other company-owned facilities without significant cost. The carrying values of the five idled core facilities as of December 31, 2014 were as follows (in thousands):
| Prairie Correctional Facility |
$ | 18,748 | ||
| Huerfano County Correctional Center |
19,033 | |||
| Diamondback Correctional Facility |
44,480 | |||
| Otter Creek Correctional Center |
24,089 | |||
| Marion Adjustment Center |
12,978 | |||
|
|
|
|||
| $ | 119,328 | |||
|
|
|
We also have three idled non-core facilities with carrying values amounting to $1.3 million as of December 31, 2014. We consider the Shelby Training Center, Queensgate Correctional Facility, and Mineral Wells Pre-Parole Transfer Facility to be non-core because they were designed for uses other than for adult secure correctional purposes. From the date each facility became idle, the eight idled facilities incurred combined operating expenses of approximately $7.9 million, $6.4 million, and $6.0 million for the years ended December 31, 2014, 2013, and 2012, respectively. The 2014 and 2013 amounts exclude expenses incurred in connection with the activation of the Diamondback Correctional Facility which began in the third quarter of 2013 and continued until near the end of the second quarter of 2014, as further described hereafter.
50
We evaluate the recoverability of the carrying values of our long-lived assets, other than goodwill, when events suggest that an impairment may have occurred. Such events primarily include, but are not limited to, the termination of a management contract or a significant decrease in inmate populations within a correctional facility we own or manage. Accordingly, we tested each of the aforementioned eight currently idled facilities for impairment when we were notified by the respective customers that they would no longer be utilizing such facility.
We re-perform the impairment analyses on an annual basis for each of the idle facilities and evaluate on a quarterly basis market developments for the potential utilization of each of these facilities in order to identify events that may cause us to reconsider our most recent assumptions. Such events could include negotiations with a prospective customer for the utilization of an idle facility at terms significantly less favorable than used in our most recent impairment analysis, or changes in legislation surrounding a particular facility that could impact our ability to house certain types of inmates at such facility, or a demolition or substantial renovation of a facility. Further, a substantial increase in the number of available beds at other facilities we own could lead to a deterioration in market conditions and cash flows that we might be able to obtain under a new management contract at our idle facilities. We have historically secured contracts with customers at existing facilities that were already operational, allowing us to move the existing population to other idle facilities. Although they are not frequently received, an unsolicited offer to purchase any of our idle facilities at amounts that are less than the carrying value could also cause us to reconsider the assumptions used in our most recent impairment analysis.
In the fourth quarter of 2014, we made the decision to actively pursue the sale of the Queensgate Correctional Facility, idle since 2009, and the Mineral Wells Pre-Parole Transfer Facility, idle since 2013. We acquired the Queensgate and Mineral Wells facilities in 1998 and 1995, respectively, in connection with separate business combination transactions. We reviewed comparable sales data and concluded that either the exit value in the principle market or comparable sales prices for similar properties in the respective geographical areas represented the fair value of these non-core assets. We determined the principle market for these non-core assets will be buyers who intend to use the assets for purposes other than correctional facilities. The aggregate net book value of these facilities prior to the evaluation for impairment was $28.8 million and, as a result of the impairment indicator resulting from the potential sale of the facilities, we recorded non-cash impairments totaling $27.8 million during the fourth quarter of 2014 to write down the book values of the Queensgate and Mineral Wells facilities to the estimated fair values.
In the third quarter of 2014, we entered into a purchase and sale agreement with a third party to sell our idled Houston Educational Facility in Houston, Texas for $4.5 million. The Houston Educational Facility was another non-core asset that was previously leased to a charter school operator. We closed on the sale during the fourth quarter of 2014. The net book value of this facility prior to the evaluation for impairment was $6.4 million and, as a result of the impairment indicator resulting from the potential sale of the facility, we recorded a non-cash impairment of $2.2 million during the second quarter of 2014 to write-down the book value of the facility to the estimated fair value. The potential sale price was used as a proxy for the fair value of the facility during the second quarter of 2014 to evaluate and record the impairment.
In performing our annual impairment analyses, the estimates of recoverability are initially based on projected undiscounted cash flows that are comparable to historical cash flows from
51
management contracts at similar facilities to the idled facilities and sensitivity analyses that consider reductions to such cash flows. Our sensitivity analyses included reductions in projected cash flows by as much as half of the historical cash flows generated by the respective facility as well as prolonged periods of vacancies. In all cases, the projected undiscounted cash flows in our analyses as of December 31, 2014, exceeded the carrying amounts of each facility by material amounts.
Our impairment evaluations also take into consideration our historical experience in securing new management contracts to utilize facilities that had been previously idled for periods comparable to or in excess of the periods that our currently idle facilities have been idle. Such previously idled facilities are currently being operated under contracts that generate cash flows resulting in the recoverability of the net book value of the previously idled facilities by substantial amounts. Due to a variety of factors, the lead time to negotiate contracts with our federal and state partners to utilize idle bed capacity is generally lengthy and has historically resulted in periods of idleness similar to the ones we are currently experiencing at our idle facilities. As a result of our analyses, and with the exception of the impairment charges taken on our non-core assets, we determined each of these assets to have recoverable values in excess of the corresponding carrying values. However, we can provide no assurance that we will be able to secure agreements to utilize our idle facilities, or that we will not incur impairment charges in the future.
By their nature, these estimates contain uncertainties with respect to the extent and timing of the respective cash flows due to potential delays or material changes to historical terms and conditions in contracts with prospective customers that could impact the estimate of cash flows. Notwithstanding the effects the recent economic downturn has had on our customers’ demand for prison beds in the short term which has led to our decision to idle certain facilities, we believe the long-term trends favor an increase in the utilization of our correctional facilities and management services. This belief is based on our experience in operating in difficult economic environments and in working with governmental agencies faced with significant budgetary challenges, which is a primary contributing factor to the lack of appropriated funding since 2009 to build new bed capacity by the federal and state governments with which we partner.
Revenue Recognition – Multiple-Element Arrangement. In September 2014, we agreed under an expansion of an existing inter-governmental service agreement, or IGSA, between the city of Eloy, Arizona and ICE to provide residential space and services at our newly activated South Texas Family Residential Center. The amended IGSA qualifies as a multiple-element arrangement under the guidance in ASC 605, “Revenue Recognition”. We evaluate each deliverable in an arrangement to determine whether it represents a separate unit of accounting. A deliverable constitutes a separate unit of accounting when it has standalone value to the customer. ASC 605 requires revenue to be allocated to each unit of accounting based on a selling price hierarchy. The selling price for a deliverable is based on its vendor specific objective evidence, or VSOE, of selling price, if available, third party evidence, or TPE, if VSOE of selling price is not available, or estimated selling price, or ESP, if neither VSOE of selling price nor TPE is available. We establish VSOE of selling price using the price charged for a deliverable when sold separately. We establish TPE of selling price by evaluating similar products or services in standalone sales to similarly situated customers. We establish ESP based on management judgment considering internal factors such as margin objectives, pricing practices and controls, and market conditions. In arrangements with multiple elements, we allocate the transaction price to the individual units of accounting at inception of the arrangement based on their relative selling price. The allocation of revenue to each element requires considerable judgment and estimations which could change in the future. However, while a change in revenue allocation could lead to timing differences in the period in which revenue is recognized, total revenue recognized over the life of the IGSA will not change.
52
Self-funded insurance reserves. As of December 31, 2014 and 2013, we had $32.0 million and $33.8 million, respectively, in accrued liabilities for employee health, workers’ compensation, and automobile insurance claims. We are significantly self-insured for employee health, workers’ compensation, and automobile liability insurance claims. As such, our insurance expense is largely dependent on claims experience and our ability to control our claims. We have consistently accrued the estimated liability for employee health insurance claims based on our history of claims experience and the estimated time lag between the incident date and the date we pay the claims. We have accrued the estimated liability for workers’ compensation claims based on an actuarial valuation of the outstanding liabilities, discounted to the net present value of the outstanding liabilities, using a combination of actuarial methods used to project ultimate losses, and our automobile insurance claims based on estimated development factors on claims incurred. The liability for employee health, workers’ compensation, and automobile insurance includes estimates for both claims incurred and for claims incurred but not reported. These estimates could change in the future. It is possible that future cash flows and results of operations could be materially affected by changes in our assumptions, new developments, or by the effectiveness of our strategies.
Legal reserves. As of December 31, 2014 and 2013, we had $4.3 million and $6.2 million, respectively, in accrued liabilities related to certain legal proceedings in which we are involved. We have accrued our best estimate of the probable costs for the resolution of these claims based on a range of potential outcomes. In addition, we are subject to current and potential future legal proceedings for which little or no accrual has been reflected because our current assessment of the potential exposure is nominal. These estimates have been developed in consultation with our General Counsel’s office and, as appropriate, outside counsel handling these matters, and are based upon an analysis of potential results, assuming a combination of litigation and settlement strategies. It is possible that future cash flows and results of operations could be materially affected by changes in our assumptions, new developments, or by the effectiveness of our strategies.
53
Our results of operations are impacted by the number of facilities we owned and managed, the number of facilities we managed but did not own, the number of facilities we leased to other operators, and the facilities we owned that were not in operation. The following table sets forth the changes in the number of facilities operated for the years ended December 31, 2014, 2013, and 2012.
| Effective Date |
Owned and Managed |
Managed Only |
Leased | Total | ||||||||||||||
| Facilities as of December 31, 2011 |
46 | 21 | 2 | 69 | ||||||||||||||
| Termination of the management contract for the Delta Correctional Facility |
January 2012 | — | (1 | ) | — | (1 | ) | |||||||||||
| Activation of the Jenkins Correctional Center |
March 2012 | 1 | — | — | 1 | |||||||||||||
|
|
|
|
|
|
|
|
|
|||||||||||
| Facilities as of December 31, 2012 |
47 | 20 | 2 | 69 | ||||||||||||||
|
|
|
|
|
|
|
|
|
|||||||||||
| Reclassification of Elizabeth Detention Center as owned and managed from managed only |
January 2013 | 1 | (1 | ) | — | — | ||||||||||||
| Reclassification of North Georgia Detention Center as owned and managed from managed only |
January 2013 | 1 | (1 | ) | — | — | ||||||||||||
| Termination of the management contract for the Wilkinson County Correctional Facility |
June 2013 | — | (1 | ) | — | (1 | ) | |||||||||||
| Acquisition of CAI |
July 2013 | 2 | — | — | 2 | |||||||||||||
| Termination of the management contract for the Dawson State Jail |
August 2013 | — | (1 | ) | — | (1 | ) | |||||||||||
| Assignment of the contract at the Bridgeport Pre-Parole Transfer Facility |
September 2013 | (1 | ) | — | 1 | — | ||||||||||||
| Lease of the California City Correctional Center |
December 2013 | (1 | ) | — | 1 | — | ||||||||||||
|
|
|
|
|
|
|
|
|
|||||||||||
| Facilities as of December 31, 2013 |
49 | 16 | 4 | 69 | ||||||||||||||
|
|
|
|
|
|
|
|
|
|||||||||||
| Termination of the management contracts for the Bay, Graceville and |
January 2014 | — | (3 | ) | — | (3 | ) | |||||||||||
| Termination of the contract at the North Georgia Detention Center |
February 2014 | (1 | ) | — | — | (1 | ) | |||||||||||
| Termination of the management contract for the Idaho Correctional Center |
July 2014 | — | (1 | ) | — | (1 | ) | |||||||||||
| Sale of the Houston Educational Facility |
November 2014 | — | — | (1 | ) | (1 | ) | |||||||||||
| Activation of the South Texas Family Residential Center |
October 2014 | 1 | — | — | 1 | |||||||||||||
|
|
|
|
|
|
|
|
|
|||||||||||
| Facilities as of December 31, 2014 |
49 | 12 | 3 | 64 | ||||||||||||||
|
|
|
|
|
|
|
|
|
|||||||||||
54
Year Ended December 31, 2014 Compared to the Year Ended December 31, 2013
During the year ended December 31, 2014, we generated net income of $195.0 million, or $1.66 per diluted share, compared with net income of $300.8 million, or $2.70 per diluted share, for the previous year. Net income was negatively impacted during 2014 by the aforementioned $30.0 million of asset impairments, net of taxes, or $0.26 per diluted share, at the Houston Educational Facility, Queensgate Correctional Facility, and Mineral Wells Pre-Parole Transfer Facility. When compared to 2013, per share results during 2014 were also negatively impacted by the issuance of 13.9 million shares of common stock in connection with the payment of a special dividend on May 20, 2013.
Net income was favorably impacted during 2013 by the income tax benefit of $137.7 million recorded during the first quarter of 2013, or $1.24 per diluted share, due to the revaluation of certain deferred tax assets and liabilities and other income taxes associated with the REIT conversion effective January 1, 2013. In addition, results for 2013 were favorably impacted by a tax benefit of $4.9 million, or $0.04 per share, due to certain tax strategies implemented during the second quarter of 2013 that resulted in a further reduction in income taxes. These income tax benefits during 2013 were offset by our decision to provide bonuses totaling $5.0 million, or $0.04 per share, to non-management staff in lieu of merit increases in 2013. Net income for 2013 was negatively impacted due to several non-routine items including $43.5 million, net of taxes, or $0.39 per diluted share for expenses associated with debt refinancing transactions, the REIT conversion, and with the acquisition of Correctional Alternatives, Inc., or CAI, in the third quarter of 2013, as further described hereafter. Net income was also negatively impacted during 2013 by asset impairments associated with contract terminations of $6.7 million, net of taxes, or $0.06 per diluted share.
Facility Operations
A key performance indicator we use to measure the revenue and expenses associated with the operation of the facilities we own or manage is expressed in terms of a compensated man-day, which represents the revenue we generate and expenses we incur for one offender for one calendar day. Revenue and expenses per compensated man-day are computed by dividing facility revenue and expenses by the total number of compensated man-days during the period. A compensated man-day represents a calendar day for which we are paid for the occupancy of an offender. We believe the measurement is useful because we are compensated for operating and managing facilities at an offender per-diem rate based upon actual or minimum guaranteed occupancy levels. We also measure our ability to contain costs on a per-compensated man-day basis, which is largely dependent upon the number of offenders we accommodate. Further, per compensated man-day measurements are also used to estimate our potential profitability based on certain occupancy levels relative to design capacity. Revenue and expenses per compensated man-day for all of the facilities placed into
55
service that we owned or managed, exclusive of those discontinued (see further discussion below regarding discontinued operations) or held for lease, were as follows for the years ended December 31, 2014 and 2013:
| For the Years Ended December 31, |
||||||||
| 2014 | 2013 | |||||||
| Revenue per compensated man-day |
$ | 63.54 | $ | 60.57 | ||||
| Operating expenses per compensated man-day: |
||||||||
| Fixed expense |
33.06 | 32.48 | ||||||
| Variable expense |
11.60 | 10.26 | ||||||
|
|
|
|
|
|||||
| Total |
44.66 | 42.74 | ||||||
|
|
|
|
|
|||||
| Operating income per compensated man-day |
$ | 18.88 | $ | 17.83 | ||||
|
|
|
|
|
|||||
| Operating margin |
29.7 | % | 29.4 | % | ||||
|
|
|
|
|
|||||
| Average compensated occupancy |
83.8 | % | 85.2 | % | ||||
|
|
|
|
|
|||||
| Average available beds |
82,942 | 88,894 | ||||||
|
|
|
|
|
|||||
| Average compensated population |
69,536 | 75,698 | ||||||
|
|
|
|
|
|||||
The calculations of expenses per compensated man-day for 2014 and 2013 exclude expenses incurred during the fourth quarter of 2013 and the first six months of 2014 for start-up efforts associated with the Diamondback facility because of the distorted impact they have on the statistics. The Diamondback expenses were incurred in connection with the activation of the facility in anticipation of a new contract. As further described hereafter, in April 2014, we made the decision to once again idle the facility in the absence of a definitive contract. The de-activation was completed near the end of the second quarter of 2014. In addition, the calculations of revenue and expenses per compensated man-day for 2013 exclude revenues (and compensated man-days) earned and expenses incurred during the fourth quarter of 2013 for the Red Rock facility because of the distorted impact they have on the statistics due to the transition to a new contract, as further described hereafter.
Revenue
Total revenue consists of revenue we generate in the operation and management of correctional and detention facilities, as well as rental revenue generated from facilities we lease to third-party operators, and from our inmate transportation subsidiary. The following table reflects the components of revenue for the years ended December 31, 2014 and 2013 (in millions):
| For the Years Ended December 31, |
||||||||||||||||
| 2014 | 2013 | $ Change | % Change | |||||||||||||
| Management revenue: |
||||||||||||||||
| Federal |
$ | 728.3 | $ | 740.0 | $ | (11.7 | ) | (1.6 | %) | |||||||
| State |
759.3 | 823.6 | (64.3 | ) | (7.8 | %) | ||||||||||
| Local |
68.6 | 66.9 | 1.7 | 2.5 | % | |||||||||||
| Other |
56.5 | 57.3 | (0.8 | ) | (1.4 | %) | ||||||||||
|
|
|
|
|
|
|
|
|
|||||||||
| Total management revenue |
1,612.7 | 1,687.8 | (75.1 | ) | (4.4 | %) | ||||||||||
| Rental and other revenue |
34.2 | 6.5 | 27.7 | 426.2 | % | |||||||||||
|
|
|
|
|
|
|
|
|
|||||||||
| Total revenue |
$ | 1,646.9 | $ | 1,694.3 | $ | (47.4 | ) | (2.8 | %) | |||||||
|
|
|
|
|
|
|
|
|
|||||||||
56
The $75.1 million, or 4.4%, reduction in revenue associated with the operation and management of correctional and detention facilities consisted of a decrease in revenue of approximately $136.2 million caused by a decrease in the average daily compensated population during 2014, partially offset by an increase of 4.9% in average revenue per compensated man-day. The reduction in revenue was also a result of a contract adjustment by one of our federal partners, as previously disclosed in the fourth quarter of 2013 and as further described hereafter. The reduction in revenue from the operation and management of correctional and detention facilities was partially offset by an increase in lease revenue at our California City facility, as further described hereafter under “Other Facility Related Activity”.
Average daily compensated population decreased 6,162, or 8.1%, from 2013 to 2014. The decline in average compensated population primarily resulted from the expiration of our contracts at the Bay Correctional Facility, Graceville Correctional Facility, and Moore Haven Correctional Facility, collectively referred to herein as the “Three Florida Facilities”, after the Florida Department of Management Services, or DMS, awarded the management of these contracts to another operator effective January 31, 2014. The decline in average compensated population also resulted from the expiration of our contract at the Idaho Correctional Center after the state of Idaho assumed management of the facility effective July 1, 2014, and from our decision to terminate a contract at the North Georgia Detention Center effective in the first quarter of 2014. Combined, these five facilities contributed to a decrease in revenue of $76.9 million and generated net operating losses, or the operating losses from operations before interest, taxes, asset impairments, and depreciation and amortization, of $2.4 million during the time they were active in 2014, and net operating income of $0.6 million during the year ended December 31, 2013.
Business from our federal customers, including primarily the Federal Bureau of Prisons, or BOP, the United States Marshals Service, or USMS, and ICE, continues to be a significant component of our business. Our federal customers generated approximately 44% of our total revenue for both of the years ended December 31, 2014 and 2013, but decreased $11.7 million from 2013 to 2014. The reduction in federal revenues primarily resulted from the transition of our California City facility, which housed USMS and ICE offenders during the majority of 2013, to a lease with the state of California, as further described under “Other Facility Related Activity” hereafter. Partially offsetting the reduction in federal revenues was an increase in revenues that resulted from our acquisition of CAI in the third quarter of 2013 and the activation of the South Texas Family Residential Center in the fourth quarter of 2014, as further described hereafter.
The reduction in federal revenues also resulted from a contract adjustment by one of our federal partners previously disclosed in the fourth quarter of 2013. The contract adjustment resulted in an accrual of $13.0 million of revenue and an equal accrual of operating expenses during the fourth quarter of 2013, both of which were revised to $9.0 million during the first quarter of 2014. Because of the distorted impact these amounts would have on the per compensated man-day statistics presented in the previous table, the revenue and expenses related to these adjustments were not included in the calculations of the per compensated man-day statistics.
State revenues from facilities that we manage decreased 7.8% from 2013 to 2014 primarily as a result of the expiration of our contracts at the Idaho Correctional Center effective July 1, 2014 and at the Three Florida Facilities effective January 31, 2014, and due to the idling of our Mineral Wells and Marion Adjustment Center facilities in the third quarter of 2013.
Operating Expenses
Operating expenses totaled $1,156.1 million and $1,220.4 million for the years ended December 31, 2014 and 2013, respectively. Operating expenses consist of those expenses incurred in the operation and management of correctional and detention facilities, as well as at facilities we lease to third-party operators, and for our inmate transportation subsidiary.
57
Expenses incurred in connection with the operation and management of correctional and detention facilities decreased $67.3 million, or 5.6%, during 2014 compared with 2013. Similar to our reduction in revenues, operating expenses decreased most notably as a result of the expiration of our contracts at the Idaho Correctional Center effective July 1, 2014 and at the Three Florida Facilities effective January 31, 2014, and due to the idling of our Mineral Wells and Marion Adjustment Center facilities in the third quarter of 2013. The reduction in operating expenses was also a result of the aforementioned contract adjustment by one of our federal partners, also as previously disclosed in the fourth quarter of 2013. These reductions in operating expenses were partially offset by an increase in expenses related to the activation of our South Texas Family Residential Center in the fourth quarter of 2014, as further described hereafter.
Fixed expenses per compensated man-day increased to $33.06 during the year ended December 31, 2014 from $32.48 during the year ended December 31, 2013 primarily as a result of an increase in salaries and benefits per compensated man-day of $0.46. The increase in salaries and benefits per compensated man-day resulted primarily from wage adjustments implemented during 2014 and a higher average rate at our newly activated South Texas Family Residential Center, as well as more unfavorable claims experience in our self-insured employee health plans in 2014 compared with the prior year. Salaries and benefits represent the most significant component of fixed operating expenses, representing approximately 62% and 65% of our operating expenses during 2014 and 2013, respectively.
Variable expenses per compensated man-day increased $1.34 during the year ended December 31, 2014 from the year ended December 31, 2013. The increase was primarily a result of increases in inmate medical costs and contractual inflationary increases in food service, and due to expenses associated with our newly activated South Texas Family Residential Center. The increase in variable expenses per compensated man-day was also due to an increase in travel and other variable expenses, largely attributable to the aforementioned transition of several contracts to new operators. In addition, 2013 was favorably impacted by the implementation of certain sales tax strategies which reduced variable expenses per compensated man-day by $0.15 in 2013.
Facility Management Contracts
We typically enter into facility contracts to provide prison bed capacity and management services to governmental entities for terms typically from three to five years, with additional renewal periods at the option of the contracting governmental agency. Accordingly, a substantial portion of our facility contracts are scheduled to expire each year, notwithstanding contractual renewal options that a government agency may exercise. Although we generally expect these customers to exercise renewal options or negotiate new contracts with us, one or more of these contracts may not be renewed by the corresponding governmental agency.
During December 2014, the BOP announced that it elected not to renew its contract with us at our owned and operated 2,016-bed Northeast Ohio Correctional Center. The current contract with the BOP at this facility is scheduled to expire on May 31, 2015. We currently expect to continue to house USMS detainees at this facility pursuant to a separate contract that expires December 31, 2016, while we continue to market the space that will become available.
Based on information available at this filing, notwithstanding the contract at the Northeast Ohio Correctional Center described above, we believe we will renew all other contracts that
58
have expired or are scheduled to expire within the next twelve months. We believe our renewal rate on existing contracts remains high as a result of a variety of reasons including, but not limited to, the constrained supply of available beds within the U.S. correctional system, our ownership of the majority of the beds we operate, and the quality of our operations.
The operation of the facilities we own carries a higher degree of risk associated with a facility contract than the operation of the facilities we manage but do not own because we incur significant capital expenditures to construct or acquire facilities we own. Additionally, correctional and detention facilities have limited or no alternative use. Therefore, if a contract is terminated on a facility we own, we continue to incur certain operating expenses, such as real estate taxes, utilities, and insurance, which we would not incur if a management contract were terminated for a managed-only facility. As a result, revenue per compensated man-day is typically higher for facilities we own and manage than for managed-only facilities. Because we incur higher expenses, such as repairs and maintenance, real estate taxes, and insurance, on the facilities we own and manage, our cost structure for facilities we own and manage is also higher than the cost structure for the managed-only facilities. Accordingly, the following tables display the revenue and expenses per compensated man-day for the facilities placed into service that we own and manage and for the facilities we manage but do not own, which we believe is useful to our financial statement users:
| For the Years Ended December 31, |
||||||||
| 2014 | 2013 | |||||||
| Owned and Managed Facilities: |
||||||||
| Revenue per compensated man-day |
$ | 70.55 | $ | 68.19 | ||||
| Operating expenses per compensated man-day: |
||||||||
| Fixed expense |
35.25 | 35.02 | ||||||
| Variable expense |
12.09 | 10.66 | ||||||
|
|
|
|
|
|||||
| Total |
47.34 | 45.68 | ||||||
|
|
|
|
|
|||||
| Operating income per compensated man-day |
$ | 23.21 | $ | 22.51 | ||||
|
|
|
|
|
|||||
| Operating margin |
32.9 | % | 33.0 | % | ||||
|
|
|
|
|
|||||
| Average compensated occupancy |
81.0 | % | 81.6 | % | ||||
|
|
|
|
|
|||||
| Average available beds |
66,179 | 67,588 | ||||||
|
|
|
|
|
|||||
| Average compensated population |
53,592 | 55,123 | ||||||
|
|
|
|
|
|||||
| Managed Only Facilities: |
||||||||
| Revenue per compensated man-day |
$ | 39.98 | $ | 40.14 | ||||
| Operating expenses per compensated man-day: |
||||||||
| Fixed expense |
25.68 | 25.68 | ||||||
| Variable expense |
9.95 | 9.20 | ||||||
|
|
|
|
|
|||||
| Total |
35.63 | 34.88 | ||||||
|
|
|
|
|
|||||
| Operating income per compensated man-day |
$ | 4.35 | $ | 5.26 | ||||
|
|
|
|
|
|||||
| Operating margin |
10.9 | % | 13.1 | % | ||||
|
|
|
|
|
|||||
| Average compensated occupancy |
95.1 | % | 96.6 | % | ||||
|
|
|
|
|
|||||
| Average available beds |
16,763 | 21,306 | ||||||
|
|
|
|
|
|||||
| Average compensated population |
15,944 | 20,575 | ||||||
|
|
|
|
|
|||||
59
Owned and Managed Facilities
Facility net operating income, or the operating income or loss from operations before interest, taxes, asset impairments, depreciation and amortization, at our owned and managed facilities increased by $6.4 million, from $444.7 million in 2013 to $451.1 million in 2014. Facility net operating income at our owned and managed facilities during 2014 was favorably impacted by the activation of the South Texas Family Residential Center in the fourth quarter of 2014, as further described hereafter, and the CAI acquisition in the third quarter of 2013.
In July 2013, we extended our agreement with the California Department of Corrections and Rehabilitation, or CDCR, to continue to house inmates at the four facilities we operate for them in Arizona, Oklahoma, and Mississippi. The extension, which runs through June 30, 2016, also allowed CDCR to transition California inmates previously housed at our Red Rock Correctional Center to our other facilities. Accordingly, all of the California inmates were relocated from our Red Rock Correctional Center in the fourth quarter of 2013 in order to prepare for the receipt of inmates under our new contract with the state of Arizona, which commenced January 1, 2014, as further described hereafter. While the transition resulted in the loss of some of the inmates housed at the Red Rock facility, the transition plan included retention and transfer of certain inmates to our other facilities. The calculations of revenue and expenses per compensated man-day in the preceding table exclude revenues (and compensated man-days) earned and expenses incurred during the fourth quarter of 2013 for the Red Rock facility because of the distorted impact they have on the statistics due to the transition to a new contract.
In May 2011, in response to a lawsuit brought by inmates against the state of California, the U.S. Supreme Court upheld a lower court ruling issued by a three judge panel requiring California to reduce its inmate population to 137.5% of its capacity. In an effort to meet the Federal court ruling, the state of California enacted legislation that shifted the responsibilities for housing certain lower level inmates from state government to local jurisdictions. This realignment plan commenced on October 1, 2011 and has resulted in a reduction in state inmate populations of approximately 29,000 as of December 31, 2014. As of December 31, 2014, the adult inmate population held in state of California institutions totaled approximately 139% of capacity, or approximately 115,000 inmates, which did not include the California inmates held in our out-of-state facilities.
In September 2013, the State asked the court to amend its order and provide an extension on the date of compliance in return for adding additional resources toward community-based offender programs that reduce recidivism. On February 10, 2014, a federal court extended to February 28, 2016 the date by which the state of California must comply with the maximum in-state population capacity rate of 137.5%, originally imposed by the federal court in 2009. The federal court also prohibited the State from increasing the out-of-state capacity beyond our contract of approximately 9,000 beds. We believe the state of California will continue to work to resolve the overcrowded conditions in-state through utilizing public and/or private in-state facilities and sentencing measures to reduce prison populations over the long term. As of both December 31, 2014 and 2013, we housed approximately 8,900 inmates from the state of California as a solution to overcrowding. Approximately 14% and 12% of our total revenue for the years ended December 31, 2014 and 2013, respectively, was generated from the CDCR, including revenue generated at the California City facility under a lease agreement that commenced December 1, 2013, as further described hereafter. The reduction or elimination of the use of our out-of-state solutions by the state of California would have a significant adverse impact on our financial position, results of operations, and cash flows.
60
During the second quarter of 2013, we announced that the Texas Department of Criminal Justice, or TDCJ, elected not to renew its contract for our owned and managed 2,103-bed Mineral Wells Pre-Parole Transfer Facility due to a legislative budget reduction. As a result, upon expiration of the contract in August 2013, we ceased operations and idled the Mineral Wells facility. Further, the Kentucky Department of Corrections, or KDOC, provided us notice during the second quarter of 2013 that it was not going to award a contract under the RFP that would have allowed for the KDOC’s continued use of our owned and managed 826-bed Marion Adjustment Center. We also idled the Marion Adjustment Center following the transfer of the populations during September 2013. These two facilities generated a combined net operating loss, excluding depreciation and amortization, of $1.6 million for the year ended December 31, 2014, compared with a combined net operating loss of $1.1 million for the year ended December 31, 2013. In addition, as previously described, we recorded a non-cash asset impairment of $17.2 million for the Mineral Wells facility in the fourth quarter of 2014.
During the third quarter of 2013, we began hiring staff at the Diamondback Correctional Facility in order to reactivate the facility for future operations. Our decision to activate the facility was made as a result of potential need for additional beds by certain state customers. In January 2014, the state of Oklahoma issued a Request For Proposal, or RFP, for bed capacity in the state of Oklahoma and anticipated that an award announcement would be made in the second quarter of 2014. When it became evident the contract would not be awarded and commence in the near-term, we made the decision to re-idle the facility. The de-activation was completed near the end of the second quarter of 2014. In the preceding table, the calculations of expenses per man-day exclude expenses incurred during the fourth quarter of 2013 and the first six months of 2014 for the Diamondback facility because of the distorted impact they have on the statistics.
In September 2014, we announced that we agreed under an expansion of an existing inter-governmental service agreement, or IGSA, between the City of Eloy, Arizona, and ICE to house up to 2,400 individuals at the South Texas Family Residential Center, a facility we lease in Dilley, Texas. The expanded agreement gives ICE additional capacity to accommodate the influx of Central American female adults with children arriving illegally on the Southwest border while they await the outcome of immigration hearings or return to their home countries. As part of the agreement, we are responsible for providing space and residential services in an open and safe environment which offers residents indoor and outdoor recreational activities, life skills, study period, counseling, group interaction, and access to religious and legal services. In addition, we provide educational programs through a third party and food services through the lessor. Medical services are provided to residents by ICE Health Care Services, a division of ICE. The new services provided under the amended IGSA commenced in the fourth quarter of 2014, have a term of up to four years, and can be extended by bi-lateral modifications. During 2014, we recognized $21.0 million in revenue associated with the amended IGSA.
We lease the South Texas Family Residential Center and the site upon which it is being constructed from a third-party lessor. Our lease agreement with the lessor is over a period co-terminus with the aforementioned amended IGSA with ICE. ICE began housing the first residents at the facility in the fourth quarter of 2014, and the site is expected to be ready for full capacity during the second quarter of 2015. The agreement provides for a fixed monthly payment in accordance with a graduated schedule. Certain lease and service revenue was recognized in the fourth quarter of 2014 and will continue to increase as additional beds are brought on line, up to the point the facility is ready for full occupancy at 2,400 beds. The expanded agreement with ICE had a favorable impact on the revenue and net operating income of our Owned and Managed facilities during 2014 and is also expected to continue to have a favorable impact on our financial results.
61
In January 2015, a class action lawsuit was filed in federal district court for the District of Columbia against the Secretary of the Department of Homeland Security, or DHS, and certain ICE officials. The complaint sought to certify a class of plaintiffs, consisting of Central American mothers and children who (i) have been or will be detained in ICE family detention facilities since June 2014, (ii) have been or will be determined to have a credible fear of persecution in their home country under federal asylum laws and (iii) are eligible for release on bond pursuant to certain federal statutes but have been or will be denied such release after being subject to an ICE custody determination that took deterrence of mass migration into account. In February 2015, the court certified the class and granted the plaintiffs’ motion for a preliminary injunction, enjoining DHS from detaining class members for the purpose of deterring future immigration to the United States and from considering deterrence of such immigration as a factor in such custody determinations until a final determination has been reached on the merits of the action. We have not received any instruction from ICE on what action they intend to take in response to the court order, or how and whether it will affect our contract at the South Texas Family Residential Center. Any adverse decision with regard to this contract could materially affect our financial condition and results of operations.
In September 2012, we announced that we were awarded a new management contract from the Arizona Department of Corrections to house up to 1,000 medium-security inmates at our 1,596-bed Red Rock Correctional Center in Arizona. The new management contract, which commenced in January 2014, contains an initial term of ten years, with two five-year renewal options upon mutual agreement and provides an occupancy guarantee of 90% of the contracted beds, which is expected to be implemented in two phases. The government partner included the occupancy guarantee in its RFP in order to guarantee its access to the beds. We received approximately 500 inmates from Arizona during the first quarter of 2014. During January 2015, we began receiving additional inmates under this contract, and we expect the population to reach approximately 1,000 inmates at the Red Rock facility during the first quarter of 2015.
Managed-Only Facilities
Total revenue at our managed-only facilities decreased $68.8 million from $301.5 million in 2013 to $232.7 million in 2014. The decrease in revenues during 2014 at our managed-only facilities was largely the result of the aforementioned expiration of our contracts at the Idaho Correctional Center effective July 1, 2014 and at the Three Florida Facilities effective January 31, 2014. Revenue per compensated man-day decreased slightly to $39.98 in 2014 from $40.14 in 2013, or 0.4%. Facility net operating income at our managed-only facilities decreased $14.2 million from $39.6 million during the year ended December 31 2013 to $25.3 million during year ended December 31, 2014.
Operating expenses per compensated man-day at managed-only facilities increased to $35.63 during the year ended December 31, 2014 from $34.88 during the year ended December 31, 2013 largely due to increases in inmate litigation costs, inmate medical costs, travel, and other variable expenses, most notably at our Idaho facility.
During the third quarter of 2013, the state of Idaho reported that they expected to solicit bids for the management of the Idaho Correctional Center upon the expiration of our contract in June 2014. During the third quarter of 2013, we decided not to submit a bid for the continued management of this facility. The state announced in early 2014 that it would assume management of the facility effective July 1, 2014. The transition of our operations to the state of Idaho was completed successfully on July 1, 2014. We generated an operating loss, net of depreciation and amortization, of $2.8 million at this facility during the time it was active in 2014, and an operating loss of $0.3 million at this facility for the year ended December 31, 2013. In addition, we reported a non-cash goodwill impairment charge of $1.0 million for the Idaho facility in the third quarter of 2013.
During the fourth quarter of 2013, the Florida DMS awarded to another operator contracts to manage the Three Florida Facilities which are owned by the state of Florida. We previously managed these facilities under contracts that expired on January 31, 2014. Accordingly, we transferred operations of these facilities to the new operator upon expiration of the contracts. These three facilities operated at breakeven during the time they were active in 2014 and generated combined facility operating income, net of depreciation and amortization, of $1.5 million for the year ended December 31, 2013. In addition, we reported a non-cash goodwill impairment charge of $1.1 million for one of the Three Florida Facilities in the fourth quarter of 2013.
We expect the managed-only business to remain competitive and we will only pursue opportunities for managed-only business where we are sufficiently compensated for the risk associated with this competitive business. Further, we may terminate existing contracts from time to time when we are unable to achieve per diem increases that offset increasing
62
expenses and enable us to maintain safe, effective operations. During 2014 and 2013, managed-only facilities generated 5.3% and 8.2%, respectively, of our total facility net operating income.
Other Facility Related Activity
In October 2013, we entered into a lease for our California City Correctional Center with the CDCR. The lease agreement includes a three-year base term that commenced December 1, 2013, with unlimited two-year renewal options upon mutual agreement. Annual base rent during the three-year base term is fixed at $28.5 million. After the three-year base term, the rent will be increased annually by the lesser of CPI (Consumer Price Index) or 2%. We are responsible for repairs and maintenance, property taxes and property insurance, while all other aspects and costs of facility operations are the responsibility of the CDCR. We also provided $10.0 million in tenant allowances and improvements. Profitability increased at this facility compared with the prior year, when the facility was only partially occupied by USMS and ICE populations.
General and administrative expense
For the years ended December 31, 2014 and 2013, general and administrative expenses totaled $106.4 million and $103.6 million respectively. General and administrative expenses consist primarily of corporate management salaries and benefits, professional fees, and other administrative expenses. General and administrative expenses increased in 2014 when compared to 2013 primarily as a result of increased professional fees of $4.2 million for assistance with several corporate initiatives and legal matters, and increased incentive compensation of $6.0 million. General and administrative expenses in 2014 also included $1.5 million of expenses associated with the write-off of costs in the first quarter of 2014 related to a parcel of land we previously optioned in connection with the construction of the Otay Mesa Detention Center; however, we were able to design a more efficient structure that no longer required this parcel as part of the footprint. General and administrative expenses during 2013 included professional fees and expenses of $10.3 million associated with the conversion of our corporate structure to a REIT effective January 1, 2013. During the year ended December 31, 2013, we also incurred $0.8 million in connection with our acquisition of CAI.
Depreciation and Amortization
Depreciation and amortization expense totaled $113.9 million and $112.7 million during the years ended December 31, 2014 and 2013, respectively. The increase in depreciation and amortization expense primarily occurred at our Red Rock facility as a result of our new management contract with the Arizona Department of Corrections which was effective January 1, 2014. Our depreciation rate for the facility was adjusted to reflect the terms of the contract which provides the state of Arizona an option to purchase the facility at any time during the twenty-year term of the contract based on an amortization schedule starting with the fair market value and decreasing evenly to zero over the twenty-year term.
Interest expense, net
Interest expense was reported net of interest income and capitalized interest for the years ended December 31, 2014 and 2013. Gross interest expense, net of capitalized interest, was $43.1 million and $47.1 million for 2014 and 2013, respectively. Gross interest expense is based on outstanding borrowings under our revolving credit facility, our outstanding senior notes, as well as the amortization of loan costs and unused facility fees. We have benefited from relatively low interest rates on our revolving credit facility, which is largely based on
63
the London Interbank Offered Rate (LIBOR). It is possible that LIBOR could increase in the future. The interest rate on our revolving credit facility, which was amended and extended in March 2013, was at LIBOR plus a margin of 1.50% throughout 2013. The rate increased to LIBOR plus a margin of 1.75% during the first quarter of 2014 pursuant to the terms of the revolving credit facility based on an increase in our leverage ratio. Our interest expense was lower in 2014 compared to 2013 as we completed several refinancing transactions in the second quarter of 2013 which reduced our weighted average interest rate contributing to the reduction in interest expense.
We currently expect the outstanding balance on our revolving credit facility to increase during 2015 as we utilize additional borrowing capacity under it to complete the construction of two correctional facilities, further described under “Liquidity and Capital Resources” hereafter. We may issue additional debt securities in the future when we determine that market conditions and the opportunity to utilize the proceeds from the issuance of such securities are favorable. Our interest expense would increase in the future if we decide to pay down a portion of the revolving credit facility with proceeds from a long-term debt offering.
Gross interest income was $3.6 million and $2.0 million, respectively, for the years ended December 31, 2014 and 2013. Gross interest income is earned on a direct financing lease, notes receivable, investments, and cash and cash equivalents. Interest income generated on investments we hold in a rabbi trust were higher during the year ended December 31, 2014 compared to the same period in 2013. Capitalized interest was $2.5 million and $0.8 million during 2014 and 2013, respectively, and was associated with various construction and expansion projects as further described under “Liquidity and Capital Resources” hereafter.
Expenses associated with debt refinancing transactions
During the year ended December 31, 2013, we reported charges of $36.5 million, for the write-off of loan costs and the unamortized discount, redemption premium, and third-party fees and expenses associated with the tender offer for our then outstanding 7.75% senior unsecured notes.
Income tax expense
During the years ended December 31, 2014 and 2013, our financial statements reflected an income tax expense of $6.9 million and an income tax benefit of $135.0 million, respectively. The income tax benefit in 2013 was due primarily to a net tax benefit of $137.7 million resulting from the revaluation of certain deferred tax assets and liabilities associated with the REIT conversion effective January 1, 2013. Our effective tax rate was 3.4% during the year ended December 31, 2014, and was approximately 6.2% during the same period in 2013, excluding the aforementioned net tax benefit and the income tax benefit of certain other items. As a REIT, we are entitled to a deduction for dividends paid, resulting in a substantial reduction in the amount of federal income tax expense we recognize. Substantially all of our income tax expense is incurred based on the earnings generated by our TRSs. Our overall effective tax rate is estimated based on the current projection of taxable income primarily generated in our TRSs. Our consolidated effective tax rate could fluctuate in the future based on changes in estimates of taxable income, the relative amounts of taxable income generated by the TRSs and the REIT, the implementation of additional tax planning strategies, changes in federal or state tax rates or laws affecting tax credits available to us, changes in other tax laws, changes in estimates related to uncertain tax positions, or changes in state apportionment factors, as well as changes in the valuation allowance applied to our deferred tax assets that are based primarily on the amount of state net operating losses and tax credits that could expire unused.
64
Discontinued operations
During the second quarter of 2013, we announced that the TDCJ elected not to renew its contract for the 2,216-bed managed-only Dawson State Jail in Dallas, Texas due to a legislative budget reduction. As a result, upon expiration of the contract in August 2013, we ceased operations of the Dawson State Jail. During the second quarter of 2013, we also received notification that we were not selected for the continued management of the 1,000-bed managed-only Wilkinson County Correctional Facility in Woodville, Mississippi at the end of the contract on June 30, 2013. Accordingly, the results of operations, net of taxes, and the assets and liabilities of the Dawson and Wilkinson facilities have been reported as discontinued operations for all periods presented. The Dawson and Wilkinson facilities operated at a combined loss of $3.8 million, net of taxes, for the year ended December 31, 2013, and had no operations during 2014.
In April 2014, the FASB issued ASU 2014-08, “Presentation of Financial Statements (Topic 205) and Property, Plant, and Equipment (Topic 360): Reporting Discontinued Operations and Disclosures of Disposals of Components of an Entity”, which changed the criteria for reporting a discontinued operation. Specifically, ASU 2014-08 changed the current definition of “discontinued operations” so that only disposals of components that represent a strategic shift that has (or will have) a major effect on an entity’s operations and financial results qualify for discontinued operations reporting. We elected to early adopt ASU 2014-08 in the first quarter of 2014. Accordingly, under the guidelines of the new ASU 2014-08, the operations of the Three Florida Facilities were not reported as discontinued operations upon expiration of the contracts effective January 31, 2014. In addition, the operation of the Idaho Correctional Center was not reported as a discontinued operation upon expiration of the contract effective July 1, 2014, as we concluded that the four facilities do not meet the new definition of a discontinued operation and that they were not individually significant components of an entity. Under ASU 2014-08, previously reported discontinued operations are not reclassified as continuing operations even though such operations do not meet the new definition of a discontinued operation.
Year Ended December 31, 2013 Compared to the Year Ended December 31, 2012
During the year ended December 31, 2013, we generated net income of $300.8 million, or $2.70 per diluted share, compared with net income of $156.8 million, or $1.56 per diluted share, for the previous year. Net income was favorably impacted during 2013 by the income tax benefit of $137.7 million recorded during the first quarter of 2013, or $1.24 per diluted share, due to the revaluation of certain deferred tax assets and liabilities and other income taxes associated with the REIT conversion effective January 1, 2013. In addition, results for 2013 were favorably impacted by a tax benefit of $4.9 million, or $0.04 per share, due to certain tax strategies implemented during the second quarter of 2013 that resulted in a further reduction in income taxes. The income tax benefit during the second quarter of 2013 was offset by our decision to provide bonuses totaling $5.0 million, or $0.04 per share, to non-management staff in lieu of merit increases in 2013. We have monitored our compensation levels very closely and believe these adjustments to our compensation strategy were necessary to help ensure the long-term success of our business.
Net income for 2013 was negatively impacted due to several other non-routine items including $43.5 million, net of taxes, or $0.39 per diluted share for expenses associated with debt refinancing transactions, the REIT conversion, and with the acquisition of CAI, as further described hereafter. Net income was also negatively impacted during 2013 by asset impairments associated with contract terminations of $6.7 million, net of taxes, or $0.06 per diluted share. Earnings per share during the year ended December 31, 2013 was also negatively impacted by the additional 13.9 million shares issued as a result of the payment of a special dividend on May 20, 2013.
65
Net income for 2012 was also impacted by several non-routine items. As a result of the internal reorganization of our corporate structure completed on December 31, 2012 to facilitate our qualification as a REIT effective for our taxable year beginning January 1, 2013, we were required to revalue certain deferred tax assets and liabilities which resulted in a net tax benefit of $2.9 million, or $0.03 per diluted share, favorably impacting our net income during 2012. Net income was negatively impacted during 2012 by charges totaling $4.0 million, net of taxes, or $0.04 per diluted share, associated with debt refinancing transactions and the charges associated with the REIT conversion.
Facility Operations
Revenue and expenses per compensated man-day for all of the facilities placed into service that we owned or managed, exclusive of those discontinued (see further discussion below regarding discontinued operations) or held for lease, were as follows for the years ended December 31, 2013 and 2012:
| For the Years Ended December 31, |
||||||||
| 2013 | 2012 | |||||||
| Revenue per compensated man-day |
$ | 60.57 | $ | 60.22 | ||||
| Operating expenses per compensated man-day: |
||||||||
| Fixed expense |
32.48 | 31.91 | ||||||
| Variable expense |
10.26 | 10.13 | ||||||
|
|
|
|
|
|||||
| Total |
42.74 | 42.04 | ||||||
|
|
|
|
|
|||||
| Operating income per compensated man-day |
$ | 17.83 | $ | 18.18 | ||||
|
|
|
|
|
|||||
| Operating margin |
29.4 | % | 30.2 | % | ||||
|
|
|
|
|
|||||
| Average compensated occupancy |
85.2 | % | 87.9 | % | ||||
|
|
|
|
|
|||||
| Average available beds |
88,894 | 88,646 | ||||||
|
|
|
|
|
|||||
| Average compensated population |
75,698 | 77,961 | ||||||
|
|
|
|
|
|||||
The calculations of revenue and expenses per compensated man-day exclude revenues (and compensated man-days) earned and expenses incurred during the fourth quarter of 2013 for the Red Rock and Diamondback facilities because of the distorted impact they have on the statistics due to the transition to a new contract at the Red Rock facility and activation in anticipation of a new contract at the Diamondback facility during the quarter.
66
Revenue
Total revenue consists of revenue we generate in the operation and management of correctional and detention facilities, as well as rental revenue generated from facilities we lease to third-party operators, and from our inmate transportation subsidiary The following table reflects the components of revenue for the years ended December 31, 2013 and 2012 (in millions):
| For the Years Ended December 31, |
||||||||||||||||
| 2013 | 2012 | $ Change | % Change | |||||||||||||
| Management revenue: |
||||||||||||||||
| Federal |
$ | 740.0 | $ | 752.2 | $ | (12.2 | ) | (1.6 | %) | |||||||
| State |
823.6 | 848.4 | (24.8 | ) | (2.9 | %) | ||||||||||
| Local |
66.9 | 60.7 | 6.2 | 10.2 | % | |||||||||||
| Other |
57.3 | 57.1 | 0.2 | 0.4 | % | |||||||||||
|
|
|
|
|
|
|
|
|
|||||||||
| Total management revenue |
1,687.8 | 1,718.4 | (30.6 | ) | (1.8 | %) | ||||||||||
| Rental and other revenue |
6.5 | 5.3 | 1.2 | 22.6 | % | |||||||||||
|
|
|
|
|
|
|
|
|
|||||||||
| Total revenue |
$ | 1,694.3 | $ | 1,723.7 | $ | (29.4 | ) | (1.7 | %) | |||||||
|
|
|
|
|
|
|
|
|
|||||||||
The $30.6 million, or 1.8%, reduction in revenue associated with the operation and management of correctional and detention facilities consisted of a decrease in revenue of approximately $54.4 million caused by a decrease in the average daily compensated population during 2013 (including due to one fewer day of operations, for the leap year in 2012), partially offset by an increase of 0.6% in average revenue per compensated man-day. The reduction in revenue from 2012 to 2013 was also partially offset by an increase of $14.3 million of revenue resulting from Other Facility Related Activity, as further described hereafter.
Average daily compensated population decreased 2,263, or 2.9%, from 2012 to 2013. We experienced declines in populations from the USMS across several of our facilities primarily in the southwest region of the United States resulting in the decline in average compensated population. During 2013, we housed an average daily population of approximately 9,300 USMS offenders compared with approximately 10,600 USMS offenders during 2012. A substantial portion of the reduction in USMS populations occurred at our California City Correctional Center. During the fourth quarter of 2013, we entered into an agreement to lease this facility to the CDCR, resulting in the removal of the federal inmate populations from this facility.
Additionally, the decline in average compensated population resulted from idling our 2,103-bed Mineral Wells facility in the third quarter of 2013 after the TDCJ elected not to renew its contract with us. The decline in average compensated population also resulted from the transition of California inmates out of our Red Rock facility during the fourth quarter of 2013 in order to prepare for the receipt of inmates under our new contract with the state of Arizona, as further described herein. These declines in average compensated population were partially offset by the activation of our 1,124-bed Jenkins Correctional Center in March 2012, as well as the activation of a 454-bed expansion at our McRae Correctional Facility in the fourth quarter of 2012.
Our federal customers generated approximately 44% of our total revenue for both of the years ended December 31, 2013 and 2012, but decreased $12.2 million from 2012 to 2013. Our partners at the BOP, USMS, and ICE were impacted by the Budget Control Act of 2011, which mandated across the board spending cuts through a process called “sequestration” in order to meet overall discretionary spending limits in fiscal year 2013 and beyond.
67
State revenues decreased 2.9% from 2012 to 2013 primarily as a result of idling our Otter Creek facility during the third quarter of 2012 and our Mineral Wells facility in the third quarter of 2013. In addition, the decrease in revenues was a result of transitioning California inmates out of our Red Rock facility during the fourth quarter of 2013 to prepare the facility for the commencement of a new contract with the state of Arizona on January 1, 2014. These declines were partially offset by the activations of our Jenkins and McRae facilities during 2012. Local revenues increased primarily as a result of new management contracts and the acquisition of CAI.
Operating Expenses
Operating expenses totaled $1,220.4 million and $1,217.1 million for the years ended December 31, 2013 and 2012, respectively. Operating expenses consist of those expenses incurred in the operation and management of correctional and detention facilities, as well as at facilities we lease to third-party operators, and for our inmate transportation subsidiary.
Expenses incurred in connection with the operation and management of correctional and detention facilities increased $4.2 million, or 0.3%, during 2013 compared with 2012. The increase in operating expenses was primarily a result of $16.9 million of operating expenses resulting from Other Facility Related Activity, as further described hereafter. In addition, we experienced increases in salaries and benefits, inmate medical and food services, partially offset by decreases in operating expenses at certain facilities that experienced operational transitions. Most notably, operating expenses decreased as a result of idling the Otter Creek Correctional Center during the third quarter of 2012 and idling the Mineral Wells Pre-Parole Transfer Facility during the third quarter of 2013. Further, operating expenses at our Red Rock facility decreased as a result of transitioning California inmates out of the facility during the fourth quarter of 2013 to prepare the facility for the commencement of a new contract with the state of Arizona on January 1, 2014. Operating expenses decreased $21.5 million at these three facilities during the year ended December 31, 2013.
Fixed expenses per compensated man-day increased to $32.48 during the year ended December 31, 2013 from $31.91 during the year ended December 31, 2012 primarily as a result of an increase in salaries and benefits per compensated man-day of $0.20. We provided wage increases in the third quarters of 2011 and 2012 to the majority of our employees, which resulted in an increase in operating expenses per compensated man-day, particularly as these fixed expenses were leveraged over lower inmate populations. We did not provide wage increases to the majority of our employees in 2013. However, in lieu of a wage increase, we elected to pay approximately $5.0 million in bonuses to non-management level staff. Salaries and benefits represent the most significant component of fixed operating expenses, representing approximately 65% of our operating expenses during both 2013 and 2012.
Variable expenses increased $0.13 per compensated man-day during the year ended December 31, 2013 from the year ended December 31, 2012. Increases in inmate medical and contractual inflationary increases in food service were partially offset by the implementation of certain sales tax strategies which reduced variable expenses per compensated man-day by $0.15 in 2013.
68
The following tables display the revenue and expenses per compensated man-day for the facilities placed into service that we own and manage and for the facilities we manage but do not own:
| For the Years Ended December 31, |
||||||||
| 2013 | 2012 | |||||||
| Owned and Managed Facilities: |
||||||||
| Revenue per compensated man-day |
$ | 68.19 | $ | 67.61 | ||||
| Operating expenses per compensated man-day: |
||||||||
| Fixed expense |
35.02 | 34.13 | ||||||
| Variable expense |
10.66 | 10.46 | ||||||
|
|
|
|
|
|||||
| Total |
45.68 | 44.59 | ||||||
|
|
|
|
|
|||||
| Operating income per compensated man-day |
$ | 22.51 | $ | 23.02 | ||||
|
|
|
|
|
|||||
| Operating margin |
33.0 | % | 34.0 | % | ||||
|
|
|
|
|
|||||
| Average compensated occupancy |
81.6 | % | 85.1 | % | ||||
|
|
|
|
|
|||||
| Average available beds |
67,588 | 67,340 | ||||||
|
|
|
|
|
|||||
| Average compensated population |
55,123 | 57,337 | ||||||
|
|
|
|
|
|||||
| Managed Only Facilities: |
||||||||
| Revenue per compensated man-day |
$ | 40.14 | $ | 39.69 | ||||
| Operating expenses per compensated man-day: |
||||||||
| Fixed expense |
25.68 | 25.72 | ||||||
| Variable expense |
9.20 | 9.21 | ||||||
|
|
|
|
|
|||||
| Total |
34.88 | 34.93 | ||||||
|
|
|
|
|
|||||
| Operating income per compensated man-day |
$ | 5.26 | $ | 4.76 | ||||
|
|
|
|
|
|||||
| Operating margin |
13.1 | % | 12.0 | % | ||||
|
|
|
|
|
|||||
| Average compensated occupancy |
96.6 | % | 96.8 | % | ||||
|
|
|
|
|
|||||
| Average available beds |
21,306 | 21,306 | ||||||
|
|
|
|
|
|||||
| Average compensated population |
20,575 | 20,624 | ||||||
|
|
|
|
|
|||||
Owned and Managed Facilities
Facility net operating income, or the operating income or loss from operations before interest, taxes, asset impairments, depreciation and amortization, at our owned and managed facilities decreased by $38.4 million, from $483.1 million during the year ended December 31, 2012 to $444.7 million during the year ended December 31, 2013, a decrease of 7.9%. The decrease in facility net operating income at our owned and managed facilities during 2013 is largely the result of reductions in margins associated with declines in USMS populations at certain facilities, the termination of the contract at our Mineral Wells Pre-Parole Transfer Facility, a decrease in ICE populations at the Stewart and North Georgia facilities, and a decrease in inmate populations from the CDCR. Additionally, the aforementioned wage increases provided to the majority of our employees in July 2011 and 2012 and the bonuses in lieu of raises for non-management level employees during 2013 also contributed to the decline in facility net operating income.
In July 2013, we extended our agreement with the CDCR to continue to house inmates at the four facilities we currently operate for them in Arizona, Oklahoma, and Mississippi. The
69
extension, which runs through June 30, 2016, also allowed CDCR to transition California inmates previously housed at our Red Rock Correctional Center to our other facilities. Accordingly, as of December 31, 2013, all of the California inmates were removed from our Red Rock Correctional Center in order to prepare for the receipt of inmates under our new contract with the state of Arizona, which commenced January 1, 2014. While the transition resulted in the loss of some of the inmates housed at the Red Rock facility, the transition plan included retention and transfer of certain inmates to our other facilities. The calculations of revenue and expenses per compensated man-day in the preceding table exclude revenues (and compensated man-days) earned and expenses incurred during the fourth quarter of 2013 for the Red Rock facility because of the distorted impact they have on the statistics due to the transition to a new contract.
In October 2011, we announced that, pursuant to a competitive re-bid, we received a new contract from the BOP for the expansion and continued management of our McRae Correctional Facility in Georgia. We experienced a reduction in operating margin at this facility effective with the commencement of the new contract in December 2012. We accepted this contract even though it provides us with a lower margin because it also provides for a long term contract of up to ten years, including extension options, and allows us to protect our market share. Further, the contract guarantees a BOP population equal to 90% of the expanded rated capacity and a per diem payment for each additional inmate thereafter.
During the second quarter of 2013, we announced that the TDCJ elected not to renew its contract for our owned and managed 2,103-bed Mineral Wells Pre-Parole Transfer Facility due to a legislative budget reduction. As a result, upon expiration of the contract in August 2013, we ceased operations and idled the Mineral Wells facility. Further, the KDOC provided us notice during the second quarter of 2013 that it was not going to award a contract under the RFP that would have allowed for the KDOC’s continued use of our owned and managed 826-bed Marion Adjustment Center. We also idled the Marion Adjustment Center following the transfer of the populations during September 2013. These two facilities generated combined facility net operating losses of $1.1 million for the year ended December 31, 2013, compared with facility net operating income of $6.6 million for the year ended December 31, 2012.
During the third quarter of 2013, we began hiring staff at the Diamondback Correctional Facility in order to reactivate the facility for future operations. Our decision to activate the facility was made as a result of potential need for additional beds by certain state customers. While we began to incur expenditures associated with the activation of these beds, we did not have a customer contract and, as previously described herein, we subsequently made the decision to re-idle the facility. The de-activation was completed near the end of the second quarter of 2014. The calculations of expenses per man-day in the preceding table exclude expenses incurred during the fourth quarter of 2013 for the Diamondback facility because of the distorted impact they have on the statistics.
Managed-Only Facilities
Total revenue at our managed only facilities increased $1.9 million from $299.6 million in 2012 to $301.5 million in 2013. Revenue per compensated man-day increased to $40.14 from $39.69, or 1.1%, for 2013 compared with the prior year. Facility net operating income at our managed-only facilities increased $3.6 million, from $35.9 million during the year ended December 31, 2012 to $39.6 million during the year ended December 31, 2013.
70
Operating expenses per compensated man-day decreased to $34.88 during the year ended December 31, 2013 from $34.93 during the year ended December 31, 2012 largely due to favorable claims experience associated with our self-insured employee medical expenses.
During 2013 and 2012, managed-only facilities generated 8.2% and 6.9%, respectively, of our total facility net operating income.
Other Facility Related Activity
In October 2013, we entered into a lease for our 2,304-bed California City Correctional Center with the CDCR. The lease agreement includes a three-year base term that commenced December 1, 2013, with unlimited two-year renewal options upon mutual agreement. Annual base rent during the three-year base term is fixed at $28.5 million. After the three-year base term, the rent will be increased annually by the lesser of CPI (Consumer Price Index) or 2%. We will be responsible for repairs and maintenance, property taxes and property insurance, while all other aspects and costs of facility operations will be the responsibility of the CDCR. We also provided $10.0 million in tenant improvements at no additional cost to the CDCR.
Revenues and operating expenses during the fourth quarter of 2013 were impacted due to a one-time contract adjustment by one of our federal partners. The contract adjustment resulted in a $13.0 million expense accrual in the fourth quarter of 2013 as well as an offsetting $13.0 million revenue accrual as the federal partner is obligated to reimburse us for the increased costs resulting from the contract adjustment. Both the revenue and expense accruals were revised to $9.0 million during the first quarter of 2014, resulting in a reduction of both revenue and operating expenses by $4.0 million. Because of the distorted impact these amounts would have on the per compensated man-day statistics presented in the previous table, the revenue and expenses related to this adjustment were not included.
General and administrative expense
For the years ended December 31, 2013 and 2012, general and administrative expenses totaled $103.6 million and $88.9 million respectively. General and administrative expenses consist primarily of corporate management salaries and benefits, professional fees, and other administrative expenses. General and administrative expenses during 2013 included professional fees and expenses of $10.3 million associated with the conversion of our corporate structure to a REIT effective January 1, 2013, compared with $4.2 million during 2012. During the year ended December 31, 2013, we also incurred $0.8 million in connection with our acquisition of CAI.
Interest expense, net
Interest expense was reported net of interest income and capitalized interest for the years ended December 31, 2013 and 2012. Gross interest expense, net of capitalized interest, was $47.1 million and $60.5 million for 2013 and 2012, respectively. Gross interest expense during these periods was based on outstanding borrowings under our revolving credit facility, our outstanding senior notes, as well as the amortization of loan costs and unused facility fees. We benefited from relatively low interest rates on our revolving credit facility, which is largely based on the LIBOR. The interest rate on our revolving credit facility was at LIBOR plus a margin of 1.50% throughout 2013 and 2012.
Our interest expense was lower in 2013 compared to 2012 as we redeemed during 2012 all of our $375.0 million 6.25% senior unsecured notes and all of our $150.0 million 6.75% senior unsecured notes with the expanded capacity under our revolving credit facility and cash on
71
hand. As a result of these redemptions, we reduced our weighted average interest rate. During the second quarter of 2013, we completed several refinancing transactions which resulted in a further reduction to our interest expense.
Gross interest income was $2.0 million and $2.1 million, respectively, for the years ended December 31, 2013 and 2012. Gross interest income is earned on a direct financing lease, notes receivable, investments, and cash and cash equivalents. Capitalized interest was $0.8 million and $1.1 million during 2013 and 2012, respectively, and was associated with various construction and expansion projects.
Expenses associated with debt refinancing transactions
During the year ended December 31, 2013, we reported charges of $36.5 million for third-party fees and expenses associated with the tender offer and redemption for all of our outstanding 7.75% senior unsecured notes, consisting of the write-off of loan costs and the unamortized discount on the 7.75% senior unsecured notes, the tender fees and expenses associated with the purchase, and the redemption premium paid on the 7.75% senior unsecured notes.
During the year ended December 31, 2012, we reported charges of $2.1 million in connection with debt refinancing transactions, consisting of $1.7 million for the write-off of loan costs associated with an amendment to our revolving credit facility, various redemptions of senior unsecured notes during 2012, and $0.4 million of fees paid in connection with the tender offer for our 6.25% senior unsecured notes in the first quarter of 2012.
Income tax expense
During the years ended December 31, 2013 and 2012, our financial statements reflected an income tax benefit of $135.0 million and an income tax expense of $87.5 million, respectively. The income tax benefit during 2013 is due primarily to the $137.7 million net tax benefit recorded in the first quarter resulting from the revaluation of certain deferred tax assets and liabilities associated with the REIT conversion effective January 1, 2013. Our effective tax rate during the year ended 2013 was approximately 6.2%, excluding the aforementioned net tax benefit and the income tax benefit of certain other items, and was 35.8% during the year ended December 31, 2012. Our effective tax rate is significantly lower in 2013 as a result of our election to be taxed as a REIT effective January 1, 2013. As a REIT, we are entitled to a deduction for dividends paid, resulting in a substantial reduction in the amount of federal income tax expense we recognize. Substantially all of our income tax expense is incurred based on the earnings generated by our TRSs. Our overall effective tax rate is based on the taxable income primarily generated in our TRSs.
Discontinued operations
In November 2011, we announced a joint decision with the state of Mississippi to cease operations of the 1,172-bed Delta Correctional Facility in Greenwood, Mississippi. We began ramping down the population of approximately 900 inmates from the state-owned facility in December 2011 and completely closed the facility in January 2012. Accordingly, we reclassified the results of operations, net of taxes, and the assets and liabilities of this facility as discontinued operations upon termination of operations in the first quarter of 2012 for all periods presented. The facility operated at a loss of $0.4 million, net of taxes, for the year ended December 31, 2012.
During the second quarter of 2013, we announced that the TDCJ elected not to renew its contract for the 2,216-bed managed-only Dawson State Jail in Dallas, Texas due to a
72
legislative budget reduction. As a result, upon expiration of the contract in August 2013, we ceased operations of the Dawson State Jail. During the second quarter of 2013, we also received notification that we were not selected for the continued management of the 1,000-bed managed-only Wilkinson County Correctional Facility in Woodville, Mississippi at the end of the contract on June 30, 2013. Accordingly, the results of operations, net of taxes, and the assets and liabilities of the Dawson and Wilkinson facilities have been reported as discontinued operations for all periods presented. The Dawson and Wilkinson facilities operated at a combined loss of $3.8 million and a combined profit of $0.2 million, net of taxes, for the years ended December 31, 2013 and 2012, respectively.
LIQUIDITY AND CAPITAL RESOURCES
Our principal capital requirements are for working capital, stockholder distributions, capital expenditures, and debt service payments. Capital requirements may also include cash expenditures associated with our outstanding commitments and contingencies, as further discussed in the notes to our financial statements. Additionally, we may incur capital expenditures to expand the design capacity of certain of our facilities (in order to retain management contracts) and to increase our inmate bed capacity for anticipated demand from current and future customers. We may acquire additional correctional facilities that we believe have favorable investment returns and increase value to our stockholders. We will also consider opportunities for growth, including, but not limited to, potential acquisitions of businesses within our line of business and those that provide complementary services, provided we believe such opportunities will broaden our market share and/or increase the services we can provide to our customers.
On July 31, 2013, we closed on the acquisition of CAI, a privately held community corrections company, for an all cash purchase price of approximately $36.5 million, excluding transaction related expenses. Founded in 1987, CAI provides cost-effective solutions for housing and rehabilitation through community corrections and re-entry services. CAI operates two facilities concentrating on community corrections and specializing in work furloughs, residential re-entry programs and home confinement for San Diego County and BOP residents. Through the CAI acquisition, we acquired a 120-bed facility and control a 483-bed facility through a long-term lease.
To qualify and be taxed as a REIT, we generally are required to distribute annually to our stockholders at least 90% of our REIT taxable income (determined without regard to the dividends paid deduction and excluding net capital gains). Our REIT taxable income will not typically include income earned by our TRSs except to the extent our TRSs pay dividends to the REIT. Our Board of Directors declared a quarterly dividend of $0.51 for each quarter of 2014 totaling $239.1 million. The amount, timing and frequency of future distributions will be at the sole discretion of our Board of Directors and will be declared based upon various factors, many of which are beyond our control, including our financial condition and operating cash flows, the amount required to maintain qualification and taxation as a REIT and reduce any income and excise taxes that we otherwise would be required to pay, limitations on distributions in our existing and future debt instruments, our ability to utilize net operating losses, or NOLs, to offset, in whole or in part, our REIT distribution requirements, limitations on our ability to fund distributions using cash generated through our TRSs and other factors that our Board of Directors may deem relevant.
As of December 31, 2014, our liquidity was provided by cash on hand of $74.4 million, and $358.7 million available under our $900.0 million revolving credit facility. During the year ended December 31, 2014 and 2013, we generated $423.6 million and $369.5 million, respectively, in cash through operating activities, and as of December 31, 2014, we had net working capital of $47.0 million. We currently expect to be able to meet our cash expenditure
73
requirements for the next year utilizing these resources. None of our outstanding debt requires scheduled principal repayments and we have no debt maturities until December 2017.
Our cash flow is subject to the receipt of sufficient funding of and timely payment by contracting governmental entities. If the appropriate governmental agency does not receive sufficient appropriations to cover its contractual obligations, it may terminate our contract or delay or reduce payment to us. Delays in payment from our major customers or the termination of contracts from our major customers could have an adverse effect on our cash flow and financial condition.
Debt
As of December 31, 2014, we had $350.0 million principal amount of unsecured notes outstanding with a fixed stated interest rate of 4.625%, $325.0 million principal amount of unsecured notes outstanding with a fixed stated interest rate of 4.125%, and $525.0 million outstanding under our revolving credit facility with a variable weighted average interest rate of 1.9%. At December 31, 2014, our total weighted average effective interest rate was 3.6% while our total weighted average maturity was 5.2 years. We also have the flexibility to issue debt or equity securities from time to time when we determine that market conditions and the opportunity to utilize the proceeds from the issuance of such securities are favorable.
On March 21, 2013, Standard & Poor’s Ratings Services raised our corporate credit rating to “BB+” from “BB” and also assigned a “BB+” rating to our unsecured notes. Additionally, on April 5, 2013, Standard & Poor’s Ratings Services assigned a rating of “BBB” to our $900.0 million revolving credit facility. On February 7, 2012, Fitch Ratings assigned a rating of “BBB-” to our revolving credit facility and “BB+” ratings to our unsecured debt and corporate credit. On January 31, 2013, Fitch Ratings affirmed these ratings in connection with our intention to convert to a REIT and reaffirmed them on January 26, 2015. On June 3, 2011, Moody’s raised our senior unsecured debt rating to “Ba1” from “Ba2” and revised the outlook on our debt rating from positive to stable. On March 21, 2013, Moody’s revised the rating outlook to positive from stable, and affirmed the senior unsecured rating at “Ba1”.
Facility development and capital expenditures
In order to retain federal inmate populations we currently manage in the 1,154-bed San Diego Correctional Facility, we are constructing the 1,492-bed Otay Mesa Detention Center at a site in San Diego. The existing San Diego Correctional Facility is subject to a ground lease with the County of San Diego. Under the provisions of the lease, the facility is divided into three different properties whereby, pursuant to an amendment to the ground lease executed in January 2010, ownership of the entire facility reverts to the County upon expiration of the lease on December 31, 2015. As of December 31, 2014, we have invested approximately $121.5 million related to the new facility. We have developed plans to build the Otay Mesa Detention Center within a construction timeline that coincides with the expiration of the ground lease with the County of San Diego. We currently estimate the total construction cost, inclusive of land and site development costs already incurred, will range from approximately $153.0 million to $157.0 million. We plan to offer this new facility to house the existing federal inmate populations at the San Diego Correctional Facility.
In November 2013, we announced our decision to re-commence construction of a correctional facility in Trousdale County, Tennessee. We suspended construction of this facility in 2009 until we had greater clarity around the timing of a new contract. In October 2013, Trousdale County received notice from the Tennessee Department of Corrections of its intent to partner with the County to develop a new correctional facility to house state of
74
Tennessee inmates. In April 2014, we entered into an agreement with Trousdale County whereby we agreed to finance, design, build and operate a 2,552-bed facility to meet the responsibilities of a separate IGSA between Trousdale County and the state of Tennessee regarding correctional services. In July 2014, we received notice that Trousdale County and the state of Tennessee finalized the IGSA. The IGSA with the state of Tennessee includes a minimum monthly payment plus a per diem payment for each inmate housed in the facility in excess of 90% of the design capacity, provided that during a twenty-six week ramp period the minimum payment is based on the greater of the number of inmates actually at the facility or 90% of the beds available pursuant to the ramp schedule. Total cost of the Trousdale Turner Correctional Center is estimated at approximately $140.0 million to $145.0 million, including $60.7 million invested through December 31, 2014. The construction estimate includes capital investment funding to achieve Leadership in Energy and Environmental Design (“LEED”) certification and upgrade fixtures that reduce both water and energy consumption during the life of the facility. These investments support our belief in corporate responsibility to both the global environment and the local community in which facilities are located. Construction is expected to be completed in the fourth quarter of 2015, with the intake of inmate populations expected to begin in the first quarter of 2016.
In addition to these two new facility construction projects, we entered into an amended agreement with ICE whereby we agreed to construct additional administrative space for ICE at our Stewart Detention Center. We expect to incur approximately $6.0 million, including $0.6 million invested through December 31, 2014, in construction costs and expect to complete the project in the second quarter of 2015. In order for ICE to ensure its access to the beds at the Stewart facility, the amended agreement also includes a fixed monthly payment for 1,600 beds which will take effect once the expansion is completed. Additionally, we expect to incur approximately $24.0 million, including $9.1 million invested through December 31, 2014, in certain leasehold improvements and furniture, fixtures and equipment at the South Texas Family Residential Center, which amount is in addition to the lease payments under the lease agreement. We expect to complete these additions by the end of the second quarter of 2015 when the South Texas facility is expected to be ready for full occupancy.
The demand for capacity in the short-term has been affected by the budget challenges many of our government partners currently face. At the same time, these challenges impede our customers’ ability to construct new prison beds of their own or update older facilities, which we believe could result in further need for private sector capacity solutions in the long-term. We intend to continue to pursue build-to-suit opportunities like our 2,552-bed Trousdale Turner Correctional Center under construction in Trousdale County, Tennessee, and alternative solutions like the recently announced 2,400-bed South Texas Family Residential Center whereby we identified a site and lessor to provide residential housing and administrative buildings for ICE. In the long-term, however, we would like to see continued and meaningful utilization of our available capacity and better visibility from our customers before we add any additional capacity on a speculative basis.
Operating Activities
Our net cash provided by operating activities for the year ended December 31, 2014 was $423.6 million compared with $369.5 million in 2013 and $283.3 million in 2012. Cash provided by operating activities represents our net income plus depreciation and amortization, changes in various components of working capital, and various non-cash charges, including primarily deferred income taxes. The increase in cash provided by operating activities during 2014 was primarily due to the receipt of a $70.0 million payment from our customer in the fourth quarter of 2014 related to the aforementioned South Texas Family Residential Center. The amount, along with portions of other monthly payments
75
under the contract, is included in deferred revenue in the consolidated balance sheet as of December 31, 2014. Slightly offsetting the effect of the $70.0 million payment were negative fluctuations in working capital balances during 2014 when compared to the same period in 2013, including routine timing differences in the collection of accounts receivables and in the payment of accounts payables, accrued salaries and wages, and other liabilities. The increase in cash provided by operating activities during 2013 from 2012 was primarily due to lower income taxes resulting from our conversion to a REIT effective January 1, 2013 contributing to an increase in net income after adjusting for the non-cash write-off of certain deferred tax assets and liabilities resulting from the REIT conversion and adjusting for certain non-cash charges. The increase in cash provided by operating activities also resulted from favorable fluctuations in working capital balances during 2013 when compared to the same period in 2012.
Investing Activities
Our cash flow used in investing activities was $196.9 million for the year ended December 31, 2014 and was primarily attributable to capital expenditures during the year of $135.1 million, including expenditures for facility development and expansions of $85.8 million primarily related to the aforementioned facility development projects, and $49.3 million for facility maintenance and information technology capital expenditures. In addition, cash flow used in investing activities included $70.8 million of capitalized lease payments related to the aforementioned South Texas Family Residential Center, reported in accordance with Accounting Standard Codification 840-40-55, formerly Emerging Issues Task Force No. 97-10, “The Effect of Lessee Involvement in Asset Construction.” Cash flow used in investing activities for the year ended December 31, 2014 was partially offset by proceeds from the sale of assets and net decreases in restricted cash and other assets.
Our cash flow used in investing activities was $125.5 million for the year ended December 31, 2013 and was primarily attributable to capital expenditures during the year of $89.3 million, including expenditures for facility development and expansions of $40.7 million primarily related to the facility development and expansion projects previously discussed herein and including renovations pursuant to new customer agreements at our California City and Red Rock facilities, and $48.6 million for facility maintenance and information technology capital expenditures. Our 2013 investing activities also included $36.3 million in cash paid, net of cash acquired, for the acquisition of CAI. Our cash flow used in investing activities was $79.9 million for the year ended December 31, 2012, and was primarily attributable to capital expenditures during the year of $79.4 million, including $30.4 million for the expansion and development activities previously discussed herein, and $49.0 million for facility maintenance and information technology capital expenditures.
Financing Activities
Cash flow used in financing activities was $230.2 million for the year ended December 31, 2014 and was primarily attributable to dividend payments of $234.0 million. Additionally, cash flow used in financing activities included $4.0 million for the purchase and retirement of common stock that was issued in connection with equity-based compensation and $5.0 million of net payments on our revolving credit facility. These payments were partially offset by cash flows associated with exercising stock options, including the related income tax benefit of equity compensation, totaling $13.1 million.
Cash flow used in financing activities was $229.0 million for the year ended December 31, 2013 and was primarily attributable to dividend payments of $299.4 million. Cash flow used in financing activities also included $37.3 million for the payment of debt issuance and other refinancing costs. Additionally, cash flow used in financing activities included $6.7 million
76
for the purchase and retirement of common stock that was issued in connection with equity-based compensation. These payments were partially offset by $85.0 million of net proceeds from issuance of debt as well as the cash flows associated with exercising stock options, including the related income tax benefit of equity compensation, totaling $30.5 million.
Cash flow used in financing activities was $196.3 million for the year ended December 31, 2012 and was primarily attributable to $135.0 million of net principal payments of debt and $6.3 million for payments of debt issuance and other refinancing costs associated with refinancing transactions. Additionally, cash flow used in financing activities included $59.8 million of dividends paid during the year ended December 31, 2012 and $2.8 million for the purchase and retirement of common stock that was issued in connection with equity-based compensation. These payments were partially offset by the cash flows associated with exercising stock options, including the related income tax benefit of equity compensation, totaling $7.6 million.
Funds from Operations
Funds From Operations, or FFO, is a widely accepted supplemental non-GAAP measure utilized to evaluate the operating performance of real estate companies. The National Association of Real Estate Investment Trusts, or NAREIT, defines FFO as net income computed in accordance with generally accepted accounting principles, excluding gains or losses from sales of property and extraordinary items, plus depreciation and amortization of real estate and impairment of depreciable real estate and after adjustments for unconsolidated partnerships and joint ventures calculated to reflect funds from operations on the same basis.
We believe FFO is an important supplemental measure of our operating performance and believe it is frequently used by securities analysts, investors and other interested parties in the evaluation of REITs, many of which present FFO when reporting results.
We also present Normalized FFO as an additional supplemental measure as we believe it is more reflective of our core operating performance. We may make adjustments to FFO from time to time for certain other income and expenses that we consider non-recurring, infrequent or unusual, even though such items may require cash settlement, because such items do not reflect a necessary component of our ongoing operations. Normalized FFO excludes the effects of such items.
FFO and Normalized FFO are supplemental non-GAAP financial measures of real estate companies’ operating performances, which do not represent cash generated from operating activities in accordance with GAAP and therefore should not be considered an alternative for net income or as a measure of liquidity. Our method of calculating FFO and Normalized FFO may be different from methods used by other REITs and, accordingly, may not be comparable to such other REITs.
77
Our reconciliation of net income to FFO and Normalized FFO for the years ended December 31, 2014, 2013, and 2012 is as follows (in thousands):
| For the Years Ended December 31 | ||||||||||||
| 2014 | 2013 | 2012 | ||||||||||
| FUNDS FROM OPERATIONS: |
||||||||||||
| Net income |
$ | 195,022 | $ | 300,835 | $ | 156,761 | ||||||
| Depreciation of real estate assets |
85,560 | 81,313 | 79,145 | |||||||||
| Impairment of real estate assets, net of taxes |
29,843 | — | — | |||||||||
|
|
|
|
|
|
|
|||||||
| Funds From Operations |
310,425 | 382,148 | 235,906 | |||||||||
| Expenses associated with debt refinancing transactions, net of taxes |
— | 33,299 | 1,316 | |||||||||
| Expenses associated with REIT conversion, net of taxes |
— | 9,522 | 2,679 | |||||||||
| Expenses associated with mergers and acquisitions, net of taxes |
— | 713 | — | |||||||||
| Goodwill and other impairments, net of taxes |
119 | 6,736 | — | |||||||||
| Income tax benefit for reversal of deferred taxes due to REIT conversion |
— | (137,686 | ) | (2,891 | ) | |||||||
|
|
|
|
|
|
|
|||||||
| Normalized Funds From Operations |
$ | 310,544 | $ | 294,732 | $ | 237,010 | ||||||
|
|
|
|
|
|
|
|||||||
Contractual Obligations
The following schedule summarizes our contractual obligations by the indicated period as of December 31, 2014 (in thousands):
| Payments Due By Year Ended December 31, | ||||||||||||||||||||||||||||
| 2015 | 2016 | 2017 | 2018 | 2019 | Thereafter | Total | ||||||||||||||||||||||
| Long-term debt |
$ | — | $ | — | $ | 525,000 | $ | — | $ | — | $ | 675,000 | $ | 1,200,000 | ||||||||||||||
| Interest on senior notes |
29,594 | 29,594 | 29,594 | 29,594 | 29,594 | 63,358 | 211,328 | |||||||||||||||||||||
| Contractual facility developments and other commitments |
86,656 | — | — | — | — | — | 86,656 | |||||||||||||||||||||
| South Texas Family Residential Center |
125,827 | 92,056 | 73,412 | 53,733 | — | — | 345,028 | |||||||||||||||||||||
| Operating leases |
2,748 | — | — | — | — | — | 2,748 | |||||||||||||||||||||
|
|
|
|
|
|
|
|
|
|
|
|
|
|
|
|||||||||||||||
| Total contractual cash obligations |
$ | 244,825 | $ | 121,650 | $ | 628,006 | $ | 83,327 | $ | 29,594 | $ | 738,358 | $ | 1,845,760 | ||||||||||||||
|
|
|
|
|
|
|
|
|
|
|
|
|
|
|
|||||||||||||||
The cash obligations in the table above do not include future cash obligations for variable interest expense associated with our outstanding revolving credit facility as projections would be based on future outstanding balances as well as future variable interest rates, and we are unable to make reliable estimates of either. Further, the cash obligations in the table above also do not include future cash obligations for uncertain tax positions as we are unable to make reliable estimates of the timing of such payments, if any, to the taxing authorities. The contractual facility developments included in the table above represent development projects for which we have already entered into a contract with a customer that obligates us to complete the development project. With respect to the South Texas Family Residential Center, the cash obligations included in the table above reflect the full contractual obligations of various contracts, excluding contingent payments, for periods up to 48 months even though many of these agreements provide us with the ability to terminate if ICE terminates the amended IGSA. Certain of our other ongoing construction projects are not currently under contract and thus are not included as a contractual obligation above as we may generally suspend or terminate such projects without substantial penalty.
78
We had $16.3 million of letters of credit outstanding at December 31, 2014 primarily to support our requirement to repay fees and claims under our workers’ compensation plan in the event we do not repay the fees and claims due in accordance with the terms of the plan. The letters of credit are renewable annually. We did not have any draws under any outstanding letters of credit during 2014, 2013, or 2012.
Many of our management contracts include provisions for inflationary indexing, which mitigates an adverse impact of inflation on net income. However, a substantial increase in personnel costs, workers’ compensation or food and medical expenses could have an adverse impact on our results of operations in the future to the extent that these expenses increase at a faster pace than the per diem or fixed rates we receive for our management services. We outsource our food service operations to a third party. The contract with our outsourced food service vendor contains certain protections against increases in food costs.
SEASONALITY AND QUARTERLY RESULTS
Our business is somewhat subject to seasonal fluctuations. Because we are generally compensated for operating and managing facilities at an inmate per diem rate, our financial results are impacted by the number of calendar days in a fiscal quarter. Our fiscal year follows the calendar year and therefore, our daily profits for the third and fourth quarters include two more days than the first quarter (except in leap years) and one more day than the second quarter. Further, salaries and benefits represent the most significant component of operating expenses. Significant portions of the Company’s unemployment taxes are recognized during the first quarter, when base wage rates reset for unemployment tax purposes. Finally, quarterly results are affected by government funding initiatives, the timing of the opening of new facilities, or the commencement of new management contracts and related start-up expenses which may mitigate or exacerbate the impact of other seasonal influences. Because of these seasonality factors, results for any quarter are not necessarily indicative of the results that may be achieved for the full fiscal year.
| ITEM 7A. | QUANTITATIVE AND QUALITATIVE DISCLOSURES ABOUT MARKET RISK. |
Our primary market risk exposure is to changes in U.S. interest rates. We are exposed to market risk related to our revolving credit facility because the interest rate on our revolving credit facility is subject to fluctuations in the market. If the interest rate for our outstanding indebtedness under the revolving credit facility was 100 basis points higher or lower during the years ended December 31, 2014, 2013, and 2012, our interest expense, net of amounts capitalized, would have been increased or decreased by $5.7 million, $5.3 million, and $5.7 million, respectively.
As of December 31, 2014, we had outstanding $325.0 million of senior notes due 2020 with a fixed interest rate of 4.125% and $350.0 million of senior notes due 2023 with a fixed interest rate of 4.625%. Because the interest rates with respect to these instruments are fixed, a hypothetical 100 basis point increase or decrease in market interest rates would not have a material impact on our financial statements.
We may, from time to time, invest our cash in a variety of short-term financial instruments. These instruments generally consist of highly liquid investments with original maturities at the date of purchase of three months or less. While these investments are subject to interest rate risk and will decline in value if market interest rates increase, a hypothetical 100 basis point increase or decrease in market interest rates would not materially affect the value of these instruments.
79
| ITEM 8. | FINANCIAL STATEMENTS AND SUPPLEMENTARY DATA. |
The financial statements and supplementary data required by Regulation S-X are included in this Annual Report on Form 10-K commencing on Page F-1.
| ITEM 9. | CHANGES IN AND DISAGREEMENTS WITH ACCOUNTANTS ON ACCOUNTING AND FINANCIAL DISCLOSURE. |
None.
| ITEM 9A. | CONTROLS AND PROCEDURES. |
Management’s Evaluation of Disclosure Controls and Procedures
An evaluation was performed under the supervision and with the participation of our senior management, including our Chief Executive Officer and Chief Financial Officer, of the effectiveness of our disclosure controls and procedures, as defined in Rules 13a-15(e) and 15d-15(e) of the Exchange Act as of the end of the period covered by this Annual Report. Based on that evaluation, our officers, including our Chief Executive Officer and Chief Financial Officer, concluded that as of the end of the period covered by this Annual Report our disclosure controls and procedures are effective to ensure that information required to be disclosed in the reports that we file or submit under the Exchange Act is recorded, processed, summarized and reported, within the time periods specified in the Commission’s rules and forms and information required to be disclosed in the reports we file or submit under the Exchange Act is accumulated and communicated to our management, including our Chief Executive Officer and Chief Financial Officer, to allow timely decisions regarding required disclosure.
Management’s Report on Internal Control over Financial Reporting
Management of Corrections Corporation of America (the “Company”) is responsible for establishing and maintaining adequate internal control over financial reporting, as defined in Rules 13a-15(f) and 15d-15(f) under the Exchange Act. The Company’s internal control over financial reporting is designed to provide reasonable assurance regarding the reliability of financial reporting and the preparation of financial statements for external purposes in accordance with generally accepted accounting principles. The Company’s internal control over financial reporting includes those policies and procedures that:
| (i) | pertain to the maintenance of records that, in reasonable detail, accurately and fairly reflect the transactions and dispositions of the assets of the Company; |
| (ii) | provide reasonable assurance that transactions are recorded as necessary to permit preparation of financial statements in accordance with generally accepted accounting principles, and that receipts and expenditures of the Company are being made only in accordance with authorizations of management and directors of the Company; and |
| (iii) | provide reasonable assurance regarding prevention or timely detection of unauthorized acquisition, use, or disposition of the Company’s assets that could have a material effect on the financial statements. |
80
Because of its inherent limitations, internal control over financial reporting may not prevent or detect misstatements. Also, projections of any evaluation of effectiveness to future periods are subject to the risk that controls may become inadequate because of changes in conditions, or that the degree of compliance with the policies or procedures may deteriorate.
Management assessed the effectiveness of the Company’s internal control over financial reporting as of December 31, 2014. In making this assessment, management used the criteria set forth by the Committee of Sponsoring Organizations of the Treadway Commission (COSO) in Internal Control-Integrated Framework released in 2013. Based on this assessment, management believes that, as of December 31, 2014, the Company’s internal control over financial reporting was effective.
The Company’s independent registered public accounting firm, Ernst & Young LLP, has issued an attestation report on the Company’s internal control over financial reporting. That report begins on page 82.
Changes in Internal Control over Financial Reporting
There have been no changes in our internal control over financial reporting that occurred during the fourth fiscal quarter that have materially affected, or are likely to materially affect, our internal control over financial reporting.
81
REPORT OF INDEPENDENT REGISTERED PUBLIC ACCOUNTING FIRM
The Board of Directors and Stockholders of Corrections Corporation of America and Subsidiaries
We have audited Corrections Corporation of America and Subsidiaries’ internal control over financial reporting as of December 31, 2014, based on criteria established in Internal Control – Integrated Framework issued by the Committee of Sponsoring Organizations of the Treadway Commission (2013 framework) (the COSO criteria). Corrections Corporation of America and Subsidiaries’ management is responsible for maintaining effective internal control over financial reporting, and for its assessment of the effectiveness of internal control over financial reporting included in the accompanying Management’s Report on Internal Control over Financial Reporting. Our responsibility is to express an opinion on the Company’s internal control over financial reporting based on our audit.
We conducted our audit in accordance with the standards of the Public Company Accounting Oversight Board (United States). Those standards require that we plan and perform the audit to obtain reasonable assurance about whether effective internal control over financial reporting was maintained in all material respects. Our audit included obtaining an understanding of internal control over financial reporting, assessing the risk that a material weakness exists, testing and evaluating the design and operating effectiveness of internal control based on the assessed risk, and performing such other procedures as we considered necessary in the circumstances. We believe that our audit provides a reasonable basis for our opinion.
A company’s internal control over financial reporting is a process designed to provide reasonable assurance regarding the reliability of financial reporting and the preparation of financial statements for external purposes in accordance with generally accepted accounting principles. A company’s internal control over financial reporting includes those policies and procedures that (1) pertain to the maintenance of records that, in reasonable detail, accurately and fairly reflect the transactions and dispositions of the assets of the company; (2) provide reasonable assurance that transactions are recorded as necessary to permit preparation of financial statements in accordance with generally accepted accounting principles, and that receipts and expenditures of the company are being made only in accordance with authorizations of management and directors of the company; and (3) provide reasonable assurance regarding prevention or timely detection of unauthorized acquisition, use, or disposition of the company’s assets that could have a material effect on the financial statements.
Because of its inherent limitations, internal control over financial reporting may not prevent or detect misstatements. Also, projections of any evaluation of effectiveness to future periods are subject to the risk that controls may become inadequate because of changes in conditions, or that the degree of compliance with the policies or procedures may deteriorate.
In our opinion, Corrections Corporation of America and Subsidiaries maintained, in all material respects, effective internal control over financial reporting as of December 31, 2014, based on the COSO criteria.
82
We also have audited, in accordance with the standards of the Public Company Accounting Oversight Board (United States), the consolidated balance sheets of Corrections Corporation of America and Subsidiaries as of December 31, 2014 and 2013, and the related consolidated statements of operations, stockholders’ equity and cash flows for each of the three years in the period ended December 31, 2014, of Corrections Corporation of America and Subsidiaries and our report dated February 25, 2015, expressed an unqualified opinion thereon. Our audits also included the financial statement schedule listed in the Index at Item 15(2).
/s/ Ernst & Young LLP
Nashville, Tennessee
February 25, 2015
83
| ITEM 9B. | OTHER INFORMATION |
Dividend Declared for First Quarter 2015
On February 20, 2015, the Company’s Board of Directors declared a dividend for the first quarter of 2015 of $0.54 per share to be paid on April 15, 2015 to stockholders of record as of the close of business on April 2, 2015.
| ITEM 10. | DIRECTORS, EXECUTIVE OFFICERS AND CORPORATE GOVERNANCE. |
The information required by this Item 10 will appear in, and is hereby incorporated by reference from, the information under the headings “Proposal 1 – Election of Directors-Directors Standing for Election,” “Executive Officers-Information Concerning Executive Officers Who Are Not Directors,” “Corporate Governance – Board of Directors Meetings and Committees,” “Corporate Governance – Independence and Financial Literacy of Audit and Risk Committee Members,” and “Security Ownership of Certain Beneficial Owners and Management – Section 16(a) Beneficial Ownership Reporting Compliance” in our definitive proxy statement for the 2015 Annual Meeting of Stockholders.
Our Board of Directors has adopted a Code of Ethics and Business Conduct applicable to the members of our Board of Directors and our officers, including our Chief Executive Officer and Chief Financial Officer. In addition, the Board of Directors has adopted Corporate Governance Guidelines and charters for our Audit and Risk Committee, Compensation Committee, Nominating and Governance Committee and Executive Committee. You can access our Code of Ethics and Business Conduct, Corporate Governance Guidelines and current committee charters on our website at www.cca.com.
| ITEM 11. | EXECUTIVE COMPENSATION. |
The information required by this Item 11 will appear in, and is hereby incorporated by reference from, the information under the headings “Executive and Director Compensation” in our definitive proxy statement for the 2015 Annual Meeting of Stockholders.
| ITEM 12. | SECURITY OWNERSHIP OF CERTAIN BENEFICIAL OWNERS AND MANAGEMENT AND RELATED STOCKHOLDER MATTERS. |
The information required by this Item 12 will appear in, and is hereby incorporated by reference from, the information under the heading “Security Ownership of Certain Beneficial Owners and Management – Ownership of Common Stock” in our definitive proxy statement for the 2015 Annual Meeting of Stockholders.
84
Securities Authorized for Issuance Under Equity Compensation Plans
The following table sets forth certain information as of December 31, 2014 regarding compensation plans under which our equity securities are authorized for issuance.
| (a) | (b) | (c) | ||||||||||
| Plan Category |
Number of Securities to be Issued Upon Exercise of Outstanding Options |
Weighted – Average Exercise Price of Outstanding Options |
Number of Securities Remaining Available for Future Issuance Under Equity Compensation Plan (Excluding Securities Reflected in Column (a)) |
|||||||||
| Equity compensation plans approved by stockholders |
1,884,233 | $ | 20.00 | 11,380,507 | (1) | |||||||
| Equity compensation plans not approved by stockholders |
— | — | — | |||||||||
|
|
|
|
|
|
|
|||||||
| Total |
1,884,233 | $ | 20.00 | 11,380,507 | ||||||||
|
|
|
|
|
|
|
|||||||
| (1) | Reflects shares of common stock available for issuance under our Amended and Restated 2008 Stock Incentive Plan and our Non-Employee Directors’ Compensation Plan, the only equity compensation plans approved by our stockholders under which we continue to grant awards. |
| ITEM 13. | CERTAIN RELATIONSHIPS AND RELATED TRANSACTIONS, AND DIRECTOR INDEPENDENCE. |
The information required by this Item 13 will appear in, and is hereby incorporated by reference from, the information under the heading “Corporate Governance – Certain Relationships and Related Transactions” and “Corporate Governance – Director Independence” in our definitive proxy statement for the 2015 Annual Meeting of Stockholders.
| ITEM 14. | PRINCIPAL ACCOUNTING FEES AND SERVICES. |
The information required by this Item 14 will appear in, and is hereby incorporated by reference from, the information under the heading “Proposal 2 – Ratification of Appointment of Independent Registered Public Accounting Firm” in our definitive proxy statement for the 2015 Annual Meeting of Stockholders.
85
| ITEM 15. | EXHIBITS AND FINANCIAL STATEMENT SCHEDULES. |
The following documents are filed as part of this Annual Report:
| (1) | Financial Statements: |
| The financial statements as set forth under Item 8 of this Annual Report on Form 10-K have been filed herewith, beginning on page F-1 of this Annual Report. |
| (2) | Financial Statement Schedules: |
| Schedule III-Real Estate Assets and Accumulated Depreciation. |
| Information with respect to this item begins on page F-48 of this Annual Report on Form 10-K. Other schedules are omitted because of the absence of conditions under which they are required or because the required information is given in the financial statements or notes thereto. |
| (3) | The Exhibits required by Item 601 of Regulation S-K are listed in the Index of Exhibits included herewith. |
86
INDEX TO FINANCIAL STATEMENTS
Consolidated Financial Statements of Corrections Corporation of America and Subsidiaries
F-1
REPORT OF INDEPENDENT REGISTERED PUBLIC ACCOUNTING FIRM
Board of Directors and Stockholders of
Corrections Corporation of America and Subsidiaries
We have audited the accompanying consolidated balance sheets of Corrections Corporation of America and Subsidiaries as of December 31, 2014 and 2013, and the related consolidated statements of operations, stockholders’ equity, and cash flows for each of the three years in the period ended December 31, 2014. Our audits also included the financial statement schedule listed in the Index at Item 15(2). These financial statements and schedule are the responsibility of the Company’s management. Our responsibility is to express an opinion on these financial statements and schedule based on our audits.
We conducted our audits in accordance with the standards of the Public Company Accounting Oversight Board (United States). Those standards require that we plan and perform the audit to obtain reasonable assurance about whether the financial statements are free of material misstatement. An audit includes examining, on a test basis, evidence supporting the amounts and disclosures in the financial statements. An audit also includes assessing the accounting principles used and significant estimates made by management, as well as evaluating the overall financial statement presentation. We believe that our audits provide a reasonable basis for our opinion.
In our opinion, the financial statements referred to above present fairly, in all material respects, the consolidated financial position of Corrections Corporation of America and Subsidiaries at December 31, 2014 and 2013, and the consolidated results of their operations and their cash flows for each of the three years in the period ended December 31, 2014, in conformity with U.S. generally accepted accounting principles. Also in our opinion, the related financial statement schedule, when considered in relation to the basic financial statements taken as a whole, presents fairly in all material respects the information set forth therein.
As described in Note 12 to the consolidated financial statements, the Company changed its method for reporting discontinued operations effective January 1, 2014.
We also have audited, in accordance with the standards of the Public Company Accounting Oversight Board (United States), Corrections Corporation of America and Subsidiaries’ internal control over financial reporting as of December 31, 2014, based on criteria established in Internal Control-Integrated Framework issued by the Committee of Sponsoring Organizations of the Treadway Commission (2013 framework) and our report dated February 25, 2015, expressed an unqualified opinion thereon.
/s/ Ernst & Young LLP
Nashville, Tennessee
February 25, 2015
F-2
CORRECTIONS CORPORATION OF AMERICA AND SUBSIDIARIES
CONSOLIDATED BALANCE SHEETS
(in thousands, except per share data)
| December 31, | ||||||||
| 2014 | 2013 | |||||||
| ASSETS | ||||||||
| Cash and cash equivalents |
$ | 74,393 | $ | 77,909 | ||||
| Accounts receivable, net of allowance of $748 and $1,265, respectively |
248,588 | 244,957 | ||||||
| Current deferred tax assets |
13,229 | 9,241 | ||||||
| Prepaid expenses and other current assets |
29,775 | 20,612 | ||||||
| Current assets of discontinued operations |
— | 15 | ||||||
|
|
|
|
|
|||||
| Total current assets |
365,985 | 352,734 | ||||||
| Property and equipment, net |
2,658,628 | 2,546,613 | ||||||
| Restricted cash |
2,858 | 5,589 | ||||||
| Investment in direct financing lease |
3,223 | 5,473 | ||||||
| Goodwill |
16,110 | 16,110 | ||||||
| Non-current deferred tax assets |
2,301 | 3,078 | ||||||
| Other assets |
78,086 | 77,828 | ||||||
|
|
|
|
|
|||||
| Total assets |
$ | 3,127,191 | $ | 3,007,425 | ||||
|
|
|
|
|
|||||
| LIABILITIES AND STOCKHOLDERS’ EQUITY | ||||||||
| Accounts payable and accrued expenses |
$ | 317,566 | $ | 252,277 | ||||
| Income taxes payable |
1,368 | 1,243 | ||||||
| Current liabilities of discontinued operations |
54 | 886 | ||||||
|
|
|
|
|
|||||
| Total current liabilities |
318,988 | 254,406 | ||||||
| Long-term debt |
1,200,000 | 1,205,000 | ||||||
| Other liabilities |
126,703 | 45,512 | ||||||
|
|
|
|
|
|||||
| Total liabilities |
1,645,691 | 1,504,918 | ||||||
|
|
|
|
|
|||||
| Commitments and contingencies |
||||||||
| Preferred stock - $0.01 par value; 50,000 shares authorized; none issued and outstanding at December 31, 2014 and 2013, respectively |
— | — | ||||||
| Common stock - $0.01 par value; 300,000 shares authorized; 116,764 and 115,923 shares issued and outstanding at December 31, 2014 and 2013, respectively |
1,168 | 1,159 | ||||||
| Additional paid-in capital |
1,748,303 | 1,725,363 | ||||||
| Accumulated deficit |
(267,971 | ) | (224,015 | ) | ||||
|
|
|
|
|
|||||
| Total stockholders’ equity |
1,481,500 | 1,502,507 | ||||||
|
|
|
|
|
|||||
| Total liabilities and stockholders’ equity |
$ | 3,127,191 | $ | 3,007,425 | ||||
|
|
|
|
|
|||||
The accompanying notes are an integral part of these consolidated financial statements.
F-3
CORRECTIONS CORPORATION OF AMERICA AND SUBSIDIARIES
CONSOLIDATED STATEMENTS OF OPERATIONS
(in thousands, except per share amounts)
| For the Years Ended December 31, | ||||||||||||
| 2014 | 2013 | 2012 | ||||||||||
| REVENUES |
$ | 1,646,867 | $ | 1,694,297 | $ | 1,723,657 | ||||||
|
|
|
|
|
|
|
|||||||
| EXPENSES: |
||||||||||||
| Operating |
1,156,135 | 1,220,351 | 1,217,051 | |||||||||
| General and administrative |
106,429 | 103,590 | 88,935 | |||||||||
| Depreciation and amortization |
113,925 | 112,692 | 113,063 | |||||||||
| Asset impairments |
30,082 | 6,513 | — | |||||||||
|
|
|
|
|
|
|
|||||||
| 1,406,571 | 1,443,146 | 1,419,049 | ||||||||||
|
|
|
|
|
|
|
|||||||
| OPERATING INCOME |
240,296 | 251,151 | 304,608 | |||||||||
|
|
|
|
|
|
|
|||||||
| OTHER (INCOME) EXPENSE: |
||||||||||||
| Interest expense, net |
39,535 | 45,126 | 58,363 | |||||||||
| Expenses associated with debt refinancing transactions |
— | 36,528 | 2,099 | |||||||||
| Other income |
(1,204 | ) | (100 | ) | (333 | ) | ||||||
|
|
|
|
|
|
|
|||||||
| 38,331 | 81,554 | 60,129 | ||||||||||
|
|
|
|
|
|
|
|||||||
| INCOME FROM CONTINUING OPERATIONS BEFORE INCOME TAXES |
201,965 | 169,597 | 244,479 | |||||||||
| Income tax (expense) benefit |
(6,943 | ) | 134,995 | (87,513 | ) | |||||||
|
|
|
|
|
|
|
|||||||
| INCOME FROM CONTINUING OPERATIONS |
195,022 | 304,592 | 156,966 | |||||||||
| Loss from discontinued operations, net of taxes |
— | (3,757 | ) | (205 | ) | |||||||
|
|
|
|
|
|
|
|||||||
| NET INCOME |
$ | 195,022 | $ | 300,835 | $ | 156,761 | ||||||
|
|
|
|
|
|
|
|||||||
| BASIC EARNINGS PER SHARE: |
||||||||||||
| Income from continuing operations |
$ | 1.68 | $ | 2.77 | $ | 1.58 | ||||||
| Loss from discontinued operations, net of taxes |
— | (0.03 | ) | — | ||||||||
|
|
|
|
|
|
|
|||||||
| Net income |
$ | 1.68 | $ | 2.74 | $ | 1.58 | ||||||
|
|
|
|
|
|
|
|||||||
| DILUTED EARNINGS PER SHARE: |
||||||||||||
| Income from continuing operations |
$ | 1.66 | $ | 2.73 | $ | 1.56 | ||||||
| Loss from discontinued operations, net of taxes |
— | (0.03 | ) | — | ||||||||
|
|
|
|
|
|
|
|||||||
| Net income |
$ | 1.66 | $ | 2.70 | $ | 1.56 | ||||||
|
|
|
|
|
|
|
|||||||
| REGULAR DIVIDENDS DECLARED PER SHARE |
$ | 2.04 | $ | 1.97 | $ | 0.60 | ||||||
|
|
|
|
|
|
|
|||||||
| SPECIAL DIVIDENDS DECLARED PER SHARE |
$ | — | $ | 6.66 | $ | — | ||||||
|
|
|
|
|
|
|
|||||||
The accompanying notes are an integral part of these consolidated financial statements.
F-4
CORRECTIONS CORPORATION OF AMERICA AND SUBSIDIARIES
CONSOLIDATED STATEMENTS OF CASH FLOWS
(in thousands)
| For the Years Ended December 31, | ||||||||||||
| 2014 | 2013 | 2012 | ||||||||||
| CASH FLOWS FROM OPERATING ACTIVITIES: |
||||||||||||
| Net income |
$ | 195,022 | $ | 300,835 | $ | 156,761 | ||||||
| Adjustments to reconcile net income to net cash provided by operating activities: |
||||||||||||
| Depreciation and amortization |
113,925 | 113,491 | 113,933 | |||||||||
| Asset impairments |
30,082 | 9,150 | — | |||||||||
| Amortization of debt issuance costs and other non-cash interest |
3,102 | 3,509 | 4,316 | |||||||||
| Expenses associated with debt refinancing transactions |
— | 36,528 | 2,099 | |||||||||
| Deferred income taxes |
(3,211 | ) | (151,037 | ) | 5,761 | |||||||
| Other expenses and non-cash items |
4,594 | 2,623 | 1,084 | |||||||||
| Non-cash revenue and other income |
(3,880 | ) | (294 | ) | — | |||||||
| Income tax benefit of equity compensation |
(665 | ) | (351 | ) | (2,708 | ) | ||||||
| Non-cash equity compensation |
13,975 | 12,965 | 12,325 | |||||||||
| Changes in assets and liabilities, net: |
||||||||||||
| Accounts receivable, prepaid expenses and other assets |
(12,549 | ) | 16,683 | 12,189 | ||||||||
| Accounts payable, accrued expenses and other liabilities |
82,396 | 23,910 | (24,219 | ) | ||||||||
| Income taxes payable |
790 | 1,492 | 1,715 | |||||||||
|
|
|
|
|
|
|
|||||||
| Net cash provided by operating activities |
423,581 | 369,504 | 283,256 | |||||||||
|
|
|
|
|
|
|
|||||||
| CASH FLOWS FROM INVESTING ACTIVITIES: |
||||||||||||
| Expenditures for facility development and expansions |
(85,791 | ) | (27,955 | ) | (30,424 | ) | ||||||
| Acquisition of businesses, net of cash acquired |
— | (36,252 | ) | — | ||||||||
| Expenditures for other capital improvements |
(49,315 | ) | (48,570 | ) | (49,014 | ) | ||||||
| Capitalized lease payments |
(70,793 | ) | — | — | ||||||||
| Cash paid for leasehold incentive |
— | (12,765 | ) | — | ||||||||
| Decrease in restricted cash |
2,983 | 452 | — | |||||||||
| Proceeds from sale of assets |
5,136 | 998 | 1,838 | |||||||||
| Increase in other assets |
(1,101 | ) | (3,260 | ) | (4,027 | ) | ||||||
| Payments received on direct financing lease and notes receivable |
1,994 | 1,840 | 1,707 | |||||||||
|
|
|
|
|
|
|
|||||||
| Net cash used in investing activities |
(196,887 | ) | (125,512 | ) | (79,920 | ) | ||||||
|
|
|
|
|
|
|
|||||||
| CASH FLOWS FROM FINANCING ACTIVITIES: |
||||||||||||
| Proceeds from issuance of debt |
250,000 | 1,283,000 | 888,500 | |||||||||
| Principal repayments of debt |
(255,000 | ) | (1,198,000 | ) | (1,023,500 | ) | ||||||
| Payment of debt issuance and other refinancing and related costs |
— | (37,349 | ) | (6,336 | ) | |||||||
| Proceeds from exercise of stock options |
12,450 | 30,171 | 4,933 | |||||||||
| Purchase and retirement of common stock |
(4,036 | ) | (6,693 | ) | (2,808 | ) | ||||||
| Income tax benefit of equity compensation |
665 | 351 | 2,708 | |||||||||
| Increase in restricted cash for dividends |
(251 | ) | (1,016 | ) | — | |||||||
| Dividends paid |
(234,048 | ) | (299,434 | ) | (59,768 | ) | ||||||
|
|
|
|
|
|
|
|||||||
| Net cash used in financing activities |
(230,220 | ) | (228,970 | ) | (196,271 | ) | ||||||
|
|
|
|
|
|
|
|||||||
| NET (DECREASE) INCREASE IN CASH AND CASH EQUIVALENTS |
(3,526 | ) | 15,022 | 7,065 | ||||||||
| CASH AND CASH EQUIVALENTS, beginning of year |
77,919 | 62,897 | 55,832 | |||||||||
|
|
|
|
|
|
|
|||||||
| CASH AND CASH EQUIVALENTS, end of year |
$ | 74,393 | $ | 77,919 | $ | 62,897 | ||||||
|
|
|
|
|
|
|
|||||||
| SUPPLEMENTAL DISCLOSURES OF CASH FLOW INFORMATION: |
||||||||||||
| Cash paid during the period for: |
||||||||||||
| Interest (net of amounts capitalized of $2,525, $836, and $1,057 in 2014, 2013, and 2012, respectively) |
$ | 39,928 | $ | 40,776 | $ | 66,943 | ||||||
|
|
|
|
|
|
|
|||||||
| Income taxes |
$ | 19,717 | $ | 7,422 | $ | 83,864 | ||||||
|
|
|
|
|
|
|
|||||||
The accompanying notes are an integral part of these consolidated financial statements.
F-5
CORRECTIONS CORPORATION OF AMERICA AND SUBSIDIARIES
CONSOLIDATED STATEMENTS OF STOCKHOLDERS’ EQUITY
FOR THE YEARS ENDED DECEMBER 31, 2014, 2013, AND 2012
(in thousands)
|
Common Stock |
Additional Paid-In Capital |
Accumulated Deficit |
Total Stockholders’ Equity |
|||||||||||||||||
| Shares | Par Value | |||||||||||||||||||
| BALANCE, December 31, 2013 |
115,923 | $ | 1,159 | $ | 1,725,363 | $ | (224,015 | ) | $ | 1,502,507 | ||||||||||
| Net income |
— | — | — | 195,022 | 195,022 | |||||||||||||||
| Retirement of common stock |
(118 | ) | (1 | ) | (4,035 | ) | — | (4,036 | ) | |||||||||||
| Regular dividends declared on common stock ($2.04 per share) |
— | — | — | (239,086 | ) | (239,086 | ) | |||||||||||||
| Restricted stock compensation, net of forfeitures |
(20 | ) | — | 11,985 | 108 | 12,093 | ||||||||||||||
| Stock option compensation expense, net of forfeitures |
— | — | 1,882 | — | 1,882 | |||||||||||||||
| Income tax benefit of equity compensation |
— | — | 665 | — | 665 | |||||||||||||||
| Restricted stock grants |
267 | 3 | — | — | 3 | |||||||||||||||
| Stock options exercised |
712 | 7 | 12,443 | — | 12,450 | |||||||||||||||
|
|
|
|
|
|
|
|
|
|
|
|||||||||||
| BALANCE, December 31, 2014 |
116,764 | $ | 1,168 | $ | 1,748,303 | $ | (267,971 | ) | $ | 1,481,500 | ||||||||||
|
|
|
|
|
|
|
|
|
|
|
|||||||||||
(Continued)
F-6
CORRECTIONS CORPORATION OF AMERICA AND SUBSIDIARIES
CONSOLIDATED STATEMENTS OF STOCKHOLDERS’ EQUITY
FOR THE YEARS ENDED DECEMBER 31, 2014, 2013, AND 2012
(in thousands)
| Common Stock | Additional Paid-In Capital |
(Accumulated Deficit) Retained Earnings |
Total Stockholders’ Equity |
|||||||||||||||||
| Shares | Par value | |||||||||||||||||||
| BALANCE, December 31, 2012 |
100,105 | $ | 1,001 | $ | 1,146,488 | $ | 374,131 | $ | 1,521,620 | |||||||||||
| Net income |
— | — | — | 300,835 | 300,835 | |||||||||||||||
| Issuance of common stock |
20 | — | 27 | — | 27 | |||||||||||||||
| Retirement of common stock |
(180 | ) | (2 | ) | (6,691 | ) | — | (6,693 | ) | |||||||||||
| Special dividend on common stock ($6.66 per share) |
13,878 | 139 | 542,541 | (678,226 | ) | (135,546 | ) | |||||||||||||
| Regular dividends declared on common stock ($1.97 per share) |
— | — | — | (221,196 | ) | (221,196 | ) | |||||||||||||
| Restricted stock compensation, net of forfeitures |
(30 | ) | — | 9,381 | 441 | 9,822 | ||||||||||||||
| Stock option compensation expense, net of forfeitures |
— | — | 3,116 | — | 3,116 | |||||||||||||||
| Income tax benefit of equity compensation |
— | — | 351 | — | 351 | |||||||||||||||
| Restricted stock grants |
300 | 3 | (3 | ) | — | — | ||||||||||||||
| Stock options exercised |
1,830 | 18 | 30,153 | — | 30,171 | |||||||||||||||
|
|
|
|
|
|
|
|
|
|
|
|||||||||||
| BALANCE, December 31, 2013 |
115,923 | $ | 1,159 | $ | 1,725,363 | $ | (224,015 | ) | $ | 1,502,507 | ||||||||||
|
|
|
|
|
|
|
|
|
|
|
|||||||||||
(Continued)
F-7
CORRECTIONS CORPORATION OF AMERICA AND SUBSIDIARIES
CONSOLIDATED STATEMENTS OF STOCKHOLDERS’ EQUITY
FOR THE YEARS ENDED DECEMBER 31, 2014, 2013, AND 2012
(in thousands)
| Common Stock | Additional Paid-In Capital |
Retained Earnings |
Total Stockholders’ Equity |
|||||||||||||||||
| Shares | Par value | |||||||||||||||||||
| BALANCE, December 31, 2011 |
99,528 | $ | 995 | $ | 1,129,435 | $ | 277,592 | $ | 1,408,022 | |||||||||||
| Net income |
— | — | — | 156,761 | 156,761 | |||||||||||||||
| Issuance of common stock |
1 | — | 29 | — | 29 | |||||||||||||||
| Retirement of common stock |
(110 | ) | (1 | ) | (2,807 | ) | — | (2,808 | ) | |||||||||||
| Regular dividends declared on common stock ($0.60 per share) |
— | — | — | (60,222 | ) | (60,222 | ) | |||||||||||||
| Restricted stock compensation, net of forfeitures |
(13 | ) | — | 7,635 | — | 7,635 | ||||||||||||||
| Stock option compensation expense, net of forfeitures |
— | — | 4,661 | — | 4,661 | |||||||||||||||
| Income tax benefit of equity compensation |
— | — | 2,609 | — | 2,609 | |||||||||||||||
| Restricted stock grants |
333 | 3 | (3 | ) | — | — | ||||||||||||||
| Stock options exercised |
366 | 4 | 4,929 | — | 4,933 | |||||||||||||||
|
|
|
|
|
|
|
|
|
|
|
|||||||||||
| BALANCE, December 31, 2012 |
100,105 | $ | 1,001 | $ | 1,146,488 | $ | 374,131 | $ | 1,521,620 | |||||||||||
|
|
|
|
|
|
|
|
|
|
|
|||||||||||
The accompanying notes are an integral part of these consolidated financial statements.
F-8
CORRECTIONS CORPORATION OF AMERICA AND SUBSIDIARIES
NOTES TO CONSOLIDATED FINANCIAL STATEMENTS
DECEMBER 31, 2014, 2013 AND 2012
| 1. | ORGANIZATION AND OPERATIONS |
Corrections Corporation of America (together with its subsidiaries, the “Company” or “CCA”) is the nation’s largest owner of privatized correctional and detention facilities and one of the largest prison operators in the United States. As of December 31, 2014, CCA owned or controlled 52 correctional and detention facilities, and managed an additional 12 facilities owned by its government partners, with a total design capacity of approximately 84,500 (unaudited) beds in 19 states and the District of Columbia.
CCA is a Real Estate Investment Trust (“REIT”) specializing in owning, operating and managing prisons and other correctional facilities and providing residential, community re-entry, and prisoner transportation services for governmental agencies. In addition to providing fundamental residential services, CCA’s facilities offer a variety of rehabilitation and educational programs, including basic education, faith-based services, life skills and employment training, and substance abuse treatment. These services are intended to help reduce recidivism and to prepare offenders for their successful re-entry into society upon their release. CCA also provides or makes available to offenders certain health care (including medical, dental and mental health services), food services, and work and recreational programs.
CCA began operating as a REIT for federal income tax purposes effective January 1, 2013. The Company provides correctional services and conducts other business activities through taxable REIT subsidiaries (“TRSs”). A TRS is a subsidiary of a REIT that is subject to applicable corporate income tax and certain qualification requirements. The Company’s use of TRSs enables CCA to comply with REIT qualification requirements while providing correctional services at facilities it owns and at facilities owned by its government partners and to engage in certain other business operations. A TRS is not subject to the distribution requirements applicable to REITs so it may retain income generated by its operations for reinvestment. Consequently, income taxes recorded in 2014 are not comparable to those recorded in 2013 and 2012. See Note 11.
| 2. | SUMMARY OF SIGNIFICANT ACCOUNTING POLICIES |
Basis of Presentation
The consolidated financial statements are prepared in accordance with U.S. generally accepted accounting principles and include the accounts of CCA on a consolidated basis with its wholly-owned subsidiaries. All intercompany balances and transactions have been eliminated.
Cash and Cash Equivalents
CCA considers all liquid debt instruments with a maturity of three months or less at the time of purchase to be cash equivalents.
F-9
Restricted Cash
Restricted cash at December 31, 2014 and 2013 of $2.9 million and $5.6 million, respectively, is restricted for a capital improvements, replacements, and repairs reserve fund required by one of CCA’s contracts, and for the payment of dividends on unvested restricted stock.
Accounts Receivable and Allowance for Doubtful Accounts
At December 31, 2014 and 2013, accounts receivable of $248.6 million and $245.0 million were net of allowances for doubtful accounts totaling $0.7 million and $1.3 million, respectively. Accounts receivable consist primarily of amounts due from federal, state, and local government agencies for the utilization of CCA’s correctional and detention facilities, as well as for operating and managing prisons and other correctional facilities and providing offender residential and prisoner transportation services to such government agencies.
Accounts receivable are stated at estimated net realizable value. CCA recognizes allowances for doubtful accounts to ensure receivables are not overstated due to uncollectibility. Bad debt reserves are maintained for customers in the aggregate based on a variety of factors, including the length of time receivables are past due, significant one-time events, and historical experience. If circumstances related to customers change, estimates of the recoverability of receivables would be further adjusted.
Property and Equipment
Property and equipment are carried at cost. Assets acquired by CCA in conjunction with acquisitions are recorded at estimated fair market value at the time of purchase. Betterments, renewals and significant repairs that extend the life of an asset are capitalized; other repair and maintenance costs are expensed. Interest is capitalized to the asset to which it relates in connection with the construction or expansion of facilities. Construction costs directly associated with the development of a correctional facility are capitalized as part of the cost of the development project. Such costs are written-off to general and administrative expense whenever a project is abandoned. The cost and accumulated depreciation applicable to assets retired are removed from the accounts and the gain or loss on disposition is recognized in income. Depreciation is computed over the estimated useful lives of depreciable assets using the straight-line method. Useful lives for property and equipment are as follows:
| Land improvements |
5 – 20 years | |||
| Buildings and improvements |
5 – 50 years | |||
| Equipment and software |
3 – 5 years | |||
| Office furniture and fixtures |
5 years |
Accounting for the Impairment of Long-Lived Assets Other Than Goodwill
Long-lived assets other than goodwill are reviewed for impairment when circumstances indicate the carrying value of an asset may not be recoverable. When circumstances indicate an asset may not be recoverable, impairment is recognized when the estimated undiscounted cash flows associated with the asset or group of assets is less than their carrying value. If impairment exists, an adjustment is made to write the asset down to its fair value, and a loss is recorded as the difference between the carrying value and fair value. Fair values are determined based on quoted market values, comparable sales data, discounted cash flows or internal and external appraisals, as applicable.
F-10
Goodwill
Goodwill represents the cost in excess of the net assets of businesses acquired. As further discussed in Note 3, goodwill is tested for impairment at least annually using a fair-value based approach.
Investment in Direct Financing Lease
Investment in direct financing lease represents the portion of CCA’s management contract with a governmental agency that represents lease payments on buildings and equipment. The lease is accounted for using the financing method and, accordingly, the minimum lease payments to be received over the term of the lease less unearned income are capitalized as CCA’s investment in the lease. Unearned income is recognized as income over the term of the lease using the interest method.
Investment in Affiliates
Investments in affiliates that are equal to or less than 50%-owned over which CCA can exercise significant influence are accounted for using the equity method of accounting. Investments under the equity method are recorded at cost and subsequently adjusted for contributions, distributions, and net income attributable to the Company’s ownership based on the governing agreement.
Debt Issuance Costs
Generally, debt issuance costs, which are included in other assets in the consolidated balance sheets, are capitalized and amortized into interest expense using the interest method, or on a straight-line basis over the term of the related debt, if not materially different than the interest method. However, certain debt issuance costs incurred in connection with debt refinancings are charged to expense in accordance with Accounting Standards Codification (“ASC”) 470-50, “Modifications and Extinguishments.”
Revenue Recognition
CCA maintains contracts with certain governmental entities to manage their facilities for fixed per diem rates. CCA also maintains contracts with various federal, state, and local governmental entities for the housing of offenders in company-owned facilities at fixed per diem rates or monthly fixed rates. These contracts usually contain expiration dates with renewal options ranging from annual to multi-year renewals. Most of these contracts have current terms that require renewal every two to five years. Additionally, most facility management contracts contain clauses that allow the government agency to terminate a contract without cause, and are generally subject to legislative appropriations. CCA generally expects to renew these contracts for periods consistent with the remaining renewal options allowed by the contracts or other reasonable extensions; however, no assurance can be given that such renewals will be obtained. Fixed monthly rate revenue is recorded in the month earned and fixed per diem revenue, including revenue under those contracts that include guaranteed minimum populations, is recorded based on the per diem rate multiplied by the number of offenders housed or guaranteed during the respective period.
CCA recognizes any additional management service revenues upon completion of services provided to the customer. Certain of the government agencies also have the authority to audit and investigate CCA’s contracts with them. If the agency determines that CCA has improperly allocated costs to a specific contract or otherwise was unable to perform certain contractual services, CCA may not be reimbursed for those costs and could be required to refund the amount of any such costs that have been reimbursed.
F-11
Rental revenue is recognized in accordance with ASC 840, “Leases”. In accordance with ASC 840, minimum rental revenue is recognized on a straight-line basis over the term of the related lease. Leasehold incentives are recognized as a reduction to rental revenue on a straight-line basis over the term of the related lease. Rental revenue associated with expense reimbursements from tenants are recognized in the period that the related expenses are incurred based upon the tenant lease provision.
In September 2014, CCA agreed under an expansion of an existing inter-governmental service agreement (“IGSA”) between the city of Eloy, Arizona and the U.S. Immigration and Customs Enforcement (“ICE”) to provide residential space and services at the newly activated South Texas Family Residential Center. The amended IGSA qualifies as a multiple-element arrangement under the guidance in ASC 605, “Revenue Recognition”. CCA evaluates each deliverable in an arrangement to determine whether it represents a separate unit of accounting. A deliverable constitutes a separate unit of accounting when it has standalone value to the customer. ASC 605 requires revenue to be allocated to each unit of accounting based on a selling price hierarchy. The selling price for a deliverable is based on its vendor specific objective evidence (“VSOE”) of selling price, if available, third party evidence (“TPE”) if VSOE of selling price is not available, or estimated selling price (“ESP”) if neither VSOE of selling price nor TPE is available. CCA establishes VSOE of selling price using the price charged for a deliverable when sold separately. CCA establishes TPE of selling price by evaluating similar products or services in standalone sales to similarly situated customers. CCA establishes ESP based on management judgment considering internal factors such as margin objectives, pricing practices and controls, and market conditions. In arrangements with multiple elements, CCA allocates the transaction price to the individual units of accounting at inception of the arrangement based on their relative selling price.
Other revenue consists primarily of ancillary revenues associated with operating correctional and detention facilities, such as commissary, phone, and vending sales, and are recorded in the period the goods and services are provided. Revenues generated from prisoner transportation services for governmental agencies are recorded in the period the inmates have been transported to their destination.
Self-Funded Insurance Reserves
CCA is significantly self-insured for employee health, workers’ compensation, automobile liability claims, and general liability claims. As such, CCA’s insurance expense is largely dependent on claims experience and CCA’s ability to control its claims experience. CCA has consistently accrued the estimated liability for employee health insurance based on its history of claims experience and time lag between the incident date and the date the cost is paid by CCA. CCA has accrued the estimated liability for workers’ compensation claims based on an actuarially determined liability, discounted to the net present value of the outstanding liabilities, using a combination of actuarial methods used to project ultimate losses, and the Company’s automobile insurance claims based on estimated development factors on claims incurred. The liability for employee health, workers’ compensation, and automobile insurance includes estimates for both claims incurred and for claims incurred but not reported. CCA records litigation reserves related to general liability matters for which it is probable that a loss has been incurred and the range of such loss can be estimated. These estimates could change in the future.
F-12
Income Taxes
CCA began operating as a REIT for federal income tax purposes effective January 1, 2013. As a REIT, the Company generally is not subject to corporate level federal income tax on taxable income it distributes to its shareholders as long as it meets the organizational and operational requirements under the REIT rules. However, certain subsidiaries have made an election with the Company to be treated as TRSs in conjunction with the Company’s REIT election. The TRS elections permit CCA to engage in certain business activities in which the REIT may not engage directly, so long as these activities are conducted in entities that elect to be treated as TRSs under the Internal Revenue Code. A TRS is subject to federal and state income taxes on the income from these activities and therefore, CCA includes a provision for taxes in its consolidated financial statements.
Income taxes are accounted for under the provisions of ASC 740, “Income Taxes”. ASC 740 generally requires CCA to record deferred income taxes for the tax effect of differences between book and tax bases of its assets and liabilities. Deferred income taxes reflect the available net operating losses and the net tax effect of temporary differences between the carrying amounts of assets and liabilities for financial reporting purposes and the amounts used for income tax purposes using enacted tax rates in effect for the year in which the differences are expected to reverse. The effect of a change in tax rates on deferred tax assets and liabilities is recognized in the statement of operations in the period that includes the enactment date. Realization of the future tax benefits related to deferred tax assets is dependent on many factors, including CCA’s past earnings history, expected future earnings, the character and jurisdiction of such earnings, unsettled circumstances that, if unfavorably resolved, would adversely affect utilization of its deferred tax assets, carryback and carryforward periods, and tax strategies that could potentially enhance the likelihood of realization of a deferred tax asset.
Income tax contingencies are accounted for under the provisions of ASC 740. ASC 740 prescribes a recognition threshold and measurement attribute for the financial statement recognition and measurement of a tax position taken or expected to be taken in a tax return. The guidance prescribed in ASC 740 establishes a recognition threshold of more likely than not that a tax position will be sustained upon examination. The measurement attribute requires that a tax position be measured at the largest amount of benefit that is greater than 50% likely of being realized upon ultimate settlement.
Foreign Currency Transactions
CCA has extended a working capital loan to Agecroft Prison Management, Ltd. (“APM”), the operator of a correctional facility in Salford, England previously owned by a subsidiary of CCA. The working capital loan is denominated in British pounds; consequently, CCA adjusts these receivables to the current exchange rate at each balance sheet date and recognizes the unrealized currency gain or loss in current period earnings. See Note 6 for further discussion of CCA’s relationship with APM.
Fair Value of Financial Instruments
To meet the reporting requirements of ASC 825, “Financial Instruments”, regarding fair value of financial instruments, CCA calculates the estimated fair value of financial instruments using market interest rates, quoted market prices of similar instruments, or discounted cash flow techniques with observable Level 1 inputs for publicly traded debt and Level 2 inputs for all other financial instruments, as defined in ASC 820, “Fair Value Measurement”. At December 31, 2014 and 2013,
F-13
there were no material differences between the carrying amounts and the estimated fair values of CCA’s financial instruments, other than as follows (in thousands):
| December 31, | ||||||||||||||||
| 2014 | 2013 | |||||||||||||||
| Carrying Amount |
Fair Value | Carrying Amount |
Fair Value | |||||||||||||
| Investment in direct financing lease |
$ | 5,473 | $ | 6,048 | $ | 7,466 | $ | 8,609 | ||||||||
| Note receivable from APM |
$ | 3,677 | $ | 6,539 | $ | 4,831 | $ | 9,006 | ||||||||
| Debt |
$ | (1,200,000 | ) | $ | (1,179,625 | ) | $ | (1,205,000 | ) | $ | (1,179,375 | ) | ||||
Use of Estimates in Preparation of Financial Statements
The preparation of financial statements in conformity with accounting principles generally accepted in the United States requires management to make estimates and assumptions that affect the reported amounts of assets and liabilities, and disclosure of contingent assets and liabilities, at the date of the financial statements and the reported amounts of revenue and expenses during the reporting period. Actual results could differ from those estimates and those differences could be material.
Concentration of Credit Risks
CCA’s credit risks relate primarily to cash and cash equivalents, restricted cash, accounts receivable, and an investment in a direct financing lease. Cash and cash equivalents and restricted cash are primarily held in bank accounts and overnight investments. CCA maintains deposits of cash in excess of federally insured limits with certain financial institutions. CCA’s accounts receivable and investment in direct financing lease represent amounts due primarily from governmental agencies. CCA’s financial instruments are subject to the possibility of loss in carrying value as a result of either the failure of other parties to perform according to their contractual obligations or changes in market prices that make the instruments less valuable.
CCA derives its revenues primarily from amounts earned under federal, state, and local government contracts. For each of the years ended December 31, 2014, 2013, and 2012, federal correctional and detention authorities represented 44% of CCA’s total revenue. Federal correctional and detention authorities consist primarily of the Federal Bureau of Prisons (“BOP”), the United States Marshals Service (“USMS”), and ICE. The BOP accounted for 13%, 13%, and 12% of total revenue for 2014, 2013, and 2012, respectively. The USMS accounted for 17%, 19%, and 20% of total revenue for 2014, 2013, and 2012, respectively. ICE accounted for 13%, 12%, and 12% of total revenue for 2014, 2013, and 2012, respectively. These federal customers have management contracts at facilities CCA owns and at facilities CCA manages but does not own. Additionally, CCA’s management contracts with state correctional authorities represented 48%, 49%, and 49% of total revenue during the years ended December 31, 2014, 2013, and 2012, respectively. The State of California Department of Corrections and Rehabilitation (the “CDCR”) accounted for 14%, 12%, and 12% of total revenue for the years ended December 31, 2014, 2013, and 2012, respectively, including revenue generated under an operating lease that commenced December 1, 2013, at a facility we own in California. No other customer generated more than 10% of total revenue during 2014, 2013, or 2012. Although the revenue generated from each of these agencies is derived from numerous management contracts, the loss of one or more of such contracts could have a material adverse impact on CCA’s financial condition and results of operations.
F-14
Accounting for Stock-Based Compensation
Restricted Stock
CCA accounts for restricted stock-based compensation under the recognition and measurement principles of ASC 718, “Compensation-Stock Compensation”. CCA amortizes the fair market value as of the grant date of restricted stock awards over the vesting period using the straight-line method. The fair market value of performance-based restricted stock is amortized over the vesting period as long as CCA expects to meet the performance criteria. If achievement of the performance criteria becomes improbable, an adjustment is made to reverse the expense previously recognized.
Stock Options
CCA’s stock option plans are described more fully in Note 13. CCA accounts for those plans under the recognition and measurement principles of ASC 718. All options granted under those plans had an exercise price equal to the market value of the underlying common stock on the date of grant.
Recent Accounting Pronouncements
In May 2014, the Financial Accounting Standards Board (“FASB”) issued Accounting Standards Update (“ASU”) 2014-09, “Revenue from Contracts with Customers”, which establishes a single, comprehensive revenue recognition standard for all contracts with customers. For public reporting entities such as CCA, ASU 2014-09 is effective for interim and annual periods beginning after December 15, 2016 and early adoption of the ASU is not permitted. CCA is reviewing the ASU to determine the potential impact it might have on the Company’s results of operations, cash flows, or financial position and its related financial statement disclosures, along with evaluating which transition method will be utilized upon adoption.
| 3. | GOODWILL |
ASC 350, “Intangibles-Goodwill and Other”, establishes accounting and reporting requirements for goodwill and other intangible assets. Goodwill was $16.1 million as of December 31, 2014 and 2013. This goodwill was established in connection with the acquisition of Correctional Alternatives Inc. (“CAI”) during the third quarter of 2013, as further described in Note 5, and the acquisitions of two service companies during 2000.
CCA applies the FASB’s ASU 2011-08, which gives companies the option to perform a qualitative assessment that may allow them to skip the annual two-step impairment test. Under the amendments in ASU 2011-08, a company has the option to first assess qualitative factors to determine whether the existence of events or circumstances leads to a determination that it is more likely than not that the fair value of a reporting unit is less than its carrying amount. If, after assessing the totality of events or circumstances, an entity determines it is not more likely than not that the fair value of a reporting unit is less than its carrying amount, then performing the two-step impairment test is unnecessary. If the two-step impairment test is required, CCA determines the fair value of a reporting unit using a collaboration of various common valuation techniques, including market multiples and discounted cash flows. These impairment tests are required to be performed at least annually. CCA performed its impairment tests during the fourth quarter, in connection with CCA’s annual budgeting process, and concluded no impairments had occurred. CCA will perform these impairment tests at least annually and whenever circumstances indicate the carrying value of goodwill may not be recoverable.
F-15
During the fourth quarter of 2013, CCA reported an asset impairment of $1.1 million for the write-off of goodwill associated with the Bay Correctional Facility in Florida. In the fourth quarter of 2013, the Florida Department of Management Services (“DMS”) awarded to another operator the contract to manage this facility owned by the state of Florida upon the expiration of CCA’s contract on January 31, 2014.
During the third quarter of 2013, CCA reported an asset impairment of $1.0 million for the write-off of goodwill associated with the Idaho Correctional Center. During the second quarter of 2013, the state of Idaho reported that they expected to solicit bids for the management of the Idaho Correctional Center upon the expiration of CCA’s contract in June 2014. During the third quarter of 2013, CCA decided not to submit a bid for the continued management of this facility. The state assumed management of the facility effective July 1, 2014.
During the second quarter of 2013, CCA received notification that it was not selected for the continued management of the Wilkinson County Correctional Facility at the end of the contract on June 30, 2013. As a result of this managed-only contract termination, during the second quarter of 2013, CCA recorded asset impairments of $2.6 million consisting of a goodwill impairment charge of $0.8 million and $1.8 million for other assets. These charges are reported as discontinued operations in the accompanying statement of operations for the year ended December 31, 2013.
| 4. | PROPERTY AND EQUIPMENT |
At December 31, 2014, CCA owned 54 real estate properties, including 52 correctional and detention facilities, three of which CCA leased to other operators, and two corporate office buildings. At December 31, 2014, CCA also managed 12 correctional and detention facilities owned by governmental agencies.
Property and equipment, at cost, consists of the following (in thousands):
| December 31, | ||||||||
| 2014 | 2013 | |||||||
| Land and improvements |
$ | 127,221 | $ | 127,246 | ||||
| Buildings and improvements |
3,048,836 | 3,058,748 | ||||||
| Equipment and software |
326,603 | 316,696 | ||||||
| Office furniture and fixtures |
30,884 | 30,969 | ||||||
| Construction in progress |
276,508 | 93,187 | ||||||
|
|
|
|
|
|||||
| 3,810,052 | 3,626,846 | |||||||
| Less: Accumulated depreciation |
(1,151,424 | ) | (1,080,233 | ) | ||||
|
|
|
|
|
|||||
| $ | 2,658,628 | $ | 2,546,613 | |||||
|
|
|
|
|
|||||
Construction in progress primarily consists of correctional facilities under construction or expansion. Interest is capitalized on construction in progress and amounted to $2.5 million, $0.8 million, and $1.1 million in 2014, 2013, and 2012, respectively.
Depreciation expense was $114.0 million, $112.8 million, and $113.2 million for the years ended December 31, 2014, 2013, and 2012, respectively.
Eleven of the facilities owned by CCA are subject to options that allow various governmental agencies to purchase those facilities. Certain of these options to purchase are based on a depreciated book value while others are based on a fair market value calculation. In addition, two facilities, one of which is also subject to a purchase option, are constructed on land that CCA leases
F-16
from governmental agencies under ground leases. Under the terms of those ground leases, the facilities become the property of the governmental agencies upon expiration of the ground leases in 2015 and 2017. CCA depreciates these properties over the shorter of the term of the applicable ground lease or the estimated useful life of the property.
CCA leases portions of the land and building of the San Diego Correctional Facility under an operating lease that expires December 2015 pursuant to amended lease terms executed between CCA and the County of San Diego in January 2010. CCA also leases land and building at the Elizabeth Detention Center under operating leases that expire in June 2015. During December 2013, CCA elected to terminate the lease of land and building at the North Georgia Detention Center effective during the first quarter of 2014.
CCA leases the South Texas Family Residential Center and the site upon which it is being constructed from a third-party lessor. CCA’s lease agreement with the lessor is over a base period co-terminus with an amended IGSA with ICE, as further described in Note 5, and includes two one-year renewal periods. However, under terms of the lease agreement, if ICE terminates the amended IGSA for convenience, CCA can terminate the agreement, without penalty, by providing the lessor with a 90-day notice. In the event ICE elects to terminate the amended IGSA due to a non-appropriation of funds, CCA must provide a 60-day notice period to the lessor. If ICE terminates the IGSA due to non-appropriation of funds without notice to CCA, CCA may not be able to provide a timely termination notice to the lessor and could, therefore, be subject to a penalty the equivalent of up to two months of payments due to the lessor, which would currently amount to approximately $13.4 million.
In January 2015, a class action lawsuit was filed in federal district court for the District of Columbia against the Secretary of the Department of Homeland Security (“DHS”) and certain ICE officials. The complaint sought to certify a class of plaintiffs, consisting of Central American mothers and children who (i) have been or will be detained in ICE family detention facilities since June 2014, (ii) have been or will be determined to have a credible fear of persecution in their home country under federal asylum laws and (iii) are eligible for release on bond pursuant to certain federal statutes but have been or will be denied such release after being subject to an ICE custody determination that took deterrence of mass migration into account. In February 2015, the court certified the class and granted the plaintiffs’ motion for a preliminary injunction, enjoining DHS from detaining class members for the purpose of deterring future immigration to the United States and from considering deterrence of such immigration as a factor in such custody determinations until a final determination has been reached on the merits of the action. CCA has not received any instruction from ICE on what action they intend to take in response to the court order, or how and whether it will affect CCA’s contract at the South Texas Family Residential Center. Any adverse decision with regard to this contract could materially affect CCA’s financial condition and results of operations.
CCA’s lease agreement with the third-party lessor required CCA to pay $70.0 million in September 2014, which resulted in CCA being deemed the owner of the constructed assets for accounting purposes, in accordance with ASC 840-40-55, formerly Emerging Issues Task Force No. 97-10, “The Effect of Lessee Involvement in Asset Construction”. Accordingly, CCA is recording an asset representing the estimated costs incurred attributable to the building assets being constructed by the third-party lessor and a related financing liability. CCA will depreciate the asset over the four-year term of the lease and will impute interest for the financing liability. Additionally, CCA determined that the lease with the third-party lessor also includes separate units of account for the land and pre-existing cottages as well as food services provided by the third-party lessor. The amount of consideration allocated to each of these separate deliverables was determined based on the relative selling price of the lessor-financing, the land lease, the lease of pre-existing cottages, and the food services. The operating lease term for the land is equivalent to the four-year term of the lease and is recognized on a straight-line basis over the lease term. The operating lease term for the pre-existing cottages is the four-month period in which CCA expects to use the cottages for housing residents. The food services provided by the third-party lessor are recognized proportionally based on the number of beds available to ICE during the construction period until such time as the facility reaches its capacity of 2,400 beds which is expected to be in the second quarter of 2015. In addition to the lease commitments described above, as of December 31, 2014, CCA has contractually committed $57.6 million for tenant improvements, furniture and equipment, and various other services related to the South Texas Family Residential Center even though many of these agreements provide CCA with the ability to terminate if ICE terminates the amended IGSA.
The rental expense incurred for the leases at these four facilities, inclusive of the expenses recognized for the South Texas lease, as described above, was $9.1 million, $5.9 million, and $4.7 million for the years ended December 31, 2014, 2013, and 2012, respectively. Future minimum lease payments as of December 31, 2014 under these operating leases, inclusive of $287.4 million
F-17
of payments expected to be made under the cancelable lease at the South Texas facility, are as follows (in thousands):
| 2015 |
$ | 83,427 | ||
| 2016 |
79,538 | |||
| 2017 |
73,412 | |||
| 2018 |
53,733 | |||
| 2019 |
— | |||
| Thereafter |
— |
In December 2009, CCA entered into an Economic Development Agreement (“EDA”) with the Wheeler County Development Authority (“Wheeler County”) in Wheeler County, Georgia to implement a tax abatement plan related to CCA’s bed expansion project at its Wheeler Correctional Facility. The tax abatement plan provides for 50% abatement of real property taxes for six years. In December 2009, Wheeler County issued bonds in a maximum principal amount of $30.0 million. Also, in December 2009, CCA entered into an EDA with the Douglas-Coffee County Industrial Authority (“Coffee County”) in Coffee County, Georgia to implement a tax abatement plan related to CCA’s bed expansion project at its Coffee Correctional Facility. The tax abatement plan provides for 100% abatement of real property taxes for five years. In December 2009, Coffee County issued bonds in a maximum principal amount of $33.0 million. In June 2013, CCA also entered into an EDA with the Development Authority of Telfair County (“Telfair County”) in Telfair County, Georgia to implement a tax abatement plan related to CCA’s bed expansion project at its McRae Correctional Facility. The tax abatement plan provides for 90% abatement of real property taxes in the first year, decreasing by 10% over the subsequent nine years. In June 2013, Telfair County issued bonds in a maximum principal amount of $15.0 million.
According to each of the EDAs, legal title of CCA’s real property was transferred to the respective county. Pursuant to each EDA, the bonds were issued to CCA, so no cash exchanged hands. In each case, the applicable county authority then leased the real property back to CCA. The lease payments are equal to the amount of the payments on the bonds. At any time, CCA has the option to purchase the real property by paying off the bonds, plus $100. Due to the form of the transactions, CCA has not recorded the bonds or the capital leases associated with sale lease-back transactions. The original cost of CCA’s property and equipment is recorded on the balance sheet and is being depreciated over its estimated useful life.
| 5. | REAL ESTATE TRANSACTIONS |
Acquisitions
On July 31, 2013, CCA acquired in a business combination all of the stock of CAI, a privately held San Diego, California community corrections company that specializes in residential re-entry, home detention, and work furlough programs for San Diego County, the BOP and United States Pretrial and Probation. CCA acquired CAI as a strategic investment in a complementary business that broadens the scope of solutions it provides, from incarceration through release, and supporting its belief in helping offenders successfully transition to society. The consideration paid for CAI, consisted of approximately $36.5 million in cash, excluding transaction related expenses of $0.8 million. The purchase price was allocated based on fair value for the assets acquired and the liabilities assumed. In allocating the purchase price, CCA recorded $7.0 million of goodwill, $26.9 million of identifiable intangible assets, $7.9 million of intangible liabilities, $17.7 million of net tangible assets, and $7.2 million of deferred tax liabilities. Several factors gave rise to the goodwill recorded in the acquisition, such as the expected benefit from synergies of the combination and the long-term contracts within a complementary business that broadens the scope of solutions CCA provides. The results of operations for CAI have been included in the Company’s consolidated financial statements from the date of acquisition.
F-18
Real Estate Closures and Idle Facilities
CCA has five idled core facilities that are currently available and being actively marketed to other customers. CCA considers its core facilities to be those that were designed for adult secure correctional purposes. The following table summarizes each of the idled core facilities and their respective carrying values, excluding equipment and other assets that could generally be transferred and used at other facilities CCA owns without significant cost (dollars in thousands):
| Design Capacity |
Date Idled |
Net Carrying Values at December 31, | ||||||||||||||
| Facility |
2014 | 2013 | ||||||||||||||
| Prairie Correctional Facility |
1,600 | 2010 | $ | 18,748 | $ | 19,366 | ||||||||||
| Huerfano County Correctional Center |
752 | 2010 | 19,033 | 19,800 | ||||||||||||
| Diamondback Correctional Facility |
2,160 | 2010 | 44,480 | 44,223 | ||||||||||||
| Otter Creek Correctional Center |
656 | 2012 | 24,089 | 24,805 | ||||||||||||
| Marion Adjustment Center |
826 | 2013 | 12,978 | 13,429 | ||||||||||||
|
|
|
|
|
|
|
|||||||||||
| 5,994 | $ | 119,328 | $ | 121,623 | ||||||||||||
|
|
|
|
|
|
|
|||||||||||
CCA also has three idled non-core facilities with carrying values amounting to $1.3 million and $30.4 million as of December 31, 2014 and 2013, respectively. CCA considers the Shelby Training Center, Queensgate Correctional Facility, and Mineral Wells Pre-Parole Transfer Facility to be non-core facilities because they were designed for uses other than for adult secure correctional purposes. From the date each of the aforementioned eight facilities became idle, CCA incurred approximately $7.9 million, $6.4 million, and $6.0 million in operating expenses for the years ended December 31, 2014, 2013, and 2012, respectively. The operating expenses incurred in 2014 and 2013 exclude the incremental expenses incurred in connection with the activation of the Diamondback facility which began in the third quarter of 2013 and continued until near the end of the second quarter of 2014, when anticipated opportunities to activate the facility were deferred.
CCA considers the cancellation of a contract as an indicator of impairment and tested each of the aforementioned facilities for impairment when it was notified by the respective customers that they would no longer be utilizing such facility. Upon notification of cancellation by the respective customers, CCA concluded in each case that no impairment had occurred. CCA updates the impairment analyses on an annual basis for each of the idled facilities and evaluates on a quarterly basis market developments for the potential utilization of each of these facilities in order to identify events that may cause CCA to reconsider its most recent assumptions. As a result of CCA’s analyses, CCA determined each of the five core assets to have recoverable values in excess of the corresponding carrying values.
In the fourth quarter of 2014, CCA made the decision to actively pursue the sale of the Queensgate Correctional Facility, idle since 2009, and the Mineral Wells Pre-Parole Transfer Facility, idle since 2013. CCA reviewed comparable sales data and concluded that either the exit value in the principle market or comparable sales prices for similar properties in the respective geographical areas represented the fair value of these non-core assets. CCA determined the principle market for these non-core assets will be buyers who intend to use the assets for purposes other than as correctional facilities. The aggregate net book value of these facilities prior to the evaluation for impairment was $28.8 million and, as a result of the impairment indicator resulting from the potential sale of the facilities, CCA recorded non-cash impairments totaling $27.8 million during the fourth quarter of 2014 to write down the book values of the Queensgate and Mineral Wells facilities to the estimated fair values using Level 2 inputs for quoted prices of similar assets and assuming asset sales for uses other than correctional facilities.
F-19
Sales
In the third quarter of 2014, CCA entered into a purchase and sale agreement with a third party to sell its idled Houston Educational Facility in Houston, Texas for $4.5 million. The Houston Educational Facility was another non-core asset that was previously leased to a charter school operator. CCA closed on the sale during the fourth quarter of 2014. The net book value of this facility prior to the evaluation for impairment was $6.4 million and, as a result of the impairment indicator resulting from the potential sale of the facility, CCA recorded a non-cash impairment of $2.2 million during the second quarter of 2014 to write-down the book value of the facility to the estimated fair value using Level 2 inputs. The ultimate sale price was used as a proxy for the fair value of the facility.
Construction of New Facilities
In order to retain federal inmate populations CCA currently manages in the 1,154-bed San Diego Correctional Facility, CCA is constructing the 1,492-bed Otay Mesa Detention Center in San Diego. The existing San Diego Correctional Facility is subject to a ground lease with the County of San Diego. Under the provisions of the lease, the facility is divided into different premises whereby, pursuant to an amendment to the ground lease executed in January 2010, ownership of the entire facility reverts to the County upon expiration of the lease on December 31, 2015. As of December 31, 2014, CCA has invested approximately $121.5 million in the new facility. CCA has developed plans to build the Otay Mesa Detention Center within a construction timeline that coincides with the expiration of the ground lease with the County of San Diego. CCA plans to offer this new facility to house the existing federal inmate populations at the San Diego Correctional Facility.
In November 2013, CCA announced its decision to re-commence construction of a correctional facility in Trousdale County, Tennessee. CCA suspended construction of this facility in 2009 until it had greater clarity around the timing of a new contract. In October 2013, Trousdale County received notice from the Tennessee Department of Corrections of its intent to partner with the County to develop a new correctional facility to house state of Tennessee inmates. In April 2014, CCA entered into an agreement with Trousdale County whereby CCA agreed to finance, design, build and operate a 2,552-bed facility to meet the responsibilities of a separate IGSA between Trousdale County and the state of Tennessee regarding correctional services. In July 2014, CCA received notice that Trousdale County and the state of Tennessee finalized the IGSA. The IGSA with the state of Tennessee includes a minimum monthly payment plus a per diem payment for each inmate housed in the facility in excess of 90% of the design capacity, provided that during a twenty-six week ramp period the minimum payment is based on the greater of the number of inmates actually at the facility or 90% of the beds available pursuant to the ramp schedule. As of December 31, 2014, CCA has invested approximately $60.7 million in the Trousdale Turner Correctional Center and construction is expected to be completed in the fourth quarter of 2015.
Activations
In September 2012, CCA announced that it was awarded a new management contract from the Arizona Department of Corrections to house up to 1,000 medium-security inmates at its 1,596-bed Red Rock Correctional Center in Arizona. The new management contract, which commenced in January 2014, contains an initial term of ten years, with two five-year renewal options upon mutual agreement and provides an occupancy guarantee of 90% of the contracted beds, which is expected to be implemented in two phases. The government partner included the occupancy guarantee in its
F-20
Request For Proposal (“RFP”) in order to guarantee its access to the beds. Additionally, the contract provides the state of Arizona an option to purchase the Red Rock facility at any time during the term of the contract, including extension options, based on an amortization schedule starting with the fair market value and decreasing evenly to zero over the twenty-year term. In order to prepare the Red Rock facility to house Arizona inmates under this contract, CCA capitalized $20.8 million of facility improvements during 2013 and 2014. The total net book value of the facility is being depreciated over the twenty-year term.
In September 2014, CCA announced that it had agreed under an expansion of an existing IGSA between the City of Eloy, Arizona and ICE to house up to 2,400 individuals at the South Texas Family Residential Center, a facility leased by CCA in Dilley, Texas. Certain new services provided under the amended IGSA commenced in the fourth quarter of 2014, have a term of up to four years, and can be extended by bi-lateral modifications. The agreement provides for a fixed monthly payment in accordance with a graduated schedule. Under terms of the amended IGSA, ICE can terminate the agreement for convenience, without penalty, by providing CCA with at least a 90-day notice. In addition, terms allow for ICE to terminate the agreement with CCA at any time, without penalty, due to a non-appropriation of funds. ICE began housing the first residents at the facility in December 2014, and the site is expected to be ready for full capacity during the second quarter of 2015.
Under the fixed monthly payment schedule of the amended IGSA, ICE agreed to pay CCA $70.0 million in two $35.0 million installments during the fourth quarter of 2014 and graduated fixed monthly payments over the remaining months of the contract. As described in Note 2, CCA used the multiple-element arrangement guidance prescribed in ASC 605, “Revenue Recognition” in determining the total revenue to be recognized over the term of the amended IGSA. CCA determined that there were five distinct elements related to the amended IGSA with ICE. The lease revenue element, representing the operating lease of the site and constructed assets, was valued based on the estimated selling price of the land and building improvements provided to ICE and is recognized proportionately based on the number of beds available. The correctional services revenue element, representing the correctional management services provided to ICE, was valued based on the estimated selling price of similar services CCA provides and is recognized based on labor efforts expended over the contract. The food services revenue element was valued based on the TPE of the contracted outsourced service and is recognized proportionately based on the number of beds available. The educational services revenue element, representing the grade-level appropriate juvenile educational program prescribed under the IGSA, was based on the TPE of the contracted outsourced service and is recognized on a straight-line basis over the period educational services are required to be performed. The construction management services revenue element, representing CCA’s site development and construction management services, was valued based on the estimated selling price of similar services CCA provides and is recognized on a straight-line basis during the first seven months of the IGSA representing the period over which the construction activity will be ongoing. During 2014, CCA recognized $21.0 million in revenue associated with the amended IGSA with the unrecognized balance of the fixed monthly payments reported in deferred revenue, which is reflected within other liabilities, in the accompanying consolidated balance sheet as of December 31, 2014.
Other Leasing Transactions
In October 2013, CCA entered into a lease for its California City Correctional Center with the CDCR. The lease agreement includes a three-year base term that commenced December 1, 2013, with unlimited two-year renewal options upon mutual agreement. Annual base rent during the three-year base term is fixed at $28.5 million. After the three-year base term, the rent will be increased annually by the lesser of CPI (Consumer Price Index) or 2%. CCA is responsible for repairs and
F-21
maintenance, property taxes and property insurance, while all other aspects and costs of facility operations are the responsibility of the CDCR. CCA also provided $10.0 million of tenant allowances and improvements which is being amortized as a reduction to rental revenue over the expected lease term.
During December 2013, CCA elected to terminate the lease from the City of Gainesville, Georgia, of the land and building at the North Georgia Detention Center and make replacement beds available at the Stewart Detention Center in Lumpkin, Georgia for the ICE detainees housed at the North Georgia facility. CCA reported an asset impairment of $3.8 million in the fourth quarter of 2013 primarily for renovations CCA made to the North Georgia facility, as well as $1.0 million of expenses associated with the lease termination. All of the detainees were transferred out of the facility and control of the facility was returned to the City of Gainesville near the end of the first quarter of 2014.
| 6. | INVESTMENT IN AFFILIATE |
CCA has a 50% ownership interest in APM, an entity holding the management contract for a correctional facility, HM Prison Forest Bank, under a 25-year prison management contract with an agency of the United Kingdom government. CCA has determined that its joint venture investment in APM represents a variable interest entity (“VIE”) in accordance with ASC 810, “Consolidation” of which CCA is not the primary beneficiary. The Forest Bank facility, located in Salford, England, was previously constructed and owned by a wholly-owned subsidiary of CCA, which was sold in April 2001. All gains and losses under the joint venture are accounted for using the equity method of accounting. During 2000, CCA extended a working capital loan to APM, which has an outstanding balance of $3.7 million as of December 31, 2014.
For the years ended December 31, 2014, 2013, and 2012, equity in earnings of the joint venture was $720,000, $78,000 and $323,000, respectively, which is included in other (income) expense in the consolidated statements of operations. As of December 31, 2014, CCA’s investment in APM was $0.1 million and is reported in other assets in the accompanying consolidated balance sheets. The outstanding working capital loan of $3.7 million, combined with the $0.1 million investment in APM, represents CCA’s maximum exposure to loss in connection with APM.
| 7. | INVESTMENT IN DIRECT FINANCING LEASE |
At December 31, 2014, CCA’s investment in a direct financing lease represents net receivables under a building and equipment lease between CCA and the District of Columbia for the D.C. Correctional Treatment Facility.
A schedule of minimum rentals to be received under the direct financing lease in future years is as follows (in thousands):
| 2015 |
$ | 2,793 | ||
| 2016 |
2,793 | |||
| 2017 |
694 | |||
| 2018 |
— | |||
| 2019 |
— | |||
|
|
|
|||
| Total minimum obligation |
6,280 | |||
| Less unearned interest income |
(807 | ) | ||
| Less current portion of direct financing lease |
(2,250 | ) | ||
|
|
|
|||
| Investment in direct financing lease |
$ | 3,223 | ||
|
|
|
F-22
During the years ended December 31, 2014, 2013, and 2012, CCA recorded interest income of $0.8 million, $1.0 million, and $1.2 million, respectively, under this direct financing lease.
| 8. | OTHER ASSETS |
Other assets consist of the following (in thousands):
| December 31, | ||||||||
| 2014 | 2013 | |||||||
| Debt issuance costs, less accumulated amortization of $5,413 and $2,311, respectively |
$ | 14,305 | $ | 17,336 | ||||
| Intangible lease value |
24,289 | 25,567 | ||||||
| Deferred leasing costs |
8,338 | 9,305 | ||||||
| Notes receivable, net |
8,285 | 6,987 | ||||||
| Cash equivalents and cash surrender value of life insurance held in Rabbi trust |
17,918 | 15,811 | ||||||
| Deposits |
1,982 | 2,037 | ||||||
| Straight-line rent receivable |
1,729 | 133 | ||||||
| Other |
1,240 | 652 | ||||||
|
|
|
|
|
|||||
| $ | 78,086 | $ | 77,828 | |||||
|
|
|
|
|
|||||
| 9. | ACCOUNTS PAYABLE, ACCRUED EXPENSES AND OTHER LONG-TERM LIABILITIES |
Accounts payable and accrued expenses consist of the following (in thousands):
| December 31, | ||||||||
| 2014 | 2013 | |||||||
| Trade accounts payable |
$ | 49,825 | $ | 49,826 | ||||
| Accrued salaries and wages |
58,173 | 58,810 | ||||||
| Accrued dividends |
61,129 | 56,306 | ||||||
| Accrued workers’ compensation and auto liability |
7,727 | 8,409 | ||||||
| Accrued litigation |
4,323 | 6,170 | ||||||
| Accrued employee medical insurance |
8,530 | 9,658 | ||||||
| Accrued property taxes |
24,522 | 24,721 | ||||||
| Accrued interest |
6,435 | 6,331 | ||||||
| Deferred revenue |
5,725 | 375 | ||||||
| Construction payable |
64,995 | 8,374 | ||||||
| Other |
26,182 | 23,297 | ||||||
|
|
|
|
|
|||||
| $ | 317,566 | $ | 252,277 | |||||
|
|
|
|
|
|||||
The total liability for workers’ compensation and auto liability was $23.5 million and $24.1 million as of December 31, 2014 and 2013, respectively, with the long-term portion included in other long-term liabilities in the accompanying consolidated balance sheets. These liabilities were discounted to the net present value of the outstanding liabilities using a 3.0% rate in 2014 and 2013. These liabilities amounted to $26.4 million and $27.1 million on an undiscounted basis as of December 31, 2014 and 2013, respectively.
F-23
Other long-term liabilities consist of the following (in thousands):
| December 31, | ||||||||
| 2014 | 2013 | |||||||
| Deferred revenue |
$ | 87,227 | $ | 1,070 | ||||
| Intangible lease liability |
7,352 | 7,739 | ||||||
| Accrued workers’ compensation |
15,732 | 15,707 | ||||||
| Accrued deferred compensation |
13,036 | 15,013 | ||||||
| Other |
3,356 | 5,983 | ||||||
|
|
|
|
|
|||||
| $ | 126,703 | $ | 45,512 | |||||
|
|
|
|
|
|||||
| 10. | DEBT |
Debt outstanding consists of the following (in thousands):
| December 31, | ||||||||
| 2014 | 2013 | |||||||
| Revolving Credit Facility, principal due at maturity in December 2017; interest payable periodically at variable interest rates. The weighted average rate at December 31, 2014 and 2013 was 1.9% and 1.7%, respectively. |
$ | 525,000 | $ | 530,000 | ||||
| 4.625% Senior Notes, principal due at maturity in May 2023; interest payable semi-annually in May and November at 4.625%. |
350,000 | 350,000 | ||||||
| 4.125% Senior Notes, principal due at maturity in April 2020; interest payable semi-annually in April and October at 4.125%. |
325,000 | 325,000 | ||||||
|
|
|
|
|
|||||
| $ | 1,200,000 | $ | 1,205,000 | |||||
|
|
|
|
|
|||||
Revolving Credit Facility. During March 2013, CCA entered into an amended and restated $900.0 million senior secured revolving credit facility (the “$900.0 Million Revolving Credit Facility”). In addition to replacing the previous $785.0 million revolving credit facility, the amendment extended the maturity by one year to December 2017, and provided covenant flexibility to operate as a REIT. CCA capitalized $2.7 million of costs associated with the amendment.
The $900.0 Million Revolving Credit Facility has an aggregate principal capacity of $900.0 million and has an “accordion” feature that provides for uncommitted incremental extensions of credit in the form of increases in the revolving commitments or incremental term loans in an aggregate principal amount up to an additional $100.0 million as requested by CCA, subject to bank approval. At CCA’s option, interest on outstanding borrowings under the $900.0 Million Revolving Credit Facility is based on either a base rate plus a margin ranging from 0.25% to 1.0% or a London Interbank Offered Rate (“LIBOR”) plus a margin ranging from 1.25% to 2.0% based on CCA’s leverage ratio. The $900.0 Million Revolving Credit Facility includes a $30.0 million sublimit for swing line loans that enables CCA to borrow at the base rate from the Administrative Agent without advance notice.
Based on CCA’s current leverage ratio, loans under the $900.0 Million Revolving Credit Facility currently bear interest at the base rate plus a margin of 0.75% or at LIBOR plus a margin of 1.75%, and a commitment fee equal to 0.35% of the unfunded balance. The $900.0 Million Revolving Credit Facility also has a $50.0 million sublimit for the issuance of standby letters of credit. As of December 31, 2014, CCA had $525.0 million in borrowings under the $900.0 Million Revolving Credit Facility as well as $16.3 million in letters of credit outstanding resulting in $358.7 million available under the $900.0 Million Revolving Credit Facility.
F-24
The $900.0 Million Revolving Credit Facility is secured by a pledge of all of the capital stock of CCA’s domestic subsidiaries, 65% of the capital stock of CCA’s foreign subsidiaries, all of CCA’s accounts receivable, and all of CCA’s deposit accounts. The $900.0 Million Revolving Credit Facility requires CCA to meet certain financial covenants, including, without limitation, a maximum total leverage ratio, a maximum secured leverage ratio, and a minimum fixed charge coverage ratio. As of December 31, 2014, CCA was in compliance with all such covenants. In addition, the $900.0 Million Revolving Credit Facility contains certain covenants that, among other things, limit the incurrence of additional indebtedness, acquisitions and other investments, payment of dividends and other customary restricted payments, transactions with affiliates, asset sales, mergers and consolidations, liquidations, prepayments and modifications of other indebtedness, liens and other encumbrances and other matters customarily restricted in such agreements. In addition, the $900.0 Million Revolving Credit Facility is subject to certain cross-default provisions with terms of CCA’s other indebtedness, and is subject to acceleration upon the occurrence of a change of control.
Senior Notes. Interest on the $325.0 million aggregate principal amount of CCA’s 4.125% senior notes issued in April 2013 (the “4.125% Senior Notes”) accrues at the stated rate and is payable in April and October of each year. The 4.125% Senior Notes are scheduled to mature on April 1, 2020. Interest on the $350.0 million aggregate principal amount of CCA’s 4.625% senior notes issued in April 2013 (the “4.625% Senior Notes”) accrues at the stated rate and is payable in May and November of each year. The 4.625% Senior Notes are scheduled to mature on May 1, 2023. The 4.125% Senior Notes and the 4.625% Senior Notes, collectively referred to herein as the “Senior Notes”, are senior unsecured obligations of the Company and are guaranteed by all of the Company’s subsidiaries that guarantee the $900.0 Million Revolving Credit Facility. CCA may redeem all or part of the Senior Notes at any time prior to three months before their respective maturity date at a “make-whole” redemption price, plus accrued and unpaid interest thereon to, but not including, the redemption date. Thereafter, the Senior Notes are redeemable at CCA’s option, in whole or in part, at a redemption price equal to 100% of the aggregate principal amount of the notes to be redeemed plus accrued and unpaid interest thereon to, but not including, the redemption date.
Guarantees and Covenants. All of the domestic subsidiaries of CCA (as the parent corporation) have provided full and unconditional guarantees of the Senior Notes. Each of CCA’s subsidiaries guaranteeing the Senior Notes are 100% owned subsidiaries of CCA; the subsidiary guarantees are full and unconditional and are joint and several obligations of the guarantors; and all non-guarantor subsidiaries are minor (as defined in Rule 3-10(h)(6) of Regulation S-X).
As of December 31, 2014, neither CCA nor any of its subsidiary guarantors had any material or significant restrictions on CCA’s ability to obtain funds from its subsidiaries by dividend or loan or to transfer assets from such subsidiaries.
The indentures governing the Senior Notes contain certain customary covenants that, subject to certain exceptions and qualifications, restrict CCA’s ability to, among other things, make restricted payments; incur additional debt or issue certain types of preferred stock; create or permit to exist certain liens; consolidate, merge or transfer all or substantially all of CCA’s assets; and enter into transactions with affiliates. In addition, if CCA sells certain assets (and generally does not use the proceeds of such sales for certain specified purposes) or experiences specific kinds of changes in control, CCA must offer to repurchase all or a portion of the Senior Notes. The offer price for the Senior Notes in connection with an asset sale would be equal to 100% of the aggregate principal amount of the notes repurchased plus accrued and unpaid interest and liquidated damages, if any, on the notes repurchased to the date of purchase. The offer price for the Senior Notes in connection with a change in control would be 101% of the aggregate principal
F-25
amount of the notes repurchased plus accrued and unpaid interest and liquidated damages, if any, on the notes repurchased to the date of purchase. The Senior Notes are also subject to certain cross-default provisions with the terms of CCA’s $900.0 Million Revolving Credit Facility, as more fully described hereafter.
Other Debt Transactions
Letters of Credit. At December 31, 2014 and 2013, CCA had $16.3 million and $25.0 million, respectively, in outstanding letters of credit. The letters of credit were issued to secure CCA’s workers’ compensation and general liability insurance policies, performance bonds, and utility deposits. The letters of credit outstanding at December 31, 2014 and 2013 were provided by a sub-facility under the $900.0 Million Revolving Credit Facility.
Debt Maturities
Scheduled principal payments as of December 31, 2014 for the next five years and thereafter were as follows (in thousands):
| 2015 |
$ | — | ||
| 2016 |
— | |||
| 2017 |
525,000 | |||
| 2018 |
— | |||
| 2019 |
— | |||
| Thereafter |
675,000 | |||
|
|
|
|||
| Total debt |
$ | 1,200,000 | ||
|
|
|
Cross-Default Provisions
The provisions of CCA’s debt agreements relating to the $900.0 Million Revolving Credit Facility and the Senior Notes contain certain cross-default provisions. Any events of default under the $900.0 Million Revolving Credit Facility that results in the lenders’ actual acceleration of amounts outstanding thereunder also result in an event of default under the Senior Notes. Additionally, any events of default under the Senior Notes that give rise to the ability of the holders of such indebtedness to exercise their acceleration rights also result in an event of default under the $900.0 Million Revolving Credit Facility.
If CCA were to be in default under the $900.0 Million Revolving Credit Facility, and if the lenders under the $900.0 Million Revolving Credit Facility elected to exercise their rights to accelerate CCA’s obligations under the $900.0 Million Revolving Credit Facility, such events could result in the acceleration of all or a portion of CCA’s Senior Notes, which would have a material adverse effect on CCA’s liquidity and financial position. CCA does not have sufficient working capital to satisfy its debt obligations in the event of an acceleration of all or a substantial portion of CCA’s outstanding indebtedness.
F-26
| 11. | INCOME TAXES |
As discussed in Note 1, the Company began operating in compliance with REIT requirements for federal income tax purposes effective January 1, 2013. As a REIT, the Company must distribute at least 90 percent of its taxable income (including dividends paid to it by its TRSs) and will not pay federal income taxes on the amount distributed to its shareholders. Therefore, the Company should not be subject to federal income taxes if it distributes 100 percent of its taxable income. In addition, the Company must meet a number of other organizational and operational requirements. It is management’s intention to adhere to these requirements and maintain the Company’s REIT status. Most states where CCA holds investments in real estate conform to the federal rules recognizing REITs. Certain subsidiaries have made an election with the Company to be treated as TRSs in conjunction with the Company’s REIT election; the TRS elections permit CCA to engage in certain business activities in which the REIT may not engage directly. A TRS is subject to federal and state income taxes on the income from these activities and therefore, CCA includes a provision for taxes in its consolidated financial statements.
Income tax expense (benefit) is comprised of the following components (in thousands):
| For the Years Ended December 31, | ||||||||||||
| 2014 | 2013 | 2012 | ||||||||||
| Current income tax expense (benefit) |
||||||||||||
| Federal |
$ | 9,326 | $ | 13,674 | $ | 75,867 | ||||||
| State |
828 | 2,368 | 5,885 | |||||||||
|
|
|
|
|
|
|
|||||||
| 10,154 | 16,042 | 81,752 | ||||||||||
|
|
|
|
|
|
|
|||||||
| Deferred income tax expense (benefit) |
||||||||||||
| Federal |
(2,280 | ) | (144,771 | ) | 8,576 | |||||||
| State |
(931 | ) | (6,266 | ) | (2,815 | ) | ||||||
|
|
|
|
|
|
|
|||||||
| (3,211 | ) | (151,037 | ) | 5,761 | ||||||||
|
|
|
|
|
|
|
|||||||
| Income tax expense (benefit) |
$ | 6,943 | $ | (134,995 | ) | $ | 87,513 | |||||
|
|
|
|
|
|
|
|||||||
F-27
Significant components of CCA’s deferred tax assets and liabilities as of December 31, 2014 and 2013, are as follows (in thousands):
| December 31, | ||||||||
| 2014 | 2013 | |||||||
| Current deferred tax assets: |
||||||||
| Asset reserves and liabilities not yet deductible for tax |
$ | 15,969 | $ | 11,284 | ||||
|
|
|
|
|
|||||
| Net current deferred tax assets |
15,969 | 11,284 | ||||||
|
|
|
|
|
|||||
| Current deferred tax liabilities: |
||||||||
| Other |
(2,740 | ) | (2,043 | ) | ||||
|
|
|
|
|
|||||
| Net total current deferred tax assets |
$ | 13,229 | $ | 9,241 | ||||
|
|
|
|
|
|||||
| Noncurrent deferred tax assets: |
||||||||
| Asset reserves and liabilities not yet deductible for tax |
$ | 15,665 | $ | 17,372 | ||||
| Tax over book basis of certain assets |
924 | 897 | ||||||
| Net operating loss and tax credit carryforwards |
5,008 | 4,575 | ||||||
| Intangible contract value |
2,877 | 3,024 | ||||||
| Other |
579 | 705 | ||||||
|
|
|
|
|
|||||
| Total noncurrent deferred tax assets |
25,053 | 26,573 | ||||||
| Less valuation allowance |
(4,065 | ) | (4,497 | ) | ||||
|
|
|
|
|
|||||
| Net noncurrent deferred tax assets |
20,988 | 22,076 | ||||||
|
|
|
|
|
|||||
| Noncurrent deferred tax liabilities: |
||||||||
| Book over tax basis of certain assets |
(9,028 | ) | (9,067 | ) | ||||
| Intangible lease value |
(9,431 | ) | (9,894 | ) | ||||
| Other |
(228 | ) | (37 | ) | ||||
|
|
|
|
|
|||||
| Total noncurrent deferred tax liabilities |
(18,687 | ) | (18,998 | ) | ||||
|
|
|
|
|
|||||
| Net total noncurrent deferred tax assets |
$ | 2,301 | $ | 3,078 | ||||
|
|
|
|
|
|||||
The tax benefits associated with equity-based compensation reduced income taxes payable by $0.7 million, $0.4 million, and $2.6 million during 2014, 2013, and 2012, respectively. Such benefits were recorded as increases to stockholders’ equity.
A reconciliation of the income tax provision at the statutory income tax rate and the effective tax rate as a percentage of income from continuing operations before income taxes for the years ended December 31, 2014, 2013, and 2012 is as follows:
| 2014 | 2013 | 2012 | ||||||||||
| Statutory federal rate |
35.0 | % | 35.0 | % | 35.0 | % | ||||||
| Dividends paid deduction |
(31.1 | ) | (30.7 | ) | — | |||||||
| State taxes, net of federal tax benefit |
0.8 | 1.1 | 1.0 | |||||||||
| Permanent differences |
0.1 | 3.0 | 0.7 | |||||||||
| Impact of REIT election |
— | (87.0 | ) | — | ||||||||
| Other items, net |
(1.4 | ) | (1.0 | ) | (0.9 | ) | ||||||
|
|
|
|
|
|
|
|||||||
| 3.4 | % | (79.6 | )% | 35.8 | % | |||||||
|
|
|
|
|
|
|
|||||||
CCA’s effective tax rate was 3.4%, (79.6)%, and 35.8% during 2014, 2013, and 2012, respectively. CCA’s effective tax rate is significantly different in 2014 and 2013 as a result of its election to be taxed as a REIT effective January 1, 2013. As a result of CCA’s election to be taxed as a REIT effective January 1, 2013, CCA recorded during the first quarter of 2013 a net tax benefit of $137.7
F-28
million for the revaluation of certain deferred tax assets and liabilities and other income taxes associated with the REIT conversion based on the revised tax structure. As a REIT, CCA is entitled to a deduction for dividends paid, resulting in a substantial reduction in the amount of federal income tax expense it recognizes. Substantially all of CCA’s income tax expense is incurred based on the earnings generated by its TRSs. CCA’s overall effective tax rate is estimated based on its current projection of taxable income primarily generated in its TRSs. The Company’s consolidated effective tax rate could fluctuate in the future based on changes in estimates of taxable income, the relative amounts of taxable income generated by the TRSs and the REIT, the implementation of additional tax planning strategies, changes in federal or state tax rates or laws affecting tax credits available to the Company, changes in other tax laws, changes in estimates related to uncertain tax positions, or changes in state apportionment factors, as well as changes in the valuation allowance applied to the Company’s deferred tax assets that are based primarily on the amount of state net operating losses and tax credits that could expire unused.
CCA had no liabilities for uncertain tax positions as of December 31, 2014 and 2013. CCA recognizes interest and penalties related to unrecognized tax positions in income tax expense. CCA does not currently anticipate that the total amount of unrecognized tax positions will significantly change in the next twelve months.
CCA’s U.S. federal income tax returns for tax years 2011 through 2013 remain subject to examination by the Internal Revenue Service (“IRS”). All states in which CCA files income tax returns follow the same statute of limitations as federal, with the exception of the following states whose open tax years include 2010 through 2013: Arizona, California, Colorado, Kentucky, Michigan, Minnesota, New Jersey, Texas, and Wisconsin.
| 12. | DISCONTINUED OPERATIONS |
In April 2014, the FASB issued ASU 2014-08, “Presentation of Financial Statements (Topic 205) and Property, Plant, and Equipment (Topic 360): Reporting Discontinued Operations and Disclosures of Disposals of Components of an Entity”, which changed the criteria for reporting a discontinued operation. Specifically, ASU 2014-08 changed the current definition of “discontinued operations” so that only disposals of components that represent a strategic shift that has (or will have) a major effect on an entity’s operations and financial results qualify for discontinued operations reporting. ASU 2014-08 also expanded the disclosure requirements for discontinued operations and requires new disclosures related to a disposal of an individually significant component of an entity that does not qualify for discontinued operations reporting. ASU 2014-08 is effective for interim and annual periods beginning after December 15, 2014, requires prospective application, and permits early adoption beginning in the first quarter of 2014.
CCA elected to early adopt ASU 2014-08 in the first quarter of 2014. Accordingly, under the guidelines of the new ASU 2014-08, the operations of the Bay Correctional Facility, Graceville Correctional Facility, and the Moore Haven Correctional Facility in Florida were not reported as discontinued operations upon expiration of the contracts effective January 31, 2014. In addition, the operation of the Idaho Correctional Center was not reported as a discontinued operation upon expiration of the contract effective July 1, 2014, as CCA concluded that the four facilities do not meet the new definition of a discontinued operation and that they were not individually significant components of an entity. However, operations of terminated contracts that previously qualified as discontinued operations before January 1, 2014 will continue to be reported as such in the respective prior periods.
F-29
In November 2011, CCA announced its joint decision with the state of Mississippi to cease operations at the state-owned 1,172-bed Delta Correctional Facility in Greenwood, Mississippi. In December 2011, CCA began the process of transferring the population of approximately 900 inmates from the facility, which was completed in January 2012.
During the second quarter of 2013, CCA announced that the Texas Department of Criminal Justice elected not to renew its contract for the 2,216-bed managed-only Dawson State Jail in Dallas, Texas due to a legislative budget reduction. As a result, upon expiration of the contract in August 2013, CCA ceased operations of the Dawson State Jail. During the second quarter of 2013, CCA also received notification that it was not selected for the continued management of the 1,000-bed managed-only Wilkinson County Correctional Facility in Woodville, Mississippi at the end of the contract on June 30, 2013.
There were no results of operations during 2014 at these three facilities. The following table summarizes the results of operations for these three facilities for the years ended December 31, 2013 and 2012 (in thousands):
| For the Years Ended December 31, | ||||||||
| 2013 | 2012 | |||||||
| REVENUE: |
||||||||
| Managed-only |
$ | 19,984 | $ | 36,421 | ||||
|
|
|
|
|
|||||
| 19,984 | 36,421 | |||||||
|
|
|
|
|
|||||
| EXPENSES: |
||||||||
| Managed-only |
22,529 | 35,994 | ||||||
| Depreciation and amortization |
799 | 870 | ||||||
| Asset impairments |
2,637 | — | ||||||
|
|
|
|
|
|||||
| 25,965 | 36,864 | |||||||
|
|
|
|
|
|||||
| OPERATING LOSS |
(5,981 | ) | (443 | ) | ||||
| Other (expense) income |
(17 | ) | 96 | |||||
|
|
|
|
|
|||||
| LOSS BEFORE INCOME TAXES |
(5,998 | ) | (347 | ) | ||||
| Income tax benefit |
2,241 | 142 | ||||||
|
|
|
|
|
|||||
| LOSS FROM DISCONTINUED OPERATIONS, NET OF TAXES |
$ | (3,757 | ) | $ | (205 | ) | ||
|
|
|
|
|
|||||
There were no assets and $0.1 million of accounts payable and accrued expenses associated with discontinued operations as of December 31, 2014. There were $15,000 of current assets and $0.9 million of accounts payable and accrued expenses associated with discontinued operations as of December 31, 2013.
F-30
| 13. | STOCKHOLDERS’ EQUITY |
Dividends on Common Stock
The tax characterization of dividends per share on common shares as reported to shareholders was as follows for the years ended December 31, 2014, 2013, and 2012:
| Declaration Date |
Record Date | Payable Date | Ordinary Income |
Return of Capital |
Total Per Share | |||||||||
| May 11, 2012 |
June 8, 2012 | June 22, 2012 | 0.20 | (1) | — | $0.20 | ||||||||
| August 20, 2012 |
September 14, 2012 | September 28, 2012 | 0.20 | (1) | — | $0.20 | ||||||||
| November 6, 2012 |
November 30, 2012 | December 14, 2012 | 0.20 | (1) | — | $0.20 | ||||||||
| February 22, 2013 |
April 3, 2013 | April 15, 2013 | 0.346119 | 0.183881 | $0.53 | |||||||||
| May 16, 2013 |
July 3, 2013 | July 15, 2013 | 0.313466 | 0.166534 | $0.48 | |||||||||
| August 16, 2013 |
October 2, 2013 | October 15, 2013 | 0.313466 | 0.166534 | $0.48 | |||||||||
| December 12, 2013 |
January 2, 2014 | January 15, 2014 | 0.48 | (2) | — | $0.48 | ||||||||
| February 20, 2014 |
April 2, 2014 | April 15, 2014 | 0.51 | (3) | — | $0.51 | ||||||||
| May 15, 2014 |
July 2, 2014 | July 15, 2014 | 0.51 | (3) | — | $0.51 | ||||||||
| August 14, 2014 |
October 2, 2014 | October 15, 2014 | 0.51 | (3) | — | $0.51 | ||||||||
| December 11, 2014 |
January 2, 2015 | January 15, 2015 | — | (4) | — | (4) | $0.51 | |||||||
| (1) | The amount constitutes a “Qualified Dividend”, as defined by the IRS. |
| (2) | $0.072069 of this amount constitutes a “Qualified Dividend”, as defined by the IRS. |
| (3) | $0.076573 of this amount constitutes a “Qualified Dividend”, as defined by the IRS. |
| (4) | Taxable in 2015. |
In addition, on April 8, 2013, CCA’s Board of Directors declared a special dividend to shareholders of $675.0 million, or approximately $6.66 per share of common stock, in connection with CCA’s previously announced plan to qualify and convert to a REIT for federal income tax purposes effective as of January 1, 2013. The special dividend was paid in satisfaction of requirements that CCA distribute its accumulated earnings and profits attributable to tax periods ending prior to January 1, 2013. CCA paid the special dividend on May 20, 2013 to shareholders of record as of April 19, 2013. The special dividend constituted a qualified dividend of which $6.647357 was taxable as ordinary income to shareholders in 2013, and $0.012643 constituted a return of capital.
Each CCA shareholder could elect to receive payment of the special dividend either in all cash, all shares of CCA common stock or a combination of cash and CCA common stock, with the total amount of cash payable to shareholders limited to a maximum of 20% of the total value of the special dividend, or $135.0 million. The total amount of cash elected by shareholders exceeded 20% of the total value of the special dividend. As a result, the cash payment was prorated among those shareholders who elected to receive cash, and the remaining portion of the special dividend was paid in shares of CCA common stock. The total number of shares of CCA common stock distributed pursuant to the special dividend was 13.9 million and was determined based on shareholder elections and the average closing price per share of CCA common stock on the New York Stock Exchange for the three trading days after May 9, 2013, or $38.90 per share.
Future dividends will depend on CCA’s distribution requirements as a REIT, future earnings, capital requirements, financial condition, opportunities for alternative uses of capital, and on such other factors as the Board of Directors of CCA may consider relevant.
F-31
Common Stock
Restricted shares. During 2014, CCA issued approximately 548,000 shares of restricted common stock units (“RSUs”) to certain of CCA’s employees and non-employee directors, with an aggregate value of $17.8 million, including 478,000 RSUs to employees and non-employee directors whose compensation is charged to general and administrative expense and 70,000 RSUs to employees whose compensation is charged to operating expense. During 2013, CCA issued approximately 423,000 shares of restricted common stock and RSUs to certain of its employees and non-employee directors, with an aggregate value of $15.6 million, including 378,000 restricted shares or RSUs to employees and non-employee directors whose compensation is charged to general and administrative expense and 45,000 restricted shares to employees whose compensation is charged to operating expense.
CCA established performance-based vesting conditions on the shares of restricted common stock and RSUs awarded to its officers and executive officers in 2014 and in years prior to 2013. Unless earlier vested under the terms of the agreements, shares or RSUs issued to officers and executive officers in these years are subject to vesting over a three-year period based upon the satisfaction of certain performance criteria. No more than one-third of such shares or RSUs may vest in the first performance period; however, the performance criteria are cumulative for the three-year period. With respect to the RSUs issued in 2013 to officers and executive officers, unless earlier vested under the terms of the RSU agreement, the RSUs issued vest evenly over a three-year period and are not subject to performance-based criteria. Unless earlier vested under the terms of the agreements, shares of restricted stock and RSUs issued to other employees “cliff” vest on the third anniversary of the award, while RSUs issued to non-employee directors vest approximately one year from the date of award.
Nonvested restricted common stock transactions as of December 31, 2014 and for the year then ended are summarized below (in thousands, except per share amounts).
| Shares of restricted common stock and RSUs |
Weighted average grant date fair value |
|||||||
| Nonvested at December 31, 2013 |
812 | $ | 32.81 | |||||
| Granted |
548 | $ | 32.40 | |||||
| Cancelled |
(31 | ) | $ | 32.31 | ||||
| Vested |
(309 | ) | $ | 31.73 | ||||
|
|
|
|
|
|||||
| Nonvested at December 31, 2014 |
1,020 | $ | 32.93 | |||||
|
|
|
|
|
|||||
During 2014, 2013, and 2012, CCA expensed $12.1 million ($1.4 million of which was recorded in operating expenses and $10.7 million of which was recorded in general and administrative expenses), $9.8 million ($1.2 million of which was recorded in operating expenses and $8.6 million of which was recorded in general and administrative expenses), and $7.6 million ($1.2 million of which was recorded in operating expenses and $6.4 million of which was recorded in general and administrative expenses), net of forfeitures, relating to the restricted common stock and RSUs, respectively. As of December 31, 2014, CCA had $16.6 million of total unrecognized compensation cost related to restricted common stock and RSUs that is expected to be recognized over a remaining weighted-average period of 1.8 years. The total fair value of restricted common stock and RSUs that vested during 2014, 2013, and 2012 was $9.8 million, $10.5 million, and $5.4 million, respectively.
F-32
Preferred Stock
CCA has the authority to issue 50.0 million shares of $0.01 par value per share preferred stock (the “Preferred Stock”). The Preferred Stock may be issued from time to time upon authorization by the Board of Directors, in such series and with such preferences, conversion or other rights, voting powers, restrictions, limitations as to dividends, qualifications or other provisions as may be fixed by CCA’s Board of Directors.
Stock Option Plans
CCA has equity incentive plans under which, among other things, incentive and non-qualified stock options are granted to certain employees and non-employee directors of CCA by the compensation committee of CCA’s Board of Directors. The options are granted with exercise prices equal to the fair market value on the date of grant. Vesting periods for options granted to employees generally range from three to four years. Options granted to non-employee directors vest on a date approximately following the first anniversary of the grant date. The term of such options is ten years from the date of grant.
In 2014 and 2013, CCA elected not to issue stock options to its non-employee directors, officers, and executive officers as it had in the past and instead elected to issue all of its equity compensation in the form of restricted common stock and RSUs as previously described herein. During 2014, 2013, and 2012, CCA expensed $1.9 million, $3.1 million, and $4.7 million, respectively, net of estimated forfeitures relating to its outstanding stock options, all of which was charged to general and administrative expenses.
Stock option transactions relating to CCA’s non-qualified stock option plans are summarized below (in thousands, except exercise prices):
| No. of options |
Weighted- Average Exercise Price of options |
Weighted- Average Remaining Contractual Term |
Aggregate Intrinsic Value |
|||||||||||||
| Outstanding at December 31, 2013 |
2,602 | $ | 19.31 | |||||||||||||
| Granted |
— | — | ||||||||||||||
| Exercised |
(712 | ) | 17.47 | |||||||||||||
| Cancelled |
(6 | ) | 22.34 | |||||||||||||
|
|
|
|
|
|||||||||||||
| Outstanding at December 31, 2014 |
1,884 | $ | 20.00 | 5.0 | $ | 30,792 | ||||||||||
|
|
|
|
|
|
|
|
|
|||||||||
| Exercisable at December 31, 2014 |
1,602 | $ | 19.58 | 4.6 | $ | 26,841 | ||||||||||
|
|
|
|
|
|
|
|
|
|||||||||
The aggregate intrinsic value in the table above represents the total pre-tax intrinsic value (the difference between CCA’s stock price as of December 31, 2014 and the exercise price, multiplied by the number of in-the-money options) that would have been received by the option holders had all option holders exercised their options on December 31, 2014. This amount changes based on the fair market value of CCA’s stock. The total intrinsic value of options exercised during the years ended December 31, 2014, 2013, and 2012 was $12.3 million, $36.9 million, and $5.5 million, respectively.
F-33
The weighted average fair value of options granted during 2012 was $7.50 per option based on the estimated fair value using the Black-Scholes option-pricing model. The fair value of the 2012 option grant was estimated on the date of the grant using the Black-Scholes option-pricing model with the following weighted average assumptions:
| 2012 | ||||
| Expected dividend yield |
3.0 | % | ||
| Expected stock price volatility |
42.2 | % | ||
| Risk-free interest rate |
1.0 | % | ||
| Expected life of options |
5 years | |||
CCA estimates expected stock price volatility based on actual historical changes in the market value of CCA’s stock. The risk-free interest rate is based on the U.S. Treasury yield with a term that is consistent with the expected life of the stock options. The expected life of stock options is based on CCA’s historical experience and is calculated separately for groups of employees that have similar historical exercise behavior.
Nonvested stock option transactions relating to CCA’s non-qualified stock option plans as of December 31, 2014 and changes during the year ended December 31, 2014 are summarized below (in thousands, except grant date fair values):
| Number of options |
Weighted average grant date fair value |
|||||||
| Nonvested at December 31, 2013 |
679 | $ | 6.88 | |||||
| Granted |
— | $ | — | |||||
| Cancelled |
— | $ | — | |||||
| Vested |
(397 | ) | $ | 7.04 | ||||
|
|
|
|||||||
| Nonvested at December 31, 2014 |
282 | $ | 6.66 | |||||
|
|
|
|||||||
As of December 31, 2014, CCA had $0.8 million of total unrecognized compensation cost related to stock options that is expected to be recognized over a remaining weighted-average period of 0.9 years.
At CCA’s 2011 annual meeting of stockholders held in May 2011, CCA’s stockholders approved an amendment to the 2008 Stock Incentive Plan that increased the authorized limit on issuance of new awards to an aggregate of up to 18.0 million shares. In addition, during the 2003 annual meeting the stockholders approved the adoption of CCA’s Non-Employee Directors’ Compensation Plan, authorizing CCA to issue up to 225,000 shares of common stock pursuant to the plan. As of December 31, 2014, CCA had 11.2 million shares available for issuance under the Amended and Restated 2008 Stock Incentive Plan and 0.2 million shares available for issuance under the Non-Employee Directors’ Compensation Plan.
| 14. | EARNINGS PER SHARE |
Basic earnings per share is computed by dividing net income by the weighted average number of common shares outstanding during the year. Diluted earnings per share reflects the potential dilution that could occur if securities or other contracts to issue common stock were exercised or converted into common stock or resulted in the issuance of common stock that then shared in the earnings of the entity. For CCA, diluted earnings per share is computed by dividing net income by the weighted average number of common shares after considering the additional dilution related to restricted share grants and stock options.
F-34
A reconciliation of the numerator and denominator of the basic earnings per share computation to the numerator and denominator of the diluted earnings per share computation is as follows (in thousands, except per share data):
| For the Years Ended December 31, | ||||||||||||
| 2014 | 2013 | 2012 | ||||||||||
| NUMERATOR |
||||||||||||
| Basic: |
||||||||||||
| Income from continuing operations |
$ | 195,022 | $ | 304,592 | $ | 156,966 | ||||||
| Loss from discontinued operations, net of taxes |
— | (3,757 | ) | (205 | ) | |||||||
|
|
|
|
|
|
|
|||||||
| Net income |
$ | 195,022 | $ | 300,835 | $ | 156,761 | ||||||
|
|
|
|
|
|
|
|||||||
| Diluted: |
||||||||||||
| Income from continuing operations |
$ | 195,022 | $ | 304,592 | $ | 156,966 | ||||||
| Loss from discontinued operations, net of taxes |
— | (3,757 | ) | (205 | ) | |||||||
|
|
|
|
|
|
|
|||||||
| Diluted net income |
$ | 195,022 | $ | 300,835 | $ | 156,761 | ||||||
|
|
|
|
|
|
|
|||||||
| DENOMINATOR |
||||||||||||
| Basic: |
||||||||||||
| Weighted average common shares outstanding |
116,109 | 109,617 | 99,545 | |||||||||
|
|
|
|
|
|
|
|||||||
| Diluted: |
||||||||||||
| Weighted average common shares outstanding |
116,109 | 109,617 | 99,545 | |||||||||
| Effect of dilutive securities: |
||||||||||||
| Stock options |
895 | 1,279 | 864 | |||||||||
| Restricted stock-based compensation |
308 | 354 | 214 | |||||||||
|
|
|
|
|
|
|
|||||||
| Weighted average shares and assumed conversions |
117,312 | 111,250 | 100,623 | |||||||||
|
|
|
|
|
|
|
|||||||
| BASIC EARNINGS PER SHARE: |
||||||||||||
| Income from continuing operations |
$ | 1.68 | $ | 2.77 | $ | 1.58 | ||||||
| Loss from discontinued operations, net of taxes |
— | (0.03 | ) | — | ||||||||
|
|
|
|
|
|
|
|||||||
| Net income |
$ | 1.68 | $ | 2.74 | $ | 1.58 | ||||||
|
|
|
|
|
|
|
|||||||
| DILUTED EARNINGS PER SHARE: |
||||||||||||
| Income from continuing operations |
$ | 1.66 | $ | 2.73 | $ | 1.56 | ||||||
| Loss from discontinued operations, net of taxes |
— | (0.03 | ) | — | ||||||||
|
|
|
|
|
|
|
|||||||
| Net income |
$ | 1.66 | $ | 2.70 | $ | 1.56 | ||||||
|
|
|
|
|
|
|
|||||||
As discussed in Note 13, on May 20, 2013, CCA paid a special dividend in connection with its conversion to a REIT. The shareholders were allowed to elect to receive their payment of the special dividend either in all cash, all shares of CCA common stock, or a combination of cash and CCA common stock, except that CCA placed a limit on the aggregate amount of cash payable to the shareholders. Under ASC 505, “Equity” and ASU 2010-01, “Accounting for Distributions to Shareholders with Components of Stock and Cash, a consensus of the FASB Emerging Issues Task Force”, a distribution that allows shareholders to elect to receive cash or stock with a potential limitation on the total amount of cash that all shareholders can elect to receive in the aggregate is considered a share issuance that is reflected in earnings per share prospectively. As such, the stock portion of the special dividend, totaling 13.9 million shares, is presented prospectively in basic and diluted earnings per share as presented above and was not presented retroactively for all periods presented.
Approximately 12,000, 15,000, and 0.7 million stock options were excluded from the computations of diluted earnings per share for the years ended December 31, 2014, 2013, and 2012, respectively, because they were anti-dilutive.
F-35
| 15. | COMMITMENTS AND CONTINGENCIES |
Legal Proceedings
General. The nature of CCA’s business results in claims and litigation alleging that it is liable for damages arising from the conduct of its employees, offenders or others. The nature of such claims includes, but is not limited to, claims arising from employee or offender misconduct, medical malpractice, employment matters, property loss, contractual claims, including claims regarding compliance with contract performance requirements, and personal injury or other damages resulting from contact with CCA’s facilities, personnel or offenders, including damages arising from an offender’s escape or from a disturbance at a facility. In February 2014, CCA reached an agreement to pay $1.0 million in compensation to the state of Idaho regarding contractual disputes related to staffing at the Idaho Correctional Center. In addition, CCA was notified that an investigation by the FBI was being undertaken and CCA received additional inquiries from other government partners concerning matters related to the Idaho Correctional Center. CCA maintains insurance to cover many of these claims, which may mitigate the risk that any single claim would have a material effect on CCA’s consolidated financial position, results of operations, or cash flows, provided the claim is one for which coverage is available. The combination of self-insured retentions and deductible amounts means that, in the aggregate, CCA is subject to substantial self-insurance risk.
CCA records litigation reserves related to certain matters for which it is probable that a loss has been incurred and the range of such loss can be estimated. Based upon management’s review of the potential claims and outstanding litigation and based upon management’s experience and history of estimating losses, and taking into consideration CCA’s self-insured retention amounts, management believes a loss in excess of amounts already recognized would not be material to CCA’s financial statements. In the opinion of management, there are no pending legal proceedings that would have a material effect on CCA’s consolidated financial position, results of operations, or cash flows. Any receivable for insurance recoveries is recorded separately from the corresponding litigation reserve, and only if recovery is determined to be probable. Adversarial proceedings and litigation are, however, subject to inherent uncertainties, and unfavorable decisions and rulings resulting from legal proceedings or from the investigation or inquiries described above, could occur which could have a material adverse impact on CCA’s consolidated financial position, results of operations, or cash flows for the period in which such decisions or rulings occur, or future periods. Expenses associated with legal proceedings may also fluctuate from quarter to quarter based on changes in CCA’s assumptions, new developments, or by the effectiveness of CCA’s litigation and settlement strategies.
Insurance Contingencies
Each of CCA’s management contracts and the statutes of certain states require the maintenance of insurance. CCA maintains various insurance policies including employee health, workers’ compensation, automobile liability, and general liability insurance. These policies are fixed premium policies with various deductible amounts that are self-funded by CCA. Reserves are provided for estimated incurred claims for which it is probable that a loss has been incurred and the range of such loss can be estimated.
Guarantees
Hardeman County Correctional Facilities Corporation (“HCCFC”) is a nonprofit, mutual benefit corporation organized under the Tennessee Nonprofit Corporation Act to purchase, construct, improve, equip, finance, own and manage a detention facility located in Hardeman County,
F-36
Tennessee. HCCFC was created as an instrumentality of Hardeman County to implement the County’s incarceration agreement with the state of Tennessee to house certain inmates.
During 1997, HCCFC issued $72.7 million of revenue bonds, which were primarily used for the construction of a 2,016-bed medium security correctional facility. In addition, HCCFC entered into a construction and management agreement with CCA in order to assure the timely and coordinated acquisition, construction, development, marketing and operation of the correctional facility.
HCCFC leases the correctional facility to Hardeman County in exchange for all revenue from the operation of the facility. HCCFC has, in turn, entered into a management agreement with CCA for the correctional facility.
In connection with the issuance of the revenue bonds, CCA is obligated, under a debt service deficit agreement, to pay the trustee of the bond’s trust indenture (the “Trustee”) amounts necessary to pay any debt service deficits consisting of principal and interest requirements (outstanding principal balance of $18.6 million at December 31, 2014 plus future interest payments). In the event the state of Tennessee, which is currently utilizing the facility to house certain inmates, exercises its option to purchase the correctional facility, CCA is also obligated to pay the difference between principal and interest owed on the bonds on the date set for the redemption of the bonds and amounts paid by the state of Tennessee for the facility plus all other funds on deposit with the Trustee and available for redemption of the bonds. Ownership of the facility reverts to the state of Tennessee in 2017 at no cost. Therefore, CCA does not currently believe the state of Tennessee will exercise its option to purchase the facility. At December 31, 2014, the outstanding principal balance of the bonds exceeded the purchase price option by $7.3 million.
Retirement Plan
All employees of CCA are eligible to participate in the Corrections Corporation of America 401(k) Savings and Retirement Plan (the “Plan”) upon reaching age 18 and completing one year of qualified service. Eligible employees may contribute up to 90% of their eligible compensation, subject to IRS limitations. For the years ended December 31, 2014, 2013, and 2012, CCA provided a discretionary matching contribution equal to 100% of the employee’s contributions up to 5% of the employee’s eligible compensation to employees with at least one thousand hours of employment in the plan year. Prior to January 1, 2012, employer contributions were made to those who were employed by CCA on the last day of the plan year, and investment earnings or losses thereon become vested 20% after two years of service, 40% after three years of service, 80% after four years of service, and 100% after five or more years of service. Effective January 1, 2012, the Plan adopted a safe harbor provision that provides, among other changes, future employer matching contributions to be paid into the Plan each pay period and vest immediately.
During the years ended December 31, 2014, 2013, and 2012, CCA’s discretionary contributions to the Plan, net of forfeitures, were $11.1 million, $11.8 million, and $11.1 million, respectively.
Deferred Compensation Plans
During 2002, the compensation committee of the board of directors approved CCA’s adoption of two non-qualified deferred compensation plans (the “Deferred Compensation Plans”) for non-employee directors and for certain senior executives. The Deferred Compensation Plans are unfunded plans maintained for the purpose of providing CCA’s directors and certain of its senior executives the opportunity to defer a portion of their compensation. Under the terms of the Deferred Compensation Plans, certain senior executives may elect to contribute on a pre-tax basis up to 50% of their base salary and up to 100% of their cash bonus, and non-employee directors may
F-37
elect to contribute on a pre-tax basis up to 100% of their director retainer and meeting fees. During the years ended December 31, 2014, 2013, and 2012, CCA matched 100% of employee contributions up to 5% of total cash compensation. CCA also contributes a fixed rate of return on balances in the Deferred Compensation Plans, determined at the beginning of each plan year. Vesting provisions for matching contributions and investment earnings thereon conform to the vesting provisions of CCA’s 401(k) Plan. However, CCA did not change the vesting provisions to conform with the 401(k) Plan effective January 1, 2012. Distributions are generally payable no earlier than five years subsequent to the date an individual becomes a participant in the Plan, or upon termination of employment (or the date a director ceases to serve as a director of CCA), at the election of the participant. Distributions to senior executives must commence on or before the later of 60 days after the participant’s separation from service or the fifteenth day of the month following the month the individual attains age 65.
During 2014, 2013, and 2012, CCA provided a fixed return of 5.6%, 5.6%, and 5.9% to participants in the Deferred Compensation Plans, respectively. CCA has purchased life insurance policies on the lives of certain employees of CCA, which are intended to fund distributions from the Deferred Compensation Plans. CCA is the sole beneficiary of such policies. At the inception of the Deferred Compensation Plans, CCA established an irrevocable Rabbi Trust to secure the plans’ obligations. However, assets in the Deferred Compensation Plans are subject to creditor claims in the event of bankruptcy. During 2014, 2013, and 2012, CCA recorded $0.2 million, $0.2 million, and $0.5 million, respectively, of matching contributions as general and administrative expense associated with the Deferred Compensation Plans. Assets in the Rabbi Trust were $17.9 million and $15.8 million as of December 31, 2014 and 2013, respectively. As of December 31, 2014 and 2013, CCA’s liability related to the Deferred Compensation Plans was $15.7 million and $16.4 million, respectively, which was reflected in accounts payable and accrued expenses and other liabilities in the accompanying balance sheets.
Employment and Severance Agreements
CCA currently has employment agreements with several of its executive officers, which provide for the payment of certain severance amounts upon termination of employment under certain circumstances or a change of control, as defined in the agreements.
| 16. | SEGMENT REPORTING |
As of December 31, 2014, CCA owned and managed 49 correctional and detention facilities, and managed 12 correctional and detention facilities it did not own. In addition, CCA owned three facilities that it leased to third-party operators. Management views CCA’s operating results in one operating segment. However, the Company has chosen to report financial performance segregated for (1) owned and managed correctional and detention facilities and (2) managed-only correctional and detention facilities as the Company believes this information is useful to users of the financial statements. Owned and managed facilities include the operating results of those facilities placed into service that were owned or controlled via a long-term lease and managed by CCA. Managed-only facilities include the operating results of those facilities owned by a third party and managed by CCA. The operating performance of the owned and managed and the managed-only correctional and detention facilities can be measured based on their net operating income. CCA defines facility net operating income as a facility’s operating income or loss from operations before interest, taxes, asset impairments, depreciation, and amortization.
F-38
The revenue and net operating income for the owned and managed and the managed-only facilities and a reconciliation to CCA’s operating income is as follows for the three years ended December 31, 2014, 2013, and 2012 (in thousands):
| For the Years Ended December 31, | ||||||||||||
| 2014 | 2013 | 2012 | ||||||||||
| Revenue: |
||||||||||||
| Owned and managed |
$ | 1,379,986 | $ | 1,386,355 | $ | 1,418,783 | ||||||
| Managed-only |
232,685 | 301,454 | 299,599 | |||||||||
|
|
|
|
|
|
|
|||||||
| Total management revenue |
1,612,671 | 1,687,809 | 1,718,382 | |||||||||
|
|
|
|
|
|
|
|||||||
| Operating expenses: |
||||||||||||
| Owned and managed |
928,857 | 941,638 | 935,680 | |||||||||
| Managed-only |
207,355 | 261,903 | 263,678 | |||||||||
|
|
|
|
|
|
|
|||||||
| Total operating expenses |
1,136,212 | 1,203,541 | 1,199,358 | |||||||||
|
|
|
|
|
|
|
|||||||
| Facility net operating income |
||||||||||||
| Owned and managed |
451,129 | 444,717 | 483,103 | |||||||||
| Managed-only |
25,330 | 39,551 | 35,921 | |||||||||
|
|
|
|
|
|
|
|||||||
| Total facility net operating income |
476,459 | 484,268 | 519,024 | |||||||||
|
|
|
|
|
|
|
|||||||
| Other revenue (expense): |
||||||||||||
| Rental and other revenue |
34,196 | 6,488 | 5,275 | |||||||||
| Other operating expense |
(19,923 | ) | (16,810 | ) | (17,693 | ) | ||||||
| General and administrative expense |
(106,429 | ) | (103,590 | ) | (88,935 | ) | ||||||
| Depreciation and amortization |
(113,925 | ) | (112,692 | ) | (113,063 | ) | ||||||
| Asset impairments |
(30,082 | ) | (6,513 | ) | — | |||||||
|
|
|
|
|
|
|
|||||||
| Operating income |
$ | 240,296 | $ | 251,151 | $ | 304,608 | ||||||
|
|
|
|
|
|
|
|||||||
The following table summarizes capital expenditures for the years ended December 31, 2014, 2013, and 2012 (in thousands):
| For the Years Ended December 31, | ||||||||||||
| 2014 | 2013 | 2012 | ||||||||||
| Capital expenditures: |
||||||||||||
| Owned and managed |
$ | 246,333 | $ | 96,975 | $ | 55,222 | ||||||
| Managed-only |
3,171 | 3,719 | 3,507 | |||||||||
| Corporate and other |
13,056 | 10,852 | 17,685 | |||||||||
| Discontinued operations |
— | 72 | 532 | |||||||||
|
|
|
|
|
|
|
|||||||
| Total capital expenditures |
$ | 262,560 | $ | 111,618 | $ | 76,946 | ||||||
|
|
|
|
|
|
|
|||||||
The total assets are as follows (in thousands):
| December 31, | ||||||||
| 2014 | 2013 | |||||||
| Assets: |
||||||||
| Owned and managed |
$ | 2,745,905 | $ | 2,715,719 | ||||
| Managed-only |
68,146 | 81,551 | ||||||
| Corporate and other |
313,140 | 210,140 | ||||||
| Discontinued operations |
— | 15 | ||||||
|
|
|
|
|
|||||
| Total assets |
$ | 3,127,191 | $ | 3,007,425 | ||||
|
|
|
|
|
|||||
F-39
| 17. | SUBSEQUENT EVENTS |
During February 2015, CCA issued approximately 0.4 million RSUs to certain of CCA’s employees and non-employee directors, with an aggregate value of $16.9 million. Unless earlier vested under the terms of the RSU agreement, approximately 0.3 million RSUs were issued to officers and executive officers and are subject to vesting over a three-year period based upon satisfaction of certain annual performance criteria for the fiscal years ending December 31, 2015, 2016, and 2017. Approximately 0.1 million RSUs issued to other employees “cliff” vest on the third anniversary of the award. Shares of RSUs issued to non-employee directors vest on the first anniversary of the award. Any RSUs that become vested will be settled in shares of CCA’s common stock.
On February 20, 2015, the Company’s Board of Directors declared a quarterly dividend of $0.54 per common share payable April 15, 2015 to shareholders of record on April 2, 2015.
| 18. | CONDENSED CONSOLIDATING FINANCIAL STATEMENTS OF CCA AND SUBSIDIARIES |
The following condensed consolidating financial statements of CCA and subsidiaries have been prepared pursuant to Rule 3-10 of Regulation S-X. These condensed consolidating financial statements have been prepared from the Company’s financial information on the same basis of accounting as the consolidated financial statements.
F-40
CONDENSED CONSOLIDATING BALANCE SHEET
As of December 31, 2014
(in thousands)
| ASSETS |
Parent | Combined Subsidiary Guarantors |
Consolidating Adjustments and Other |
Total Consolidated Amounts |
||||||||||||
| Cash and cash equivalents |
$ | 12,337 | $ | 62,056 | $ | — | $ | 74,393 | ||||||||
| Accounts receivable, net of allowance |
167,626 | 178,911 | (97,949 | ) | 248,588 | |||||||||||
| Current deferred tax assets |
— | 13,241 | (12 | ) | 13,229 | |||||||||||
| Prepaid expenses and other current assets |
17,060 | 34,705 | (21,990 | ) | 29,775 | |||||||||||
|
|
|
|
|
|
|
|
|
|||||||||
| Total current assets |
197,023 | 288,913 | (119,951 | ) | 365,985 | |||||||||||
| Property and equipment, net |
2,459,053 | 199,575 | — | 2,658,628 | ||||||||||||
| Restricted cash |
1,267 | 1,591 | — | 2,858 | ||||||||||||
| Investment in direct financing lease |
3,223 | — | — | 3,223 | ||||||||||||
| Goodwill |
— | 16,110 | — | 16,110 | ||||||||||||
| Non-current deferred tax assets |
— | 2,778 | (477 | ) | 2,301 | |||||||||||
| Other assets |
241,690 | 47,046 | (210,650 | ) | 78,086 | |||||||||||
|
|
|
|
|
|
|
|
|
|||||||||
| Total assets |
$ | 2,902,256 | $ | 556,013 | $ | (331,078 | ) | $ | 3,127,191 | |||||||
|
|
|
|
|
|
|
|
|
|||||||||
| LIABILITIES AND STOCKHOLDERS’ EQUITY |
||||||||||||||||
| Accounts payable and accrued expenses |
$ | 218,403 | $ | 205,213 | $ | (106,050 | ) | $ | 317,566 | |||||||
| Income taxes payable |
195 | 1,173 | — | 1,368 | ||||||||||||
| Current deferred tax liabilities |
13 | — | (13 | ) | — | |||||||||||
| Note payable to an affiliate |
— | 13,854 | (13,854 | ) | — | |||||||||||
| Current liabilities of discontinued operations |
— | 54 | — | 54 | ||||||||||||
|
|
|
|
|
|
|
|
|
|||||||||
| Total current liabilities |
218,611 | 220,294 | (119,917 | ) | 318,988 | |||||||||||
| Long-term debt |
1,200,000 | 115,000 | (115,000 | ) | 1,200,000 | |||||||||||
| Non-current deferred tax liabilities |
477 | — | (477 | ) | — | |||||||||||
| Other liabilities |
1,668 | 125,035 | — | 126,703 | ||||||||||||
|
|
|
|
|
|
|
|
|
|||||||||
| Total liabilities |
1,420,756 | 460,329 | (235,394 | ) | 1,645,691 | |||||||||||
|
|
|
|
|
|
|
|
|
|||||||||
| Total stockholders’ equity |
1,481,500 | 95,684 | (95,684 | ) | 1,481,500 | |||||||||||
|
|
|
|
|
|
|
|
|
|||||||||
| Total liabilities and stockholders’ equity |
$ | 2,902,256 | $ | 556,013 | $ | (331,078 | ) | $ | 3,127,191 | |||||||
|
|
|
|
|
|
|
|
|
|||||||||
F-41
CONDENSED CONSOLIDATING BALANCE SHEET
As of December 31, 2013
(in thousands)
| ASSETS |
Parent | Combined Subsidiary Guarantors |
Consolidating Adjustments and Other |
Total Consolidated Amounts |
||||||||||||
| Cash and cash equivalents |
$ | 31,647 | $ | 46,262 | $ | — | $ | 77,909 | ||||||||
| Accounts receivable, net of allowance |
203,018 | 178,894 | (136,955 | ) | 244,957 | |||||||||||
| Current deferred tax assets |
2 | 9,239 | — | 9,241 | ||||||||||||
| Prepaid expenses and other current assets |
7,580 | 22,856 | (9,824 | ) | 20,612 | |||||||||||
| Current assets of discontinued operations |
— | 15 | — | 15 | ||||||||||||
|
|
|
|
|
|
|
|
|
|||||||||
| Total current assets |
242,247 | 257,266 | (146,779 | ) | 352,734 | |||||||||||
| Property and equipment, net |
2,450,028 | 96,585 | — | 2,546,613 | ||||||||||||
| Restricted cash |
1,016 | 4,573 | — | 5,589 | ||||||||||||
| Investment in direct financing lease |
5,473 | — | — | 5,473 | ||||||||||||
| Goodwill |
— | 16,110 | — | 16,110 | ||||||||||||
| Non-current deferred tax assets |
— | 3,633 | (555 | ) | 3,078 | |||||||||||
| Other assets |
245,028 | 45,149 | (212,349 | ) | 77,828 | |||||||||||
|
|
|
|
|
|
|
|
|
|||||||||
| Total assets |
$ | 2,943,792 | $ | 423,316 | $ | (359,683 | ) | $ | 3,007,425 | |||||||
|
|
|
|
|
|
|
|
|
|||||||||
| LIABILITIES AND STOCKHOLDERS’ EQUITY |
||||||||||||||||
| Accounts payable and accrued expenses |
$ | 234,277 | $ | 164,745 | $ | (146,745 | ) | $ | 252,277 | |||||||
| Income taxes payable |
— | 1,243 | — | 1,243 | ||||||||||||
| Current liabilities of discontinued operations |
— | 886 | — | 886 | ||||||||||||
|
|
|
|
|
|
|
|
|
|||||||||
| Total current liabilities |
234,277 | 166,874 | (146,745 | ) | 254,406 | |||||||||||
| Long-term debt |
1,205,000 | 115,000 | (115,000 | ) | 1,205,000 | |||||||||||
| Non-current deferred tax liabilities |
555 | — | (555 | ) | — | |||||||||||
| Other liabilities |
1,453 | 44,059 | — | 45,512 | ||||||||||||
|
|
|
|
|
|
|
|
|
|||||||||
| Total liabilities |
1,441,285 | 325,933 | (262,300 | ) | 1,504,918 | |||||||||||
|
|
|
|
|
|
|
|
|
|||||||||
| Total stockholders’ equity |
1,502,507 | 97,383 | (97,383 | ) | 1,502,507 | |||||||||||
|
|
|
|
|
|
|
|
|
|||||||||
| Total liabilities and stockholders’ equity |
$ | 2,943,792 | $ | 423,316 | $ | (359,683 | ) | $ | 3,007,425 | |||||||
|
|
|
|
|
|
|
|
|
|||||||||
F-42
CONDENSED CONSOLIDATING STATEMENT OF OPERATIONS
For the year ended December 31, 2014
(in thousands)
| Parent | Combined Subsidiary Guarantors |
Consolidating Adjustments and Other |
Total Consolidated Amounts |
|||||||||||||
| REVENUES |
$ | 1,250,199 | $ | 1,268,654 | $ | (871,986 | ) | $ | 1,646,867 | |||||||
|
|
|
|
|
|
|
|
|
|||||||||
| EXPENSES: |
||||||||||||||||
| Operating |
896,470 | 1,131,651 | (871,986 | ) | 1,156,135 | |||||||||||
| General and administrative |
33,508 | 72,921 | — | 106,429 | ||||||||||||
| Depreciation and amortization |
80,820 | 33,105 | — | 113,925 | ||||||||||||
| Asset impairments |
29,915 | 167 | — | 30,082 | ||||||||||||
|
|
|
|
|
|
|
|
|
|||||||||
| 1,040,713 | 1,237,844 | (871,986 | ) | 1,406,571 | ||||||||||||
|
|
|
|
|
|
|
|
|
|||||||||
| OPERATING INCOME |
209,486 | 30,810 | — | 240,296 | ||||||||||||
|
|
|
|
|
|
|
|
|
|||||||||
| OTHER (INCOME) EXPENSE: |
||||||||||||||||
| Interest expense, net |
35,138 | 4,397 | — | 39,535 | ||||||||||||
| Other (income) expense |
302 | (786 | ) | (720 | ) | (1,204 | ) | |||||||||
|
|
|
|
|
|
|
|
|
|||||||||
| 35,440 | 3,611 | (720 | ) | 38,331 | ||||||||||||
|
|
|
|
|
|
|
|
|
|||||||||
| INCOME FROM CONTINUING OPERATIONS BEFORE INCOME TAXES |
174,046 | 27,199 | 720 | 201,965 | ||||||||||||
| Income tax expense |
(552 | ) | (6,391 | ) | — | (6,943 | ) | |||||||||
|
|
|
|
|
|
|
|
|
|||||||||
| INCOME FROM CONTINUING OPERATIONS |
173,494 | 20,808 | 720 | 195,022 | ||||||||||||
| Income from equity in subsidiaries |
21,528 | — | (21,528 | ) | — | |||||||||||
|
|
|
|
|
|
|
|
|
|||||||||
| NET INCOME |
$ | 195,022 | $ | 20,808 | $ | (20,808 | ) | $ | 195,022 | |||||||
|
|
|
|
|
|
|
|
|
|||||||||
F-43
CONDENSED CONSOLIDATING STATEMENT OF OPERATIONS
For the year ended December 31, 2013
(in thousands)
| Parent | Combined Subsidiary Guarantors |
Consolidating Adjustments and Other |
Total Consolidated Amounts |
|||||||||||||
| REVENUES |
$ | 1,268,763 | $ | 1,351,695 | $ | (926,161 | ) | $ | 1,694,297 | |||||||
|
|
|
|
|
|
|
|
|
|||||||||
| EXPENSES: |
||||||||||||||||
| Operating |
945,750 | 1,200,762 | (926,161 | ) | 1,220,351 | |||||||||||
| General and administrative |
31,290 | 72,300 | — | 103,590 | ||||||||||||
| Depreciation and amortization |
76,112 | 36,580 | — | 112,692 | ||||||||||||
| Asset impairments |
— | 6,513 | — | 6,513 | ||||||||||||
|
|
|
|
|
|
|
|
|
|||||||||
| 1,053,152 | 1,316,155 | (926,161 | ) | 1,443,146 | ||||||||||||
|
|
|
|
|
|
|
|
|
|||||||||
| OPERATING INCOME |
215,611 | 35,540 | — | 251,151 | ||||||||||||
|
|
|
|
|
|
|
|
|
|||||||||
| OTHER (INCOME) EXPENSE: |
||||||||||||||||
| Interest expense, net |
38,319 | 6,807 | — | 45,126 | ||||||||||||
| Expenses associated with debt refinancing transactions |
28,563 | 7,965 | — | 36,528 | ||||||||||||
| Other (income) expense |
(45 | ) | 23 | (78 | ) | (100 | ) | |||||||||
|
|
|
|
|
|
|
|
|
|||||||||
| 66,837 | 14,795 | (78 | ) | 81,554 | ||||||||||||
|
|
|
|
|
|
|
|
|
|||||||||
| INCOME FROM CONTINUING OPERATIONS BEFORE INCOME TAXES |
148,774 | 20,745 | 78 | 169,597 | ||||||||||||
| Income tax benefit (expense) |
143,590 | (8,595 | ) | — | 134,995 | |||||||||||
|
|
|
|
|
|
|
|
|
|||||||||
| INCOME FROM CONTINUING OPERATIONS |
292,364 | 12,150 | 78 | 304,592 | ||||||||||||
| Income from equity in subsidiaries |
8,471 | — | (8,471 | ) | — | |||||||||||
| Loss from discontinued operations, net of taxes |
— | (3,757 | ) | — | (3,757 | ) | ||||||||||
|
|
|
|
|
|
|
|
|
|||||||||
| NET INCOME |
$ | 300,835 | $ | 8,393 | $ | (8,393 | ) | $ | 300,835 | |||||||
|
|
|
|
|
|
|
|
|
|||||||||
F-44
CONDENSED CONSOLIDATING STATEMENT OF OPERATIONS
For the year ended December 31, 2012
(in thousands)
| Parent | Combined Subsidiary Guarantors |
Consolidating Adjustments and Other |
Total Consolidated Amounts |
|||||||||||||
| REVENUES |
$ | 1,411,277 | $ | 329,971 | $ | (17,591 | ) | $ | 1,723,657 | |||||||
|
|
|
|
|
|
|
|
|
|||||||||
| EXPENSES: |
||||||||||||||||
| Operating |
943,803 | 290,839 | (17,591 | ) | 1,217,051 | |||||||||||
| General and administrative |
70,792 | 18,143 | — | 88,935 | ||||||||||||
| Depreciation and amortization |
74,452 | 38,611 | — | 113,063 | ||||||||||||
|
|
|
|
|
|
|
|
|
|||||||||
| 1,089,047 | 347,593 | (17,591 | ) | 1,419,049 | ||||||||||||
|
|
|
|
|
|
|
|
|
|||||||||
| OPERATING INCOME (LOSS) |
322,230 | (17,622 | ) | — | 304,608 | |||||||||||
|
|
|
|
|
|
|
|
|
|||||||||
| OTHER (INCOME) EXPENSE: |
||||||||||||||||
| Interest expense, net |
57,174 | 1,189 | — | 58,363 | ||||||||||||
| Expenses associated with debt refinancing transactions |
2,099 | — | — | 2,099 | ||||||||||||
| Other (income) expense |
16 | (26 | ) | (323 | ) | (333 | ) | |||||||||
|
|
|
|
|
|
|
|
|
|||||||||
| 59,289 | 1,163 | (323 | ) | 60,129 | ||||||||||||
|
|
|
|
|
|
|
|
|
|||||||||
| INCOME (LOSS) FROM CONTINUING OPERATIONS BEFORE INCOME TAXES |
262,941 | (18,785 | ) | 323 | 244,479 | |||||||||||
| Income tax benefit (expense) |
(93,870 | ) | 6,357 | — | (87,513 | ) | ||||||||||
|
|
|
|
|
|
|
|
|
|||||||||
| INCOME (LOSS) FROM CONTINUING OPERATIONS |
169,071 | (12,428 | ) | 323 | 156,966 | |||||||||||
| Loss from equity in subsidiaries |
(12,310 | ) | — | 12,310 | — | |||||||||||
| Loss from discontinued operations, net of taxes |
— | (205 | ) | — | (205 | ) | ||||||||||
|
|
|
|
|
|
|
|
|
|||||||||
| NET INCOME (LOSS) |
$ | 156,761 | $ | (12,633 | ) | $ | 12,633 | $ | 156,761 | |||||||
|
|
|
|
|
|
|
|
|
|||||||||
F-45
CONDENSED CONSOLIDATING STATEMENT OF CASH FLOWS
For the year ended December 31, 2014
(in thousands)
| Parent | Combined Subsidiary Guarantors |
Consolidating Adjustments And Other |
Total Consolidated Amounts |
|||||||||||||
| Net cash provided by operating activities |
$ | 296,087 | $ | 127,494 | $ | — | $ | 423,581 | ||||||||
| Net cash used in investing activities |
(73,404 | ) | (102,337 | ) | (21,146 | ) | (196,887 | ) | ||||||||
| Net cash used in financing activities |
(241,993 | ) | (9,373 | ) | 21,146 | (230,220 | ) | |||||||||
|
|
|
|
|
|
|
|
|
|||||||||
| Net (decrease) increase in cash and cash equivalents |
(19,310 | ) | 15,784 | — | (3,526 | ) | ||||||||||
| CASH AND CASH EQUIVALENTS, beginning of year |
31,647 | 46,272 | — | 77,919 | ||||||||||||
|
|
|
|
|
|
|
|
|
|||||||||
| CASH AND CASH EQUIVALENTS, end of year |
$ | 12,337 | $ | 62,056 | $ | — | $ | 74,393 | ||||||||
|
|
|
|
|
|
|
|
|
|||||||||
CONDENSED CONSOLIDATING STATEMENT OF CASH FLOWS
For the year ended December 31, 2013
(in thousands)
| Parent | Combined Subsidiary Guarantors |
Consolidating Adjustments And Other |
Total Consolidated Amounts |
|||||||||||||
| Net cash provided by operating activities |
$ | 211,247 | $ | 158,257 | $ | — | $ | 369,504 | ||||||||
| Net cash used in investing activities |
(83,895 | ) | (56,617 | ) | 15,000 | (125,512 | ) | |||||||||
| Net cash used in financing activities |
(95,705 | ) | (118,265 | ) | (15,000 | ) | (228,970 | ) | ||||||||
|
|
|
|
|
|
|
|
|
|||||||||
| Net increase (decrease) in cash and cash equivalents |
31,647 | (16,625 | ) | — | 15,022 | |||||||||||
| CASH AND CASH EQUIVALENTS, beginning of year |
— | 62,897 | — | 62,897 | ||||||||||||
|
|
|
|
|
|
|
|
|
|||||||||
| CASH AND CASH EQUIVALENTS, end of year |
$ | 31,647 | $ | 46,272 | $ | — | $ | 77,919 | ||||||||
|
|
|
|
|
|
|
|
|
|||||||||
CONDENSED CONSOLIDATING STATEMENT OF CASH FLOWS
For the year ended December 31, 2012
(in thousands)
| Parent | Combined Subsidiary Guarantors |
Consolidating Adjustments And Other |
Total Consolidated Amounts |
|||||||||||||
| Net cash provided by operating activities |
$ | 260,602 | $ | 22,654 | $ | — | $ | 283,256 | ||||||||
| Net cash used in investing activities |
(42,378 | ) | (37,542 | ) | — | (79,920 | ) | |||||||||
| Net cash used in financing activities |
(218,224 | ) | 21,953 | — | (196,271 | ) | ||||||||||
|
|
|
|
|
|
|
|
|
|||||||||
| Net increase in cash and cash equivalents |
— | 7,065 | — | 7,065 | ||||||||||||
| CASH AND CASH EQUIVALENTS, beginning of year |
— | 55,832 | — | 55,832 | ||||||||||||
|
|
|
|
|
|
|
|
|
|||||||||
| CASH AND CASH EQUIVALENTS, end of year |
$ | — | $ | 62,897 | $ | — | $ | 62,897 | ||||||||
|
|
|
|
|
|
|
|
|
|||||||||
F-46
| 19. | SELECTED QUARTERLY FINANCIAL INFORMATION (UNAUDITED) |
Selected quarterly financial information for each of the quarters in the years ended December 31, 2014 and 2013 is as follows (in thousands, except per share data):
| March 31, 2014 |
June 30, 2014 |
September 30, 2014 |
December 31, 2014 |
|||||||||||||
| Revenue |
$ | 404,222 | $ | 410,694 | $ | 408,474 | $ | 423,477 | ||||||||
| Operating income |
63,066 | 65,535 | 69,850 | 41,845 | (1) | |||||||||||
| Net income |
51,738 | 55,732 | 57,546 | 30,006 | (1) | |||||||||||
| Basic earnings per share: |
||||||||||||||||
| Net income |
$ | 0.45 | $ | 0.48 | $ | 0.50 | $ | 0.26 | (1) | |||||||
| Diluted earnings per share: |
||||||||||||||||
| Net income |
$ | 0.44 | $ | 0.48 | $ | 0.49 | $ | 0.25 | (1) | |||||||
| March 31, 2013 |
June 30, 2013 |
September 30, 2013 |
December 31, 2013 |
|||||||||||||
| Revenue |
$ | 416,723 | $ | 425,005 | $ | 421,466 | $ | 431,103 | ||||||||
| Operating income |
59,892 | 67,969 | 67,271 | 56,019 | ||||||||||||
| Loss from discontinued operations, net of taxes |
(355 | ) | (2,739 | ) | (663 | ) | — | |||||||||
| Net income |
181,092 | (2) | 20,429 | (3) | 51,843 | 47,471 | ||||||||||
| Basic earnings per share: |
||||||||||||||||
| Net income |
$ | 1.81 | (2) | $ | 0.19 | (3) | $ | 0.45 | $ | 0.41 | ||||||
| Diluted earnings per share: |
||||||||||||||||
| Net income |
$ | 1.78 | (2) | $ | 0.19 | (3) | $ | 0.44 | $ | 0.41 | ||||||
| (1) | The earnings amounts in the fourth quarter of 2014 were unfavorably impacted by $27.8 million of non-cash impairments recorded to write down the book values of two of CCA’s non-core facilities to the estimated fair values, as discussed in Note 5. |
| (2) | The earnings amounts in the first quarter of 2013 were favorably impacted by the net tax benefit resulting from the revaluation of certain deferred tax assets and liabilities associated with the REIT conversion effective January 1, 2013. |
| (3) | The earnings amounts in the second quarter of 2013 were negatively impacted by $36.3 million of expenses associated with debt refinancing transactions. |
F-47
CORRECTIONS CORPORATION OF AMERICA AND SUBSIDIARIES
SCHEDULE III – REAL ESTATE ASSETS AND ACCUMULATED DEPRECIATION
DECEMBER 31, 2014
(in thousands)
| Description |
Location | Initial Cost to Company | Cost Capitalized Subsequent to Acquisition |
Gross Amount at Which Carried at Close of Period | Accumulated Depreciation (A) |
Date Constructed/ Acquired |
||||||||||||||||||||||||||||
| Land | Buildings and Improvements |
Land and Land Improvements |
Buildings and Leasehold Improvements |
Total | ||||||||||||||||||||||||||||||
| Adams County Correctional Center |
Adams County, Mississippi |
$ | 874 | $ | 119,565 | $ | 2,783 | $ | 1,075 | $ | 122,147 | $ | 123,222 | $ | (15,038 | ) | 2008 | |||||||||||||||||
| Bent County Correctional Facility |
Las Animas, Colorado |
550 | 13,115 | 66,495 | 1,212 | 78,948 | 80,160 | (18,267 | ) | 1992 | ||||||||||||||||||||||||
| Bridgeport Pre-Parole Transfer Facility |
Bridgeport, Texas |
70 | 291 | 588 | 209 | 740 | 949 | (473 | ) | 1995 | ||||||||||||||||||||||||
| CAI – Boston Avenue |
San Diego, California |
800 | 11,440 | 25 | 830 | 11,435 | 12,265 | (548 | ) | 2013 | ||||||||||||||||||||||||
| California City Correctional Center |
California City, California |
1,785 | 125,337 | 4,357 | 2,484 | 128,995 | 131,479 | (39,548 | ) | 1999 | ||||||||||||||||||||||||
| Central Arizona Detention Center |
Florence, Arizona |
1,298 | 57,857 | 30,571 | 2,767 | 86,959 | 89,726 | (28,569 | ) | 1994 | ||||||||||||||||||||||||
| Cibola County Corrections Center |
Milan, New Mexico |
444 | 16,215 | 29,130 | 1,319 | 44,470 | 45,789 | (14,953 | ) | 1994 | ||||||||||||||||||||||||
| Cimarron Correctional Facility |
Cushing, Oklahoma |
250 | 71,303 | 42,349 | 570 | 113,332 | 113,902 | (28,887 | ) | 1997 | ||||||||||||||||||||||||
| Coffee Correctional Facility |
Nicholls, Georgia |
194 | 28,361 | 44,911 | 853 | 72,613 | 73,466 | (17,302 | ) | 1998 | ||||||||||||||||||||||||
| Crossroads Correctional Center |
Shelby, Montana |
413 | 33,196 | 6,700 | 867 | 39,442 | 40,309 | (27,785 | ) | 1999 | ||||||||||||||||||||||||
| Crowley County Correctional Facility |
Olney Springs, Colorado |
211 | 46,845 | 27,133 | 1,890 | 72,299 | 74,189 | (17,856 | ) | 2003 | ||||||||||||||||||||||||
| Davis Correctional Facility |
Holdenville, Oklahoma |
250 | 66,701 | 40,096 | 872 | 106,175 | 107,047 | (27,380 | ) | 1996 | ||||||||||||||||||||||||
| D.C. Correctional Treatment Facility |
Washington, D.C. |
— | — | 5,998 | 71 | 5,927 | 5,998 | (3,777 | ) | 1997 | ||||||||||||||||||||||||
| Diamondback Correctional Facility |
Watonga, Oklahoma |
208 | 41,677 | 22,544 | 567 | 63,862 | 64,429 | (19,949 | ) | 1998 | ||||||||||||||||||||||||
| Eden Detention Facility |
Eden, Texas | 925 | 27,645 | 33,050 | 5,279 | 56,341 | 61,620 | (17,707 | ) | 1995 | ||||||||||||||||||||||||
| Eloy Detention Center |
Eloy, Arizona | 498 | 33,308 | 14,047 | 1,851 | 46,002 | 47,853 | (14,703 | ) | 1995 | ||||||||||||||||||||||||
| Florence County Detention Center |
Florence, Arizona |
— | 75,674 | 9,022 | 719 | 83,977 | 84,696 | (25,169 | ) | 1999 | ||||||||||||||||||||||||
| Houston Processing Center |
Houston, Texas | 2,250 | 53,373 | 36,625 | 3,143 | 89,105 | 92,248 | (26,921 | ) | 1984 | ||||||||||||||||||||||||
| Huerfano County Correctional Center |
Walsenburg, Colorado |
124 | 26,358 | 4,095 | 984 | 29,593 | 30,577 | (11,544 | ) | 1997 | ||||||||||||||||||||||||
| Jenkins County Correctional Center |
Millen, Georgia |
208 | 48,158 | 37 | 237 | 48,166 | 48,403 | (2,738 | ) | 2012 | ||||||||||||||||||||||||
| Kit Carson Correctional Center |
Burlington, Colorado |
432 | 35,980 | 42,563 | 863 | 78,112 | 78,975 | (17,602 | ) | 1998 | ||||||||||||||||||||||||
| Lake Erie Correctional Institution |
Conneaut, Ohio |
2,871 | 69,779 | 2,166 | 3,669 | 71,147 | 74,816 | (4,370 | ) | 2011 | ||||||||||||||||||||||||
| La Palma Correctional Center |
Eloy, Arizona |
283 | 183,155 | 11,974 | 470 | 194,942 | 195,412 | (26,757 | ) | 2008 | ||||||||||||||||||||||||
| Laredo Processing Center |
Laredo, Texas | 788 | 26,737 | 1,968 | 929 | 28,564 | 29,493 | (9,647 | ) | 1985 | ||||||||||||||||||||||||
| Leavenworth U.S.M. Detention Center |
Leavenworth, Kansas |
130 | 44,970 | 42,167 | 464 | 86,803 | 87,267 | (23,115 | ) | 1992 | ||||||||||||||||||||||||
| Lee Adjustment Center |
Beattyville, Kentucky |
500 | 515 | 16,087 | 1,214 | 15,888 | 17,102 | (5,736 | ) | 1998 | ||||||||||||||||||||||||
| Leo Chesney Correctional Center |
Live Oak, California |
250 | 4,774 | 1,577 | 250 | 6,351 | 6,601 | (2,418 | ) | 1989 | ||||||||||||||||||||||||
| Marion Adjustment Center |
St. Mary, Kentucky |
250 | 9,994 | 8,277 | 915 | 17,606 | 18,521 | (5,543 | ) | 1998 | ||||||||||||||||||||||||
F-48
| Description |
Location | Initial Cost to Company | Cost Capitalized Subsequent to Acquisition |
Gross Amount at Which Carried at Close of Period | Accumulated Depreciation (A) |
Date Constructed/ Acquired |
||||||||||||||||||||||||||||
| Land | Buildings and Improvements |
Land and Land Improvements |
Buildings and Leasehold Improvements |
Total | ||||||||||||||||||||||||||||||
| McRae County Georgia Prison |
McRae, Georgia |
462 | 60,396 | 17,295 | 954 | 77,199 | 78,153 | (15,956 | ) | 2000 | ||||||||||||||||||||||||
| Mineral Wells Pre-Parole Transfer Facility |
Mineral Wells, Texas |
176 | 22,589 | 4,877 | 100 | — | 100 | (B) | — | 1995 | ||||||||||||||||||||||||
| Nevada Southern Detention Center |
Pahrump, Nevada |
7,548 | 64,362 | 9,238 | 8,330 | 72,818 | 81,148 | (7,485 | ) | 2010 | ||||||||||||||||||||||||
| New Mexico Women’s Correctional Facility |
Grants, New Mexico |
142 | 15,888 | 13,770 | 807 | 28,993 | 29,800 | (10,638 | ) | 1989 | ||||||||||||||||||||||||
| North Fork Correctional Facility |
Sayre, Oklahoma |
— | 42,166 | 58,453 | 291 | 100,328 | 100,619 | (24,076 | ) | 1998 | ||||||||||||||||||||||||
| Northeast Ohio Correctional Center |
Youngstown, Ohio |
750 | 39,583 | 7,803 | 1,675 | 46,461 | 48,136 | (15,613 | ) | 1997 | ||||||||||||||||||||||||
| Otter Creek Adjustment Center |
Wheelwright, Kentucky |
500 | 24,487 | 11,319 | 1,447 | 34,859 | 36,306 | (12,217 | ) | 1998 | ||||||||||||||||||||||||
| Prairie Correctional Facility |
Appleton, Minnesota |
100 | 22,306 | 8,307 | 1,065 | 29,648 | 30,713 | (11,966 | ) | 1991 | ||||||||||||||||||||||||
| Queensgate Correctional Facility |
Cincinnati, Ohio |
750 | 15,221 | 1,586 | 340 | 498 | 838 | (B) | — | 1998 | ||||||||||||||||||||||||
| Red Rock Correctional Center |
Eloy, Arizona |
10 | 78,456 | 20,106 | 255 | 98,317 | 98,572 | (16,447 | ) | 2006 | ||||||||||||||||||||||||
| Saguaro Correctional Center |
Eloy, Arizona |
193 | 98,903 | 316 | 385 | 99,027 | 99,412 | (15,174 | ) | 2007 | ||||||||||||||||||||||||
| San Diego Correctional Facility |
San Diego, California |
28,845 | 92,458 | 10,325 | 37,148 | 94,480 | 131,628 | (89,758 | ) | 1999 | ||||||||||||||||||||||||
| Shelby Training Center |
Memphis, Tennessee |
150 | 6,393 | 3,076 | 275 | 9,344 | 9,619 | (9,263 | ) | 1986 | ||||||||||||||||||||||||
| Stewart Detention Center |
Lumpkin, Georgia |
143 | 70,560 | 9,192 | 716 | 79,179 | 79,895 | (15,177 | ) | 2004 | ||||||||||||||||||||||||
| Tallahatchie County Correctional Facility |
Tutwiler, Mississippi |
— | 44,638 | 94,046 | 1,536 | 137,148 | 138,684 | (34,949 | ) | 2000 | ||||||||||||||||||||||||
| T. Don Hutto Correctional Center |
Taylor, Texas |
183 | 13,418 | 4,018 | 591 | 17,028 | 17,619 | (6,118 | ) | 1997 | ||||||||||||||||||||||||
| Torrance County Detention Facility |
Estancia, New Mexico |
511 | 52,599 | 7,392 | 1,704 | 58,798 | 60,502 | (19,667 | ) | 1990 | ||||||||||||||||||||||||
| Webb County Detention Center |
Laredo, Texas |
498 | 20,160 | 5,792 | 2,101 | 24,349 | 26,450 | (8,570 | ) | 1998 | ||||||||||||||||||||||||
| West Tennessee Detention Facility |
Mason, Tennessee |
538 | 31,931 | 5,605 | 2,008 | 36,066 | 38,074 | (13,405 | ) | 1990 | ||||||||||||||||||||||||
| Wheeler Correctional Facility |
Alamo, Georgia |
117 | 30,781 | 41,426 | 423 | 71,901 | 72,324 | (17,155 | ) | 1998 | ||||||||||||||||||||||||
| Whiteville Correctional Facility |
Whiteville, Tennessee |
303 | 51,694 | 3,991 | 1,571 | 54,417 | 55,988 | (18,044 | ) | 1998 | ||||||||||||||||||||||||
| Totals |
$ | 58,775 | $ | 2,171,312 | $ | 885,268 | $ | 100,295 | $ | 2,970,799 | $ | 3,071,094 | $ | (815,980 | ) | |||||||||||||||||||
|
|
|
|
|
|
|
|
|
|
|
|
|
|
|
|||||||||||||||||||||
NOTES TO SCHEDULE III—REAL ESTATE AND ACCUMULATED DEPRECIATION
| (A) | Depreciation is calculated using estimated useful lives of depreciable assets up to 50 years for prison facilities. |
| (B) | CCA recorded non-cash impairments during the fourth quarter of 2014 to write down the book values of the Queensgate and Mineral Wells facilities to the estimated fair values assuming asset sales for uses other than correctional facilities. |
F-49
CORRECTIONS CORPORATION OF AMERICA AND SUBSIDIARIES
SCHEDULE III – REAL ESTATE ASSETS AND ACCUMULATED DEPRECIATION
FOR THE YEARS ENDED DECEMBER 31, 2014, 2013, AND 2012
(in thousands)
| For the Years Ended December 31, | ||||||||||||
| 2014 | 2013 | 2012 | ||||||||||
| Investment in Real Estate: |
||||||||||||
| Balance at beginning of period |
$ | 3,078,902 | $ | 3,049,672 | $ | 2,972,528 | ||||||
| Additions through capital expenditures |
45,929 | 30,376 | 77,233 | |||||||||
| Sale of real estate for cash |
(4,368 | ) | (554 | ) | (81 | ) | ||||||
| Asset impairments |
(49,247 | ) | — | — | ||||||||
| Reclassifications and other |
(122 | ) | (592 | ) | (8 | ) | ||||||
|
|
|
|
|
|
|
|||||||
| Balance at end of period |
$ | 3,071,094 | $ | 3,078,902 | $ | 3,049,672 | ||||||
|
|
|
|
|
|
|
|||||||
| Accumulated Depreciation: |
||||||||||||
| Balance at beginning of period |
$ | (755,761 | ) | $ | (680,965 | ) | $ | (607,771 | ) | |||
| Depreciation |
(79,745 | ) | (75,069 | ) | (73,260 | ) | ||||||
| Disposals |
118 | 273 | 66 | |||||||||
| Asset impairments |
19,408 | — | — | |||||||||
|
|
|
|
|
|
|
|||||||
| Balance at end of period |
$ | (815,980 | ) | $ | (755,761 | ) | $ | (680,965 | ) | |||
|
|
|
|
|
|
|
|||||||
F-50
Pursuant to the requirements of the Securities Exchange Act of 1934, the registrant has duly caused this Annual Report to be signed on its behalf by the undersigned, thereunto duly authorized.
| CORRECTIONS CORPORATION OF AMERICA | ||||||
| Date: February 25, 2015 | By: | /s/ Damon T. Hininger | ||||
| Damon T. Hininger, President and Chief Executive Officer | ||||||
Pursuant to the requirements of the Securities Exchange Act of 1934, this Annual Report has been signed by the following persons on behalf of the registrant and in the capabilities and on the dates indicated.
| /s/ Damon T. Hininger |
February 25, 2015 | |||
| Damon T. Hininger, President and Chief Executive Officer (Principal Executive Officer and Director) |
||||
| /s/ David M. Garfinkle |
February 25, 2015 | |||
| David M. Garfinkle, Executive Vice President and Chief Financial Officer (Principal Financial and Accounting Officer) |
||||
| /s/ John D. Ferguson |
February 25, 2015 | |||
| John D. Ferguson, Chairman of the Board of Directors | ||||
| /s/ Donna M. Alvarado |
February 25, 2015 | |||
| Donna M. Alvarado, Director | ||||
| /s/ John D. Correnti |
February 25, 2015 | |||
| John D. Correnti, Director | ||||
| /s/ Robert J. Dennis |
February 25, 2015 | |||
| Robert J. Dennis, Director | ||||
| /s/ Mark A. Emkes |
February 25, 2015 | |||
| Mark A. Emkes, Director | ||||
| /s/ C. Michael Jacobi |
February 25, 2015 | |||
| C. Michael Jacobi, Director | ||||
| /s/ Anne L. Mariucci |
February 25, 2015 | |||
| Anne L. Mariucci, Director | ||||
| /s/ Thurgood Marshall, Jr. |
February 25, 2015 | |||
| Thurgood Marshall, Jr., Director | ||||
| /s/ Charles L. Overby |
February 25, 2015 | |||
| Charles L. Overby, Director | ||||
| /s/ John R. Prann, Jr. |
February 25, 2015 | |||
| John R. Prann, Jr., Director | ||||
| /s/ Joseph V. Russell |
February 25, 2015 | |||
| Joseph V. Russell, Director | ||||
INDEX OF EXHIBITS
Exhibits marked with an * are filed herewith. Exhibits marked with ** are furnished herewith. Other exhibits have previously been filed with the Securities and Exchange Commission (the “Commission”) and are incorporated herein by reference.
| Exhibit Number |
Description of Exhibits | |
| 3.1 | Articles of Amendment and Restatement of the Company (previously filed as Exhibit 3.1 to the Company’s Current Report on Form 8-K (Commission File no. 001-16109), filed with the Commission on May 20, 2013 and incorporated herein by this reference). | |
| 3.2 | Sixth Amended and Restated Bylaws of the Company (previously filed as Exhibit 3.1 to the Company’s Current Report on Form 8-K (Commission File no. 001-16109), filed with the Commission on August 22, 2012 and incorporated herein by this reference). | |
| 4.1 | Specimen of certificate representing shares of the Company’s Common Stock (previously filed as Exhibit 4.2 to the Company’s Annual Report on Form 10-K (Commission File no. 001-16109), filed with the Commission on March 22, 2002 and incorporated herein by this reference). | |
| 4.2 | Indenture (2020 Notes), dated as of April 4, 2013, by and among the Company, certain of its subsidiaries, and U.S. Bank National Association, as Trustee (previously filed as Exhibit 4.2 to the Company’s Current Report on Form 8-K (Commission File no. 001-16109), filed with the Commission on April 8, 2013 and incorporated herein by this reference). | |
| 4.3 | Indenture (2023 Notes), dated as of April 4, 2013, by and among the Company, certain of its subsidiaries, and U.S. Bank National Association, as Trustee (previously filed as Exhibit 4.3 to the Company’s Current Report on Form 8-K (Commission File no. 001-16109), filed with the Commission on April 8, 2013 and incorporated herein by this reference). | |
| 4.4 | Form of 4.125% Senior Note due 2020 (incorporated by reference to Exhibit A to Exhibit 4.2 hereof). | |
| 4.5 | Form of 4.625% Senior Note due 2023 (incorporated by reference to Exhibit A to Exhibit 4.3 hereof). | |
| 4.6 | Supplemental Indenture (2020 Notes), dated as of September 4, 2013, by and among the Company, certain of its subsidiaries, and U.S. Bank National Association, as Trustee (previously filed as Exhibit 4.1 to the Company’s Quarterly Report on Form 10-Q (Commission File no. 001-16109), filed with the Commission on November 7, 2013 and incorporated herein by this reference). | |
| Exhibit Number |
Description of Exhibits | |
| 4.7 | Supplemental Indenture (2023 Notes), dated as of September 4, 2013, by and among the Company, certain of its subsidiaries, and U.S. Bank National Association, as Trustee (previously filed as Exhibit 4.2 to the Company’s Quarterly Report on Form 10-Q (Commission File no. 001-16109), filed with the Commission on November 7, 2013 and incorporated herein by this reference). | |
| 10.1 | Amended and Restated Credit Agreement, dated as of January 6, 2012, by and among the Company, as Borrower, certain lenders and Bank of America, N.A., as Administrative Agent and Wells Fargo Bank, National Association, as Syndication Agent for the lenders (previously filed as Exhibit 10.1 to the Company’s Current Report on Form 8-K (Commission File no. 001-16109), filed with the Commission on January 10, 2012 and incorporated herein by this reference). | |
| 10.2 | Amendment to the Amended and Restated Credit Agreement, dated as of March 22, 2013, by and among the Company, as Borrower, certain lenders and Bank of America, N.A., as Administrative Agent and Wells Fargo Bank, National Association, as Syndication Agent for the lenders (previously filed as Exhibit 10.1 to the Company’s Current Report on Form 8-K (Commission File no. 001-16109), filed with the Commission on March 25, 2013 and incorporated herein by this reference). | |
| 10.3 | The Company’s Amended and Restated 1997 Employee Share Incentive Plan (previously filed as Exhibit 10.15 to the Company’s Annual Report on Form 10-K (Commission File no. 001-16109), filed with the Commission on March 12, 2004 and incorporated herein by this reference). | |
| 10.4 | Form of Non-qualified Stock Option Agreement for the Company’s Amended and Restated 1997 Employee Share Incentive Plan (previously filed as Exhibit 10.17 to the Company’s Annual Report on Form 10-K (Commission File no. 001-16109), filed with the Commission on March 7, 2005 and incorporated herein by this reference). | |
| 10.5 | The Company’s Amended and Restated 2000 Stock Incentive Plan (previously filed as Exhibit 10.20 to the Company’s Annual Report on Form 10-K (Commission File no. 001-16109), filed with the Commission on March 12, 2004 and incorporated herein by this reference). | |
| 10.6 | Amendment No. 1 to the Company’s Amended and Restated 2000 Stock Incentive Plan (previously filed as Exhibit 10.1 to the Company’s Quarterly Report on Form 10-Q (Commission File no. 001-16109), filed with the Commission on November 5, 2004 and incorporated herein by this reference). | |
| Exhibit Number |
Description of Exhibits | |
| 10.7 | First Amendment to Amended and Restated 2000 Stock Incentive Plan of the Company (previously filed as Exhibit 10.1 to the Company’s Quarterly Report on Form 10-Q (Commission File no. 001-16109), filed with the Commission on August 7, 2008 and incorporated herein by this reference). | |
| 10.8 | Second Amendment to Amended and Restated 2000 Stock Incentive Plan of the Company (previously filed as Exhibit 10.3 to the Company’s Current Report on Form 8-K (Commission File no. 001-16109), filed with the Commission on August 18, 2009 and incorporated herein by this reference). | |
| 10.9 | The Company’s Non-Employee Directors’ Compensation Plan (previously filed as Appendix C to the Company’s definitive Proxy Statement relating to its Annual Meeting of Stockholders (Commission File no. 001-16109), filed with the Commission on April 11, 2003 and incorporated herein by this reference). | |
| 10.10 | Form of Employee Non-qualified Stock Option Agreement for the Company’s Amended and Restated 2000 Stock Incentive Plan (previously filed as Exhibit 10.15 to the Company’s Annual Report on Form 10-K (Commission File no. 001-16109), filed with the Commission on March 7, 2006 and incorporated herein by this reference). | |
| 10.11 | Form of Director Non-qualified Stock Option Agreement for the Company’s Amended and Restated 2000 Stock Incentive Plan (previously filed as Exhibit 10.1 to the Company’s Quarterly Report on Form 10-Q (Commission File no. 001-16109), filed with the Commission on August 7, 2007 and incorporated herein by this reference). | |
| 10.12 | Form of Restricted Stock Agreement for the Company’s Amended and Restated 2000 Stock Incentive Plan (previously filed as Exhibit 10.16 to the Company’s Annual Report on Form 10-K (Commission File no. 001-16109), filed with the Commission on March 7, 2006 and incorporated herein by this reference). | |
| 10.13 | The Company’s 2008 Stock Incentive Plan (previously filed as Exhibit 10.1 to the Company’s Current Report on Form 8-K (Commission File no. 001-16109), filed with the Commission on May 11, 2007 and incorporated herein by this reference). | |
| 10.14 | Form of Executive Non-qualified Stock Option Agreement for the Company’s 2008 Stock Incentive Plan (previously filed as Exhibit 10.2 to the Company’s Current Report on Form 8-K (Commission File no. 001-16109), filed with the Commission on February 21, 2008 and incorporated herein by this reference). | |
| Exhibit Number |
Description of Exhibits | |
| 10.15 | Amended Form of Executive Non-qualified Stock Option Agreement for the Company’s 2008 Stock Incentive Plan (previously filed as Exhibit 10.2 to the Company’s Current Report on Form 8-K (Commission File no. 001-16109), filed with the Commission on February 23, 2009 and incorporated herein by this reference). | |
| 10.16 | Form of Director Non-qualified Stock Option Agreement for the Company’s 2008 Stock Incentive Plan (previously filed as Exhibit 10.3 to the Company’s Current Report on Form 8-K (Commission File no. 001-16109), filed with the Commission on February 21, 2008 and incorporated herein by this reference). | |
| 10.17 | Form of Restricted Stock Agreement for the Company’s 2008 Stock Incentive Plan (previously filed as Exhibit 10.4 to the Company’s Current Report on Form 8-K (Commission File no. 001-16109), filed with the Commission on February 21, 2008 and incorporated herein by this reference). | |
| 10.18 | Form of Executive Restricted Stock Unit Agreement for the Company’s 2008 Stock Incentive Plan (previously filed as Exhibit 10.1 to the Company’s Current Report on Form 8-K (Commission File no. 001-16109), filed with the Commission on February 23, 2009 and incorporated herein by this reference). | |
| 10.19 | The Company’s Amended and Restated 2008 Stock Incentive Plan (previously filed as Exhibit 10.1 of the Company’s Current Report on Form 8-K (Commission File no. 001-16109), filed with the Commission on May 17, 2011 and incorporated herein by this reference). | |
| 10.20 | Form of Executive Restricted Stock Unit Award Agreement for the Company’s Amended and Restated 2008 Stock Incentive Plan (previously filed as Exhibit 10.1 to the Company’s Current Report on Form 8-K (Commission File no. 001-16109), filed with the Commission on March 21, 2012 and incorporated herein by this reference). | |
| 10.21 | Form of Director Restricted Stock Agreement for the Company’s Amended and Restated 2008 Stock Incentive Plan (previously filed as Exhibit 10.2 to the Company’s Current Report on Form 8-K (Commission File no. 001-16109), filed with the Commission on May 17, 2011 and incorporated herein by this reference). | |
| 10.22 | Form of Non-Employee Directors Restricted Stock Unit Award Agreement with deferral provisions for the Company’s Amended and Restated 2008 Stock Incentive Plan (previously filed as Exhibit 10.2 to the Company’s Current Report on Form 8-K (Commission File no. 001-16109), filed with the Commission on March 21, 2012 and incorporated herein by this reference). | |
| Exhibit Number |
Description of Exhibits | |
| 10.23 | Form of Non-Employee Directors Restricted Stock Unit Award Agreement for the Company’s Amended and Restated 2008 Stock Incentive Plan (previously filed as Exhibit 10.3 to the Company’s Current Report on Form 8-K (Commission File no. 001-16109), filed with the Commission on March 21, 2012 and incorporated herein by this reference). | |
| 10.24 | Form of Restricted Stock Unit Award Agreement for the Company’s Amended and Restated 2008 Stock Incentive Plan (Time-Vesting Form for Executive Officers) (previously filed as Exhibit 10.23 to the Company’s Annual Report on Form 10-K (Commission File no. 001-16109), filed with the Commission on February 27, 2013 and incorporated herein by this reference). | |
| 10.25 | Amended and Restated Non-Employee Director Deferred Compensation Plan (previously filed as Exhibit 10.1 to the Company’s Current Report on Form 8-K (Commission File no. 001-16109), filed with the Commission on August 16, 2007 and incorporated herein by this reference). | |
| 10.26 | Amendment to the Amended and Restated Non-Employee Director Deferred Compensation Plan (previously filed as Exhibit 10.35 to the Company’s Annual Report on Form 10-K (Commission File no. 001-16109), filed with the Commission on February 24, 2010 and incorporated herein by this reference). | |
| 10.27 | Amended and Restated Executive Deferred Compensation Plan (previously filed as Exhibit 10.2 to the Company’s Current Report on Form 8-K (Commission File no. 001-16109), filed with the Commission on August 16, 2007 and incorporated herein by this reference). | |
| 10.28 | Form of Indemnification Agreement (previously filed as Exhibit 10.1 to the Company’s Current Report on Form 8-K (Commission File no. 001-16109), filed with the Commission on August 18, 2009 and incorporated herein by this reference). | |
| 10.29 | Notice Letter from John D. Ferguson to the Company (previously filed as Exhibit 10.2 to the Company’s Current Report on Form 8-K (Commission File no. 001-16109), filed with the Commission on August 18, 2009 and incorporated herein by this reference). | |
| 10.30 | Letter Agreement, dated as of October 15, 2009, with John D. Ferguson (previously filed as Exhibit 10.2 to the Company’s Current Report on Form 8-K (Commission File no. 001-16109), filed with the Commission on October 15, 2009 and incorporated herein by this reference). | |
| Exhibit Number |
Description of Exhibits | |
| 10.31 | Transition Agreement, dated as of May 1, 2014, with Todd J Mullenger (previously filed as Exhibit 10.2 to the Company’s Current Report on Form 8-K (Commission File no. 001-16109), filed with the Commission on April 15, 2014 and incorporated herein by this reference). | |
| 10.32* | Form of Executive Employment Agreement, effective as of January 1, 2015. | |
| 21.1* | Subsidiaries of the Company. | |
| 23.1* | Consent of Independent Registered Public Accounting Firm. | |
| 31.1* | Certification of the Company’s Chief Executive Officer pursuant to Securities and Exchange Act Rules 13a-14(a) and 15d-14(a), as adopted pursuant to Section 302 of the Sarbanes-Oxley Act of 2002. | |
| 31.2* | Certification of the Company’s Chief Financial Officer pursuant to Securities and Exchange Act Rules 13a-14(a) and 15d-14(a), as adopted pursuant to Section 302 of the Sarbanes-Oxley Act of 2002. | |
| 32.1** | Certification of the Company’s Chief Executive Officer pursuant to 18 U.S.C. Section 1350, as adopted pursuant to Section 906 of the Sarbanes-Oxley Act of 2002. | |
| 32.2** | Certification of the Company’s Chief Financial Officer pursuant to 18 U.S.C. Section 1350, as adopted pursuant to Section 906 of the Sarbanes-Oxley Act of 2002. | |
| 101.INS* | XBRL Instance Document | |
| 101.SCH* | XBRL Taxonomy Extension Schema | |
| 101.CAL* | XBRL Taxonomy Extension Calculation Linkbase | |
| 101.DEF* | XBRL Taxonomy Extension Definition Linkbase | |
| 101.LAB* | XBRL Taxonomy Extension Label Linkbase | |
| 101.PRE* | XBRL Taxonomy Extension Presentation Linkbase | |