Attached files
| file | filename |
|---|---|
| 8-K - FORM 8-K - CNB FINANCIAL CORP/PA | d875231d8k.htm |
 Investor Meetings
February 2015
Exhibit 99.1 |
 Forward-Looking Statements
This
presentation
includes
forward-looking
statements
within
the
meaning
of
Section
27A
of
the
Securities
Act
of
1933,
as
amended,
and
Section
21E
of
the
Securities
Exchange
Act
of
1934,
as
amended,
with
respect
to
the
financial
condition,
liquidity,
results
of
operations,
future
performance
and
business
of
CNB
Financial
Corporation.
These
forward-looking
statements
are
intended
to
be
covered
by
the
safe
harbor
for
“forward-looking
statements”
provided
by
the
Private
Securities
Litigation
Reform
Act
of
1995.
Forward-looking
statements
are
those
that
are
not
historical
facts.
Forward-looking
statements
include
statements
with
respect
to
beliefs,
plans,
objectives,
goals,
expectations,
anticipations,
estimates
and
intentions
that
are
subject
to
significant
risks
and
uncertainties
and
are
subject
to
change
based
on
various
factors
(some
of
which
are
beyond
our
control).
Forward-looking
statements
often
include
the
words
“believes,”
“expects,”
“anticipates,”
“estimates,”
“forecasts,”
“intends,”
“plans,”
“targets,”
“potentially,”
“probably,”
“projects,”
“outlook”
or
similar
expressions
or
future
conditional
verbs
such
as
“may,”
“will,”
“should,”
“would”
and
“could.”
Such
known
and
unknown
risks,
uncertainties
and
other
factors
that
could
cause
the
actual
results
to
differ
materially
from
the
statements,
include,
but
are
not
limited
to:
(i)
changes
in
general
business,
industry
or
economic
conditions
or
competition;
(ii)
changes
in
any
applicable
law,
rule,
regulation,
policy,
guideline
or
practice
governing
or
affecting
financial
holding
companies
and
their
subsidiaries
or
with
respect
to
tax
or
accounting
principles
or
otherwise;
(iii)
adverse
changes
or
conditions
in
capital
and
financial
markets;
(iv)
changes
in
interest
rates;
(v)
higher
than
expected
costs
or
other
difficulties
related
to
integration
of
combined
or
merged
businesses;
(vi)
the
inability
to
realize
expected
cost
savings
or
achieve
other
anticipated
benefits
in
connection
with
business
combinations
and
other
acquisitions;
(vii)
changes
in
the
quality
or
composition
of
our
loan
and
investment
portfolios;
(viii)
adequacy
of
loan
loss
reserves;
(ix)
increased
competition;
(x)
loss
of
certain
key
officers;
(xi)
deposit
attrition;
(xii)
rapidly
changing
technology;
(xiii)
unanticipated
regulatory
or
judicial
proceedings
and
liabilities
and
other
costs;
(xiv)
changes
in
the
cost
of
funds,
demand
for
loan
products
or
demand
for
financial
services;
and
(xv)
other
economic,
competitive,
governmental
or
technological
factors
affecting
our
operations,
markets,
products,
services
and
prices.
Such
developments
could
have
an
adverse
impact
on
our
financial
position
and
our
results
of
operations.
The
forward-looking
statements
are
based
upon
management’s
beliefs
and
assumptions.
Any
forward-looking
statement
made
herein
speaks
only
as
of
the
date
of
this
presentation.
Factors
or
events
that
could
cause
our
actual
results
to
differ
may
emerge
from
time
to
time,
and
it
is
not
possible
for
us
to
predict
all
of
them.
We
undertake
no
obligation
to
publicly
update
any
forward-looking
statement,
whether
as
a
result
of
new
information,
future
developments
or
otherwise,
except
as
may
be
required
by
law.
2 |
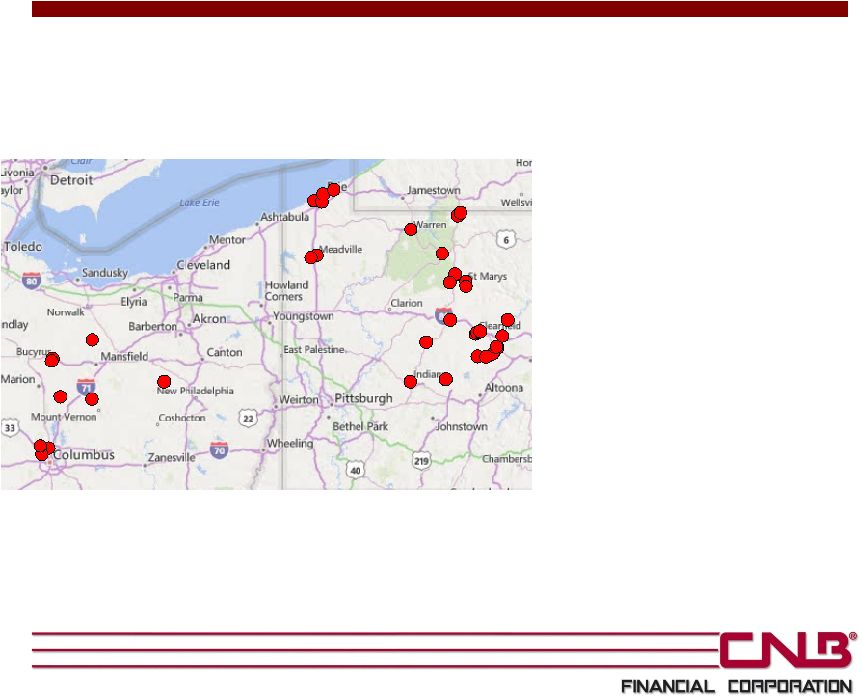 CNB
Financial Overview CNB Financial is a full-service bank,
headquartered in Clearfield, PA, providing
services, including wealth and asset management,
to individuals, businesses, governments, and
institutional customers
As of December 31, 2014:
•
Assets: $2.2 billion
•
Loans: $1.4 billion
•
Deposits: $1.8 billion
Operates 38 branches in North Central
Pennsylvania and Ohio through its principal
subsidiary, CNB Bank
CNB Bank is a regional independent community
bank operating:
•
21 branches in North Central Pennsylvania
•
8 full-service branches through ERIEBANK,
a division of CNB Bank headquartered in
Erie, PA
•
9 full-service branches through FCBank, a
division of CNB Bank, headquartered in
Bucyrus, Ohio
Loan production offices in Hollidaysburg, PA and
Ashtabula, OH
Holiday Financial Services Corporation is a
consumer discount loan company with 13 offices
NASDAQ-listed under the symbol “CCNE”
3
Source: SNL Financial and company data. Information and data as
of December 31, 2014 |
 Strong Balance Sheet Growth
•
Loans of $1.4 billion at December 31, 2014 represent 4.6% of organic growth over
December 31, 2013 •
Deposits of $1.8 billion at December 31, 2014 represent 0.6% growth over December
31, 2013, non-interest bearing demand deposits grew 10.6% and
savings deposits grew 8.3%, offset by a decline in non-core time deposits of
33.4%
Profitability
•
Record net income of $23.1 million in 2014, an increase of 38.3%
over 2013
•
Earnings per share of $1.60 in 2014 up from $1.29 in 2013, an increase of 24%
•
Annualized return on assets of 1.07% and return on equity of 12.76% in 2014, as
compared to 0.88% and 11.38%, respectively, in 2013
•
Net interest margin of 3.82% compared to 3.47% for the full year
2013*
Superior Asset Quality
•
Nonperforming assets to total assets declined to 0.47% from 0.61% at December 31,
2013 •
Net charge-offs to average loans of 0.10% for CNB Bank and 0.21% including
Holiday Financial Services Corp. •
Allowance for loan losses to loans of 1.28%
Capital
•
Tangible common equity to tangible assets of 7.32%**
•
Leverage ratio of 8.39%
•
Tier 1 Risk Based Ratio of 13.06%
•
Total Risk Based Capital Ratio of 14.31%
Financial Highlights –
2014
4
Note: Financial data as of or for the twelve months ended December 31, 2014
* Net accretion included in loan interest income related to loans acquired in the
fourth quarter of 2013 was $2.9 million in 2014, resulting in an increase in
the net interest margin of 14 basis points **Please see the Appendix for a
reconciliation of non-GAAP financial information. |
 2014
Initiatives Focused on the integration of the FC Banc Corp. acquisition
Opened a CNB Bank loan production office in Blair County, PA
in April
Opened a FCBank full-service branch in Dublin, OH in July
Opened an ERIEBANK loan production office in Ashtabula, OH
in October
Construction of new ERIEBANK full-service branch in Erie, PA
that opened in January 2015
5 |
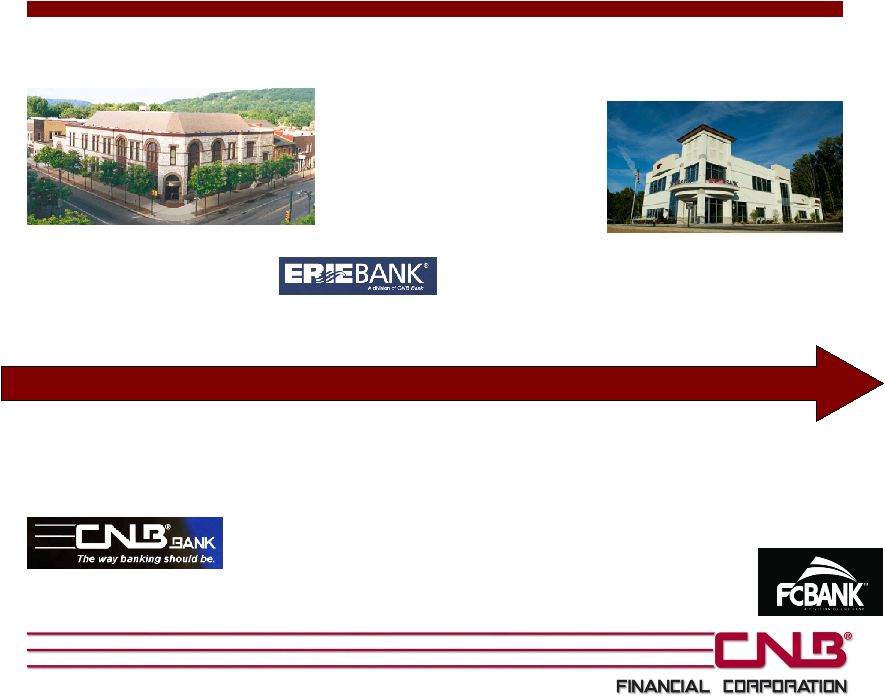 History of CNB Financial
6
1865
1934
1984
2005
2006
2008
2009
2010 2013
1865:
County
National Bank
of Clearfield
established
1934:
Reorganizes
through a stock
offering to existing
depositors
1984:
Forms
CNB
Financial Corporation
holding company
2005:
ERIEBANK is
formed
2005:
Purchases
assets
of Holiday Consumer
Discount Company and
forms Holiday Financial
Services Corporation
2006:
Conversion
to a state banking
charter
2010:
Joseph
Bower
becomes CEO after
retirement of William
Falger
2008-2009:
Receives
approval to raise $21
million via TARP;
CNB chooses not to
participate
2010:
Capital
raise of $34.5
million
2013:
Acquisition of
FC Banc Corp.
headquartered
in Bucyrus,
Ohio with $360
million in
assets |
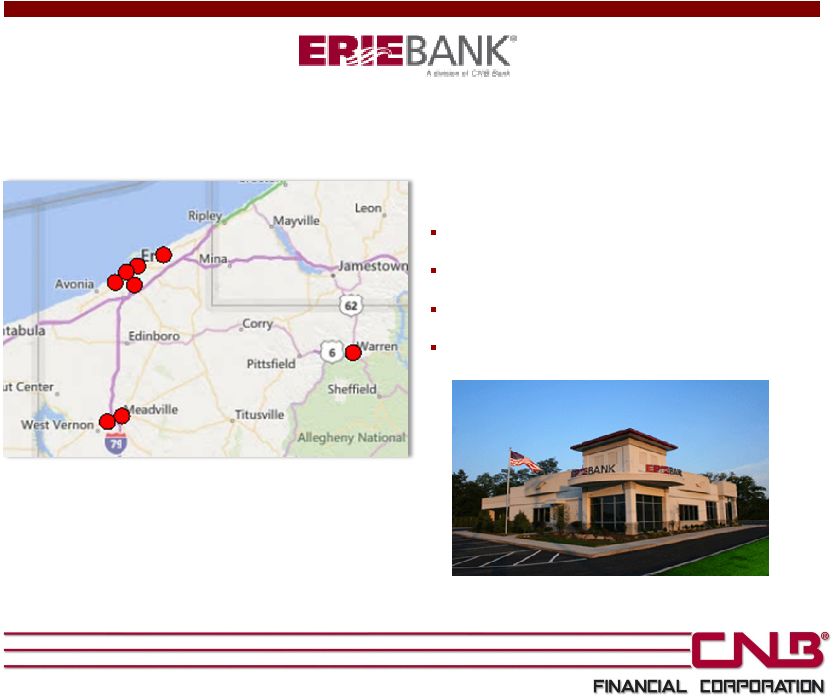 ERIEBANK, a division of CNB Bank, was created de novo in 2005
At December 31, 2014:
Eight branches
One loan production office
$417 million in loans
$594 million in deposits
7 |
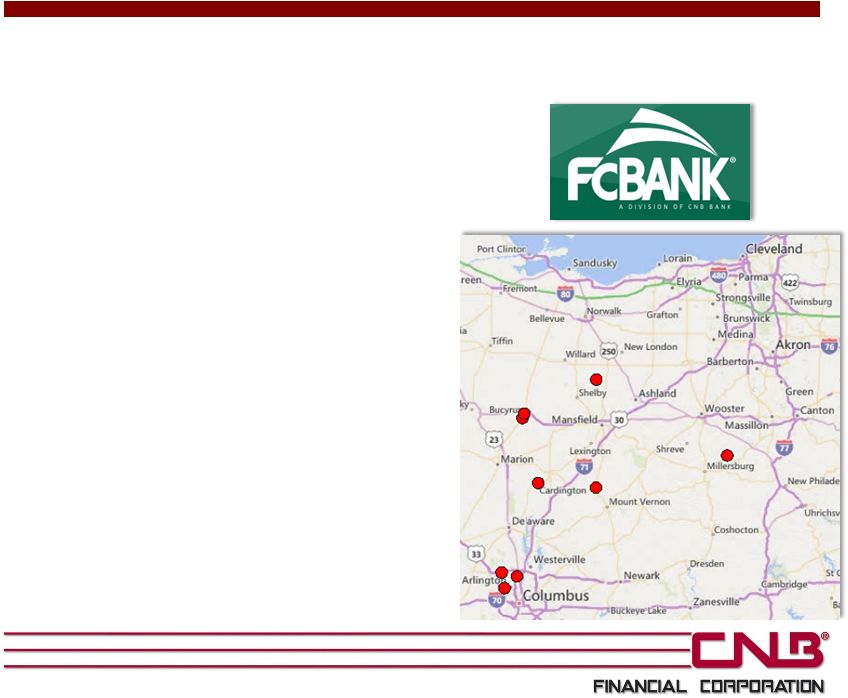 Expansion into Ohio
•
The acquisition of FC Banc Corp., which closed in the
fourth quarter of 2013, expanded CNB’s geographic
footprint into Central Ohio with meaningful size and
scale
–
Entry into 5 new markets, similar to CNB
core markets
–
$360 million in total assets; $248 million in
loans; and $332 million in deposits as of
October 11, 2013
•
Opportunity to replicate CNB’s already
successful ERIEBANK model in a market
conducive to CNB’s business plan
•
Significant opportunity for both organic and
strategic growth going forward
•
EPS accretion realized in the first full combined
year without significant TBV dilution
8 |
 CNB’s Experienced Management Team
Years at
Years in
Executive
Title
CCNE
Industry
Joseph B. Bower Jr.
President & Chief Executive Officer
18
22
Richard L. Greslick Jr.
SEVP / Chief Operating Officer & Secretary
17
17
Joseph E. Dell Jr.
EVP / Chief Lending Officer
2
31
Mark D. Breakey
SEVP / Chief Credit Officer
24
30
Brian W. Wingard
EVP / Chief Financial Officer & Treasurer
7
7
Vincent C. Turiano
EVP / Operations
6
42
Leanne D. Kasseb
EVP / Marketing
19
21
Mary Ann Conaway
EVP / Human Resources
33
33
David J. Zimmer
President of ERIEBANK
10
31
J. Andrew Dale
President of FC Bank
2
28
9 |
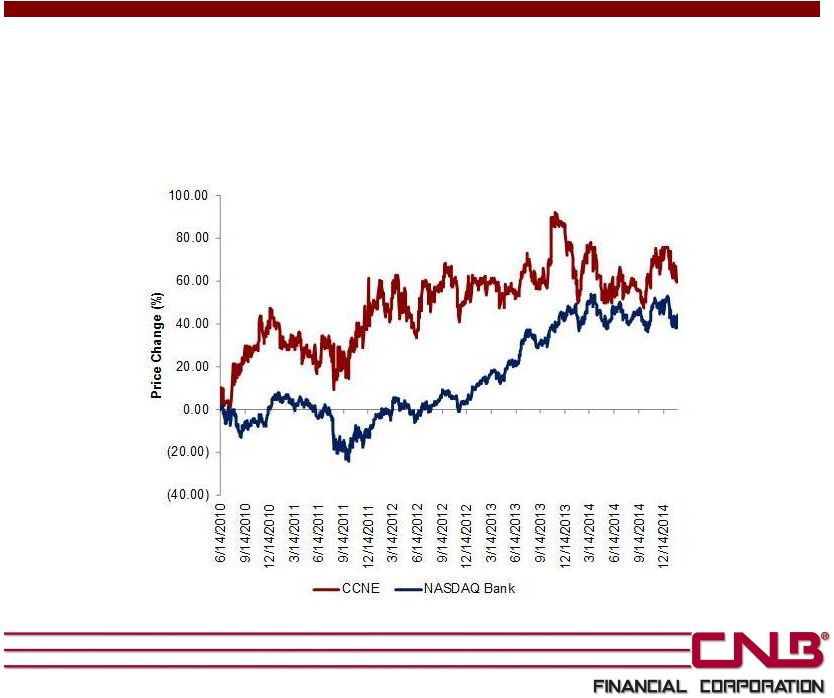 CNB
Stock Price Performance Since its follow-on offering in 2010, CNB has
outperformed the NASDAQ Bank Index
Source: SNL Financial. Price change from 6/14/10 to 2/3/15
10 |
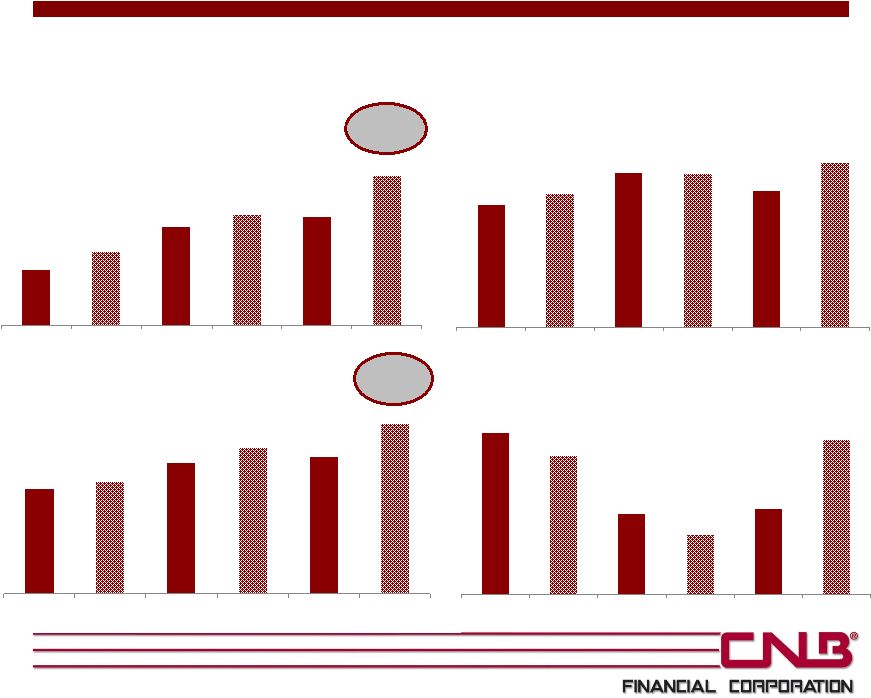
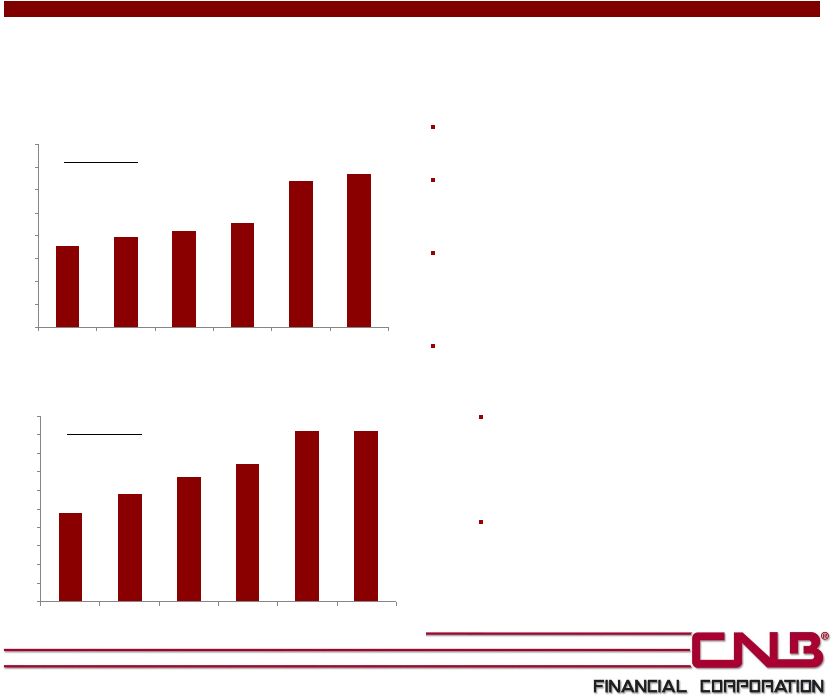 Strong organic loan and deposit growth
through the financial crisis and recession
Fundamental focus on originating loans in-
market and funding with local, low-cost core
deposits while maintaining asset quality
The Bank strives to be more customer-
driven than its competitors and builds long-
term customer relationships by being
reliable and competitively priced
Loans and deposits at December 31, 2014
increased 4.6% and 0.6%, respectively,
compared to year-end 2013
Deposit growth in 2014 includes growth in
non-interest bearing demand deposits of
10.6% and savings deposits of 8.3%,
offset by a decline in non-core time
deposits of 33.4%
CNB anticipates moderate loan and
deposit growth across all of its markets in
2015
Strong Organic Loan and Deposit Growth
11
0
0
0
0
0
200,000
400,000
600,000
800,000
1,000,000
1,200,000
1,400,000
1,600,000
2009Y
2010Y
2011Y
2012Y
2013Y
2014Y
Total Loans
5-Year CAGR:
Total
13.6%
Organic 9.1%
0
0
0
0
0
200,000
400,000
600,000
800,000
1,000,000
1,200,000
1,400,000
1,600,000
1,800,000
2,000,000
2009Y
2010Y
2011Y
2012Y
2013Y
2014Y
Total Deposits
5-Year CAGR:
Total
14.1%
Organic 9.6% |
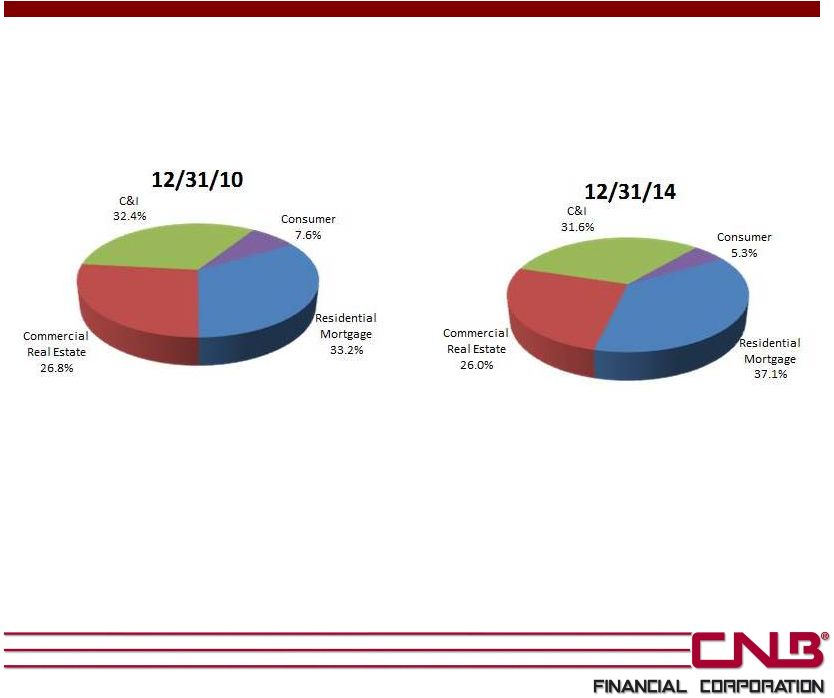 Diversified Loan Portfolio
$795 million
6.43% yield
12
$1.4 billion
5.33% yield |
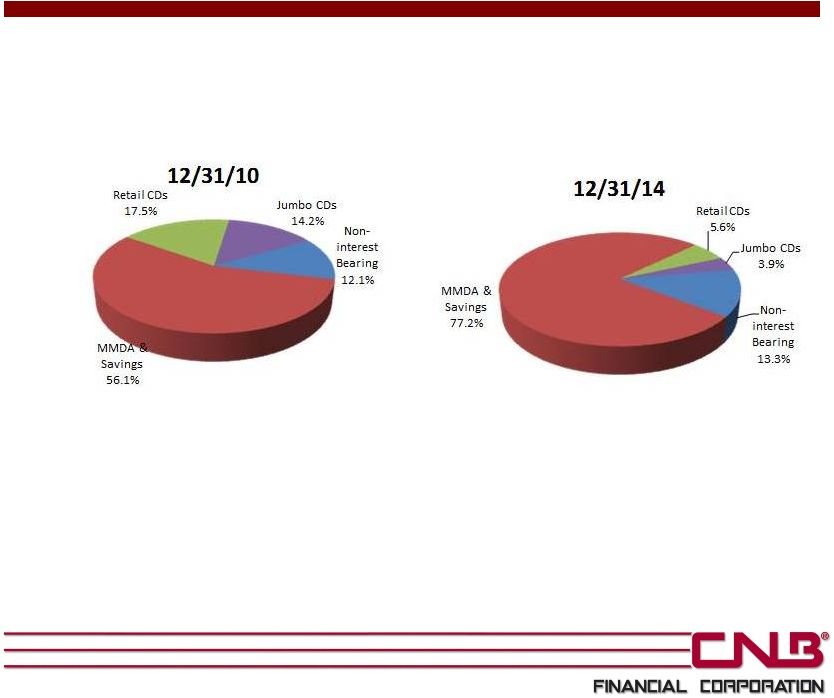 Attractive Deposit Mix
$1.2 billion
1.42% cost of deposits
13
$1.8 billion
0.51% cost of deposits |
 Deposit Market Share
Source: SNL Financial. Deposit market share as of June 30, 2014
14
CNB Growth
Market Growth
Market
Rank
# of
Branches
CNB
Deposits
($000)
CNB Deposit
Market Share
(%)
Year over
Year (%)
5-Year
CAGR (%)
Total
Deposits in
Market
($000)
Year over
Year (%)
5-Year
CAGR (%)
Clearfield, PA
1
10
455,265
33.97
1.39
3.34
1,340,282
1.37
0.03
Erie, PA
5
4
408,166
9.31
(4.35)
24.86
4,382,281
3.64
5.23
Elk, PA
2
4
167,188
24.26
0.93
11.89
689,050
0.22
0.94
Crawford, PA
5
2
136,415
10.74
9.88
-
1,270,313
4.07
3.15
McKean, PA
3
3
122,367
14.90
0.16
11.62
821,456
(0.98)
3.30
Crawford, OH
2
2
120,590
16.81
(9.10)
1.66
717,532
(3.67)
0.82
Franklin, OH
17
3
107,979
0.24
(3.31)
14.18
44,791,832
5.79
8.60
Centre, PA
10
1
84,454
3.23
(0.22)
7.80
2,613,896
(2.49)
4.11
Warren, PA
4
1
58,448
7.50
(2.09)
15.80
778,847
(8.24)
1.92
Cambria, PA
10
1
51,820
1.87
0.20
4.96
2,775,698
0.17
1.47
Jefferson, PA
6
1
50,604
5.71
(16.26)
9.74
885,793
(0.49)
0.67
Knox, OH
6
1
37,364
4.94
1.80
3.97
756,899
2.76
2.92
Morrow, OH
4
1
31,116
15.51
(3.65)
2.86
200,664
1.56
2.09
Richland, OH
13
1
12,113
0.71
12.65
28.21
1,715,231
0.55
1.02
Holmes, OH
8
1
4,789
0.63
66.28
-
760,371
4.09
6.89
Indiana, PA
9
1
2,651
0.11
0.23
-
2,449,716
0.52
3.11
Total
37
1,851,329
2.77
(1.20)
11.52
66,949,861
4.01
6.48 |
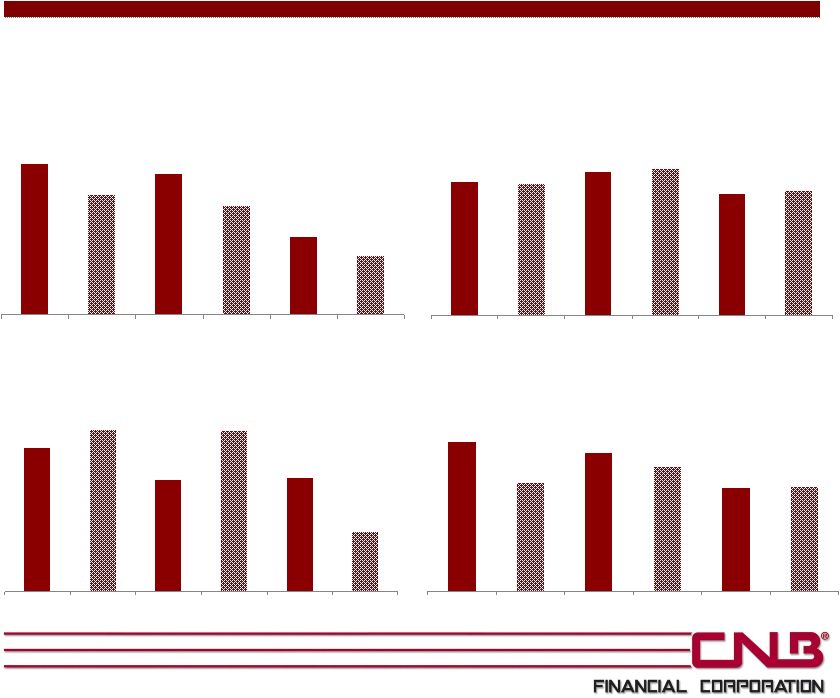
 Improved Profitability
* Note 2013 full year net income includes one-time merger costs of $2.4 million
(pre-tax) related to the acquisition of FC Banc Corp.
15
0
0
0
0
$8,512
$11,316
$15,104
$17,136
$16,679
$23,074
2009Y
2010Y
2011Y
2012Y
2013Y
2014Y
Net Income
5-Year
CAGR
+22.1%
0
0
0
0
0.79
0.87
1.00
1.00
0.88
1.07
2009Y
2010Y
2011Y
2012Y
2013Y
2014Y
ROAA
0
0
0
0
$0.98
$1.06
$1.23
$1.38
$1.29
$1.60
2009Y
2010Y
2011Y
2012Y
2013Y
2014Y
Diluted EPS
5-Year
CAGR
+10.3%
0
0
0
0
59.91
58.54
54.96
53.67
55.24
59.54
2009Y
2010Y
2011Y
2012Y
2013Y
2014Y
Efficiency Ratio |
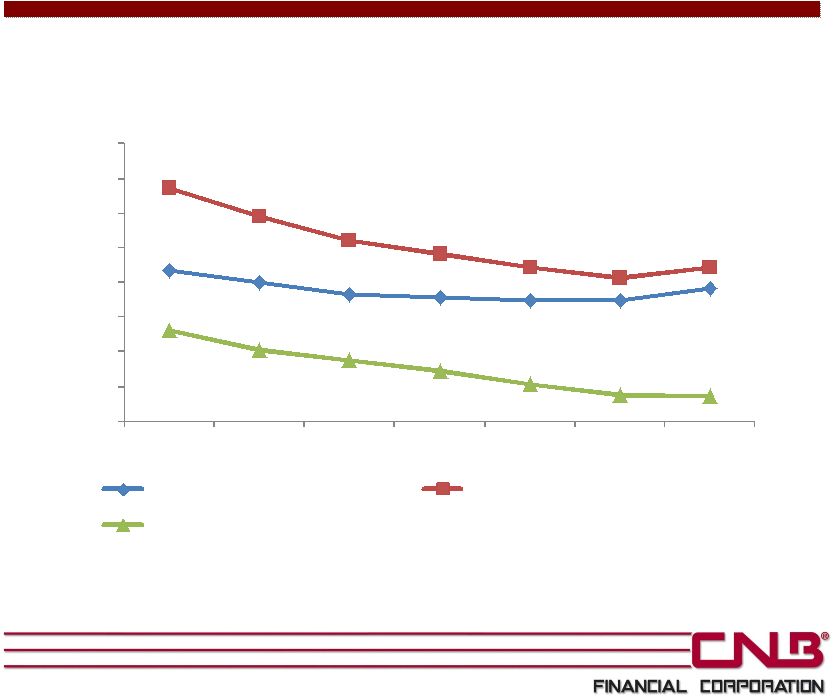 Stable Net Interest Margin
16
0
0
0
0
4.33
4.00
3.65
3.59
3.49
3.47
3.82
6.72
5.89
5.23
4.84
4.42
4.15
4.43
2.64
2.07
1.78
1.44
1.08
0.79
0.71
0.00
1.00
2.00
3.00
4.00
5.00
6.00
7.00
8.00
2008Y
2009Y
2010Y
2011Y
2012Y
2013Y
2014Y
Net Interest Margin
Yield on Interest Earning Assets
Cost of Interest Bearing Liabilities |
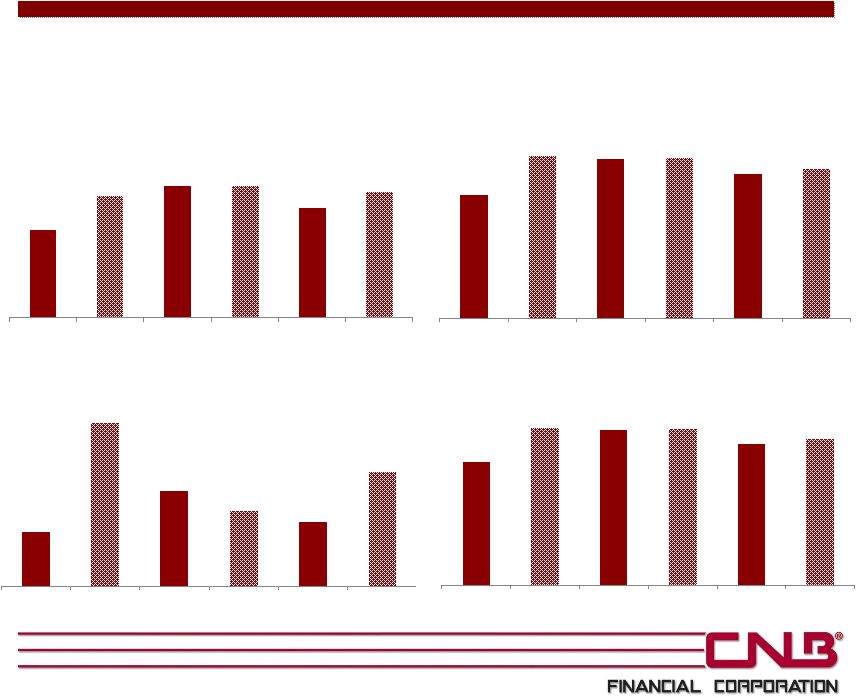
 Superior Asset Quality
Source: SNL Financial. NPAs excluded restructured loans. Texas ratio defined as NPA
& Loans 90+/ Tangible Common Equity* + Allowance for Loan Losses.
* Please see the Appendix for a reconciliation of non-GAAP financial
information 17
0
0
0
0
1.17
0.93
1.09
0.85
0.61
0.47
2009Y
2010Y
2011Y
2012Y
2013Y
2014Y
NPAs/Assets
0
0
0
0
1.37
1.35
1.48
1.51
1.25
1.28
2009Y
2010Y
2011Y
2012Y
2013Y
2014Y
Allowance for Loan Losses/
Gross Loans
0
0
0
0
20.30
14.82
18.85
16.90
14.00
14.25
2009Y
2010Y
2011Y
2012Y
2013Y
2014Y
Texas Ratio
0
0
0
0
0.49
0.56
0.38
0.55
0.39
0.21
2009Y
2010Y
2011Y
2012Y
2013Y
2014Y
NCOs/Average Loans |
 Strong Capital Levels
18
* Please see the Appendix for a reconciliation of non-GAAP financial
information. 0
0
0
0
5.08
7.05
7.61
7.63
6.34
7.32
2009Y
2010Y
2011Y
2012Y
2013Y
2014Y
Tangible Common
Equity/Tangible Assets*
0
0
0
0
7.87
8.81
8.22
8.06
7.96
8.39
2009Y
2010Y
2011Y
2012Y
2013Y
2014Y
Leverage Ratio
0
0
0
0
10.70
14.13
13.89
14.03
12.51
13.06
2009Y
2010Y
2011Y
2012Y
2013Y
2014Y
Tier 1 Risk Based Ratio
0
0
0
0
11.95
15.38
15.14
15.28
13.72
14.31
2009Y
2010Y
2011Y
2012Y
2013Y
2014Y
Total Risk Based Ratio |
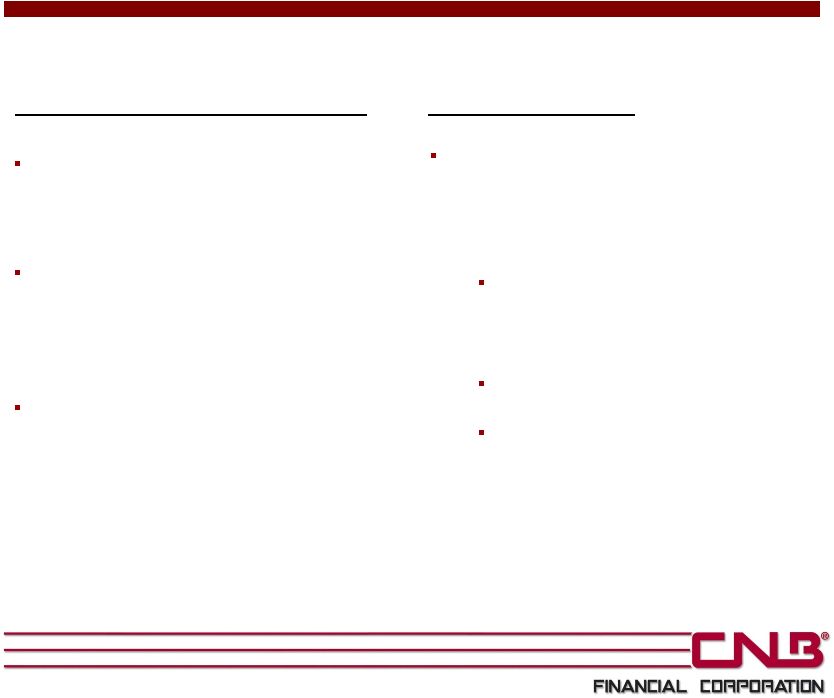 CNB’s Growth Strategy
Organic / De Novo Growth Strategy
Intend to grow organically in the
FCBank market through new offices
and additional lenders
Continued growth of ERIEBANK by
focusing on retail and commercial
relationship banking as well as
private banking
Continue to open loan production
offices to fill in our markets
Acquisition Strategy
M&A is not a priority in our growth
strategy; however, we will remain
opportunistic and would consider a
transaction that would:
Expand our presence into new
markets that fit our business
model (e.g. FCBank)
Bring significant talent
Fill in existing markets
19 |
 Appendix
20 |
 Non-GAAP Financial Reconciliation
Tangible
common
equity
to
tangible
assets
is
a
non-GAAP
financial
measure
calculated
using
GAAP
amounts.
Tangible
common
equity
is
calculated
by
excluding
the
balance
of
goodwill
and
other
intangible
assets
from
the
calculation
of
shareholders’
equity.
Tangible
assets
is
calculated
by
excluding
the
balance
of
goodwill
and
other
intangible
assets
from
the
calculation
of
total
assets.
CNB
believes
that
this
non-GAAP
financial
measure
provides
information
to
investors
that
is
useful
in
understanding
our
financial
condition.
Because
not
all
companies
use
the
same
calculations
of
tangible
common
equity
and
tangible
assets,
this
presentation
may
not
be
comparable
to
other
similarly
titled
measures
calculated
by
other
companies.
A
reconciliation
of
this
non-GAAP
financial
measure
is
provided
below.
21
Year ended December 31,
($ in thousands)
2009
2010
2011
2012
2013
2014
Total Shareholders' Equity
$69,409
$109,645
$131,889
$145,364
$164,911
$188,548
Less Goodwill
10,821
10,821
10,821
10,946
27,194
27,194
Less Other Intangible Assets
85
-
-
-
4,583
3,403
Tangible Common Equity
$58,503
$98,824
$121,068
$134,418
$133,134
$157,951
Total Assets
$1,161,591
$1,413,511
$1,602,207
$1,773,079
$2,131,289
$2,189,213
Less Goodwill
10,821
10,821
10,821
10,946
27,194
27,194
Less Other Intangible Assets
85
-
-
-
4,583
3,403
Tangible Assets
$1,150,685
$1,402,690
$1,591,386
$1,762,133
$2,099,512
$2,158,616
Total Shareholders' Equity / Total Assets
5.98%
7.76%
8.23%
8.20%
7.74%
8.61%
Tangible Common Equity / Tangible Assets
5.08%
7.05%
7.61%
7.63%
6.34%
7.32% |