Attached files
| file | filename |
|---|---|
| 8-K - 8-K - CARRIAGE SERVICES INC | a8k-csvq42014pressrelease.htm |
 | FOR IMMEDIATE RELEASE |
CARRIAGE SERVICES ANNOUNCES RECORD 2014 ANNUAL RESULTS
RAISES ROLLING FOUR QUARTER OUTLOOK
HOUSTON – February 25, 2015 – Carriage Services, Inc. (NYSE: CSV) today announced record results for the year ending December 31, 2014.
Mel Payne, Chief Executive Officer, stated, “Our 2014 full year performance was an earning power milestone record with Adjusted Net Income of $24.8 million equal to Adjusted Diluted EPS of $1.34 and Adjusted Net Income Margin of 11.0% on record revenues of $226.1 million, made possible by an extraordinarily strong fourth quarter finish of Adjusted Diluted EPS of $0.38 on record revenues of $59.4 million. Carriage as a consolidation and operating platform for funeral homes and cemeteries has reached an “earning power sweet spot” in maturity and size, as reflected by the leveraging of a 12.9% total revenue increase in the fourth quarter into much larger increases of 25.6% in Total Field EBITDA, 27.8% in Adjusted Consolidated EBITDA, and 52.0% in Adjusted Diluted EPS.
We fully expect this sustainable earning power trend from existing operations and the value creation leveraging dynamics to continue into 2015 and thereafter and to be supplemented by new, high quality acquisitions from our growing pipeline of top quality acquisition candidates in strategic markets. We are therefore raising our Rolling Four Quarter Outlook range on revenue to $244 - $248 million and Adjusted Diluted EPS to $1.55 - $1.59.
The 2014 year was the third year in our defined Five Year Carriage Good To Great Journey with an annual theme of Carriage Services 2014: Being the Best - One Team, One Vision! Highlights of the year were as follows:
1. | Dave DeCarlo joined Bill Heiligbrodt and me in March as a member of the Executive Team with the primary responsibility of growing the Company by selective, strategic acquisitions; |
2. | Entered two large, new strategic markets, New Orleans and Washington, D.C., with the acquisition from SCI in May of five funeral homes and one combination business; |
3. | Completed the refinancing in May of all the old high rate components of our balance sheet with low rate $325 million syndicated five year bank credit facilities and $143.75 million seven year convertible subordinated notes; |
4. | Established a highly collaborative Operations and Strategic Growth Leadership Team (OSGLT) comprised of the Executive Team and twelve senior leaders representing field operations and Houston Support teams. This group operates informally as owner leaders without titles, direct reports, etc., and addresses all important Carriage value creation matters consistent with One Team, One Vision; |
5. | Updated and revised Strategic Acquisition Model criteria and methodologies to directly align with Standards Operating and 4E Leadership Models, and began building a new Strategic Development Team under Dave's leadership focused on building relationships with top quality acquisition candidates in large and medium strategic markets and areas. |
Year Ended December 31, 2014
• | Total Revenue of $226.1 million, an increase of 6.1%; |
• | Adjusted Consolidated EBITDA of $61.7 million, an increase of 10.1%; |
• | Adjusted Consolidated EBITDA Margin up 100 basis points to 27.3%; |
• | Adjusted Diluted Earnings Per Share of $1.34, an increase of 36.7%; and |
• | Adjusted Free Cash Flow of $34.2 million, an increase of 2.8%. |
1
Three Months Ended December 31, 2014
• | Total Revenue of $59.4 million, an increase of 12.9%; |
• | Adjusted Consolidated EBITDA of $17.1 million, an increase of 27.8%; |
• | Adjusted Consolidated EBITDA Margin up 330 basis points to 28.7%; |
• | Adjusted Diluted Earnings Per Share of $0.38, an increase of 52.0%; and |
• | Adjusted Free Cash Flow of $7.0 million, an increase of 4.0% |
We begin the fourth year of our defined Five Year Carriage Good To Great Journey with a company that is materially better in all areas than one year ago. While we understand that public investors must rely on our reported quantitative financial results covering a recent short period of time to judge our progress, the internal qualitative drivers of our increasing quantitative success are our Five Guiding Principles, three innovative operating, leadership and growth models, High Performance Standards, relentless focus on 4E Leadership and Right Quality of Staff and the collaboration dynamic across all field operations and Houston Support teams. Linked together, these ideas and concepts form our High Performance Culture Framework of value creation, which we believe will produce superior quantitative results over the next several years that will attract the best acquisition candidates and talent in our industry to join and contribute to the Carriage Good To Great Journey.
As we successfully execute our three models (Standards Operating, Strategic Acquisition and 4E Leadership) over this year and next to complete our Five Year Good to Great Journey, we fully expect to accelerate the earning power of our Carriage Consolidation and Operating Platform. However, by the end of 2016 we will also have redefined our Carriage Good to Great Journey over a new five year timeframe with new goals, always keeping our Mission of Being The Best and Five Guiding Principles together with shareholder value creation uppermost in mind. Lastly and importantly for our company leadership and employees, I am extremely proud to publicly announce our Good To Great annual theme for this year,” concluded Mr. Payne.
“Carriage Services 2015: High Performance through Passion and Partnership!”
TOTAL FIELD OPERATIONS
For the Year Ended December 31, 2014 compared to Year Ended December 31, 2013
• | Total Field Revenue increased 6.1% to $226.1 million; |
• | Total Field EBITDA increased 7.0% to $90.4 million; |
• | Total Field EBITDA Margin increased 40 basis points to 40.0%; |
• | Total Funeral Operating Revenue increased 6.8% to $164.3 million; |
• | Same Store Funeral Revenue decreased 0.7% with same store volume decreasing 1.2%; |
• | Acquisition Funeral Revenue increased 33.5% with acquisition volume increasing 26.9%; |
• | Total Funeral Field EBITDA increased 9.0% to $60.5 million; |
• | Total Funeral Field EBITDA Margin increased 80 basis points to 36.8%; |
• | Total Cemetery Operating Revenue increased 5.9% to $42.9 million; |
• | Cemetery preneed property sale contracts increased 5.5% to 7,408; |
• | Preneed property revenue recognized increased 5.4% and At-need revenue increased 10.8%; |
• | Total Cemetery Field EBITDA increased 4.1% to $12.2 million; |
• | Total Cemetery Field EBITDA Margin decreased 40 basis points to 28.5%; |
• | Total Financial Revenue increased 1.5% to $19.0 million; |
• | Funeral Financial Revenue increased 2.7% to $9.5 million; |
• | Cemetery Financial Revenue remained flat at $9.5 million; |
• | Total Financial EBITDA increased 2.2% to $17.7 million; |
• | Total Financial EBITDA Margin increased 70 basis points to 93.0%. |
2
ADJUSTED FREE CASH FLOW
Carriage produced Adjusted Free Cash Flow from operations for the year ended December 31, 2014 of $34.2 million compared to $33.2 million for the corresponding period in 2013. The sources and uses of cash for the year ended December 31, 2013 and 2014 consisted of the following (in millions):
Three Months Ended December 31, | Twelve Months Ended December 31, | ||||||||||||||
2013 | 2014 | 2013 | 2014 | ||||||||||||
Cash flow provided by operations | $ | 8.6 | $ | 8.9 | $ | 39.8 | $ | 36.6 | |||||||
Adjustment for tax benefit from Good to Great stock awards | — | — | — | 4.8 | |||||||||||
Cash used for maintenance capital expenditures | (1.9 | ) | (1.9 | ) | (6.6 | ) | (7.2 | ) | |||||||
Adjusted Free Cash Flow | $ | 6.7 | $ | 7.0 | $ | 33.2 | $ | 34.2 | |||||||
Cash at beginning of period | 0.9 | 3.0 | 1.7 | 1.4 | |||||||||||
Acquisitions and land for new construction | (13.7 | ) | (1.0 | ) | (19.7 | ) | (57.9 | ) | |||||||
Net proceeds from sale of businesses and other assets | 1.9 | 0.3 | 10.2 | 2.2 | |||||||||||
Net (payments) borrowings on our revolving credit facility, term loan and long-term debt obligations | 7.6 | (4.3 | ) | (19.0 | ) | 6.1 | |||||||||
Proceeds from issuance of convertible subordinated notes | — | — | — | 143.7 | |||||||||||
Payment of debt issuance costs related to the convertible subordinated notes | — | — | — | (4.7 | ) | ||||||||||
Payment of loan origination costs related to the credit facility | — | — | (0.6 | ) | (0.8 | ) | |||||||||
Redemption of convertible junior subordinated debentures | — | — | — | (89.7 | ) | ||||||||||
Payments for performance-based stock awards | — | — | — | (16.2 | ) | ||||||||||
Cash used for growth capital expenditures | (1.3 | ) | (3.6 | ) | (4.1 | ) | (16.5 | ) | |||||||
Dividends on common stock | (0.5 | ) | (0.5 | ) | (1.8 | ) | (1.8 | ) | |||||||
Excess tax benefit of equity compensation, net of benefit from Good to Great stock awards | (0.4 | ) | (0.6 | ) | 0.6 | (0.8 | ) | ||||||||
Other investing and financing activities | 0.2 | 0.1 | 0.9 | 1.2 | |||||||||||
Cash at end of period | $ | 1.4 | $ | 0.4 | $ | 1.4 | $ | 0.4 | |||||||
3
ROLLING FOUR QUARTER OUTLOOK RAISED
The Rolling Four Quarter Outlook (“Outlook”) reflects management’s opinion on the performance of our existing portfolio of businesses for the rolling four quarter period ending December 31, 2015, the performance of the trusts, and our view of the activity within the industry acquisition landscape. This Outlook is not intended to be management estimates or forecasts of our future performance, as we believe such precise rolling estimates will be precisely wrong all the time. Rather our intent and goal is to reflect a “roughly right range” most of the time of future Rolling Four Quarter Outlook performance as we execute our Standards Operating, Strategic Acquisition and 4E Leadership Models over time.
ROLLING FOUR QUARTER OUTLOOK – Period Ending December 31, 2015
Range (in millions, except per share amounts) | |
Revenues | $244 - $248 |
Adjusted Consolidated EBITDA | $70 - $72 |
Adjusted Net Income | $28 - $30 |
Adjusted Diluted Earnings Per Share(1) | $1.55 - $1.59 |
Factors affecting our analysis include, among others, number, size and timing of closing of acquisitions, funeral contract volumes, average revenue per funeral service, cemetery interment volumes, preneed cemetery sales, capital expenditures, execution of our funeral and cemetery Standards Operating Model, Strategic Acquisition Model, Withdrawable Trust Income and changes in Federal Reserve monetary policy. Revenues, Adjusted Consolidated EBITDA, Adjusted Net Income and Adjusted Diluted Earnings Per Share for the four quarter period ending December 31, 2015 are expected to improve relative to the same period in the previous period for the following reasons:
• | Increases in Acquired Funeral Revenue and Acquired Funeral Field EBITDA; |
• | Increases in Acquired Cemetery Revenue and Acquired Cemetery Field EBITDA; |
• | Modest increases in Same Store Funeral Revenue and Same Store Funeral Field EBITDA; |
• | Increases in Same Store Cemetery Revenue and Same Store Cemetery Field EBITDA; |
• | Increases in Financial Revenue and Financial EBITDA from trust funds; and |
• | Reduced interest expense in conjunction with the fourth and fifth amendments to our bank credit facilities and the $143.75 2.75% Convertible Notes, including the add-back to Adjusted Diluted EPS of non-tax deductible accretion on the Convertible Notes to reflect the Non-GAAP normalized earning power of the Company. |
(1) | The Rolling Four Quarter Outlook on Adjusted Diluted Earnings Per Share does not include any changes to our fully diluted share count that could occur related to a share price increase and EPS dilution calculations related to our new convertible notes, as explained more fully on page 6 in this press release. |
4
CONFERENCE CALL AND INVESTOR RELATIONS CONTACT
Carriage Services has scheduled a conference call for tomorrow, February 26, 2015 at 9:30 a.m. CT. To participate in the call, please dial 866-516-3867 (ID-67804537) and ask for the Carriage Services conference call. A replay of the conference call will be available through March 2, 2015 and may be accessed by dialing 855-859-2056 (ID-67804537). The conference call will also be available at www.carriageservices.com. For any investor relations questions, please contact Bill Heiligbrodt at 713-332-8553.
TRUST FUND PERFORMANCE
For the year ended December 31, 2014, Carriage’s discretionary trust funds gained 8.3% compared to our 70/30 index benchmark of 5.8%. Over the same period in the discretionary portfolio, the fixed income return was 6.9%, beating the High Yield Index of 2.5% while the equity return was 7.6%, underperforming the S&P 500 at 13.7%. The current yield on Carriage's discretionary fixed income portfolio, which comprises 72% of discretionary trust assets, is 8.5% and the estimated annual income for the discretionary portfolio is approximately $10.8 million.
Shown below are consolidated performance metrics for the combined trust fund portfolios (preneed funeral, cemetery merchandise and services and cemetery perpetual care) at key dates.
Investment Performance | ||||||||||||
Investment Performance(1) | Index Performance | |||||||||||
Discretionary | Total Trust | S&P 500 Stock Index | High Yield Index | 70/30 index Benchmark(2) | ||||||||
1 year ended 12/31/14 | 8.3 | % | 7.9 | % | 13.7 | % | 2.5 | % | 5.8 | % | ||
2 years ended 12/31/14 | 23.8 | % | 22.7 | % | 50.4 | % | 10.1 | % | 22.2 | % | ||
3 years ended 12/31/14 | 48.9 | % | 43.7 | % | 74.5 | % | 27.5 | % | 41.6 | % | ||
4 years ended 12/31/14 | 44.6 | % | 41.0 | % | 78.1 | % | 33.8 | % | 47.1 | % | ||
5 years ended 12/31/14 | 74.5 | % | 66.6 | % | 105.0 | % | 54.1 | % | 69.3 | % | ||
(1) | Investment performance includes realized income and unrealized appreciation (depreciation). |
(2) | The 70/30 Benchmark is 70% weighted to the High Yield Index and 30% weighted to the S&P 500 Stock Index. |
Asset Allocation as of December 31, 2014 (in thousands) | ||||||||||||||
Discretionary Trust Funds | Total Trust Funds | |||||||||||||
Asset Class | MV | % | MV | % | ||||||||||
Cash | $ | 13,628 | 7 | % | $ | 29,366 | 12 | % | ||||||
Equities | 36,232 | 19 | % | 54,035 | 23 | % | ||||||||
Fixed Income | 134,107 | 72 | % | 149,622 | 63 | % | ||||||||
Other/Insurance | 3,386 | 2 | % | 3,629 | 2 | % | ||||||||
Total Portfolios | $ | 187,353 | 100 | % | $ | 236,652 | 100 | % | ||||||
5
CONVERTIBLE NOTES
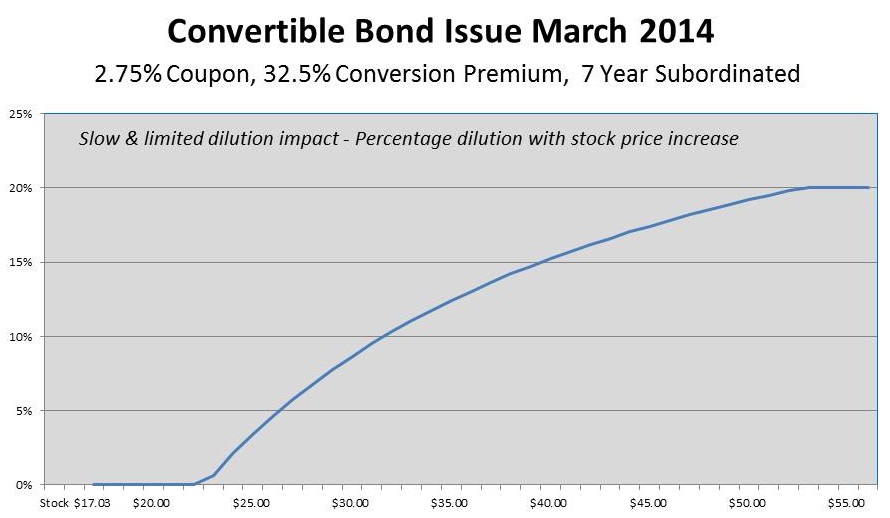
On March 13, 2014, when our common stock closed at $17.03 per share, we executed a new seven year convertible subordinated debenture (new convertible notes) in the amount of $143.75 million with a coupon of 2.75% and 32.5% conversion premium equal to a conversion price of $22.56 per share. We used a majority of the proceeds to refinance a traditional 7% coupon, $90 million convertible security due in 2029 (Tides convertible) with a conversion price of $20.44, which was adding 4.4 million shares to our reported fully diluted EPS calculation (24% dilution) when our stock price traded “in the money” above $20.44 even though none of these securities were ever converted into common stock.
In most traditional convertible securities issued prior to the last ten years (including in our refinanced Tides security issued in 1999), full dilution kicks in to the calculation of EPS once the stock price rises above the conversion price (in the money). That will not be the case with our new convertible notes because of highly favorable anti-dilution features (net share settlement). The in the money option value can be settled in cash using any form of financing at our discretion, meaning that depending on the amount of net share settlement need at any time and the financing method selected by management, the actual number of new shares outstanding in the future may differ materially from the technical calculation of EPS pursuant to the share count mechanics of the new convertible notes.
While the mechanics of the in the money payment features on our new convertible notes are somewhat complex, the main points are that dilution is restricted to under 20% of outstanding shares as of the March 19, 2014 issue date (about 3.6 million shares). The new convertible notes become eligible for conversion at $29.33 per share and reach the maximum potential 20% dilution at a price of $54 per share, as the New York Stock Exchange rules restrict the maximum dilution of an unregistered convertible to 20% for any listed member such as Carriage.
We had about 18 million fully diluted shares outstanding when the new convertible notes were issued in March 2014, so it is easy using the chart below to determine the EPS share count dilution calculation as our share price increases over time. For example, at a share price of $26, the threshold of 5% dilution is reached, so 5% of 18 million or 900,000 shares are added to the weighted average number of fully diluted shares for the period whose EPS performance is covered. Likewise, a share price of $32 triggers the 10% dilution threshold or 1.8 million added shares, a share price of $40 triggers the 15% dilution threshold or 2.7 million additional shares, and a $54 share price triggers the 20% dilution maximum threshold adding 3.6 million shares to our EPS calculation for the EPS period covered.
6
CARRIAGE SERVICES, INC. | |||||||||||||||||
OPERATING AND FINANCIAL TREND REPORT | |||||||||||||||||
FROM CONTINUING OPERATIONS (IN THOUSANDS - EXCEPT PER SHARE AMOUNTS) | |||||||||||||||||
Three Months Ended December 31, | Twelve Months Ended December 31, | ||||||||||||||||
2013 | 2014 | % Change | 2013 | 2014 | % Change | ||||||||||||
Same Store Contracts | |||||||||||||||||
Atneed Contracts | 4,400 | 4,578 | 4.0 | % | 18,149 | 18,133 | -0.1 | % | |||||||||
Preneed Contracts | 1,188 | 1,193 | 0.4 | % | 4,908 | 4,641 | -5.4 | % | |||||||||
Total Same Store Funeral Contracts | 5,588 | 5,771 | 3.3 | % | 23,057 | 22,774 | -1.2 | % | |||||||||
Acquisition Contracts | |||||||||||||||||
Atneed Contracts | 1,513 | 2,079 | 37.4 | % | 5,689 | 7,260 | 27.6 | % | |||||||||
Preneed Contracts | 280 | 387 | 38.2 | % | 1,108 | 1,368 | 23.5 | % | |||||||||
Total Acquisition Funeral Contracts | 1,793 | 2,466 | 37.5 | % | 6,797 | 8,628 | 26.9 | % | |||||||||
Total Funeral Contracts | 7,381 | 8,237 | 11.6 | % | 29,854 | 31,402 | 5.2 | % | |||||||||
Funeral Operating Revenue | |||||||||||||||||
Same Store Revenue | $ | 29,563 | $ | 30,619 | 3.6 | % | $ | 120,191 | $ | 119,322 | -0.7 | % | |||||
Acquisition Revenue | 8,880 | 12,841 | 44.6 | % | 33,660 | 44,930 | 33.5 | % | |||||||||
Total Funeral Operating Revenue | $ | 38,443 | $ | 43,460 | 13.1 | % | $ | 153,851 | $ | 164,252 | 6.8 | % | |||||
Cemetery Operating Revenue | |||||||||||||||||
Same Store Revenue | $ | 9,695 | $ | 10,624 | 9.6 | % | $ | 40,181 | $ | 41,257 | 2.7 | % | |||||
Acquisition Revenue | 66 | 565 | 756.1 | % | 298 | 1,599 | 436.6 | % | |||||||||
Total Cemetery Operating Revenue | $ | 9,761 | $ | 11,189 | 14.6 | % | $ | 40,479 | $ | 42,856 | 5.9 | % | |||||
Financial Revenue | |||||||||||||||||
Preneed Funeral Commission Income | $ | 418 | $ | 400 | -4.3 | % | $ | 1,853 | $ | 2,036 | 9.9 | % | |||||
Preneed Funeral Trust Earnings | 1,794 | 1,949 | 8.6 | % | 7,378 | 7,447 | 0.9 | % | |||||||||
Cemetery Trust Earnings | 1,875 | 2,051 | 9.4 | % | 8,095 | 8,123 | 0.3 | % | |||||||||
Preneed Cemetery Finance Charges | 348 | 370 | 6.3 | % | 1,418 | 1,410 | -0.6 | % | |||||||||
Total Financial Revenue | $ | 4,435 | $ | 4,770 | 7.6 | % | $ | 18,744 | $ | 19,016 | 1.5 | % | |||||
Total Revenue | $ | 52,639 | $ | 59,419 | 12.9 | % | $ | 213,074 | $ | 226,124 | 6.1 | % | |||||
Field EBITDA | |||||||||||||||||
Same Store Funeral Field EBITDA | $ | 10,004 | $ | 12,050 | 20.5 | % | $ | 44,973 | $ | 44,756 | -0.5 | % | |||||
Same Store Funeral Field EBITDA Margin | 33.8 | % | 39.4 | % | 560 bp | 37.4 | % | 37.5 | % | 10 bp | |||||||
Acquisition Funeral Field EBITDA | 2,743 | 4,711 | 71.7 | % | 10,486 | 15,718 | 49.9 | % | |||||||||
Acquisition Funeral Field EBITDA Margin | 30.9 | % | 36.7 | % | 580 bp | 31.2 | % | 35.0 | % | 380 bp | |||||||
Total Funeral Field EBITDA | $ | 12,747 | $ | 16,761 | 31.5 | % | $ | 55,459 | $ | 60,474 | 9.0 | % | |||||
Total Funeral Field EBITDA Margin | 33.2 | % | 38.6 | % | 540 bp | 36.0 | % | 36.8 | % | 80 bp | |||||||
Same Store Cemetery Field EBITDA | $ | 2,684 | $ | 3,290 | 22.6 | % | $ | 11,757 | $ | 11,845 | 0.7 | % | |||||
Same Store Cemetery Field EBITDA Margin | 27.7 | % | 31.0 | % | 330 bp | 29.3 | % | 28.7 | % | -60 bp | |||||||
Acquisition Cemetery Field EBITDA | (10 | ) | 112 | 1,220.0 | % | (43 | ) | 351 | 916.3 | % | |||||||
Acquisition Cemetery Field EBITDA Margin | -15.2 | % | 19.8 | % | 3,500 bp | -14.4 | % | 22.0 | % | 3,640 bp | |||||||
Total Cemetery Field EBITDA | $ | 2,674 | $ | 3,402 | 27.2 | % | $ | 11,714 | $ | 12,196 | 4.1 | % | |||||
Total Cemetery Field EBITDA Margin | 27.4 | % | 30.4 | % | 300 bp | 28.9 | % | 28.5 | % | -40 bp | |||||||
Funeral Financial EBITDA | $ | 1,958 | $ | 2,041 | 4.2 | % | $ | 7,966 | $ | 8,348 | 4.8 | % | |||||
Cemetery Financial EBITDA | 2,179 | 2,358 | 8.2 | % | 9,338 | 9,341 | — | % | |||||||||
Total Financial EBITDA | $ | 4,137 | $ | 4,399 | 6.3 | % | $ | 17,304 | $ | 17,689 | 2.2 | % | |||||
Total Financial EBITDA Margin | 93.3 | % | 92.2 | % | -110 bp | 92.3 | % | 93.0 | % | 70 bp | |||||||
Total Field EBITDA | $ | 19,558 | $ | 24,562 | 25.6 | % | $ | 84,477 | $ | 90,359 | 7.0 | % | |||||
Total Field EBITDA Margin | 37.2 | % | 41.3 | % | 410 bp | 39.6 | % | 40.0 | % | 40 bp | |||||||
7
OPERATING AND FINANCIAL TREND REPORT | |||||||||||||||||
FROM CONTINUING OPERATIONS (IN THOUSANDS - EXCEPT PER SHARE AMOUNTS) | |||||||||||||||||
Three Months Ended December 31, | Twelve Months Ended December 31, | ||||||||||||||||
2013 | 2014 | % Change | 2013 | 2014 | % Change | ||||||||||||
Overhead | |||||||||||||||||
Total Variable Overhead | $ | 1,944 | $ | 2,425 | 24.7 | % | $ | 8,845 | $ | 10,764 | 21.7 | % | |||||
Total Regional Fixed Overhead | 538 | 758 | 40.9 | % | 3,346 | 3,136 | -6.3 | % | |||||||||
Total Corporate Fixed Overhead | 4,819 | 4,902 | 1.7 | % | 20,829 | 20,227 | -2.9 | % | |||||||||
Total Overhead | $ | 7,301 | $ | 8,085 | 10.7 | % | $ | 33,020 | $ | 34,127 | 3.4 | % | |||||
Overhead as a percent of sales | 13.9 | % | 13.6 | % | -30 bp | 15.5 | % | 15.1 | % | -40 bp | |||||||
Consolidated EBITDA | $ | 12,257 | $ | 16,477 | 34.4 | % | $ | 51,457 | $ | 56,232 | 9.3 | % | |||||
Consolidated EBITDA Margin | 23.3 | % | 27.7 | % | 440 bp | 24.1 | % | 24.9 | % | 80 bp | |||||||
Other Expenses and Interest | |||||||||||||||||
Property Depreciation & Amortization | $ | 2,823 | $ | 3,142 | 11.3 | % | $ | 11,635 | $ | 11,923 | 2.5 | % | |||||
Non Cash Stock Compensation | 617 | 920 | 49.1 | % | 2,916 | 3,832 | 31.4 | % | |||||||||
Interest Expense | 3,066 | 2,593 | -15.4 | % | 13,437 | 10,308 | -23.3 | % | |||||||||
Accretion on Convertible Subordinated Notes | — | 805 | — | 2,452 | |||||||||||||
Loss on Early Extinguishment of Debt | — | — | — | 1,042 | |||||||||||||
Loss on Redemption of Convertible Junior Subordinated Debentures | — | — | — | 3,779 | |||||||||||||
Other, Net | — | 571 | (896 | ) | 195 | -121.8 | % | ||||||||||
Pretax Income | $ | 5,751 | $ | 8,446 | 46.9 | % | $ | 24,365 | $ | 22,701 | -6.8 | % | |||||
Net Tax Provision | 1,519 | 3,079 | 9,245 | 7,255 | |||||||||||||
GAAP Net Income | $ | 4,232 | $ | 5,367 | 26.8 | % | $ | 15,120 | $ | 15,446 | 2.2 | % | |||||
Special Items, Net of tax except for ** | |||||||||||||||||
Withdrawable Trust Income | $ | 281 | $ | 198 | $ | 960 | $ | 1,181 | |||||||||
Acquisition and Divestiture Expenses | 246 | 49 | 496 | 764 | |||||||||||||
Severance Costs | 105 | 101 | 965 | 697 | |||||||||||||
Consulting Fees | 90 | 41 | 368 | 277 | |||||||||||||
Other Incentive Compensation | — | — | — | 660 | |||||||||||||
Accretion on Convertible Subordinated Notes ** | — | 805 | — | 2,452 | |||||||||||||
Costs Related to Credit Facility | — | — | 248 | 688 | |||||||||||||
Loss on Redemption of Convertible Junior Subordinated Debentures | — | — | — | 2,493 | |||||||||||||
Loss (Gain) on Asset Purchase | — | 379 | — | (367 | ) | ||||||||||||
Securities Transaction Expenses | — | — | 160 | — | |||||||||||||
Other Special Items | — | — | (484 | ) | 503 | ||||||||||||
Tax Adjustment from Prior Period ** | (338 | ) | — | 260 | — | ||||||||||||
Sum of Special Items, Net of tax | $ | 384 | $ | 1,573 | 309.6 | % | $ | 2,973 | $ | 9,348 | 214.4 | % | |||||
Adjusted Net Income | $ | 4,616 | $ | 6,940 | 50.3 | % | $ | 18,093 | $ | 24,794 | 37.0 | % | |||||
Adjusted Net Profit Margin | 8.8 | % | 11.7 | % | 290 bp | 8.5 | % | 11.0 | % | 250 bp | |||||||
Adjusted Basic Earnings Per Share | $ | 0.25 | $ | 0.38 | 52.0 | % | $ | 1.00 | $ | 1.35 | 35.0 | % | |||||
Adjusted Diluted Earnings Per Share | $ | 0.25 | $ | 0.38 | 52.0 | % | $ | 0.98 | $ | 1.34 | 36.7 | % | |||||
GAAP Basic Earnings Per Share | $ | 0.23 | $ | 0.29 | 26.1 | % | $ | 0.83 | $ | 0.84 | 1.2 | % | |||||
GAAP Diluted Earnings Per Share | $ | 0.23 | $ | 0.29 | 26.1 | % | $ | 0.82 | $ | 0.83 | 1.2 | % | |||||
Effective Tax Rate | 26.4 | % | 36.5 | % | 37.9 | % | 32.0 | % | |||||||||
Reconciliation to Adjusted Consolidated EBITDA | |||||||||||||||||
Consolidated EBITDA | $ | 12,257 | $ | 16,477 | 34.4 | % | $ | 51,457 | $ | 56,232 | 9.3 | % | |||||
Withdrawable Trust Income | 426 | 300 | 1,454 | 1,788 | |||||||||||||
Acquisition and Divestiture Expenses | 372 | 74 | 752 | 1,158 | |||||||||||||
Severance Costs | 158 | 153 | 1,462 | 1,056 | |||||||||||||
Consulting Fees | 136 | 62 | 557 | 419 | |||||||||||||
Securities Transaction Expenses | — | — | 242 | — | |||||||||||||
Other Incentive Compensation | — | — | — | 1,000 | |||||||||||||
Other Special Items | — | — | 83 | — | |||||||||||||
Adjusted Consolidated EBITDA | $ | 13,349 | $ | 17,066 | 27.8 | % | $ | 56,007 | $ | 61,653 | 10.1 | % | |||||
Adjusted Consolidated EBITDA Margin | 25.4 | % | 28.7 | % | 330 bp | 26.3 | % | 27.3 | % | 100 bp | |||||||
8
CARRIAGE SERVICES, INC.
CONDENSED CONSOLIDATED BALANCE SHEETS
(in thousands)
December 31, | |||||||
2013 | 2014 | ||||||
ASSETS | |||||||
Current assets: | |||||||
Cash and cash equivalents | $ | 1,377 | $ | 413 | |||
Accounts receivable, net | 17,950 | 19,264 | |||||
Assets held for sale | 3,544 | — | |||||
Inventories | 5,300 | 5,294 | |||||
Prepaid expenses | 4,421 | 4,590 | |||||
Other current assets | 3,525 | 7,144 | |||||
Total current assets | 36,117 | 36,705 | |||||
Preneed cemetery trust investments | 68,341 | 71,972 | |||||
Preneed funeral trust investments | 97,144 | 97,607 | |||||
Preneed receivables, net | 24,521 | 26,284 | |||||
Receivables from preneed trusts | 11,166 | 12,809 | |||||
Property, plant and equipment, net | 160,690 | 186,211 | |||||
Cemetery property | 72,911 | 75,564 | |||||
Goodwill | 221,087 | 257,442 | |||||
Deferred charges and other non-current assets | 12,280 | 14,264 | |||||
Cemetery perpetual care trust investments | 42,342 | 48,670 | |||||
Total assets | $ | 746,599 | $ | 827,528 | |||
LIABILITIES AND STOCKHOLDERS’ EQUITY | |||||||
Current liabilities: | |||||||
Current portion of long-term debt and capital lease obligations | $ | 13,424 | $ | 9,838 | |||
Accounts payable | 7,046 | 6,472 | |||||
Other liabilities | 9,939 | 1,437 | |||||
Accrued liabilities | 12,854 | 15,203 | |||||
Liabilities associated with assets held for sale | 4,357 | — | |||||
Total current liabilities | 47,620 | 32,950 | |||||
Long-term debt, net of current portion | 105,642 | 111,887 | |||||
Revolving credit facility | 36,900 | 40,500 | |||||
Convertible junior subordinated debentures due in 2029 to an affiliate | 89,770 | — | |||||
Convertible subordinated notes due 2021 | — | 114,542 | |||||
Obligations under capital leases, net of current portion | 3,786 | 3,098 | |||||
Deferred preneed cemetery revenue | 55,479 | 56,875 | |||||
Deferred preneed funeral revenue | 30,588 | 31,265 | |||||
Deferred tax liability | 11,915 | 36,414 | |||||
Other long-term liabilities | 1,548 | 2,401 | |||||
Deferred preneed cemetery receipts held in trust | 68,341 | 71,972 | |||||
Deferred preneed funeral receipts held in trust | 97,144 | 97,607 | |||||
Care trusts’ corpus | 41,893 | 48,142 | |||||
Total liabilities | 590,626 | 647,653 | |||||
Commitments and contingencies: | |||||||
Stockholders’ equity: | |||||||
Common stock, $.01 par value; 80,000,000 shares authorized; 22,183,000 and 22,434,000 issued as of December 31, 2013 and 2014, respectively | 222 | 224 | |||||
Additional paid-in capital | 204,324 | 212,386 | |||||
Accumulated deficit | (33,306 | ) | (17,468 | ) | |||
Treasury stock, at cost; 3,922,000 shares at December 31, 2013 and 2014 | (15,267 | ) | (15,267 | ) | |||
Total stockholders’ equity | 155,973 | 179,875 | |||||
Total liabilities and stockholders’ equity | $ | 746,599 | $ | 827,528 | |||
9
CARRIAGE SERVICES, INC.
CONDENSED CONSOLIDATED STATEMENTS OF OPERATIONS
(in thousands, except share and per share data)
(unaudited) | |||||||||||||||
For the Three Months Ended December 31, | For the Twelve Months Ended December 31, | ||||||||||||||
2013 | 2014 | 2013 | 2014 | ||||||||||||
Revenues | $ | 52,639 | $ | 59,419 | $ | 213,074 | $ | 226,124 | |||||||
Field costs and expenses | 38,239 | 40,492 | 148,789 | 156,116 | |||||||||||
Gross profit | $ | 14,400 | $ | 18,927 | $ | 64,285 | $ | 70,008 | |||||||
General and administrative expenses | 5,583 | 6,512 | 27,379 | 30,293 | |||||||||||
Operating income | $ | 8,817 | $ | 12,415 | $ | 36,906 | $ | 39,715 | |||||||
Interest expense, net | (3,066 | ) | (2,593 | ) | (12,622 | ) | (10,308 | ) | |||||||
Accretion of discount on convertible subordinated notes | — | (805 | ) | — | (2,452 | ) | |||||||||
Loss on early extinguishment of debt and other costs | — | — | — | (1,042 | ) | ||||||||||
Loss on redemption of convertible junior subordinated debentures | — | — | — | (3,779 | ) | ||||||||||
Other, net | — | (571 | ) | 81 | 567 | ||||||||||
Income from continuing operations before income taxes | $ | 5,751 | $ | 8,446 | $ | 24,365 | $ | 22,701 | |||||||
Net provision for income taxes | (1,519 | ) | (3,079 | ) | (9,245 | ) | (7,255 | ) | |||||||
Net income from continuing operations | $ | 4,232 | $ | 5,367 | $ | 15,120 | $ | 15,446 | |||||||
Net income (loss) from discontinued operations, net of tax | (233 | ) | 11 | 4,176 | 392 | ||||||||||
Net income | $ | 3,999 | $ | 5,378 | $ | 19,296 | $ | 15,838 | |||||||
Preferred stock dividend | — | — | (4 | ) | — | ||||||||||
Net income available to common stockholders | $ | 3,999 | $ | 5,378 | $ | 19,292 | $ | 15,838 | |||||||
Basic earnings per common share: | |||||||||||||||
Continuing operations | $ | 0.23 | $ | 0.29 | $ | 0.83 | $ | 0.84 | |||||||
Discontinued operations | (0.01 | ) | — | 0.23 | 0.02 | ||||||||||
Basic earnings per common share | $ | 0.22 | $ | 0.29 | $ | 1.06 | $ | 0.86 | |||||||
Diluted earnings per common share: | |||||||||||||||
Continuing operations | $ | 0.23 | $ | 0.29 | $ | 0.82 | $ | 0.83 | |||||||
Discontinued operations | (0.01 | ) | — | 0.18 | 0.02 | ||||||||||
Diluted earnings per common share | $ | 0.22 | $ | 0.29 | $ | 1.00 | $ | 0.85 | |||||||
Dividends declared per common share | $ | 0.025 | $ | 0.025 | $ | 0.100 | $ | 0.100 | |||||||
Weighted average number of common and common equivalent shares outstanding: | |||||||||||||||
Basic | 17,920 | 18,170 | 17,826 | 18,108 | |||||||||||
Diluted | 22,488 | 18,358 | 22,393 | 18,257 | |||||||||||
The GAAP Diluted EPS and Adjusted Diluted EPS for the three and twelve months ended December 31, 2013 includes 4.4 million shares that would be issued upon conversion of our convertible subordinated debentures (TIDES) as a result of the if-converted method prescribed by accounting standards.
On August 1, 2014, we received notification that the Internal Revenue Service completed its examination of our tax year ended December 31, 2011 citing no change. As a result, we have re-measured our tax liability for unrecognized tax benefits related to personal goodwill which resulted in a tax benefit recognized of $1.7 million and an increase to Deferred tax liability of $5.6 million. The tax benefit reduced the effective tax rate for the year ended December 31, 2014. Additionally, we recognized a credit to interest expense of $0.6 million related to the settled portion of the uncertain tax position.
10
CARRIAGE SERVICES, INC.
CONSOLIDATED STATEMENTS OF CASH FLOWS
(in thousands)
For the Years Ended December 31, | ||||||||
2013 | 2014 | |||||||
Cash flows from operating activities: | ||||||||
Net income | $ | 19,296 | $ | 15,838 | ||||
Adjustments to reconcile net income to net cash provided by operating activities: | ||||||||
Depreciation and amortization | 11,748 | 11,945 | ||||||
Gain on sale of businesses and purchase of assets | (6,091 | ) | (2,150 | ) | ||||
Impairment of goodwill | 100 | 1,180 | ||||||
Loss on early extinguishment of debt and other costs | — | 1,042 | ||||||
Amortization of deferred financing costs | 362 | 908 | ||||||
Accretion of discount on convertible subordinated notes | — | 2,452 | ||||||
Provision for losses on accounts receivable | 2,005 | 2,877 | ||||||
Stock-based compensation expense | 3,583 | 4,622 | ||||||
Deferred income tax expense | 12,572 | 5,295 | ||||||
Loss on redemption of convertible junior subordinated debentures | — | 2,932 | ||||||
Other | 85 | — | ||||||
Changes in operating assets and liabilities that provided (required) cash: | ||||||||
Accounts and preneed receivables | (3,329 | ) | (4,146 | ) | ||||
Inventories and other current assets | (337 | ) | (2,590 | ) | ||||
Deferred charges and other | (35 | ) | (165 | ) | ||||
Preneed funeral and cemetery trust investments | (1,415 | ) | (203 | ) | ||||
Accounts payable | 1,142 | (562 | ) | |||||
Accrued and other liabilities | (3,294 | ) | (1,529 | ) | ||||
Deferred preneed funeral and cemetery revenue | 1,187 | 303 | ||||||
Deferred preneed funeral and cemetery receipts held in trust | 2,266 | (1,484 | ) | |||||
Net cash provided by operating activities | 39,845 | 36,565 | ||||||
Cash flows from investing activities: | ||||||||
Acquisitions and land for new construction | (19,701 | ) | (57,874 | ) | ||||
Net proceeds from sale of businesses and other assets | 10,184 | 2,192 | ||||||
Capital expenditures | (10,695 | ) | (23,675 | ) | ||||
Net cash used in investing activities | (20,212 | ) | (79,357 | ) | ||||
Cash flows from financing activities: | ||||||||
Net borrowings (payments) on the revolving credit facility | (7,800 | ) | 3,600 | |||||
Net borrowings on the term loan | — | 3,313 | ||||||
Proceeds from the issuance of convertible subordinated notes | — | 143,750 | ||||||
Payment of debt issuance costs related to the convertible subordinated notes | — | (4,650 | ) | |||||
Payments on long-term debt and obligations under capital leases | (11,219 | ) | (840 | ) | ||||
Redemption of convertible junior subordinated debentures | — | (89,748 | ) | |||||
Payments for performance-based stock awards | — | (16,150 | ) | |||||
Proceeds from the exercise of stock options and employee stock purchase plan contributions | 894 | 1,228 | ||||||
Dividends on common stock | (1,817 | ) | (1,840 | ) | ||||
Dividends on redeemable preferred stock | (4 | ) | — | |||||
Payment of loan origination costs | (621 | ) | (825 | ) | ||||
Excess tax benefit of equity compensation | 613 | 3,990 | ||||||
Net cash provided by (used in) financing activities | (19,954 | ) | 41,828 | |||||
Net decrease in cash and cash equivalents | (321 | ) | (964 | ) | ||||
Cash and cash equivalents at beginning of year | 1,698 | 1,377 | ||||||
Cash and cash equivalents at end of year | $ | 1,377 | $ | 413 | ||||
11
CARRIAGE SERVICES, INC.
CALCULATION OF EARNINGS PER SHARE
(in thousands, except share and per share data)
Year Ended December 31, | |||||||
2013 | 2014 | ||||||
Numerator for basic earnings per share: | |||||||
Numerator from continuing operations | |||||||
Income from continuing operations | $ | 15,120 | $ | 15,446 | |||
Less: Earnings allocated to unvested restricted stock | (314 | ) | (295 | ) | |||
Income attributable to continuing operations | $ | 14,806 | $ | 15,151 | |||
Numerator from discontinued operations | |||||||
Income from discontinued operations | $ | 4,176 | $ | 392 | |||
Less: Earnings allocated to unvested restricted stock | (85 | ) | (8 | ) | |||
Income attributable to discontinued operations | $ | 4,091 | $ | 384 | |||
Numerator for diluted earnings per share: | |||||||
Adjustment for diluted earnings per share: | |||||||
Interest on convertible junior subordinated debentures, net of tax | 3,454 | — | |||||
$ | 3,454 | $ | — | ||||
Income attributable to continuing operations | $ | 18,260 | $ | 15,151 | |||
Income attributable to discontinuing operations | $ | 4,091 | $ | 384 | |||
Denominator | |||||||
Denominator for basic earnings per common share - weighted average shares outstanding | 17,826 | 18,108 | |||||
Effect of dilutive securities: | |||||||
Stock options | 175 | 149 | |||||
Convertible junior subordinated debentures | 4,392 | — | |||||
Denominator for diluted earnings per common share - weighted average shares outstanding | 22,393 | 18,257 | |||||
Basic earnings per common share: | |||||||
Continuing operations | $ | 0.83 | $ | 0.84 | |||
Discontinued operations | 0.23 | 0.02 | |||||
Basic earnings per common share | $ | 1.06 | $ | 0.86 | |||
Diluted earnings per common share: | |||||||
Continuing operations | $ | 0.82 | $ | 0.83 | |||
Discontinued operations | 0.18 | 0.02 | |||||
Diluted earnings per common share | $ | 1.00 | $ | 0.85 | |||
12
NON-GAAP FINANCIAL MEASURES
This press release uses Non-GAAP financial measures to present the financial performance of the Company. Non-GAAP financial measures should be viewed in addition to, and not as an alternative for, the Company’s reported operating results or cash flow from operations or any other measure of performance as determined in accordance with GAAP. We believe the Non-GAAP results are useful to investors because such results help investors compare our results to previous periods and provide insights into underlying trends in our business. The Company’s GAAP financial statements accompany this release. Reconciliations of the Non-GAAP financial measures to GAAP measures are provided in this press release.
The Non-GAAP financial measures include “Adjusted Net Income”, “Adjusted Basic Earnings Per Share”, “Adjusted Diluted Earnings Per Share”, “Consolidated EBITDA”, “Adjusted Consolidated EBITDA”, “Adjusted Free Cash Flow”, “Funeral, Cemetery and Financial EBITDA”, “Total Field EBITDA” and “Special Items” in this press release. These financial measurements are defined as similar GAAP items adjusted for Special Items and are reconciled to GAAP in this press release. In addition, the Company’s presentation of these measures may not be comparable to similarly titled measures in other companies’ reports. The definitions used by the Company for our internal management purposes and in this press release are as follows:
• | Adjusted Net Income is defined as net income from continuing operations plus adjustments for special items and other non-recurring expenses or credits. |
• | Consolidated EBITDA is defined as net income from continuing operations before income taxes, interest expenses, non-cash stock compensation, depreciation and amortization, and interest income and other, net. |
• | Adjusted Consolidated EBITDA is defined as Consolidated EBITDA plus adjustments for special items and non-recurring expenses or credits. |
• | Adjusted Free Cash Flow is defined as net cash provided by operations, adjusted by special items as deemed necessary, less cash for maintenance capital expenditures. |
• | Funeral Field EBITDA is defined as Funeral Gross Profit less depreciation and amortization, regional and unallocated overhead expenses and net financial income. |
• | Cemetery Field EBITDA is defined as Cemetery Gross Profit less depreciation and amortization, regional and unallocated overhead expenses and net financial income. |
• | Financial EBITDA is defined as Financial Revenue less Financial Expenses. |
• | Total Field EBITDA is defined as Gross Profit less depreciation and amortization, regional and unallocated overhead expenses. |
• | Special Items is defined as charges or credits that are deemed as Non-GAAP items such as withdrawable trust income, acquisition and divestiture expenses, severance costs, loss on early retirement of debt and other costs, discrete tax items and other non-recurring amounts. Special items are taxed at the federal statutory rate of 34 percent for the three and twelve months ended December 31, 2013 and 2014, except for the accretion of the discount on Convertible Notes as this is a non-tax deductible item and the tax adjustment from prior period. |
• | Adjusted Basic Earnings Per Share is defined as GAAP Basic Earnings Per Share, adjusted for special items. |
• | Adjusted Diluted Earnings Per Share is defined as GAAP Diluted Earnings Per Share, adjusted for special items. |
Certain state regulations allow the withdrawal of financial income from preneed cemetery merchandise and services trust funds when realized in the trust. Under current generally accepted accounting principles, trust income is only recognized in the Company’s financial statements at a later time when the related merchandise and services sold on the preneed contract is delivered at the time of death. Carriage has provided financial income from the trusts, termed “Withdrawable Trust Income” and reported on a Non-GAAP proforma basis within Special Items in the accompanying Operating and Financial Trend Report (a Non-GAAP Unaudited Income Statement), to reflect the current cash results. Management believes that the Withdrawable Trust Income provides useful information to investors because it presents income and cash flow when earned by the trusts.
13
Reconciliation of Non-GAAP Financial Measures:
This press release includes the use of certain financial measures that are not GAAP measures. The Non-GAAP financial measures are presented for additional information and are reconciled to their most comparable GAAP measures below.
Reconciliation of Net Income from continuing operations to Adjusted Net Income for the three and twelve months ended December 31, 2013 and 2014 (in thousands):
Three Months Ended December 31, | Twelve Months Ended December 31, | ||||||||||||||
2013 | 2014 | 2013 | 2014 | ||||||||||||
Net Income from continuing operations | $ | 4,232 | $ | 5,367 | $ | 15,120 | $ | 15,446 | |||||||
Special items, net of tax except for ** | |||||||||||||||
Withdrawable Trust Income | 281 | 198 | 960 | 1,181 | |||||||||||
Acquisition and Divestiture Expenses | 246 | 49 | 496 | 764 | |||||||||||
Severance Costs | 105 | 101 | 965 | 697 | |||||||||||
Consulting Fees | 90 | 41 | 368 | 277 | |||||||||||
Other Incentive Compensation | — | — | — | 660 | |||||||||||
Securities Transaction Expenses | — | — | 160 | — | |||||||||||
Accretion of Discount on Convertible Subordinated Notes ** | — | 805 | — | 2,452 | |||||||||||
Costs Related to the Credit Facility | — | — | 248 | 688 | |||||||||||
Loss on Redemption of Convertible Junior Subordinated Debentures | — | — | — | 2,493 | |||||||||||
Loss (gain) on Asset Purchase | — | 379 | — | (367 | ) | ||||||||||
Other Special Items | — | — | (484 | ) | 503 | ||||||||||
Tax Adjustment from Prior Period ** | (338 | ) | — | 260 | — | ||||||||||
Total Special items affecting net income | $ | 384 | $ | 1,573 | $ | 2,973 | $ | 9,348 | |||||||
Adjusted Net Income | $ | 4,616 | $ | 6,940 | $ | 18,093 | $ | 24,794 | |||||||
14
Reconciliation of Net Income from continuing operations to Consolidated EBITDA and Adjusted Consolidated EBITDA for the three and twelve months ended December 31, 2013 and 2014 (in thousands):
Three Months Ended December 31, | Twelve Months Ended December 31, | ||||||||||||||
2013 | 2014 | 2013 | 2014 | ||||||||||||
Net income from continuing operations | $ | 4,232 | $ | 5,367 | $ | 15,120 | $ | 15,446 | |||||||
Net provision for income taxes | 1,519 | 3,079 | 9,245 | 7,255 | |||||||||||
Pre-tax earnings from continuing operations | $ | 5,751 | $ | 8,446 | $ | 24,365 | $ | 22,701 | |||||||
Interest expense | 3,066 | 2,593 | 13,437 | 10,308 | |||||||||||
Accretion of discount on convertible subordinated notes | — | 805 | — | 2,452 | |||||||||||
Loss on early extinguishment of debt and other costs | — | — | — | 1,042 | |||||||||||
Loss on redemption of convertible junior subordinated debentures | — | — | — | 3,779 | |||||||||||
Non-cash stock compensation | 617 | 920 | 2,916 | 3,832 | |||||||||||
Depreciation & amortization | 2,823 | 3,142 | 11,635 | 11,923 | |||||||||||
Other, net | — | 571 | (896 | ) | 195 | ||||||||||
Consolidated EBITDA | $ | 12,257 | $ | 16,477 | $ | 51,457 | $ | 56,232 | |||||||
Adjusted For: | |||||||||||||||
Withdrawable Trust Income | $ | 426 | $ | 300 | $ | 1,454 | $ | 1,788 | |||||||
Acquisition and Divestiture Expenses | 372 | 74 | 752 | 1,158 | |||||||||||
Severance Costs | 158 | 153 | 1,462 | 1,056 | |||||||||||
Consulting Fees | 136 | 62 | 557 | 419 | |||||||||||
Other Incentive Compensation | — | — | — | 1,000 | |||||||||||
Securities Transaction Expenses | — | — | 242 | — | |||||||||||
Other Special Items | — | — | 83 | — | |||||||||||
Adjusted Consolidated EBITDA | $ | 13,349 | $ | 17,066 | $ | 56,007 | $ | 61,653 | |||||||
Revenue | $ | 52,639 | $ | 59,419 | $ | 213,074 | $ | 226,124 | |||||||
Adjusted Consolidated EBITDA Margin | 25.4 | % | 28.7 | % | 26.3 | % | 27.3 | % | |||||||
15
Reconciliation of funeral and cemetery income before income taxes to Field EBITDA for the three and twelve months ended December 31, 2013 and 2014 (in thousands):
Funeral Field EBITDA | Three Months Ended December 31, | Twelve Months Ended December 31, | |||||||||||||
2013 | 2014 | 2013 | 2014 | ||||||||||||
Gross Profit (GAAP) | $ | 11,057 | $ | 14,537 | $ | 48,874 | $ | 54,102 | |||||||
Depreciation & amortization | 1,771 | 1,782 | 6,440 | 6,841 | |||||||||||
Regional & unallocated costs | 1,877 | 2,483 | 8,111 | 7,879 | |||||||||||
Net financial income | (1,958 | ) | (2,041 | ) | (7,966 | ) | (8,348 | ) | |||||||
Funeral Field EBITDA | $ | 12,747 | $ | 16,761 | $ | 55,459 | $ | 60,474 | |||||||
Funeral Field Operating Revenue | $ | 38,443 | $ | 43,460 | $ | 153,851 | $ | 164,252 | |||||||
Funeral Field EBITDA Margin | 33.2 | % | 38.6 | % | 36.0 | % | 36.8 | % | |||||||
Cemetery Field EBITDA | Three Months Ended December 31, | Twelve Months Ended December 31, | |||||||||||||
2013 | 2014 | 2013 | 2014 | ||||||||||||
Gross Profit (GAAP) | $ | 3,343 | $ | 4,390 | $ | 15,411 | $ | 15,906 | |||||||
Depreciation & amortization | 1,166 | 1,019 | 3,739 | 3,704 | |||||||||||
Regional & unallocated costs | 344 | 351 | 1,902 | 1,927 | |||||||||||
Net financial income | (2,179 | ) | (2,358 | ) | (9,338 | ) | (9,341 | ) | |||||||
Cemetery Field EBITDA | $ | 2,674 | $ | 3,402 | $ | 11,714 | $ | 12,196 | |||||||
Cemetery Field Operating Revenue | $ | 9,761 | $ | 11,189 | $ | 40,479 | $ | 42,856 | |||||||
Cemetery Field EBITDA Margin | 27.4 | % | 30.4 | % | 28.9 | % | 28.5 | % | |||||||
Total Field EBITDA | Three Months Ended December 31, | Twelve Months Ended December 31, | |||||||||||||
2013 | 2014 | 2013 | 2014 | ||||||||||||
Funeral Field EBITDA | $ | 12,747 | $ | 16,761 | $ | 55,459 | $ | 60,474 | |||||||
Cemetery Field EBITDA | 2,674 | 3,402 | 11,714 | 12,196 | |||||||||||
Funeral Financial EBITDA | 1,958 | 2,041 | 7,966 | 8,348 | |||||||||||
Cemetery Financial EBITDA | 2,179 | 2,358 | 9,338 | 9,341 | |||||||||||
Total Field EBITDA | $ | 19,558 | $ | 24,562 | $ | 84,477 | $ | 90,359 | |||||||
16
Reconciliation of cash provided by operating activities to Adjusted Free Cash Flow from operations for the three and twelve months ended December 31, 2013 and 2014 (in thousands):
Three Months Ended December 31, | Twelve Months Ended December 31, | ||||||||||||||
2013 | 2014 | 2013 | 2014 | ||||||||||||
Cash flow provided by operations | $ | 8,629 | $ | 8,916 | $ | 39,845 | $ | 36,565 | |||||||
Adjustment for tax benefit from Good to Great stock awards | — | — | — | 4,802 | |||||||||||
Cash used for maintenance capital expenditures | (1,888 | ) | (1,904 | ) | (6,615 | ) | (7,211 | ) | |||||||
Adjusted Free Cash Flow | $ | 6,741 | $ | 7,012 | $ | 33,230 | $ | 34,156 | |||||||
Reconciliation of GAAP basic earnings per share to Adjusted basic earnings per share for the three and twelve months ended December 31, 2013 and 2014:
Three Months Ended December 31, | Twelve Months Ended December 31, | ||||||||||||||
2013 | 2014 | 2013 | 2014 | ||||||||||||
GAAP basic earnings per share from continuing operations | $ | 0.23 | $ | 0.29 | $ | 0.83 | $ | 0.84 | |||||||
Special items affecting net income | 0.02 | 0.09 | 0.17 | 0.51 | |||||||||||
Adjusted basic earnings per share | $ | 0.25 | $ | 0.38 | $ | 1.00 | $ | 1.35 | |||||||
Reconciliation of GAAP diluted earnings per share to Adjusted diluted earnings per share for the three and twelve months ended December 31, 2013 and 2014:
Three Months Ended December 31, | Twelve Months Ended December 31, | ||||||||||||||
2013 | 2014 | 2013 | 2014 | ||||||||||||
GAAP diluted earnings per share from continuing operations | $ | 0.23 | $ | 0.29 | $ | 0.82 | $ | 0.83 | |||||||
Special items affecting net income | 0.02 | 0.09 | 0.13 | 0.51 | |||||||||||
Dilution effect of convertible junior subordinated debentures | — | — | 0.03 | — | |||||||||||
Adjusted diluted earnings per share | $ | 0.25 | $ | 0.38 | $ | 0.98 | $ | 1.34 | |||||||
17
CAUTIONARY STATEMENT ON FORWARD-LOOKING STATEMENTS
Certain statements made herein or elsewhere by, or on behalf of, the Company that are not historical facts are intended to be forward-looking statements within the meaning of Section 27A of the Securities Act of 1933, as amended, and Section 21E of the Securities Exchange Act of 1934, as amended. In addition to historical information, this Press Release contains certain statements and information that may constitute forward-looking statements within the safe harbor provisions of the Private Securities Litigation Reform Act of 1995. These statements include statements regarding the consummation of the SCI acquisition, any projections of earnings, revenues, asset sales, cash flow, debt levels or other financial items; any statements of the plans, strategies and objectives of management for future operations; any statements regarding future economic conditions or performance; any statements of belief; and any statements of assumptions underlying any of the foregoing and are based on our current expectations and beliefs concerning future developments and their potential effect on us. The words “may”, “will”, “estimate”, “intend”, “believe”, “expect”, “project”, “forecast”, “foresee”, “should”, “would”, “could”, “plan”, “anticipate” and other similar words or expressions are intended to identify forward-looking statements, which are generally not historical in nature. While management believes that these forward-looking statements are reasonable as and when made, there can be no assurance that future developments affecting us will be those that we anticipate. All comments concerning our expectations for future revenues and operating results are based on our forecasts for our existing operations and do not include the potential impact of any future acquisitions. Our forward-looking statements involve significant risks and uncertainties (some of which are beyond our control) and assumptions that could cause actual results to differ materially from our historical experience and our present expectations or projections. Important factors that could cause actual results to differ materially from those in the forward-looking statements include, but are not limited to, those summarized below:
• | the execution of our Standards Operating Model; |
• | changes in the number of deaths in our markets; |
• | changes in consumer preferences; |
• | ability to find and retain skilled personnel; |
• | the effects of competition; |
• | the investment performance of our funeral and cemetery trust funds; |
• | fluctuations in interest rates; |
• | our ability to obtain debt or equity financing on satisfactory terms to fund additional acquisitions, expansion projects, working capital requirements and the repayment or refinancing of indebtedness; |
• | death benefits related to preneed funeral contracts funded through life insurance contracts; |
• | our ability to generate preneed sales; |
• | the financial condition of third-party insurance companies that fund our preneed funeral contracts; |
• | increased or unanticipated costs, such as insurance or taxes; |
• | effects of the application of applicable laws and regulations, including changes in such regulations or the interpretation thereof; |
• | consolidation of the deathcare industry; and |
• | other factors and uncertainties inherent in the deathcare industry. |
For additional information regarding known material factors that could cause our actual results to differ from our projected results, please see “Risk Factors” in our most recent Annual Report on Form 10-K. Readers are cautioned not to place undue reliance on forward-looking statements, which speak only as of the date hereof. We undertake no obligation to publicly update or revise any forward-looking statements after the date they are made, whether as a result of new information, future events or otherwise. A copy of the Company’s Form 10-K, other Carriage Services information and news releases are available at www.carriageservices.com.
This press release includes the use of certain financial measures that are not GAAP measures. The Non-GAAP financial measures are presented for additional information and are reconciled to their most comparable GAAP measures in the tables presented above.
18