Attached files
| file | filename |
|---|---|
| EX-23 - EX-23 - TREX CO INC | d828432dex23.htm |
| EX-21 - EX-21 - TREX CO INC | d828432dex21.htm |
| EX-32 - EX-32 - TREX CO INC | d828432dex32.htm |
| EX-31.1 - EX-31.1 - TREX CO INC | d828432dex311.htm |
| EX-10.3 - EX-10.3 - TREX CO INC | d828432dex103.htm |
| EX-31.2 - EX-31.2 - TREX CO INC | d828432dex312.htm |
| EX-10.1 - EX-10.1 - TREX CO INC | d828432dex101.htm |
| EXCEL - IDEA: XBRL DOCUMENT - TREX CO INC | Financial_Report.xls |
Table of Contents
UNITED STATES
SECURITIES AND EXCHANGE COMMISSION
Washington, D.C. 20549
Form 10-K
(Mark One)
| þ | ANNUAL REPORT PURSUANT TO SECTION 13 OR 15(d) OF THE SECURITIES EXCHANGE ACT OF 1934 |
For the fiscal year ended December 31, 2014
| ¨ | TRANSITION REPORT PURSUANT TO SECTION 13 OR 15(d) OF THE SECURITIES EXCHANGE ACT OF 1934 |
For the transition period from to
Commission file number: 001-14649
Trex Company, Inc.
(Exact name of registrant as specified in its charter)
| Delaware | 54-1910453 | |
| (State or other jurisdiction of incorporation or organization) |
(I.R.S. Employer Identification No.) | |
| 160 Exeter Drive, Winchester, Virginia | 22603-8605 | |
| (Address of principal executive offices) | (Zip Code) | |
(540) 542-6300
Registrant’s telephone number, including area code:
Securities registered pursuant to Section 12(b) of the Act:
| Title of each class: |
Name of each exchange on which registered: | |
| Common Stock, par value $0.01 per share | New York Stock Exchange |
Securities registered pursuant to Section 12(g) of the Act:
None
Indicate by check mark if the registrant is a well-known seasoned issuer, as defined in Rule 405 of the Securities Act. Yes ¨ No þ
Indicate by check mark if the registrant is not required to file reports pursuant to Section 13 or Section 15(d) of the Exchange Act. Yes ¨ No þ
Indicate by check mark whether the registrant (1) has filed all reports required to be filed by Section 13 or 15(d) of the Securities Exchange Act of 1934 during the preceding 12 months (or for such shorter period that the registrant was required to file such reports), and (2) has been subject to such filing requirements for the past 90 days. Yes þ No ¨
Indicate by check mark whether the registrant has submitted electronically and posted on its corporate web site, if any, every Interactive Data File required to be submitted and posed pursuant to Rule 405 of Regulation S-T during the preceding 12 months. Yes þ No ¨
Indicate by check mark if disclosure of delinquent filers pursuant to Item 405 of Regulation S-K is not contained herein, and will not be contained, to the best of registrant’s knowledge, in definitive proxy or information statements incorporated by reference in Part III of this Form 10-K or any amendment to this Form 10-K. þ
Indicate by check mark whether the registrant is a large accelerated filer, an accelerated filer, a non-accelerated filer, or a smaller reporting Company. See the definitions of “large accelerated filer,” “accelerated filer” and “smaller reporting Company” in Rule 12b-2 of the Exchange Act.
| Large accelerated filer þ | Accelerated filer ¨ | |||
| Non-accelerated filer ¨ (Do not check if a smaller reporting Company) | Smaller reporting company ¨ |
Indicate by check mark whether the registrant is a shell Company (as defined in Rule 12b-2 of the Exchange Act). Yes ¨ No þ
The aggregate market value of the registrant’s common equity held by non-affiliates of the registrant at June 30, 2014, which was the last business day of the registrant’s most recently completed second fiscal quarter, was approximately $908.9 million based on the closing price of the common stock as reported on the New York Stock Exchange on such date and assuming, for purposes of this computation only, that the registrant’s directors, executive officers and beneficial owners of 10% or more of the registrant’s common stock are affiliates.
The number of shares of the registrant’s common stock outstanding on February 10, 2015 was 32,020,203.
DOCUMENTS INCORPORATED BY REFERENCE
Portions of the following documents are incorporated by reference in this Form 10-K as indicated herein:
| Document |
Part of 10-K into which incorporated | |
| Proxy Statement relating to Registrant’s 2015 Annual Meeting of Stockholders |
Part III |
Table of Contents
| Page | ||||||
| PART I | ||||||
| Item 1. |
1 | |||||
| Item 1A. |
9 | |||||
| Item 1B. |
13 | |||||
| Item 2. |
13 | |||||
| Item 3. |
14 | |||||
| Item 4. |
14 | |||||
| PART II | ||||||
| Item 5. |
15 | |||||
| Item 6. |
17 | |||||
| Item 7. |
Management’s Discussion and Analysis of Financial Condition and Results of Operations |
19 | ||||
| Item 7A. |
31 | |||||
| Item 8. |
32 | |||||
| Item 9. |
Changes in and Disagreements With Accountants on Accounting and Financial Disclosure |
32 | ||||
| Item 9A. |
32 | |||||
| Item 9B. |
35 | |||||
| PART III | ||||||
| Item 10. |
36 | |||||
| Item 11. |
36 | |||||
| Item 12. |
Security Ownership of Certain Beneficial Owners and Management and Related Stockholder Matters |
36 | ||||
| Item 13. |
Certain Relationships and Related Transactions, and Director Independence |
36 | ||||
| Item 14. |
36 | |||||
| PART IV | ||||||
| Item 15. |
37 | |||||
| F-1 | ||||||
i
Table of Contents
NOTE ON FORWARD-LOOKING STATEMENTS
This report, including the information it incorporates by reference, contains forward-looking statements within the meaning of Section 27A of the Securities Act of 1933 and Section 21E of the Securities Exchange Act of 1934. We intend our forward-looking statements to be covered by the safe harbor provisions for forward-looking statements in these sections. All statements regarding our expected financial position and operating results, our business strategy, our financing plans, forecasted demographic and economic trends relating to our industry and similar matters are forward-looking statements. These statements can sometimes be identified by our use of forward-looking words such as “believe,” “may,” “will,” “anticipate,” “estimate,” “expect” or “intend.” We cannot promise you that our expectations in such forward-looking statements will turn out to be correct. Our actual results could be materially different from our expectations because of various factors, including the factors discussed under “Risk Factors” in this report.
ii
Table of Contents
Some of the information contained in this report concerning the markets and industry in which we operate is derived from publicly available information and from industry sources. Although we believe that this publicly available information and the information provided by these industry sources are reliable, we have not independently verified the accuracy of any of this information.
| Item 1. | Business |
General
Trex Company, Inc. (the “Company”), founded as a Delaware corporation in 1998, is the world’s largest manufacturer of wood-alternative decking and railing products, which are marketed under the brand name Trex®. Our principal executive offices are located at 160 Exeter Drive, Winchester, Virginia 22603, and our telephone number at that address is (540) 542-6300. We operate in one business segment.
Products
We offer a comprehensive set of aesthetically durable, low maintenance product offerings in the decking, railing, porch, fencing, trim, steel deck framing and outdoor lighting categories. We believe that the range and variety of our product offerings allow consumers to design much of their outdoor living space using Trex brand products. A majority of our products are made in a proprietary process that combines waste wood fibers and scrap polyethylene. Our products are provided in a wide selection of popular sizes and lengths and are available with several finishes and numerous colors.
Decking. We market our decking products under a number of brand names. Our principal brand names for decking are: Trex Transcend®, Trex Enhance® and Trex Select®, which each feature a protective shell for enhanced protection against fading, staining, mold and scratching. We also offer Trex Hideaway®, a hidden fastening system for specially grooved boards.
Railing. Our railing products are Trex Transcend Railing, Trex Designer Series Railing®, Trex Select Railing, and Trex Reveal® aluminum railing. Trex Transcend Railing is available in the colors of Trex Transcend decking and finishes that make it appropriate for use with Trex decking products as well as other decking materials, which we believe enhances the sales prospects of our railing products. Our Designer Series Railing system consists of a decorative top and bottom rail, refined balusters, our Trex RailPost™, and post caps and skirts. Trex Select Railing, which is white, is for consumers who desire a simple clean finished look for their deck. Trex Reveal aluminum railing, which is available in three colors, is for consumers who want a sleek, contemporary aesthetic look.
Porch. Our Trex Transcend Porch Flooring and Railing System is an integrated system of porch components and accessories.
Fencing. We offer our Trex Seclusions® fencing product through two specialty distributors. This product consists of structural posts, bottom rail, pickets, top rail and decorative post caps.
Trim. Our TrexTrim™ product is a low maintenance cellular PVC residential exterior trim product that offers exceptional workability, durability, visual appeal and a low level of required maintenance.
Steel Deck Framing. We offer a triple-coated steel deck framing system called Trex Elevations®.
Outdoor Lighting. Our outdoor lighting systems are Trex DeckLighting™ and Trex Landscape Lighting™. Trex DeckLighting is a line of energy-efficient LED dimmable deck lighting, which is designed for use on posts, floors and steps. The line includes a post cap light, deck rail light, riser light and a recessed deck light. Trex Landscape Lighting line includes an energy-efficient well light, path light, multifunction light and spotlight.
1
Table of Contents
We are a licensor in a number of licensing agreements with third parties to manufacture and sell products under the Trex trademark. Our licensed products are:
| • | Trex Outdoor Furniture™, which is a line of outdoor furniture products manufactured and sold by Poly-Wood, Inc.; |
| • | Trex RainEscape®, which is an above joist deck drainage system manufactured and sold by Dri-Deck Enterprises, LLC; |
| • | Trex CustomCurve®, which is an on-site system that allows contractors to heat and bend Trex products manufactured and sold by CurveIt, LLC; |
| • | Trex Pergolas, which are pergolas made from TrexTrim™, our low maintenance cellular PVC trim product, marketed by Home and Leisure, Inc. dba Backyard America; |
| • | Diablo® Trex Blade, which is a specialty saw blade for wood-plastic composite decking manufactured and sold by Freud America, Inc.; |
| • | Trex SpiralStairs™ and Structural Steel Posts (for use with the Elevations system), manufactured and sold by M. Cohen and Sons, Inc. dba The Iron Shop; and |
| • | Trex Outdoor Cabinets, which are outdoor storage cabinets manufactured and sold by NatureKast Products LLC. |
Trex products offer a number of significant aesthetic advantages over wood while eliminating many of wood’s major functional disadvantages, which include warping, splitting and other damage from moisture. Our products require no staining, are resistant to moisture damage, provide a splinter-free surface and need no chemical treatment against rot or insect infestation. These features eliminate most of the on-going maintenance requirements for a wood deck and make Trex products less costly than wood over the life of the deck. Like wood, Trex products are slip-resistant (even when wet) but are less vulnerable to damage from ultraviolet rays. Special characteristics (including resistance to splitting, the ability to bend, and ease and consistency of machining and finishing) facilitate deck, railing, fencing and trim installation, reduce contractor call-backs and afford customers a wide range of design options. Trex decking products do not have the tensile strength of wood and, as a result, are not used as primary structural members in posts, beams or columns used in a deck’s substructure. However, Trex does offer the Trex Elevations steel deck framing system.
We have received product building code listings from the major U.S. and Canadian building code listing agencies for both our decking and railing systems. Our listings facilitate the acquisition of building permits by deck builders and promote consumer and industry acceptance of our products as an alternative to wood in decking. In addition, Trex Seclusions privacy fencing has passed the Miami/Dade County wind load testing, a widely regarded standard for assessing a fencing product’s performance under extreme environmental conditions.
During the second half of 2014, we began manufacturing and selling polyethylene pellets made from recycled plastic into the plastic bag, film and sheet markets and other commercial business applications. Our entry into this adjacent industry enables us to leverage our core recycling and extrusion capabilities, adding significant value to our polyethylene sales. As of December 31, 2014, one polyethylene pellet manufacturing line was operational, and an additional three lines are expected to be built during the first half of 2015.
Growth Strategies
Our long-term goal is to perpetuate our position as the leading producer of branded superior wood-alternative outdoor living products by increasing our market share and expanding into new product categories and geographic markets. To attain this goal, we intend to employ the following long-term strategies:
| • | Innovation: Bring to the market new products that address unmet consumer and trade professional needs. Provide a compelling value proposition through ease of installation, low maintenance, long-term durability and superior aesthetics. |
2
Table of Contents
| • | Brand: Expand preference and commitment for the Trex brand with both the consumer and trade professional. Deliver on the brand’s promise of superior quality, functionality, aesthetics and overall performance in the outdoor living space. Leverage online efforts to build a bigger Trex brand presence digitally, extending our footprint nationally and globally. |
| • | Channels: Achieve comprehensive market segment and geographic coverage for Trex products by increasing the number of stocking dealers and retailers and expanding our international presence, thereby making our products available wherever our customers choose to purchase their decking, railing, porch, trim, steel deck framing and outdoor lighting products. |
| • | Quality: Continuously advance the quality of all operational and business processes, with the goal of achieving superior product quality and service levels, thereby giving us a sustainable competitive advantage. |
| • | Cost: Through capital investments and process engineering, continuously seek to lower the cost to manufacture Trex products. Investments in plastic recycling capabilities will allow us to add significant value to our polyethylene sales and expand our ability to use a wider breadth of waste streams thereby lowering our raw material costs. We plan to concentrate on improving the productivity of our production process, from raw materials preparation through extrusion into finishing and packaging. |
Customers and Distribution
We distribute our products as follows:
Wholesale Distributors/Retail Lumber Dealers. We generate most of our sales through our wholesale distribution network by selling Trex products to wholesale distributors, who in turn, sell our products to retail lumber outlets. These retail dealers market to both homeowners and contractors, but they emphasize sales to professional contractors, remodelers and homebuilders. Contractor-installed decks generally are larger installations with professional craftsmanship. Our retail dealers generally provide sales personnel trained in Trex products, contractor training, inventory commitment and point-of-sale display support.
We believe that attracting wholesale distributors, who are committed to our products and marketing approach and can effectively sell higher value products to contractor-oriented lumber yards and other retail outlets, is important to our future growth. Our distributors are able to provide value-added service in marketing our products because they sell premium wood decking products and other innovative building materials that typically require product training and personal selling efforts. We typically appoint two distributors on a non-exclusive basis to distribute Trex products within a specified area. The distributor generally purchases our products at prices in effect at the time we ship the product to the distributor. Based on our 2014 net sales, sales to one of our distributors, Boise Cascade, exceeded 10% of our net sales.
Home Depot and Lowe’s. We sell our products through Home Depot and Lowe’s stores. Home Depot and Lowe’s purchase products directly from us for stocking on their shelves. They also purchase product through our wholesale distributors for special orders placed by consumers. Although Home Depot and Lowe’s serve the contractor market, the largest part of their sales are to “do-it-yourself” homeowner customers that shop for their materials at Home Depot and Lowe’s stores rather than at retail lumber dealers. We believe that brand exposure through Home Depot and Lowe’s distribution promotes consumer acceptance of our products.
Manufacturing Process
We operate manufacturing facilities located in Winchester, Virginia and Fernley, Nevada.
Trex products are primarily manufactured from waste wood fiber and scrap polyethylene. Our primary manufacturing process involves mixing wood particles with plastic, heating and finally extruding, or forcing, the highly viscous and abrasive material through a profile die. We have many proprietary and skill-based advantages in this process.
3
Table of Contents
Production of a wood-alternative decking such as ours requires significant capital investment, special process expertise and time to develop. We have continuously invested the capital necessary to expand our manufacturing throughput and improve our manufacturing processes. We have also broadened the range of raw materials that we can use to produce a consistent and high-quality finished product. We maintain research and development operations in the Trex Technical Center adjacent to our Winchester, Virginia manufacturing facilities. In connection with our building code listings, we maintain a quality control testing program that is monitored by an independent inspection agency.
We utilize Six Sigma practices and Standard Lean Manufacturing methodology within our plant operations. We also incorporate the use of these tools throughout our Company in the planning and execution of those projects that are the most important to our success.
Research and Development
Our research and development efforts focus on innovation and developing new products, lowering the cost of manufacturing our existing products and redesigning existing product lines to increase efficiency and enhance performance. For the years ended December 31, 2014, 2013 and 2012, research and development costs were $2.3 million, $2.9 million and $2.9 million, respectively, and have been included in “Selling, general and administrative expenses” in the accompanying consolidated statements of comprehensive income.
Suppliers
The production of most of our products requires the supply of waste wood fiber and scrap polyethylene.
We fulfill requirements for raw materials under both purchase orders and supply contracts. In the year ended December 31, 2014, we purchased substantially all of our waste wood fiber requirements under purchase orders, which do not involve long-term supply commitments. Substantially all of our polyethylene purchases are under short-term supply contracts that average approximately two years for which pricing is negotiated as needed.
Waste Wood Fiber. Woodworking plants or mills are our preferred suppliers of waste wood fiber because the waste wood fiber produced by these operations contains little contamination and is low in moisture. These facilities generate waste wood fiber as a byproduct of their manufacturing operations.
If the waste wood fiber meets our specifications, our waste wood fiber supply agreements generally require us to purchase at least a specified minimum and at most a specified maximum amount of waste wood fiber each year. Depending on our needs, the amount of waste wood fiber that we actually purchase within the specified range under any supply agreement may vary significantly from year to year.
Scrap Polyethylene. The polyethylene we consumed in 2014 was primarily composed of scrap plastic film and plastic bags. Approximately two billion pounds of polyethylene resin are used in the manufacture of stretch film and plastic bags in the United States each year. We will continue to seek to meet our future needs for scrap polyethylene from the expansion of our existing supply sources and the development of new sources. We believe our use of multiple sources provides us with a cost advantage and facilitates an environmentally responsible approach to our procurement of polyethylene.
Our ability to source and use a wide variety of polyethylene is important to our cost strategy. We maintain this ability through the continued expansion of our plastic reprocessing operations in combination with the advancement of our proprietary material preparation and extrusion processes.
Third-Party Manufacturing. We outsource the production of certain products to third-party manufacturers under supply contracts that commit us to purchase minimum levels for each year extending through 2015. We have purchase commitments under the third-party manufacturing contracts of $1.9 million for the year ending December 31, 2015.
4
Table of Contents
Competition
Our primary competition consists of wood products, which constitutes a substantial majority of decking and railing sales, as measured by linear feet of lumber. Many of the conventional lumber suppliers with which we compete have established ties to the building and construction industry and have well-accepted products. A majority of the lumber used in wood decks is pressure-treated lumber. Southern yellow pine and fir have a porosity that readily allows the chemicals used in the pressure treating process to be absorbed. The same porosity makes southern yellow pine susceptible to absorbing moisture, which causes the lumber to warp, crack, splinter and expel fasteners. In addition to pine and fir, other segments of wood material for decking include redwood, cedar and tropical hardwoods, such as ipe, teak and mahogany. These products are often significantly more expensive than pressure-treated lumber, but do not eliminate many of the disadvantages of other wood products.
In addition to wood, we also compete with other manufacturers of wood-alternative products. Industry studies indicate that we have the leading market share of the wood-alternative segment of the decking and railing market. Our principal competitors include Advanced Environmental Recycling Technologies, Inc., CPG International and Fiber Composites, LLC.
Our ability to compete depends, in part, on a number of factors outside our control, including the ability of our competitors to develop new wood-alternative decking and railing products that are competitive with our products. We believe that the principal competitive factors in the decking and railing market include product quality, price, aesthetics, maintenance cost, distribution and brand strength. We believe we compete favorably with respect to these factors. We believe that our products offer aesthetic and cost advantages over the life of a deck when compared to other types of decking and railing materials. Although a contractor-installed deck built with Trex products using a pressure-treated wood substructure generally costs more than a deck made entirely from pressure-treated wood, Trex products eliminate many of the on-going maintenance required for a pressure-treated deck and are, therefore, less costly over the life of the deck. We believe that our manufacturing process and utilization of relatively low-cost raw material sources provide us with a competitive cost advantage relative to other manufacturers of wood-alternative decking and railing products. The scale of our operations also confers cost efficiencies in manufacturing, sales and marketing.
Seasonality
Our net sales, gross profit and income from operations have historically varied from quarter to quarter. Such variations are often attributable to seasonal trends in the demand for our products. We have historically experienced lower net sales during the fourth quarter because holidays and adverse weather conditions in certain regions reduce the level of home improvement and construction activity.
Government Regulation
We are subject to federal, state and local environmental regulation. The emissions of particulates and other substances from our manufacturing facilities must meet federal and state air quality standards implemented through air permits issued to us by the Department of Environmental Quality of the Commonwealth of Virginia, the Division of Environmental Protection of Nevada’s Department of Conservation and Natural Resources and the Mississippi Department of Environmental Quality. Our facilities are regulated by federal and state laws governing the disposal of solid waste and by state and local permits and requirements with respect to wastewater and storm water discharge. Compliance with environmental laws and regulations has not had a material adverse effect on our business, operating results or financial condition.
Our operations also are subject to work place safety regulation by the U.S. Occupational Safety and Health Administration, the Commonwealth of Virginia, the State of Nevada and the State of Mississippi. Our compliance efforts include safety awareness and training programs for our production and maintenance employees.
5
Table of Contents
Intellectual Property
Our success depends, in part, upon our intellectual property rights relating to our products, production processes and other operations. We rely upon a combination of trade secret, nondisclosure and other contractual arrangements, and patent, copyright and trademark laws, to protect our proprietary rights. We have made substantial investments in manufacturing process improvements that have enabled us to increase manufacturing line production rates, facilitate our development of new products, and produce improvements in our existing products’ dimensional consistency, surface texture and color uniformity.
Intellectual property rights may be challenged by third parties and may not exclude competitors from using the same or similar technologies, brands or works. We seek to secure effective rights for our intellectual property, but cannot provide assurance that third parties will not successfully challenge, or avoid infringing, our intellectual property rights.
We have obtained two patents for complementary methods of preparing the raw materials for the manufacturing phase of production, one patent on an apparatus for implementing one of the methods, and one patent on a tool for use with the installation of the decking board. We intend to maintain our existing patents in effect until they expire, beginning in 2015, as well as to seek additional patents as we consider appropriate.
We consider our trademarks to be of material importance to our business plans. The U.S. Patent and Trademark Office has granted us federal registrations for many of our trademarks. Federal registration of trademarks is effective for as long as we continue to use the trademarks and renew their registrations. We do not generally register any of our copyrights with the U.S. Copyright Office, but rely on the protection afforded to such copyrights by the U.S. Copyright Act. This law provides protection to authors of original works, whether published or unpublished, and whether registered or unregistered. We enter into confidentiality agreements with our employees and limit access to and distribution of our proprietary information. If it is necessary to disclose proprietary information to third parties for business reasons, we require that such third parties sign a confidentiality agreement prior to any disclosure.
Employees
At December 31, 2014, we had approximately 630 full-time employees, approximately 470 of whom were employed in our manufacturing operations. Our employees are not covered by collective bargaining agreements. We believe that our relationships with our employees are favorable.
Web Sites and Additional Information
The SEC maintains an Internet web site at www.sec.gov that contains reports, proxy statements, and other information regarding our Company. In addition, we maintain an Internet corporate web site at www.trex.com. We make available through our web site our annual reports on Form 10-K, quarterly reports on Form 10-Q, current reports on Form 8-K, and all amendments to those reports, as soon as reasonably practicable after we electronically file or furnish such material with or to the SEC. We do not charge any fees to view, print or access these reports on our web site. The contents of our web site are not a part of this report.
6
Table of Contents
Executive Officers and Directors
The table below sets forth information concerning our executive officers and directors as of February 16, 2015.
| Name |
Age | Positions with Company | ||
| Ronald W. Kaplan |
63 | Chairman, President and Chief Executive Officer; Director | ||
| James E. Cline |
63 | Senior Vice President and Chief Financial Officer | ||
| William R. Gupp |
55 | Senior Vice President, General Counsel and Secretary | ||
| F. Timothy Reese |
62 | Senior Vice President, Operations | ||
| Christopher P. Gerhard |
42 | Vice President, Sales | ||
| Adam D. Zambanini |
38 | Vice President, Marketing | ||
| Michael F. Golden |
60 | Director | ||
| Jay M. Gratz |
62 | Director | ||
| Frank H. Merlotti, Jr. |
64 | Director, Lead Independent Director | ||
| Richard E. Posey |
68 | Director | ||
| Patricia B. Robinson |
62 | Director | ||
| Gerald Volas |
60 | Director |
Ronald W. Kaplan has served as Chairman, President and Chief Executive Officer of the Company since May 2010. From January 2008 to May 2010, Mr. Kaplan served as a director and President and Chief Executive Officer of the Company. From February 2006 through December 2007, Mr. Kaplan served as Chief Executive Officer of Continental Global Group, Inc., a manufacturer of bulk material handling systems. For 26 years prior to this, Mr. Kaplan was employed by Harsco Corporation, an international industrial services and products company, at which he served in a number of capacities, including as Senior Vice President-Operations, and, from 1994 through 2005, as President of Harsco’s Gas Technologies Group, which manufactures containment and control equipment for the global gas industry. Mr. Kaplan received a B.A. degree in economics from Alfred University and a M.B.A. degree from the Wharton School of Business, University of Pennsylvania.
James E. Cline has served as Senior Vice President and Chief Financial Officer of the Company since August 2013 and as Vice President and Chief Financial Officer between March 2008 and July 2013. Mr. Cline served from July 2005 through December 2007 as the President of Harsco GasServ, a subsidiary of Harsco Corporation and a manufacturer of containment and control equipment for the global gas industry. From January 2008 through February 2008, in connection with the purchase of Harsco GasServ by Taylor-Wharton International LLC, which is owned by Windpoint Partners Company, Mr. Cline served as a consultant to the buyers by providing transition management and financial services. From April 1994 through June 2005, Mr. Cline served as the Vice President and Controller of Harsco GasServ. Mr. Cline served in various capacities with Huffy Corporation from June 1976 to February 1994, including as the Director of Finance of its True Temper Hardware subsidiary, a manufacturer of lawn care and construction products with nine manufacturing locations in the United States, Canada and Ireland. Mr. Cline received a B.S.B.A. degree in accounting from Bowling Green State University.
William R. Gupp has served as Senior Vice President, General Counsel and Secretary of the Company since August 2014. From October 2009 to August 2014, Mr. Gupp served as Chief Administrative Officer, General Counsel and Secretary, and from May 2001 to October 2009, Mr. Gupp served as Vice President and General Counsel. From March 1993 to May 2001, Mr. Gupp was employed by Harsco Corporation, an international industrial services and products company, most recently as Senior Counsel and Director-Corporate Development. From August 1985 to March 1993, Mr. Gupp was employed by the law firm of Harter, Secrest & Emery. Mr. Gupp received a B.S. degree in accounting from Syracuse University and a J.D. from the University of Pennsylvania Law School.
F. Timothy Reese has served as Senior Vice President, Operations of the Company since August 2013 and as Vice President, Operations between February 2008 and July 2013. From March 2007 through January 2008,
7
Table of Contents
Mr. Reese served as Operations Director for the Americas Region of DuPont Teijin Films, a DuPont Teijin Films U.S. Limited Partnership and producer of polyester films. From 1979 to March 2007, Mr. Reese served in various positions with DuPont, including Global Director, Business and Integrated Operations, DuPont High Performance Films, from November 1995 through November 1998; Director/Plant Manager, Global Operations, Cyrel® Packaging Graphics Products, from December 1998 through May 2000; Director, Global Operations and Six Sigma Champion, Cyrel® Packaging Graphics Products, from June 2000 through February 2001; and Director/Plant Manager in multiple assignments from March 2001 through February 2007, including in Corporate Operations, Human Resources and DuPont Chemical Solutions Enterprise. Mr. Reese served in the U.S. Navy and received a B.S. in ocean engineering with an emphasis on mechanical engineering from the U.S. Naval Academy.
Christopher P. Gerhard has served as Vice President, Sales of the Company since June 2012. From May 2006 through June 2012, Mr. Gerhard served in a number of capacities at the Company, most recently as Director, Field Sales. From 2002 to May 2006, Mr. Gerhard served in various capacities with Kraft Foods North America, a manufacturer of food and beverages, most recently as Southeast Region Customer Category Manager. Mr. Gerhard received a B.A. in English from the University of North Carolina—Greensboro, and a Masters in Science from Ohio University.
Adam D. Zambanini has served as Vice President, Marketing of the Company since January 2011. From September 2005 through December 2010, Mr. Zambanini served in a number of capacities at the Company, most recently as Director, Marketing. From January 2000 through September 2005, Mr. Zambanini was employed by Rubbermaid Commercial Products, most recently as Product Manager. Mr. Zambanini received a B.S. in mechanical engineering from Penn State University, and a M.B.A. degree from Averett University.
Michael F. Golden has served as a director of the Company since February 2013. Mr. Golden is retired. Mr. Golden served as President and Chief Executive Officer of Smith and Wesson Holding Corporation, a manufacturer of firearms and firearms-related products and accessories, from December 2004 until his retirement in September 2011, and currently serves as a director of such company. Mr. Golden was employed in various executive positions with the Kohler Company, which manufactures kitchen and bath plumbing fixtures, furniture, tile, engines, and generators, and operates resorts, from February 2002 until December 2004, with his most recent position being the President of its Cabinetry Division. Mr. Golden was the President of Sales for the Industrial/Construction Group of the Stanley Works Company, which manufactures tools and hardware, from 1999 until 2002; Vice President of Sales for Kohler’s North American Plumbing Group from 1996 until 1998; and Vice President, Sales and Marketing for a division of The Black & Decker Corporation, which manufactures tools and hardware, where he was employed from 1981 until 1996. Mr. Golden also serves on the Board of Directors of Quest Resources Holding Company. Mr. Golden received a B.S. degree in Marketing from Pennsylvania State University and a M.B.A. degree from Emory University.
Jay M. Gratz has served as a director of the Company since February 2007. Mr. Gratz has served as the Chief Financial Officer of VisTracks, Inc., an application enabling platform service provider, since March 2010, and a director of such company since April 2010. Mr. Gratz was a partner in Tatum LLC, a national executive services and consulting firm that focuses on the needs of the Office of the CFO between February 2010 and March 2010. From October 2007 through February 2010, Mr. Gratz was an independent consultant. From 1999 through October 2007, Mr. Gratz served as Executive Vice President and Chief Financial Officer of Ryerson Inc., a metals processor and distributor, and as President of Ryerson Coil Processing Division from November 2001 until October 2007. Mr. Gratz served as Vice President and Chief Financial Officer of Inland Steel Industries, a steel company, from 1994 through 1998, and served in various other positions, including Vice President of Finance, within that company since 1975. Mr. Gratz is a Certified Public Accountant. He received a B.A. degree in economics from State University of New York in Buffalo and a M.B.A. degree from Northwestern University Kellogg Graduate School of Management.
Frank H. Merlotti, Jr. has served as a director of the Company since February 2006 and as Lead Independent Director since April 2014. Mr. Merlotti is retired. Mr. Merlotti served as President of the Coalesse
8
Table of Contents
business unit of Steelcase, Inc., a manufacturer of office furniture and furniture systems, from October 2006 until his retirement in September 2013, and as President of Steelcase North America from September 2002 through September 2006. Mr. Merlotti served as President and Chief Executive Officer of G&T Industries, a manufacturer and distributor of fabricated foam and soft-surface materials for the marine, office furniture and commercial building industries, from August 1999 to September 2002. From 1991 through 1999, Mr. Merlotti served as President and Chief Executive Officer of Metropolitan Furniture Company, a Steelcase Design Partnership company. From 1985 through 1999, Mr. Merlotti served as General Manager of the Business Furniture Division of G&T Industries.
Richard E. Posey has served as a director of the company since May 2009. Mr. Posey is retired. He served as President and Chief Executive Officer of Moen Incorporated, a manufacturer of faucets, from January 2002 until his retirement in September 2007. Prior to joining Moen, Mr. Posey was President and Chief Executive Officer of Hamilton Beach / Proctor Silex, Inc., a manufacturer of small kitchen appliances, for five years. Mr. Posey began his career at S.C. Johnson & Son, a supplier of cleaning and other household products, where for 22 years he served in a series of increasingly responsible management positions, both overseas and in the U.S., culminating with Executive Vice President, Consumer Products, North America. Mr. Posey is a Founding Trustee, Virginia Commonwealth University School of Engineering Foundation. He received a B.A. degree in English from The University of Southern California and a M.B.A. degree from The University of Michigan.
Patricia B. Robinson has served as a director of the Company since November 2000. Ms. Robinson has been an independent consultant since 1999. From 1977 to 1998, Ms. Robinson served in a variety of positions with Mead Corporation, a forest products company, including President of Mead School and Office Products, Vice President of Corporate Strategy and Planning, President of Gilbert Paper, Plant Manager of a specialty machinery facility and Product Manager for new packaging product introductions. Ms. Robinson received a B.A. degree in economics from Duke University and a M.B.A. degree from the Darden School at the University of Virginia.
Gerald Volas has served as a director of the Company since March 2014. Mr. Volas has been employed by Masco Corporation, one of the world’s leading manufacturers of brand-name products for the home improvement and new home construction industries, in various positions of increasing responsibility since 1982. Since February 2005, he has served as a Group Executive responsible for almost all of Masco’s operating companies at one time or another. He currently is responsible for a number of Masco operating companies accounting for approximately 50% of Masco’s revenues in 2012. From April 2001 to February 2005, he served as President of Liberty Hardware, a Masco operating company, from January 1996 to April 2001, he served as a Group Controller supporting a variety of Masco operating companies, and from May 1982 to January 1996, he served in progressive financial roles including Vice President/Controller at BrassCraft Manufacturing Company, a Masco operating company. Mr. Volas is a Certified Public Accountant. He received a Bachelor of Business Administration degree from the University of Michigan.
| Item 1A. | Risk Factors |
Our business is subject to a number of risks, including the following:
We may not be able to grow unless we increase market acceptance of our products, compete effectively and develop new products and applications.
Our primary competition consists of wood products, which constitute a substantial majority of decking, railing, porches, fencing, trim and deck framing sales. Since wood-alternative products were introduced to the market in the early 1990’s, their market acceptance has increased, but during the past few years, the rate of conversion from purchasing wood products to purchasing wood-alternative products slowed. Our ability to grow will depend, in part, on our success in continuing to convert demand for wood products into a demand for wood-alternative Trex products. To increase our market share, we must overcome:
| • | the consumer lack of awareness of the enhanced value of wood-alternative decking, railing, porches, fencing, trim and deck framing products in general and Trex brand products in particular; |
9
Table of Contents
| • | the resistance of many consumers and contractors to change from well-established wood products; |
| • | the consumer lack of awareness that the greater initial expense of Trex products compared to wood is a one-time cost that is reduced over time as Trex products have a longer life span than wood; |
| • | the established relationships existing between suppliers of wood products and contractors and homebuilders; |
| • | actual and perceived quality issues with first generation wood-alternative products; and |
| • | the competition from other wood-alternative manufacturers. |
We must also compete with a number of companies in the wood-alternative segment of the decking, railing, fencing and trim markets and with wood producers that currently have more production capacity than is required to meet the demand for such products. Our failure to compete successfully in such markets could have a material adverse effect on our ability to replace wood or increase the market share of wood-alternatives compared to wood. Many of the conventional lumber suppliers with which we compete have established ties to the building and construction industry and have well-accepted products. Our ability to compete depends, in part, upon a number of factors outside our control, including the ability of competitors to develop new non-wood alternatives that are more competitive with Trex products.
In addition to the above, substantially all of our revenues are derived from sales of our proprietary wood/plastic composite material. Although we have developed, and continue to develop, new products made from other materials, if we should experience significant problems, real or perceived, with product quality or acceptance of the Trex wood/polyethylene composite material, our lack of product diversification could have a significant adverse impact on our net sales levels.
Our prospects for sales growth and profitability may be adversely affected if we fail to maintain product quality and product performance at an acceptable cost.
We will be able to expand our net sales and to sustain and enhance profitable operations only if we succeed in maintaining the quality and performance of our products. If we should not be able to produce high-quality products at standard manufacturing rates and yields, unit costs may be higher. A lack of product performance would negatively affect our profitability by impeding acceptance of our products in the marketplace and by leading to higher product replacement and consumer relations expenses. In recent periods, we have experienced significant warranty expenses related to material produced at our Nevada facility prior to 2007 that exhibits surface flaking. We have limited our financial exposure by agreeing to settle a nationwide class action lawsuit which fixes our obligation in each claim to provide replacement product and provide a partial labor reimbursement. However, because the establishment of reserves is an inherently uncertain process involving estimates of the number of future claims and the average cost of claims, our ultimate losses may differ from our warranty reserve. Increases we have made to the warranty reserve and payments for related claims in recent years have had a material adverse effect on our profitability and cash flows. Future increases to the warranty reserve could have a material adverse effect on our profitability and cash flows should we make such increases and pay such claims.
In addition, our products are used outdoors and are sometimes subject to heavy use and harsh exposure to the environment. Although our Limited Warranty excludes any conditions attributable to “any act of God (such as flooding, hurricane, earthquake, lightning, etc., ), environmental condition (such as air pollution, mold, mildew, etc.), staining from foreign substances (such as dirt, grease, oil, etc.), or normal weathering (defined as exposure to sunlight, weather and atmosphere which may cause any colored surface to gradually fade, chalk, or accumulate dirt or stains”), to the extent that our products are affected in any way, this may lead to an increased risk of product liability claims or litigation.
A number of class action lawsuits based upon mold growth, color fading and color variation on our products have been brought against us, all of which have been settled. (See Part I, Item 3, Legal Proceedings, for a
10
Table of Contents
discussion of these lawsuits.) In the event future lawsuits are brought against us relating to alleged product quality issues, such lawsuits are a potential financial exposure to us and could cause adverse publicity, which in turn could result in a loss of consumer confidence in our products and also reduce our sales. Product quality claims could increase our expenses and have a material adverse effect on demand for our products and, consequently, reduce our net sales, net income and liquidity.
Our business is subject to risks in obtaining the raw materials we use at acceptable prices.
The production of our product requires substantial amounts of wood fiber and polyethylene. Our business strategy is to create a substantial cost advantage over our competitors by using waste wood fibers and scrap polyethylene. Our business could suffer from the termination of significant sources of raw materials, the payment of higher prices for raw materials or from the failure to obtain sufficient additional raw materials to meet planned increases in production. Our ability to obtain adequate supplies of scrap polyethylene depends on our success in developing new sources that meet our quality requirements, maintaining favorable relationships with suppliers and managing the collection of supplies from geographically dispersed locations.
We sell to certain customers that account for a significant portion of our sales, and the loss of one or more of these customers could have an adverse effect on our business.
A limited number of customers account for a significant percentage of our sales. Specifically, sales through our 15 largest customers each year accounted for approximately 86% of gross sales during fiscal year 2014, 89% during fiscal year 2013 and 90% during fiscal year 2012.
We expect that a significant portion of our sales will continue to be sold through a small number of customers, and certain customers will continue to account for a significant portion of our sales. The loss of a significant customer could have a negative impact on our business, financial condition and results of operations.
We have limited ability to control or project inventory build-ups in our distribution channel that can negatively affect our sales in subsequent periods.
The dynamic nature of our industry can result in substantial fluctuations in inventory levels of Trex products carried in our two-step distribution channel. We have limited ability to control or precisely project inventory build-ups, which can adversely affect our net sales levels in subsequent periods. We make the substantial majority of our sales to wholesale distributors, who, in turn, sell our products to local lumber yards. Because of the seasonal nature of the demand for decking, railing, deck framing, fencing and trim, our distribution channel partners must forecast demand for our products, place orders for the products, and maintain Trex product inventories in advance of the prime deck-building season, which generally occurs in our late first through third fiscal quarters. Accordingly, our results for the second and third fiscal quarters are difficult to predict and past performance will not necessarily indicate future performance. Inventory levels respond to a number of changing conditions in our industry, including product price increases resulting from escalating raw materials costs, increases in the number of competitive producers and in the production capacity of those competitors, the rapid pace of product introduction and innovation, changes in the levels of home-building and remodeling expenditures, and the cost and availability of credit.
The demand for our products is affected by adverse weather conditions.
Our products are generally purchased shortly before installation and used in outdoor environments. As a result, there is a correlation between the amount of product we sell and the weather conditions around the time they are to be installed. Weather conditions, such as very high or low temperatures, intense and prolonged precipitation, hurricanes, floods, and regional fires in the regions we sell our products interfere with ordinary construction, delay projects and can even lead to cessation of certain construction involving our products.
11
Table of Contents
Since weather conditions and seasonal cycles cannot be accurately predicted, adverse weather conditions may shift our sales to subsequent reporting periods, or may also reduce overall sales given the limited decking season in many locations. Prolonged adverse weather conditions could have a negative impact on our financial statements.
We depend on third parties for transportation services and the lack of availability of transportation and/or increases in cost could materially adversely affect our business and operations.
Our business depends on the transportation of both finished goods to our distributors and the transportation of raw materials to us. We rely on third parties for transportation of these items. In particular, a significant portion of our finished goods are transported by flatbed trucks, which are occasionally in high demand (especially at the end of calendar quarters) and/or subject to price fluctuations based on market conditions and the price of fuel.
If the required supply of transportation services is unavailable when needed, we may be unable to sell our products at full value, or at all. Similarly, if any of these providers were unavailable to deliver raw materials to us in a timely manner, we may be unable to manufacture our products in response to customer demand. This could harm our reputation, negatively impact our customer relationships and have a material adverse effect on our financial condition and results of operation. In addition, a material increase in transportation rates or fuel surcharges could materially adversely affect our profitability.
The demand for our products is influenced by general economic conditions and could be adversely affected by economic downturns.
The demand for our products is correlated to changes in the health of the economy in general, and the level of activity in home improvements and, to a much lesser extent, new home construction. These levels of activity, in turn, are affected by such factors as home equity values, credit availability, consumer confidence and spending habits, employment, interest rates, inflation and general economic conditions. Market conditions in the housing industry slowed significantly in recent years, particularly in new home construction. Home equity values in many markets that decreased significantly during those time periods have only begun to recover. This devaluation in home equity values has adversely affected the availability of home equity withdrawals, which have resulted in decreased home improvement spending. We cannot predict when the economy, the home remodeling and new home construction environments will fully recover or if the current recovery will continue. Any continued economic downturn could reduce consumer income or equity capital available for spending on discretionary items such as decking, railing, porches, fencing and trim, which could adversely affect the demand for our products.
We have significant capital invested in property, plant and equipment that may become obsolete or impaired and result in a charge to our earnings.
At December 31, 2014, we had $98.7 million of net property, plant and equipment, $6.8 million of which relates to assets located at our Olive Branch, Mississippi manufacturing facility that was shut down in September 2007. In addition, each year we make significant capital investments to improve or expand our manufacturing capabilities. These improvements sometimes involve the implementation of new technology and replacement of existing equipment at our manufacturing facilities, which may result in charges to our earnings if the existing equipment is not fully depreciated. Significant replacement of equipment or changes in the expected cash flows related to our assets could result in reduced earnings in future periods.
Our level of indebtedness, and ability to continue to obtain financing on favorable terms, could adversely affect our financial health and ability to compete.
As of December 31, 2014, we had no outstanding indebtedness. At certain periods during the year, we borrowed significant amounts on our senior secured credit facility for working capital purposes, and it is
12
Table of Contents
foreseeable that we will need to borrow on the facility in 2015 for similar purposes. In addition, we may borrow money in the event we elect to pursue an acquisition or other transactions. Accordingly, our future level of indebtedness could have important consequences. For example, it may:
| • | increase our vulnerability to general adverse economic and industry conditions, including interest rate fluctuations; |
| • | require us to dedicate a substantial portion of our cash flow from operations to payments on our indebtedness, thereby reducing the availability of our cash flow to fund working capital, capital expenditures and other general corporate purposes; |
| • | limit our ability to borrow additional funds to alleviate liquidity constraints, as a result of financial and other restrictive covenants in our indebtedness; |
| • | limit our flexibility in planning for, or reacting to, changes in our business and the industry in which we operate; |
| • | place us at a competitive disadvantage relative to companies that have less indebtedness; and |
| • | limit our ability to refinance our principal secured indebtedness. |
In addition, our senior secured credit facility imposes operating and financial restrictions that may limit our discretion on some business matters, which could make it more difficult for us to expand, finance our operations and engage in other business activities that may be in our interest. These restrictions may limit our ability to:
| • | incur additional indebtedness and additional liens on our assets; |
| • | engage in mergers or acquisitions or dispose of assets; |
| • | enter into sale-leaseback transactions; |
| • | pay dividends or make other distributions; |
| • | voluntarily prepay other indebtedness; |
| • | enter into transactions with affiliated persons; |
| • | make investments; and |
| • | change the nature of our business. |
We may incur indebtedness in addition to our current indebtedness. Any additional indebtedness we may incur in the future could subject us to similar or even more restrictive conditions.
Our ability to make future principal and interest payments, borrow and repay amounts under our revolving credit facility and continue to comply with our loan covenants will depend primarily on our ability to generate sufficient cash flow from operations. Our failure to comply with our loan covenants might cause our lenders to accelerate our repayment obligations under our credit facility, which may be declared payable immediately based on a default. To remain in compliance with our credit facility, we must maintain specified financial ratios based on our levels of debt, fixed charges, and earnings (excluding extraordinary gains and extraordinary non-cash losses) before interest, taxes, depreciation and amortization, all of which are subject to the risks of our business.
| Item 1B. | Unresolved Staff Comments |
None.
| Item 2. | Properties |
We lease our corporate headquarters in Winchester, Virginia, which consists of approximately 32,000 square feet of office space, under a lease that expires in March 2020. In 2005, in anticipation of relocating our
13
Table of Contents
corporate headquarters, we entered into an agreement to lease 55,047 square feet of office space in Dulles, Virginia. The lease expires in mid-2019. Subsequently, we reconsidered our decision to relocate our corporate headquarters and decided not to move. We have executed subleases for 24,732 square feet of the leased space and are currently marketing the remaining portion of the space to find a suitable tenant. For a description of our financial reporting in connection with the Dulles lease agreement, see Note 12 to our consolidated financial statements appearing elsewhere in this report.
We own approximately 66 contiguous acres of land in Winchester, Virginia and the buildings on this land. The site includes our research and development technical facility and manufacturing facilities, which contain approximately 465,000 square feet of space. We own approximately 37 acres of land in Fernley, Nevada and the buildings on this land. The site includes our manufacturing facility, which contains approximately 240,000 square feet of space, and outside open storage. We own approximately 102 acres of land in Olive Branch, Mississippi and the buildings on this land. The site contains four buildings with approximately 200,000 square feet for manufacturing and raw material handling operations. In September 2007, we suspended operations at our Olive Branch facility and consolidated all of our manufacturing operations into our Winchester and Fernley sites. Our facilities provide adequate capacity for current and anticipated future consumer demand.
We lease a total of approximately one million square feet of warehouse space under leases with expiration dates ranging from 2015 to 2025. For information about these leases, see Note 9 to our consolidated financial statements appearing elsewhere in this report.
The equipment and machinery we use in our operations consist principally of plastic and wood conveying and processing equipment. We own all of our manufacturing equipment. We lease forklift equipment at our facilities under operating leases.
We regularly evaluate our various facilities and equipment and make capital investments where necessary. In 2014, we spent a total of $13.0 million on capital expenditures, primarily related to new poly processing lines and upgrades to our existing production lines to support the manufacture of our high-performance products. We estimate that our capital expenditures in 2015 will be in approximately $20 million. We expect to use these expenditures principally to support cost reduction initiatives, new product launches in current and adjacent categories and general business support.
| Item 3. | Legal Proceedings |
On December 16, 2013, the United States District Court, Northern District of California Court granted final approval of the settlement with the law firm of Hagens Berman Sobol Shapiro LLP, relating to the previously reported class action lawsuit brought on behalf of Dean Mahan, and other named and similarly situated plaintiffs generally which alleged certain defects in the Company’s products relating to mold growth, color fading and color variation. As of the date of this report, the Company has distributed all cash payments and rebate certificates under the settlement. Claimants who were denied relief could appeal Trex’s decision, and the deadline for appeals has now passed. The Company believes that payments to consumers for all relief under the settlement will not exceed approximately $1.0 million. In addition to such amount, the Company previously paid $1.8 million related to this litigation, representing payment of attorneys’ fees to class counsel and named plaintiff awards in the nationwide settlement and the settlement of corollary cases brought in Indiana, Kentucky, New Jersey and Michigan, all as previously disclosed.
The Company has other lawsuits, as well as other claims, pending against it which are ordinary routine litigation and claims incidental to the business. Management has evaluated the merits of these other lawsuits and claims, and believes that their ultimate resolution will not have a material effect on the Company’s consolidated financial condition, results of operations, liquidity or competitive position.
| Item 4. | Mine Safety Disclosures |
Not applicable.
14
Table of Contents
| Item 5. | Market for Registrant’s Common Equity, Related Stockholder Matters and Issuer Purchases of Equity Securities |
Market for Common Stock
Our common stock has been listed on the New York Stock Exchange, or NYSE, since April 8, 1999. Between April 8, 1999 and November 22, 2009, it was listed under the symbol “TWP”. Effective November 23, 2009, the symbol changed to “TREX”. The table below shows the reported high and low sale prices of our common stock for each quarter during 2014 and 2013 as reported by the New York Stock Exchange. All common stock share and per share data in the table below are presented on a post-split basis to reflect the two-for-one stock split of our common stock distributed on May 7, 2014 to stockholders of record at the close of business on April 7, 2014.
| 2014 |
High | Low | ||||||
| First Quarter |
$ | 43.43 | $ | 31.05 | ||||
| Second Quarter |
40.51 | 28.26 | ||||||
| Third Quarter |
39.49 | 25.14 | ||||||
| Fourth Quarter |
44.82 | 31.08 | ||||||
| 2013 |
High | Low | ||||||
| First Quarter |
$ | 25.75 | $ | 19.05 | ||||
| Second Quarter |
29.02 | 22.62 | ||||||
| Third Quarter |
26.06 | 20.63 | ||||||
| Fourth Quarter |
41.52 | 23.13 | ||||||
Dividend Policy
We have never paid cash dividends on our common stock and our credit agreement places limitations on our ability to pay cash dividends. We intend to retain future earnings to finance the development and expansion of our business and, therefore, have no current intention to pay cash dividends. However, we reconsider our dividend policy on a regular basis and may determine to pay dividends in the future.
15
Table of Contents
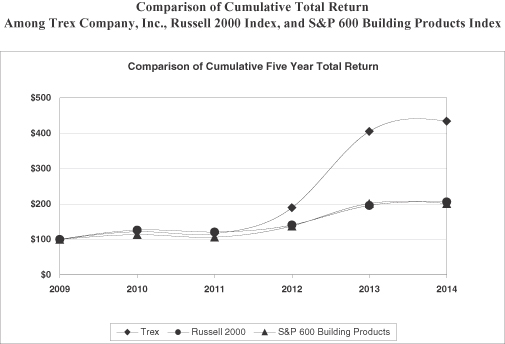
Stockholder Return Performance Graph
The following graph and table show the cumulative total stockholder return on Trex Company’s common stock for the last five fiscal years compared to the Russell 2000 Index and the Standard and Poor’s 600 Building Products Index. The graph assumes $100 was invested on December 31, 2009 in (1) Trex Company common stock, (2) the Russell 2000 Index and (3) the S&P 600 Building Products Index, and assumes reinvestment of dividends and market capitalization weighting as of December 31, 2010, 2011, 2012, 2013 and 2014.
| December 31, 2009 |
December 31, 2010 |
December 31, 2011 |
December 31, 2012 |
December 31, 2013 |
December 31, 2014 |
|||||||||||||||||||
| Trex Company |
$ | 100.00 | $ | 122.24 | $ | 116.84 | $ | 189.90 | $ | 405.71 | $ | 434.49 | ||||||||||||
| Russell 2000 |
$ | 100.00 | $ | 126.85 | $ | 121.55 | $ | 141.42 | $ | 196.32 | $ | 205.92 | ||||||||||||
| S&P 600 BPI |
$ | 100.00 | $ | 113.57 | $ | 106.72 | $ | 138.59 | $ | 202.05 | $ | 201.56 | ||||||||||||
Other Stockholder Matters
As of February 10, 2015, there were approximately 186 holders of record of our common stock.
In 2014, we submitted to the NYSE in a timely manner the annual certification that our Chief Executive Officer was not aware of any violation by us of the NYSE corporate governance listing standards.
16
Table of Contents
| Item 6. | Selected Financial Data |
The following table presents selected financial data as of December 31, 2014, 2013, 2012, 2011 and 2010 and for each of the years in the five-year period ended December 31, 2014.
The selected financial data should be read in conjunction with “Management’s Discussion and Analysis of Financial Condition and Results of Operations” and our consolidated financial statements and related notes thereto appearing elsewhere in this report.
| Year Ended December 31, (1) | ||||||||||||||||||||
| 2014 | 2013 (2) | 2012 (3) | 2011 (4) | 2010 (5) | ||||||||||||||||
| (In thousands, except share and per share data) | ||||||||||||||||||||
| Statement of Comprehensive Income Data: |
||||||||||||||||||||
| Net sales |
$ | 391,660 | $ | 342,511 | $ | 307,354 | $ | 266,789 | $ | 317,690 | ||||||||||
| Cost of sales |
251,464 | 243,893 | 222,772 | 203,998 | 244,875 | |||||||||||||||
|
|
|
|
|
|
|
|
|
|
|
|||||||||||
| Gross profit |
140,196 | 98,618 | 84,582 | 62,791 | 72,815 | |||||||||||||||
| Selling, general and administrative expenses |
72,370 | 73,967 | 71,907 | 60,620 | 67,764 | |||||||||||||||
|
|
|
|
|
|
|
|
|
|
|
|||||||||||
| Income from operations |
67,826 | 24,651 | 12,675 | 2,171 | 5,051 | |||||||||||||||
| Interest expense, net |
878 | 602 | 8,946 | 16,364 | 15,288 | |||||||||||||||
|
|
|
|
|
|
|
|
|
|
|
|||||||||||
| Income (loss) before income taxes |
66,948 | 24,049 | 3,729 | (14,193 | ) | (10,237 | ) | |||||||||||||
| Provision (benefit) for income taxes |
25,427 | (10,549 | ) | 1,009 | (2,605 | ) | (171 | ) | ||||||||||||
|
|
|
|
|
|
|
|
|
|
|
|||||||||||
| Net income (loss) |
$ | 41,521 | $ | 34,598 | $ | 2,720 | $ | (11,588 | ) | $ | (10,066 | ) | ||||||||
|
|
|
|
|
|
|
|
|
|
|
|||||||||||
| Basic earnings (loss) per share |
$ | 1.28 | $ | 1.03 | $ | 0.08 | $ | (0.38 | ) | $ | (0.33 | ) | ||||||||
|
|
|
|
|
|
|
|
|
|
|
|||||||||||
| Basic weighted average shares outstanding |
32,319,649 | 33,589,682 | 32,247,184 | 30,776,912 | 30,374,056 | |||||||||||||||
|
|
|
|
|
|
|
|
|
|
|
|||||||||||
| Diluted earnings (loss) per share |
$ | 1.27 | $ | 1.01 | $ | 0.08 | $ | (0.38 | ) | $ | (0.33 | ) | ||||||||
|
|
|
|
|
|
|
|
|
|
|
|||||||||||
| Diluted weighted average shares outstanding |
32,751,074 | 34,273,502 | 34,129,712 | 30,776,912 | 30,374,056 | |||||||||||||||
|
|
|
|
|
|
|
|
|
|
|
|||||||||||
| Cash Flow Data: |
||||||||||||||||||||
| Cash provided by operating activities |
$ | 58,642 | $ | 45,208 | $ | 60,443 | $ | 33,847 | $ | 18,994 | ||||||||||
| Cash used in investing activities |
(12,873 | ) | (12,697 | ) | (7,484 | ) | (9,367 | ) | (9,773 | ) | ||||||||||
| Cash used in financing activities |
(39,997 | ) | (30,898 | ) | (55,326 | ) | (47,224 | ) | (1,465 | ) | ||||||||||
| Other Data (unaudited): |
||||||||||||||||||||
| EBITDA (6) |
$ | 82,653 | $ | 40,597 | $ | 29,149 | $ | 20,589 | $ | 24,666 | ||||||||||
| Balance Sheet Data: |
||||||||||||||||||||
| Cash and cash equivalents and restricted cash |
$ | 9,544 | $ | 3,772 | $ | 2,159 | $ | 41,526 | $ | 27,270 | ||||||||||
| Working capital |
35,787 | 28,994 | 10,158 | (18,574 | ) | 66,057 | ||||||||||||||
| Total assets |
195,824 | 188,157 | 168,615 | 228,090 | 247,815 | |||||||||||||||
| Total debt (including derivatives) |
— | — | 5,000 | 86,425 | 85,095 | |||||||||||||||
| Total stockholder’s equity |
$ | 113,385 | $ | 106,616 | $ | 93,986 | $ | 92,499 | $ | 102,922 | ||||||||||
| (1) | All common stock share and per share data in the above table are presented on a post-split basis to reflect the two-for-one stock split of our common stock distributed on May 7, 2014 to stockholders of record at the close of business on April 7, 2014. |
| (2) | Year ended December 31, 2013 was materially affected by a pre-tax increase of $20.0 million to the warranty reserve and a $19.9 million income tax benefit resulting from a significant reversal of our valuation allowance, $10.9 million of which was a direct result of the Company’s decision to exit a full valuation allowance. |
17
Table of Contents
| (3) | Year ended December 31, 2012 was materially affected by a pre-tax increase of $21.5 million to the warranty reserve. |
| (4) | Year ended December 31, 2011 was materially affected by a pre-tax increase of $10.0 million to the warranty reserve and a $2.6 million income tax benefit as a result of the settlement of uncertain tax positions. |
| (5) | Year ended December 31, 2010 was materially affected by a pre-tax increase of $15.0 million to the warranty reserve and $3.9 million for minimum purchase penalties. |
| (6) | EBITDA represents net income before interest, income taxes, depreciation and amortization. EBITDA is not a measurement of financial performance under accounting principles generally accepted in the United States, or GAAP. The Company has included data with respect to EBITDA because management evaluates and projects the performance of the Company’s business using several measures, including EBITDA. Management considers EBITDA to be an important supplemental indicator of the Company’s operating performance, particularly as compared to the operating performance of the Company’s competitors, because this measure eliminates many differences among companies in capitalization and tax structures, capital investment cycles and ages of related assets, as well as some recurring non-cash and non-operating charges to net income or loss. For these reasons, management believes that EBITDA provides important supplemental information to investors regarding the operating performance of the Company and facilitates comparisons by investors between the operating performance of the Company and the operating performance of its competitors. Management believes that consideration of EBITDA should be supplemental, because EBITDA has limitations as an analytical financial measure. These limitations include the following: |
| • | EBITDA does not reflect the Company’s cash expenditures, or future requirements for capital expenditures, or contractual commitments; |
| • | EBITDA does not reflect the interest expense, or the cash requirements necessary to service interest or principal payments, on the Company’s indebtedness; |
| • | although depreciation and amortization are non-cash charges, the assets being depreciated and amortized will often have to be replaced in the future, and EBITDA does not reflect any cash requirements for such replacements; |
| • | EBITDA does not reflect the effect of earnings or charges resulting from matters the Company considers not to be indicative of its ongoing operations; and |
| • | not all of the companies in the Company’s industry may calculate EBITDA in the same manner in which the Company calculates EBITDA, which limits its usefulness as a comparative measure. |
The Company compensates for these limitations by relying primarily on its GAAP results to evaluate its operating performance and by considering independently the economic effects of the foregoing items that are not reflected in EBITDA. As a result of these limitations, EBITDA should not be considered as an alternative to net income (loss), as calculated in accordance with GAAP, as a measure of operating performance, nor should it be considered as an alternative to cash flows as a measure of liquidity. The following table sets forth, for the years indicated, a reconciliation of EBITDA to net income (loss):
| Year Ended December 31, | ||||||||||||||||||||
| 2014 | 2013 | 2012 | 2011 | 2010 | ||||||||||||||||
| (In thousands) | ||||||||||||||||||||
| Net income (loss) |
$ | 41,521 | $ | 34,598 | $ | 2,720 | $ | (11,588 | ) | $ | (10,066 | ) | ||||||||
| Plus interest expense, net |
878 | 602 | 8,946 | 16,364 | 15,288 | |||||||||||||||
| Plus income tax provision (benefit) |
25,427 | (10,549 | ) | 1,009 | (2,605 | ) | (171 | ) | ||||||||||||
| Plus depreciation and amortization |
14,827 | 15,946 | 16,474 | 18,418 | 19,615 | |||||||||||||||
|
|
|
|
|
|
|
|
|
|
|
|||||||||||
| EBITDA |
$ | 82,653 | $ | 40,597 | $ | 29,149 | $ | 20,589 | $ | 24,666 | ||||||||||
|
|
|
|
|
|
|
|
|
|
|
|||||||||||
18
Table of Contents
| Item 7. | Management’s Discussion and Analysis of Financial Condition and Results of Operations |
This management’s discussion and analysis contains forward-looking statements within the meaning of Section 27A of the Securities Act of 1933 and Section 21E of the Securities Exchange Act of 1934. All statements regarding our expected financial position and operating results, our business strategy, our financing plans, forecasted demographic and economic trends relating to our industry and similar matters are forward-looking statements. These statements can sometimes be identified by our use of forward-looking words such as “may,” “will,” “anticipate,” “estimate,” “expect,” “intend” or similar expressions. We cannot promise you that our expectations in such forward-looking statements will turn out to be correct. Our actual results could be materially different from our expectations because of various factors, including the factors discussed under “Item 1A. Risk Factors.” These statements are also subject to risks and uncertainties that could cause the Company’s actual operating results to differ materially. Such risks and uncertainties include the extent of market acceptance of the Company’s products; the costs associated with the development and launch of new products and the market acceptance of such new products; the sensitivity of the Company’s business to general economic conditions; the impact of seasonal and weather-related demand fluctuations on inventory levels in the distribution channel and sales of the Company’s products; the availability and cost of third-party transportation services for our products and raw materials; the Company’s ability to obtain raw materials at acceptable prices; the Company’s ability to maintain product quality and product performance at an acceptable cost; the level of expenses associated with product replacement and consumer relations expenses related to product quality; and the highly competitive markets in which the Company operates.
OVERVIEW
General. Trex Company, Inc. is the world’s largest manufacturer of wood-alternative decking and railing products, which are marketed under the brand name Trex®. We offer a comprehensive set of aesthetically durable, low maintenance product offerings in the decking, railing, porch, fencing, trim, steel deck framing and outdoor lighting categories. We believe that the range and variety of our product offerings allow consumers to design much of their outdoor living space using Trex brand products.
We offer the following products:
| • | Three principal decking products: Trex Transcend®, Trex Enhance®, and Trex Select®; |
| • | Three principal railing products: Trex Transcend Railing, Trex Select Railing, and Trex Reveal® aluminum railing; |
| • | One porch product, Trex Transcend Porch Flooring and Railing System; |
| • | One steel deck framing system, Trex Elevations®; |
| • | One fencing product, Trex Seclusions®; |
| • | Two outdoor lighting systems, Trex DeckLighting™ and Trex Landscape Lighting™; and, |
| • | One cellular PVC outdoor trim product, TrexTrim™. |
In addition, we offer Trex Hideaway®, which is a hidden fastening system for specially grooved boards.
Highlights related to the fourth quarter and full year 2014 include:
| • | Increase in net sales of 16% in the fourth quarter of 2014 and 14% in the full year of 2014 compared to the respective periods in 2013. Net sales in the full year 2014 were the highest net sales in any year of our history. |
| • | Positive cash flow from operations and no outstanding indebtedness at end of the year. |
| • | Repurchase of $50 million of our outstanding common stock during the full year 2014. |
| • | Two-for-one stock split of our common stock in the form of a stock dividend distributed on May 7, 2014 to stockholders of record at the close of business on April 7, 2014. |
19
Table of Contents
| • | Amendment and restatement of our revolving credit facility agreement, providing expanded availability, more favorable borrowing rates, less financial covenants and a maturity of November 2019. |
Net Sales. Net sales consist of sales and freight, net of returns and discounts. The level of net sales is principally affected by sales volume and the prices paid for Trex products. Our branding and product differentiation strategy enables us to command premium prices over wood products. Our operating results have historically varied from quarter to quarter, often due to seasonal trends in the demand for our products. We have historically experienced lower net sales during the fourth quarter because holidays and adverse weather conditions in certain regions reduce the level of home improvement and construction activity.
Sales Incentives / Early Buy Program: As part of our normal business practice and consistent with industry practices, we have historically provided our distributors and dealers incentives to build inventory levels before the start of the prime deck-building season to ensure adequate availability of product to meet anticipated seasonal consumer demand and to enable production planning. These incentives, which together we reference as our “early buy program,” include payment discounts and favorable payment terms. In addition, from time to time we may offer price discounts or volume rebates on specified products and other incentives based on increases in purchases as part of specific promotional programs.
We launched our early buy program for the 2015 decking season in December 2014. The timing and terms of the 2015 program are generally consistent with the timing and terms of the 2014 program launched in December 2013. To qualify for early buy program incentives, customers must commit to the terms of the program which specify eligible products and quantities, order deadlines and available terms, discounts and rebates. There are no product return rights granted to our distributors except those granted pursuant to the warranty provisions of our agreements with distributors. We generally do not extend the payment terms beyond those offered in the program. In addition, our products are not susceptible to rapid changes in technology that may cause them to become obsolete. The early buy program can have a significant impact on our sales, receivables and inventory levels. Refer to the liquidity and capital resources section for further discussion of significant impacts on our receivables and inventory levels.
Gross Profit. Gross profit represents the difference between net sales and cost of sales. Cost of sales consists of raw materials costs, direct labor costs, manufacturing costs and freight. Raw materials costs generally include the costs to purchase and transport waste wood fiber, scrap polyethylene and pigmentation for coloring Trex products. Direct labor costs include wages and benefits of personnel engaged in the manufacturing process. Manufacturing costs consist of costs of depreciation, utilities, maintenance supplies and repairs, indirect labor, including wages and benefits, and warehouse and equipment rental activities.
Selling, General and Administrative Expenses. The largest component of selling, general and administrative expenses is personnel related costs, which include salaries, commissions, incentive compensation, and benefits of personnel engaged in sales and marketing, accounting, information technology, corporate operations, research and development, and other business functions. Another component of selling, general and administrative expenses is branding and other sales and marketing costs, which are used to build brand awareness of Trex. These costs consist primarily of advertising, merchandising, and other promotional costs. Other general and administrative expenses include professional fees, office occupancy costs attributable to the business functions previously referenced, and consumer relations expenses. As a percentage of net sales, selling, general and administrative expenses have varied from quarter to quarter due, in part, to the seasonality of our business.
CRITICAL ACCOUNTING POLICIES AND ESTIMATES
Our significant accounting policies are described in Note 2 to our consolidated financial statements appearing elsewhere in this report. Our critical accounting estimates include the areas where we have made what we consider to be particularly difficult, subjective or complex judgments in making estimates, and where these estimates can significantly affect our financial results under different assumptions and conditions. We prepare our financial statements in conformity with accounting principles generally accepted in the United States. As a
20
Table of Contents
result, we are required to make estimates, judgments and assumptions that we believe are reasonable based upon the information available. These estimates, judgments and assumptions affect the reported amounts of assets and liabilities at the date of the financial statements and the reported amounts of revenue and expenses during the periods presented. Actual results could be different from these estimates.
Product Warranty. We warrant that our products will be free from material defects in workmanship and materials. This warranty generally extends for a period of 25 years for residential use and 10 years for commercial use. (With respect to TrexTrim™ and Trex Reveal® Railing, the warranty period is 25 years for both residential and commercial use.) With respect to our Transcend®, Enhance®, Select® and Universal Fascia product, we further warrant that the product will not fade in color more than a certain amount and will be resistant to permanent staining from food substances or mold (provided the stain is cleaned within seven days of appearance). This warranty extends for a period of 25 years for residential use and 10 years for commercial use. If there is a breach of such warranties, we have an obligation either to replace the defective product or refund the purchase price.
Historically, we have not had material numbers of claims submitted or settled under the provisions of our product warranties, with the exception of claims related to material produced at our Nevada facility prior to 2007 that exhibits surface flaking. We continue to receive and settle surface flaking claims and maintain a warranty reserve to provide for the settlement of these claims. In 2009, we agreed to a settlement of a class action lawsuit covering the surface defect, stipulating our responsibilities with regard to such claims. Estimating the warranty reserve for surface flaking claims requires management to estimate (1) the number of claims to be settled with payment and (2) the average cost to settle each claim, both of which are subject to variables that are difficult to estimate.
The key component driving our potential liability is the number of claims that will ultimately require payment. To estimate the number of future paid claims, we utilize actuarial techniques to quantify both the expected number of claims to be received and the percentage of those claims that will ultimately require payment. Estimates for both of these elements (number and percentage of claims that will ultimately require payment) are quantified using a range of assumptions derived from the recent claim count history and the identification of factors influencing the claim counts, including the downward trend in received claims due to the passage of time since production of the suspect material. For each of the various parameters used in the analysis, the assumed values in the actuarial valuation produce results that represent our best estimate for the ultimate number of claims to be settled with payment.
A number of factors make estimates of the number of claims to be received inherently uncertain. We believe that production of the suspect material was confined to material produced from our Nevada facility prior to 2007, but are unable to determine the amount of suspect material produced or the exact time it takes for surface flaking to become evident in the suspect material and materialize as a claim. Furthermore, the aforementioned 2009 class action settlement and communications made by us in July 2013 informing homeowners of potential hazards associated with decking products exhibiting surface flaking that are not timely replaced led to increased claims volume and disrupted the claims data and settlement patterns. Lastly, we are not aware of any analogous industry data that might be referenced in predicting future claims to be received. The number of surface flaking claims received peaked in 2009 in conjunction with the class action settlement and has declined each year thereafter.
The cost per claim varies due to a number of factors, including the size of affected decks, the type of replacement material used, the cost of production of replacement material and the method of claim settlement. Although the cost per claim does vary, it is less volatile and more predictable than the number of claims to be settled with payment, which is inherently uncertain. The cost per claim declined from 2007 through 2009 but has increased each year thereafter.
We monitor surface flaking claims activity each quarter for indications that our estimate of the number of claims expected requires revision. Due to extensive use of decks during the summer outdoor season, variance to annual claims expectations is typically observed during the latter part of our fiscal year.
21
Table of Contents
During the third quarter of 2013, the number of claims received was significantly greater than our prior estimates. We believe that this unexpected increase in claims was due primarily to a response to communications made by us in July 2013 informing homeowners of potential hazards associated with decking products exhibiting surface flaking that are not timely replaced. These communications included a public press release and over 10,000 letters sent to homeowners that previously filed surface flaking claims. In addition to contributing to the increase in new claims received, these communications resulted in the reopening of a significant number of claims previously closed. Furthermore, although not directly related to the surface flaking issue, in August 2013, the United States District Court, Northern District of California granted preliminary approval of a settlement agreement related to cases in which plaintiffs generally alleged certain defects in our products and alleged misrepresentations relating to mold growth. We believe that public notices made subsequent to the Court approval increased homeowner awareness of product-related issues and contributed to the increased number of surface flaking claims received during the third quarter of 2013. Due to the unfavorable claims experience during the three months ended September 30, 2013, we revised our estimate of the number of remaining future claims and recorded a $20 million increase to the warranty reserve.
During 2014, the number of claims received was lower than our expectations, while the average cost per claim was higher than our expectations for 2014. Based on claims activity experienced during the current year, we revised our assumed future number of claims and average cost per claim. The revised assumptions did not result in a change to our reserve, which as of December 31, 2014, we believe is sufficient to cover future surface flaking obligations. The increase in the amount paid to settle surface flaking claims in 2014, as compared to 2013, was primarily a result of the large number of claims received during the second half of 2013, as described above.
Our analysis is based on currently known facts and a number of assumptions. Projecting future events such as the number of claims to be received, the number of claims that will require payment and the average cost of claims could cause the actual warranty liabilities to be higher or lower than those projected which could materially affect our financial condition, results of operations or cash flow. We estimate that the number of claims received will decline over time and that the average cost per claim will remain relatively stable. If the level of claims received or average cost per claim differs materially from expectations, it could result in additional increases to the warranty reserve and reduced earnings and cash flows in future periods. We estimate that a 10% change in the expected number of remaining claims to be settled with payment or the expected cost to settle claims may result in approximately a $3.1 million change in the surface flaking warranty reserve.
The following table details surface flaking claims activity related to our warranty:
| Year Ended December 31, | ||||||||||||
| 2014 | 2013 | 2012 | ||||||||||
| Claims unresolved, beginning of period |
4,249 | 4,073 | 4,878 | |||||||||
| Claims received (1) |
3,212 | 4,256 | 4,807 | |||||||||
| Claims resolved (2) |
(4,589 | ) | (4,080 | ) | (5,612 | ) | ||||||
|
|
|
|
|
|
|
|||||||
| Claims unresolved, end of period |
2,872 | 4,249 | 4,073 | |||||||||
|
|
|
|
|
|
|
|||||||
| Average cost per claim (3) |
$ | 2,287 | $ | 2,269 | $ | 2,098 | ||||||
| (1) | Claims received include new claims received or identified during the period. |
| (2) | Claims resolved include all claims settled with or without payment and closed during the period. |
| (3) | Average cost per claim represents, for claims closed during the period, the average settlement cost of claims closed with payment (excludes claims settled without payment). |
For additional information about product warranties, see Notes 2 and 12 to the consolidated financial statements appearing elsewhere in this report.
22
Table of Contents
Contract Termination Costs. In anticipation of relocating our corporate headquarters, we entered into a lease agreement in 2005. We reconsidered and decided not to move our headquarters. The lease obligates us to lease 55,047 square feet of office space through June 30, 2019. As of December 31, 2014, we have executed subleases for 24,732 square feet of the leased space and are currently marketing the remaining portion of the space to find a suitable tenant. We estimate that the present value of the estimated future sublease receipts, net of transaction costs, will be less than the remaining minimum lease payment obligations under our lease and have recorded a liability for the expected shortfall. We recorded a $1.1 million charge in 2013 after a subtenant defaulted on its sublease and vacated the space. During 2014, we recorded $1.5 million in charges due to downward revisions of our estimate of future sublease receipts resulting from the departure of a subtenant that decided not to renew its sublease at the end of 2014.
To estimate future sublease receipts, we have assumed that the existing subleases will be renewed or new subleases will be executed at rates consistent with rental rates in the current subleases or estimated market rates and that existing vacancies will be filled within one year. However, management cannot be certain that the timing of future subleases or the rental rates contained in future subleases will not differ from current estimates. Factors such as the availability of commercial office space, market conditions and subtenant preferences will influence the terms achieved in future subleases. The inability to sublet the office space in the future or unfavorable changes to key assumptions used in the estimate of the future sublease receipts may result in material charges to selling, general and administrative expenses in future periods.
Income Taxes. We recognize deferred tax assets and liabilities based on the difference between the financial statement basis and tax basis of assets and liabilities using enacted rates expected to be in effect during the year in which the differences reverse. We assess the likelihood that our deferred tax assets will be realized. Deferred tax assets are reduced by a valuation allowance when, after considering all available positive and negative evidence, it is determined that it is more likely than not that some portion, or all, of the deferred tax asset will not be realized.
At December 31, 2013, we determined that we more likely than not will realize most of our deferred tax assets and, as a result, reversed the valuation allowance against all but a few specific items primarily related to state tax credits we estimate will expire before they are realized. As of December 31, 2014, we continue to have a valuation allowance of $4.5 million against these deferred tax assets. We will analyze our position in subsequent reporting periods, considering all available positive and negative evidence, in determining the expected realization of our deferred tax assets.
Stock-Based Compensation. The fair value of each stock-based award to officers, directors and certain key employees is established on the date of the grant. We calculate the grant date fair value of stock options and stock appreciation rights using the Black-Scholes valuation model. Determining the fair value of these awards is judgmental in nature and involves the use of significant estimates and assumptions, including the term of the share-based awards, risk-free interest rates over the vesting period, expected dividend rates, the price volatility of our shares and forfeiture rates of the awards. We base our fair value estimates on assumptions we believe to be reasonable but that are inherently uncertain. Actual future results may differ from those estimates.
We grant performance-based restricted stock, the vesting of which is subject to holder’s continuing employment and our achievement of certain performance measures. At each reporting period, we assess actual performance versus the predetermined performance measures, and adjust the stock-based compensation expense to reflect the relative performance achievement. Actual distributed shares are calculated upon conclusion of the service and performance periods.
Inventories. We account for inventories at the lower of cost (last-in, first-out, or “LIFO”) or market value. We believe that our current inventory of finished goods will be saleable in the ordinary course of business and, accordingly, have not established significant reserves for estimated slow moving products or obsolescence. At December 31, 2014, the excess of the replacement cost of inventory over the LIFO value of inventory was approximately $25.3 million.
23
Table of Contents
RESULTS OF OPERATIONS
Below we have included a discussion of our operating results and material changes in our operating results for the years ended December 31, 2014 compared to December 31, 2013 and December 31, 2013 compared to December 31, 2012.
Year Ended December 31, 2014 Compared to Year Ended December 31, 2013
Net Sales
| Year Ended December 31, | $ Change | % Change | ||||||||||||||
| 2014 | 2013 | |||||||||||||||
| (dollars in thousands) | ||||||||||||||||
| Net sales |
$ | 391,660 | $ | 342,511 | $ | 49,149 | 14.3 | % | ||||||||
The increase in net sales in 2014 compared to 2013 was due primarily to a 16.4% increase in sales volumes, partially offset by a 2.1% decrease in the average price per unit. We attribute the increase in sales volumes in 2014 compared to 2013 primarily to stronger demand from existing dealers and additions to our distribution network in late 2013. The decrease in average price per unit in 2014 was primarily due to our revamped pricing strategy implemented in the fourth quarter of 2013. The pricing strategy provides a more optimal pricing position for our high-performance products in the marketplace.
Gross Profit
| Year Ended December 31, | $ Change | % Change | ||||||||||||||
| 2014 | 2013 | |||||||||||||||
| (dollars in thousands) | ||||||||||||||||
| Cost of sales |
$ | 251,464 | $ | 243,893 | $ | 7,571 | 3.1 | % | ||||||||
| % of net sales |
64.2 | % | 71.2 | % | ||||||||||||
| Gross profit |
$ | 140,196 | $ | 98,618 | $ | 41,578 | 42.2 | % | ||||||||
| Gross margin |
35.8 | % | 28.8 | % | ||||||||||||
Gross profit in 2013 was adversely affected by $21.5 million of non-operating charges, which were comprised of a $20.0 million charge to increase the previously established surface flaking warranty reserve and a $1.5 million charge related to market share expansion and a reset of prices for certain products as we transitioned our remaining products to the next generation product offering. Excluding the aforementioned charges in 2013, gross profit increased to $140.2 million in 2014 compared to $120.1 million in 2013. Excluding the aforementioned charges in 2013, gross profit as a percentage of net sales, gross margin, increased by 90 basis points to 35.8% from 34.9% in 2013. Key drivers to the favorable underlying gross margin for 2014 include manufacturing efficiencies, cost-reduction initiatives and higher capacity utilization, partially offset by the aforementioned revamped pricing strategy.
Selling, General and Administrative Expenses
| Year Ended December 31, | $ Change | % Change | ||||||||||||||
| 2014 | 2013 | |||||||||||||||
| (dollars in thousands) | ||||||||||||||||
| Selling, general and administrative expenses |
$ | 72,370 | $ | 73,967 | $ | (1,597 | ) | (2.2 | %) | |||||||
| % of net sales |
18.5 | % | 21.6 | % | ||||||||||||
The decrease in selling, general and administrative expenses in 2014 compared to 2013 was attributable to various factors including:
| • | a $1.7 million reduction in costs related to the mold growth class action lawsuit that was settled in December 2013; |
24
Table of Contents
| • | a $0.6 million decrease in personnel-related expenses primarily attributable to decreased incentive compensation; |
| • | partially offset by a $0.6 million one-time charge for expenses and breakage fees related to a terminated transaction. |
As a percentage of net sales, total selling, general and administrative expenses decreased to 18.5% in 2014 from 21.6% in 2013.
Interest Expense
| Year Ended December 31, | $ Change | % Change | ||||||||||||||
| 2014 | 2013 | |||||||||||||||
| (dollars in thousands) | ||||||||||||||||
| Interest expense |
$ | 878 | $ | 602 | $ | 276 | 45.8 | % | ||||||||
| % of net sales |
0.2 | % | 0.2 | % | ||||||||||||
The increase in interest expense was driven by higher debt balances under the revolving credit facility during 2014 compared to 2013 primarily to facilitate repurchases of our common stock. As a percentage of net sales, interest expense was 0.2% in both 2014 and 2013.
Provision for Income Taxes
| Year Ended December 31, | $ Change | % Change | ||||||||||||||
| 2014 | 2013 | |||||||||||||||
| (dollars in thousands) | ||||||||||||||||
| Provision (benefit) for income taxes |
$ | 25,427 | $ | (10,549 | ) | $ | 35,976 | [NM | ] | |||||||
| Effective tax rate |
38.0 | % | (43.9 | )% | ||||||||||||
| [NM] | Not meaningful information. |
During 2014, our income tax expense consisted of statutory federal and state taxes, permanent book to tax differences, federal tax credits, other miscellaneous tax items and an increase to the valuation allowance on our deferred tax asset. During 2013, our income tax benefit consisted of a reduction of a substantial portion of our valuation allowance on our deferred tax asset as well as statutory federal and state taxes, permanent book to tax differences, federal tax credits, and other miscellaneous tax items.
Our effective tax rate in 2013 was substantially different than the statutory rate due to the effect of the valuation allowance we maintained against our net deferred tax assets. During 2013, we realized $9.1 million of deferred tax assets previously reserved under a valuation allowance. Additionally, as a result of all positive and negative evidence available as of December 31, 2013, we determined that we would realize the majority of our remaining deferred tax asset and, as a result, reversed a significant portion of the valuation allowance resulting in a tax benefit of $10.9 million.
Year Ended December 31, 2013 Compared to Year Ended December 31, 2012
Net Sales
| Year Ended December 31, | $ Change | % Change | ||||||||||||||
| 2013 | 2012 | |||||||||||||||
| (dollars in thousands) | ||||||||||||||||
| Net sales |
$ | 342,511 | $ | 307,354 | $ | 35,157 | 11.4 | % | ||||||||
25
Table of Contents
The increase in net sales in 2013 compared to 2012 was due primarily to an 8% increase in sales volume and a 3% increase in the average price per unit. We attribute the increase in sales volumes in 2013 compared to 2012 to the execution of growth strategies including increased market share from additions to our distribution network, the introduction of new product lines and a revised pricing strategy. The increase in average price per unit in 2013 was primarily driven by sales mix including an increased attachment rate on railing products.
Gross Profit
| Year Ended December 31, | $ Change | % Change | ||||||||||||||
| 2013 | 2012 | |||||||||||||||
| (dollars in thousands) | ||||||||||||||||
| Cost of sales |
$ | 243,893 | $ | 222,772 | $ | 21,121 | 9.5 | % | ||||||||
| % of net sales |
71.2 | % | 72.5 | % | ||||||||||||
| Gross profit |
$ | 98,618 | $ | 84,582 | $ | 14,036 | 16.6 | % | ||||||||
| Gross margin |
28.8 | % | 27.5 | % | ||||||||||||
Gross profit in 2013 and 2012 was adversely affected by $21.5 million and $21.5 million of non-operating charges, respectively. We recognized $20.0 million and $21.5 million of charges to increase the previously established warranty reserve in 2013 and 2012, respectively. In addition, in 2013, we recognized a $1.5 million charge related to market share expansion and a reset of prices for certain products as we transitioned our remaining products to the next generation product offering. Excluding the aforementioned charges in both 2013 and 2012, gross profit increased to $120.1 million in 2013 compared to $106.1 in 2012. Excluding the aforementioned charges in both 2013 and 2012, gross profit as a percentage of net sales, gross margin, increased by 40 basis points to 34.9% from 34.5% in 2012. The 2012 gross margin reflected $4.5 million of LIFO inventory liquidation income. The 2013 underlying gross margin at 34.9% was 185 basis points higher than 2012 excluding the LIFO inventory liquidation income. Key drivers to the favorable underlying gross margin for 2013 include lower sales related items, increased capacity utilization rates and continued manufacturing efficiencies.
Selling, General and Administrative Expenses
| Year Ended December 31, | $ Change | % Change | ||||||||||||||
| 2013 | 2012 | |||||||||||||||
| (dollars in thousands) | ||||||||||||||||
| Selling, general and administrative expenses |
$ | 73,967 | $ | 71,907 | $ | 2,060 | 2.9 | % | ||||||||
| % of net sales |
21.6 | % | 23.4 | % | ||||||||||||
The increase in selling, general and administrative expenses in 2013 compared to 2012 was attributable to various factors including a $1.2 million decrease in the benefits recognized from reductions in the provision for future contingent payments associated with the 2011 Iron Deck acquisition and a $0.9 million increase in legal and claims servicing costs primarily resulting from the mold growth class action lawsuit that was settled in December 2013 and related public and homeowner communications. As a percentage of net sales, total selling, general and administrative expenses decreased to 21.6% in 2013 from 23.4% to 2012.
Interest Expense
| Year Ended December 31, | $ Change | % Change | ||||||||||||||
| 2013 | 2012 | |||||||||||||||
| (dollars in thousands) | ||||||||||||||||
| Interest expense |
$ | 602 | $ | 8,946 | $ | (8,344 | ) | (93.3 | %) | |||||||
| % of net sales |
0.2 | % | 2.9 | % | ||||||||||||
26
Table of Contents
The decrease in interest expense in 2013 compared to 2012 resulted from carrying lower debt levels at lower interest rates during 2013 compared to 2012. This was primarily driven by the repayment of the $91.9 million principal balance on the 6.0% convertible notes on July 2, 2012. As a percentage of net sales, interest expense decreased to 0.2% in 2013 from 2.9% in 2012.
Provision for Income Taxes
| Year Ended December 31, | $ Change | % Change | ||||||||||||||
| 2013 | 2012 | |||||||||||||||
| (dollars in thousands) | ||||||||||||||||
| Provision (benefit) for income taxes |
$ | (10,549 | ) | $ | 1,009 | $ | (11,558 | ) | [NM | ] | ||||||
| Effective tax rate |
(43.9 | )% | 27.1 | % | ||||||||||||
| [NM] | Not meaningful information. |
During 2013, our income tax benefit consisted of a reduction of a substantial portion of our valuation allowance on our deferred tax asset as well as statutory federal and state taxes, permanent book to tax differences, federal tax credits, and other miscellaneous tax items. During 2012, our income tax expense consisted of cash taxes to various states where no net operating loss carry-forward existed to offset current year taxable income, unfavorable effect of permanent differences related to employee stock awards and increases in indefinite-lived deferred tax liabilities, primarily related to goodwill amortized for income taxes.
Our effective tax rate for both years was substantially different than the statutory rate due to the effect of the valuation allowance we maintained against our net deferred tax assets. During the three months ended December 31, 2013, we determined it to be more likely than not that we will realize most of our deferred tax assets. During 2013, we recorded a $19.9 million income tax benefit resulting from a significant reversal of our valuation allowance, $10.9 million of which was a direct result of our decision to exit a full valuation allowance.
LIQUIDITY AND CAPITAL RESOURCES
We finance operations and growth primarily with cash flow from operations, borrowings under the credit facility and other loans, operating leases and normal trade credit terms from operating activities.
Sources and Uses of Cash. The following table summarizes our cash flows from operating, investing and financing activities for the years ended December 31, 2014, 2013, and 2012 (in thousands):
| Year Ended December 31, | ||||||||||||
| 2014 | 2013 | 2012 | ||||||||||
| Net cash provided by operating activities |
$ | 58,642 | $ | 45,208 | $ | 60,443 | ||||||
| Net cash used in investing activities |
$ | (12,873 | ) | $ | (12,697 | ) | $ | (7,484 | ) | |||
| Net cash used in financing activities |
$ | (39,997 | ) | $ | (30,898 | ) | $ | (55,326 | ) | |||
|
|
|
|
|
|
|
|||||||
| Net increase (decrease) in cash and cash equivalents |
$ | 5,772 | $ | 1,613 | $ | (2,367 | ) | |||||
|
|
|
|
|
|
|
|||||||
Operating Activities
Net cash provided by operating activities increased $13.4 million in 2014 compared to 2013. The year-over-year increase was primarily driven by favorable cash flows relating to accounts receivable and increased net sales and earnings in 2014, partially offset by significantly higher income taxes paid in 2014 compared to 2013. Net sales and associated cash collections increased primarily due to additions to our distribution network and a revised pricing strategy in late 2013 and a stronger demand from existing dealers during 2014. The increased payments for income taxes during 2014 resulted from increased taxable income that exceeds available net operating loss carryforwards.
27
Table of Contents
Accounts receivable balances decreased slightly to $36.4 million at December 31, 2014 compared to $37.3 million at December 31, 2013. Substantially all of the accounts receivable balances at December 31, 2014 were subject to the terms of our early buy program. We expect to collect all outstanding accounts receivable balances by May 2015.
Net cash provided by operating activities decreased $15.2 million in 2013 compared to 2012. The year-over-year reduction in cash provided by operating activities was primarily driven by increased inventory and accounts receivable balances, partially offset by an increase in net sales and earnings during 2013 compared to 2012. The increase in inventory balances at December 31, 2013 was to support conversion to our next generation product offerings and additions to our distribution network.
Accounts receivable balances increased to $37.3 million at December 31, 2013 compared to $26.5 million at December 31, 2012 due to increased sales in late 2013 primarily driven by additions to our distribution network, an increase in demand for our products and a revised pricing strategy. Substantially all of the accounts receivable balances at December 31, 2013 were subject to the terms of our early buy program. We collected all outstanding accounts receivable balances by May 2014.
Investing Activities
Net cash used in investing activities increased $0.2 million in 2014 compared to 2013. Capital expenditures in 2014 totaled $13.0 million related to new poly processing lines and upgrades to existing production lines to support the manufacture of our high-performance products.
Net cash used in investing activities increased $5.2 million in 2013 compared to 2012. The increase was primarily attributable to an increase in capital expenditures in 2013 compared to 2012 due to a focus on new product launches and manufacturing efficiencies. Capital expenditures in 2013 consisted primarily of manufacturing equipment for process and productivity improvements, including upgrading lines to produce new products.
Financing Activities
Net cash used in financing activities increased $9.1 million in 2014 compared to 2013. The increase was due primarily to an increase in repurchases of our outstanding common stock under stock repurchase programs authorized by the Board of Directors. During 2014, we repurchased $50.0 million of our outstanding common stock using cash on hand and borrowings from our revolving credit facility. During 2013, we used cash on hand to repurchase $25.0 million of our outstanding common stock. Cash flow in 2014 was favorably affected by $12.9 million of excess tax benefits related to stock-based awards compared to $1.5 million in 2013.
Net cash used in financing activities decreased $24.4 million in 2013 compared to 2012. The improvement in 2013 was due to the fact that, in 2012, we used cash on hand and $37.0 million of restricted cash to fully repay the $91.9 million principal balance on our convertibles notes. In 2013, we used cash on hand to repurchase $25.0 million of our common stock.
Stock Repurchase Programs. On October 24, 2013, our Board of Directors authorized a common stock repurchase program, expiring on February 10, 2014, of up to $30 million of our outstanding common stock (the “October 2013 Stock Repurchase Program”). We made no repurchases under the October 2013 Stock Repurchase Program before it expired.
On February 19, 2014, our Board of Directors authorized a common stock repurchase program of up to $50 million of our outstanding common stock (the “February 2014 Stock Repurchase Program”). This authorization had no expiration date. During the three months ended June 30, 2014, we repurchased 1,657,919 shares for $50.0 million at an average price of $30.16 per share, which completed the authorization under the February 2014 Stock Repurchase Program. The share and per share data for the repurchases are reflective of the two-for-one stock split distributed on May 7, 2014.
28
Table of Contents
On October 23, 2014, our Board of Directors authorized a common stock repurchase program of up to two million shares of our outstanding common stock (the “October 2014 Stock Repurchase Program”). This authorization has no expiration date. As of December 31, 2014, no repurchases have been made under the October 2014 Stock Repurchase Program
Inventory in Distribution Channels. We sell our products through a tiered distribution system. We have approximately 20 distributors and two mass merchandisers to which we sell our products. The distributors in turn sell the products to approximately 3,700 dealers who in turn sell the products to the end users. Consistent with industry practices, to ensure adequate availability of product to meet anticipated seasonal consumer demand and to enable production planning, we have historically provided our distributors and dealers incentives to build inventory levels before the start of the prime deck-building season. These incentives include prompt payment discounts and favorable payment terms. In addition, from time to time, we may offer price discounts or volume rebates on specified products and other incentives based on increases in purchases as part of specific promotional programs. There are no product return rights granted to our distributors except those granted pursuant to the warranty provisions of our agreements with distributors. While we do not typically receive any information regarding inventory in the distribution channel from any dealers, we receive limited information from some but not all of our distributors regarding their inventory. Because few distributors provide us with any information regarding their inventory, we cannot definitively determine the level of inventory in the distribution channel at any time. Our sales in the fourth quarter of 2014 were higher than our sales in the fourth quarter of 2013. We believe that distributor inventory levels at December 31, 2014 are comparable to distributor inventory levels at December 31, 2013. Significant increases in inventory levels in the distribution channel without a corresponding change in end-user demand could have an adverse effect on future sales.
We seek to maintain favorable relationships with our distributors. However, on occasion, we may need to replace a distributor. Historically, we have had little difficulty replacing a distributor and have experienced little or no disruption to operations or liquidity. We believe that in the event we needed to replace a distributor, it would not have an adverse effect on our profitability or liquidity.
Product Warranty. We continue to receive and settle claims related to material produced at our Nevada facility prior to 2007 that exhibits surface flaking and regularly monitor the adequacy of the warranty reserve. During the year ended December 31, 2014, we paid approximately $8.9 million to settle claims against the warranty reserve, which had a material adverse effect on cash flow from operations. We estimate that the number of claims received will decline over time and that the average cost per claim will remain relatively stable. If the level of claims received or average cost per claim differs materially from our expectations, it could result in additional increases to the warranty reserve and reduced earnings and cash flow in future periods.
Indebtedness. On November 20, 2014, we entered into a Second Amended and Restated Credit Agreement (the “Second Amended Credit Agreement”) with Branch Banking and Trust Company (“BB&T”), as a Lender, Administrative Agent, Swing Line Lender and Letter of Credit Issuer; Citibank, N.A. and Bank of America, N.A., each as a Lender, and BB&T Capital Markets, as Lead Arranger. The Second Amended Credit Agreement amended and restated the Amended and Restated Credit Agreement dated as of January 6, 2012 by and among us, as borrower; BB&T as a Lender, Administrative Agent, Swing Line Lender, Letter of Credit Issuer and a Collateral Agent; Wells Fargo Capital Finance, LLC, as a Lender and Collateral Agent; and BB&T Capital Markets, as Lead Arranger, and as further amended (the “Prior Credit Agreement”). Under the Prior Credit Agreement, BB&T and Wells Fargo provided us with one or more revolving loans in a collective maximum principal amount of $100 million. The Second Amended Credit Agreement terminated the Revolver Notes and Swing Advance Note under the Prior Credit Agreement. No additional fees were due or owing as a result of the termination of the aforementioned agreements.
The Second Amended Credit Agreement provides us with one or more revolving loans in a collective maximum principal amount of $150 million from January 1 through June 30 of each year, reducing to a maximum principal amount of $100 million from July 1 through December 31 of each year (the “Revolving Loan Limit”) throughout the term, which ends November 20, 2019.
29
Table of Contents
Included within the Revolving Loan Limit are sublimits for a letter of credit facility in an amount not to exceed $15 million and swing advances in an aggregate principal amount at any time outstanding not to exceed $5 million. The Revolver Loans, the Letter of Credit Facility and the Swing Advance loans are for the purpose of raising working capital and supporting general business operations. We are not obligated to borrow any amount under the Revolving Loan Limit. Additionally, within the Revolving Loan Limit, we may borrow, repay, and reborrow, at any time or from time to time while the Revolving Loans are in effect.
Base Rate Advances (as defined in the Second Amended Credit Agreement) under the Revolver Loans and the Swing Advances accrue interest at the Base Rate plus the Applicable Margin (as defined in the Second Amended Credit Agreement) and Euro-dollar Advances for the Revolver Loans and Swing Advances accrue interest at the Adjusted London InterBank Offered Rate plus the Applicable Margin (as defined in the Second Amended Credit Agreement). Repayment of all then outstanding principal, interest, fees and costs is due on November 20, 2019.
We shall reimburse BB&T for all amounts payable, including interest, under a Letter of Credit at the earlier of (i) the date set forth in the application or (ii) one business day after the payment under such Letter of Credit by BB&T.
The Second Amended Credit Agreement is secured by interest in real property owned by us and certain collateral (as described in the Second Amended and Restated Security Agreement and Intellectual Property Security Agreement).
At December 31, 2014, we had no outstanding borrowings under the Revolver Loans and additional available borrowing capacity of approximately $100 million.
Compliance with Debt Covenants and Restrictions. Our ability to make scheduled principal and interest payments, borrow and repay amounts under any outstanding revolving credit facility and continue to comply with any loan covenants depends primarily on our ability to generate sufficient cash flow from operations. To remain in compliance with financial covenants in the Second Amended Credit Agreement, we are required to maintain specified financial ratios based on levels of debt, fixed charges, and earnings (excluding extraordinary gains and extraordinary non-cash losses) before interest, taxes, depreciation and amortization, all of which are subject to the risks of the business, some of which are discussed in this report under “Risk Factors.” We were in compliance with all covenants contained in Second Amended Credit Agreement at December 31, 2014. Under the Second Amended Credit Agreement, the material financial covenants and restrictions are as follows:
| (a) | Fixed Charge Coverage Ratio. The Fixed Charge Coverage Ratio is not permitted to be less than 1.5 to 1.0, measured as of the end of each Fiscal Quarter, commencing with the Fiscal Quarter ended September 30, 2014. |
| (b) | Consolidated Debt to Consolidated EBITDA Ratio. The Consolidated Debt to Consolidated EBITDA Ratio is not permitted to exceed 3.00 to 1.0 measured as of the end of each Fiscal Quarter (and in the case of Consolidated EBITDA, for the four-quarter period ending on such date). |
Failure to comply with the financial covenants in our Second Amended Credit Agreement could be considered a default of our repayment obligations and, among other remedies, could accelerate payment of any amounts outstanding under our Second Amended Credit Agreement.
At December 31, 2014, we had no outstanding indebtedness, and the interest rate on the revolving credit facility was 1.3%.
30
Table of Contents
Contractual Obligations. The following tables show, as of December 31, 2014, our contractual obligations and commercial commitments, which consist primarily of purchase commitments and operating leases (in thousands):
Contractual Obligations
Payments Due by Period
| Total | Less than 1 year |
1-3 years | 4-5 years | After 5 years |
||||||||||||||||
| Purchase commitments (1) |
44,494 | 25,471 | 18,975 | 48 | — | |||||||||||||||
| Operating leases |
38,118 | 6,753 | 16,168 | 7,474 | 7,723 | |||||||||||||||
|
|
|
|
|
|
|
|
|
|
|
|||||||||||
| Total contractual cash obligations |
$ | 82,612 | $ | 32,224 | $ | 35,143 | $ | 7,522 | $ | 7,723 | ||||||||||
|
|
|
|
|
|
|
|
|
|
|
|||||||||||
| (1) | Purchase commitments represent supply contracts with third-party manufacturers and raw material vendors. Open purchase orders written in the normal course of business for goods or services that are provided on demand have been excluded as the timing of which is not certain. |
Off-Balance Sheet Arrangements. We do not have off-balance sheet financing arrangements other than operating leases.
Capital and Other Cash Requirements. We made capital expenditures of $13.0 million in 2014, $13.1 million in 2013 and $7.6 million in 2012, primarily related to new products and to make process and productivity improvements. We currently estimate that capital expenditures in 2015 will be approximately $20 million. Capital expenditures in 2015 are expected to be used primarily to support cost reduction initiatives, new product launches in current and adjacent categories and general business support.
We believe that cash on hand, cash flow from operations and borrowings expected to be available under our revolving credit facility will provide sufficient funds to enable us to fund planned capital expenditures, make scheduled principal and interest payments, fund the warranty reserve, meet other cash requirements and maintain compliance with terms of our debt agreements for at least the next 12 months. We currently expect to fund future capital expenditures from operations and borrowings under the revolving credit facility. The actual amount and timing of future capital requirements may differ materially from our estimate depending on the demand for Trex and new market developments and opportunities. Our ability to meet our cash needs during the next 12 months and thereafter could be adversely affected by various circumstances, including increases in raw materials and product replacement costs, quality control problems, higher than expected product warranty claims, service disruptions and lower than expected collections of accounts receivable. In addition, any failure to negotiate amendments to our existing debt agreements to resolve any future noncompliance with financial covenants could adversely affect our liquidity by reducing access to revolving credit borrowings needed primarily to fund seasonal borrowing needs. We may determine that it is necessary or desirable to obtain financing through bank borrowings or the issuance of debt or equity securities to address such contingencies or changes to our business plan. Debt financing would increase our level of indebtedness, while equity financing would dilute the ownership of our stockholders. There can be no assurance as to whether, or as to the terms on which, we would be able to obtain such financing, which would be restricted by covenants contained in our existing debt agreements.
NEW ACCOUNTING STANDARDS
New accounting standards are discussed in Note 2. Summary of Significant Accounting Policies in the Notes to Consolidated Financial Statements in this report.
| Item 7A. | Quantitative and Qualitative Disclosures About Market Risk |
We are subject to market risks from changing interest rates associated with our borrowings. To meet our seasonal working capital needs, we borrow periodically on our variable rate revolving line of credit. At
31
Table of Contents
December 31, 2014, we had no debt outstanding under our revolving line of credit. While variable rate debt obligations expose us to the risk of rising interest rates, an increase of 1% in interest rates would not have a material adverse effect on our overall financial position, results of operations or liquidity based on balances outstanding at December 31, 2014.
In certain instances we may use interest rate swap agreements to modify fixed rate obligations to variable rate obligations, thereby adjusting the interest rates to current market rates and ensuring that the debt instruments are always reflected at fair value. We had no interest rate swap agreements outstanding as of December 31, 2014.
| Item 8. | Financial Statements and Supplementary Data |
The financial statements listed in Item 15 and appearing on pages F-2 through F-26 are incorporated by reference in this Item 8 and are filed as part of this report.
| Item 9. | Changes in and Disagreements With Accountants on Accounting and Financial Disclosure |
None.
| Item 9A. | Controls and Procedures |
Evaluation of Disclosure Controls and Procedures
Our management, with the participation of our Chief Executive Officer, who is our principal executive officer, and our Chief Financial Officer, who is our principal financial officer, has evaluated the effectiveness of our disclosure controls and procedures (as defined in Rules 13a-15(e) and 15d-15(e) under the Securities Exchange Act of 1934) as of December 31, 2014. Based upon this evaluation, our Chief Executive Officer and our Chief Financial Officer concluded that our disclosure controls and procedures were effective as of December 31, 2014.
32
Table of Contents
Management’s Report on Internal Control Over Financial Reporting
We, as members of management of Trex Company, Inc. (the “Company”), are responsible for establishing and maintaining adequate internal control over financial reporting. The Company’s internal control over financial reporting is a process designed to provide reasonable assurance regarding the reliability of financial reporting and the preparation of financial statements for external purposes in accordance with generally accepted accounting principles. Internal control over financial reporting includes those policies and procedures that (1) pertain to the maintenance of records that, in reasonable detail, accurately and fairly reflect the transactions and dispositions of the assets of the Company; (2) provide reasonable assurance that transactions are recorded as necessary to permit preparation of financial statements in accordance with generally accepted accounting principles, and that receipts and expenditures of the Company are being made only in accordance with authorizations of management and directors of the Company; and (3) provide reasonable assurance regarding prevention or timely detection of unauthorized acquisition, use, or disposition of the Company’s assets that could have a material effect on the financial statements.
Because of its inherent limitations, internal control over financial reporting may not prevent or detect misstatements. Also, projections of any evaluation of effectiveness to future periods are subject to the risk that controls may become inadequate because of changes in conditions, or that the degree of compliance with the policies and procedures may deteriorate.
We assessed the Company’s internal control over financial reporting as of December 31, 2014, based on criteria for effective internal control over financial reporting established in “Internal Control-Integrated Framework (2013)” issued by the Committee of Sponsoring Organizations of the Treadway Commission (the “COSO Framework”). Based on this assessment, we concluded that, as of December 31, 2014, our internal control over financial reporting was effective, based on the COSO Framework.
The effectiveness of our internal control over financial reporting as of December 31, 2014, has been audited by Ernst & Young LLP, an independent registered public accounting firm, as stated in their report, which follows hereafter.
| TREX COMPANY, INC. | ||||||||
| February 24, 2015 | By: | /s/ RONALD W. KAPLAN | ||||||
| Ronald W. Kaplan | ||||||||
| Chairman, President and Chief Executive Officer | ||||||||
| (Principal Executive Officer) | ||||||||
| February 24, 2015 | By: | /s/ JAMES E. CLINE | ||||||
| James E. Cline | ||||||||
| Senior Vice President and Chief Financial Officer | ||||||||
| (Principal Financial Officer) | ||||||||
Changes in Internal Control Over Financial Reporting
There have been no changes in the Company’s internal control over financial reporting identified in connection with the evaluation described above in “Management’s Report on Internal Control Over Financial Reporting’ that occurred during the Company’s fourth fiscal quarter that have materially affected, or are reasonably likely to materially affect, the Company’s internal control over financial reporting.
33
Table of Contents
Report of Ernst & Young LLP, Independent Registered Public Accounting Firm,
on Internal Control Over Financial Reporting
The Board of Directors and Stockholders of Trex Company, Inc.
We have audited Trex Company, Inc.’s internal control over financial reporting as of December 31, 2014, based on criteria established in Internal Control—Integrated Framework issued by the Committee of Sponsoring Organizations of the Treadway Commission (2013 framework) (the COSO criteria). Trex Company, Inc.’s management is responsible for maintaining effective internal control over financial reporting, and for its assessment of the effectiveness of internal control over financial reporting included in the accompanying Management’s Report on Internal Control over Financial Reporting in Item 9A. Our responsibility is to express an opinion on the company’s internal control over financial reporting based on our audit.
We conducted our audit in accordance with the standards of the Public Company Accounting Oversight Board (United States). Those standards require that we plan and perform the audit to obtain reasonable assurance about whether effective internal control over financial reporting was maintained in all material respects. Our audit included obtaining an understanding of internal control over financial reporting, assessing the risk that a material weakness exists, testing and evaluating the design and operating effectiveness of internal control based on the assessed risk, and performing such other procedures as we considered necessary in the circumstances. We believe that our audit provides a reasonable basis for our opinion.
A company’s internal control over financial reporting is a process designed to provide reasonable assurance regarding the reliability of financial reporting and the preparation of financial statements for external purposes in accordance with generally accepted accounting principles. A company’s internal control over financial reporting includes those policies and procedures that (1) pertain to the maintenance of records that, in reasonable detail, accurately and fairly reflect the transactions and dispositions of the assets of the company; (2) provide reasonable assurance that transactions are recorded as necessary to permit preparation of financial statements in accordance with generally accepted accounting principles, and that receipts and expenditures of the company are being made only in accordance with authorizations of management and directors of the company; and (3) provide reasonable assurance regarding prevention or timely detection of unauthorized acquisition, use or disposition of the company’s assets that could have a material effect on the financial statements.
Because of its inherent limitations, internal control over financial reporting may not prevent or detect misstatements. Also, projections of any evaluation of effectiveness to future periods are subject to the risk that controls may become inadequate because of changes in conditions, or that the degree of compliance with the policies or procedures may deteriorate.
In our opinion, Trex Company, Inc. maintained, in all material respects, effective internal control over financial reporting as of December 31, 2014, based on the COSO criteria.
We also have audited, in accordance with the standards of the Public Company Accounting Oversight Board (United States), the consolidated balance sheets of Trex Company, Inc., as of December 31, 2014 and 2013, and the related consolidated statements of comprehensive income, changes in stockholders’ equity, and cash flows for each of the three years in the period ended December 31, 2014 of Trex Company, Inc. and our report dated February 24, 2015 expressed an unqualified opinion thereon.
/s/ Ernst & Young LLP
Richmond, Virginia
February 24, 2015
34
Table of Contents
| Item 9B. | Other Information |
On February 18, 2015, the Board of Directors approved an amendment to the Amended and Restated 1999 Incentive Plan for Outside Directors (the “Outside Directors Plan”). Prior to such amendment, the Outside Directors Plan provided for the grant of stock appreciation rights (“SARS”) or options to new directors in the amount of $55,000, an annual grant to directors of restricted stock in the amount of $55,000, and it permitted directors to elect to receive all or any portion of their annual board and committee fees in the form of 50% SARs or options and 50% restricted stock. As a result of the amendment, the Nominating and Corporate Governance Committee will now determine, prior to any grant of equity, whether such grant shall be in the form of options, SARs or Restricted Stock, or any combination thereof.
The foregoing description of the amendment to the Outside Directors Plan is qualified in its entirety by reference to the full text of Outside Directors Plan, which is filed as Exhibit 10.3 to this Form 10-K.
35
Table of Contents
| Item 10. | Directors, Executive Officers and Corporate Governance |
See “Executive Officers and Directors” in Part I, Item 1 of this report for the information about our executive officers, which is incorporated by response in this Item 10. Other information responsive to this Item 10 is incorporated herein by reference to our definitive proxy statement for our 2015 annual meeting of stockholders, which we will file with the SEC on or before 120 days after our 2014 fiscal year-end.
We have adopted a code of conduct and ethics, which is applicable to all of our directors, officers and employees, including our Chief Executive Officer and Chief Financial Officer. The code is available on our corporate web site and in print to any stockholder who requests a copy. We also make available on our web site, at www.trex.com, and in print to any stockholder who requests them, copies of our corporate governance principles and the charters of each standing committee of our board of directors. Requests for copies of these documents should be directed to Corporate Secretary, Trex Company, Inc., 160 Exeter Drive, Winchester, Virginia 22603-8605. To the extent required by SEC rules, we intend to disclose any amendments to our code of conduct and ethics, and any waiver of a provision of the code with respect to our principal executive officer, principal financial officer, principal accounting officer or controller, or persons performing similar functions, on our web site referred to above within four business days following any such amendment or waiver, or within any other period that may be required under SEC rules from time to time.
| Item 11. | Executive Compensation |
Information responsive to this Item 11 is incorporated herein by reference to our definitive proxy statement for our 2015 annual meeting of stockholders, which we will file with the SEC on or before 120 days after our 2014 fiscal year-end.
| Item 12. | Security Ownership of Certain Beneficial Owners and Management and Related Stockholder Matters |
Information responsive to this Item 12 is incorporated herein by reference to our definitive proxy statement for our 2015 annual meeting of stockholders, which we will file with the SEC on or before 120 days after our 2014 fiscal year-end.
| Item 13. | Certain Relationships and Related Transactions, and Director Independence |
Information responsive to this Item 13 is incorporated herein by reference to our definitive proxy statement for our 2015 annual meeting of stockholders, which we will file with the SEC on or before 120 days after our 2014 fiscal year-end.
| Item 14. | Principal Accounting Fees and Services |
Information responsive to this Item 14 is incorporated herein by reference to our definitive proxy statement for our 2015 annual meeting of stockholders, which we will file with the SEC on or before 120 days after our 2014 fiscal year-end.
36
Table of Contents
| Item 15. | Exhibits and Financial Statement Schedules |
(a)(1) The following consolidated financial statements of the Company appear on pages F-2 through F-26 of this report and are incorporated by reference in Part II, Item 8:
| Report of Ernst & Young LLP, Independent Registered Public Accounting Firm |
F-2 | |||
| Consolidated Financial Statements |
||||
| Consolidated Balance Sheets as of December 31, 2014 and 2013 |
F-3 | |||
| Consolidated Statements of Comprehensive Income for the three years ended December 31, 2014 |
F-4 | |||
| F-5 | ||||
| Consolidated Statements of Cash Flows for the three years ended December 31, 2014 |
F-6 | |||
| F-7 | ||||
| (a)(2) The following financial statement schedule is filed as part of this report: |
||||
| F-27 | ||||
All other schedules for which provision is made in the applicable accounting regulations of the Securities and Exchange Commission are not required under the related instructions or are inapplicable or not material and, therefore, have been omitted.
(a)(3) The following exhibits are either filed with this Form 10-K or are incorporated herein by reference. The Company’s Securities Exchange Act file number is 001-14649.
| Exhibit |
Exhibit Description | |
| 3.1 | Restated Certificate of Incorporation of Trex Company, Inc. (the “Company”). Filed as Exhibit 3.1 to the Company’s Registration Statement on Form S-1 (No. 333-63287) and incorporated herein by reference. | |
| 3.2 | Certificate of Amendment to the Restated Certificate of Incorporation of Trex Company, Inc. dated April 30, 2014. Filed as Exhibit 3.2 to the Company’s Quarterly Report on Form 10-Q for the quarterly period ended March 31, 2014 and incorporated herein by reference. | |
| 3.3 | Amended and Restated By-Laws of the Company. Filed as Exhibit 3.2 to the Company’s Current Report on Form 8-K filed May 7, 2008 and incorporated herein by reference. | |
| 4.1 | Specimen certificate representing the Company’s common stock. Filed as Exhibit 4.1 to the Company’s Registration Statement on Form S-1 (No. 333-63287) and incorporated herein by reference. | |
| 4.2 | Credit Agreement dated as of November 4, 2009 between the Company and Branch Banking and Trust Company as Administrative Agent and Letter of Credit Issuer, BB&T Capital Markets as Lead Arranger and the Lenders listed on the signature pages thereof. Filed as Exhibit 4.1 to the Company’s Current Report on Form 8-K filed on November 6, 2009 and incorporated herein by reference. | |
| 4.3 | Swing Advance Note dated November 4, 2009 payable by the Company Inc. to Branch Banking and Trust Company in the amount of the lesser of $5,000,000 or the outstanding swing advances made by Branch Banking and Trust Company. Filed as Exhibit 4.6 to the Company’s Current Report on Form 8-K filed on November 6, 2009 and incorporated herein by reference. | |
37
Table of Contents
| Exhibit |
Exhibit Description | |
| 4.4 | First Amendment, dated October 28, 2011, of Credit Agreement dated as of November 4, 2009 between the Company and Branch Banking and Trust Company as Administrative Agent, Letter of Credit Issuer and Lender, and BB&T Capital Markets Letter as Lead Arranger. Filed as Exhibit 4.1 to the Company’s Quarterly Report on Form 10-Q for the quarterly period ended September 30, 2011 and incorporated herein by reference. | |
| 4.5 | Revolver Note dated October 28, 2011 payable by the Company to Branch Banking and Trust Company in the amount of the lesser of $40,000,000 or the outstanding revolver advances made by Branch Banking and Trust Company. Filed as Exhibit 4.2 to the Company’s Quarterly Report on Form 10-Q for the quarterly period ended September 30, 2011 and incorporated herein by reference. | |
| 4.6 | Reducing Revolver Note dated October 28, 2011 payable by the Company to Branch Banking and Trust Company in the amount of the lesser of $15,000,000 or the outstanding revolver advances made by Branch Banking and Trust Company. Filed as Exhibit 4.3 to the Company’s Quarterly Report on Form 10-Q for the quarterly period ended September 30, 2011 and incorporated herein by reference. | |
| 4.7 | Amended and Restated Security Agreement between the Company and Branch Banking and Trust Company as Collateral Agent for the Lenders, dated as of November 4, 2009. Filed as Exhibit 4.7 to the Company’s Current Report on Form 8-K filed on November 6, 2009 and incorporated herein by reference. | |
| 4.8 | Amended and Restated Credit Line Deed of Trust, dated November 4, 2009, by and among the Company, as grantor, BB&T-VA Collateral Service Corporation, as trustee, and Branch Banking and Trust Company, as Collateral Agent for the Lenders, as Beneficiary relating to real property partially located in the County of Frederick, Virginia and partially located in the City of Winchester, Virginia. Filed as Exhibit 4.8 to the Company’s Current Report on Form 8-K filed on November 6, 2009 and incorporated herein by reference. | |
| 4.9 | Deed of Trust, dated November 4, 2009, by and among the Company, as grantor, Eric L. Sappenfield, as trustee, and Branch Banking and Trust Company, as Collateral Agent for the Lenders, as Beneficiary relating to real property located in the County of De Soto, Mississippi. Filed as Exhibit 4.9 to the Company’s Current Report on Form 8-K filed on November 6, 2009 and incorporated herein by reference. | |
| 4.10 | Amended and Restated Credit Agreement dated as of January 6, 2012 between the Company and Branch Banking and Trust Company, as a Lender, Administrative Agent, Swing Line Lender, Letter of Credit Issuer and a Collateral Agent; Wells Fargo Capital Finance, LLC, as a Lender and a Collateral Agent; and BB&T Capital Markets, as Lead Arranger. Filed as Exhibit 4.1 to the Company’s Current Report on Form 8-K filed on January 12, 2012 and incorporated herein by reference. | |
| 4.11 | Revolver Note dated January 6, 2012 payable by the Company to Branch Banking and Trust Company in the amount of the lesser of $55,000,000 or the outstanding revolver advances made by Branch Banking and Trust Company. Filed as Exhibit 4.2 to the Company’s Current Report on Form 8-K filed on January 12, 2012 and incorporated herein by reference. | |
| 4.12 | Revolver Note dated January 6, 2012 payable by the Company to Wells Fargo Capital Finance, LLC in the amount of the lesser of $45,000,000 or the outstanding revolver advances made by Wells Fargo Capital Finance, LLC. Filed as Exhibit 4.3 to the Company’s Current Report on Form 8-K filed on January 12, 2012 and incorporated herein by reference. | |
| 4.13 | Swing Advance Note dated January 6, 2012 payable by the Company to Branch Banking and Trust Company in the amount of the lesser of $5,000,000 or the outstanding swing advances made by Branch Banking and Trust Company. Filed as Exhibit 4.4 to the Company’s Current Report on Form 8-K filed on January 12, 2012 and incorporated herein by reference. | |
38
Table of Contents
| Exhibit |
Exhibit Description | |
| 4.14 | Amended and Restated Security Agreement dated as of January 6, 2012 between the Company, as debtor, and Branch Banking and Trust Company as Collateral Agent for Branch Banking and Trust Company and Wells Fargo Capital Finance, LLC. Filed as Exhibit 4.5 to the Company’s Current Report on Form 8-K filed on January 12, 2012 and incorporated herein by reference. | |
| 4.15 | Modification to Amended and Restated Credit Line Deed of Trust, dated as of January 6, 2012, by and among the Company as grantor, BB&T-VA Collateral Service Corporation, as trustee, and Branch Banking and Trust Company, as Collateral Agent for Branch Banking and Trust Company and Wells Fargo Capital Finance, LLC, as Beneficiary relating to real property partially located in the County of Frederick, Virginia and partially located in the City of Winchester, Virginia. Filed as Exhibit 4.6 to the Company’s Current Report on Form 8-K filed on January 12, 2012 and incorporated herein by reference. | |
| 4.16 | Deed of Trust, dated as of January 6, 2012, by and among the Company as grantor, First American Title Insurance Company, as trustee, and Branch Banking and Trust Company, as Collateral Agent for Branch Banking and Trust Company and Wells Fargo Capital Finance, LLC, as Beneficiary relating to real property located in the County of Fernley, Nevada. Filed as Exhibit 4.7 to the Company’s Current Report on Form 8-K filed on January 12, 2012 and incorporated herein by reference. | |
| 4.17 | First Amendment dated February 26, 2013 to Amended and Restated Credit Agreement dated as of January 6, 2012 between the Company and Branch Banking and Trust Company, as a Lender and Administrative Agent, and Wells Fargo Capital Finance, LLC as a Lender. Filed as Exhibit 4.1 to the Company’s Amended Current Report on Form 8-K filed April 18, 2013 and incorporated herein by reference. | |
| 4.18 | Revolver Note dated February 26, 2013 payable by Trex Company, Inc. to Branch Banking and Trust Company in the amount of the lesser of $67,500,000 or the outstanding revolver advances made by Branch Banking and Trust Company. Filed as Exhibit 4.2 to the Company’s Current Report on Form 8-K filed February 26, 2013 and incorporated herein by reference. | |
| 4.19 | Revolver Note dated February 26, 2013 payable to Trex Company, Inc. to Wells Fargo Capital Finance, LLC in the amount of the lesser of $57,500,000 or the outstanding revolver advances made by Wells Fargo Capital Finance, LLC. Filed as Exhibit 4.3 to the Company’s Current Report on Form 8-K filed February 26, 2013 and incorporated herein by reference. | |
| 4.20 | Second Amendment dated December 17, 2013 to Amended and Restated Credit Agreement dated as of January 6, 2012, as amended by a First Amendment dated February 26, 2013, between the Company and Branch Banking and Trust Company, as a Lender and Administrative Agent, and Wells Fargo Capital Finance, LLC as a Lender. Filed as Exhibit 4.1 to the Company’s Current Report on Form 8-K filed December 19, 2013 and incorporated herein by reference. | |
| 4.21 | Letter Agreement dated October 23, 2014 to Amended and Restated Credit Agreement Dated as of January 6, 2012, as amended, between the Company and Branch Banking and Trust Company, as a Lender and Administrative Agent, and Wells Fargo Capital Finance, LLC as a Lender. Filed as Exhibit 4.1 to the Company’s Quarterly Report on Form 10-Q for the quarterly period ended September 30, 2014 and incorporated herein by reference. | |
| 4.22 | Second Amended and Restated Credit Agreement dated as of November 20, 2014 between the Company and Branch Banking and Trust Company, as a Lender, Administrative Agent, Swing Line Lender and Letter of Credit Issuer; Citibank, N.A. as a Lender; Bank of America, N.A. as a Lender; and BB&T Capital Markets, as Lead Arranger. Filed as Exhibit 4.1 to the Company’s Current Report on Form 8-K filed November 25, 2014 and incorporated herein by reference. | |
39
Table of Contents
| Exhibit |
Exhibit Description | |
| 4.23 | Revolver Note dated November 20, 2014 payable by the Company to Branch Banking and Trust Company in the amount of the lesser of $80,000,000 or the outstanding revolver advances made by Branch Banking and Trust Company. Filed as Exhibit 4.2 to the Company’s Current Report on Form 8-K filed November 25, 2014 and incorporated herein by reference. | |
| 4.24 | Revolver Note dated November 20, 2014 payable by the Company to Citibank, N.A. in the amount of the lesser of $45,000,000 or the outstanding revolver advances made by Citibank, N.A. Filed as Exhibit 4.3 to the Company’s Current Report on Form 8-K filed November 25, 2014 and incorporated herein by reference. | |
| 4.25 | Revolver Note dated November 20, 2014 payable by the Company to Bank of America, N.A. in the amount of the lesser of $25,000,000 or the outstanding revolver advances made by Bank of America, N.A. Filed as Exhibit 4.4 to the Company’s Current Report on Form 8-K filed November 25, 2014 and incorporated herein by reference. | |
| 4.26 | Swing Advance Note dated November 20, 2014 payable by the Company to Branch Banking and Trust Company in the amount of the lesser of $5,000,000 or the outstanding swing advances made by Branch Banking and Trust Company. Filed as Exhibit 4.5 to the Company’s Current Report on Form 8-K filed November 25, 2014 and incorporated herein by reference. | |
| 4.27 | Second Amended and Restated Security Agreement dated as of November 20, 2014 between the Company, as debtor, and Branch Banking and Trust Company as Administrative Agent for Branch Banking and Trust Company, Citibank, N.A. and Bank of America, N.A. Filed as Exhibit 4.6 to the Company’s Current Report on Form 8-K filed November 25, 2014 and incorporated herein by reference. | |
| 4.28 | Second Modification to Amended and Restated Credit Line Deed of Trust, dated as of November 20, 2014, by and among the Company as grantor, BB&T-VA Collateral Service Corporation, as trustee, and Branch Banking and Trust Company, as Administrative Agent for Branch Banking and Trust Company, Citibank, N.A. and Bank of America, N.A., as Beneficiaries relating to real property partially located in the County of Frederick, Virginia and partially located in the City of Winchester, Virginia. Filed as Exhibit 4.7 to the Company’s Current Report on Form 8-K filed November 25, 2014 and incorporated herein by reference. | |
| 4.29 | Modification to Deed of Trust, dated as of November 20, 2014, by and among the Company as grantor, First American Title Insurance Company, as trustee, and Branch Banking and Trust Company, as Administrative Agent for Branch Banking and Trust Company, Citibank, N.A. and Bank of America, N.A., as Beneficiaries relating to real property located in the County of Fernley, Nevada. Filed as Exhibit 4.8 to the Company’s Current Report on Form 8-K filed November 25, 2014 and incorporated herein by reference. | |
| 4.30 | Intellectual Property Security Agreement, dated November 20, 2014, by and between Trex Company, Inc. as debtor; and Branch Banking and Trust Company, in its capacity as Administrative Agent under the Second Amended and Restated Credit Agreement and acting as agent for itself and the other secured parties. Filed as Exhibit 4.9 to the Company’s Current Report on Form 8-K filed November 25, 2014 and incorporated herein by reference. | |
| 10.1 | Description of Management Compensatory Plans and Arrangements. Filed herewith. ** | |
| 10.2 | Trex Company, Inc. 2014 Stock Incentive Plan. Filed as Exhibit 10.1 to the Company’s Quarterly Report on Form 10-Q for the quarterly period ended June 30, 2014 and incorporated herein by reference. ** | |
| 10.3 | Trex Company, Inc. Amended and Restated 1999 Incentive Plan for Outside Directors. Filed herewith. ** | |
40
Table of Contents
| Exhibit |
Exhibit Description | |
| 10.4 | Form of Trex Company, Inc. 2005 Stock Incentive Plan Time-Based Restricted Stock Agreement. Filed as Exhibit 10.7 to the Company’s Annual Report on Form 10-K for the fiscal year ended December 31, 2013 and incorporated herein by reference. ** | |
| 10.5 | Form of Trex Company, Inc. 2005 Stock Incentive Plan Performance-Based Restricted Stock Agreement. Filed as Exhibit 10.8 to the Company’s Annual Report on Form 10-K for the fiscal year ended December 31, 2013 and incorporated herein by reference. ** | |
| 10.6 | Form of Trex Company, Inc. Amended and Restated 1999 Incentive Plan for Outside Directors Stock Appreciation Rights Agreement. Filed as Exhibit 10.3 to the Company’s Quarterly Report on Form 10-Q for the quarterly period ended September 30, 2006 and incorporated herein by reference. ** | |
| 10.7 | Form of Trex Company, Inc. Amended and Restated 1999 Incentive Plan for Outside Directors Restricted Stock Agreement. Filed as Exhibit 10.10 to the Company’s Annual Report on Form 10-K for the fiscal year ended December 31, 2011 and incorporated herein by reference. ** | |
| 10.8 | Amendment and Restatement of Employment Agreement, dated as of July 24, 2012, between Trex Company, Inc. and Ronald W. Kaplan. Filed as Exhibit 10.2 to the Company’s Quarterly Report on Form 10-Q for the quarterly period ended September 30, 2012 and incorporated herein by reference. ** | |
| 10.9 | Amendment and Restatement of Change in Control Severance Agreement, dated as of August 3, 2011, between Trex Company, Inc. and Ronald W. Kaplan. Filed as Exhibit 10.2 to the Company’s Current Report on Form 8-K filed on August 9, 2011 and incorporated herein by reference. ** | |
| 10.10 | Form of Amendment and Restatement of Change in Control Severance Agreement between Trex Company, Inc. and Officers other than the Chief Executive Officer. Filed as Exhibit 10.3 to the Company’s Current Report on Form 8-K filed on August 9, 2011 and incorporated herein by reference. ** | |
| 10.11 | Form of Severance Agreement between Trex Company, Inc. and Officers other than the Chief Executive Officer. Filed as Exhibit 10.1 to the Company’s Quarterly Report on Form 10-Q for the quarterly period ended June 30, 2013 and incorporated herein by reference. ** | |
| 10.12 | Retention Agreement, dated as of July 24, 2012, between Trex Company, Inc. and Ronald W. Kaplan. Filed as Exhibit 10.3 to the Company’s Quarterly Report on Form 10-Q for the quarterly period ended September 30, 2012 and incorporated herein by reference. ** | |
| 10.13 | Retention Agreement, dated as of July 24, 2012, between Trex Company, Inc. and James E. Cline. Filed as Exhibit 10.4 to the Company’s Quarterly Report on Form 10-Q for the quarterly period ended September 30, 2012 and incorporated herein by reference. ** | |
| 10.14 | Retention Agreement, dated as of July 24, 2012, between Trex Company, Inc. and William R. Gupp. Filed as Exhibit 10.5 to the Company’s Quarterly Report on Form 10-Q for the quarterly period ended September 30, 2012 and incorporated herein by reference.*, ** | |
| 10.15 | Retention Agreement, dated as of July 24, 2012, between Trex Company, Inc. and F. Timothy Reese. Filed as Exhibit 10.6 to the Company’s Quarterly Report on Form 10-Q for the quarterly period ended September 30, 2012 and incorporated herein by reference. ** | |
| 10.16 | Form of Indemnity Agreement for Directors. Filed as Exhibit 10.19 to the Company’s Annual Report on Form 10-K for the fiscal year ended December 31, 2008 and incorporated herein by reference. | |
| 10.17 | Form of Indemnity Agreement for Officers. Filed as Exhibit 10.20 to the Company’s Annual Report on Form 10-K for the fiscal year ended December 31, 2008 and incorporated herein by reference. | |
41
Table of Contents
| Exhibit |
Exhibit Description | |
| 10.18 | Form of Indemnity Agreement for Director/Officers. Filed as Exhibit 10.21 to the Company’s Annual Report on Form 10-K for the fiscal year ended December 31, 2008 and incorporated herein by reference. | |
| 10.19 | Form of Distributor Agreement of TREX Company, Inc. Filed as Exhibit 10.23 to the Company’s Annual Report on Form 10-K for the fiscal year ended December 31, 2008 and incorporated herein by reference. | |
| 10.20 | Form of Trex Company, Inc. Fencing Agreement for Installers/Retailers. Filed as Exhibit 10.4 to the Company’s Quarterly Report on Form 10-Q for the quarterly period ended September 30, 2006 and incorporated herein by reference. | |
| 10.21 | Deed of Lease, dated June 15, 2000, between TREX Company, LLC and Space, LLC. Filed as Exhibit 10.16 to the Company’s Annual Report on Form 10-K for the fiscal year ended December 31, 2000 and incorporated herein by reference. | |
| 10.22 | Amendment, dated February 22, 2010, of Deed of Lease dated as of June 15, 2000, between Trex Company, Inc., as successor by merger to Trex Company, LLC, and TC.V.LLC, as successor to Space, LLC. Filed as Exhibit 10.1 to the Company’s Quarterly Report on Form 10-Q for the quarterly period ended March 31, 2010 and incorporated herein by reference. | |
| 10.23 | Deed of Lease, dated as of July 27, 2005, between the Company and 1 Dulles Town Center, L.L.C. Filed as Exhibit 10.34 to the Company’s Annual Report on Form 10-K for the fiscal year ended December 31, 2005 and incorporated herein by reference.* | |
| 21 | Subsidiaries of the Company. Filed herewith. | |
| 23 | Consent of Ernst & Young LLP, Independent Registered Public Accounting Firm. Filed herewith. | |
| 31.1 | Certification of Chief Executive Officer of the Company pursuant to Rule 13a-14(a) under the Securities Exchange Act of 1934. Filed herewith. | |
| 31.2 | Certification of Chief Financial Officer of the Company pursuant to Rule 13a-14(a) under the Securities Exchange Act of 1934. Filed herewith. | |
| 32 | Certifications pursuant to Rule 13a-14(b) under the Securities Exchange Act of 1934 and 18 U.S.C. § 1350. Filed herewith. | |
| 101.INS | XBRL Instance Document. Filed herewith. | |
| 101.SCH | XBRL Taxonomy Extension Schema Document. Filed herewith. | |
| 101.CAL | XBRL Taxonomy Extension Calculation Linkbase Document. Filed herewith. | |
| 101.DEF | XBRL Taxonomy Extension Definition Linkbase Document. Filed herewith. | |
| 101.LAB | XBRL Taxonomy Extension Label Linkbase Document. Filed herewith. | |
| 101.PRE | XBRL Taxonomy Extension Presentation Linkbase Document. Filed herewith. | |
| * | Portions of this exhibit have been omitted and filed separately with the Securities and Exchange Commission pursuant to a request for confidential treatment. |
| ** | Management contract or compensatory plan or agreement. |
42
Table of Contents
Index to Consolidated Financial Statements
The following Consolidated Financial Statement Schedule of the Registrant is filed as part of this Report as required to be included in Item 15(a)(2):
| Page | ||||
| F-27 | ||||
F-1
Table of Contents
Report of Ernst & Young LLP, Independent Registered Public Accounting Firm
The Board of Directors and Stockholders of Trex Company, Inc.
We have audited the accompanying consolidated balance sheets of Trex Company, Inc. as of December 31, 2014 and 2013, and the related consolidated statements of comprehensive income, changes in stockholders’ equity and cash flows for each of the three years in the period ended December 31, 2014. Our audits also included the financial statement schedule listed in the Index at Item 15(a). These financial statements and schedule are the responsibility of the Company’s management. Our responsibility is to express an opinion on these financial statements and schedule based on our audits.
We conducted our audits in accordance with the standards of the Public Company Accounting Oversight Board (United States). Those standards require that we plan and perform the audit to obtain reasonable assurance about whether the financial statements are free of material misstatement. An audit includes examining, on a test basis, evidence supporting the amounts and disclosures in the financial statements. An audit also includes assessing the accounting principles used and significant estimates made by management, as well as evaluating the overall financial statement presentation. We believe that our audits provide a reasonable basis for our opinion.
In our opinion, the financial statements referred to above present fairly, in all material respects, the consolidated financial position of Trex Company, Inc. at December 31, 2014 and 2013, and the consolidated results of its operations and its cash flows for each of the three years in the period ended December 31, 2014, in conformity with U.S. generally accepted accounting principles. Also, in our opinion, the related financial statement schedule, when considered in relation to the basic financial statements taken as a whole, presents fairly in all material respects the information set forth therein.
We also have audited, in accordance with the standards of the Public Company Accounting Oversight Board (United States), Trex Company, Inc.’s internal control over financial reporting as of December 31, 2014, based on criteria established in Internal Control-Integrated Framework issued by the Committee of Sponsoring Organizations of the Treadway Commission (2013 framework) and our report dated February 24, 2015 expressed an unqualified opinion thereon.
/s/ Ernst & Young LLP
Richmond, Virginia
February 24, 2015
F-2
Table of Contents
TREX COMPANY, INC.
| December 31, | ||||||||
| 2014 | 2013 | |||||||
| (In thousands) | ||||||||
| ASSETS |
||||||||
| Current Assets: |
||||||||
| Cash and cash equivalents |
$ | 9,544 | $ | 3,772 | ||||
| Accounts receivable, net |
36,391 | 37,338 | ||||||
| Inventories |
23,747 | 22,428 | ||||||
| Prepaid expenses and other assets |
6,288 | 3,145 | ||||||
| Deferred income taxes |
9,271 | 9,497 | ||||||
|
|
|
|
|
|||||
| Total current assets |
85,241 | 76,180 | ||||||
| Property, plant and equipment, net |
98,716 | 100,783 | ||||||
| Goodwill and other intangibles |
10,534 | 10,542 | ||||||
| Other assets |
1,333 | 652 | ||||||
|
|
|
|
|
|||||
| Total Assets |
$ | 195,824 | $ | 188,157 | ||||
|
|
|
|
|
|||||
| LIABILITIES AND STOCKHOLDERS’ EQUITY |
||||||||
| Current Liabilities: |
||||||||
| Accounts payable |
$ | 20,050 | $ | 14,891 | ||||
| Accrued expenses |
20,660 | 23,295 | ||||||
| Accrued warranty |
8,744 | 9,000 | ||||||
|
|
|
|
|
|||||
| Total current liabilities |
49,454 | 47,186 | ||||||
| Deferred income taxes |
3,708 | 360 | ||||||
| Non-current accrued warranty |
25,097 | 31,812 | ||||||
| Other long-term liabilities |
4,180 | 2,183 | ||||||
|
|
|
|
|
|||||
| Total Liabilities |
82,439 | 81,541 | ||||||
|
|
|
|
|
|||||
| Commitments and contingencies |
||||||||
| Stockholders’ Equity: |
||||||||
| Preferred stock, $0.01 par value, 3,000,000 shares authorized; none issued and outstanding |
— | — | ||||||
| Common stock, $0.01 par value, 80,000,000 shares authorized; 34,800,552 and 34,598,124 shares issued and 32,020,123 and 33,475,614 shares outstanding at December 31, 2014 and 2013, respectively |
348 | 346 | ||||||
| Additional paid-in capital |
116,740 | 101,494 | ||||||
| Retained earnings |
71,297 | 29,776 | ||||||
| Treasury stock, at cost, 2,780,429 and 1,122,510 shares at December 31, 2014 and 2013, respectively |
(75,000 | ) | (25,000 | ) | ||||
|
|
|
|
|
|||||
| Total Stockholders’ Equity |
113,385 | 106,616 | ||||||
|
|
|
|
|
|||||
| Total Liabilities and Stockholders’ Equity |
$ | 195,824 | $ | 188,157 | ||||
|
|
|
|
|
|||||
See accompanying notes to financial statements.
F-3
Table of Contents
TREX COMPANY, INC.
CONSOLIDATED STATEMENTS OF COMPREHENSIVE INCOME
| Year Ended December 31, | ||||||||||||
| 2014 | 2013 | 2012 | ||||||||||
| (In thousands, except share and per share data) | ||||||||||||
| Net sales |
$ | 391,660 | $ | 342,511 | $ | 307,354 | ||||||
| Cost of sales |
251,464 | 243,893 | 222,772 | |||||||||
|
|
|
|
|
|
|
|||||||
| Gross profit |
140,196 | 98,618 | 84,582 | |||||||||
| Selling, general and administrative expenses |
72,370 | 73,967 | 71,907 | |||||||||
|
|
|
|
|
|
|
|||||||
| Income from operations |
67,826 | 24,651 | 12,675 | |||||||||
| Interest expense, net |
878 | 602 | 8,946 | |||||||||
|
|
|
|
|
|
|
|||||||
| Income before income taxes |
66,948 | 24,049 | 3,729 | |||||||||
| Provision (benefit) for income taxes |
25,427 | (10,549 | ) | 1,009 | ||||||||
|
|
|
|
|
|
|
|||||||
| Net income |
$ | 41,521 | $ | 34,598 | $ | 2,720 | ||||||
|
|
|
|
|
|
|
|||||||
| Basic earnings per common share |
$ | 1.28 | $ | 1.03 | $ | 0.08 | ||||||
|
|
|
|
|
|
|
|||||||
| Basic weighted average common shares outstanding |
32,319,649 | 33,589,682 | 32,247,184 | |||||||||
|
|
|
|
|
|
|
|||||||
| Diluted earnings per common share |
$ | 1.27 | $ | 1.01 | $ | 0.08 | ||||||
|
|
|
|
|
|
|
|||||||
| Diluted weighted average common shares outstanding |
32,751,074 | 34,273,502 | 34,129,712 | |||||||||
|
|
|
|
|
|
|
|||||||
| Comprehensive income |
$ | 41,521 | $ | 34,598 | $ | 2,720 | ||||||
|
|
|
|
|
|
|
|||||||
See accompanying notes to financial statements.
F-4
Table of Contents
TREX COMPANY, INC.
CONSOLIDATED STATEMENTS OF CHANGES IN STOCKHOLDERS’ EQUITY
| Common Stock | Additional Paid-In Capital |
Retained Earnings (Deficit) |
Treasury Stock | Total | ||||||||||||||||||||||||
| Shares | Amount | Shares | Amount | |||||||||||||||||||||||||
| Balance, December 31, 2011 |
31,204,264 | $ | 329 | $ | 99,712 | $ | (7,542 | ) | — | $ | — | $ | 92,499 | |||||||||||||||
| Net income |
— | — | — | 2,720 | — | — | 2,720 | |||||||||||||||||||||
| Employee stock purchase and option plans |
469,104 | 2 | 820 | — | — | — | 822 | |||||||||||||||||||||
| Shares withheld for taxes on share-based payment awards |
(74,302 | ) | 1 | (5,525 | ) | — | — | — | (5,524 | ) | ||||||||||||||||||
| Stock-based compensation |
298,430 | — | 3,469 | — | — | — | 3,469 | |||||||||||||||||||||
| Common stock issued upon conversion of notes |
2,123,490 | 11 | (11 | ) | — | — | — | — | ||||||||||||||||||||
|
|
|
|
|
|
|
|
|
|
|
|
|
|
|
|||||||||||||||
| Balance, December 31, 2012 |
34,020,986 | 343 | 98,465 | (4,822 | ) | — | — | 93,986 | ||||||||||||||||||||
| Net income |
— | — | — | 34,598 | — | — | 34,598 | |||||||||||||||||||||
| Employee stock purchase and option plans |
542,670 | 3 | 4,029 | — | — | — | 4,032 | |||||||||||||||||||||
| Shares withheld for taxes on share-based payment awards |
(58,730 | ) | — | (6,277 | ) | — | — | — | (6,277 | ) | ||||||||||||||||||
| Stock-based compensation |
93,198 | — | 3,811 | — | — | — | 3,811 | |||||||||||||||||||||
| Excess tax benefits from stock compensation |
— | — | 1,466 | — | — | — | 1,466 | |||||||||||||||||||||
| Shares repurchased under our publicly announced share repurchase programs |
(1,122,510 | ) | — | — | — | 1,122,510 | (25,000 | ) | (25,000 | ) | ||||||||||||||||||
|
|
|
|
|
|
|
|
|
|
|
|
|
|
|
|||||||||||||||
| Balance, December 31, 2013 |
33,475,614 | 346 | 101,494 | 29,776 | 1,122,510 | (25,000 | ) | 106,616 | ||||||||||||||||||||
| Net income |
— | — | — | 41,521 | — | — | 41,521 | |||||||||||||||||||||
| Employee stock purchase and option plans |
133,133 | 1 | 746 | — | — | — | 747 | |||||||||||||||||||||
| Shares withheld for taxes on share-based payment awards |
(36,610 | ) | — | (3,189 | ) | — | — | — | (3,189 | ) | ||||||||||||||||||
| Stock-based compensation |
105,905 | 1 | 4,806 | — | — | — | 4,807 | |||||||||||||||||||||
| Excess tax benefits from stock compensation |
— | — | 12,883 | — | — | — | 12,883 | |||||||||||||||||||||
| Shares repurchased under our publicly announced share repurchase programs |
(1,657,919 | ) | — | — | — | 1,657,919 | (50,000 | ) | (50,000 | ) | ||||||||||||||||||
|
|
|
|
|
|
|
|
|
|
|
|
|
|
|
|||||||||||||||
| Balance, December 31, 2014 |
32,020,123 | $ | 348 | $ | 116,740 | $ | 71,297 | 2,780,429 | $ | (75,000 | ) | $ | 113,385 | |||||||||||||||
|
|
|
|
|
|
|
|
|
|
|
|
|
|
|
|||||||||||||||
See accompanying notes to financial statements.
F-5
Table of Contents
TREX COMPANY, INC.
CONSOLIDATED STATEMENTS OF CASH FLOWS
| Year Ended December 31, | ||||||||||||
| 2014 | 2013 | 2012 | ||||||||||
| (In thousands) | ||||||||||||
| Operating Activities |
||||||||||||
| Net income |
$ | 41,521 | $ | 34,598 | $ | 2,720 | ||||||
| Adjustments to reconcile net income to net cash provided by operating activities: |
||||||||||||
| Depreciation and amortization |
15,204 | 16,255 | 17,009 | |||||||||
| Debt discount amortization |
— | — | 5,450 | |||||||||
| Deferred income taxes |
3,574 | (12,698 | ) | 618 | ||||||||
| Stock-based compensation |
4,807 | 3,811 | 3,469 | |||||||||
| Loss on disposal of property, plant and equipment |
158 | 587 | 1,909 | |||||||||
| Excess tax benefits from stock compensation |
(12,898 | ) | (1,466 | ) | — | |||||||
| Other non-cash adjustments |
(245 | ) | (337 | ) | (314 | ) | ||||||
| Changes in operating assets and liabilities: |
||||||||||||
| Accounts receivable |
867 | (10,844 | ) | 2,660 | ||||||||
| Inventories |
(1,319 | ) | (4,907 | ) | 11,376 | |||||||
| Prepaid expenses and other assets |
(624 | ) | (213 | ) | (405 | ) | ||||||
| Accounts payable |
5,159 | 3,731 | (731 | ) | ||||||||
| Accrued expenses and other liabilities |
(7,535 | ) | 15,173 | 16,784 | ||||||||
| Income taxes receivable/payable |
9,973 | 1,518 | (102 | ) | ||||||||
|
|
|
|
|
|
|
|||||||
| Net cash provided by operating activities |
58,642 | 45,208 | 60,443 | |||||||||
|
|
|
|
|
|
|
|||||||
| Investing Activities |
||||||||||||
| Expenditures for property, plant and equipment |
(12,974 | ) | (13,060 | ) | (7,593 | ) | ||||||
| Proceeds from sales of property, plant and equipment |
66 | 176 | 3 | |||||||||
| Purchase of acquired company, net of cash acquired |
(44 | ) | — | (11 | ) | |||||||
| Notes receivable, net |
79 | 187 | 117 | |||||||||
|
|
|
|
|
|
|
|||||||
| Net cash used in investing activities |
(12,873 | ) | (12,697 | ) | (7,484 | ) | ||||||
|
|
|
|
|
|
|
|||||||
| Financing Activities |
||||||||||||
| Financing costs |
(453 | ) | (119 | ) | (750 | ) | ||||||
| Restricted cash |
— | — | 37,000 | |||||||||
| Borrowings under line of credit |
143,000 | 74,500 | 93,700 | |||||||||
| Principal payments under line of credit |
(143,000 | ) | (79,500 | ) | (88,700 | ) | ||||||
| Principal payments under mortgages and notes |
— | — | (91,875 | ) | ||||||||
| Repurchases of common stock |
(53,189 | ) | (31,277 | ) | (5,522 | ) | ||||||
| Proceeds from employee stock purchase and option plans |
747 | 4,032 | 821 | |||||||||
| Excess tax benefits from stock compensation |
12,898 | 1,466 | — | |||||||||
|
|
|
|
|
|
|
|||||||
| Net cash used in financing activities |
(39,997 | ) | (30,898 | ) | (55,326 | ) | ||||||
|
|
|
|
|
|
|
|||||||
| Net increase (decrease) in cash and cash equivalents |
5,772 | 1,613 | (2,367 | ) | ||||||||
| Cash and cash equivalents at beginning of year |
3,772 | 2,159 | 4,526 | |||||||||
|
|
|
|
|
|
|
|||||||
| Cash and cash equivalents at end of year |
$ | 9,544 | $ | 3,772 | $ | 2,159 | ||||||
|
|
|
|
|
|
|
|||||||
| Supplemental disclosures of cash flow information: |
||||||||||||
| Cash paid for interest, net of capitalized interest |
$ | 520 | $ | 348 | $ | 5,792 | ||||||
| Cash paid for income taxes, net |
$ | 11,919 | $ | 672 | $ | 590 | ||||||
See accompanying notes to financial statements.
F-6
Table of Contents
TREX COMPANY, INC.
NOTES TO CONSOLIDATED FINANCIAL STATEMENTS
| 1. | BUSINESS AND ORGANIZATION |
Trex Company, Inc. (together with its subsidiary, the “Company”), a Delaware corporation, was incorporated on September 4, 1998. The Company manufactures and distributes wood/plastic composite products, as well as related accessories, primarily for residential and commercial decking and railing applications. A majority of its products are manufactured in a proprietary process that combines waste wood fibers and scrap polyethylene. The Company operates in one business segment.
| 2. | SUMMARY OF SIGNIFICANT ACCOUNTING POLICIES |
Basis of Accounting
The accompanying consolidated financial statements have been prepared in accordance with accounting principles generally accepted in the United States and include the accounts of the Company and its wholly-owned subsidiary, Trex Wood-Polymer Espana, S.L. (“TWPE”). Intercompany accounts and transactions have been eliminated in consolidation.
TWPE was formed to hold the Company’s 35% equity interest in Denplax, S.A. (“Denplax”), a joint venture with a Spanish Company responsible for public environmental programs in southern Spain and with an Italian equipment manufacturer. The joint venture was formed to recycle polyethylene at a facility in El Ejido, Spain. The Company’s investment in Denplax is accounted for using the equity method. During 2010, the Company determined that its investment in Denplax and a related note receivable were no longer recoverable and recorded a $2.4 million charge to earnings to fully reserve the equity investment and note. Both the equity investment and note remain fully reserved as of December 31, 2014.
Stock Split
In February 2014, the Company’s Board of Directors approved a two-for-one stock split of the Company’s common stock, par value $0.01. The stock split was in the form of a stock dividend distributed on May 7, 2014 to stockholders of record at the close of business on April 7, 2014. The stock split entitled each stockholder to receive one additional share of common stock, par value $0.01, for each share they held as of the record date. All common stock share and per share data for all periods presented in the accompanying consolidated financial statements and related notes are presented on a post-split basis. Additionally, on April 30, 2014, the Company’s stockholders approved an amendment to the Company’s Restated Certificate of Incorporation to increase the number of authorized shares of common stock from 40 million to 80 million shares.
Use of Estimates
The preparation of financial statements in conformity with accounting principles generally accepted in the United States requires management to make estimates and assumptions that affect the amounts reported in the consolidated financial statements and the accompanying notes. Actual results could differ from those estimates.
Cash and Cash Equivalents
Cash equivalents consist of highly liquid investments purchased with original maturities of three months or less.
F-7
Table of Contents
Concentrations and Credit Risk
The Company’s financial instruments that are exposed to concentrations of credit risk consist primarily of cash and cash equivalents and trade accounts receivable. The Company from time to time may have bank deposits in excess of insurance limits of the Federal Deposit Insurance Corporation. As of December 31, 2014, substantially all deposits are maintained in one financial institution. The Company has not experienced any losses in such accounts and believes it is not exposed to any significant credit risk related to its cash and cash equivalents.
The Company routinely assesses the financial strength of its customers and believes that its trade receivables credit risk exposure is limited. Trade receivables are carried at the original invoice amount less an estimate made for payment discounts and doubtful accounts. A valuation allowance is provided for known and anticipated credit losses and disputed amounts, as determined by management in the course of regularly evaluating individual customer receivables. This evaluation takes into consideration a customer’s financial condition and credit history, as well as current economic conditions.
In the years ended December 31, 2014, 2013 and 2012, sales to certain customers accounted for 10% or more of the Company’s total net sales. For the year ended December 31, 2014, one customer of the Company represented approximately 24% of the Company’s net sales. For the year ended December 31, 2013, one customer of the Company represented approximately 28% of the Company’s net sales. For the year ended December 31, 2012, two customers of the Company represented approximately 26% and 10% of the Company’s net sales. As of December 31, 2014, three customers represented 28%, 13%, and 11%, respectively, of the Company’s accounts receivable balance.
Approximately 38%, 44%, and 40% of the Company’s raw materials purchases for the years ended December 31, 2014, 2013 and 2012, respectively, were purchased from its four largest suppliers.
Inventories
Inventories are stated at the lower of cost (last-in, first-out, or “LIFO” method) or market value. The Company periodically reviews its inventory for slow moving or obsolete items and writes down the related products to estimated realizable value. The Company has not established significant reserves for estimated slow moving products or obsolescence. At December 31, 2014, the excess of the replacement cost of inventory over the LIFO value of inventory was approximately $25.3 million. Due to the nature of the LIFO valuation methodology, liquidations of inventories will result in a portion of the Company’s cost of sales being based on historical rather than current year costs.
A majority of the Company’s products are made in a proprietary process that combines waste wood fibers and scrap polyethylene. The Company grinds up scrap materials generated from its manufacturing process and inventories deemed no longer salable and reintroduces the “reclaimed” material into the manufacturing process as a substitute for raw materials. The reclaimed material is valued at the costs of the raw material components of the material.
Property, Plant and Equipment
Property, plant and equipment are stated at historical cost. The costs of additions and improvements are capitalized, while maintenance and repairs are expensed as incurred. Depreciation is provided using the straight-line method over the following estimated useful lives:
| Buildings |
40 years | |||
| Machinery and equipment |
3-11 years | |||
| Furniture and equipment |
10 years | |||
| Forklifts and tractors |
5 years | |||
| Computer equipment and software |
3-5 years |
F-8
Table of Contents
Leasehold improvements are amortized over the shorter of the lease term or the estimated useful life of the asset.
The Company reviews its long-lived assets, including property, plant and equipment, whenever events or changes in circumstances indicate that the carrying amount of the assets may not be fully recoverable. To determine the recoverability of its long-lived assets, the Company evaluates the probability that future estimated undiscounted net cash flows will be less than the carrying amount of the long-lived assets. If the estimated cash flows are less than the carrying amount of the long-lived assets, the assets are written down to their fair value. The Company’s estimates of anticipated cash flows and the remaining estimated useful lives of long-lived assets could be reduced in the future. As a result, the carrying amount of long-lived assets could be reduced in the future.
Contract Termination Costs
In anticipation of relocating its corporate headquarters, the Company entered into a lease agreement in 2005. The Company reconsidered and decided not to move its headquarters. The lease obligates the Company to lease 55,047 square feet of office space through June 30, 2019. As of December 31, 2014, the Company has executed subleases for 24,732 square feet of the leased space and is currently marketing the remaining portion of the space to find a suitable tenant. The Company estimates that the present value of the estimated future sublease receipts, net of transaction costs, will be less than the remaining minimum lease payment obligations under its lease and has recorded a liability for the expected shortfall. The Company recorded a $1.1 million charge in 2013 after a subtenant defaulted on its sublease and vacated the space. During 2014, the Company recorded $1.5 million in charges due to downward revisions of its estimate of future sublease receipts resulting from the departure of a subtenant that decided not to renew its sublease at the end of 2014.
To estimate future sublease receipts, the Company has assumed that the existing subleases will be renewed or new subleases will be executed at rates consistent with rental rates in the current subleases or estimated market rates and that existing vacancies will be filled within one year. However, management cannot be certain that the timing of future subleases or the rental rates contained in future subleases will not differ from current estimates. Factors such as the availability of commercial office space, market conditions and subtenant preferences will influence the terms achieved in future subleases. The inability to sublet the office space in the future or unfavorable changes to key assumptions used in the estimate of the future sublease receipts may result in material charges to selling, general and administrative expenses in future periods.
Goodwill
Goodwill represents the excess of cost over net assets acquired resulting from the Company’s 1996 purchase of the Mobil Composite Products Division and the 2011 purchase of the assets of the Iron Deck Corporation. The Company evaluates the recoverability of goodwill annually or more frequently if an event occurs or circumstances change in the interim that would more likely than not reduce the fair value of the asset below its carrying amount. Goodwill is considered to be impaired when the net book value of the reporting unit exceeds its estimated fair value.
In the evaluation of goodwill for impairment, the Company first compares the fair value of the reporting unit to its carrying value. If the carrying value of a reporting unit exceeds its fair value, the goodwill of that reporting unit is potentially impaired and step two of the impairment analysis is performed. In step two of the analysis, an impairment loss is recorded equal to the excess of the carrying value of the reporting unit’s goodwill over its implied fair value should such a circumstance arise.
The Company measures fair value of the reporting unit based on a present value of future discounted cash flows and a market valuation approach. The discounted cash flows model indicates the fair value of the reporting unit based on the present value of the cash flows that the reporting unit is expected to generate in the future.
F-9
Table of Contents
Significant estimates in the discounted cash flows model include: the weighted average cost of capital; long-term rate of growth and profitability of the business; and working capital effects. The market valuation approach indicates the fair value of the business based on a comparison of the Company against certain market information. Significant estimates in the market approach model include identifying appropriate market multiples and assessing earnings before interest, income taxes, depreciation and amortization (EBITDA) in estimating the fair value of the reporting unit.
For the years ended December 31, 2014, 2013 and 2012, the Company completed its annual impairment test of goodwill and noted no impairment. The Company performs the annual impairment testing of its goodwill as of October 31 of each year. However, actual results could differ from the Company’s estimates and projections, which would affect the assessment of impairment. As of December 31, 2014, the Company had goodwill of $10.5 million that is subject to at least annual review of impairment.
Product Warranty
The Company warrants that its products will be free from material defects in workmanship and materials. This warranty generally extends for a period of 25 years for residential use and 10 years for commercial use. (With respect to TrexTrim™ and Trex Reveal® Railing, the warranty period is 25 years for both residential and commercial use.) With respect to the Company’s Transcend®, Enhance®, Select® and Universal Fascia product, the Company further warrants that the product will not fade in color more than a certain amount and will be resistant to permanent staining from food substances or mold (provided the stain is cleaned within seven days of appearance). This warranty extends for a period of 25 years for residential use and 10 years for commercial use. If there is a breach of such warranties, the Company has an obligation either to replace the defective product or refund the purchase price. The Company establishes warranty reserves to provide for estimated future expenses as a result of product defects that result in claims. Reserve estimates are based on management’s judgment, considering such factors as cost per claim, historical experience, anticipated rates of claims, and other available information. Management reviews and adjusts these estimates, if necessary, on a quarterly basis based on the differences between actual experience and historical estimates.
Treasury Stock
The Company records the repurchase of shares of its common stock at cost. These shares are considered treasury stock, which is a reduction to stockholders’ equity. Treasury stock is included in authorized and issued shares but excluded from outstanding shares.
Revenue Recognition
The Company recognizes revenue when title is transferred to customers, which is generally upon shipment of the product to the customer. The Company does not grant contractual product return rights to customers other than pursuant to its product warranty. The Company does not expect future product returns to be material and, consequently, does not maintain an allowance for product returns.
The Company records all shipping and handling fees in sales and records all of the related costs in cost of sales. The Company offers sales incentive programs to dealers and distributors, including rebates, pricing discounts, favorable payment terms and cooperative advertising, many of which result in cash consideration made to dealers and distributors. The Company accounts for consideration made pursuant to these programs in accordance with accounting guidance that governs consideration given by a vendor to a customer. With the exception of cooperative advertising, the Company classifies sales incentives as a reduction in revenue in “Net sales.” Sales incentives are recorded in the period in which they are earned by customers. The Company’s cooperative advertising program meets the requirements for exclusion from net sales and the costs are recorded as expenses in “Selling, general and administrative expenses” in the accompanying consolidated statements of comprehensive income. Cooperative advertising costs are expensed as incurred.
F-10
Table of Contents
Stock-Based Compensation
The Company measures stock-based compensation at the grant date of the award based on the fair value. For stock options, stock appreciation rights and time-based restricted stock, stock-based compensation is recognized on a straight line basis over the vesting periods of the award, net of an estimated forfeiture rate. For performance-based restricted stock, expense is recognized ratably over the performance and vesting period of each tranche based on management’s judgment of the ultimate award that is likely to be paid out based on the achievement of predetermined performance measures. Stock-based compensation expense is included in “Selling, general and administrative expenses” in the accompanying consolidated statements of comprehensive income.
Income Taxes
The Company recognizes deferred tax assets and liabilities based on the difference between the financial statement basis and tax basis of assets and liabilities using enacted rates expected to be in effect during the year in which the differences reverse. The Company assesses the likelihood that its deferred tax assets will be realized. Deferred tax assets are reduced by a valuation allowance when, after considering all available positive and negative evidence, it is determined that it is more likely than not that some portion, or all, of the deferred tax asset will not be realized.
At December 31, 2013, the Company determined that it more likely than not will realize most of its deferred tax assets and, as a result, reversed the valuation allowance against all but a few specific items primarily related to state tax credits it estimates will expire before they are realized. As of December 31, 2014, the Company continues to have a valuation allowance of $4.5 million against these deferred tax assets. The Company analyzes its position in subsequent reporting periods, considering all available positive and negative evidence, in determining the expected realization of its deferred tax assets.
Research and Development Costs
Research and development costs are expensed as incurred. For the years ended December 31, 2014, 2013 and 2012, research and development costs were $2.3 million, $2.9 million and $2.9 million, respectively, and have been included in “Selling, general and administrative expenses” in the accompanying consolidated statements of comprehensive income.
Advertising Costs
The Company expenses its branding and advertising communication costs as incurred. Significant production costs are deferred and recognized as expense in the period that the related advertisement is first used. At December 31, 2014 and December 31, 2013, $0.5 million and $0.5 million, respectively, were included in prepaid expenses for production costs.
For the years ended December 31, 2014, 2013 and 2012, branding expenses, including advertising expenses as described above, were $20.8 million, $20.9 million and $20.5 million, respectively.
Fair Value of Financial Instruments
The Company considers the recorded value of its financial assets and liabilities, consisting primarily of cash and cash equivalents, accounts receivable, accounts payable, accrued expenses and other current liabilities to approximate the fair value of the respective assets and liabilities at December 31, 2014 and 2013.
F-11
Table of Contents
New Accounting Standards Not Yet Adopted
In May 2014, the Financial Accounting Standards Board issued Accounting Standards Update 2014-09, “Revenue from Contracts with Customers.” The new standard provides a single, comprehensive model for revenue arising from contracts with customers and supersedes most current revenue recognition guidance. The new standard requires an entity to recognize revenue at an amount that reflects the consideration to which the company expects to be entitled in exchange for transferring goods or services to a customer. The new guidance is effective for fiscal years, and interim periods within those years, beginning after December 15, 2016 and allows for either full retrospective or modified retrospective application. No early adoption is permitted. The Company is currently assessing the impact of the adoption of this new standard on its consolidated financial statements and footnote disclosures and has not yet selected a method of adoption.
Reclassifications
Certain prior year amounts have been reclassified to conform to the current year presentation.
| 3. | INVENTORIES |
Inventories (at LIFO value) consist of the following as of December 31 (in thousands):
| 2014 | 2013 | |||||||
| Finished goods |
$ | 32,756 | $ | 30,423 | ||||
| Raw materials |
16,290 | 16,502 | ||||||
|
|
|
|
|
|||||
| Total FIFO inventories |
49,046 | 46,925 | ||||||
| Reserve to adjust inventories to LIFO value |
(25,299 | ) | (24,497 | ) | ||||
|
|
|
|
|
|||||
| Total LIFO inventories |
$ | 23,747 | $ | 22,428 | ||||
|
|
|
|
|
|||||
Inventory is stated at the lower of LIFO cost or net realizable value. The Company periodically reviews its inventory for slow moving or obsolete items and writes down the related products to estimated net realizable value.
Under the LIFO method, reductions in inventory cause a portion of the Company’s cost of sales to be based on historical costs rather than current year costs. During the year ended December 31, 2012, the Company recognized to cost of sales a $4.5 million benefit due to a reduction in inventory. No such inventory reduction occurred during the years ended December 31, 2014 and 2013.
| 4. | PROPERTY, PLANT AND EQUIPMENT |
Property, plant and equipment consist of the following as of December 31 (in thousands):
| 2014 | 2013 | |||||||
| Building and improvements |
$ | 50,394 | $ | 48,774 | ||||
| Machinery and equipment |
203,496 | 195,873 | ||||||
| Furniture and fixtures |
2,237 | 2,062 | ||||||
| Forklifts and tractors |
6,052 | 6,191 | ||||||
| Computer equipment |
8,120 | 8,353 | ||||||
| Construction in process |
6,707 | 7,619 | ||||||
| Land |
8,858 | 8,858 | ||||||
|
|
|
|
|
|||||
| Total property, plant and equipment |
285,864 | 277,730 | ||||||
| Accumulated depreciation |
(187,148 | ) | (176,947 | ) | ||||
|
|
|
|
|
|||||
| Total property, plant and equipment, net |
$ | 98,716 | $ | 100,783 | ||||
|
|
|
|
|
|||||
F-12
Table of Contents
The Company had construction in process as of December 31, 2014 of approximately $6.7 million. The Company expects that the construction in process will be completed and put into service in the year ending December 31, 2015.
Depreciation expense for the years ended December 31, 2014, 2013, and 2012 totaled $14.8 million, $15.9 million and $16.5 million, respectively.
| 5. | ACCRUED EXPENSES |
Accrued expenses consist of the following (in thousands):
| 2014 | 2013 | |||||||
| Accrued compensation and benefits |
$ | 9,201 | $ | 9,135 | ||||
| Accrued sales and marketing costs |
5,963 | 5,269 | ||||||
| Accrued rent obligations |
1,372 | 1,787 | ||||||
| Accrued manufacturing costs |
1,307 | 1,107 | ||||||
| Accrued legal contingency |
301 | 3,174 | ||||||
| Other |
2,516 | 2,823 | ||||||
|
|
|
|
|
|||||
| Total accrued expenses |
$ | 20,660 | $ | 23,295 | ||||
|
|
|
|
|
|||||
| 6. | DEBT |
The Company’s debt consists of a revolving credit facility. At December 31, 2014, the Company had no outstanding indebtedness, and the interest rate on the revolving credit facility was 1.3%.
Revolving Credit Facility
On November 20, 2014, the Company entered into a Second Amended and Restated Credit Agreement (the “Second Amended Credit Agreement”) with Branch Banking and Trust Company (“BB&T”), as a Lender, Administrative Agent, Swing Line Lender and Letter of Credit Issuer; Citibank, N.A. and Bank of America, N.A., each as a Lender, and BB&T Capital Markets, as Lead Arranger. The Second Amended Credit Agreement amended and restated the Amended and Restated Credit Agreement dated as of January 6, 2012 by and among the Company, as borrower; BB&T as Lender, Administrative Agent, Swing Line Lender, Letter of Credit Issuer and a Collateral Agent; Wells Fargo Capital Finance, LLC, as a Lender and a Collateral Agent; and BB&T Capital Markets, as Lead Arranger, and as further amended (the “Prior Credit Agreement”). Under the Prior Credit Agreement, BB&T and Wells Fargo provided the Company with one or more revolving loans in a collective maximum principal amount of $100 million. The Second Amended Credit Agreement terminated the Revolver Notes and Swing Advance Notes under the Prior Credit Agreement. No additional fees were due or owing as a result of the termination of the aforementioned agreements.
The Second Amended Credit Agreement provides the Company with one or more revolving loans in a collective maximum principal amount of $150 million from January 1 through June 30 of each year, reducing to a maximum principal amount of $100 million from July 1 through December 31 of each year (the “Revolving Loan Limit”) throughout the term, which ends November 20, 2019.
Included within the Revolving Loan Limit are sublimits for a letter of credit facility in an amount not to exceed $15 million and swing advances in an aggregate principal amount at any time outstanding not to exceed $5 million. The Revolver Loans, the Letter of Credit Facility and the Swing Advance loans are for the purpose of raising working capital and supporting general business operations. The Company is not obligated to borrow any amount under the Revolving Loan Limit. Additionally, within the Revolving Loan Limit, the Company may borrow, repay, and reborrow, at any time or from time to time while the Revolving Loans are in effect.
F-13
Table of Contents
Base Rate Advances (as defined in the Second Amended Credit Agreement) under the Revolver Loans and the Swing Advances accrue interest at the Base Rate plus the Applicable Margin (as defined in the Second Amended Credit Agreement) and Euro-dollar Advances for the Revolver Loans and Swing Advances accrue interest at the Adjusted London InterBank Offered Rate plus the Applicable Margin (as defined in the Second Amended Credit Agreement). Repayment of all then outstanding principal, interest, fees and costs is due on November 20, 2019.
The Company shall reimburse BB&T for all amounts payable, including interest, under a Letter of Credit at the earlier of (i) the date set forth in the application or (ii) one business day after the payment under such Letter of Credit by BB&T.
The Second Amended Credit Agreement is secured by interest in real property owned by us and certain collateral (as described in the Second Amended and Restated Security Agreement and Intellectual Property Security Agreement).
At December 31, 2014, the Company had no outstanding borrowings under the Revolver Loans and additional available borrowing capacity of approximately $100 million.
Compliance with Debt Covenants and Restrictions. The Company’s ability to make scheduled principal and interest payments, borrow and repay amounts under any outstanding revolving credit facility and continue to comply with any loan covenants depends primarily on its ability to generate sufficient cash flow from operations. To remain in compliance with financial covenants in the Second Amended Credit Agreement, the Company is required to maintain specified financial ratios based on levels of debt, fixed charges, and earnings (excluding extraordinary gains and extraordinary non-cash losses) before interest, taxes, depreciation and amortization, all of which are subject to the risks of the business, some of which are discussed in this report under “Risk Factors.” The Company was in compliance with all covenants contained in Second Amended Credit Agreement at December 31, 2014. Under the Second Amended Credit Agreement, the material financial covenants and restrictions are as follows:
| (a) | Fixed Charge Coverage Ratio. The Fixed Charge Coverage Ratio is not permitted to be less than 1.5 to 1.0, measured as of the end of each Fiscal Quarter, commencing with the Fiscal Quarter ended September 30, 2014. |
| (b) | Consolidated Debt to Consolidated EBITDA Ratio. The Consolidated Debt to Consolidated EBITDA Ratio is not permitted to exceed 3.00 to 1.0 measured as of the end of each Fiscal Quarter (and in the case of Consolidated EBITDA, for the four-quarter period ending on such date). |
Failure to comply with the financial covenants in the Second Amended Credit Agreement could be considered a default of repayment obligations and, among other remedies, could accelerate payment of any amounts outstanding under the Second Amended Credit Agreement.
F-14
Table of Contents
| 7. | STOCKHOLDERS’ EQUITY |
Earnings Per Share
The following table sets forth the computation of basic and diluted earnings per share (in thousands, except share and per share data):
| Year Ended December 31, | ||||||||||||
| 2014 | 2013 | 2012 | ||||||||||
| Numerator: |
||||||||||||
| Net income |
$ | 41,521 | $ | 34,598 | $ | 2,720 | ||||||
|
|
|
|
|
|
|
|||||||
| Denominator: |
||||||||||||
| Basic weighted average shares outstanding |
32,319,649 | 33,589,682 | 32,247,184 | |||||||||
| Effect of dilutive securities: |
||||||||||||
| SARS and options |
262,730 | 510,706 | 812,964 | |||||||||
| Restricted stock |
168,695 | 173,114 | 103,598 | |||||||||
| Convertible notes |
— | — | 965,966 | |||||||||
|
|
|
|
|
|
|
|||||||
| Diluted weighted average shares outstanding |
32,751,074 | 34,273,502 | 34,129,712 | |||||||||
|
|
|
|
|
|
|
|||||||
| Basic earnings per share |
$ | 1.28 | $ | 1.03 | $ | 0.08 | ||||||
|
|
|
|
|
|
|
|||||||
| Diluted earnings per share |
$ | 1.27 | $ | 1.01 | $ | 0.08 | ||||||
|
|
|
|
|
|
|
|||||||
Diluted earnings per share is computed using the weighted average number of shares determined for the basic earnings per share computation plus the dilutive effect of common stock equivalents using the treasury stock method. The computation of diluted earnings per share excludes the following potentially dilutive securities because the effect would be anti-dilutive:
| Year Ended December 31, | ||||||||||||
| 2014 | 2013 | 2012 | ||||||||||
| Restricted stock and stock options |
2,633 | 118,596 | 234,644 | |||||||||
| Stock appreciation rights |
1,969 | 73,154 | 242,412 | |||||||||
Stock Split
In February 2014, the Company’s Board of Directors approved a two-for-one stock split of the Company’s common stock, par value $0.01. The stock split was in the form of a stock dividend distributed on May 7, 2014 to stockholders of record at the close of business on April 7, 2014. The stock split entitled each stockholder to receive one additional share of common stock, par value $0.01, for each share they held as of the record date. All common stock share and per share data for all periods presented in the accompanying consolidated financial statements and related notes are presented on a post-split basis. Additionally, on April 30, 2014, the Company’s stockholders approved an amendment to the Company’s Restated Certificate of Incorporation to increase the number of authorized shares of common stock from 40 million to 80 million shares.
Stock Repurchase Programs
On October 24, 2013, the Board of Directors authorized a common stock repurchase program, expiring on February 10, 2014, of up to $30 million of our outstanding common stock (the “October 2013 Stock Repurchase Program”). The Company made no repurchases under the October 2013 Stock Repurchase Program before it expired.
On February 19, 2014, the Board of Directors authorized a common stock repurchase program of up to $50 million of the company’s outstanding common stock (the “February 2014 Stock Repurchase Program”). This
F-15
Table of Contents
authorization had no expiration date. During the three months ended June 30, 2014, the Company repurchased 1,657,919 shares for $50.0 million at an average price of $30.16 per share, which completed the authorization under the February 2014 Stock Repurchase Program. The share and per share data for the repurchases are reflective of the two-for-one stock split distributed on May 7, 2014.
On October 23, 2014, the Board of Directors authorized a common stock repurchase program of up to two million shares of the Company’s outstanding common stock (the “October 2014 Stock Repurchase Program”). This authorization has no expiration date. As of December 31, 2014, no repurchases were made under the October 2014 Stock Repurchase Program.
| 8. | STOCK-BASED COMPENSATION |
On April 30, 2014, the Company’s stockholders approved the Trex Company, Inc. 2014 Stock Incentive Plan (“the Plan”), which was previously approved by the Board of Directors on February 19, 2014. The Plan amended and restated in its entirety the Trex Company, Inc. 2005 Stock Incentive Plan, as previously disclosed. The Plan is administered by the Compensation Committee of the Company’s Board of Directors. Stock-based compensation is granted to officers, directors and certain key employees in accordance with the provisions of the Plan. The Plan provides for grants of stock options, restricted stock, restricted stock units, stock appreciation rights (“SARs”), and unrestricted stock. The total aggregate number of shares of the Company’s common stock that may be issued under the Plan is 6,420,000, an increase of 60,000 shares from the previous plan and adjusted to reflect the two-for-one stock split distributed on May 7, 2014.
The Company recognizes stock-based compensation expense ratably over the period from grant date to the earlier of: (1) the vesting date of the award, or (2) the date the grantee is eligible to retire without forfeiting the award. For performance-based restricted stock, expense is recognized ratably over the performance and vesting period of each tranche based on management’s judgment of the ultimate award that is likely to be paid out based on the achievement of the predetermined performance measures. For the employee stock purchase plan, compensation expense is recognized related to the discount on purchases. The following table summarizes the Company’s stock-based compensation expense for the years ended December 31, 2014, 2013 and 2012 (in thousands):
| Year Ended December 31, | ||||||||||||
| 2014 | 2013 | 2012 | ||||||||||
| Time-based restricted stock |
$ | 2,974 | $ | 2,461 | $ | 2,035 | ||||||
| Performance-based restricted stock |
727 | — | — | |||||||||
| Stock appreciation rights |
1,035 | 1,251 | 1,369 | |||||||||
| Employee stock purchase plan |
71 | 99 | 65 | |||||||||
|
|
|
|
|
|
|
|||||||
| Total stock-based compensation |
$ | 4,807 | $ | 3,811 | $ | 3,469 | ||||||
|
|
|
|
|
|
|
|||||||
Stock-based compensation expense is included in “Selling, general and administrative expenses” in the accompanying consolidated statements of comprehensive income.
Time-Based Restricted Stock
The fair value of time-based restricted stock is determined based on the closing price of the Company’s shares on the grant date. Shares of time-based restricted stock vest based on the terms of the awards. Unvested time-based restricted stock is generally forfeitable upon termination of a holder’s service as an employee unless the individual’s service is terminated due to retirement, death or permanent disability. The total fair value of time-based restricted shares vested for the years ended December 31, 2014, 2013 and 2012 was $3.9 million, $3.1 million, and $2.5 million, respectively. At December 31, 2014, there was $2.8 million of total compensation expense related to unvested time-based restricted stock remaining to be recognized over a weighted-average period of approximately 1.5 years.
F-16
Table of Contents
Time-based restricted stock activity under the Plan and all predecessor stock incentive plans is as follows:
| Time-based Restricted Stock |
Weighted-Average Grant Price Per Share |
|||||||
| Nonvested at December 31, 2011 |
320,350 | $ | 11.50 | |||||
| Granted |
313,854 | $ | 13.59 | |||||
| Vested |
(189,410 | ) | $ | 13.44 | ||||
| Forfeited |
(15,424 | ) | $ | 12.74 | ||||
|
|
|
|||||||
| Nonvested at December 31, 2012 |
429,370 | $ | 12.08 | |||||
| Granted |
94,030 | $ | 22.21 | |||||
| Vested |
(139,594 | ) | $ | 22.28 | ||||
| Forfeited |
(832 | ) | $ | 16.16 | ||||
|
|
|
|||||||
| Nonvested at December 31, 2013 |
382,974 | $ | 13.78 | |||||
| Granted |
66,511 | $ | 32.70 | |||||
| Vested |
(116,641 | ) | $ | 33.73 | ||||
| Forfeited |
(3,282 | ) | $ | 16.61 | ||||
|
|
|
|||||||
| Nonvested at December 31, 2014 |
329,562 | $ | 18.89 | |||||
|
|
|
|||||||
Performance-based Restricted Stock
In 2014, the Company began granting performance-based restricted stock in addition to the time-based restricted stock it previously granted. The fair value of performance-based restricted stock is determined based on the closing price of the Company’s shares on the grant date. Unvested performance-based restricted stock is generally forfeitable upon termination of a holder’s service as an employee unless the individual’s service is terminated due to retirement, death or permanent disability. The performance-based restricted shares have a three-year vesting period, vesting one-third each year based on target earnings before interest, taxes, depreciation and amortization, or “EBITDA”, for 1 year, cumulative 2 years and cumulative 3 years, respectively. With respect to each vesting, the number of shares that will vest will be between 0% and 200% of the target number of shares. As of December 31, 2014, no performance-based restricted shares had vested. At December 31, 2014, there was $0.6 million of total compensation expense related to unvested performance-based restricted stock remaining to be recognized over a weighted-average period of approximately 1.6 years.
Performance-based restricted stock activity under the Plan is as follows:
| Performance-based Restricted Stock |
Weighted-Average Grant Price Per Share |
|||||||
| Nonvested at December 31, 2013 |
— | $ | — | |||||
| Granted |
42,676 | $ | 33.72 | |||||
| Vested |
— | $ | — | |||||
| Forfeited |
— | $ | — | |||||
|
|
|
|||||||
| Nonvested at December 31, 2014 |
42,676 | $ | 33.72 | |||||
|
|
|
|||||||
Stock Appreciation Rights
SARs are granted with a grant price equal to the closing market price of the Company’s common stock on the date of grant. These awards expire ten years after the date of grant and vest based on the terms of the individual awards. The SARs are generally forfeitable upon termination of a holder’s service as an employee or director unless the individual’s service is terminated due to retirement, death or permanent disability. The Company recognizes compensation cost on a straight-line basis over the vesting period for the award. In 2006, the Company began the use of SARs instead of stock options.
F-17
Table of Contents
As of December 31, 2014, there was $0.5 million of unrecognized compensation cost related to SARs expected to be recognized over a weighted-average period of approximately 6.5 years. The fair value of each SAR is estimated on the date of grant using a Black-Scholes option-pricing model. For SARs issued in the years ended December 31, 2014, 2013 and 2012, respectively, the assumptions shown in the following table were used:
| Year Ended December 31, | ||||||||||||
| 2014 | 2013 | 2012 | ||||||||||
| Dividend yield |
0 | % | 0 | % | 0 | % | ||||||
| Average risk-free interest rate |
1.7 | % | 0.7 | % | 0.8 | % | ||||||
| Expected term (years) |
5 | 5 | 5 | |||||||||
| Expected volatility |
52.6 | % | 63.7 | % | 65.9 | % | ||||||
Expected Volatility. Volatility is a measure of the amount by which a financial variable such as a share price has fluctuated (historical volatility) or is expected to fluctuate (expected volatility) during a period. The Company has used the historical volatility over the average expected term of the options granted as the expected volatility.
Risk-Free Interest Rate. The Company uses the U.S. Treasury rate having a term that most closely resembles the expected term of the option.
Expected Term. The expected term is the period of time that the SARs granted is expected to remain unexercised. SARs granted during the year ended December 31, 2014 had a maximum term of ten years. The Company used historical exercise behavior with further consideration given to the class of employees to whom the equity awards were granted to estimate the expected term of the SAR.
The forfeiture rate is the estimated percentage of equity awards granted that are expected to be forfeited or canceled before becoming fully vested. The Company estimates forfeitures based on historical experience with further consideration given to the class of employees to whom the equity awards were granted.
The weighted-average grant date fair value of SARs granted during the years ended December 31, 2014, 2013 and 2012 was $17.78, $11.67, and $7.06, respectively.
SAR activity under the Plan and all predecessor stock incentive plans is as follows:
| SARs | Weighted- Average Grant Price Per Share |
Weighted- Average Remaining Contractual Life (Years) |
Aggregate Intrinsic Value as of December 31, 2014 |
|||||||||||||
| Outstanding at December 31, 2011 |
2,325,410 | $ | 6.59 | |||||||||||||
| Granted |
201,828 | $ | 12.88 | |||||||||||||
| Exercised |
(1,135,906 | ) | $ | 6.54 | ||||||||||||
| Canceled |
(16,952 | ) | $ | 12.08 | ||||||||||||
|
|
|
|||||||||||||||
| Outstanding at December 31, 2012 |
1,374,380 | $ | 9.28 | |||||||||||||
| Granted |
121,176 | $ | 21.95 | |||||||||||||
| Exercised |
(749,334 | ) | $ | 7.70 | ||||||||||||
| Canceled |
(7,028 | ) | $ | 13.10 | ||||||||||||
|
|
|
|||||||||||||||
| Outstanding at December 31, 2013 |
739,194 | $ | 12.93 | |||||||||||||
| Granted |
3,866 | $ | 37.88 | |||||||||||||
| Exercised |
(218,826 | ) | $ | 10.96 | ||||||||||||
| Canceled |
(8,404 | ) | $ | 4.74 | ||||||||||||
|
|
|
|||||||||||||||
| Outstanding at December 31, 2014 |
515,830 | $ | 13.98 | 6.5 | $ | 14,754,320 | ||||||||||
| Vested at December 31, 2014 |
383,488 | $ | 12.55 | 6.1 | $ | 11,514,749 | ||||||||||
| Exercisable at December 31, 2014 |
383,488 | $ | 12.55 | 6.1 | $ | 11,514,749 | ||||||||||
F-18
Table of Contents
Employee Stock Purchase Plan
The Company has an employee stock purchase plan (“ESPP”) that permits eligible employees to purchase shares of common stock of the Company at a purchase price which is the lesser of 85% of the market price on either the first day of the calendar quarter or the last day of the calendar quarter. Eligible employees may elect to participate in the plan by authorizing payroll deductions of up to 15% of gross compensation for each payroll period. On the last day of each quarter, each participant’s contribution account is used to purchase the maximum number of whole shares of common stock determined by dividing the contribution account’s balance by the purchase price. The aggregate number of shares of common stock that may be purchased under the plan is 600,000, adjusted to reflect the two-for-one stock split distributed on May 7, 2014. Through December 31, 2014, employees had purchased approximately 407,000 shares under the plan.
Stock Options
Stock options are granted with an exercise price equal to the closing market price of the Company’s common stock on the date of grant. These awards expire ten years after the date of grant and vest based on the terms of the individual awards. The options are generally forfeitable upon termination of a holder’s service as an employee or director, unless the individual’s service is terminated due to retirement, death or permanent disability. The fair value of each stock option award is estimated on the date of grant using a Black-Scholes option-pricing model. The Company recognizes compensation cost on a straight-line basis over the vesting period for the award. Prior to 2006, the Company granted stock options and all stock options outstanding at December 31, 2014 are fully vested. In 2006, the Company began the use of SARs instead of stock options.
Stock option activity under the Plan and all predecessor stock incentive plans is as follows:
| Options | Weighted- Average Exercise Price Per Share |
Weighted- Average Remaining Contractual Life (Years) |
Aggregate Intrinsic Value as of December 31, 2014 |
|||||||||||||
| Outstanding at December 31, 2011 |
290,138 | $ | 19.04 | |||||||||||||
| Granted |
— | $ | — | |||||||||||||
| Exercised |
(46,378 | ) | $ | 15.68 | ||||||||||||
| Canceled |
(2,484 | ) | $ | 10.00 | ||||||||||||
|
|
|
|||||||||||||||
| Outstanding at December 31, 2012 |
241,276 | $ | 20.19 | |||||||||||||
| Granted |
— | $ | — | |||||||||||||
| Exercised |
(186,968 | ) | $ | 24.92 | ||||||||||||
| Canceled |
(12,020 | ) | $ | 18.16 | ||||||||||||
|
|
|
|||||||||||||||
| Outstanding at December 31, 2013 |
42,288 | $ | 20.05 | |||||||||||||
| Granted |
— | $ | — | |||||||||||||
| Exercised |
(27,942 | ) | $ | 35.73 | ||||||||||||
| Canceled |
(1,188 | ) | $ | 17.92 | ||||||||||||
|
|
|
|||||||||||||||
| Outstanding at December 31, 2014 |
13,158 | $ | 23.36 | 0.2 | $ | 252,963 | ||||||||||
| Vested at December 31, 2014 |
13,158 | $ | 23.36 | 0.2 | $ | 252,963 | ||||||||||
| Exercisable at December 31, 2014 |
13,158 | $ | 23.36 | 0.2 | $ | 252,963 | ||||||||||
F-19
Table of Contents
| 9. | LEASES |
The Company leases office space, storage warehouses and certain office and plant equipment under various operating leases. Minimum annual payments under these non-cancelable leases as of December 31, 2014 were as follows (in thousands):
| Year Ending December 31, |
||||
| 2015 |
$ | 6,753 | ||
| 2016 |
5,490 | |||
| 2017 |
5,370 | |||
| 2018 |
5,308 | |||
| 2019 |
4,467 | |||
| Thereafter |
10,730 | |||
|
|
|
|||
| Total minimum lease payments |
$ | 38,118 | ||
|
|
|
|||
For the years ended December 31, 2014, 2013 and 2012, the Company recognized rental expenses of approximately $7.5 million, $6.5 million and $7.5 million, respectively.
For information related to the Company’s reconsidered corporate headquarters lease agreement, see Note 12.
| 10. | EMPLOYEE BENEFIT PLANS |
The Company has a 401(k) Profit Sharing Plan for the benefit of all employees who meet certain eligibility requirements. The plan covers substantially all of the Company’s full-time employees. The plan documents provide for the Company to match contributions equal to 100% of an employee’s contribution to the plan up to 6% of base salary. The Company’s contributions to the plan totaled $2.0 million, $1.8 million and $1.6 million for the years ended December 31, 2014, 2013 and 2012.
| 11. | INCOME TAXES |
Income tax provision (benefit) for the years ended December 31, 2014, 2013 and 2012 consists of the following (in thousands):
| Year Ended December 31, | ||||||||||||
| 2014 | 2013 | 2012 | ||||||||||
| Current income tax provision: |
||||||||||||
| Federal |
$ | 18,722 | $ | 1,745 | $ | 303 | ||||||
| State |
3,131 | 404 | 88 | |||||||||
|
|
|
|
|
|
|
|||||||
| 21,853 | 2,149 | 391 | ||||||||||
|
|
|
|
|
|
|
|||||||
| Deferred income tax provision (benefit): |
||||||||||||
| Federal |
3,118 | (11,182 | ) | 510 | ||||||||
| State |
456 | (1,516 | ) | 108 | ||||||||
|
|
|
|
|
|
|
|||||||
| 3,574 | (12,698 | ) | 618 | |||||||||
|
|
|
|
|
|
|
|||||||
| Total income tax provision (benefit) |
$ | 25,427 | $ | (10,549 | ) | $ | 1,009 | |||||
|
|
|
|
|
|
|
|||||||
F-20
Table of Contents
The income tax provision (benefit) differs from the amount of income tax determined by applying the U.S. federal statutory rate to income before taxes as a result of the following (in thousands):
| Year Ended December 31, | ||||||||||||
| 2014 | 2013 | 2012 | ||||||||||
| U.S. federal statutory taxes |
$ | 23,432 | $ | 8,417 | $ | 1,305 | ||||||
| State and local taxes, net of U.S. federal benefit |
2,856 | 1,061 | (418 | ) | ||||||||
| Permanent items |
(868 | ) | 225 | 198 | ||||||||
| Federal credits |
(214 | ) | (566 | ) | (54 | ) | ||||||
| Other |
(43 | ) | 244 | 46 | ||||||||
| Increase (decrease) in valuation allowance |
264 | (19,930 | ) | (68 | ) | |||||||
|
|
|
|
|
|
|
|||||||
| Total income tax provision (benefit) |
$ | 25,427 | $ | (10,549 | ) | $ | 1,009 | |||||
|
|
|
|
|
|
|
|||||||
Deferred tax assets and liabilities as of December 31, 2014 and 2013 consist of the following (in thousands):
| As of December 31, | ||||||||
| 2014 | 2013 | |||||||
| Deferred tax assets: |
||||||||
| Net operating losses |
$ | 347 | $ | 483 | ||||
| Warranty reserve |
13,032 | 16,085 | ||||||
| Stock-based compensation |
2,931 | 2,383 | ||||||
| Accruals not currently deductible and other |
5,221 | 6,210 | ||||||
| Inventories |
4,437 | 3,843 | ||||||
| State tax credit carryforwards |
4,050 | 3,714 | ||||||
|
|
|
|
|
|||||
| Gross deferred tax assets, before valuation allowance |
30,018 | 32,718 | ||||||
| Valuation allowance |
(4,465 | ) | (4,201 | ) | ||||
|
|
|
|
|
|||||
| Gross deferred tax assets, after valuation allowance |
25,553 | 28,517 | ||||||
|
|
|
|
|
|||||
| Deferred tax liabilities: |
||||||||
| Depreciation and other |
(19,990 | ) | (19,380 | ) | ||||
|
|
|
|
|
|||||
| Gross deferred tax liabilities |
(19,990 | ) | (19,380 | ) | ||||
|
|
|
|
|
|||||
| Net deferred tax asset |
$ | 5,563 | $ | 9,137 | ||||
|
|
|
|
|
|||||
The Company recognizes deferred tax assets and liabilities based on the difference between the financial statement basis and tax basis of assets and liabilities using enacted rates expected to be in effect during the year in which the differences reverse. In accordance with accounting standards, the Company assesses the likelihood that its deferred tax assets will be realized. Deferred tax assets are reduced by a valuation allowance when, after considering all available positive and negative evidence, it is determined that it is more likely than not that some portion, or all, of the deferred tax asset will not be realized.
During 2013, the Company realized $9.1 million of deferred tax assets previously reserved under a valuation allowance. Additionally, as a result of all positive and negative evidence available as of December 31, 2013, the Company determined that it would realize the majority of its remaining deferred tax asset and, as a result, reversed the valuation allowance against all but a few specific items primarily related to state tax credits it estimates will expire before they are realized resulting in a tax benefit of $10.9 million. As of December 31, 2014, the Company continues to have a valuation allowance of $4.5 million against these deferred tax assets. The Company will analyze its position in subsequent reporting periods, considering all available positive and negative evidence, in determining the expected realization of its deferred tax assets.
F-21
Table of Contents
The Company recognizes excess tax benefits for stock-based awards as an increase to additional paid-in capital only when realized. The Company realized $12.9 million of excess tax benefits during 2014 and, accordingly, recorded an increase to additional paid-in capital.
The Company has identified no uncertain tax positions and accordingly, has not recorded any unrecognized tax benefits or associated interest and penalties. The Company recognizes interest and penalties related to tax matters as a component of “Selling, general and administrative expenses” in the accompanying consolidated statements of comprehensive income.
The Company operates in multiple tax jurisdictions and, in the normal course of business, its tax returns are subject to examination by various taxing authorities. Such examinations may result in future assessments by these taxing authorities, and the Company has accrued a liability when it believes that it is not more likely than not that it will realize the benefits of tax positions that it has taken or for the amount of any tax benefit that exceeds the cumulative probability threshold in accordance with accounting standards. As of December 31, 2014, federal tax years 2011 through 2013 remain subject to examination. The Company believes that adequate provisions have been made for all tax returns subject to examination. Sales made to foreign distributors are not taxable in any foreign jurisdictions as the Company does not have a taxable presence. During the year ended December 31, 2014, the Company’s returns filed with the state of Michigan for tax years 2008 through 2011 were examined. No material adjustments resulted from the audit.
In September 2013, the Internal Revenue Service issued Treasury Decision 9636, which enacted final tax regulations regarding the capitalization and expensing of amounts paid to acquire, produce, or improve tangible property. The regulations also include guidance regarding the retirement of depreciable property. The regulations are required to be effective in taxable years beginning on or after January 1, 2014. The Company assessed the impact of the final regulations on its financial statements and does not expect any material adjustments or changes.
| 12. | COMMITMENTS AND CONTINGENCIES |
Legal Matters
On December 16, 2013, the United States District Court, Northern District of California Court granted final approval of the settlement with the law firm of Hagens Berman Sobol Shapiro LLP, relating to the previously reported class action lawsuit brought on behalf of Dean Mahan, and other named and similarly situated plaintiffs generally which alleged certain defects in the Company’s products relating to mold growth, color fading and color variation. As of the date of this report, the Company has distributed all cash payments and rebate certificates under the settlement. Claimants who were denied relief could appeal Trex’s decision, and the deadline for appeals has now passed. The Company believes that payments to consumers for all relief under the settlement will not exceed approximately $1.0 million. In addition to such amount, the Company previously paid $1.8 million related to this litigation, representing payment of attorneys’ fees to class counsel and named plaintiff awards in the nationwide settlement and the settlement of corollary cases brought in Indiana, Kentucky, New Jersey and Michigan, all as previously disclosed.
The Company has other lawsuits, as well as other claims, pending against it which are ordinary routine litigation and claims incidental to the business. Management has evaluated the merits of these other lawsuits and claims, and believes that their ultimate resolution will not have a material effect on the Company’s consolidated financial condition, results of operations, liquidity or competitive position.
Purchase Commitments
The Company fulfills requirements for raw materials under both purchase orders and supply contracts. In the year ended December 31, 2014, the Company purchased substantially all of its waste wood fiber requirements under purchase orders, which do not involve long-term supply commitments. Substantially all of
F-22
Table of Contents
the Company’s scrap polyethylene purchases are under short-term supply contracts that average approximately two years, for which pricing is negotiated as needed.
The wood and polyethylene supply contracts generally provide that the Company is obligated to purchase all of the wood or polyethylene a supplier provides, if the wood or polyethylene meets certain specifications. The amount of wood and polyethylene the Company is required to purchase under these contracts varies with the production of its suppliers and, accordingly, is not fixed or determinable. As of December 31, 2014, the Company has purchase commitments under raw material supply contracts of $23.6 million, $13.3 million, $5.7 million and $48 thousand for the years ending December 31, 2015, 2016, 2017 and 2018, respectively.
The Company outsources the production of certain products to third-party manufacturers under supply contracts that commit the Company to purchase minimum levels for each year extending through 2015. The Company has purchase commitments under the third-party manufacturing contracts of $1.9 million for the year ending December 31, 2015.
Contract Termination Costs
In anticipation of relocating its corporate headquarters, the Company entered into a lease agreement in 2005. The Company reconsidered and decided not to move its headquarters. The lease obligates the Company to lease 55,047 square feet of office space through June 30, 2019. As of December 31, 2014, the Company has executed subleases for 24,732 square feet of the leased space and is currently marketing the remaining portion of the space to find a suitable tenant. The Company estimates that the present value of the estimated future sublease receipts, net of transaction costs, will be less than the remaining minimum lease payment obligations under its lease and has recorded a liability for the expected shortfall. The Company recorded a $1.1 million charge in 2013 after a subtenant defaulted on its sublease and vacated the space. During 2014, the Company recorded $1.5 million in charges due to downward revisions of its estimate of future sublease receipts resulting from the departure of a subtenant that decided not to renew its sublease at the end of 2014.
To estimate future sublease receipts, the Company has assumed that the existing subleases will be renewed or new subleases will be executed at rates consistent with rental rates in the current subleases or estimated market rates and that existing vacancies will be filled within one year. However, management cannot be certain that the timing of future subleases or the rental rates contained in future subleases will not differ from current estimates. Factors such as the availability of commercial office space, market conditions and subtenant preferences will influence the terms achieved in future subleases. The inability to sublet the office space in the future or unfavorable changes to key assumptions used in the estimate of the future sublease receipts may result in material charges to selling, general and administrative expenses in future periods.
As of December 31, 2014, the minimum payments remaining under the Company’s lease over the years ending December 31, 2015, 2016, 2017, 2018, and 2019 are $1.9 million, $1.9 million, $2.0 million, $2.0 million and $1.0 million, respectively. The minimum receipts remaining under the Company’s existing subleases over the years ending December 31, 2015, 2016, 2017, 2018, and 2019 are $0.7 million, $0.6 million, $0.6 million, $0.6 million and $0.4 million, respectively.
The following table provides information about the Company’s liability under the lease (in thousands):
| 2014 | 2013 | |||||||
| Beginning balance, January 1 |
$ | 1,787 | $ | 1,103 | ||||
| Net rental payments |
(403 | ) | (558 | ) | ||||
| Accretion of discount |
178 | 98 | ||||||
| Increase in net estimated contract termination costs |
1,471 | 1,144 | ||||||
|
|
|
|
|
|||||
| Ending balance, December 31 |
$ | 3,033 | $ | 1,787 | ||||
|
|
|
|
|
|||||
F-23
Table of Contents
Product Warranty
The Company warrants that its products will be free from material defects in workmanship and materials. This warranty generally extends for a period of 25 years for residential use and 10 years for commercial use. (With respect to TrexTrim™ and Trex Reveal® Railing, the warranty period is 25 years for both residential and commercial use.) With respect to the Company’s Transcend®, Enhance®, Select® and Universal Fascia product, the Company further warrants that the product will not fade in color more than a certain amount and will be resistant to permanent staining from food substances or mold (provided the stain is cleaned within seven days of appearance). This warranty extends for a period of 25 years for residential use and 10 years for commercial use. If there is a breach of such warranties, the Company has an obligation either to replace the defective product or refund the purchase price.
Historically, the Company has not had material numbers of claims submitted or settled under the provisions of its product warranties, with the exception of claims related to material produced at its Nevada facility prior to 2007 that exhibits surface flaking. The Company continues to receive and settle surface flaking claims and maintains a warranty reserve to provide for the settlement of these claims. In 2009, the Company agreed to a settlement of a class action lawsuit covering the surface defect, stipulating its responsibilities with regard to such claims. Estimating the warranty reserve for surface flaking claims requires management to estimate (1) the number of claims to be settled with payment and (2) the average cost to settle each claim, both of which are subject to variables that are difficult to estimate.
The key component driving the Company’s potential liability is the number of claims that will ultimately require payment. To estimate the number of future paid claims, the Company utilizes actuarial techniques to quantify both the expected number of claims to be received and the percentage of those claims that will ultimately require payment. Estimates for both of these elements (number and percentage of claims that will ultimately require payment) are quantified using a range of assumptions derived from the recent claim count history and the identification of factors influencing the claim counts, including the downward trend in received claims due to the passage of time since production of the suspect material. For each of the various parameters used in the analysis, the assumed values in the actuarial valuation produce results that represent the Company’s best estimate for the ultimate number of claims to be settled with payment.
A number of factors make estimates of the number of claims to be received inherently uncertain. The Company believes that production of the suspect material was confined to material produced from its Nevada facility prior to 2007, but is unable to determine the amount of suspect material produced or the exact time it takes for surface flaking to become evident in the suspect material and materialize as a claim. Furthermore, the aforementioned 2009 class action settlement and communications made by the Company in July 2013 informing homeowners of potential hazards associated with decking products exhibiting surface flaking that are not timely replaced led to increased claims volume and disrupted the claims data and settlement patterns. Lastly, the Company is not aware of any analogous industry data that might be referenced in predicting future claims to be received. The number of surface flaking claims received peaked in 2009 in conjunction with the class action settlement and has declined each year thereafter.
The cost per claim varies due to a number of factors, including the size of affected decks, the type of replacement material used, the cost of production of replacement material and the method of claim settlement. Although the cost per claim does vary, it is less volatile and more predictable than the number of claims to be settled with payment, which is inherently uncertain. The cost per claim declined from 2007 through 2009 but has increased each year thereafter.
The Company monitors surface flaking claims activity each quarter for indications that its estimate of the number of claims expected requires revision. Due to extensive use of decks during the summer outdoor season, variance to annual claims expectations is typically observed during the latter part of the Company’s fiscal year.
F-24
Table of Contents
During the third quarter of 2013, the number of claims received was significantly greater than the Company’s prior estimates. The Company believes that this unexpected increase in claims was due primarily to a response to communications made by the Company in July 2013 informing homeowners of potential hazards associated with decking products exhibiting surface flaking that are not timely replaced. These communications included a public press release and over 10,000 letters sent to homeowners that previously filed surface flaking claims. In addition to contributing to the increase in new claims received, these communications resulted in the reopening of a significant number of claims previously closed. Furthermore, although not directly related to the surface flaking issue, in August 2013, the United States District Court, Northern District of California granted preliminary approval of a settlement agreement related to cases in which plaintiffs generally alleged certain defects in the Company’s products and alleged misrepresentations relating to mold growth. The Company believes that public notices made subsequent to the Court approval increased homeowner awareness of product-related issues and contributed to the increased number of surface flaking claims received during the third quarter of 2013. Due to the unfavorable claims experience during the three months ended September 30, 2013, the Company revised its estimate of the number of remaining future claims and recorded a $20 million increase to the warranty reserve.
During 2014, the number of claims received was lower than the Company’s expectations, while the average cost per claim was higher than the Company’s expectations for 2014. Based on claims activity experienced during the current year, the Company revised its assumed future number of claims and average cost per claim. The revised assumptions did not result in a change to the Company’s reserve, which as of December 31, 2014, the Company believes is sufficient to cover future surface flaking obligations. The increase in the amount paid to settle surface flaking claims in 2014, as compared to 2013, was primarily a result of the large number of claims received during the second half of 2013, as described above.
The Company’s analysis is based on currently known facts and a number of assumptions. Projecting future events such as the number of claims to be received, the number of claims that will require payment and the average cost of claims could cause the actual warranty liabilities to be higher or lower than those projected which could materially affect the Company’s financial condition, results of operations or cash flow. The Company estimates that the number of claims received will decline over time and that the average cost per claim will remain relatively stable. If the level of claims received or average cost per claim differs materially from expectations, it could result in additional increases to the warranty reserve and reduced earnings and cash flows in future periods. The Company estimates that a 10% change in the expected number of remaining claims to be settled with payment or the expected cost to settle claims may result in approximately a $3.1 million change in the surface flaking warranty reserve.
The following is a reconciliation of the Company’s surface flaking warranty reserve (in thousands):
| 2014 | 2013 | |||||||
| Beginning balance, January 1 |
$ | 40,312 | $ | 28,487 | ||||
| Changes in estimates related to pre-existing warranties |
— | 20,000 | ||||||
| Settlements made during the period |
(8,893 | ) | (8,175 | ) | ||||
|
|
|
|
|
|||||
| Ending balance, December 31 |
$ | 31,419 | $ | 40,312 | ||||
|
|
|
|
|
|||||
The remainder of the Company’s warranty reserve represents amounts accrued for non-surface flaking claims.
F-25
Table of Contents
| 13. | INTERIM FINANCIAL DATA (Unaudited) |
| Three Months Ended | ||||||||||||||||||||||||||||||||
| December 31, 2014 |
September 30, 2014 |
June 30, 2014 |
March 31, 2014 |
December 31, 2013 (a) |
September 30, 2013 (b) |
June 30, 2013 |
March 31, 2013 |
|||||||||||||||||||||||||
| (In thousands, except per share data) | ||||||||||||||||||||||||||||||||
| Net sales |
74,202 | 95,502 | 121,311 | 100,645 | 63,831 | 72,249 | 98,551 | 107,880 | ||||||||||||||||||||||||
| Gross profit |
26,635 | 30,369 | 45,026 | 38,167 | 19,685 | 151 | 36,922 | 41,860 | ||||||||||||||||||||||||
| Net income (loss) |
5,153 | 8,913 | 15,161 | 12,295 | 15,103 | (15,298 | ) | 13,224 | 21,569 | |||||||||||||||||||||||
| Basic net income (loss) per share |
$ | 0.16 | $ | 0.28 | $ | 0.46 | $ | 0.37 | $ | 0.46 | $ | (0.45 | ) | $ | 0.39 | $ | 0.64 | |||||||||||||||
| Diluted net income (loss) per share |
$ | 0.16 | $ | 0.28 | $ | 0.46 | $ | 0.37 | $ | 0.45 | $ | (0.45 | ) | $ | 0.38 | $ | 0.62 | |||||||||||||||
| (a) | Three months ended December 31, 2013 was materially affected by a $10.9 million benefit as a direct result of the Company’s decision to exit a full valuation allowance. |
| (b) | Three months ended September 30, 2013 was materially affected by a pre-tax increase of $20.0 million to the surface flaking warranty reserve. |
The Company’s net sales, gross profit and income from operations have historically varied from quarter to quarter. Such variations are often attributable to seasonal trends in the demand for Trex products. The Company has historically experienced lower net sales during the fourth quarter because holidays and adverse weather conditions in certain regions reduce the level of home improvement and construction activity.
F-26
Table of Contents
TREX COMPANY, INC.
SCHEDULE II—VALUATION AND QUALIFYING ACCOUNTS AND RESERVES
(In Thousands)
| Descriptions |
Balance at Beginning of Period |
Additions (Reductions) Charged to Cost and Expenses |
Other | Deductions | Balance at End of Period |
|||||||||||||||
| Year ended December 31, 2014: |
||||||||||||||||||||
| Allowance for doubtful accounts (a) |
$ | — | $ | 5 | $ | — | $ | (5 | ) | $ | (0 | ) | ||||||||
|
|
|
|
|
|
|
|
|
|
|
|||||||||||
| Warranty reserve |
$ | 40,812 | $ | 3,774 | $ | — | $ | (10,745 | ) | $ | 33,841 | |||||||||
|
|
|
|
|
|
|
|
|
|
|
|||||||||||
| Income tax valuation allowance |
$ | 4,201 | $ | 388 | $ | — | $ | (124 | ) | $ | 4,465 | |||||||||
|
|
|
|
|
|
|
|
|
|
|
|||||||||||
| Year ended December 31, 2013: |
||||||||||||||||||||
| Allowance for doubtful accounts (a) |
$ | 7 | $ | (3 | ) | $ | — | $ | (4 | ) | $ | — | ||||||||
|
|
|
|
|
|
|
|
|
|
|
|||||||||||
| Warranty reserve |
$ | 28,987 | $ | 20,000 | $ | — | $ | (8,175 | ) | $ | 40,812 | |||||||||
|
|
|
|
|
|
|
|
|
|
|
|||||||||||
| Income tax valuation allowance |
$ | 24,131 | $ | — | $ | — | $ | (19,930 | ) | $ | 4,201 | |||||||||
|
|
|
|
|
|
|
|
|
|
|
|||||||||||
| Year ended December 31, 2012: |
||||||||||||||||||||
| Allowance for doubtful accounts (a) |
$ | 292 | $ | (362 | ) | $ | — | $ | 77 | $ | 7 | |||||||||
|
|
|
|
|
|
|
|
|
|
|
|||||||||||
| Warranty reserve |
$ | 16,345 | $ | 21,487 | $ | — | $ | (8,845 | ) | $ | 28,987 | |||||||||
|
|
|
|
|
|
|
|
|
|
|
|||||||||||
| Income tax valuation allowance |
$ | 24,199 | $ | (68 | ) | $ | — | $ | — | $ | 24,131 | |||||||||
|
|
|
|
|
|
|
|
|
|
|
|||||||||||
| (a) | Reserve related to accounts receivable |
F-27
Table of Contents
SIGNATURES
Pursuant to the requirements of Section 13 or 15(d) of the Securities Exchange Act of 1934, the registrant has duly caused this report to be signed on its behalf by the undersigned, thereunto duly authorized.
| Trex Company, Inc. | ||||||||
| Date: February 24, 2015 | By: | /S/ RONALD W. KAPLAN | ||||||
| Ronald W. Kaplan Chairman, President and Chief Executive Officer (Duly Authorized Officer) | ||||||||
Pursuant to the requirements of the Securities Exchange Act of 1934, this report has been signed as of February 24, 2015 by the following persons on behalf of the registrant and in the capacities indicated.
| Signature |
Title | |
| /S/ RONALD W. KAPLAN Ronald W. Kaplan |
Chairman, President and Chief Executive Officer (Principal Executive Officer); Director | |
| /S/ JAMES E. CLINE James E. Cline |
Senior Vice President and Chief Financial Officer (Principal Financial Officer and Principal Accounting Officer) | |
| /S/ MICHAEL F. GOLDEN Michael F. Golden |
Director | |
| /S/ JAY M. GRATZ Jay M. Gratz |
Director | |
| /S/ FRANK H. MERLOTTI, JR. Frank H. Merlotti, Jr. |
Director | |
| /S/ RICHARD E. POSEY Richard E. Posey |
Director | |
| /S/ PATRICIA B. ROBINSON Patricia B. Robinson |
Director | |
| /S/ GERALD VOLAS Gerald Volas |
Director | |
Table of Contents
EXHIBIT INDEX
| Exhibit Number |
Exhibit Description | |
| 3.1 | Restated Certificate of Incorporation of Trex Company, Inc. (the “Company”). Filed as Exhibit 3.1 to the Company’s Registration Statement on Form S-1 (No. 333-63287) and incorporated herein by reference. | |
| 3.2 | Certificate of Amendment to the Restated Certificate of Incorporation of Trex Company, Inc. dated April 30, 2014. Filed as Exhibit 3.2 to the Company’s Quarterly Report on Form 10-Q for the quarterly period ended March 31, 2014 and incorporated herein by reference. | |
| 3.3 | Amended and Restated By-Laws of the Company. Filed as Exhibit 3.2 to the Company’s Current Report on Form 8-K filed May 7, 2008 and incorporated herein by reference. | |
| 4.1 | Specimen certificate representing the Company’s common stock. Filed as Exhibit 4.1 to the Company’s Registration Statement on Form S-1 (No. 333-63287) and incorporated herein by reference. | |
| 4.2 | Credit Agreement dated as of November 4, 2009 between the Company and Branch Banking and Trust Company as Administrative Agent and Letter of Credit Issuer, BB&T Capital Markets as Lead Arranger and the Lenders listed on the signature pages thereof. Filed as Exhibit 4.1 to the Company’s Current Report on Form 8-K filed on November 6, 2009 and incorporated herein by reference. | |
| 4.3 | Swing Advance Note dated November 4, 2009 payable by the Company Inc. to Branch Banking and Trust Company in the amount of the lesser of $5,000,000 or the outstanding swing advances made by Branch Banking and Trust Company. Filed as Exhibit 4.6 to the Company’s Current Report on Form 8-K filed on November 6, 2009 and incorporated herein by reference. | |
| 4.4 | First Amendment, dated October 28, 2011, of Credit Agreement dated as of November 4, 2009 between the Company and Branch Banking and Trust Company as Administrative Agent, Letter of Credit Issuer and Lender, and BB&T Capital Markets Letter as Lead Arranger. Filed as Exhibit 4.1 to the Company’s Quarterly Report on Form 10-Q for the quarterly period ended September 30, 2011 and incorporated herein by reference. | |
| 4.5 | Revolver Note dated October 28, 2011 payable by the Company to Branch Banking and Trust Company in the amount of the lesser of $40,000,000 or the outstanding revolver advances made by Branch Banking and Trust Company. Filed as Exhibit 4.2 to the Company’s Quarterly Report on Form 10-Q for the quarterly period ended September 30, 2011 and incorporated herein by reference. | |
| 4.6 | Reducing Revolver Note dated October 28, 2011 payable by the Company to Branch Banking and Trust Company in the amount of the lesser of $15,000,000 or the outstanding revolver advances made by Branch Banking and Trust Company. Filed as Exhibit 4.3 to the Company’s Quarterly Report on Form 10-Q for the quarterly period ended September 30, 2011 and incorporated herein by reference. | |
| 4.7 | Amended and Restated Security Agreement between the Company and Branch Banking and Trust Company as Collateral Agent for the Lenders, dated as of November 4, 2009. Filed as Exhibit 4.7 to the Company’s Current Report on Form 8-K filed on November 6, 2009 and incorporated herein by reference. | |
| 4.8 | Amended and Restated Credit Line Deed of Trust, dated November 4, 2009, by and among the Company, as grantor, BB&T-VA Collateral Service Corporation, as trustee, and Branch Banking and Trust Company, as Collateral Agent for the Lenders, as Beneficiary relating to real property partially located in the County of Frederick, Virginia and partially located in the City of Winchester, Virginia. Filed as Exhibit 4.8 to the Company’s Current Report on Form 8-K filed on November 6, 2009 and incorporated herein by reference. | |
Table of Contents
| Exhibit Number |
Exhibit Description | |
| 4.9 | Deed of Trust, dated November 4, 2009, by and among the Company, as grantor, Eric L. Sappenfield, as trustee, and Branch Banking and Trust Company, as Collateral Agent for the Lenders, as Beneficiary relating to real property located in the County of De Soto, Mississippi. Filed as Exhibit 4.9 to the Company’s Current Report on Form 8-K filed on November 6, 2009 and incorporated herein by reference. | |
| 4.10 | Amended and Restated Credit Agreement dated as of January 6, 2012 between the Company and Branch Banking and Trust Company, as a Lender, Administrative Agent, Swing Line Lender, Letter of Credit Issuer and a Collateral Agent; Wells Fargo Capital Finance, LLC, as a Lender and a Collateral Agent; and BB&T Capital Markets, as Lead Arranger. Filed as Exhibit 4.1 to the Company’s Current Report on Form 8-K filed on January 12, 2012 and incorporated herein by reference. | |
| 4.11 | Revolver Note dated January 6, 2012 payable by the Company to Branch Banking and Trust Company in the amount of the lesser of $55,000,000 or the outstanding revolver advances made by Branch Banking and Trust Company. Filed as Exhibit 4.2 to the Company’s Current Report on Form 8-K filed on January 12, 2012 and incorporated herein by reference. | |
| 4.12 | Revolver Note dated January 6, 2012 payable by the Company to Wells Fargo Capital Finance, LLC in the amount of the lesser of $45,000,000 or the outstanding revolver advances made by Wells Fargo Capital Finance, LLC. Filed as Exhibit 4.3 to the Company’s Current Report on Form 8-K filed on January 12, 2012 and incorporated herein by reference. | |
| 4.13 | Swing Advance Note dated January 6, 2012 payable by the Company to Branch Banking and Trust Company in the amount of the lesser of $5,000,000 or the outstanding swing advances made by Branch Banking and Trust Company. Filed as Exhibit 4.4 to the Company’s Current Report on Form 8-K filed on January 12, 2012 and incorporated herein by reference. | |
| 4.14 | Amended and Restated Security Agreement dated as of January 6, 2012 between the Company, as debtor, and Branch Banking and Trust Company as Collateral Agent for Branch Banking and Trust Company and Wells Fargo Capital Finance, LLC. Filed as Exhibit 4.5 to the Company’s Current Report on Form 8-K filed on January 12, 2012 and incorporated herein by reference. | |
| 4.15 | Modification to Amended and Restated Credit Line Deed of Trust, dated as of January 6, 2012, by and among the Company as grantor, BB&T-VA Collateral Service Corporation, as trustee, and Branch Banking and Trust Company, as Collateral Agent for Branch Banking and Trust Company and Wells Fargo Capital Finance, LLC, as Beneficiary relating to real property partially located in the County of Frederick, Virginia and partially located in the City of Winchester, Virginia. Filed as Exhibit 4.6 to the Company’s Current Report on Form 8-K filed on January 12, 2012 and incorporated herein by reference. | |
| 4.16 | Deed of Trust, dated as of January 6, 2012, by and among the Company as grantor, First American Title Insurance Company, as trustee, and Branch Banking and Trust Company, as Collateral Agent for Branch Banking and Trust Company and Wells Fargo Capital Finance, LLC, as Beneficiary relating to real property located in the County of Fernley, Nevada. Filed as Exhibit 4.7 to the Company’s Current Report on Form 8-K filed on January 12, 2012 and incorporated herein by reference. | |
| 4.17 | First Amendment dated February 26, 2013 to Amended and Restated Credit Agreement dated as of January 6, 2012 between the Company and Branch Banking and Trust Company, as a Lender and Administrative Agent, and Wells Fargo Capital Finance, LLC as a Lender. Filed as Exhibit 4.1 to the Company’s Amended Current Report on Form 8-K filed April 18, 2013 and incorporated herein by reference. | |
| 4.18 | Revolver Note dated February 26, 2013 payable by Trex Company, Inc. to Branch Banking and Trust Company in the amount of the lesser of $67,500,000 or the outstanding revolver advances made by Branch Banking and Trust Company. Filed as Exhibit 4.2 to the Company’s Current Report on Form 8-K filed February 26, 2013 and incorporated herein by reference. | |
Table of Contents
| Exhibit Number |
Exhibit Description | |
| 4.19 | Revolver Note dated February 26, 2013 payable to Trex Company, Inc. to Wells Fargo Capital Finance, LLC in the amount of the lesser of $57,500,000 or the outstanding revolver advances made by Wells Fargo Capital Finance, LLC. Filed as Exhibit 4.3 to the Company’s Current Report on Form 8-K filed February 26, 2013 and incorporated herein by reference. | |
| 4.20 | Second Amendment dated December 17, 2013 to Amended and Restated Credit Agreement dated as of January 6, 2012, as amended by a First Amendment dated February 26, 2013, between the Company and Branch Banking and Trust Company, as a Lender and Administrative Agent, and Wells Fargo Capital Finance, LLC as a Lender. Filed as Exhibit 4.1 to the Company’s Current Report on Form 8-K filed December 19, 2013 and incorporated herein by reference. | |
| 4.21 | Letter Agreement dated October 23, 2014 to Amended and Restated Credit Agreement Dated as of January 6, 2012, as amended, between the Company and Branch Banking and Trust Company, as a Lender and Administrative Agent, and Wells Fargo Capital Finance, LLC as a Lender. Filed as Exhibit 4.1 to the Company’s Quarterly Report on Form 10-Q for the quarterly period ended September 30, 2014 and incorporated herein by reference. | |
| 4.22 | Second Amended and Restated Credit Agreement dated as of November 20, 2014 between the Company and Branch Banking and Trust Company, as a Lender, Administrative Agent, Swing Line Lender and Letter of Credit Issuer; Citibank, N.A. as a Lender; Bank of America, N.A. as a Lender; and BB&T Capital Markets, as Lead Arranger. Filed as Exhibit 4.1 to the Company’s Current Report on Form 8-K filed November 25, 2014 and incorporated herein by reference. | |
| 4.23 | Revolver Note dated November 20, 2014 payable by the Company to Branch Banking and Trust Company in the amount of the lesser of $80,000,000 or the outstanding revolver advances made by Branch Banking and Trust Company. Filed as Exhibit 4.2 to the Company’s Current Report on Form 8-K filed November 25, 2014 and incorporated herein by reference. | |
| 4.24 | Revolver Note dated November 20, 2014 payable by the Company to Citibank, N.A. in the amount of the lesser of $45,000,000 or the outstanding revolver advances made by Citibank, N.A. Filed as Exhibit 4.3 to the Company’s Current Report on Form 8-K filed November 25, 2014 and incorporated herein by reference. | |
| 4.25 | Revolver Note dated November 20, 2014 payable by the Company to Bank of America, N.A. in the amount of the lesser of $25,000,000 or the outstanding revolver advances made by Bank of America, N.A. Filed as Exhibit 4.4 to the Company’s Current Report on Form 8-K filed November 25, 2014 and incorporated herein by reference. | |
| 4.26 | Swing Advance Note dated November 20, 2014 payable by the Company to Branch Banking and Trust Company in the amount of the lesser of $5,000,000 or the outstanding swing advances made by Brand Banking and Trust Company. Filed as Exhibit 4.5 to the Company’s Current Report on Form 8-K filed November 25, 2014 and incorporated herein by reference. | |
| 4.27 | Second Amended and Restated Security Agreement dated as of November 20, 2014 between the Company, as debtor, and Branch Banking and Trust Company as Administrative Agent for Branch Banking and Trust Company, Citibank, N.A. and Bank of America, N.A. Filed as Exhibit 4.6 to the Company’s Current Report on Form 8-K filed November 25, 2014 and incorporated herein by reference. | |
| 4.28 | Second Modification to Amended and Restated Credit Line Deed of Trust, dated as of November 20, 2014, by and among the Company as grantor, BB&T-VA Collateral Service Corporation, as trustee, and Branch Banking and Trust Company, as Administrative Agent for Branch Banking and Trust Company, Citibank, N.A. and Bank of America, N.A., as Beneficiaries relating to real property partially located in the County of Frederick, Virginia and partially located in the City of Winchester, Virginia. Filed as Exhibit 4.7 to the Company’s Current Report on Form 8-K filed November 25, 2014 and incorporated herein by reference. | |
Table of Contents
| Exhibit Number |
Exhibit Description | |
| 4.29 | Modification to Deed of Trust, dated as of November 20, 2014, by and among the Company as grantor, First American Title Insurance Company, as trustee, and Branch Banking and Trust Company, as Administrative Agent for Branch Banking and Trust Company, Citibank, N.A. and Bank of America, N.A., as Beneficiaries relating to real property located in the County of Fernley, Nevada. Filed as Exhibit 4.8 to the Company’s Current Report on Form 8-K filed November 25, 2014 and incorporated herein by reference. | |
| 4.30 | Intellectual Property Security Agreement, dated November 20, 2014 by and between Trex Company, Inc. as debtor; and Branch Banking and Trust Company, in its capacity as Administrative Agent under the Second Amended Credit Agreement and acting as agent for itself and the other secured parties. Filed as Exhibit 4.9 to the Company’s Current Report on Form 8-K filed November 25, 2014 and incorporated herein by reference. | |
| 10.1 | Description of Management Compensatory Plans and Arrangements. Filed herewith. ** | |
| 10.2 | Trex Company, Inc. 2014 Stock Incentive Plan. Filed as Exhibit 10.1 to the Company’s Quarterly Report on Form 10-Q for the quarterly period ended June 30, 2014 and incorporated herein by reference. ** | |
| 10.3 | Trex Company, Inc. Amended and Restated 1999 Incentive Plan for Outside Directors. Filed herewith. ** | |
| 10.4 | Form of Trex Company, Inc. 2005 Stock Incentive Plan Time-Based Restricted Stock Agreement. Filed as Exhibit 10.7 to the Company’s Annual Report on Form 10-K for the fiscal year ended December 31, 2013 and incorporated herein by reference. ** | |
| 10.5 | Form of Trex Company, Inc. 2005 Stock Incentive Plan Performance-Based Restricted Stock Agreement. Filed as Exhibit 10.8 to the Company’s Annual Report on Form 10-K for the fiscal year ended December 31, 2013 and incorporated herein by reference. ** | |
| 10.6 | Form of Trex Company, Inc. Amended and Restated 1999 Incentive Plan for Outside Directors Stock Appreciation Rights Agreement. Filed as Exhibit 10.3 to the Company’s Quarterly Report on Form 10-Q for the quarterly period ended September 30, 2006 and incorporated herein by reference. ** | |
| 10.7 | Form of Trex Company, Inc. Amended and Restated 1999 Incentive Plan for Outside Directors Restricted Stock Agreement. Filed as Exhibit 10.10 to the Company’s Annual Report on Form 10-K for the fiscal year ended December 31, 2011 and incorporated herein by reference. ** | |
| 10.8 | Amendment and Restatement of Employment Agreement, dated as of July 24, 2012, between Trex Company, Inc. and Ronald W. Kaplan. Filed as Exhibit 10.2 to the Company’s Quarterly Report on Form 10-Q for the quarterly period ended September 30, 2012 and incorporated herein by reference. ** | |
| 10.9 | Amendment and Restatement of Change in Control Severance Agreement, dated as of August 3, 2011, between Trex Company, Inc. and Ronald W. Kaplan. Filed as Exhibit 10.2 to the Company’s Current Report on Form 8-K filed on August 9, 2011 and incorporated herein by reference. ** | |
| 10.10 | Form of Amendment and Restatement of Change in Control Severance Agreement between Trex Company, Inc. and Officers other than the Chief Executive Officer. Filed as Exhibit 10.3 to the Company’s Current Report on Form 8-K filed on August 9, 2011 and incorporated herein by reference. ** | |
| 10.11 | Form of Severance Agreement between Trex Company, Inc. and Officers other than the Chief Executive Officer. Filed as Exhibit 10.1 to the Company’s Quarterly Report on Form 10-Q for the quarterly period ended June 30, 2013 and incorporated herein by reference. ** | |
| 10.12 | Retention Agreement, dated as of July 24, 2012, between Trex Company, Inc. and Ronald W. Kaplan. Filed as Exhibit 10.3 to the Company’s Quarterly Report on Form 10-Q for the quarterly period ended September 30, 2012 and incorporated herein by reference. ** | |
Table of Contents
| Exhibit Number |
Exhibit Description | |
| 10.13 | Retention Agreement, dated as of July 24, 2012, between Trex Company, Inc. and James E. Cline. Filed as Exhibit 10.4 to the Company’s Quarterly Report on Form 10-Q for the quarterly period ended September 30, 2012 and incorporated herein by reference. ** | |
| 10.14 | Retention Agreement, dated as of July 24, 2012, between Trex Company, Inc. and William R. Gupp. Filed as Exhibit 10.5 to the Company’s Quarterly Report on Form 10-Q for the quarterly period ended September 30, 2012 and incorporated herein by reference.*, ** | |
| 10.15 | Retention Agreement, dated as of July 24, 2012, between Trex Company, Inc. and F. Timothy Reese. Filed as Exhibit 10.6 to the Company’s Quarterly Report on Form 10-Q for the quarterly period ended September 30, 2012 and incorporated herein by reference. ** | |
| 10.16 | Form of Indemnity Agreement for Directors. Filed as Exhibit 10.19 to the Company’s Annual Report on Form 10-K for the fiscal year ended December 31, 2008 and incorporated herein by reference. | |
| 10.17 | Form of Indemnity Agreement for Officers. Filed as Exhibit 10.20 to the Company’s Annual Report on Form 10-K for the fiscal year ended December 31, 2008 and incorporated herein by reference. | |
| 10.18 | Form of Indemnity Agreement for Director/Officers. Filed as Exhibit 10.21 to the Company’s Annual Report on Form 10-K for the fiscal year ended December 31, 2008 and incorporated herein by reference. | |
| 10.19 | Form of Distributor Agreement of TREX Company, Inc. Filed as Exhibit 10.23 to the Company’s Annual Report on Form 10-K for the fiscal year ended December 31, 2008 and incorporated herein by reference. | |
| 10.20 | Form of Trex Company, Inc. Fencing Agreement for Installers/Retailers. Filed as Exhibit 10.4 to the Company’s Quarterly Report on Form 10-Q for the quarterly period ended September 30, 2006 and incorporated herein by reference. | |
| 10.21 | Deed of Lease, dated June 15, 2000, between TREX Company, LLC and Space, LLC. Filed as Exhibit 10.16 to the Company’s Annual Report on Form 10-K for the fiscal year ended December 31, 2000 and incorporated herein by reference. | |
| 10.22 | Amendment, dated February 22, 2010, of Deed of Lease dated as of June 15, 2000, between Trex Company, Inc., as successor by merger to Trex Company, LLC, and TC.V.LLC, as successor to Space, LLC. Filed as Exhibit 10.1 to the Company’s Quarterly Report on Form 10-Q for the quarterly period ended March 31, 2010 and incorporated herein by reference. | |
| 10.23 | Deed of Lease, dated as of July 27, 2005, between the Company and 1 Dulles Town Center, L.L.C. Filed as Exhibit 10.34 to the Company’s Annual Report on Form 10-K for the fiscal year ended December 31, 2005 and incorporated herein by reference.* | |
| 21 | Subsidiaries of the Company. Filed herewith. | |
| 23 | Consent of Ernst & Young LLP, Independent Registered Public Accounting Firm. Filed herewith. | |
| 31.1 | Certification of Chief Executive Officer of the Company pursuant to Rule 13a-14(a) under the Securities Exchange Act of 1934. Filed herewith. | |
| 31.2 | Certification of Chief Financial Officer of the Company pursuant to Rule 13a-14(a) under the Securities Exchange Act of 1934. Filed herewith. | |
| 32 | Certifications pursuant to Rule 13a-14(b) under the Securities Exchange Act of 1934 and 18 U.S.C. § 1350. Filed herewith. | |
| 101.INS | XBRL Instance Document. Filed herewith. | |
| 101.SCH | XBRL Taxonomy Extension Schema Document. Filed herewith. | |
Table of Contents
| Exhibit Number |
Exhibit Description | |
| 101.CAL | XBRL Taxonomy Extension Calculation Linkbase Document. Filed herewith. | |
| 101.DEF | XBRL Taxonomy Extension Definition Linkbase Document. Filed herewith. | |
| 101.LAB | XBRL Taxonomy Extension Label Linkbase Document. Filed herewith. | |
| 101.PRE | XBRL Taxonomy Extension Presentation Linkbase Document. Filed herewith. | |
| * | Portions of this exhibit have been omitted and filed separately with the Securities and Exchange Commission pursuant to a request for confidential treatment. |
| ** | Management contract or compensatory plan or agreement. |