Attached files
| file | filename |
|---|---|
| 8-K - 8-K - STIFEL FINANCIAL CORP | d877866d8k.htm |
| Exhibit 99.1
|

4th Quarter and Full-Year 2014 Financial Results Presentation
February 23, 2015
|
|
Disclaimer
Forward?Looking Statements
This presentation may contain “forward?looking statements“within the meaning of the Private Securities Litigation Reform Act of 1995 that involve significant risks, assumptions, and uncertainties, including statements relating to the market opportunity and future business prospects of Stifel Financial Corp., as well as Stifel, Nicolaus & Company, Incorporated and its subsidiaries (collectively, “SF” or the “Company”). These statements can be identified by the use of the words “may,”“will,”“should,”“could,”“would,”“plan,”“potential,”“estimate,”“project,”“believe,” “intend,”“anticipate,”“expect,” and similar expressions. In particular, these statements may refer to our goals, intentions, and expectations, our business plans and growth strategies, our ability to integrate and manage our acquired businesses, estimates of our risks and future costs and benefits, and forecasted demographic and economic trends relating to our industry.
You should not place undue reliance on any forward?looking statements, which speak onlyasof the date they were made. Wewill not update these forward?looking statements, even though our situation may change in the future, unless we are obligated to do so under federal securities laws.
Actual results may differ materially and reported results should not be considered as an indication of future performance. Factors that could cause actual results to differ are included in the Company’s annual and quarterly reports and from time to time in other reports filed by the Company with the Securities and Exchange Commission and include, among other things, changes in general economic and business conditions, actions of competitors, regulatory and legal actions, changes in legislation, and technology changes.
Use of Non?GAAP Financial Measures
The Company utilized non?GAAP calculations of presented net revenues, compensation and benefits, non?compensation operating expenses, income from continuing operations before income taxes, provision for income taxes, net income from continuing operations, net income, compensation and non?compensation operating expense ratios, pre?tax marginand diluted earnings per share as an additional measure toaid in understanding and analyzing the Company’s financial results for the three and twelve months ended December 31, 2014. Specifically, the Company believes that the non?GAAP measures provide useful information by excluding certain items that may not be indicative of the Company’s core operating results and business outlook. The Company believes that these non?GAAP measures will allow for a better evaluation of the operating performance of the business and facilitate a meaningful comparison of the Company’s results in the current period to those in prior periods and future periods. Reference to these non?GAAP measures should not be considered as a substitute for results that are presented in a manner consistent with GAAP. These non?GAAP measures are provided to enhance investors’ overall understanding of the Company’sfinancial performance.
|
|
Chairman’s Comments
“We had a strong finish to the year and are excited to report that 2014 was our 19th consecutive year of record net revenues. Both the Global Wealth Management and Institutional Group generated record revenues and record pre?tax operating income in 2014. We continue to add capabilities and talented professionals in our pursuit of building the preeminent brokerage and investment banking firm.
Today, we announced the acquisition of Sterne Agee, which bolsters our Global Wealth Management segment with the addition of more than 700 financial advisors and independent representatives nationwide managing over $20 billion in client assets, and complements our Fixed Income platform, generating significant scale.”
|
|
Market Overview
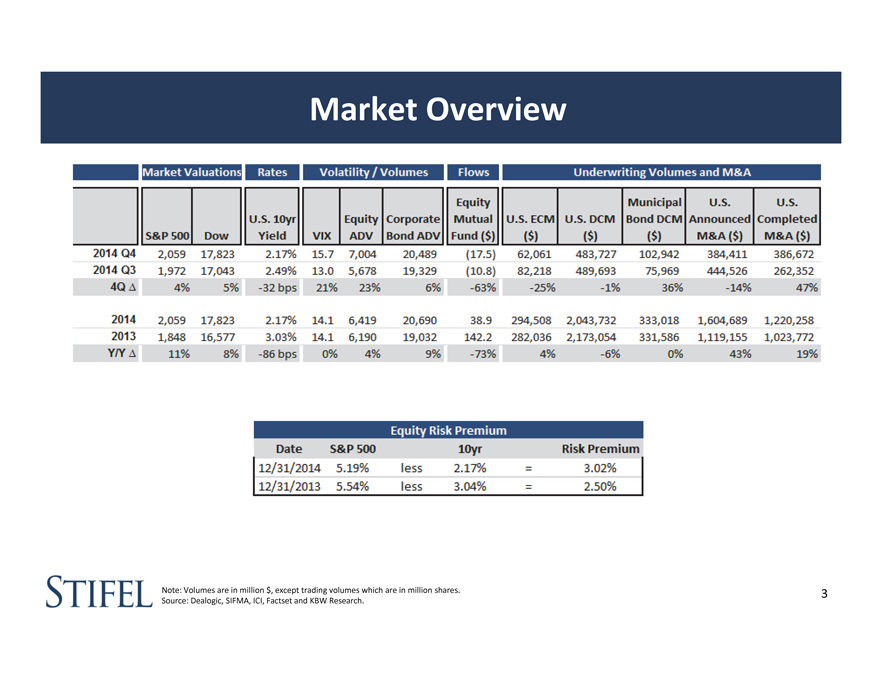
Note: Volumes are in million $, except trading volumes which are in million shares. Source: Dealogic, SIFMA, ICI, Factset and KBW Research.
|
|

Financial Results
|
|
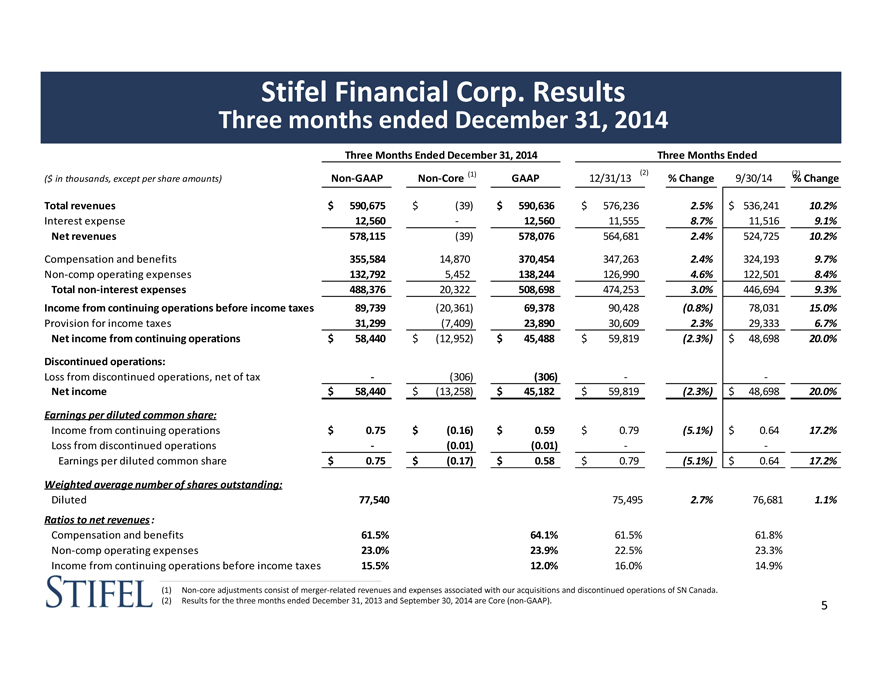
Stifel Financial Corp. Results
Three months ended December 31, 2014
Three Months Ended December 31, 2014 Three Months Ended
($ in thousands, except per share amounts) Non?GAAP Non?Core (1) GAAP 12/31/13 (2) % Change 9/30/14 (2) % Change
Total revenues $ 590,675 $ (39) $ 590,636 $ 576,236 2.5% $ 536,241 10.2%
Interest expense 12,560 ? 12,560 11,555 8.7% 11,516 9.1%
Net revenues 578,115 (39) 578,076 564,681 2.4% 524,725 10.2%
Compensation and benefits 355,584 14,870 370,454 347,263 2.4% 324,193 9.7%
Non?comp operating expenses 132,792 5,452 138,244 126,990 4.6% 122,501 8.4%
Total non?interest expenses 488,376 20,322 508,698 474,253 3.0% 446,694 9.3%
Income from continuing operations before income taxes 89,739 (20,361) 69,378 90,428 (0.8%) 78,031 15.0%
Provision for income taxes 31,299 (7,409) 23,890 30,609 2.3% 29,333 6.7%
Net income from continuing operations $ 58,440 $ (12,952) $ 45,488 $ 59,819 (2.3%) $ 48,698 20.0%
Discontinued operations:
Loss from discontinued operations, net of tax ? (306) (306) ? ?
Net income $ 58,440 $ (13,258) $ 45,182 $ 59,819 (2.3%) $ 48,698 20.0%
Earnings per diluted common share:
Income from continuing operations $ 0.75 $ (0.16) $ 0.59 $ 0.79 (5.1%) $ 0.64 17.2%
Loss from discontinued operations ? (0.01) (0.01) ? ?
Earnings per diluted common share $ 0.75 $ (0.17) $ 0.58 $ 0.79 (5.1%) $ 0.64 17.2%
Weighted average number of shares outstanding:
Diluted 77,540 75,495 2.7% 76,681 1.1%
Ratios to net revenues :
Compensation and benefits 61.5% 64.1% 61.5% 61.8%
Non?comp operating expenses 23.0% 23.9% 22.5% 23.3%
Income from continuing operations before income taxes 15.5% 12.0% 16.0% 14.9%
(1) Non?core adjustments consist of merger?related revenues and expenses associated with our acquisitions and discontinued operations of SN Canada.
(2) Results for the three months ended December 31, 2013 and September 30, 2014 are Core (non?GAAP).
|
|
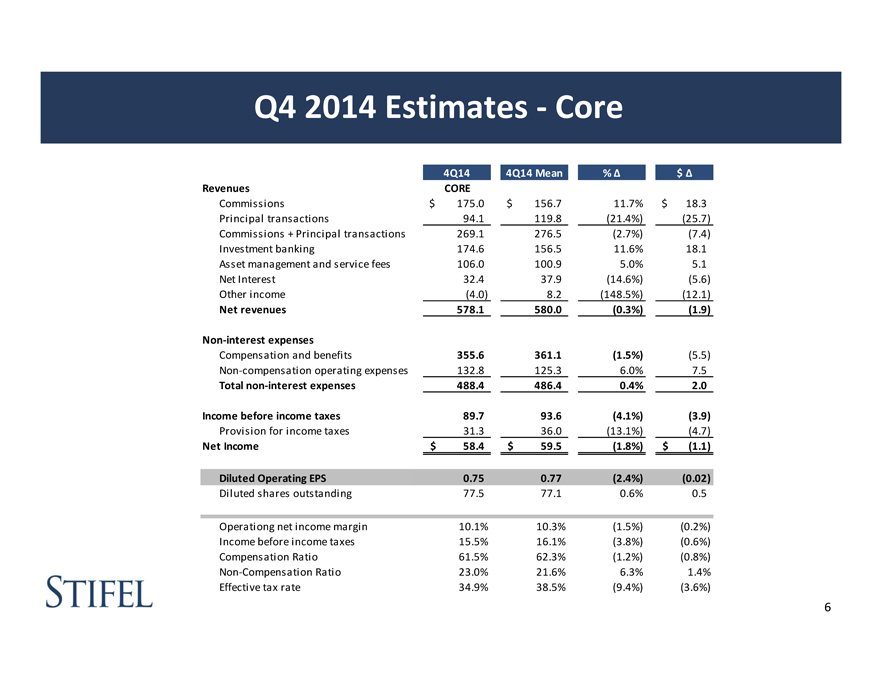
Q4 2014 Estimates ?Core
4Q14 4Q14 Mean % ? $ ?
Revenues CORE
Commissions $ 175.0 $ 156.7 11.7% $ 18.3
Principal transactions 94.1 119.8 (21.4%) (25.7)
Commissions + Principal transactions 269.1 276.5 (2.7%) (7.4)
Investment banking 174.6 156.5 11.6% 18.1
Asset management and service fees 106.0 100.9 5.0% 5.1
Net Interest 32.4 37.9 (14.6%) (5.6)
Other income (4.0) 8.2 (148.5%) (12.1)
Net revenues 578.1 580.0 (0.3%) (1.9)
Non?interest expenses
Compensation and benefits 355.6 361.1 (1.5%) (5.5)
Non?compensation operating expenses 132.8 125.3 6.0% 7.5
Total non?interest expenses 488.4 486.4 0.4% 2.0
Income before income taxes 89.7 93.6 (4.1%) (3.9)
Provision for income taxes 31.3 36.0 (13.1%) (4.7)
Net Income $ 58.4 $ 59.5 (1.8%) $ (1.1)
Diluted Operating EPS 0.75 0.77 (2.4%) (0.02)
Diluted shares outstanding 77.5 77.1 0.6% 0.5
Operationg net income margin 10.1% 10.3% (1.5%) (0.2%)
Income before income taxes 15.5% 16.1% (3.8%) (0.6%)
Compensation Ratio 61.5% 62.3% (1.2%) (0.8%)
Non?Compensation Ratio 23.0% 21.6% 6.3% 1.4%
Effective tax rate 34.9% 38.5% (9.4%) (3.6%)
|
|
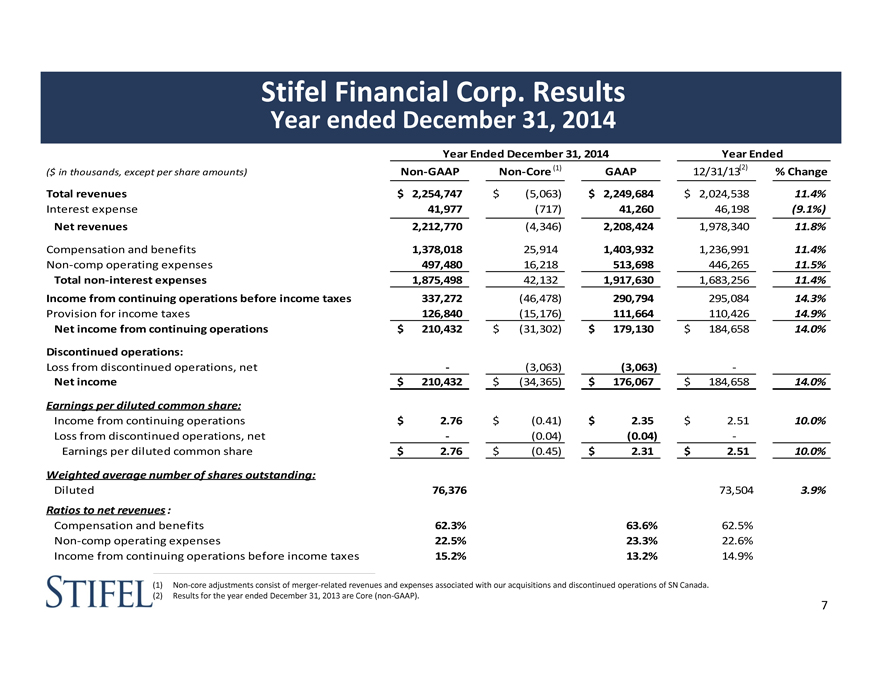
Stifel Financial Corp. Results
Year ended December 31, 2014
Year Ended December 31, 2014 Year Ended
($ in thousands, except per share amounts) Non?GAAP Non?Core (1) GAAP 12/31/13(2) % Change
Total revenues $ 2,254,747 $ (5,063) $ 2,249,684 $ 2,024,538 11.4%
Interest expense 41,977 (717) 41,260 46,198 (9.1%)
Net revenues 2,212,770 (4,346) 2,208,424 1,978,340 11.8%
Compensation and benefits 1,378,018 25,914 1,403,932 1,236,991 11.4%
Non?comp operating expenses 497,480 16,218 513,698 446,265 11.5%
Total non?interest expenses 1,875,498 42,132 1,917,630 1,683,256 11.4%
Income from continuing operations before income taxes 337,272 (46,478) 290,794 295,084 14.3%
Provision for income taxes 126,840 (15,176) 111,664 110,426 14.9%
Net income from continuing operations $ 210,432 $ (31,302) $ 179,130 $ 184,658 14.0%
Discontinued operations:
Loss from discontinued operations, net ? (3,063) (3,063) ?
Net income $ 210,432 $ (34,365) $ 176,067 $ 184,658 14.0%
Earnings per diluted common share:
Income from continuing operations $ 2.76 $ (0.41) $ 2.35 $ 2.51 10.0%
Loss from discontinued operations, net ? (0.04) (0.04) ?
Earnings per diluted common share $ 2.76 $ (0.45) $ 2.31 $ 2.51 10.0%
Weighted average number of shares outstanding:
Diluted 76,376 73,504 3.9%
Ratios to net revenues :
Compensation and benefits 62.3% 63.6% 62.5%
Non?comp operating expenses 22.5% 23.3% 22.6%
Income from continuing operations before income taxes 15.2% 13.2% 14.9%
(1) Non?core adjustments consist of merger?related revenues and expenses associated with our acquisitions and discontinued operations of SN Canada. (2) Results for the year ended December 31, 2013 are Core (non?GAAP).
0
|
|
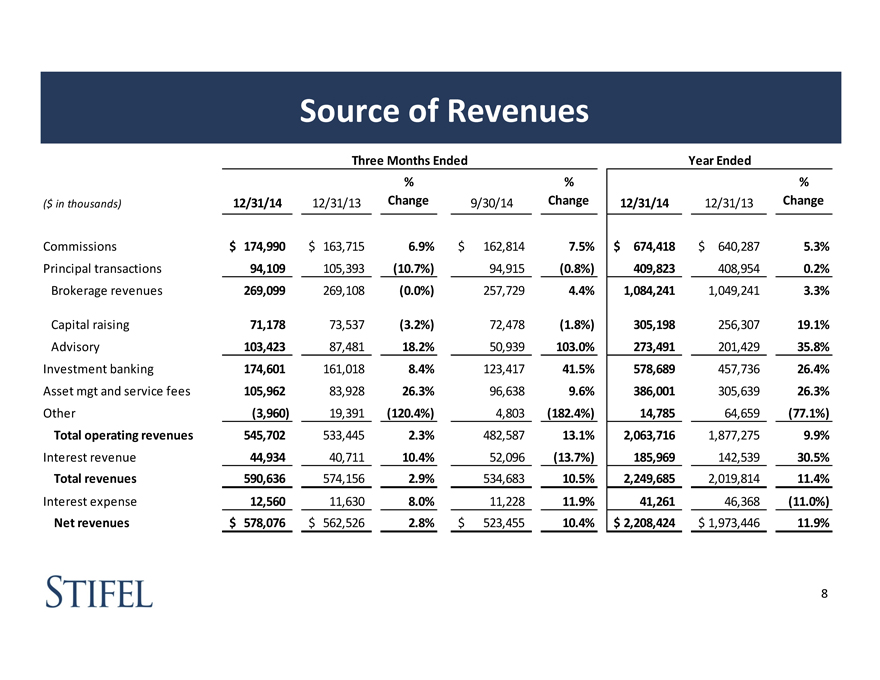
Source of Revenues
Three Months Ended Year Ended
% % %
($ in thousands) 12/31/14 12/31/13 Change 9/30/14 Change 12/31/14 12/31/13 Change
Commissions $ 174,990 $ 163,715 6.9% $ 162,814 7.5% $ 674,418 $ 640,287 5.3%
Principal transactions 94,109 105,393 (10.7%) 94,915 (0.8%) 409,823 408,954 0.2%
Brokerage revenues 269,099 269,108 (0.0%) 257,729 4.4% 1,084,241 1,049,241 3.3%
Capital raising 71,178 73,537 (3.2%) 72,478 (1.8%) 305,198 256,307 19.1%
Advisory 103,423 87,481 18.2% 50,939 103.0% 273,491 201,429 35.8%
Investment banking 174,601 161,018 8.4% 123,417 41.5% 578,689 457,736 26.4%
Asset mgt and service fees 105,962 83,928 26.3% 96,638 9.6% 386,001 305,639 26.3%
Other (3,960) 19,391 (120.4%) 4,803 (182.4%) 14,785 64,659 (77.1%)
Total operating revenues 545,702 533,445 2.3% 482,587 13.1% 2,063,716 1,877,275 9.9%
Interest revenue 44,934 40,711 10.4% 52,096 (13.7%) 185,969 142,539 30.5%
Total revenues 590,636 574,156 2.9% 534,683 10.5% 2,249,685 2,019,814 11.4%
Interest expense 12,560 11,630 8.0% 11,228 11.9% 41,261 46,368 (11.0%)
Net revenues $ 578,076 $ 562,526 2.8% $ 523,455 10.4% $ 2,208,424 $ 1,973,446 11.9%
8
|
|
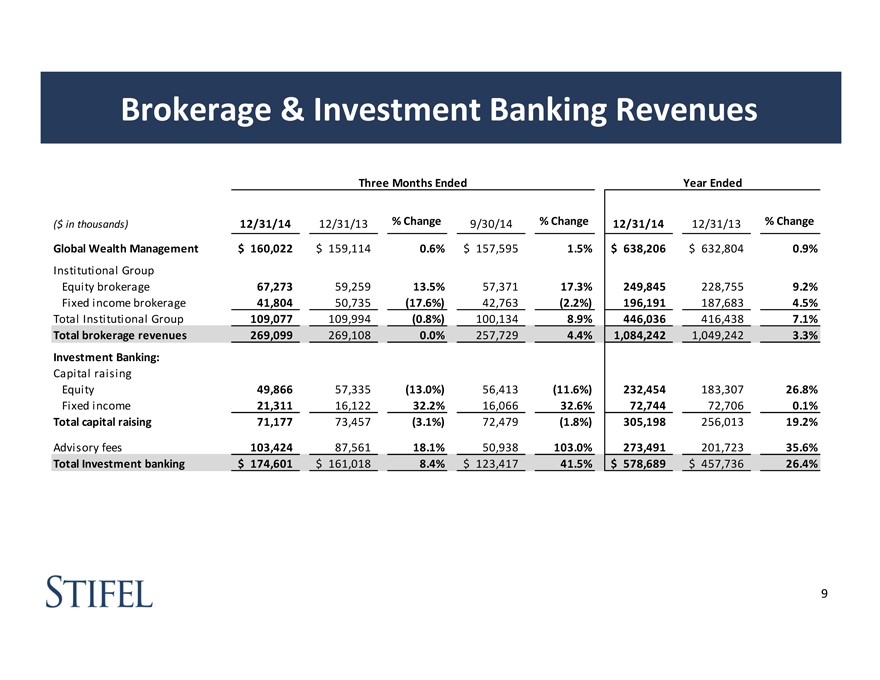
Brokerage & Investment Banking Revenues
Three Months Ended Year Ended
($ in thousands) 12/31/14 12/31/13 % Change 9/30/14 % Change 12/31/14 12/31/13 % Change
Global Wealth Management $ 160,022 $ 159,114 0.6% $ 157,595 1.5% $ 638,206 $ 632,804 0.9%
Institutional Group
Equity brokerage 67,273 59,259 13.5% 57,371 17.3% 249,845 228,755 9.2%
Fixed income brokerage 41,804 50,735 (17.6%) 42,763 (2.2%) 196,191 187,683 4.5%
Total Institutional Group 109,077 109,994 (0.8%) 100,134 8.9% 446,036 416,438 7.1%
Total brokerage revenues 269,099 269,108 0.0% 257,729 4.4% 1,084,242 1,049,242 3.3%
Investment Banking:
Capital raising
Equity 49,866 57,335 (13.0%) 56,413 (11.6%) 232,454 183,307 26.8%
Fixed income 21,311 16,122 32.2% 16,066 32.6% 72,744 72,706 0.1%
Total capital raising 71,177 73,457 (3.1%) 72,479 (1.8%) 305,198 256,013 19.2%
Advisory fees 103,424 87,561 18.1% 50,938 103.0% 273,491 201,723 35.6%
Total Investment banking $ 174,601 $ 161,018 8.4% $ 123,417 41.5% $ 578,689 $ 457,736 26.4%
9
|
|
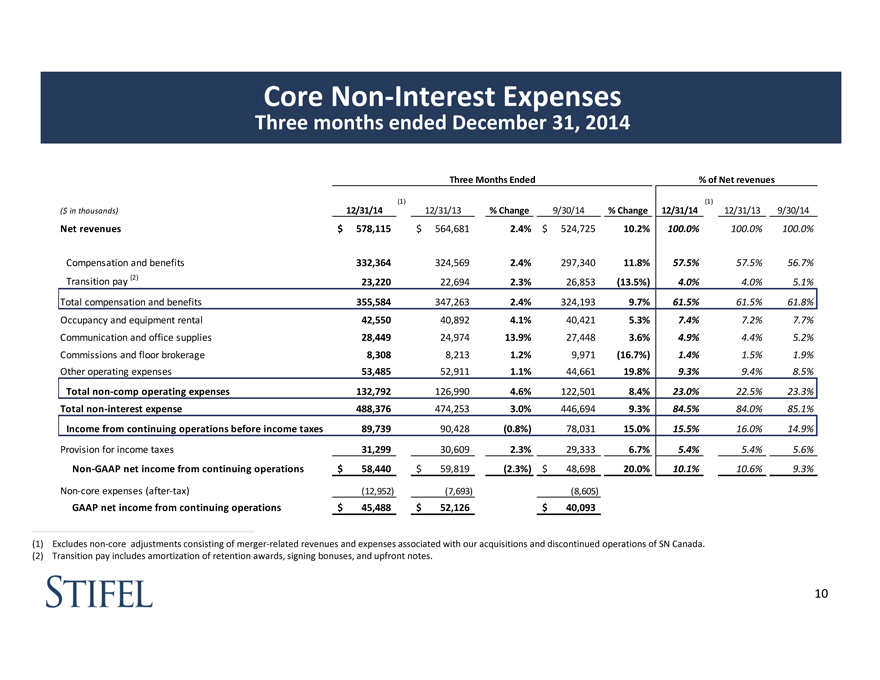
Core Non?Interest Expenses
Three months ended December 31, 2014
Three Months Ended % of Net revenues
(1) (1)
($ in thousands) 12/31/14 12/31/13 % Change 9/30/14 % Change 12/31/14 12/31/13 9/30/14
Net revenues $ 578,115 $ 564,681 2.4% $ 524,725 10.2% 100.0% 100.0% 100.0%
Compensation and benefits 332,364 324,569 2.4% 297,340 11.8% 57.5% 57.5% 56.7%
Transition pay (2) 23,220 22,694 2.3% 26,853 (13.5%) 4.0% 4.0% 5.1%
Total compensation and benefits 355,584 347,263 2.4% 324,193 9.7% 61.5% 61.5% 61.8%
Occupancy and equipment rental 42,550 40,892 4.1% 40,421 5.3% 7.4% 7.2% 7.7%
Communication and office supplies 28,449 24,974 13.9% 27,448 3.6% 4.9% 4.4% 5.2%
Commissions and floor brokerage 8,308 8,213 1.2% 9,971 (16.7%) 1.4% 1.5% 1.9%
Other operating expenses 53,485 52,911 1.1% 44,661 19.8% 9.3% 9.4% 8.5%
Total non?comp operating expenses 132,792 126,990 4.6% 122,501 8.4% 23.0% 22.5% 23.3%
Total non?interest expense 488,376 474,253 3.0% 446,694 9.3% 84.5% 84.0% 85.1%
Income from continuing operations before income taxes 89,739 90,428 (0.8%) 78,031 15.0% 15.5% 16.0% 14.9%
Provision for income taxes 31,299 30,609 2.3% 29,333 6.7% 5.4% 5.4% 5.6%
Non?GAAP net income from continuing operations $ 58,440 $ 59,819 (2.3%) $ 48,698 20.0% 10.1% 10.6% 9.3%
Non?core expenses (after?tax) (12,952) (7,693) (8,605)
GAAP net income from continuing operations $ 45,488 $ 52,126 $ 40,093
(1) Excludes non?core adjustments consisting of merger?related revenues and expenses associated with our acquisitions and discontinued operations of SN Canada.
(2) Transition pay includes amortization of retention awards, signing bonuses, and upfront notes.
10
|
|
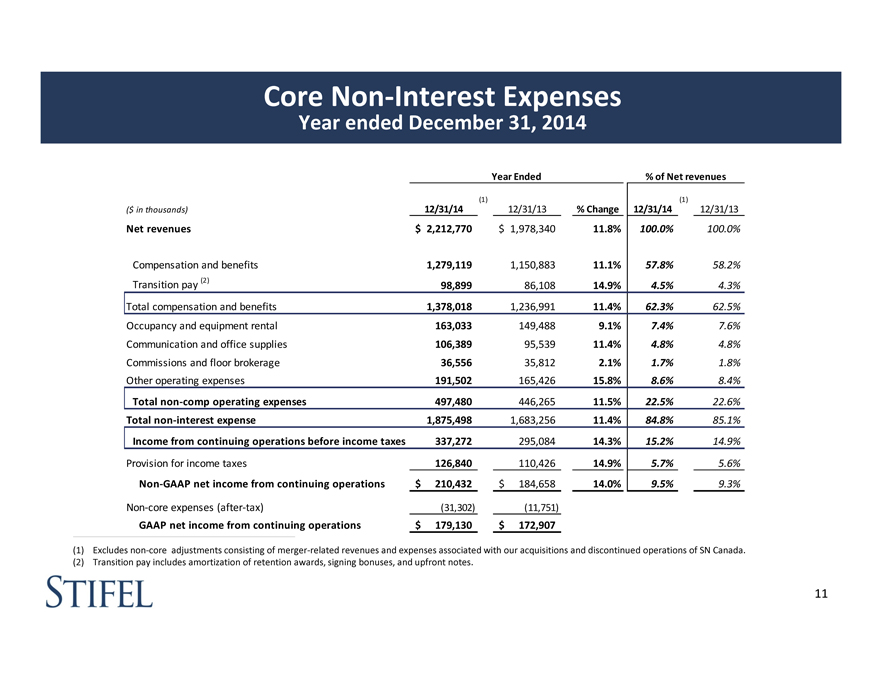
Core Non?Interest Expenses
Year ended December 31, 2014
Year Ended % of Net revenues
(1) (1)
($ in thousands) 12/31/14 12/31/13 % Change 12/31/14 12/31/13
Net revenues $ 2,212,770 $ 1,978,340 11.8% 100.0% 100.0%
Compensation and benefits 1,279,119 1,150,883 11.1% 57.8% 58.2%
Transition pay (2) 98,899 86,108 14.9% 4.5% 4.3%
Total compensation and benefits 1,378,018 1,236,991 11.4% 62.3% 62.5%
Occupancy and equipment rental 163,033 149,488 9.1% 7.4% 7.6%
Communication and office supplies 106,389 95,539 11.4% 4.8% 4.8%
Commissions and floor brokerage 36,556 35,812 2.1% 1.7% 1.8%
Other operating expenses 191,502 165,426 15.8% 86%. 84%.
Total non?comp operating expenses 497,480 446,265 11.5% 22.5% 22.6%
Total non?interest expense 1,875,498 1,683,256 11.4% 84.8% 85.1%
Income from continuing operations before income taxes 337,272 295,084 14.3% 15.2% 14.9%
Provision for income taxes 126,840 110,426 14.9% 5.7% 5.6%
Non?GAAP net income from continuing operations $ 210,432 $ 184,658 14.0% 9.5% 9.3%
Non?core expenses (after?tax) (31,302) (11,751)
GAAP net income from continuing operations $ 179,130 $ 172,907
(1) Excludes non?core adjustments consisting of merger?related revenues and expenses associated with our acquisitions and discontinued operations of SN Canada.
(2) Transition pay includes amortization of retention awards, signing bonuses, and upfront notes.
11
|
|
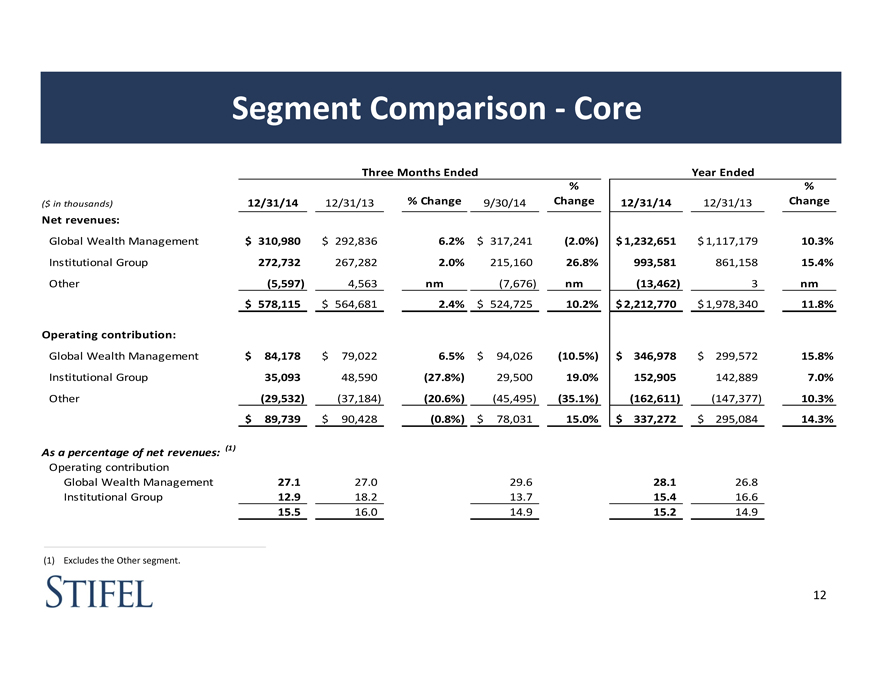
Segment Comparison ?Core
Three Months Ended Year Ended
% %
($ in thousands) 12/31/14 12/31/13 % Change 9/30/14 Change 12/31/14 12/31/13 Change
Net revenues:
Global Wealth Management $ 310,980 $ 292,836 6.2% $ 317,241 (2.0%) $ 1,232,651 $ 1,117,179 10.3%
Institutional Group 272,732 267,282 2.0% 215,160 26.8% 993,581 861,158 15.4%
Other (5,597) 4,563 nm (7,676) nm (13,462) 3 nm
$ 578,115 $ 564,681 2.4% $ 524,725 10.2% $ 2,212,770 $ 1,978,340 11.8%
Operating contribution:
Global Wealth Management $ 84,178 $ 79,022 6.5% $ 94,026 (10.5%) $ 346,978 $ 299,572 15.8%
Institutional Group 35,093 48,590 (27.8%) 29,500 19.0% 152,905 142,889 7.0%
Other (29,532) (37,184) (20.6%) (45,495) (35.1%) (162,611) (147,377) 10.3%
$ 89,739 $ 90,428 (0.8%) $ 78,031 15.0% $ 337,272 $ 295,084 14.3%
As a percentage of net revenues: (1)
Operating contribution
Global Wealth Management 27.1 27.0 29.6 28.1 26.8
Institutional Group 12.9 18.2 13.7 15.4 16.6
15.5 16.0 14.9 15.2 14.9
(1) Excludes the Other segment.
12
|
|
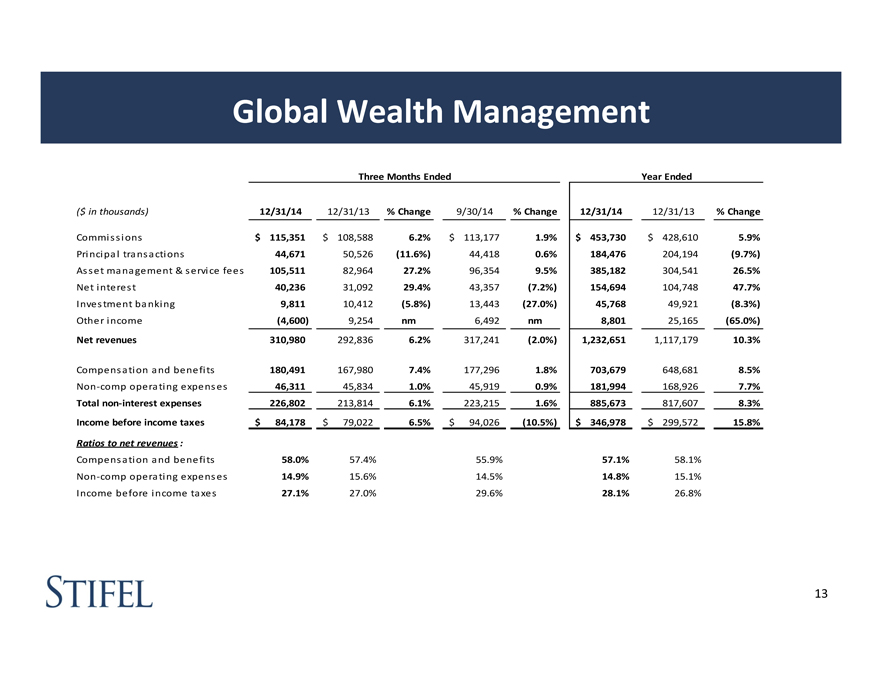
Global Wealth Management
Three Months Ended Year Ended
($ in thousands) 12/31/14 12/31/13 % Change 9/30/14 % Change 12/31/14 12/31/13 % Change
Commissions $ 115,351 $ 108,588 6.2% $ 113,177 1.9% $ 453,730 $ 428,610 5.9%
Principal transactions 44,671 50,526 (11.6%) 44,418 0.6% 184,476 204,194 (9.7%)
Asset management & service fees 105,511 82,964 27.2% 96,354 9.5% 385,182 304,541 26.5%
Net interest 40,236 31,092 29.4% 43,357 (7.2%) 154,694 104,748 47.7%
Investment banking 9,811 10,412 (5.8%) 13,443 (27.0%) 45,768 49,921 (8.3%)
Other income (4,600) 9,254 nm 6,492 nm 8,801 25,165 (65.0%)
Net revenues 310,980 292,836 6.2% 317,241 (2.0%) 1,232,651 1,117,179 10.3%
Compensation and benefits 180,491 167,980 7.4% 177,296 1.8% 703,679 648,681 8.5%
Non?comp operating expenses 46,311 45,834 1.0% 45,919 0.9% 181,994 168,926 7.7%
Total non?interest expenses 226,802 213,814 6.1% 223,215 1.6% 885,673 817,607 8.3%
Income before income taxes $ 84,178 $ 79,022 6.5% $ 94,026 (10.5%) $ 346,978 $ 299,572 15.8%
Ratios to net revenues :
Compensation and benefits 58.0% 57.4% 55.9% 57.1% 58.1%
Non?comp operating expenses 14.9% 15.6% 14.5% 14.8% 15.1%
Income before income taxes 27.1% 27.0% 29.6% 28.1% 26.8%
13
|
|
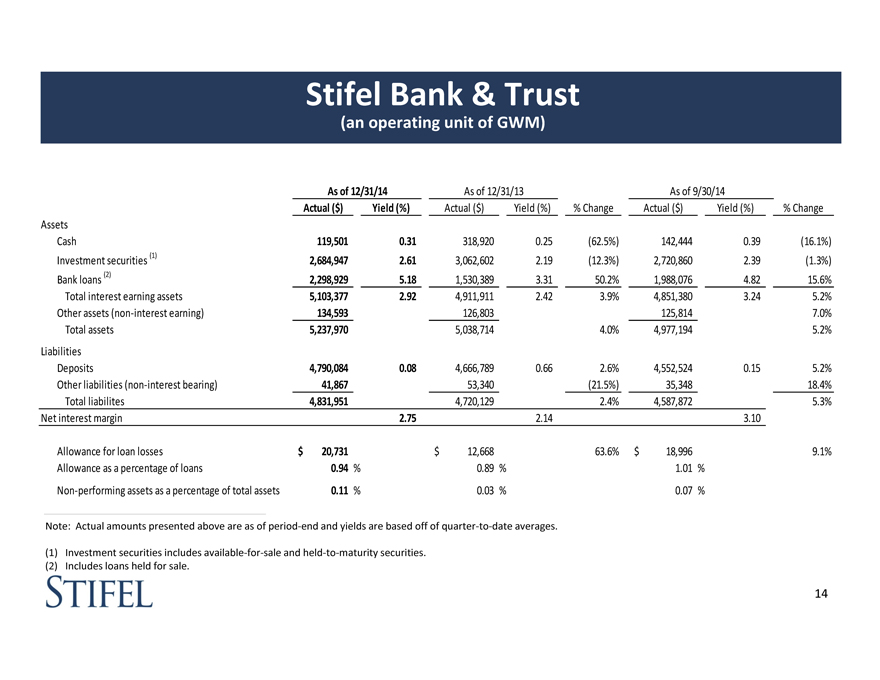
Stifel Bank & Trust
(an operating unit of GWM)
As of 12/31/14 As of 12/31/13 As of 9/30/14
Actual ($) Yield (%) Actual ($) Yield (%) % Change Actual ($) Yield (%) % Change
Assets
Cash 119,501 0.31 318,920 0.25 (62.5%) 142,444 0.39 (16.1%)
Investment securities (1) 2,684,947 2.61 3,062,602 2.19 (12.3%) 2,720,860 2.39 (1.3%)
Bank loans (2) 2,298,929 5.18 1,530,389 3.31 50.2% 1,988,076 4.82 15.6%
Total interest earning assets 5,103,377 2.92 4,911,911 2.42 3.9% 4,851,380 3.24 5.2%
Other assets (non?interest earning) 134,593 126,803 125,814 7.0%
Total assets 5,237,970 5,038,714 4.0% 4,977,194 5.2%
Liabilities
Deposits 4,790,084 0.08 4,666,789 0.66 2.6% 4,552,524 0.15 5.2%
Other liabilities (non?interest bearing) 41,867 53,340 (21.5%) 35,348 18.4%
Total liabilites 4,831,951 4,720,129 2.4% 4,587,872 5.3%
Net interest margin 2.75 2.14 3.10
Allowance for loan losses $ 20,731 $ 12,668 63.6% $ 18,996 9.1%
Allowance as a percentage of loans 0.94 % 0.89 % 1.01 %
Non?performing assets as a percentage of total assets 0.11 % 0.03 % 0.07 %
Note: Actual amounts presented above are as of period?end and yields are based off of quarter?to?date averages.
(1) Investment securities includes available?for?sale and held?to?maturity securities.
(2) Includes loans held for sale.
14
|
|
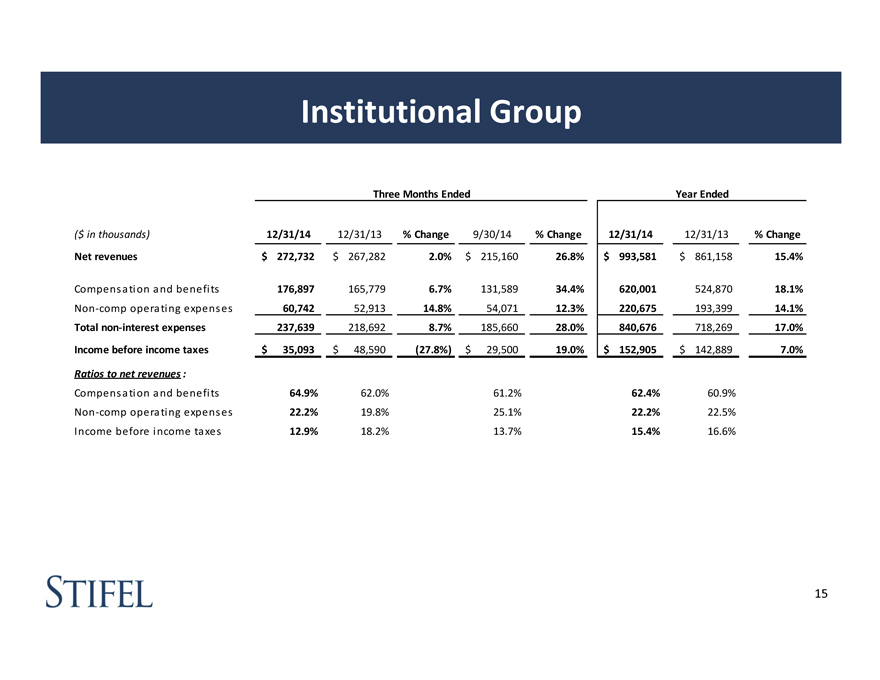
Institutional Group
Three Months Ended Year Ended
($ in thousands) 12/31/14 12/31/13 % Change 9/30/14 % Change 12/31/14 12/31/13 % Change
Net revenues $ 272,732 $ 267,282 2.0% $ 215,160 26.8% $ 993,581 $ 861,158 15.4%
Compensation and benefits 176,897 165,779 6.7% 131,589 34.4% 620,001 524,870 18.1%
Non ?comp operating expenses 60,742 52,913 14.8% 54,071 12.3% 220,675 193,399 14.1%
Total non?interest expenses 237,639 218,692 8.7% 185,660 28.0% 840,676 718,269 17.0%
Income before income taxes $ 35,093 $ 48,590 (27.8%) $ 29,500 19.0% $ 152,905 $ 142,889 7.0%
Ratios to net revenues :
Compensation and benefits 64.9% 62.0% 61.2% 62.4% 60.9%
Non ?comp operating expenses 22.2% 19.8% 25.1% 22.2% 22.5%
Income before income taxes 12.9% 18.2% 13.7% 15.4% 16.6%
15
|
|

Financial Condition
|
|
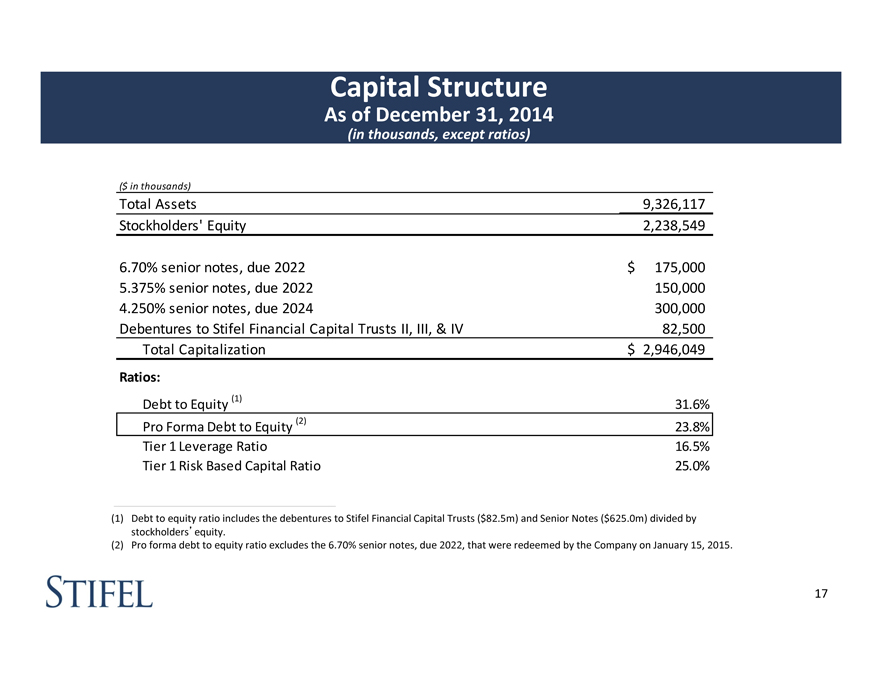
Capital Structure
As of December 31, 2014
(in thousands, except ratios)
($ in thousands)
Total Assets 9,326,117
Stockholders’ Equity 2,238,549
6.70% senior notes, due 2022 $ 175,000
5.375% senior notes, due 2022 150,000
4.250% senior notes, due 2024 300,000
Debentures to Stifel Financial Capital Trusts II, III, & IV 82,500
Total Capitalization $ 2,946,049
Ratios:
Debt to Equity (1) 31.6%
Pro Forma Debt to Equity (2) 23.8%
Tier 1 Leverage Ratio 16.5%
Tier 1 Risk Based Capital Ratio 25.0%
(1) Debt to equity ratio includes the debentures to Stifel Financial Capital Trusts ($82.5m) and Senior Notes ($625.0m) divided by
stockholders’equity.
(2) Pro forma debt to equity ratio excludes the 6.70% senior notes, due 2022, that were redeemed by the Company on January 15, 2015.
17
|
|
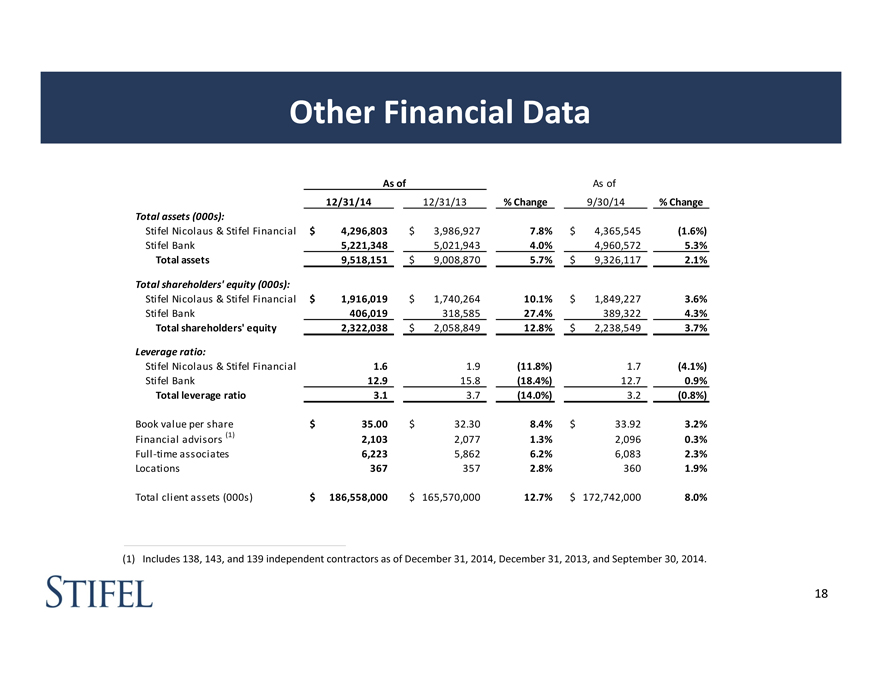
Other Financial Data
As of As of
12/31/14 12/31/13 % Change 9/30/14 % Change
Total assets (000s):
Stifel Nicolaus & Stifel Financial $ 4,296,803 $ 3,986,927 7.8% $ 4,365,545 (1.6%)
Stifel Bank 5,221,348 5,021,943 4.0% 4,960,572 5.3%
Total assets 9,518,151 $ 9,008,870 5.7% $ 9,326,117 2.1%
Total shareholders’ equity (000s):
Stifel Nicolaus & Stifel Financial $ 1,916,019 $ 1,740,264 10.1% $ 1,849,227 3.6%
Stifel Bank 406,019 318,585 27.4% 389,322 4.3%
Total shareholders’ equity 2,322,038 $ 2,058,849 12.8% $ 2,238,549 3.7%
Leverage ratio:
Stifel Nicolaus & Stifel Financial 1.6 1.9 (11.8%) 1.7 (4.1%)
Stifel Bank 12.9 15.8 (18.4%) 12.7 0.9%
Total leverage ratio 3.1 3.7 (14.0%) 3.2 (0.8%)
Book value per share $ 35.00 $ 32.30 8.4% $ 33.92 3.2%
(1)
Financial advisors 2,103 2,077 1.3% 2,096 0.3%
Full ?time associates 6,223 5,862 6.2% 6,083 2.3%
Locations 367 357 2.8% 360 1.9%
Total client assets (000s) $ 186,558,000 $ 165,570,000 12.7% $ 172,742,000 8.0%
(1) Includes 138, 143, and 139 independent contractors as of December 31, 2014, December 31, 2013, and September 30, 2014.
18
|
|
Sterne Agee Merger
|
|
Chairman’s Comments
“We have identified a great firm in Sterne Agee to bolster our Global Wealth
Management group with the addition of more than 700 financial advisors and
independent representatives increasing advisor professionals by 35%. Sterne Agee’s
fixed income platform is highly complementary to our existing products and
services, and together will catapult this business to a new level, continuing the
momentum we established with the addition of Knight’s fixed income sales and
trading business.
This acquisition furthers our goal of creating a balanced, well?diversified business
mix with wealth management and institutional exposure.”
20
|
|
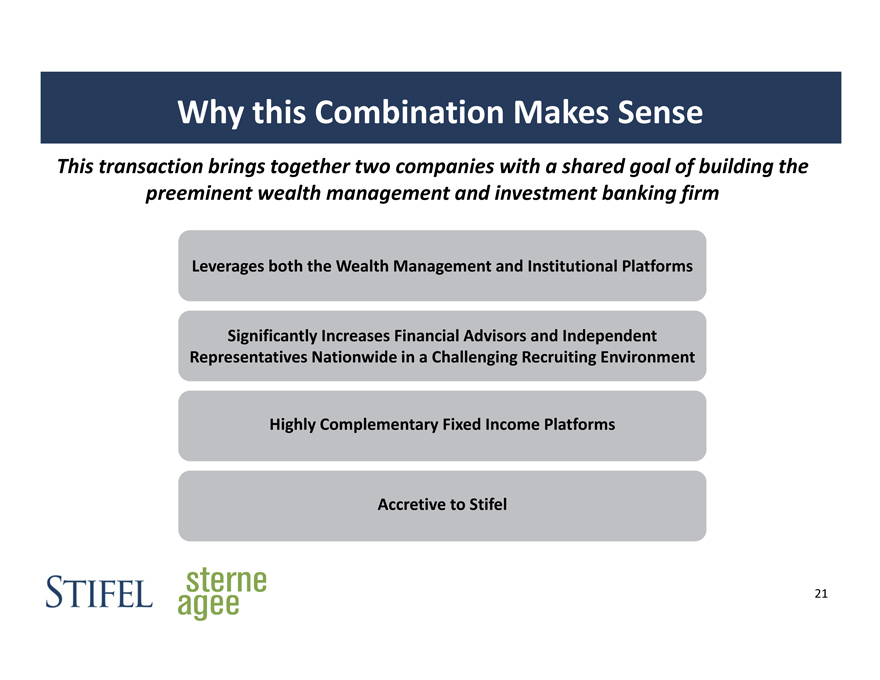
Why this Combination Makes Sense
This transaction brings together two companies with a shared goal of building the preeminent wealth management and investment banking firm
Leverages both the Wealth Management and Institutional Platforms
Significantly Increases Financial Advisors and Independent Representatives Nationwide in a Challenging Recruiting Environment
Highly Complementary Fixed Income Platforms
Accretive to Stifel
21
|
|
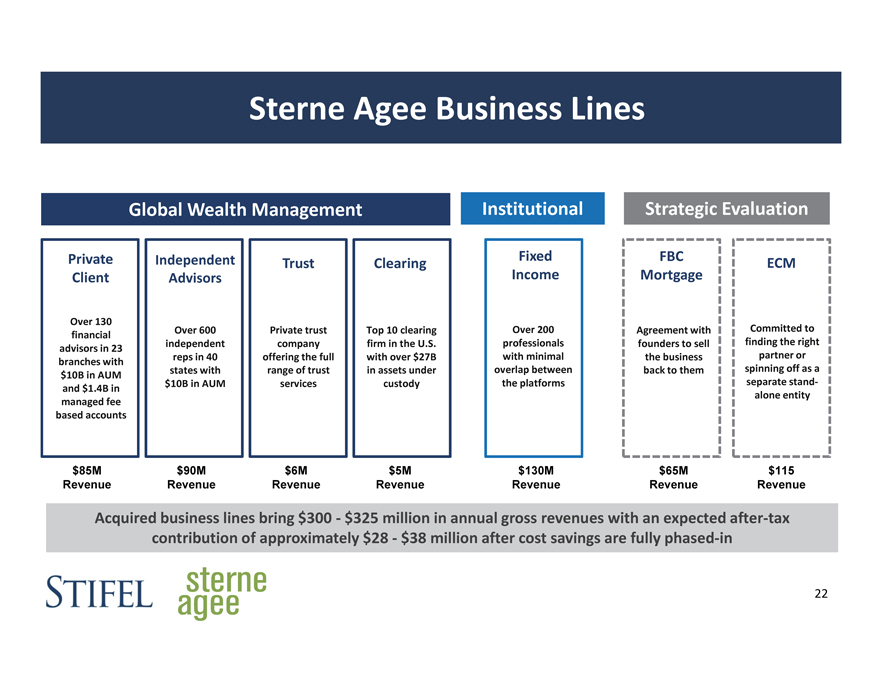
Sterne Agee Business Lines
Global Wealth Management
Private Independent Trust Clearing Client Advisors
Over 130 Over 600 Private trust Top 10 clearing financial independent company firm in the U.S. advisors in 23 reps in 40 offering the full with over $27B branches with states with range of trust in assets under $10B in AUM $10B in AUM services custody and $1.4B in managed fee based accounts
$85M $90M $6M $5M Revenue Revenue Revenue Revenue
Institutional
Fixed
Income
Over 200
professionals
with minimal
overlap between
the platforms
$130M
Revenue
Strategic Evaluation
FBC
Mortgage ECM
Agreement with Committed to
founders to sell finding the right
the business partner or
back to them spinning off as a
separate stand?
alone entity
$65M $115
Revenue Revenue
Acquired business lines bring $300 ?$325 million in annual gross revenues with an expected after?tax contribution of approximately $28 ?$38 million after cost savings are fully phased?in
22
|
|
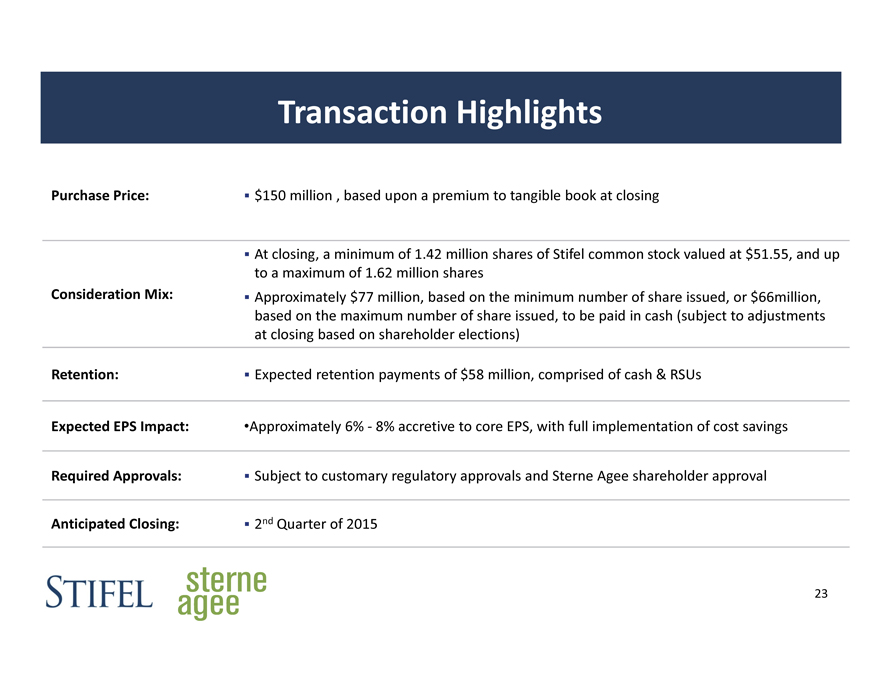
Transaction Highlights
Purchase Price: ? $150 million , based upon a premium to tangible book at closing
? At closing, a minimum of 1.42 million shares of Stifel common stock valued at $51.55, and up
to a maximum of 1.62 million shares
Consideration Mix: ? Approximately $77 million, based on the minimum number of share issued, or $66million,
based on the maximum number of share issued, to be paid in cash (subject to adjustments
at closing based on shareholder elections)
Retention: ? Expected retention payments of $58 million, comprised of cash & RSUs
Expected EPS Impact: •Approximately 6% ? 8% accretive to core EPS, with full implementation of cost savings
Required Approvals: ? Subject to customary regulatory approvals and Sterne Agee shareholder approval
Anticipated Closing: ? 2nd Quarter of 2015
23
|
|
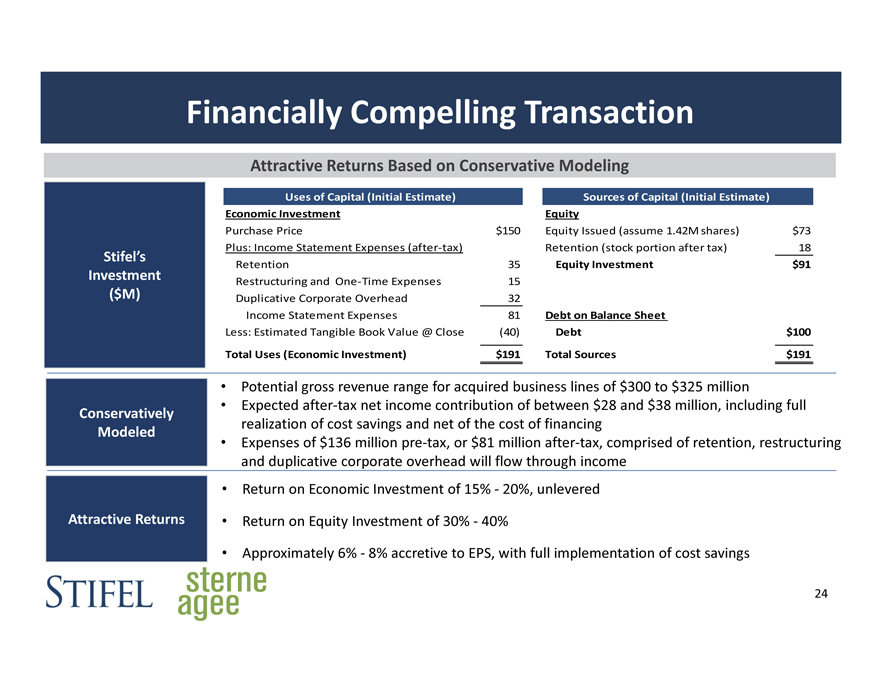
Financially Compelling Transaction
Attractive Returns Based on Conservative Modeling
Uses of Capital (Initial Estimate) Sources of Capital (Initial Estimate)
Economic Investment Equity
Purchase Price $150 Equity Issued (assume 1.42M shares) $73
Plus: Income Statement Expenses (after?tax) Retention (stock portion after tax) 18
Stifel’s
Retention 35 Equity Investment $91
Investment Restructuring and One?Time Expenses 15
($M) Duplicative Corporate Overhead 32
Income Statement Expenses 81 Debt on Balance Sheet
Less: Estimated Tangible Book Value @ Close (40) Debt $100
Total Uses (Economic Investment) $191 Total Sources $191
• Potential gross revenue range for acquired business lines of $300 to $325 million
Conservatively • Expected after?tax net income contribution of between $28 and $38 million, including full
Modeled realization of cost savings and net of the cost of financing
• Expenses of $136 million pre?tax, or $81 million after?tax, comprised of retention, restructuring
and duplicative corporate overhead will flow through income
• Return on Economic Investment of 15% ? 20%, unlevered
Attractive Returns • Return on Equity Investment of 30% ? 40%
• Approximately 6% ? 8% accretive to EPS, with full implementation of cost savings
24
|
|
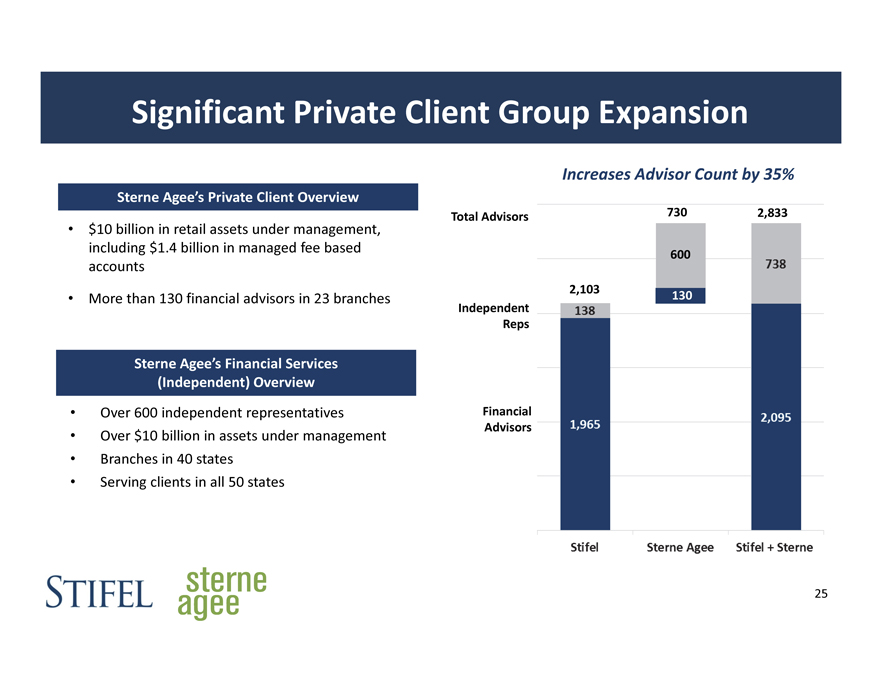
Significant Private Client Group Expansion
Sterne Agee’s Private Client Overview
$10 billion in retail assets under management, including $1.4 billion in managed fee based accounts
More than 130 financial advisors in 23 branches
Sterne Agee’s Financial Services (Independent) Overview
Over 600 independent representatives
Over $10 billion in assets under management
Branches in 40 states
Serving clients in all 50 states
Increases Advisor Count by 35%
Total Advisors 730 2,833
600
2,103
130 Independent Reps
Financial Advisors
25
|
|
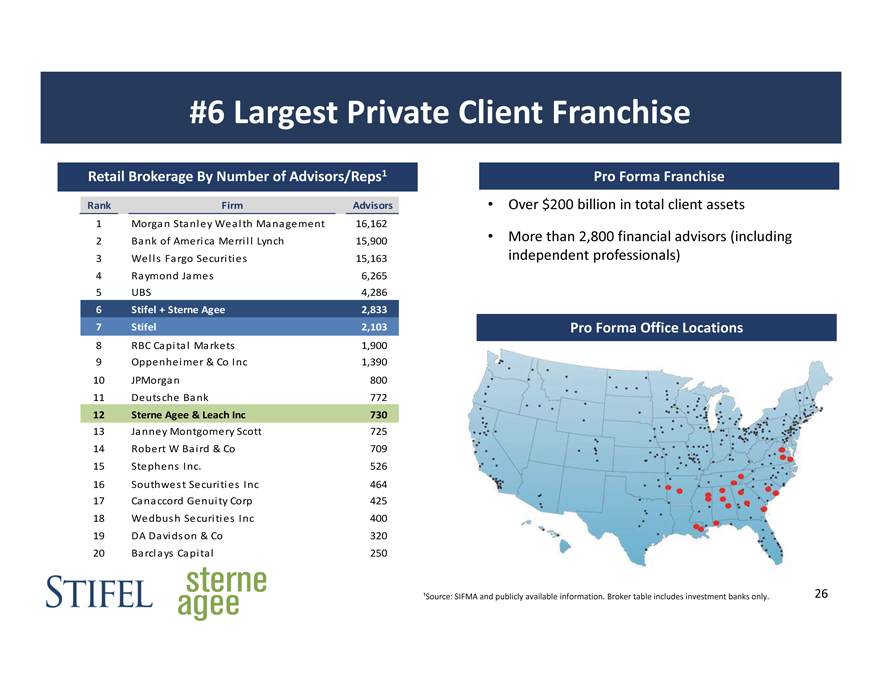
#6 Largest Private Client Franchise
Retail Brokerage By Number of Advisors/Reps1
Rank Firm Advisors
1 Morgan Stanley Wealth Management 16,162
2 Bank of America Merrill Lynch 15,900
3 Wells Fargo Securities 15,163
4 Raymond James 6,265
5 UBS 4,286
6 Stifel + Sterne Agee 2,833
7 Stifel 2,103
8 RBC Capital Markets 1,900
9 Oppenheimer & Co Inc 1,390
10 JPMorgan 800
11 Deutsche Bank 772
12 Sterne Agee & Leach Inc 730
13 Janney Montgomery Scott 725
14 Robert W Baird & Co 709
15 Stephens Inc. 526
16 Southwest Securities Inc 464
17 Canaccord Genuity Corp 425
18 Wedbush Securities Inc 400
19 DA Davidson & Co 320
20 Barclays Capital 250
Pro Forma Franchise
Over $200 billion in total client assets
More than 2,800 financial advisors (including independent professionals)
Pro Forma Office Locations
¹Source: SIFMA and publicly available information. Broker table includes investment banks only. 26
|
|
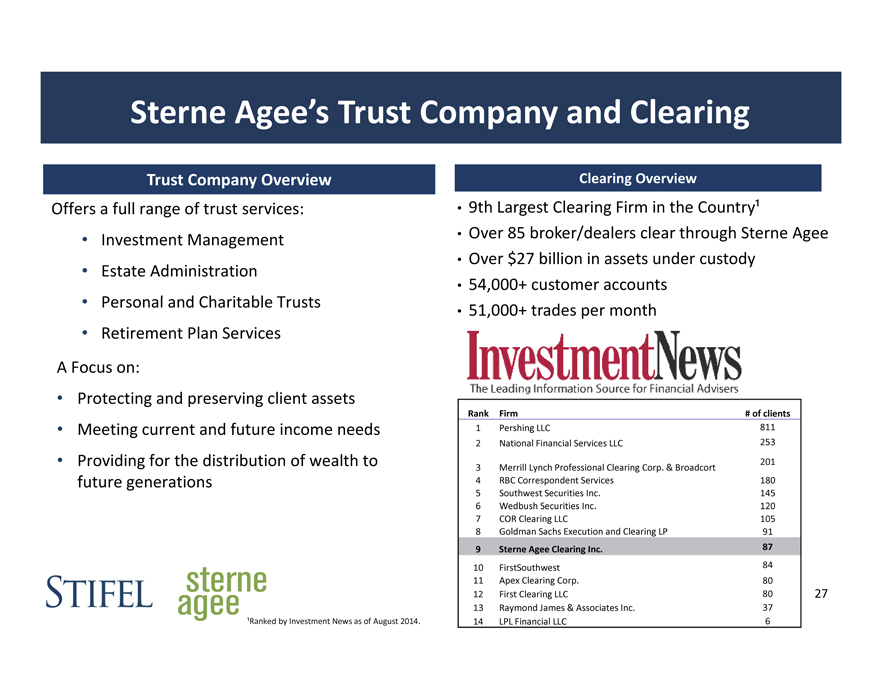
Sterne Agee’s Trust Company and Clearing
Trust Company Overview
Offers a full range of trust services:
Investment Management
Estate Administration
Personal and Charitable Trusts
Retirement Plan Services
A Focus on:
Protecting and preserving client assets
Meeting current and future income needs
Providing for the distribution of wealth to future generations
Clearing Overview
9th Largest Clearing Firm in the Country¹
Over 85 broker/dealers clear through Sterne Agee
Over $27 billion in assets under custody
54,000+ customer accounts
51,000+ trades per month
Rank Firm # of clients
1 Pershing LLC 811
2 National Financial Services LLC 253
201
3 Merrill Lynch Professional Clearing Corp. & Broadcort
4 RBC Correspondent Services 180
5 Southwest Securities Inc. 145
6 Wedbush Securities Inc. 120
7 COR Clearing LLC 105
8 Goldman Sachs Execution and Clearing LP 91
9 Sterne Agee Clearing Inc. 87
10 FirstSouthwest 84
11 Apex Clearing Corp. 80
12 First Clearing LLC 80
13 Raymond James & Associates Inc. 37
14 LPL Financial LLC 6
¹Ranked by Investment News as of August 2014.
27
|
|
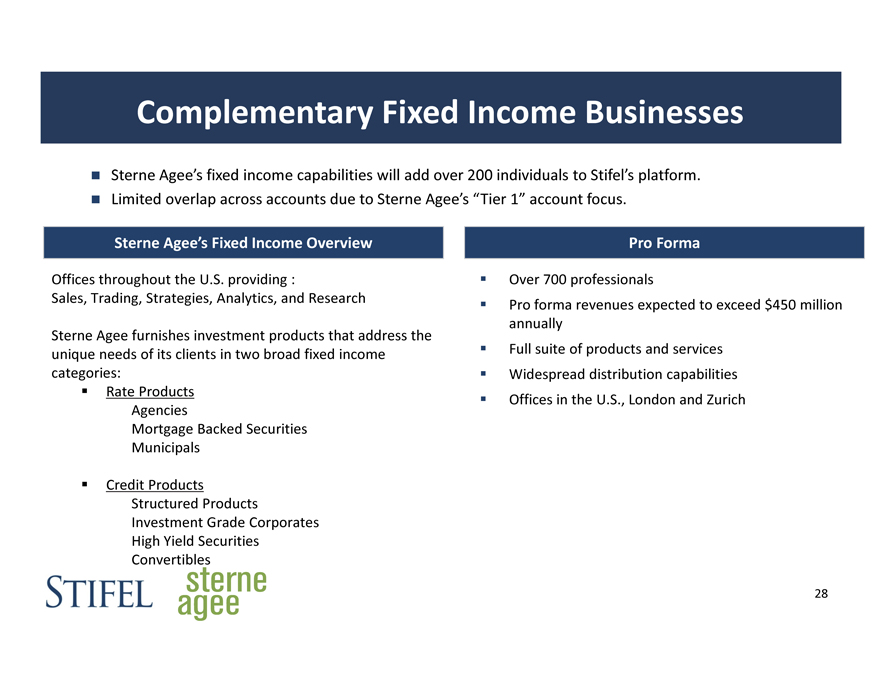
Complementary Fixed Income Businesses
Sterne Agee’s fixed income capabilities will add over 200 individuals to Stifel’s platform. Limited overlap across accounts due to Sterne Agee’s “Tier 1” account focus.
Sterne Agee’s Fixed Income Overview
Offices throughout the U.S. providing :
Sales, Trading, Strategies, Analytics, and Research
Sterne Agee furnishes investment products that address the unique needs of its clients in two broad fixed income categories: Rate Products Agencies Mortgage Backed Securities Municipals
Credit Products
Structured Products
Investment Grade Corporates High Yield Securities Convertibles
Pro Forma
Over 700 professionals
Pro forma revenues expected to exceed $450 million annually Full suite of products and services Widespread distribution capabilities Offices in the U.S., London and Zurich
28
|
|

Acquisition Updates
|
|
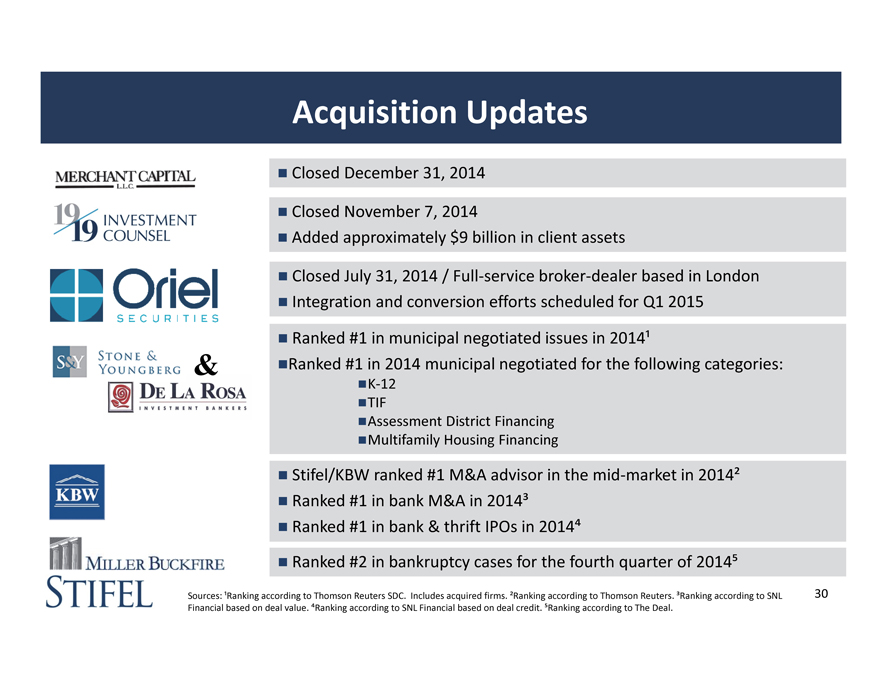
Acquisition Updates
Closed December 31, 2014
Closed November 7, 2014
Added approximately $9 billion in client assets
Closed July 31, 2014 / Full service broker dealer based in London Integration and conversion efforts scheduled for Q1 2015
Ranked #1 in municipal negotiated issues in 2014¹
Ranked #1 in 2014 municipal negotiated for the following categories:
K 12 TIF
Assessment District Financing Multifamily Housing Financing
Stifel/KBW ranked #1 M&A advisor in the mid market in 2014² Ranked #1 in bank M&A in 2014³ Ranked #1 in bank & thrift IPOs in 2014
Ranked #2 in bankruptcy cases for the fourth quarter of 2014
Sources: ¹Ranking according to Thomson Reuters SDC. Includes acquired firms. ²Ranking according to Thomson Reuters. ³Ranking according to SNL Financial based on deal value. Ranking according to SNL Financial based on deal credit. Ranking according to The Deal.
30
|
|
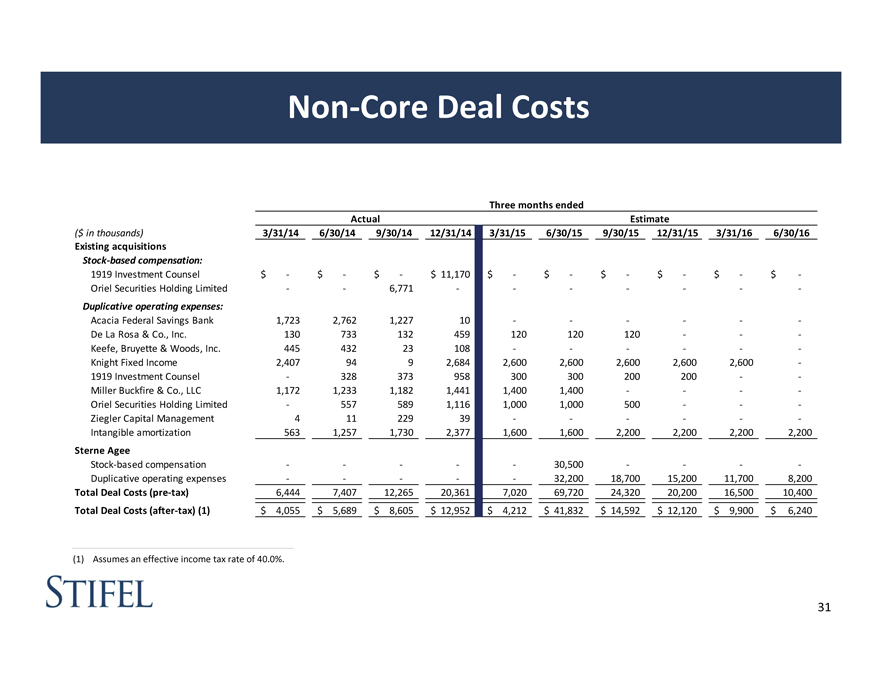
Non Core Deal Costs
Three months ended
Actual Estimate
($ in thousands) 3/31/14 6/30/14 9/30/14 12/31/14 3/31/15 6/30/15 9/30/15 12/31/15 3/31/16 6/30/16
Existing acquisitions
Stock based compensation:
1919 Investment Counsel $ $ $ $ 11,170 $ $ $ $ $ $
Oriel Securities Holding Limited 6,771
Duplicative operating expenses:
Acacia Federal Savings Bank 1,723 2,762 1,227 10
De La Rosa & Co., Inc. 130 733 132 459 120 120 120
Keefe, Bruyette & Woods, Inc. 445 432 23 108
Knight Fixed Income 2,407 94 9 2,684 2,600 2,600 2,600 2,600 2,600
1919 Investment Counsel 328 373 958 300 300 200 200
Miller Buckfire & Co., LLC 1,172 1,233 1,182 1,441 1,400 1,400
Oriel Securities Holding Limited 557 589 1,116 1,000 1,000 500
Ziegler Capital Management 4 11 229 39
Intangible amortization 563 1,257 1,730 2,377 1,600 1,600 2,200 2,200 2,200 2,200
Sterne Agee
Stock based compensation 30,500
Duplicative operating expenses 32,200 18,700 15,200 11,700 8,200
Total Deal Costs (pre tax) 6,444 7,407 12,265 20,361 7,020 69,720 24,320 20,200 16,500 10,400
Total Deal Costs (after tax) (1) $ 4,055 $ 5,689 $ 8,605 $ 12,952 $ 4,212 $ 41,832 $ 14,592 $ 12,120 $ 9,900 $ 6,240
(1) Assumes an effective income tax rate of 40.0%.
31
|
|

Q&A