Attached files
| file | filename |
|---|---|
| EX-99.2 - EX-99.2 - NUVASIVE INC | d879523dex992.htm |
| EX-99.1 - EX-99.1 - NUVASIVE INC | d879523dex991.htm |
| 8-K - FORM 8-K - NUVASIVE INC | d879523d8k.htm |
 Updated Non-GAAP Definition
February 24, 2015
Exhibit 99.3 |
 Forward-Looking Statements
NuVasive, Inc. (“NuVasive,”
“NUVA”
or the “Company”) cautions you
that statements included in this presentation that are not a description
of historical facts are forward-looking statements that involve risks,
uncertainties, assumptions and other factors which, if they do not
materialize or prove correct, could cause the Company's results to
differ materially from historical results or those expressed or implied
by such forward-looking statements.
Further information on NuVasive’s disclaimer and forward-looking
statements and the potential risks and uncertainties that could cause
actual growth and results to differ materially are more fully described
in the Company’s press releases and periodic filings with the
Securities and Exchange Commission.
2
2 |
 Reconciliation of Non-GAAP Information
3
Management uses certain non-GAAP financial measures such as non-GAAP earnings per share,
non-GAAP gross margin, non-GAAP operating expenses, and non-GAAP operating margin,
which, through December 31, 2014 results, exclude non-cash stock-based compensation,
certain intellectual property litigation expenses, amortization of intangible assets, leasehold
related charges, certain acquisition related items, non-cash interest expense on
convertible notes, a litigation liability expense, an out-of-period royalty expense charge,
and an intangible asset impairment charge. Beginning on January 1, 2015, management has
updated the above definition of non-GAAP to include the impact of non-cash
stock-based compensation as well as certain intellectual property expenses. Both measures
are discussed in this presentation, with the definition of the Company’s non-GAAP financial measures
through the end of 2014 referred to as “non-GAAP” while the 2015 and beyond definition
is referred to as “updated non-GAAP.” The
Company also uses measures such as free cash flow, which represents cash flow from operations less cash
used in the acquisition and disposition of capital. Additionally, the Company uses a commonly
used measure as adjusted EBITDA which represents earnings before interest, taxes, depreciation
and amortization as well as excludes the impact of stock-based compensation, a leasehold
related charge, acquisition related items and an intangible asset impairment
charge. Management calculates the non-GAAP financial measures excluding these
costs and uses these non-GAAP financial measures to enable it to further and more consistently
analyze the period-to-period financial performance of its core business
operations. Management believes that providing investors with these non-GAAP measures
gives them additional information to enable them to assess, in the same way management
assesses, the Company’s current and future continuing operations. These non-GAAP measures
are not in accordance with, or an alternative for GAAP, and may be different from non-GAAP
measures used by other companies. Reconciliations of the non-GAAP financial measures
to the comparable GAAP financial measures can be found on the Investor Relations section of the
Company’s website. |
 What
Is Changing? •
Updating NUVA’s non-GAAP definition for:
–
Cost of Goods Sold, Gross Margin, Operating Expenses, Operating
Margin, EPS
•
Updated definition to include:
–
Non-cash stock-based compensation
–
Certain intellectual property related litigation expenses
•
Non-GAAP EBITDA measure will continue to exclude stock-based
compensation;
however
it
will
include
certain
intellectual
property
related
litigation expenses
•
No impact to reported revenue historically or on go-forward basis
•
Effective as of first quarter 2015 reporting
•
Providing
historically
adjusted
financial
results
for
2012,
2013
and
2014
on
Company’s IR website in conjunction with this announcement
4 |
 Why
Now? •
Operating ahead of schedule on profitability improvements, having reached
goal of delivering a 20% non-GAAP operating margin in fourth quarter 2014
and delivering 180 basis points of non-GAAP operating margin
improvement in 2014, above the Company’s stated plan of driving100
basis points of improvement per year
•
Business has reached a state of maturity where it is appropriate
to shift non-
GAAP reporting approach
•
Committed to driving long-term shareholder value, which includes managing
both stock-based compensation and certain intellectual property
litigation expenses
•
Believe these changes increase transparency and better reflect the underlying
financial performance of the business
•
In response to investor feedback and more aligned with peer practices
5 |
 Overview of Updated Non-GAAP Definition Impact
6
PRIOR
UPDATED
2012
2013
2014
2012
2013
2014
Gross Margin
75.3%
74.8%
76.1%
75.3%
74.8%
76.1%
Sales, Marketing & Administrative
55.5%
55.9%
54.9%
59.8%
61.3%
59.9%
Research & Development
5.3%
4.1%
4.5%
5.6%
4.4%
4.8%
Operating Expenses
60.8%
60.0%
59.5%
65.4%
65.6%
64.7%
Operating Margin
14.5%
14.9%
16.7%
9.9%
9.2%
11.4%
Non-GAAP Earnings Per Share
$1.04
$1.23
$1.16
$0.65
$0.73
$0.67
EBITDA Margin
N/A
N/A
N/A
20.7%
21.0%
21.9%
Detailed Full Year 2012, 2013 and 2014 Adjusted Financial
Results Available on NUVA Investor Relations Website |
 Increasing Scale and Profitability
7
~15%
2013
Operating
Margin
Operating
Margin at
$1B in
Revenue*
Operating
Margin at
Beyond
$1B in
Revenue*
Prior Non-GAAP Definition
Performance Goals
*NuVasive Guidance as of 2/24/15 as Posted on the Company’s Investor Relations Website
Under “IR Overview” ~20%
~25%
~9%
2013
Operating
Margin
Operating
Margin at
$1B in
Revenue*
Operating
Margin at
Beyond
$1B in
Revenue*
Updated Non-GAAP
Definition Performance Goals
>15%
~20%
~21%
2013
EBITDA
Margin
EBITDA
Margin at
$1B in
Revenue*
EBITDA
Margin at
Beyond
$1B in
Revenue*
Updated Non-GAAP
Definition Performance Goals
>25%
~30%
PRIOR
Operating Margin
Performance Goals
UPDATED
Operating Margin
Performance Goals
UPDATED
EBITDA Margin
Performance Goals |
 1.
International scale
2.
In-sourcing manufacturing
3.
Improved asset efficiency
4.
Sales force efficiency
5.
Impact of MDT patent expiration
Targeting ~100 bps*
of Operational
Improvements per
Year
Driving
Operating
Margin
Towards
~20%
Beyond
$1
Billion*
in
Revenue
with Well-Identified Long-Term Levers
Pursuing Operating Efficiencies to Drive Operating
Margin Expansion
8
*NuVasive Guidance as of 2/24/15 as Posted on the Company’s Investor Relations Website
Under “IR Overview” |
 Driving
Operating
Margin
Towards
~20%
Beyond
$1
Billion
in
Revenue
with Well-Identified Long-Term Levers
Focused on Operating Margin Expansion With
Continued R&D Focus
9
*NuVasive Guidance as of 2/24/15 as Posted on the Company’s Investor Relations Website
Under “IR Overview” Prior
Non-GAAP
Definition
‘14 Actual
Updated Non-
GAAP Definition
(all figures are
approximations)
‘14 Actual
OM @ ~20%
Gross Margin
~76.1%
~76.1%
~78.0%
Sales, Marketing
& Admin.
~54.9%
~59.9%
~52.5%
Research & Development
~4.5%
~4.8%
~5.5%
Operating Expenses
~59.5%
~64.7%
~58.0%
Operating Margin
~16.7%
~11.4%
~20.0%
EBITDA Margin
n/a
~21.9%
~30.0% |
 Well-Identified
Operating
Levers
Remain
Unchanged
Driving Operating Margin Towards ~20%
Beyond $1 Billion in Revenue*
10
*NuVasive Guidance as of 2/24/15 as Posted on the Company’s Investor Relations Website
Under “IR Overview” 9.5%
11.5%
13.5%
15.5%
17.5%
19.5%
21.5%
11.4%
~150
~150
~100
~50
~100
~200
~200
~100
~100
~200
~15%
~20%
#’s represent approximation of basis point impact
|
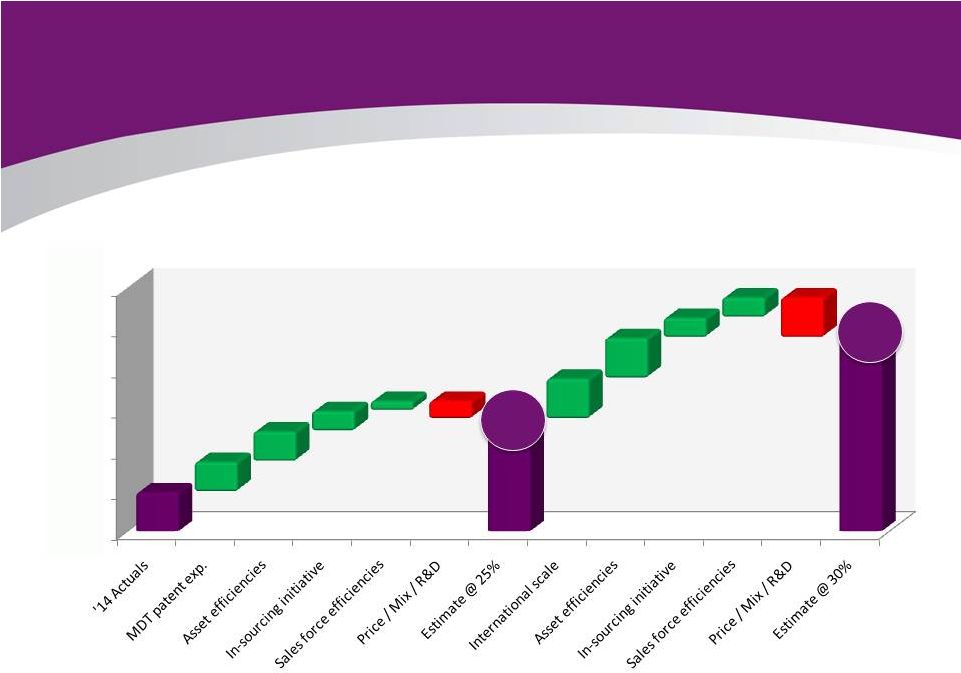 EBITDA Margin* Performance Remains Strong
Driving EBITDA Margin Towards ~30%
Beyond $1 Billion in Revenue^
11
* Non-GAAP EBITDA Margin excludes the impact of stock-based compensation expense
^NuVasive Guidance as of 2/24/15 as Posted on the Company’s Investor Relations Website
Under “IR Overview” 20.0%
22.0%
24.0%
26.0%
28.0%
30.0%
32.0%
21.9%
~150
~150
~100
~50
~100
~200
~200
~100
~100
~200
~25%
~30%
#’s represent approximation of basis point impact
|
 •
Utilizing OUS infrastructure to
drive long-term operational
efficiencies
•
ETR expected to gradually
work from 2014 high point
toward mid 30’s as Company
approaches $1 billion in
revenue*
•
Managing for the long term
Committed to Driving EPS Growth at ~ 2x the Rate
of Revenue Growth
•
Stockholders approved new
equity incentive plan in 2014
•
Reducing “burn rate”
to
< 2% in future years
Globalization Initiative
Designed to Drive ETR Lower
Additional EPS Lever Through
Reduced Share Dilution
12
*NuVasive Guidance as of 2/24/15 as Posted on the Company’s Investor Relations Website
Under “IR Overview” |
 Evolving into a Global Business
With Increasing Scale and Profitability
By Driving Mid to High Single-Digit
Revenue
Growth
Operating Margin Expansion
To ~20%
EBITDA Margin Expansion to ~30%
And EPS Growth at ~2x the
Rate of Revenue Growth
A Look at NuVasive Beyond $1 Billion in Revenue*
13
*NuVasive Guidance as of 2/24/15 as Posted on the Company’s Investor Relations Website
Under “IR Overview” |
 Updated Non-GAAP Definition
February 24, 2015 |