Attached files
| file | filename |
|---|---|
| EXCEL - IDEA: XBRL DOCUMENT - MICREL INC | Financial_Report.xls |
| EX-32 - OFFICER CERTIFICATIONS PURSUANT TO SECTION 906 OF SARBANES-OXLEY ACT OF 2002 - MICREL INC | mcrl-ex32_20141231x10k.htm |
| EX-23.2 - PRICEWATERHOUSECOOPERS LLP CONSENT - MICREL INC | mcrl-ex232_20141231x10k.htm |
| EX-21.1 - LIST OF SUBSIDIARIES - MICREL INC | mcrl-ex211_20141231x10k.htm |
| EX-23.1 - KPMG LLP CONSENT - MICREL INC | mcrl-ex231_20141231x10k.htm |
| EX-31 - OFFICER CERTIFICATIONS PURSUANT TO SECTION 302 OF SARBANES-OXLEY ACT OF 2002 - MICREL INC | mcrl-ex31_20141231x10k.htm |
UNITED STATES
SECURITIES AND EXCHANGE COMMISSION
WASHINGTON, D.C. 20549
FORM 10-K
ý ANNUAL REPORT PURSUANT TO SECTION 13 or 15(d) OF THE SECURITIES EXCHANGE ACT OF 1934
For the fiscal year ended December 31, 2014.
¨ TRANSITION REPORT PURSUANT TO SECTION 13 OR 15(d) OF THE SECURITIES EXCHANGE ACT OF 1934
For the transition period from ________ to ________.
Commission File Number 0-25236
MICREL, INCORPORATED
(Exact name of Registrant as specified in its charter)
California | 94-2526744 |
(State or other jurisdiction of incorporation or organization) | (I.R.S. Employer Identification No.) |
2180 Fortune Drive, San Jose, CA 95131
(Address of principal executive offices) (Zip Code)
Registrant’s telephone number, including area code: (408) 944-0800
Securities registered pursuant to Section 12(b) of the Act:
Title of Each Class | Name of Each Exchange on Which Registered | |||
Common Stock, no par value | The NASDAQ Global Select Market | |||
Securities registered pursuant to Section 12(g) of the Act: None
Indicate by check mark if the registrant is a well-known seasoned issuer, as defined in Rule 405 of the Securities Act. Yes ¨ No ý
Indicate by check mark if the registrant is not required to file reports pursuant to Section 13 or Section 15(d) of the Act. Yes ¨ No ý
Indicate by check mark whether the registrant (1) has filed all reports required to be filed by Section 13 or 15(d) of the Securities Exchange Act of 1934 during the preceding 12 months (or for such shorter period that the registrant was required to file such reports), and (2) has been subject to such filing requirements for the past 90 days. Yes ý No ¨
Indicate by check mark whether the registrant has submitted electronically and posted on its corporate web site, if any, every Interactive Data File required to be submitted and posted pursuant to Rule 405 of Regulation S-T during the preceding 12 months (or for such shorter period that the registrant was required to submit and post such files). Yes ý No ¨
Indicate by check mark if disclosure of delinquent filers pursuant to Item 405 of Regulation S-K is not contained herein, and will not be contained, to the best of registrant’s knowledge, in definitive proxy or information statements incorporated by reference in Part III of this Form 10-K or any amendment to this Form 10-K. ¨
Indicate by check mark whether the registrant is a large accelerated filer, an accelerated filer, a non-accelerated filer, or a smaller reporting company. See the definitions of “large accelerated filer,” “accelerated filer” and “smaller reporting company” in Rule 12b-2 of the Exchange Act. Large accelerated filer ¨ Accelerated filer ý Non-accelerated filer ¨ Smaller reporting company ¨
Indicate by check mark whether the registrant is a shell company (as defined in Rule 12b-2 of the Exchange Act). Yes ¨ No ý
As of June 30, 2014, the aggregate market value of the voting stock held by non-affiliates of the Registrant was approximately $256 million based upon the last reported sales price of the Common Stock as reported on the Nasdaq Global Select Market on such date. Shares of Common Stock held by officers, directors and holders of more than ten percent of the outstanding Common Stock have been excluded from this calculation because such persons may be deemed to be affiliates. The determination of affiliate status is not necessarily a conclusive determination for other purposes.
As of January 31, 2015, the Registrant had outstanding 56,417,092 shares of Common Stock.
DOCUMENTS INCORPORATED BY REFERENCE:
Portions of the Registrant’s Proxy Statement for its 2015 Annual Meeting of Shareholders, which is now scheduled for June 19, 2015 (as discussed under Part II, Item 9B of this Report), are incorporated by reference in Part III of this Report.
MICREL, INCORPORATED
TABLE OF CONTENTS
Page | ||
PART I | ||
Item 1. | ||
Item 1A. | ||
Item 1B. | ||
Item 2. | ||
Item 3. | ||
Item 4. | ||
PART II | ||
Item 5. | ||
Item 6. | ||
Item 7. | ||
Item 7A. | ||
Item 8. | ||
Item 9. | ||
Item 9A. | ||
Item 9B. | ||
PART III | ||
Item 10. | ||
Item 11. | ||
Item 12. | ||
Item 13. | ||
Item 14. | ||
PART IV | ||
Item 15. | ||
2
SPECIAL NOTE REGARDING FORWARD-LOOKING STATEMENTS
The statements contained in this Report on Form 10-K that are not purely historical are forward-looking statements within the meaning of Section 27A of the Securities Act of 1933, as amended (the “Securities Act”) and Section 21E of the Securities Exchange Act of 1934, as amended (the “Exchange Act”), including statements regarding our expectations, hopes, intentions or strategies regarding the future. Forward-looking statements include, but are not limited to statements regarding: future revenues and dependence on product sales; the levels of international sales; the effect of global market conditions on revenue levels, profitability and results of operations; future products or product development; statements regarding fluctuations in our results of operations; future returns and price adjustments and allowance; future uncollectible amounts and doubtful accounts allowance; future research and development spending and our product development strategy; our markets, product features and performance; product demand and inventory to service such demand; competitive threats and pricing pressure; the effect of dependence on third parties; our future use and protection of intellectual property; future expansion or utilization of manufacturing capacity; future expenditures; current or future acquisitions; the ability to meet anticipated short term and long term cash requirements; effect of changes in market interest rates on investments; our need and ability to attract and retain certain personnel; the cost and outcome of litigation and its effect on us; the future realization of tax benefits; and share-based incentive awards and expectations regarding future share-based compensation expense. In some cases, forward-looking statements can be identified by the use of forward-looking terminology such as “believe,” “estimate,” “may,” “can,” “will,” “could,” “would,” “intend,” “objective,” “plan,” “expect,” “likely,” “potential,” “possible” or “anticipate” or the negative of these terms or other comparable terminology and similar expressions. All forward-looking statements included in this document are based on information available to us on the date of this Report, and we assume no obligation to update any such forward-looking statements, including those risks discussed under “Risk Factors” and elsewhere in this Report, except as required by applicable law. These statements are subject to risks and uncertainties that could cause actual results and events to differ materially from those expressed or implied by such forward-looking statements. Some of the factors that could cause actual results to differ materially are set forth in Item 1 (“Business”), Item 1A (“Risk Factors”), Item 3 (“Legal Proceedings”) and Item 7 (“Management's Discussion and Analysis of Financial Condition and Results of Operations”).
PART I
ITEM 1. BUSINESS
General
Micrel, Incorporated was incorporated in California in July 1978. References to the “Company”, “Micrel” and “we” refer to Micrel, Incorporated and subsidiaries, which also does business as Micrel Semiconductor. Our principal executive offices are located at 2180 Fortune Drive, San Jose, California 95131. Our telephone number is (408) 944-0800. We maintain a corporate website located at www.micrel.com. Our annual reports on Form 10-K, quarterly reports on Form 10-Q, current reports on Form 8-K, and amendments to those reports are made available, free of charge, on the website noted above as soon as reasonably practicable after filing with or being furnished to the Securities and Exchange Commission. Please note that information contained on our website is not incorporated by reference in, or considered to be a part of, this report.
We design, develop, manufacture and market a range of high-performance analog, power and mixed-signal integrated circuits (“ICs”). We currently ship thousands of proprietary and industry-standard products. These products address a wide range of end markets including industrial and automotive, wireline communications, enterprise and cloud infrastructure and mobility. We also manufacture custom analog and mixed-signal circuits and provide wafer foundry services for customers which produce electronic systems utilizing semiconductor manufacturing processes as well as micro-electrical mechanical system (“MEMS”) technologies.
Our high performance linear and power products are characterized by high power density and small form factors. Recently, the demand for high performance linear and power circuits has been fueled by the growth of portable communications and computing devices, including for example, cellular handsets and tablet devices. The growth of internet connected devices continues to increase the power and data throughput requirements of the cloud and communication infrastructure equipment. We offer an extensive linear and power management product portfolio for the networking and communications infrastructure markets including cloud and enterprise servers, network switches and routers, storage area networks, wireless base stations, and the Internet of Everything. In addition, we offer products that serve the solid state drive market and are seeing strength in the emergence of solid state drives. We also offer an extensive portfolio of load switches and MOSFET drivers for industrial applications such as DC brushless motors.
3
Our timing and communications devices are used primarily in communications infrastructure markets, such as enterprise, data center, storage area networks, LTE, OTN and metropolitan networks. This product portfolio consists of system timing and clock generation and distribution as well as high speed physical media devices and fiber optic modules products. We use innovative silicon and packaging approaches and proprietary process technology to address the challenges of form factor size reductions, performance, integration and ease of use that are important for system developers. In 2012, we acquired PhaseLink, a private company based in Taiwan and in San Jose, California, in order to complement our high performance clock generation and distribution products for the communication market and to expand our product offerings into the consumer, automotive and industrial markets. PhaseLink provides high performance integrated timing solutions to system and oscillator manufacturers. In September 2013, we acquired specific net assets of Discera, which invented and implemented micro-electrical mechanical systems (“MEMS”) resonators to compete with standard quartz based oscillators and clock generators. We acquired Discera to complement our high performance clock and timing products, to expand our reach into mobile, cloud, industrial and automotive markets, as well as to extend our in-house MEMS process capabilities. With these acquisitions and our organic product development, we now offer a comprehensive portfolio of frequency control clock synthesizers and generators as well as clock conditioning and distribution products.
Our family of local area network (“LAN”) solutions products targets the automotive, industrial automation and control, unified communications and digital home network markets. This product portfolio consists of physical layer transceivers (“PHY”), media access controllers (“MAC”), switches, application specific standard products (“ASSP”) and system-on-a-chip (“SoC”) products that support transmission speeds from 10 Megabits per second to one Gigabit per second. We continue to transition our LAN solutions portfolio to higher value switch, ASSP and SoC products. These solutions enable our customers to develop cloud-enabled end-points and IP-adaptation devices with relatively low investment of time and resources and take advantage of emerging cloud-based services and Internet of Things (“IoT”) infrastructure. Emerging high value markets in automotive and industrial contributed over 50% of our LAN revenue in 2014.
Our foundry business offers foundry services to IC and MEMS designers and manufacturers seeking a production solution compatible with their specific application and/or technology needs. We offer various combinations of design, process and wafer foundry services including MEMS manufacturing capability. We fabricate wafers for customers using our standard processes, their existing processes or customized processes we develop for them.
On January 20, 2015, we announced that our Board of Directors had formed a Transaction Committee comprised of three independent directors to undertake a comprehensive review of strategic alternatives to enhance value for shareholders. We have engaged a financial advisor and outside counsel in connection with the process. There can be no assurance that our review of strategic alternatives will result in any transaction.
Industry Background
Analog, Mixed-Signal and Digital ICs Markets
ICs may be divided into three general categories — digital, analog (also known as “linear”) and mixed-signal. Digital circuits, such as memory and microprocessors, process information in the form of on-off electronic signals and are capable of implementing only two values, “1” or “0”. Analog circuits, such as regulators, converters and amplifiers, process information in the form of continuously varying voltages and currents that have an infinite number of values or states. Analog circuits condition, process, measure or control real world variables such as sound, temperature, pressure or speed. Mixed-signal ICs combine analog and digital functions on one chip.
Analog circuits are used in virtually every electronic system. The largest markets for such circuits are computers, telecommunications and data communications, industrial equipment, consumer, military and automotive electronics. Because of their numerous and diverse applications, analog circuits have a wide range of operating specifications and functions. For each application, different users may have unique requirements for integrated circuits such as specific resolution, linearity, speed, power, and signal amplitude capability.
As compared with the digital integrated circuit industry, the analog integrated circuit industry has the following important characteristics:
• | Dependence on Individual Design Teams. The design of analog circuits involves the complex and critical placement of various circuits. Analog circuit design has traditionally been highly dependent on the skills and experience of individual design engineers. |
4
• | Interdependence of Design and Process. Analog designers, especially at companies having their own wafer fabrication facilities, are able to select from several wafer fabrication processes in order to achieve higher performance and greater functionality from their designs. |
• | Longer Product Cycles and More Stable Pricing. Analog circuits generally have longer product cycles and greater price stability as compared to digital circuits. |
Recent Trends in Analog Power Management, Mixed-Signal and Digital ICs
Most electronic systems utilize analog circuits to perform power management functions (“power analog circuits”) such as the control, regulation, conversion and routing of various voltages and current. The enterprise/cloud infrastructure and wireline communications markets have emerged as two of the largest markets for power analog circuits. The increasing number of internet connected mobile devices has increased the power management and data bandwidth requirements of the cloud infrastructure equipment such as routers and servers deployed within the data centers. To capitalize on the emergence of cloud infrastructure, we have focused our new product research and development on developing products which capitalize on the growth of wireline communications, enterprise/cloud infrastructure and industrial and automotive markets.
Electronic systems commonly require clock signals that handle the timing of the data transactions and the management of system status. These mixed signal devices are critical for healthy system operation and for fast transaction of data. The continued increase in bandwidth requirements and computation power in networking systems, the expansion of electronics in automotive and industrial applications coupled with strong emerging markets such as IoT, wearable, cloud computing and power efficient applications, has led to a significant increase in the need for more sophisticated frequency and timing generation technologies. In recent years, there has been a considerable expansion in the number of broadband subscribers for both cable modem and fiber to the home technologies. We expect increased bandwidth demand of these users will continue to consume the installed capacity and drive infrastructure upgrades in metropolitan and wide area networks. We anticipate additional demand of new wireless services utilizing the transmission of video will further accelerate this trend.
In the past few years, there has been a fundamental change in terms of internet accessibility, with service providers and equipment manufacturers driving wide deployment of broadband networks and access to the Internet, resulting in increased use by consumers and enterprises alike. Cloud services have now matured to a level where they can support trillions of devices, thereby enabling the advent of the Internet of Things. The terms “Internet of Things”, “Internet of Everything” and “Industrial Internet” are used to describe machine-to-machine (M2M) connectivity across the Internet. IoT relies on any machine or device being connected to the Internet and then being able to transmit and receive information in one form or another. Based on these drivers, the market for LAN solutions based on Ethernet continues to grow in several segments such as automotive, industrial automation and control, unified communications and digital home networks. We expect to see broad adoption of Ethernet in automotive applications to support infotainment, advanced driver assistance systems and diagnostics. We believe deterministic Ethernet solutions are particularly suitable for next generation factory automation, process control, robotics and data acquisition. The transition to voice over Internet Protocol (“VoIP”) based voice communications continues in both enterprise and residential applications. With the emergence of cloud based services and the IoT, we anticipate additional need for VoIP in embedded applications such as emergency, security, intercom and paging in healthcare and utility management. We also expect demand for LAN connectivity of entertainment and control devices to continue within the digital home.
Micrel’s Strategy
We seek to capitalize on growth opportunities within our target end markets by developing and marketing high-performance analog, power and mixed-signal semiconductors. Our core competencies are our analog and mixed-signal design, packaging and device technology, as well as our in-house wafer fabrication capability. We intend to build a leadership position in our targeted markets by pursuing the following strategies:
• | Product Development Focus. We are focusing our research and development on growth areas within industrial, wireline communications, and enterprise/cloud infrastructure markets. These markets are characterized by higher gross margin and longer product life times than are typical in consumer markets. Although not a primary focus, we will continue to develop products for targeted opportunities within the mobility segment. |
• | Served Available Market Expansion. We are presently a trusted supplier to key original equipment manufacturers (“OEMs”) around the world. We intend to use these relationships to increase our revenues by providing more products to these key customers. In addition, through collaboration with these key customers, we believe we have access to a rich pipeline of new product development innovation opportunities. |
5
• | Maintain A Technological Leadership Position. We expect to continue making significant device and process optimizations which will continue to yield improvements in overall power dissipation and size and form factor reductions. |
• | Develop/Acquire New Complementary Businesses. We intend to continue to develop and acquire businesses that enhance our technology, complement our product portfolio and increase our importance to the customer. |
• | Capitalize on In-house Wafer Fabrication Facility. We believe that our in-house wafer fabrication facility provides close collaboration between design and process engineers to achieve performance levels not available from generic wafer foundries. We intend to continue developing process technologies which are not available at third-party wafer foundries. |
• | Maintain a Strategic Level of Foundry Products Revenue. Our foundry business broadens our revenue base and lowers overall per unit manufacturing costs through greater facility utilization. |
• | Protect Proprietary Technology. We seek to identify and protect our proprietary technology through the development of patents, trademarks and copyrights. |
Products and Markets
Overview
We currently operate in one segment: the design, manufacturing, marketing and sale of semiconductor products.
We generate revenue from four product groups: Linear and Power; Timing and Communications; LAN; and Foundry. The following table sets forth the net revenues attributable to our four product groups as a percentage of total net revenues.
Net Revenues by Product Group | |||||||||
Years Ended December 31, | |||||||||
2014 | 2013 | 2012 | |||||||
Net Revenues: | |||||||||
Linear and Power | 52 | % | 57 | % | 59 | % | |||
Timing and Communications | 25 | 21 | 20 | ||||||
LAN | 21 | 20 | 19 | ||||||
Foundry | 2 | 2 | 2 | ||||||
Total net revenues | 100 | % | 100 | % | 100 | % | |||
6
Our products address a wide range of end markets. Net revenues by end market categorization are based on the estimated predominant category of the OEM or distributor purchasing the parts. The eventual end market where our products are incorporated may differ, especially for parts sold through distribution channels. Our industrial products address a wide range of end markets such as automotive, control and automation, electronic instrumentation, financial terminals, security, medical and metering. Our wireline communication products are deployed within carrier infrastructure such as LTE/4G, optical transport networking (OTN) and fiber to the home (FTTH) networks. Our Enterprise/Cloud Infrastructure products are used in storage, switches, routers and servers for datacenters and enterprise networks. Our mobility products are suited for Internet of Things (IOT) devices and low power battery powered mobile devices such as smart phones and tablets. Our Other products are primarily silicon foundry services and custom products. The following table presents our estimated revenues by end market as a percentage of total net revenues.
Net Revenues by End Market | Years Ended December 31, | ||||||||
2014 | 2013 | 2012 | |||||||
As a Percentage of Total Net Revenues: | |||||||||
Industrial and Automotive | 52 | % | 54 | % | 50 | % | |||
Wireline Communications | 19 | 17 | 18 | ||||||
Enterprise / Cloud Infrastructure | 17 | 15 | 15 | ||||||
Mobility | 10 | 13 | 15 | ||||||
Other | 2 | 1 | 2 | ||||||
Total net revenues | 100 | % | 100 | % | 100 | % | |||
For a discussion of the changes in net revenues from period to period, see “Management’s Discussion and Analysis of Financial Condition and Results of Operations.”
Products
In recent years, we have directed a majority of our development, sales and marketing efforts towards expanding our product offering to address larger markets for our products and to expand our customer base. We offer a broad range of high performance analog, power and mixed signal ICs that address high growth markets including industrial, wireline communications, cloud infrastructure and mobility.
Power Conversion Products. Most electronic equipment requires a power supply that converts and regulates the electrical power source into usable voltages for the equipment. We have multiple power conversion product families:
• | LDOs – LDOs have long been a cornerstone of our product offering. LDOs are linear voltage regulators which allow lower voltage devices to be connected to higher voltage power rails. We offer numerous LDO products ranging from low cost portable regulators, to high performance (high accuracy), high current regulators with system supervisory functions. |
• | DC/DC converters – Our DC/DC converter products are offered in controller (no power switches) and regulator (switches on board) form. We compete based on power density, high voltage capability, and small form factor. The devices are primarily used in solid state drives, cloud servers, networking, portable equipment and base stations. |
• | Analog Power Switches – We offer analog switches that range from straight current switching to reverse blocking, current protected and soft start devices with system supervisory options. The devices are primarily used in LCD TV, computer USB port and wireless mobility devices. In addition, we offer a family of hot swap controllers including second sources of leading competitive devices targeted primarily to the networking and telecom markets. |
• | PMICs – Power Management Integrated Circuits (“PMICs”) combine system supervisory, DC/DC, LDO and interfacing requirements in a single IC to save space and cost. We have introduced PMIC devices for key applications such as solid state drives. |
• | Solid State Lighting – Our offerings include camera flash LED drivers for the portable and non-portable backlighting markets, as well as drivers for solid state architectural and general illumination. These products have been adopted by portable equipment and wireless mobility manufacturers as an alternative to more costly charge pump solutions. |
7
• | FET Drivers – We produce buffers which allow DC/DC controllers to interface to external switches and provide the power needed to drive these switches. Our FET drivers are also used in various power tool applications such as electric screw drivers and other consumer and industrial motor drive applications. |
Supervisory Products. We offer supervisory and reference products which protect, monitor and improve the interface of circuitry, especially around microcontroller and processor circuits. Demand for products in this area has been driven by numerous tracking, sequencing, and monitoring requirements in various networking and industrial applications.
General Linear. Our offerings include a line of general linear parts ranging from op amps, to thermal measurement devices, timers and other general devices. These types of devices are deployed in many diverse types of equipment across a multitude of markets.
Radio Frequency Data Communications. Our QwikRadio® family of RF receivers and transmitters are designed for use in any system requiring a cost-effective, low-data-rate wireless link. Typical examples include garage door openers, lighting and fan controls, automotive keyless entry and remote controls. Our RadioWire® transceivers provide a higher level of performance for more demanding applications such as remote metering, security systems and factory automation.
Clock and Timing Market. Our timing and communications products include clock and timing products such as integrated clocking solutions with internal quartz crystal, low jitter clock generators, clock distribution buffers, oscillator die, and industry leading MEMS-based Crystal-less™ clock generators and PureSilicon™ oscillators. These products address the requirements of a broad range of applications including high speed data rate communications protocols such as 1/10/40/100 Gigabit Ethernet, cloud computing, servers, data storage, in-vehicle infotainment, advanced driver assistance systems (“ADAS”), industrial controls, medical equipment, LTE based stations, Common Public Radio Interface (“CPRI”), wearable devices, tablets, media and video, smart meters, solar inverters, set-top boxes, CPE, surveillance systems, measurement and instrumentation equipment. The products also provide solutions for more general purpose standards such as PCI express, XAUI, SAS/SATA and others. Our products address clock and timing requirements of multiple market sectors, including telecommunications, data communications, computation, consumer and handheld, as well as embedded, industrial, medical, and automotive segments.
• | FUSION - Integrated Clocking Solution. In 2012, we announced a clocking solution with integrated quartz crystal that provides several elements of the timing chain within a single package. By integrating the clock tree in a single device, these products can enable simpler customer design, improved signal integrity necessary for high bandwidth and reduced bill of materials and board area. In 2014, the product line was augmented with the addition of industry compatible quartz based oscillators that meet performance requirements of highly demanding applications while simplifying the supply chain. These devices are designed to be quickly configurable to meet customers’ unique requirements for high speed data links in servers, storage, networking, LTE and base-station equipment. |
• | FLEX - Low Jitter Clock Generators. We offer a set of configurable low jitter clock generators. Useful in clocking high speed data links in, telecommunications, networking, storage, servers, and base station applications, this family of products offers integration and performance benefits that reduce component count and simplify end customer designs. Due to their ultra-low jitter, these devices meet high performance requirements in data communications, network security, enterprise storage and base station and test equipment applications. |
• | PicoPLL™ - Low Power and General Purpose Clock Generators. Our acquisition of Phaselink has enabled us to address customized, general purpose, low power and consumer clock generation requirements. These clock generators are used in femtocell, set-top box, mobile/battery operated and embedded applications and are also applicable in control plane and processor or FPGA clocking applications within telecommunications, servers, networking and storage systems. |
• | Precision Edge® - Clock Distribution and Conditioning. These products provide clock distribution, signal level shifting, frequency scaling and multiplexing of high performance clocks. They are used in servers, telecommunications, networking, storage, instrumentation, industrial and test and measurement markets. |
8
• | Crystal-less™ Clock Generators. This family of products is a result of the acquisition of Discera. We believe the devices represent one of the highest levels of integration in the industry for multiple output clock generation. Unlike competing solutions in the market that rely on external quartz crystals, the Crystal-less™ clock generators are based on MEMS resonators and require no additional external components to operate. We believe the implementation of MEMS allows system designers to benefit from much lower component counts, bill of materials reduction, space savings and higher stability over wider temperature range. This family of products provides solutions applicable in communications, storage, consumer, computation, industrial and automotive market segments. |
• | PureSilicon™ Oscillators. This family of products is also a result of the acquisition of Discera. The devices are based on MEMS resonators and provide single output, industry standard footprints. They are drop-in replacements for oscillators which are based on combining multiple components driven by a quartz crystal. We believe that the use of MEMS in these applications allows designers to reach a wider temperature range with higher stability in addition to improvements in quality and reliability as well as shock and vibration resistance. These components may be used across a wide range of markets including storage, communications, computing, consumer, medical, industrial and automotive. |
High-Speed Communications Market. Our timing and communications product group also develops and produces Clock and Data Recovery (“CDR”), Serializer/Deserializer (“SERDES”), PMD devices such as burst-mode and continuous mode limiting post amplifiers, laser diode drivers, integrated single chip transceivers, and optical module controller circuits for high speed communications products. Primary applications are fiber optic communications systems and modules targeted at LTE, PON, SONET/SDH/OTN, enterprise data communications, storage area networks, and wireless base station infrastructure.
LAN Solutions. Our LAN solutions portfolio is targeted at several large and growing segments such as automotive, industrial automation and control, unified communications and digital home networks which are seeing an increasing adoption of Ethernet.
• | Industrial. We offer a line of I-Temp qualified LAN solutions and our EtherSynchTM product family for deterministic Ethernet applications, such as industrial control. Ethernet is already commonplace across industrial control and automation networking and is now emerging as the replacement for device-layer fieldbus technologies, enabling the Industrial Internet of Things. |
We offer a portfolio of integrated, energy efficient and deterministic industrial grade networking products. We believe our EtherSynch™ IEEE1588 Time Synchronization ASSP family significantly reduces the complexity and overhead of deploying deterministic real-time control and communications. The portfolio includes products utilizing technologies such as Quiet-WIRE™ for reduced emissions and enhanced immunity and LinkMD+™ for cable fault diagnostics and link quality monitoring. We believe that the ability of our products to identify, monitor and control remotely individual devices on a network offers significant benefits to the industry.
• | Automotive. We offer a family of Ethernet products qualified to AEC-Q100 specifications. In partnership with automotive OEMs, we have pioneered the introduction of Ethernet for vehicle diagnostic and software download applications and made it possible for many additional in-vehicle Ethernet bus applications. We believe we offer one of the widest portfolios of automotive qualified Ethernet devices in the industry. |
We offer a portfolio of automotive Ethernet solutions to enable reliable, energy efficient in-vehicle networking for infotainment and ADAS. Based on IEEE1588v2 / IEEE802.1AS EtherSynch™ deterministic hardware technology, real-time audio video streaming and control solutions can be realized with reduced complexity and overhead. We believe Quiet-WIRE™ reduced emissions technology eliminates the need for shielding, enabling unshielded twisted pair wiring, such as FlexRay and CAN, to be utilized by an automotive manufacturer with significantly reduced cost and ease of installation.
• | Unified communications. We have recently developed solutions for both VoIP phones and analog telephone adapters (“ATA”). We have developed software to facilitate adoption of our products and also introduced multiple port ATA and VoIP to POTS failover solutions. Our VoIP product family of products can be used to create a range of end-points or to create IP-adaptation sub systems to cloud-enable legacy devices. Our solutions include a DSP audio subsystem, complete network switch and RISC CPU, thereby lowering bill of material costs. |
9
• | Digital Home. Our family of PHY transceivers, controllers, and switches has been employed in major consumer electronics products such as digital TVs, media players, set top boxes, and other LAN enabled devices. New offerings include support for Energy Efficient Ethernet, Wake on LAN and other capabilities. Based on EtherGreen™ low power physical layer technology, our LAN solutions offer a portfolio of application-optimized, small footprint, high performance PHYs, switches, controllers and SoCs to address the smart digital home. |
Our future success will depend in part upon the timely completion, introduction and market acceptance of new products.
Foundry Services
We offer various combinations of design, process and foundry services including MEMS manufacturing capability. MEMS are highly specialized and dedicated devices. They are used in manufacturing pressure, temperature, chemical and vibration sensors, light reflectors and switches as well as accelerometers for airbags, vehicle controls, pacemakers and games.
We typically provide foundry customers with one of the following services:
• | R&D Foundry. We modify a process or develop a new process for a customer. Using either the modified or new process and mask sets provided by the customer, we manufacture fabricated wafers for the customer. |
• | Foundry. We duplicate a customer’s process to manufacture fabricated wafers designed by the customer. |
Sales, Distribution and Marketing
We sell our products through a worldwide network of independent sales representatives, distributors and through direct sales staff.
We sell our products in Europe through direct sales staff in the United Kingdom, Germany and France as well as independent sales representative firms and independent distributors. Asian sales are handled through our sales offices in Korea, Japan, Taiwan, China and Singapore and distributors.
In 2014, sales to customers in Asia, North America and Europe accounted for 63%, 23% and 14%, respectively, of our net revenues. In 2013, sales to customers in Asia, North America and Europe accounted for 61%, 26% and 13%, respectively, of our net revenues. In 2012, sales to customers in Asia, North America and Europe accounted for 61%, 27% and 12%, respectively, of our net revenues. Our net revenues by country, including the United States, are included in Note 14 of Notes to Consolidated Financial Statements.
Our international sales are primarily denominated in U.S. dollars. Consequently, changes in exchange rates that strengthen the U.S. dollar could increase the price in local currencies of our products in foreign markets and make our products relatively more expensive than our competitors’ products that are denominated in local currencies, leading to a reduction in sales or profitability in those foreign markets. We have not taken any protective measures against exchange rate fluctuations, such as purchasing hedging instruments with respect to such fluctuations.
Customers
For the year ended December 31, 2014, no OEM customer accounted for more than 10% of our net revenues and two worldwide distributors accounted for 25% and 18%, respectively, of our net revenues. For the year ended December 31, 2013, no OEM customer accounted for more than 10% of our net revenues and two worldwide distributors accounted for 29% and 17%, respectively, of our net revenues. For the year ended December 31, 2012, one OEM customer accounted for 10% of our net revenues and two worldwide distributors accounted for 22% and 15%, respectively, of our net revenues. The increase in percentage of revenue from our largest distributor from 2012 to 2013 was primarily due to its acquisition and integration of one of our other significant distributors in 2013.
Research and Development
We compete in part by employing process technologies that we believe provide particular capabilities for the products we develop. Developing or having access to state of the art and cost effective process technologies is especially important for our high performance linear and power solutions products. Our high performance linear and power proprietary circuit design technology depends on the skills of our analog design teams.
10
We continue to develop process technologies and implement new designs on our CMOS and Bipolar-CMOS-DMOS (“BCD”) processes. These processes are characterized by an array of analog devices including analog resistors and capacitors, post package trim devices, optimized ESD and optimized power transistors with voltage capability up to 65V. In addition, we believe we have differentiated interconnection and packaging technologies. We compete in part by having these capabilities as compared to competitors which use a fabless model because these simultaneous capabilities are generally not available at many third party foundries.
Additionally, we have high speed Silicon Germanium technologies which enable us to make products for high speed networking and communications markets.
We utilize third-party wafer fabrication foundries for advanced CMOS fabrication processes and other advanced processes that are not available in-house. For the year ended December 31, 2014, approximately 28% of wafer silicon for our products was fabricated at third-party foundry suppliers, including all of our LAN products.
Our ability to compete will substantially depend on our ability to define, design, develop and introduce on a timely basis new products offering design or technology innovations. Research and development in the analog and mixed-signal integrated circuit industry is characterized primarily by circuit design and product engineering that enables new functionality or improved performance. Our research and development efforts are also directed at our process technologies and focus on cost reductions to existing manufacturing processes and the development of new process capabilities to manufacture new products and add new features to existing products. With respect to more established products, our research and development efforts also include product redesign, shrinkage of device size and the reduction of mask steps in order to improve die yields per wafer and reduce per device costs.
Our analog, mixed-signal and digital design engineers principally focus on developing next generation products for our targeted markets. Our new product development strategy emphasizes a broad line of products that are based on customer input and requests.
In 2014, 2013 and 2012, we spent $62.0 million, $55.9 million, and $57.2 million, respectively, on research and development. We expect that we will continue to spend substantial funds on research and development activities.
Patents and Intellectual Property Protection
We seek patent protection for those inventions and technologies for which such protection is suitable and is likely to provide a competitive advantage to us. At December 31, 2014, we held 365 United States patents on semiconductor devices and methods, with various expiration dates through 2034. We had applications for 28 United States patents pending. We held 87 issued foreign patents and have applications for 17 foreign patents pending. In addition, we have exclusive licenses to 22 United States patents and 10 foreign patents relating to MEMS technology.
Supply of Materials and Purchased Components
We generally purchase certain components from a limited group of vendors. The packaging of our products is performed by, and certain of the raw materials included in such products are obtained from, a limited group of suppliers. The wafer supply for our LAN products is primarily dependent upon three large third-party wafer foundry suppliers. In most cases, we can transition to alternative suppliers, but doing so may require significant time and engineering resources.
Manufacturing
We fabricate the majority of our wafers at our wafer fabrication facility located in San Jose, California, while 28% of wafer silicon for our products is subcontracted to outside foundries, including 100% of our LAN product wafer requirements. The San Jose facility includes a 57,000 square foot office and manufacturing facility containing a 28,000 square foot clean room facility, which provides production processes. The facility uses six-inch wafer technology and process geometry nodes down to 0.35 microns. We also own approximately 63,000 square feet of additional adjacent space in San Jose that is used as a testing facility and administrative offices.
Generally, our wafers are electrically tested for performance, and most of the wafers are subsequently sent to independent assembly and final test contract facilities in Thailand, China, Malaysia and certain other Asian countries. At such facilities, the wafers are separated into individual circuits and packaged.
11
Competition
The semiconductor industry is highly competitive and subject to rapid technological change. Significant competitive factors in the market for our products include product features, performance, price, the timing of product introductions, the emergence of new technological standards, quality and customer support.
The market for analog ICs is diverse and highly fragmented, and we encounter different competitors in our various market areas. Our principal linear and power competitors include Linear Technology Corporation, Maxim Integrated Products, Inc. and Texas Instruments Inc. in one or more of our product areas. Other competitors include Freescale Semiconductor, Inc., Intersil Corporation, Fairchild Semiconductor International, Inc., Skyworks Solutions, Inc., Semtech Corporation and ON Semiconductor Corporation. Our principal competitors for products targeted at the timing market are Integrated Device Technology, Inc., Silicon Laboratories, Inc., Texas Instruments, Inc., and ON Semiconductor Corporation on the clock generation and clock distribution side, and Epson, Kyocera and other oscillators manufacturers on the frequency control side. Our communications and fiber optic module solutions compete with Maxim Integrated Products, Inc. and Semtech Corporation. The primary competitors for our LAN products are Broadcom Corp., Marvell Technology Group Ltd., Microchip Technology Inc. and Realtek Semiconductor Corp. Most of these companies have substantially greater technical, financial and marketing resources and greater name recognition than us.
With respect to the custom and foundry products business, significant competitive factors include product quality and reliability, established relationships between customers and suppliers, timely delivery of products, and price.
Backlog
At December 31, 2014, our backlog was approximately $62 million, substantially all of which is scheduled to be shipped during the first six months of 2015. At December 31, 2013, our backlog was approximately $68 million. Orders in backlog are subject to cancellation or rescheduling by the customer, generally with a cancellation charge in the case of custom and foundry products. Our backlog consists of distributor and customer released orders requesting shipment within the next six months. Shipments to sell-through distributors who receive significant return rights and price adjustments from us are not recognized as revenue by us until the product is sold from the sell-through distributor stock to the end-customers. Because of possible changes in product delivery schedules and cancellation of product orders and because an increasing percentage of our sales are shipped in the same quarter that the orders are received, our backlog at any particular date is not necessarily indicative of actual sales for any succeeding period.
Environmental Matters
Federal, state and local regulations impose various environmental controls on the storage, handling, discharge and disposal of chemicals and gases used in our manufacturing process. We believe that our activities conform to present environmental regulations.
Employees
At December 31, 2014, we had 707 full-time employees, compared to 728 at December 31, 2013. Our employees are not represented by any collective bargaining agreements, and we have never experienced a work stoppage. We believe we have a good relationship with our employees.
ITEM 1 A. RISK FACTORS
Factors That May Affect Operating Results
If our operating results are below the expectations of public market analysts or investors, then the market price of our common stock could decline. Many factors that can affect our quarterly and annual results are difficult to control or predict. Some of the factors which can affect a multinational semiconductor business such as us are described below.
12
Geopolitical and Macroeconomic Risks That May Affect Multinational Enterprises
Weak global economic conditions could have a material adverse effect on our business, results of operations, and financial condition. While the global economy has partially recovered from the economic downturn that began in 2007, continued weakness in the macroeconomic climate has constrained demand for our semiconductors and there is no guarantee that these conditions will improve in a timely manner or at all or that these conditions will not further decline again in the future. The semiconductor industry has traditionally been highly cyclical and has often experienced significant downturns in connection with, or in anticipation of, declines in general economic conditions. We cannot accurately predict the timing, severity or duration of such downturns. A global recession may result in a decrease in orders for our products, which may materially adversely affect our revenues, results of operations and financial condition. In addition to reduction in sales, our profitability may decrease during economic downturns because we may not be able to reduce costs at the same rate as our sales decline.
Demand for semiconductor components is increasingly dependent upon the rate of growth of the global economy. Many factors could adversely affect regional or global economic growth. Some of the factors that could slow global economic growth include: volatility in global credit markets, price inflation or deflation for goods, services or materials, a slowdown in the rate of growth of regional economies such as Europe, China or the United States, a significant act of terrorism that disrupts global trade or consumer confidence, and geopolitical tensions including war and civil unrest. Reduced levels of economic activity, or disruptions of international transportation, could adversely affect sales on either a global basis or in specific geographic regions.
Market conditions may lead us to initiate cost reduction plans, which may negatively affect near term operating results. Weaker customer demand, competitive pricing pressures, continued excess capacity, weak economic conditions or other factors, may cause us to initiate actions to reduce our cost structure to improve our future operating results. The cost reduction actions may require incremental costs to implement, which could negatively affect our operating results in periods when the incremental costs or liabilities are incurred.
Disruption in financial markets may adversely affect our business in a number of ways. The unprecedented contraction and extreme disruption of the credit and financial markets in the United States, Europe and Asia that began in 2007 led to, among other things, extreme volatility in security prices, severely diminished liquidity and credit availability, rating downgrades of certain investments and declining valuation of others. A similar tightening of credit in financial markets in the future may limit the ability of our customers and suppliers to obtain financing for capital purchases and operations. This could result in a decrease in or cancellation of orders for our products or reduced ability to finance operations to supply products to us. We cannot predict the likely duration and severity of disruptions in financial markets and adverse economic conditions in the United States and other countries. Further, fluctuations in worldwide economic conditions make it extremely difficult for us to forecast future sales levels based on historical information and trends. Visibility into customer demand is limited due to short order lead times. Portions of our expenses are fixed and other expenses are tied to expected levels of sales activities. To the extent we do not achieve our anticipated levels of sales, our gross profit and net income could be adversely affected.
We have generated a substantial portion of our net revenues from export sales. We believe that a substantial portion of our future net revenues will continue to depend on export sales to customers in international markets, including Asia. International markets are subject to a variety of risks, including changes in policy by the U.S. or foreign governments, acts of terrorism, natural disasters, foreign government instability, social conditions such as civil unrest, economic conditions including high levels of inflation or deflation, fluctuation in the value of foreign currencies and currency exchange rates and trade restrictions or prohibitions. Changes in exchange rates that strengthen the U.S. dollar could increase the price of our products in the local currencies of the foreign markets we serve. This would result in making our products relatively more expensive than its competitors’ products that are denominated in local currencies, leading to a reduction in sales or profitability in those foreign markets. We have not taken any protective measures against exchange rate fluctuations, such as purchasing hedging instruments. In addition, we sell to domestic customers that do business worldwide and cannot predict how the businesses of these customers may be affected by economic or political conditions elsewhere in the world. Such factors could adversely affect our future revenues, financial condition, results of operations or cash flows.
13
Semiconductor Industry Specific Risks
The volatility of customer demand in the semiconductor industry limits our ability to predict future levels of sales and profitability. Semiconductor suppliers can rapidly increase production output in response to slight increases in demand, leading to a sudden oversupply situation and a subsequent reduction in order rates and revenues as customers adjust their inventories to account for shorter lead times. A rapid and sudden decline in customer demand for products can result in excess quantities of certain products relative to demand. Should this occur, our operating results may be adversely affected as a result of charges to reduce the carrying value of our inventory to the estimated demand level or market price. Our quarterly revenues are highly dependent upon turns fill orders (orders booked and shipped in the same quarter). The short-term and volatile nature of customer demand makes it extremely difficult to accurately predict near term revenues and profits.
The semiconductor industry is highly competitive and subject to rapid technological change, price-erosion and increased international competition. Significant competitive factors include product features; performance and price; timing of product introductions; emergence of new computer and communications standards; and quality and customer support. If we are unable to compete favorably in these areas, revenues and profits could be negatively affected.
The short lead-time environment in the semiconductor industry increases pressure on semiconductor suppliers to carry inventory in anticipation of orders which may not materialize. Customers have worked to minimize the amount of inventory of semiconductors they hold. As a consequence, customers are generally providing less order backlog to us and other semiconductor suppliers, resulting in short order lead times and reduced visibility into customer demand. As a consequence of the short lead-time environment and corresponding unpredictability of customer demand, we have increased our inventories over the past several years to maintain reliable service levels. If actual customer demand for our products is different from our estimated demand, delivery schedules may be impacted, product inventory may have to be scrapped, or the carrying value reduced, which could adversely affect our business, financial condition, results of operations, or cash flows.
In addition, we use sell-in distributors and sell-through distributors that carry inventory to service the volatile short-term demands of end customers. However, like many of our competitors, we generally recognize revenue on sales of product to sell-in distributors upon shipment, so fluctuations in inventory accumulation by sell-in distributors can exacerbate fluctuations in revenue from sales to such sell-in distributors.
Uncertain economic growth and customer demand in the semiconductor industry and increased concentration of electronics procurement and manufacturing may lead to further price erosion and increased advertising costs. If price erosion continues to occur, it will have the effect of reducing revenue levels and gross margins in future periods. Furthermore, the trend for our customers to move their electronics manufacturing to Asian countries has brought increased pricing pressure for us and the semiconductor industry as a whole. Asian-based manufacturers are typically highly cost sensitive. The increased concentration of electronics procurement and manufacturing in the Asia Pacific region may lead to continued price pressure and additional product advertising costs for our products in the future.
Many semiconductor companies, including us, face risks associated with a dependence upon third parties that manufacture, assemble, package or supply raw materials for certain of its products. These risks include reduced control over delivery schedules and quality; inadequate manufacturing yields and excessive costs; the potential lack of adequate capacity during periods of excess demand; difficulties selecting and integrating new subcontractors; potential increases in prices; disruption in supply due to civil unrest, terrorism, natural disasters or other events which may occur in the countries in which the subcontractors or suppliers operate; and potential misappropriation of our intellectual property. The occurrence of any of these events may lead to increased costs or delay delivery of our products, which would harm our profitability and customer relationships. Furthermore, a major disruption to any part of our customers’ supply chains could decrease their output and subsequently result in lower demand for our products.
14
We outsource some of our wafer fabrication, most of our test and all of our assembly requirements to third-party vendors. We do not have many long-term supply contracts with our third-party vendors. Therefore, most of our vendors are not obligated to perform services or supply products to us for any specific period, in any specific quantities, or at any specific price, except as may be provided in a particular accepted purchase order or guarantee. Additionally, our wafer and product requirements typically represent a relatively small portion of the total production of the suppliers, third-party foundries and outside assembly, testing and packaging contractors. As a result, we are subject to the risk that a third-party supplier will provide delivery or capacity priority to other larger customers to our detriment, resulting in an inadequate supply to meet customer demand or higher costs to obtain the necessary product supply. When demand for semiconductors improves, availability of these outsourced services typically becomes tight, resulting in longer than normal lead times and delinquent shipments to customers. The degree to which we may have difficulty obtaining these services could have a negative impact on our revenues, bookings and backlog. If these lead times are extended, the resulting loss of near-term visibility for our customers could result in their placing higher order levels than their actual requirements which may result in higher levels of order cancellations in the future. There can be no assurance that we will be able to accurately forecast demand and moderate our build schedules to accommodate the possibility of an increase in order cancellations.
Furthermore, our third-party vendors may be unwilling to supply certain products and processes or may be unable to do so due to business failure or bankruptcy. If replacement suppliers or manufacturing processes are not readily available, we may experience delays in shipment or lost revenue which could, in turn, result in temporary or permanent loss of customers.
The markets that we serve frequently undergo transitions in which products rapidly incorporate new features and performance standards on an industry-wide basis. If our products are unable to support the new features or performance levels required by OEMs in these markets, we would likely lose business from existing or potential customers and would not have the opportunity to compete for new design wins until the next product transition. If we fail to develop products with required features or performance standards or experience even a short delay in bringing a new product to market, or if our customers fail to achieve market acceptance of their products, our revenues could be significantly reduced for a substantial period of time.
Because the market for ICs is diverse and highly fragmented, we encounter different competitors in various market areas. Many of these competitors have substantially greater technical, financial and marketing resources and greater name recognition than us. We may not be able to compete successfully in the future and competitive pressures may adversely affect our financial condition, results of operations or cash flows.
The success of companies in the semiconductor industry depends in part upon intellectual property, including patents, trade secrets, know-how and continuing technology innovation. The success of companies like ours may depend on their ability to obtain necessary intellectual property rights and protect such rights. There can be no assurance that the steps taken by us to protect our intellectual property will be adequate to prevent misappropriation or that others will not develop competitive technologies or products. There can be no assurance that any patent owned by us will not be invalidated, circumvented or challenged, that the rights granted thereunder will provide competitive advantages or that any of its pending or future patent applications will be issued with the scope of the claims sought, if at all. Furthermore, others may develop technologies that are similar or superior to our technology, duplicate technology or design around the patents owned by us.
The significant investment in semiconductor manufacturing capacity and the rapid growth of circuit design centers in China may present a competitive threat to established semiconductor companies due to the current low cost of labor and capital in China. The emergence of low cost competitors in China could reduce the revenues and profitability of established semiconductor manufacturers, such as us.
There is intense competition for qualified personnel in the semiconductor industry. The loss of any key employees or the inability to attract or retain qualified personnel, including management, engineers and sales and marketing personnel, could delay the development and introduction of our products and harm our ability to sell our products. We believe that our future success is dependent on the contributions of our senior management, including our President and Chief Executive Officer, certain other executive officers and senior engineering personnel. We do not have long-term employment contracts with these or any other key personnel, and their knowledge of our business and industry would be difficult to replace.
15
Companies in the semiconductor industry are subject to a variety of federal, state and local governmental regulations related to the use, storage, discharge and disposal of toxic, volatile or otherwise hazardous chemicals used in its manufacturing process. Any failure to comply with present or future regulations could result in the imposition of fines, the suspension of production, alteration of manufacturing processes or a cessation of operations. In addition, these regulations could restrict our ability to expand our facilities at their present locations or construct or operate a new wafer fabrication facility or could require us to acquire costly equipment or incur other significant expenses to comply with environmental regulations or clean up prior discharges. Our failure to appropriately control the use of, disposal or storage of, or adequately restrict the discharge of, hazardous substances could subject us to future liabilities and could have a material adverse effect on our business.
Rules that impose diligence and disclosure requirements relating to “conflict minerals” may force us to incur significant expenses, may result in damage to our business reputation and may adversely impact our business, financial condition or operating results. The Dodd-Frank Wall Street Reform and Consumer Protection Act imposes disclosure requirements on companies that use certain minerals referred to as “conflict minerals” regardless of their actual country of origin, in their products. These metals are commonly used in electronic components and devices, including our products. These requirements require companies to investigate and disclose whether or not such metals originated from the Democratic Republic of Congo or adjoining countries and if so, whether sale of these metals was used to fund conflicts. Our supply chain is very complex and we rely on certifications from our suppliers that the minerals which they supply to us are sourced from smelters which do not source these minerals from the Democratic Republic of Congo or adjoining countries, or if they were sourced from such countries, did not fund conflict. If our suppliers do not sufficiently verify the origin of the relevant metals and their certifications are found to be inaccurate, we may face costs for heightened due diligence analysis of our supply chain, including a formal audit, as well as reputational challenges with our customers. Under these circumstances, our customers may purchase products from our competitors and seek damages from us for costs to conduct detailed due diligence of their supply chains. These outcomes could adversely impact our business, financial condition or operating results.
Company-Specific Risks
In addition to the risks that affect multinational semiconductor companies listed above, there are additional risks which are more specific to us such as:
The mobility (cellular telephone) market comprises a significant portion of our net revenues. We derive a significant portion of our net revenues from customers serving the mobility market. Due to the highly competitive and fast changing environment in which our mobility customers operate, demand for the product we sell into this end market and pricing for that product can change rapidly and unexpectedly. If our mobility customers’ acceptance of our products or pricing decreases, or if these customers lose market share or accumulate too much inventory of completed handsets, the demand for our products and/or the price at which we can sell our products could decline sharply, which could adversely affect our revenues and results of operations.
Our gross margin, operating margin and net income are highly dependent on the level of revenue, average selling prices and capacity utilization that we experience. A decline in average selling prices (“ASPs”) could adversely affect our revenues, gross margins and results of operations unless we are able to sell more units, reduce our costs, introduce new products with higher ASPs or some combination thereof. Semiconductor manufacturing is a capital-intensive business resulting in high fixed costs. If we are unable to utilize our installed wafer fabrication or test capacity at a high level, the costs associated with these facilities and equipment would not be fully absorbed, resulting in higher average unit costs and lower profit margins.
16
We are exploring and evaluating strategic alternatives for the Company, and there can be no assurance that we will be successful in identifying a strategic alternative, that any such strategic alternative will yield additional value for shareholders or that the process will not have an adverse impact on our business. In January 2015, we announced that we retained Credit Suisse Securities (USA) LLC as financial advisor to assist in exploring and evaluating a broad range of strategic alternatives. The process of exploring strategic alternatives may be time consuming and disruptive to our business operations, and if we are unable to effectively manage the process, our business, financial condition and results of operations could be adversely affected. In addition, identifying and evaluating potential strategic alternatives may result in the incurrence of expenses. No decision has been made with respect to any transaction, and we cannot assure you that we will be able to identify and undertake a transaction that allows our shareholders to realize an increase in the value of their stock or provide any guidance on the timing of such action, if any. Any strategic decision will involve risks and uncertainties, and we cannot assure you that any potential transaction or other strategic alternative if identified, evaluated and consummated, will provide greater value to our shareholders than that reflected in the current stock price. Any potential transaction would be dependent upon a number of factors that may be beyond our control, including, among other factors, market conditions, industry trends and the interest of third parties in our business. We do not intend to comment regarding the evaluation of strategic alternatives until such time as our board of directors has determined the outcome of the process or otherwise has deemed that disclosure is appropriate. As a consequence, perceived uncertainties related to the future of the Company may result in the loss of potential business opportunities and may make it more difficult for us to attract and retain qualified personnel and business partners.
We face various risks associated with the trend toward increased shareholder activism. In 2008, we became engaged in a proxy contest with a large shareholder. This dispute led to a significant increase in operating expenses which appreciably reduced our operating profit and net income. Although this dispute was resolved, we could become engaged in another proxy contest in the future. In August 2014, a family of investment funds filed a Schedule 13D with the SEC in which it disclosed that it may take action with respect to Micrel, including making proposals concerning changes to the capitalization, ownership structure, board structure (including board composition) or operations of Micrel. Such action could escalate to a proxy contest. A proxy contest would require significant additional management time and increased operating expenses and divert the attention of our Board of Directors and management from the pursuit of our business strategy, which could adversely affect our business, profitability and cash flows.
The semiconductor industry is characterized by frequent litigation regarding patent and other intellectual property rights. The semiconductor industry is characterized by frequent litigation regarding patent and other intellectual property rights. Claims alleging infringement of intellectual property rights have been asserted against us in the past and could be asserted against us in the future. These claims could result in us having to discontinue the use of certain processes or designs; cease the manufacturing, use and sale of infringing products; incur significant litigation costs and damages; attempt to obtain a license to the relevant intellectual property and develop non-infringing technology. We may not be able to obtain or renew such licenses on acceptable terms or to develop non-infringing technology. Existing claims or other assertions or claims for indemnity resulting from infringement claims could adversely affect our business, financial condition, results of operations or cash flows. In addition, we rely on third parties for certain technology that is integrated into some of our products. If we are unable to continue to use or license third-party technologies in our products on acceptable terms, or the technology fails to operate, we may not be able to secure alternative technologies in a timely manner and our business would be harmed. Furthermore, to the extent that we become involved in intellectual property litigation, it could result in substantial costs and diversion of resources to us and could have a material adverse effect on our financial condition, results of operations or cash flows.
The complexity of our products may lead to errors or defects, which could subject us to significant costs or damages and adversely affect market acceptance of our products. Although our customers and suppliers rigorously test our products, these products may contain undetected errors, weaknesses or defects. If any of our products contain production defects, reliability, quality or compatibility problems that are significant, our reputation may be damaged and customers may be reluctant to continue to buy our products. This could adversely affect our ability to retain and attract new customers. In addition, these defects could interrupt or delay sales of affected products, which could adversely affect our results of operations.
If defects are discovered after commencement of commercial production, we may be required to incur significant costs to resolve the problems. This could result in significant additional development costs and the diversion of technical and other resources from other development efforts. We could also incur significant costs to repair or replace defective products or may agree to be liable for certain damages incurred. These costs or damages could have a material adverse effect on our financial condition and results of operations.
17
We will continue to expend substantial resources developing new products, applications or markets and may never achieve the sales volume that we anticipate for these products, which may limit our future growth and harm our results of operations. Our future success will depend in part upon the success of new products. We have in the past, and will likely in the future, expend substantial resources in developing new and additional products for new applications and markets. We may experience unforeseen difficulties and delays in developing these products and experience defects upon volume production and broad deployment. The markets we enter will likely be highly competitive and competitors may have substantially more experience in these markets. Our success will depend on the growth of the markets we enter, the competitiveness of our products and our ability to increase market share in these markets. If we enter markets that do not achieve or sustain the growth we anticipate, or if our products are not competitive, we may not achieve volume sales, which may limit our future growth and would harm our results of operations.
If we are unable to convert a significant portion of our design wins into revenue, our business, financial condition and results of operations could be materially and adversely impacted. We have secured a number of design wins for new and existing products. Such design wins are necessary for revenue growth. However, many of our design wins may never generate revenues if end-customer projects are unsuccessful in the marketplace or the end-customer terminates the project, which may occur for a variety of reasons. Mergers and consolidations among customers may lead to termination of certain projects before the associated design win generates revenue. If design wins do generate revenue, the time lag between the design win and meaningful revenue is typically from six months to greater than eighteen months. If we fail to convert a significant portion of our design wins into substantial revenue, our business, financial condition and results of operations could be materially and adversely impacted.
If our distributors or sales representatives stop selling or fail to successfully promote our products, our business, financial condition and results of operations could be adversely impacted. We sell many of our products through sales representatives and distributors. Our non-exclusive distributors and sales representatives may carry our competitors’ products, which could adversely impact or limit sales of our products. Additionally, they could reduce or discontinue sales of our products or may not devote the resources necessary to adequately sell our products. Our agreements with our sell-through distributors contain limited provisions for return of products, including stock rotations whereby distributors may return a percentage of their purchases based upon a percentage of their most recent three months of shipments. In addition, in certain circumstances upon termination of the distributor relationship, sell-through distributors may return some or all of their prior purchases. The loss of business from any of our significant distributors or the delay of significant orders from any of them could materially and adversely harm our business, financial conditions and results of operations.
In addition, we depend on the continued viability and financial resources of these distributors and sales representatives, some of which are small organizations with limited working capital. In turn, these distributors and sales representatives are subject to general economic and semiconductor industry conditions. If some or all of our distributors and sales representatives experience financial difficulties, do not accurately forecast end market demand, do not properly manage inventory levels, or otherwise become unable or unwilling to promote and sell our products or deliver our products in a timely manner, our business, financial condition and results of operations could be adversely impacted.
We manufacture most of our semiconductors at our San Jose, California fabrication facilities. Our existing wafer fabrication facility, located in Northern California, may be subject to natural disasters such as earthquakes. A significant natural disaster, such as an earthquake or prolonged drought, could have a material adverse impact on our business, financial condition and operating results. Furthermore, manufacturing semiconductors requires manufacturing tools that are unique to each product being produced. If one of these unique manufacturing tools was damaged or destroyed, our ability to manufacture the related product would be impaired and our business would suffer until the tool was repaired or replaced. Additionally, the fabrication of ICs is a highly complex and precise process. Small impurities, contaminants in the manufacturing environment, difficulties in the fabrication process, defects in the masks used to print circuits on a wafer, manufacturing equipment failures and wafer breakage or other factors can cause a substantial percentage of wafers to be rejected or numerous die on each wafer to be nonfunctional. We maintain approximately two to three months of inventory that has completed the wafer fabrication manufacturing process. This inventory is generally located offshore at third party subcontractors but may not be sufficient to fully mitigate the adverse impact from a disruption to our San Jose wafer fabrication activity arising from a natural disaster such as an earthquake.
We may be subject to disruptions or failures in information technology systems and network infrastructures that could have a material adverse effect on our business and financial condition. We rely on the efficient and uninterrupted operation of complex information technology systems and network infrastructures to operate our business. A disruption, infiltration or failure of our information technology systems as a result of software or hardware malfunctions, system implementations or upgrades, computer viruses, third-party security breaches, employee error, theft or misuse, malfeasance, power disruptions, natural disasters or accidents could cause interruption to our operation or sales, breaches of data security, loss of intellectual property and critical data and the release and misappropriation of sensitive competitive information and partner, customer and employee personal data. Any of these events could cause us to lose revenue, harm our competitive position, result in a loss of customer confidence, cause us to incur significant costs to remedy any damages and ultimately materially adversely affect our business and financial condition.
18
While we have implemented a number of protective measures, including firewalls, antivirus, patches, data encryption, log monitors, routine back-ups with offsite retention of storage media, system audits, data partitioning, routine password modifications and disaster recovery procedures, such measures may not be adequate or implemented properly to prevent or fully address the adverse effect of such events. In addition, our third-party subcontractors, including our test and assembly houses and distributors, have access to certain portions of ours and our customers’ and partners’ sensitive data. In the event that these subcontractors do not properly safeguard such data, security breaches and loss of data could result. Any such loss of data by our third-party subcontractors could have a material adverse effect on our business and financial condition.
Our results of operations could vary as a result of the methods, estimations and judgments used in applying our accounting policies. The methods, estimates and judgments used by us in applying our accounting policies have a significant impact on our results of operations. Such methods, estimates and judgments are, by their nature, subject to substantial risks, uncertainties, assumptions and changes in rulemaking by the regulatory bodies, and factors may arise over time that lead us to change our methods, estimates, and judgments. Changes in those methods, estimates and judgments could significantly impact our results of operations.
Changes in tax laws could adversely affect our results of operations. We are subject to income taxes in the United States and in various foreign jurisdictions. Significant judgment is required in determining our worldwide tax liabilities. We believe that we comply with applicable tax law. However, if the governing tax authorities have a different interpretation of the applicable law or if there is a change in tax law, our financial condition and results of operations may be adversely affected.
The integration of previous and potential future acquisitions that we may pursue involves a number of risks. If we are unable to address and resolve these risks successfully, such integrations or acquisitions could disrupt our business. For example, in April, 2012, we acquired PhaseLink which has been integrated with our business, and in September 2013, we acquired specific net assets of Discera. In addition, we may in the future acquire other businesses, products or technologies to expand our product offerings and capabilities, customer base and business. Any of these transactions could be material to our financial condition and results of operations. The anticipated benefits of these acquisitions may never materialize. In addition, the process of integrating acquired businesses, products or technologies may create unforeseen operating difficulties and expenditures. Some of the areas where we may face acquisition-related risks include:
• | diversion of management time and potential business disruptions; |
• | expenses, distractions and potential claims resulting from acquisitions, whether or not they are completed; |
• | retaining and integrating employees from any businesses that we may acquire; |
• | issuance of dilutive equity securities or incurrence of debt; |
• | integrating various accounting, management, information, human resource and other systems to permit effective management; |
• | incurring possible write-offs, impairment charges, contingent liabilities, amortization expense or write-offs of goodwill; |
• | difficulties integrating and supporting acquired products or technologies; |
• | unexpected capital expenditure requirements; |
• | insufficient revenues to offset increased expenses associated with the acquisition; |
• | opportunity costs associated with committing capital to such acquisitions; and |
• | acquisition-related litigation. |
Foreign acquisitions involve risks in addition to those mentioned above, including those related to integration of operations across different cultures and languages, currency risks and the particular economic, political and regulatory risks associated with specific countries. We may not be able to address these risks successfully, or at all, without incurring significant costs, delays or other operating problems. Our inability to address successfully such risks could disrupt our business, which could have a material adverse effect on our financial condition and results of operations.
ITEM 1B. UNRESOLVED STAFF COMMENTS
None.
19
ITEM 2. PROPERTIES
The majority of our manufacturing operations are located in San Jose, California in a 57,000 square foot facility and an adjacent 63,000 square foot facility which we own. We fabricate the majority of our wafers at this location in a 28,000 square foot clean room facility, which provides all production processes. In addition to wafer fabrication, we also use this location as a testing facility for a relatively small portion of our products. Our main executive, administrative, and technical offices are located in another 57,000 square foot facility in San Jose, California which we own.
We also lease small sales and technical facilities located in Austin, TX; Richardson, TX; Ann Arbor, MI; Santa Cruz, CA; Hong Kong; Bundang, Korea; Taipei, Taiwan; HsinChu, Taiwan; Shenzhen, P.R. China; Shanghai, P.R. China; Singapore; Yokohama, Japan; Osaka, Japan; Swindon, U.K.; Frankfurt (Oder), Germany; and Villebon, France.
We believe that our existing facilities are adequate for our current manufacturing needs. We believe that if we should need additional space, such space would be available at commercially reasonable terms.
ITEM 3. LEGAL PROCEEDING
The information included in Note 12 of Notes to Consolidated Financial Statements under the caption “Litigation and Commitments and Contingencies” in Item 15 of Part IV is incorporated herein by reference.
ITEM 4. MINE SAFETY DISCLOSURES
Not applicable.
20
PART II
ITEM 5. MARKET FOR THE REGISTRANT’S COMMON EQUITY, RELATED SHAREHOLDER MATTERS AND ISSUER PURCHASES OF EQUITY SECURITIES
Our Common Stock is listed on the NASDAQ Global Select Market under the symbol “MCRL”. The following table sets forth the intraday high and low sales price per share of our common stock for the periods indicated.
Year Ended December 31, 2014 | High | Low | ||||||
Fourth quarter | $ | 14.75 | $ | 10.85 | ||||
Third quarter | $ | 12.80 | $ | 9.91 | ||||
Second quarter | $ | 11.62 | $ | 9.74 | ||||
First quarter | $ | 11.25 | $ | 9.50 | ||||
Year Ended December 31, 2013 | High | Low | ||||||
Fourth quarter | $ | 9.95 | $ | 8.60 | ||||
Third quarter | $ | 10.81 | $ | 8.92 | ||||
Second quarter | $ | 10.92 | $ | 9.32 | ||||
First quarter | $ | 10.71 | $ | 9.70 | ||||
The reported last sale price of our Common Stock on the NASDAQ Global Select Market on December 31, 2014 was $14.51 per share. The approximate number of holders of record of the shares of our Common Stock was 247 as of January 31, 2015. This number does not include shareholders whose shares are held in trust by other entities. The actual number of beneficial shareholders is greater than the number of holders of record.
We have authorized Common Stock, no par value, and Preferred Stock, no par value. We have not issued any Preferred Stock.
The information required by this item regarding securities authorized for issuance under equity compensation plans is included in Part III, Item 12 “Security Ownership of Certain Beneficial Owners and Management and Related Shareholder Matters” in this Report and is incorporated herein by reference.
Dividend Policy
During the year ended December 31, 2014, we paid a quarterly cash dividend in the amount of $0.05 per common share in each of the four quarters of 2014 for a total of $11.3 million.
During the year ended December 31, 2013, we paid a quarterly cash dividend in the amount of $0.0425 per common share in the second quarter and $0.05 per common share in the third and fourth quarters for a total of $8.2 million.
Although we have paid cash dividends on a quarterly basis for the past several years, we cannot assure that we will continue to do so on any particular schedule or that we will not reduce the amount of dividends that we pay in the future. Our future dividend policy is subject to the discretion of our Board of Directors and will depend upon a number of factors deemed relevant by the Board, including but not limited to the future consolidated earnings, financial condition, liquidity, capital requirements, applicable governmental regulations and policies and restrictive covenants in borrowing arrangements.
Stock Performance Graph
The following graph compares a $100 investment in our common stock over the five-year period from the end of 2009 through the end of 2014, with a similar investment in the NASDAQ Composite and the Philadelphia Semiconductor index. It shows the cumulative total returns over this five year period, assuming reinvestment of dividends.
21
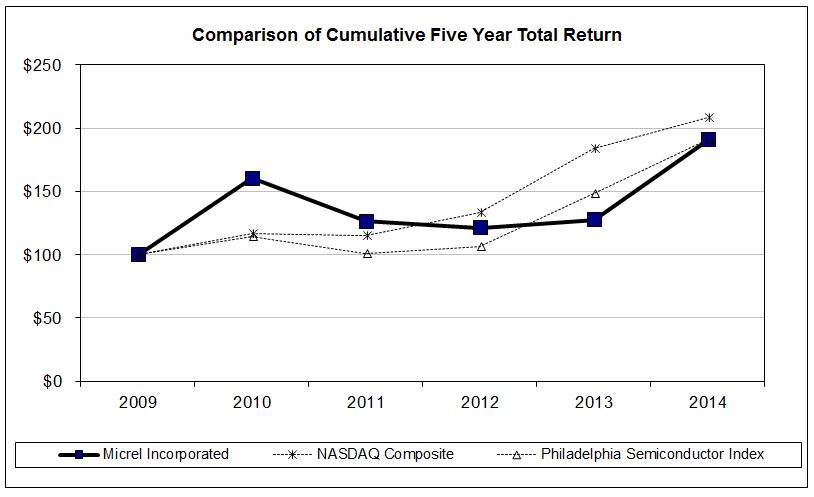
December 31, 2009 | December 31, 2010 | December 31, 2011 | December 30, 2012(1) | December 31, 2013 | December 31, 2014 | |||||||||||||
Micrel, Incorporated | 100.00 | 160.51 | 126.61 | 121.33 | 127.80 | 190.93 | ||||||||||||
NASDAQ Composite | 100.00 | 116.91 | 114.81 | 133.07 | 184.06 | 208.71 | ||||||||||||
Philadelphia Semiconductor Index | 100.00 | 114.42 | 101.26 | 106.71 | 148.66 | 190.84 | ||||||||||||
__________
(1) Stock performance calculation included an accelerated cash dividend of $0.0425 per share of common stock totaling $2.5 million paid on December 27, 2012 to shareholders of record as of December 18, 2012. The accelerated dividend was in lieu of the quarterly dividend that we would have otherwise announced with our quarterly financial results for the fourth quarter of 2012, and that would have been paid in the first quarter of 2013.
This performance graph shall not be deemed “soliciting material” or to be “filed” with the Securities and Exchange Commission for purposes of Section 18 of the Exchange Act or otherwise subject to the liabilities under that Section, and shall not be deemed to be incorporated by reference into any of our filings under the Securities Act or the Exchange Act.
Unregistered Sales of Equity Securities
We did not sell any unregistered securities during the period covered by this Annual Report on Form 10-K.
Issuer Purchases of Equity Securities
On July 26, 2012, our Board of Directors authorized the repurchase of $30.0 million of our common stock, which increased the total approval for repurchase since February 2010 to $90.0 million. On October 24, 2013, we announced that our Board of Directors authorized the repurchase of another $30.0 million of our common stock, which increased the total approval for repurchase since February 2010 to $120.0 million. On August 20, 2014, we announced that our Board of Directors authorized the repurchase of an additional $25.0 million of our common stock, which increased the total approval for repurchase since February 2010 to $145.0 million. After taking into account repurchases already completed, the total available for repurchase at December 31, 2014 was $30.7 million.
22
The authorization will stay in effect until the authorized aggregate amount is expended or the authorization is modified by our Board of Directors. The timing and amount of any repurchase of shares is determined by our management, based on our evaluation of market conditions, cash on hand and other factors. Repurchases of our common stock during the fourth quarter of fiscal year 2014 were as follows:
Period | Total Number of Shares Purchased | Average Price Paid per Share | Total Number of Shares Purchased as Part of a Publicly Announced Program | Maximum Dollar Value of Shares that May Yet be Purchased Under the Program (in thousands) | |||||||||
October 2014 | 288,100 | $ | 11.63 | 288,100 | $ | 34,030 | |||||||
November 2014 | 135,800 | 12.48 | 135,800 | 32,335 | |||||||||
December 2014 | 121,425 | 13.83 | 121,425 | 30,656 | |||||||||
Total Q4 2014 | 545,325 | 545,325 | |||||||||||
23
ITEM 6. SELECTED FINANCIAL DATA
The selected consolidated financial data below is not necessarily indicative of future operations and should be read in conjunction with “Management’s Discussion and Analysis of Financial Condition and Results of Operations” and our Consolidated Financial Statements and related notes thereto included elsewhere in this report. The selected consolidated income statement data for the years ended December 31, 2014, 2013 and 2012 and the selected consolidated balance sheet data at December 31, 2014 and 2013 are derived from our audited consolidated financial statements included elsewhere in this report. The selected consolidated income statement data for the years ended December 31, 2011 and 2010 and the selected consolidated balance sheet data at December 31, 2012, 2011 and 2010 are derived from the audited consolidated financial statements not included in this report.
Income Statement Data (1): | |||||||||||||||||||
(in thousands, except per share amounts) | 2014 | 2013 | 2012 | 2011 | 2010 | ||||||||||||||
Net revenues | $ | 247,594 | $ | 237,080 | $ | 250,112 | $ | 259,025 | $ | 297,366 | |||||||||
Cost of revenues* | 119,566 | 115,034 | 117,185 | 115,881 | 128,535 | ||||||||||||||
Gross profit | 128,028 | 122,046 | 132,927 | 143,144 | 168,831 | ||||||||||||||
Operating expenses: | |||||||||||||||||||
Research and development* | 62,033 | 55,853 | 57,182 | 49,952 | 46,271 | ||||||||||||||
Selling, general and administrative* | 48,351 | 45,803 | 48,010 | 46,415 | 47,590 | ||||||||||||||
Restructuring charges | 992 | 1,376 | — | — | — | ||||||||||||||
Total operating expenses | 111,376 | 103,032 | 105,192 | 96,367 | 93,861 | ||||||||||||||
Income from operations | 16,652 | 19,014 | 27,735 | 46,777 | 74,970 | ||||||||||||||
Interest and other income, net | 62 | 218 | 559 | 825 | 492 | ||||||||||||||
Income before income taxes and noncontrolling interest | 16,714 | 19,232 | 28,294 | 47,602 | 75,462 | ||||||||||||||
Provision for income taxes | 3,167 | 1,584 | 15,966 | 13,742 | 24,927 | ||||||||||||||
Net income | 13,547 | 17,648 | 12,328 | 33,860 | 50,535 | ||||||||||||||
Less: Net income attributable to noncontrolling interest | — | — | (10 | ) | — | — | |||||||||||||
Net income attributable to Micrel, Incorporated shareholders | $ | 13,547 | $ | 17,648 | $ | 12,318 | $ | 33,860 | $ | 50,535 | |||||||||
Net income per share attributable to Micrel, Incorporated shareholders: | |||||||||||||||||||
Basic | $ | 0.24 | $ | 0.31 | $ | 0.21 | $ | 0.55 | $ | 0.81 | |||||||||
Diluted | $ | 0.24 | $ | 0.30 | $ | 0.20 | $ | 0.54 | $ | 0.81 | |||||||||
Shares used in computing per share amounts: | |||||||||||||||||||
Basic | 56,508 | 57,803 | 59,623 | 61,609 | 62,030 | ||||||||||||||
Diluted | 57,538 | 58,506 | 60,288 | 62,371 | 62,557 | ||||||||||||||
Cash dividends per common share (1) | $ | 0.20 | $ | 0.1425 | $ | 0.205 | $ | 0.15 | $ | 0.14 | |||||||||
*Share based compensation included in: | |||||||||||||||||||
Cost of revenues | $ | 997 | $ | 1,060 | $ | 1,178 | $ | 1,009 | $ | 798 | |||||||||
Research and development | 3,197 | 2,875 | 3,132 | 2,401 | 1,808 | ||||||||||||||
Selling, general and administrative | 3,430 | 3,162 | 3,282 | 2,444 | 2,119 | ||||||||||||||
Total share-based compensation | $ | 7,624 | $ | 7,097 | $ | 7,592 | $ | 5,854 | $ | 4,725 | |||||||||
24
Balance Sheet Data: | December 31, | ||||||||||||||||||
(in thousands) | 2014 | 2013 | 2012 | 2011 | 2010 | ||||||||||||||
Working capital | $ | 137,723 | $ | 137,818 | $ | 143,579 | $ | 175,372 | $ | 141,456 | |||||||||
Total assets (2) | 277,180 | 276,124 | 281,454 | 308,018 | 300,694 | ||||||||||||||
Long-term debt and other obligations | 4,480 | 4,749 | 3,813 | 6,404 | 5,660 | ||||||||||||||
Total shareholders’ equity | 219,508 | 217,973 | 221,104 | 244,518 | 221,886 | ||||||||||||||
_________
(1) Cash dividends per common share for 2012 included an accelerated cash dividend of $0.0425 per share of common stock totaling $2.5 million paid on December 27, 2012 to shareholders of record as of December 18, 2012. The accelerated dividend was in lieu of the quarterly dividend that we would have otherwise announced with its quarterly financial results for the fourth quarter of 2012, and that would have been paid in the first quarter of 2013.
(2) Total assets included goodwill and intangible assets from the Discera acquisition completed in 2013 of $5.3 million and from the Phaselink acquisition completed in 2012 of $14.8 million.
ITEM 7. MANAGEMENT’S DISCUSSION AND ANALYSIS OF FINANCIAL CONDITION AND RESULTS OF OPERATIONS
The following discussion should be read in conjunction with our consolidated financial statements and related notes included elsewhere in this report.
Overview
We design, develop, manufacture and market a range of high-performance analog power ICs, mixed-signal and digital ICs. These products address a wide range of end markets including mobility, enterprise and cloud infrastructure, enterprise and home networking, wide area and metropolitan area networks, automotive, and industrial equipment. We also manufacture custom analog and mixed-signal circuits and provide wafer foundry services for customers who produce electronic systems for communications, consumer and military applications.
On January 20, 2015, we announced that our Board of Directors had formed a Transaction Committee comprised of three independent directors to undertake a comprehensive review of strategic alternatives to enhance value for shareholders. We have engaged a financial advisor and outside counsel in connection with the process. There can be no assurance that our review of strategic alternatives will result in any transaction.
To enhance the readers’ understanding of our performance, the following reverse chronological overview of our results for the years ended December 31, 2013 through 2014 have been provided.
For the year ended December 31, 2014, net revenues increased 4.4% to $247.6 million from $237.1 million for the year ended December 31, 2013. During the third quarter of 2014, we amended the terms of our agreements with certain sell-through distributors. These amendments included the removal of significant return rights, price protection and pricing adjustments subsequent to the initial product shipment. Therefore, upon amendment of the agreements, these distributors were changed from sell-through distributors to sell-in distributors and we recognized the revenue for sales to these distributors upon the initial product shipments to these distributors, net of estimated allowance for returns established based upon historical return rates. In addition, revenue was recognized for unsold inventory held by these distributors on the date of change. The effect of changing these sell-through distributors to sell-in distributors resulted in a one-time increase in revenue of approximately $5.1 million and related cost of goods sold of $1.6 million related to unsold inventory held by these distributors at June 30, 2014. The remainder of the increase in revenue resulted primarily from increased demand for our products serving the wireline communications and enterprise/cloud infrastructure end markets, which was partially offset by the decreased demand for our products serving the mobility end market. The book-to-bill ratio was approximately one for the full year of 2014.
Gross margin for the year ended December 31, 2014 increased to 51.7% from 51.5% for the year ended December 31, 2013. Operating margin for the year ended December 31, 2014 decreased to 6.7% from 8.0% for the year ended December 31, 2013 primarily due to lower sales and restructuring charges of $1.0 million recorded in the second half of 2014. Income tax provision was $3.2 million for the year ended December 31, 2014, compared to $1.6 million for the year ended December 31, 2013 primarily due to lower federal R&D credit benefit in the year ended December 31, 2014 compared to the year ended December 31, 2013.
25
Net income was $13.5 million, or $0.24 per diluted share, for the year ended December 31, 2014, compared to $17.6 million, or $0.30 per diluted shares, for the year ended December 31, 2013. Cash, cash equivalents and short-term investments decreased by $2.0 million to $86.6 million at December 31, 2014 from $88.6 million at December 31, 2013.
For the year ended December 31, 2013, net revenues decreased 5.2% to $237.1 million from $250.1 million for the year ended December 31, 2012. The decrease was primarily due to lower demand from the wireline communications and enterprise/cloud infrastructure end markets and lower average selling prices for the mobility market, which were partially offset by revenues from the acquisitions of Phaselink and Discera and higher demand from the industrial and automotive markets. The book-to-bill ratio was approximately one for the full year of 2013. Gross margin for the year ended December 31, 2013 decreased to 51.5% from 53.1% for the year ended December 31, 2012. The decrease was primarily due to lower factory utilization, higher inventory write-downs and a shift in product mix to lower gross margin mobile handset products, compared to the year ended December 31, 2012. Operating margin for the year ended December 31, 2013 decreased to 8.0% from 11.1% for the year ended December 31, 2012 primarily due to lower sales and lower gross margin. Income tax provision was $1.6 million for the year ended December 31, 2013, compared to $16.0 million for the year ended December 31, 2012 primarily due to benefit from research and development credits in the year ended December 31, 2013 and recording a valuation allowance on state deferred tax assets in the year ended December 31, 2012. Net income was $17.6 million, or $0.30 per diluted share, for the year ended December 31, 2013, compared to $12.3 million, or $0.20 per diluted shares, for the year ended December 31, 2012. Cash, cash equivalents and short-term investments decreased by $15.0 million to $88.6 million at December 31, 2013 from $103.6 million at December 31, 2012 primarily due to repurchases of our common stock totaling $23.3 million and dividends paid to shareholders of $8.2 million. Additionally, during the year ended December 31, 2013, we paid a total of $6.1 million for the acquisition of Discera.
For the year ended December 31, 2014, we recorded restructuring charges of $1.0 million related to workforce reductions as we continued our efforts to reduce operating expenses. We paid $1.5 million related to severance costs in the year ended December 31, 2014 and expect to pay the remaining accrued balance in 2015.
Critical Accounting Policies and Estimates
The consolidated financial statements included in this Form 10-K and discussed within this Management’s Discussion and Analysis of Financial Condition and Results of Operations have been prepared in accordance with accounting principles generally accepted in the United States of America. Preparation of these financial statements requires management to make estimates and assumptions that affect the reported amounts of assets and liabilities at the date of the financial statements and the reported amounts of revenues and expenses during the reporting period. On an on-going basis, management evaluates its estimates and judgments. Management bases its estimates and judgments on historical experience and on various other assumptions that are believed to be reasonable under the circumstances, the results of which form the basis for making judgments about the carrying values of assets and liabilities that are not readily apparent from other sources. Actual results may differ from these estimates under different assumptions or conditions. For a detailed discussion of our significant accounting policies, see Note 1 of Notes to Consolidated Financial Statements. We consider certain accounting policies related to revenue recognition and receivables, inventory valuation, share-based compensation, income taxes, goodwill, impairment of long-lived assets, litigation and restructuring charges to be critical to the fair presentation of our financial statements.
Revenue Recognition and Receivables
We generate revenue by selling products to OEMs, sell-through distributors and sell-in distributors. Our policy is to recognize revenue from sales to customers when the rights and risks of ownership have passed to the customer, when persuasive evidence of an arrangement exists, the product has been delivered, the price is fixed or determinable and collection of the resulting receivable is reasonably assured.
We provide certain sell-through distributors price protection rights and pricing adjustments subsequent to the initial product shipment to allow them to price our products competitively for specific resale opportunities. As these price adjustments have historically been significant, and price adjustments are difficult to reliably estimate, we defer recognition of revenue and related cost of revenues (in the balance sheet line item “deferred income on shipments to distributors”) derived from sales to these distributors until they have resold our products to their customers. Although revenue and related cost of revenues are not recognized, we record an accounts receivable and relieve inventory at the time of initial product shipment. Our standard terms are EXW or FCA shipping point, payment terms are enforced from shipment date and legal title and risk of inventory loss passes to the sell-through distributor upon shipment. In addition, we estimate and record an adjustment for sell-through distributor price adjustments for which the specific resale transaction has been completed, but the price adjustment claim has not yet been received by us.
26
Sales to OEM customers and sell-in distributors are recognized based upon the shipment terms of the sale transaction when all other revenue recognition criteria have been met. We do not grant return rights, price protection or pricing adjustments to OEM customers. We offer limited contractual stock rotation rights to sell-in distributors. At the time of shipment to sell-in distributors, an allowance for returns is established based upon historical return rates, and an allowance for price adjustments is established based on an estimate of price adjustments to be granted. Actual future returns and price adjustments could be different than the allowance established.
Our accounts receivable balances represent trade accounts receivable which have been recorded at invoiced amount and do not bear interest. We maintain an allowance for doubtful accounts for estimated uncollectible accounts receivable. This estimate is based on an analysis of specific customer creditworthiness and historical bad debt experience. At December 31, 2014 and 2013, the allowance for doubtful accounts was approximately $1.1 million and $0.8 million, respectively.
Inventory Valuation
Inventories are stated at the lower of cost (first-in, first-out method) or market. We record adjustments to write down the cost of obsolete and excess inventory to the estimated market value based on historical and forecasted demand for our products. If actual future demand for our products is less than currently forecasted, additional inventory adjustments may be required. Once an inventory write-down provision is established, it is maintained until the product to which it relates is sold or otherwise disposed of.
Share-Based Compensation
Share-based compensation is measured at the grant date based on the fair value of the award and is recognized as expense in the statements of operations. To determine fair value for stock options, we use the Black-Scholes valuation model which requires input factors such as expected term, stock price volatility, dividend yield and risk free interest rate. In addition, we estimate expected forfeiture rates of stock grants and share-based compensation expense is only recognized for those shares expected to vest. Determining the input factors, such as expected term, expected volatility and estimated forfeiture rates, requires significant judgment based on subjective future expectations.
Income Taxes
Deferred tax assets and liabilities result primarily from temporary timing differences between book and tax valuation of assets and liabilities, and state research and development credit carryforwards. We must regularly assess the likelihood that future taxable income levels will be sufficient to ultimately realize the tax benefits of these deferred tax assets. Due to California tax law changes in 2012 which require mandatory single sales factor apportionment in California for most multi-state taxpayers for tax years beginning on or after January 1, 2013, it became more likely than not that the benefits of all of our California deferred tax assets would not be realized. Accordingly, a valuation allowance has been established on the California deferred tax assets at December 31, 2014. We believe that future taxable income levels will be sufficient to realize the tax benefits on the remaining deferred tax assets and have not established a valuation allowance on those assets. Should we determine that future realization of these tax benefits is not more likely than not, a valuation allowance would be established, which would increase our tax provision in the period of such determination.
We use a two-step approach to recognize and measure uncertain tax positions. The first step is to evaluate the tax position for recognition by determining if the weight of available evidence indicates it is more likely than not that the position will be sustained on audit, including resolution of related appeals or litigation processes, if any. The second step is to measure the tax benefit as the largest amount which is more than 50% likely of being realized upon ultimate settlement. We consider many factors when evaluating and estimating our tax positions and tax benefits, which may require periodic adjustments and which may not accurately anticipate actual outcomes.
Goodwill
Goodwill represents the excess of the purchase price over the fair value of net tangible and identifiable intangible assets acquired. Goodwill is measured and tested for impairment annually at the reporting unit level during the last quarter of our fiscal year, or more frequently if we believe indicators of impairment exist. Events that could trigger a more frequent impairment review may include adverse industry or economic trends, restructuring actions, lower projections of profitability, or a sustained decline in our market capitalization. We have allocated our goodwill to our timing and communications reporting unit.
27
Qualitative factors are assessed to determine whether it is more likely than not that the fair value of the reporting unit is less than its carrying amount. If the qualitative assessment indicates that the carrying amount of the reporting unit is more likely than not higher than the fair value, goodwill is tested for impairment based on a two-step test. The first step requires comparing the fair value of our reporting unit to its net book value, including goodwill. Determining the fair value of a reporting unit is judgmental in nature and involves the use of significant estimates and assumptions. These estimates and assumptions include projected revenues and forecasted operating margins used to calculate projected future cash flows, risk-adjusted discount rates, future economic and market conditions and determination of appropriate market comparables. We base our fair value estimates on assumptions we believe to be reasonable. Actual future results may differ from those estimates. Future competitive, market and economic conditions could negatively impact key assumptions including our market capitalization or the carrying value of our net assets which could require us to realize an impairment of our goodwill.
A potential impairment exists if the fair value of the reporting unit is less than its net book value. The second step of the process is only performed if a potential impairment exists, and it involves determining the difference between the fair value of the reporting unit’s net assets other than goodwill to the fair value of the reporting unit and if the difference is less than the net book value of goodwill, an impairment exists and is recorded. No goodwill impairment was recognized in 2014, 2013 and 2012.
Impairment of Long-Lived Assets
We review purchased intangible assets with finite lives for impairment whenever events or changes in circumstances indicate the carrying value of an asset may not be recoverable. Recoverability of these intangible assets is assessed based on the estimated undiscounted future cash flows expected to result from the use of the asset. If the undiscounted future cash flows are less than the carrying amount, the purchased intangible assets with finite lives are considered to be impaired. The amount of the impairment is measured as the difference between the carrying amount of these assets and the fair value.
Our business combinations have included the purchase of in-process research and development assets that are not amortizable until the underlying project is complete. We assess that our in-process research and development project is complete when all material research and development costs have been incurred and no significant risks remain. We review the carrying value of indefinite-lived intangible assets for impairment at least annually during the last quarter of our fiscal year, or more frequently if we believe indicators of impairment exist.
In 2012, we recorded an impairment of $1.0 million as a component of research and development expense for a developed technology which was replaced by more advanced technologies. In 2014 and 2013, no indicators of impairment were noted.
Litigation
An estimated liability is accrued for legal matters and other contingencies when it is determined to be probable that a liability has been incurred and the amount of loss can be reasonably estimated. The liability accrual is charged to income in the period such determination is made. We regularly evaluate current information available to determine whether such accruals should be made. Legal fees are expensed as incurred.
Restructuring Charges
Our restructuring accruals include primarily payments to employees for severance and costs to exit leased facilities. Accruals are recorded when management has approved a plan to restructure operations and a liability is probable and estimable. The restructuring accruals are based upon management estimates at the time they are recorded. These estimates can change depending upon changes in facts and circumstances subsequent to the date the original liability was recorded.
28
Results of Operations
The following table sets forth certain operating data as a percentage of total net revenues for the periods indicated.
Years Ended December 31, | ||||||||
2014 | 2013 | 2012 | ||||||
Net revenues | 100.0 | % | 100.0 | % | 100.0 | % | ||
Cost of revenues | 48.3 | 48.5 | 46.9 | |||||
Gross profit | 51.7 | 51.5 | 53.1 | |||||
Operating expenses: | ||||||||
Research and development | 25.1 | 23.6 | 22.8 | |||||
Selling, general and administrative | 19.5 | 19.3 | 19.2 | |||||
Restructuring charges | 0.4 | 0.6 | — | |||||
Total operating expenses | 45.0 | 43.5 | 42.0 | |||||
Income from operations | 6.7 | 8.0 | 11.1 | |||||
Interest and other income, net | 0.1 | 0.1 | 0.2 | |||||
Income before income taxes and noncontrolling interest | 6.8 | 8.1 | 11.3 | |||||
Provision for income taxes | 1.3 | 0.7 | 6.4 | |||||
Net income | 5.5 | 7.4 | 4.9 | |||||
Less: Net income attributable to noncontrolling interest | — | — | — | |||||
Net income attributable to Micrel, Incorporated shareholders | 5.5 | % | 7.4 | % | 4.9 | % | ||
Net Revenues. Net revenues increased 4.4% to $247.6 million for the year ended December 31, 2014 compared to $237.1 million in 2013. During the third quarter of 2014, we amended the terms of our agreements with certain sell-through distributors. These amendments included the removal of significant return rights, price protection and pricing adjustments subsequent to the initial product shipment. Therefore, upon amendment of the agreements, these distributors were changed from sell-through distributors to sell-in distributors and we recognized the revenue for sales to these distributors upon the initial product shipments to these distributors, net of estimated allowance for returns established based upon historical return rates. In addition, revenue was recognized for unsold inventory held by these distributors on the date of change. The effect of changing these sell-through distributors to sell-in distributors resulted in a one-time increase in revenue of approximately $5.1 million and related cost of goods sold of $1.6 million related to unsold inventory held by these distributors at June 30, 2014. The remainder of the increase resulted primarily from increased demand for our products serving the wireline communications and enterprise/cloud infrastructure end markets, which was partially offset by the decreased demand for our products serving the mobility end market.
Net revenues decreased 5.2% to $237.1 million for the year ended December 31, 2013 compared to $250.1 million in 2012. The decrease was primarily due to lower demand from the wireline communications and enterprise/cloud infrastructure end markets and lower average selling prices from the mobility end market partially offset by revenues from the acquisitions of PhaseLink and Discera and higher demand from the industrial and automotive end markets.
Customer demand for semiconductors can change quickly and unexpectedly. Historically, our revenue levels have been highly dependent on the amount of new orders for products to be delivered to the customer within the same quarter. Within the semiconductor industry, orders that are booked and shipped within the same quarter are called “turns fill” orders. When the turns fill level exceeds approximately 35% of quarterly revenues, it can be very difficult to predict near term revenues and income. The resulting lack of visibility into demand also makes it difficult to match product build with future demand as our lead times to build our products may be substantially longer than order lead times.
As noted in Item 1A “Risk Factors,” a trend has developed over the last several years whereby customers in the semiconductor supply chain have worked to minimize the amount of inventory of semiconductors they hold. As a consequence, customers are generally providing less order backlog to us and other semiconductor suppliers, and relying on short lead times to buffer their build schedules. Shorter lead times reduce visibility into end demand and increase the reliance on turns fill orders. The reluctance of customers to provide order backlog together with short lead times and the uncertain growth rate of the world economy, make it difficult to precisely predict future levels of sales and, therefore, profitability.
29
International sales represented 77%, 74%, and 73% of net revenues for the years ended December 31, 2014, 2013 and 2012, respectively. Sales to customers in Asia represented 64% of net revenues for the year ended December 31, 2014, compared to 61% for the year ended December 31, 2013 and 61% for the year ended December 31, 2012. The trend for our customers to move their electronics manufacturing to Asian countries has resulted in increased pricing pressure for us and other semiconductor manufacturers and we expect that it will to continued price pressure for our products in the future.
Gross Profit and Gross Margin. Gross profit is affected by a variety of factors including the volume of product sales, product mix, manufacturing capacity utilization, inventory write-downs, product yields and average selling prices. Our gross margin increased to 52% for the year ended December 31, 2014 from 51% for 2013. Our gross margin continues to be negatively impacted by average selling price erosion, product mix, and capacity utilization. Our gross margin was 51% for the year ended December 31, 2014 without the one-time revenue of $5.1 million and related cost of goods sold of $1.6 million in connection with the changes from sell-through distributors to sell-in distributors as described above. For the year ended December 31, 2013, our gross margin decreased to 51% from 53% for 2012. This decrease was primarily due to lower factory utilization, higher inventory reserves, and a shift in product mix to lower gross margin mobility products.
Research and Development Expenses. Research and development (“R&D”) expenses as a percentage of net revenues was 25% for the year ended December 31, 2014, compared to 24% for the year ended December 31, 2013. R&D expenses increased $6.1 million or 11.1% to $62.0 million for the year ended December 31, 2014, compared to $55.9 million for 2013. The increase was primarily due to increased headcount from our acquisition of Discera completed in September 2013 and higher spending on R&D prototypes of $0.9 million, outside services of $0.5 million, share-based compensation of $0.3 million, travel of $0.3 million and mask sets of $0.2 million.
For the year ended December 31, 2013, R&D expenses decreased $1.3 million or 2.3% to $55.9 million compared to $57.2 million for 2012. The decrease was primarily due to reduced spending on mask sets of $0.6 million and lowered share-based compensation of $0.3 million, partially offset by increased headcount from our acquisitions of Phaselink and Discera.
We believe that the development and introduction of new products is critical to our future success and expect to continue our significant investment in R&D activities in the future.
Selling, General and Administrative Expenses. Selling, General and Administrative (“SG&A”) expenses as a percentage of net revenues represented 20% for the year ended December 31, 2014, compared to 19% for 2013. SG&A expenses increased $2.6 million, or 5.6%, to $48.4 million from $45.8 million for 2013. The increase was primarily due to higher spending on outside services of $0.6 million, travel expenses of $0.3 million and share-based compensation of $0.3 million.
For the year ended December 31, 2013, SG&A expenses decreased $2.2 million, or 4.6%, to $45.8 million for the year ended December 31, 2013 from $48.0 million for 2012. The decrease was primarily due to spending reductions on product and corporate marketing activities of $1.1 million, personnel of $0.9 million and travel of $0.6 million.
Share-Based Compensation. Our results of operations for the years ended December 31, 2014, 2013 and 2012 were impacted by the recognition of non-cash expense related to the fair value of share-based compensation awards. For the year ended December 31, 2014, we recorded $7.6 million in pre-tax share-based compensation expense, of which $1.0 million was included in cost of revenues, $3.2 million was included in R&D expense and $3.4 million was included in SG&A expense. For the year ended December 31, 2013, we recorded $7.1 million in pre-tax share-based compensation expense, of which $1.1 million was included in cost of revenues, $2.9 million was included in R&D expense and $3.2 million was included in SG&A expense. For the year ended December 31, 2012, we recorded $7.6 million in pre-tax share-based compensation expense, of which $1.2 million was included in cost of revenues, $3.1 million was included in R&D expense and $3.3 million was included in SG&A expense.
Restructuring Charges. In 2014, we continued our efforts to reduce operating expenses. In the second half of 2014, we recorded restructuring charges of $1.0 million related to workforce reductions. We paid 1.5 million related to severance costs for the year ended December 31, 2014 and expect to pay the remaining accrued balance in 2015.
Interest and Other Income, net. Interest and other income, net were $0.1 million, $0.2 million and $0.6 million for the years ended December 31, 2014, 2013 and 2012, respectively. They reflect interest income from short-term and long-term investments and money market funds.
30
Provision for Income Taxes. For the year ended December 31, 2014, the provision for income taxes was $3.2 million, or 19% of income before taxes, compared to $1.6 million, or 8% of income before taxes, for the year ended December 31, 2013 and $16.0 million, or 56% of income before taxes, for the year ended December 31, 2012. The provision increased in the year ended December 31, 2014 primarily due to lower federal R&D credit benefit, compared to the year ended December 31, 2013 as the provision for the year ended December 31, 2013 included R&D credit benefit of $4.3 million, of which $1.0 million was related to 2010 to 2012 based on additional credit information developed in 2013 and $1.4 million was related to the retroactive reinstatement of federal research and development credits for 2012 as a result of American Taxpayer Relief Act of 2012 which was signed into law on January 2, 2013. The tax provision for the year ended December 31, 2012 excluded the benefit from the federal R&D credit which expired on December 31, 2011.
The income tax provision for these interim periods differs from taxes computed at the federal statutory rate primarily due to the tax effects of share-based compensation, federal and state research and development credits, federal qualified production activity deductions and previously unrecognized tax benefits.
Liquidity and Capital Resources
Since inception, our principal sources of funding have been our cash from operations, bank borrowings and sale of our common stock. Principal sources of liquidity at December 31, 2014 consisted of cash, cash equivalents and short-term investments of $86.6 million and a $5.0 million unsecured credit facility from a commercial bank.
Operating Activities
We generated $23.1 million in cash flows from operating activities for the year ended December 31, 2014. Significant cash flows from operating activities included cash provided by net income of $13.5 million plus additions for non-cash activities of $17.1 million (consisted primarily of $13.6 million in depreciation and amortization and $7.6 million in share-based compensation expense, partially offset by a $2.1 million increase in deferred income taxes), combined with a $1.8 million increase in accounts payable which were offset in part by a $4.1 million decrease in deferred income on shipments to distributors, $2.9 million increase in prepaid taxes and a $1.1 million increase in accounts receivable.
We generated $26.9 million in cash flows from operating activities for the year ended December 31, 2013. Significant cash flows from operating activities included cash provided by net income of $17.6 million plus additions for non-cash activities of $16.0 million (consisted primarily of $13.1 million in depreciation and amortization and $7.1 million in share-based compensation expense, partially offset by $3.7 million increase in deferred income taxes), combined with a $2.9 million increase in accrued liabilities and other long-term liabilities and $1.3 million increase in deferred income on shipments to distributors, which were offset in part by a $8.8 million decrease in accounts payable.
We generated $32.7 million in cash flows from operating activities for the year ended December 31, 2012. Cash flows from operating activities were primarily attributable to net income of $12.3 million plus non-cash activities of $30.5 million (consisted primarily of $12.5 million in depreciation and amortization, $9.7 million in deferred income taxes, $7.6 million in share-based compensation and $1.0 million in impairment of technology) combined with a $3.9 million increase in accounts payable and a $2.6 million decrease in prepaid taxes, which were offset in part by a $4.9 million decrease in deferred income on shipments to distributors, a $4.7 million increase in inventories, a $3.5 million decrease in income tax payable, a $1.5 million increase in prepaid expenses and other assets, a $1.1 million increase in accounts receivable and a $1.0 million decrease in accrued liabilities and other long-term liabilities.
Investing Activities
We used $8.2 million of cash for investing activities during the year ended December 31, 2014, primarily comprised of $55.2 million for the purchase of short-term investments and $11.7 million for purchases of property, plant and equipment, which were offset in part by $57.7 million in proceeds from the sales and maturities of short-term and long-term investments.
We used $2.8 million of cash for investing activities during the year ended December 31, 2013, primarily comprised of $59.7 million for the purchase of short-term investments, $6.1 million related to the acquisition of Discera and $7.3 million for purchases of property, plant and equipment, which were offset in part by $71.5 million in proceeds from the sales and maturities of short-term investments.
31
We used $22.4 million of cash for investing activities during the year ended December 31, 2012, primarily comprised of $55.8 million for the purchase of short-term investments, $17.4 million related to the acquisition of PhaseLink, and $9.0 million for purchases of property, plant and equipment, which were offset in part by $60.1 million in proceeds from the sale of short-term and long-term investments.
Financing Activities
We used $17.6 million of cash for financing activities during the year ended December 31, 2014, primarily for the repurchases of $20.0 million of our common stock and $11.3 million for the payment of cash dividends, which were partially offset by $13.1 million in proceeds from employee stock transactions.
We used $27.5 million of cash for financing activities during the year ended December 31, 2013, primarily for the repurchases of $23.3 million of our common stock and $8.2 million for the payment of cash dividends, which were partially offset by $4.4 million in proceeds from employee stock transactions.
We used $43.6 million of cash for financing activities during the year ended December 31, 2012, primarily for the repurchases of $34.6 million of our common stock and $12.1 million for the payment of cash dividends, which were partially offset by $3.6 million in proceeds from employee stock transactions.
We currently expect to spend approximately $4.0 million to $8.0 million to purchase capital equipment and make facility improvements during 2015 primarily for manufacturing equipment and additional research and development related software and equipment.
On January 29, 2015, our Board of Directors declared a cash dividend of $0.05 per outstanding share of common stock payable on February 25, 2015 to shareholders of record at the close of business on February 11, 2015. This dividend will be recorded in the first quarter of 2015 and is expected to aggregate approximately $2.8 million.
Under our stock repurchase program, at December 31, 2014, we have remaining authorization to repurchase $30.7 million of our common stock.
We believe our cash from operations, existing cash balances, short-term investments, and our credit facility will be sufficient to meet our cash requirements for at least the next 12 months. In the longer term, we believe future cash requirements will continue to be met by our cash flow from operations, credit arrangements and future debt or equity financings as required.
For the year ended December 31, 2014, we sold $3.2 million of auction-rate notes at par value. At December 31, 2014, we held remaining $1.5 million in principal of senior auction-rate notes secured by student loans. Auctions for these remaining auction-rate notes have failed at December 31, 2014. The fair value of these notes, $1.4 million, has been classified as long-term investments at December 31, 2014. The funds associated with failed auctions will not be accessible until a successful auction occurs, a buyer is found outside of the auction process, the issuers redeem the securities or the underlying securities have matured. For additional information regarding our investments, see Note 4 of Notes to Consolidated Financial Statements.
At December 31, 2014, we had cash, cash equivalents and short-term investments of $86.6 million, of which $12.0 million was held by our foreign subsidiaries. Some of these available cash, cash equivalents and short-term investments are held in accounts managed by third-party financial institutions and consist of invested cash and cash in our operating accounts. The invested cash is invested in interest bearing funds managed by third-party financial institutions. To date, we have not experienced loss or lack of access to our invested cash or cash equivalents; however, we can provide no assurances that access to our invested cash and cash equivalents will not be impacted by adverse conditions in the financial markets.
Recently Issued Accounting Standards
Please refer to Note 2 of Notes to Consolidated Financial Statements.
32
Contractual Obligations and Commitments
At December 31, 2014, we had the following contractual obligations and commitments (in thousands):
Payments Due By Period | ||||||||||||||||||||
Total | Less than 1 Year | 1-3 Years | 4-5 Years | After 5 Years | ||||||||||||||||
Operating leases | $ | 2,047 | $ | 960 | $ | 947 | $ | 140 | $ | — | ||||||||||
Software licenses purchase obligations | 1,540 | 937 | 448 | 155 | — | |||||||||||||||
Open purchase orders | 19,440 | 19,440 | — | — | — | |||||||||||||||
Total | $ | 23,027 | $ | 21,337 | $ | 1,395 | $ | 295 | $ | — | ||||||||||
Open purchase orders are defined as agreements to purchase goods or services that are enforceable and legally binding and that specify all significant terms, including: fixed or minimum quantities to be purchased; fixed, minimum or variable pricing provisions; and the approximate timing of the transactions.
Borrowing agreements consisted of a $5.0 million unsecured credit facility for general working capital needs, which includes a $5.0 million letter of credit sub-facility including a $2.0 million foreign exchange sub-facility. At December 31, 2014, we had no borrowings under the credit facility. Our borrowing arrangements include a provision for the issuance of commercial or standby letters of credit by the bank on our behalf, which are issued to guarantee payments for our workers compensation program. At December 31, 2014, there was $0.3 million in letters of credit outstanding.
At December 31, 2014, we had $6.0 million of net unrecognized tax benefits consisting of $3.5 million included in long-term income taxes payable and $2.5 million recorded as a reduction to deferred tax assets. We do not anticipate a significant change to the $3.5 million long-term uncertain income tax positions during 2015. Due to the high degree of uncertainty regarding the settlement of these liabilities, we are unable to estimate the year in which the future cash flows may occur and therefore have not included them in the above table.
Off-Balance Sheet Arrangements
We have no off-balance sheet arrangements and have not entered into any transactions involving unconsolidated, limited purpose entities or commodity contracts.
ITEM 7A. QUANTITATIVE AND QUALITATIVE DISCLOSURES ABOUT MARKET RISK
For the year ended December 31, 2014, we sold $3.2 million of auction-rate notes at par value. At December 31, 2014, we had $1.5 million in principal of senior auction-rate notes secured by student loans remaining. Auctions for these remaining auction-rate notes have failed at December 31, 2014. The funds associated with failed auctions will not be accessible until a successful auction occurs, a buyer is found outside of the auction process, the issuers redeem the securities, or final payments come due according to a contractual maturity of 33 years. As a result, we may have limited or no ability to liquidate our investment and fully recover the carrying value of our investment in the near term. At December 31, 2014 and 2013, we have recorded less than $0.1 million ($0.1 million pre-tax) and $0.3 million ($0.5 million pre-tax), respectively, of temporary impairment of these securities to accumulated other comprehensive loss, a component of shareholders’ equity. If it is determined that the fair value of these securities is other than temporarily impaired, we would record a loss, which could be material, in our consolidated statements of operations in the period such other-than-temporary decline in fair value is determined. We currently have the ability and intent to hold these investments until a recovery of the auction process occurs or the issuers redeem the securities, or until maturity if neither of those occurs.
At December 31, 2014 and 2013, we had no fixed-rate long-term debt subject to interest rate risk.
ITEM 8. FINANCIAL STATEMENTS AND SUPPLEMENTARY DATA
Our financial statements are set forth on pages 38 through 65 and supplementary data are set forth on pages 66 through 67, which follow Item 15, are incorporated herein by reference.
33
ITEM 9. CHANGES IN AND DISAGREEMENTS WITH ACCOUNTANTS ON ACCOUNTING AND FINANCIAL DISCLOSURE
Not applicable.
ITEM 9A. CONTROLS AND PROCEDURES
Conclusion Regarding the Effectiveness of Disclosure Controls and Procedures
We maintain disclosure controls and procedures, as such term is defined under Rule 13a-15(e) promulgated under the Exchange Act. In designing and evaluating the disclosure controls and procedures, management recognizes that any disclosure controls and procedures, no matter how well designed and operated, can provide only reasonable assurance of achieving the desired control objectives, and management necessarily is required to apply its judgment in evaluating the cost-benefit relationship of possible controls and procedures.
Under the supervision and with the participation of our management, including our principal executive officer and principal financial officer, we conducted an evaluation of the effectiveness of our disclosure controls and procedures as of the end of the period covered by this Report. Based on this evaluation, our principal executive officer and principal financial officer have concluded that our disclosure controls and procedures were effective as of December 31, 2014 to provide reasonable assurance that information required to be disclosed by the Company in reports that it files or submits under the Exchange Act is recorded, processed, summarized and reported within the time periods specified in SEC rules and forms, and include controls and procedures designed to ensure that information required to be disclosed by us in such reports is accumulated and communicated to our management, including the principal executive officer and principal financial officer, as appropriate, to allow timely decisions regarding required disclosure.
Management’s Report on Internal Control Over Financial Reporting
Management is responsible for establishing and maintaining adequate internal control over financial reporting, as such term is defined in Exchange Act Rule 13a-15(f) and 15d-15(f). Internal control over financial reporting is a process designed to provide reasonable assurance regarding the reliability of financial reporting and the preparation of financial statements for external purposes in accordance with U.S. generally accepting accounting principles. Because of its inherent limitations, internal control over financial reporting may not prevent or detect all misstatements. Also, projections of any evaluation of the effectiveness of our internal control over financial reporting to future periods are subject to the risk that controls may become inadequate because of changes in conditions, or that the degree of compliance with the policies or procedures may deteriorate.
Under the supervision and with the participation of our management, including our principal executive officer and principal financial officer, we conducted an evaluation of the effectiveness of our internal control over financial reporting as of December 31, 2014. This evaluation was based on the framework in the report entitled “Internal Control - Integrated Framework (1992)” issued by the Committee of Sponsoring Organizations of the Treadway Commission. Our management concluded that as of December 31, 2014 our internal control over financial reporting was effective as of December 31, 2014.
During the year ended December 31, 2014, we implemented an internal control to address a previously identified material weakness in our financial reporting process for the year ended December 31, 2013. Effective during the three months ended March 31, 2014, we re-designed and performed the internal control to ensure the accuracy of inventory information reported by distributors used in recording deferred income on shipments to distributors was on a disaggregated level reported by multiple distributors. After completing our testing of the design and operating effectiveness of the internal control, we concluded that we have remediated the previously identified material weakness as of December 31, 2014.
The effectiveness of our internal control over financial reporting as of December 31, 2014 has been audited by KPMG LLP, our independent registered public accounting firm, as stated in their report which appears in Part IV, Item 15 “Exhibits and Financial Statement Schedules” of this Report.
Changes in Internal Control Over Financial Reporting
There has been no change in our internal controls over financial reporting that occurred during the quarter ended December 31, 2014 that has materially affected, or is reasonably likely to materially affect, our internal control over financial reporting.
34
ITEM 9B. OTHER INFORMATION
Annual Meeting Date
Our 2015 Annual Meeting of Shareholders is scheduled for June 19, 2015. The date for any shareholder of the Company to submit a proposal in order for the proposal to be included in our proxy statement and proxy for the 2015 Annual Meeting has passed. Our Board of Directors has postponed the date for receipt of proposals from our shareholders for the 2015 Annual Meeting that will not be included in our proxy materials to April 17, 2015. All such proposals must be received by our Secretary at our principal executive offices and must comply with the procedural requirements in our bylaws. Shareholders can obtain a copy of our bylaws from us upon request. The bylaws are also on file with the SEC. We reserve the right to reject, rule out of order or to take other appropriate action with respect to any proposal that does not comply with these and other applicable procedures. Our Board of Directors has also set the record date for our 2015 Annual Meeting as April 30, 2015. All shareholders of record on April 30, 2015 will be entitled to notice of our Annual Meeting and to vote.
35
PART III
ITEM 10. DIRECTORS, EXECUTIVE OFFICERS AND CORPORATE GOVERNANCE
The information concerning our directors and officers is included in our Proxy Statement to be filed in connection with our 2015 Annual Meeting of Shareholders under the captions “Election of Directors” and “Certain Information with Respect to Executive Officers,” respectively, and is incorporated herein by reference. There have been no material changes to the procedures by which security holders may recommend nominees to our Board of Directors.
We have an Audit Committee composed of independent directors. The information required by this item with respect to the Audit Committee and “audit committee financial experts” is incorporated by reference from our Proxy Statement to be filed in connection with our 2015 Annual Meeting of Shareholders under the captions, “Committees and Meetings of the Board of Directors” and “Board Committees”.
The information concerning compliance with Section 16(a) of the Exchange Act is included in our Proxy Statement to be filed in connection with our 2015 Annual Meeting of Shareholders under the caption “Section 16(A) Beneficial Ownership Reporting Compliance,” and is incorporated herein by reference.
We have adopted a code of ethics that applies to the principal executive officer, principal financial officer, principal accounting officer or corporate controller, or persons performing similar functions. Our code of ethics was filed as Exhibit 14 to our Annual Report on Form 10-K for the year ended December 31, 2003 and can also be viewed at www.micrel.com. In the event that we amend or waive any of the provisions of the code of ethics that applies to our principal executive officer, principal financial officer, principal accounting officer or corporate controller, or persons performing similar functions, we intend to disclose the subsequent information on our website.
Information regarding our code of conduct, also known as the “Worldwide Standards of Business Conduct”, is set forth in our Proxy Statement to be filed in connection with our 2015 Annual Meeting of Shareholders under the caption “Certain Relationships and Related Transactions” and is incorporated herein by reference.
ITEM 11. EXECUTIVE COMPENSATION
The information required by this item concerning executive compensation is included under the caption “Compensation Discussion and Analysis” and “Executive Compensation” in our Proxy Statement to be filed in connection with our 2015 Annual Meeting of Shareholders and is incorporated herein by reference.
The information required by this item concerning compensation committee interlocks and insider participation is included under the captions “Compensation Committee Interlocks and Insider Participation” in our Proxy Statement to be filed in connection with our 2015 Annual Meeting of Shareholders and is incorporated herein by reference.
The information required by this item concerning the Compensation Committee Report is included in our Proxy Statement to be filed in connection with our 2015 Annual Meeting of Shareholders and is incorporated herein by reference. Such information shall be deemed “furnished” and not “filed” for purposes of Section 18 of the Exchange Act, and shall not be deemed incorporated by reference into any of our filing as a result of furnishing the disclosure in this manner except to the extent incorporated by reference into such filing.
ITEM 12. SECURITY OWNERSHIP OF CERTAIN BENEFICIAL OWNERS AND MANAGEMENT AND RELATED SHAREHOLDER MATTERS
The information required by this item is included under the caption “Security Ownership of Certain Beneficial Owners and Management” and “Equity Compensation Plan Information” in our Proxy Statement to be filed in connection with our 2015 Annual Meeting of Shareholders and is incorporated herein by reference.
ITEM 13. CERTAIN RELATIONSHIPS AND RELATED TRANSACTIONS, AND DIRECTOR INDEPENDENCE
The information required by this item is included under the captions “Certain Relationships and Related Transactions,” “Director Independence” and “Board Committees” in our Proxy Statement to be filed in connection with our 2015 Annual Meeting of Shareholders and is incorporated herein by reference.
36
ITEM 14. PRINCIPAL ACCOUNTING FEES AND SERVICES
The information required by this item is included under the caption “Independent Registered Public Accounting Firm” in our Proxy Statement to be filed in connection with our 2015 Annual Meeting of Shareholders and is incorporated herein by reference.
37
PART IV
ITEM 15. | EXHIBITS AND FINANCIAL STATEMENT SCHEDULES |
The following documents are filed as part of this Report: |
(a) | 1. | Consolidated Financial Statements | |
Page | |||
2. | Financial Statement Schedule. The following financial statement schedule of the Company for the years ended December 31, 2014, 2013 and 2012, is filed as part of this report on Form 10-K and should be read in conjunction with the financial statements. | ||
Schedules not listed above have been omitted because they are not applicable, not required, or the information required to be set forth therein is included in the Consolidated Financial Statements or notes thereto. | |||
3. | |||
38
Report of Independent Registered Public Accounting Firm
The Board of Directors and Shareholders
Micrel, Incorporated:
We have audited the accompanying consolidated balance sheets of Micrel, Incorporated and subsidiaries (the Company) as of December 31, 2014 and 2013, and the related consolidated statements of operations, comprehensive income, shareholders’ equity, and cash flows for each of the years in the two-year period ended December 31, 2014. We have also audited the Company’s internal control over financial reporting as of December 31, 2014, based on criteria established in Internal Control - Integrated Framework (1992) issued by the Committee of Sponsoring Organizations of the Treadway Commission (COSO). In connection with our audit of the consolidated financial statements, we have also audited the financial statement schedule of valuation and qualifying accounts as set forth under Item 15(a)(2). The Company’s management is responsible for these consolidated financial statements and financial statement schedule, for maintaining effective internal control over financial reporting, and for its assessment of the effectiveness of internal control over financial reporting, included in the accompanying Management’s Report on Internal Control over Financial Reporting appearing under Item 9A. Our responsibility is to express an opinion on these consolidated financial statements, the financial statement schedule, and an opinion on the Company’s internal control over financial reporting based on our audits.
We conducted our audits in accordance with the standards of the Public Company Accounting Oversight Board (United States). Those standards require that we plan and perform the audits to obtain reasonable assurance about whether the financial statements are free of material misstatement and whether effective internal control over financial reporting was maintained in all material respects. Our audits of the consolidated financial statements included examining, on a test basis, evidence supporting the amounts and disclosures in the financial statements, assessing the accounting principles used and significant estimates made by management, and evaluating the overall financial statement presentation. Our audit of internal control over financial reporting included obtaining an understanding of internal control over financial reporting, assessing the risk that a material weakness exists, and testing and evaluating the design and operating effectiveness of internal control based on the assessed risk. Our audits also included performing such other procedures as we considered necessary in the circumstances. We believe that our audits provide a reasonable basis for our opinions.
A company’s internal control over financial reporting is a process designed to provide reasonable assurance regarding the reliability of financial reporting and the preparation of financial statements for external purposes in accordance with generally accepted accounting principles. A company’s internal control over financial reporting includes those policies and procedures that (1) pertain to the maintenance of records that, in reasonable detail, accurately and fairly reflect the transactions and dispositions of the assets of the company; (2) provide reasonable assurance that transactions are recorded as necessary to permit preparation of financial statements in accordance with generally accepted accounting principles, and that receipts and expenditures of the company are being made only in accordance with authorizations of management and directors of the company; and (3) provide reasonable assurance regarding prevention or timely detection of unauthorized acquisition, use, or disposition of the company’s assets that could have a material effect on the financial statements.
Because of its inherent limitations, internal control over financial reporting may not prevent or detect misstatements. Also, projections of any evaluation of effectiveness to future periods are subject to the risk that controls may become inadequate because of changes in conditions, or that the degree of compliance with the policies or procedures may deteriorate.
In our opinion, the consolidated financial statements referred to above present fairly, in all material respects, the financial position of Micrel, Incorporated and subsidiaries as of December 31, 2014 and 2013, and the results of their operations and their cash flows for each of the years in the two-year period ended December 31, 2014, in conformity with U.S. generally accepted accounting principles. Also in our opinion, the related financial statement schedule, when considered in relation to the basic consolidated financial statements taken as a whole, presents fairly, in all material respects, the information set forth therein. Also in our opinion, the Company maintained, in all material respects, effective internal control over financial reporting as of December 31, 2014, based on criteria established in Internal Control - Integrated Framework (1992) issued by the COSO.
/s/ KPMG LLP
Santa Clara, California
February 24, 2015
39
Report of Independent Registered Public Accounting Firm
The Board of Directors and Shareholders of Micrel, Incorporated:
In our opinion, the consolidated statements of operations, comprehensive income, shareholders’ equity and cash flows for the year ended December 31, 2012, present fairly, in all material respects, the results of operations and cash flows of Micrel, Incorporated and its subsidiaries for the year ended December 31, 2012, in conformity with accounting principles generally accepted in the United States of America. In addition, in our opinion, the financial statement schedule for the year ended December 31, 2012 presents fairly, in all material respects, the information set forth therein when read in conjunction with the related consolidated financial statements. These financial statements and financial statement schedule are the responsibility of the Company's management. Our responsibility is to express an opinion on these financial statements and financial statement schedule based on our audit. We conducted our audit of these statements in accordance with the standards of the Public Company Accounting Oversight Board (United States). Those standards require that we plan and perform the audit to obtain reasonable assurance about whether the financial statements are free of material misstatement. An audit includes examining, on a test basis, evidence supporting the amounts and disclosures in the financial statements, assessing the accounting principles used and significant estimates made by management, and evaluating the overall financial statement presentation. We believe that our audit provides a reasonable basis for our opinion.
/s/ PricewaterhouseCoopers LLP
San Jose, California
March 18, 2013
40
MICREL, INCORPORATED
CONSOLIDATED BALANCE SHEETS
(In thousands, except share amounts)
December 31, 2014 | December 31, 2013 | ||||||
ASSETS | |||||||
CURRENT ASSETS: | |||||||
Cash and cash equivalents | $ | 21,183 | $ | 23,787 | |||
Restricted cash | 44 | 1,116 | |||||
Short-term investments | 65,428 | 64,806 | |||||
Accounts receivable, less allowances: 2014, $1,058; 2013, $760 | 30,523 | 29,437 | |||||
Inventories | 44,136 | 43,201 | |||||
Prepaid taxes | 5,633 | 4,513 | |||||
Prepaid expenses and other | 1,612 | 2,698 | |||||
Deferred income taxes | 22,356 | 21,662 | |||||
Total current assets | 190,915 | 191,220 | |||||
LONG-TERM INVESTMENTS | 1,436 | 4,195 | |||||
PROPERTY, PLANT AND EQUIPMENT, NET | 60,453 | 57,779 | |||||
LONG-TERM PREPAID TAXES | 1,711 | — | |||||
GOODWILL | 8,655 | 8,554 | |||||
INTANGIBLE ASSETS, NET | 9,792 | 11,749 | |||||
DEFERRED INCOME TAXES | 2,707 | 1,581 | |||||
OTHER ASSETS | 1,511 | 1,046 | |||||
TOTAL ASSETS | $ | 277,180 | $ | 276,124 | |||
LIABILITIES AND SHAREHOLDERS’ EQUITY | |||||||
CURRENT LIABILITIES: | |||||||
Accounts payable | $ | 17,376 | $ | 13,502 | |||
Accrued liabilities | 12,869 | 12,874 | |||||
Deferred income on shipments to distributors | 22,947 | 27,026 | |||||
Total current liabilities | 53,192 | 53,402 | |||||
LONG-TERM INCOME TAXES PAYABLE | 3,511 | 3,575 | |||||
LONG-TERM DEFERRED INCOME TAXES | 807 | 973 | |||||
OTHER LONG-TERM LIABILITIES | 162 | 201 | |||||
Total liabilities | 57,672 | 58,151 | |||||
COMMITMENTS AND CONTINGENCIES (Note 12) | |||||||
SHAREHOLDERS’ EQUITY: | |||||||
Preferred stock, no par value - authorized: 5,000,000 shares; issued and outstanding: none | — | — | |||||
Common stock, no par value - authorized: 250,000,000 shares; issued and outstanding: 2014 - 56,435,555 shares; 2013 - 56,441,346 shares | — | — | |||||
Accumulated other comprehensive loss | (83 | ) | (320 | ) | |||
Retained earnings | 219,591 | 218,293 | |||||
Total shareholders’ equity | 219,508 | 217,973 | |||||
TOTAL LIABILITIES AND SHAREHOLDERS' EQUITY | $ | 277,180 | $ | 276,124 | |||
The accompanying notes are an integral part of these consolidated financial statements.
41
MICREL, INCORPORATED
CONSOLIDATED STATEMENTS OF OPERATIONS
(In thousands, except per share amounts)
Years Ended December 31, | 2014 | 2013 | 2012 | ||||||||
NET REVENUES | $ | 247,594 | $ | 237,080 | $ | 250,112 | |||||
COST OF REVENUES (1) | 119,566 | 115,034 | 117,185 | ||||||||
GROSS PROFIT | 128,028 | 122,046 | 132,927 | ||||||||
OPERATING EXPENSES: | |||||||||||
Research and development (1) | 62,033 | 55,853 | 57,182 | ||||||||
Selling, general and administrative (1) | 48,351 | 45,803 | 48,010 | ||||||||
Restructuring charges | 992 | 1,376 | — | ||||||||
Total operating expenses | 111,376 | 103,032 | 105,192 | ||||||||
INCOME FROM OPERATIONS | 16,652 | 19,014 | 27,735 | ||||||||
INTEREST AND OTHER INCOME (EXPENSE): | |||||||||||
Interest income | 359 | 482 | 712 | ||||||||
Other expense, net | (297 | ) | (264 | ) | (153 | ) | |||||
Total interest and other income, net | 62 | 218 | 559 | ||||||||
INCOME BEFORE INCOME TAXES AND NONCONTROLLING INTEREST | 16,714 | 19,232 | 28,294 | ||||||||
PROVISION FOR INCOME TAXES | 3,167 | 1,584 | 15,966 | ||||||||
NET INCOME | 13,547 | 17,648 | 12,328 | ||||||||
LESS: NET INCOME ATTRIBUTABLE TO NONCONTROLLING INTEREST | — | — | (10 | ) | |||||||
NET INCOME ATTRIBUTABLE TO MICREL, INCORPORATED SHAREHOLDERS | $ | 13,547 | $ | 17,648 | $ | 12,318 | |||||
NET INCOME PER SHARE ATTRIBUTABLE TO MICREL, INCORPORATED SHAREHOLDERS: | |||||||||||
Basic | $ | 0.24 | $ | 0.31 | $ | 0.21 | |||||
Diluted | $ | 0.24 | $ | 0.30 | $ | 0.20 | |||||
CASH DIVIDENDS DECLARED PER COMMON SHARE (2) | $ | 0.20 | $ | 0.1425 | $ | 0.205 | |||||
WEIGHTED AVERAGE SHARES USED IN COMPUTING PER SHARE AMOUNTS: | |||||||||||
Basic | 56,508 | 57,803 | 59,623 | ||||||||
Diluted | 57,538 | 58,506 | 60,288 | ||||||||
(1) Share-based compensation expense included in:
Cost of revenues | $ | 997 | $ | 1,060 | $ | 1,178 | |||||
Research and development | 3,197 | 2,875 | 3,132 | ||||||||
Selling, general and administrative | 3,430 | 3,162 | 3,282 | ||||||||
(2) Included an accelerated cash dividend of $0.0425 per share of common stock totaling $2.5 million paid on December 27, 2012 to shareholders of record as of December 18, 2012.
The accompanying notes are an integral part of these consolidated financial statements.
42
MICREL, INCORPORATED
CONSOLIDATED STATEMENTS OF COMPREHENSIVE INCOME
(In thousands)
Years Ended December 31, | 2014 | 2013 | 2012 | ||||||||
NET INCOME | $ | 13,547 | $ | 17,648 | $ | 12,328 | |||||
Other comprehensive income: | |||||||||||
Unrealized gains on investments | 366 | 303 | 608 | ||||||||
Reclassification adjustment for a realized loss on investment included in other expense | — | 26 | — | ||||||||
Income tax provision | (129 | ) | (117 | ) | (253 | ) | |||||
Other comprehensive income, net of taxes | 237 | 212 | 355 | ||||||||
COMPREHENSIVE INCOME | 13,784 | 17,860 | 12,683 | ||||||||
Less: Comprehensive income attributable to noncontrolling interest | — | — | (10 | ) | |||||||
COMPREHENSIVE INCOME ATTRIBUTABLE TO MICREL, INCORPORATED SHAREHOLDERS | $ | 13,784 | $ | 17,860 | $ | 12,673 | |||||
The accompanying notes are an integral part of these consolidated financial statements.
43
MICREL, INCORPORATED
CONSOLIDATED STATEMENTS OF SHAREHOLDERS’ EQUITY
(In thousands, except share amounts)
Accumulated Other Comprehensive Loss | Retained Earnings | Non-controlling Interest | Total Shareholders’ Equity | |||||||||||||||||||
Common Stock | ||||||||||||||||||||||
Shares | Amount | |||||||||||||||||||||
Balances at December 31, 2011 | 61,038,507 | $ | 206 | $ | (887 | ) | $ | 245,199 | $ | — | $ | 244,518 | ||||||||||
Net income | — | — | — | 12,318 | 10 | 12,328 | ||||||||||||||||
Other comprehensive income, net of tax | — | — | 355 | — | — | 355 | ||||||||||||||||
Noncontrolling interest in Phaselink | — | — | — | — | 977 | 977 | ||||||||||||||||
Acquisition of noncontrolling interest in Phaselink | — | 55 | — | — | (987 | ) | (932 | ) | ||||||||||||||
Share-based compensation | — | 7,558 | — | — | — | 7,558 | ||||||||||||||||
Payment of cash dividends | — | — | — | (12,072 | ) | — | (12,072 | ) | ||||||||||||||
Repurchases of common stock | (3,431,548 | ) | (10,742 | ) | — | (23,809 | ) | — | (34,551 | ) | ||||||||||||
Employee stock transactions | 599,980 | 3,642 | — | — | — | 3,642 | ||||||||||||||||
Tax effect of employee stock transactions | — | (185 | ) | — | — | — | (185 | ) | ||||||||||||||
Purchases of common stock for withholding taxes on vested restricted stock | (53,274 | ) | (534 | ) | — | — | — | (534 | ) | |||||||||||||
Balances at December 31, 2012 | 58,153,665 | — | (532 | ) | 221,636 | $ | — | 221,104 | ||||||||||||||
Net income | — | — | — | 17,648 | — | 17,648 | ||||||||||||||||
Other comprehensive income, net of tax | — | — | 212 | — | — | 212 | ||||||||||||||||
Share-based compensation | — | 7,108 | — | — | — | 7,108 | ||||||||||||||||
Payment of cash dividends | — | — | — | (8,219 | ) | — | (8,219 | ) | ||||||||||||||
Repurchases of common stock | (2,405,959 | ) | (10,564 | ) | — | (12,772 | ) | — | (23,336 | ) | ||||||||||||
Employee stock transactions | 774,403 | 4,390 | — | — | — | 4,390 | ||||||||||||||||
Tax effect of employee stock transactions | — | (122 | ) | — | — | — | (122 | ) | ||||||||||||||
Purchases of common stock for withholding taxes on vested restricted stock | (80,763 | ) | (812 | ) | — | — | — | (812 | ) | |||||||||||||
Balances at December 31, 2013 | 56,441,346 | — | (320 | ) | 218,293 | — | 217,973 | |||||||||||||||
Net income | — | — | — | 13,547 | — | 13,547 | ||||||||||||||||
Other comprehensive income, net of tax | — | — | 237 | — | — | 237 | ||||||||||||||||
Share-based compensation | — | 7,644 | — | — | — | 7,644 | ||||||||||||||||
Payment of cash dividends | — | — | — | (11,299 | ) | — | (11,299 | ) | ||||||||||||||
Repurchases of common stock | (1,744,095 | ) | (19,200 | ) | — | (950 | ) | — | (20,150 | ) | ||||||||||||
Employee stock transactions | 1,868,599 | 13,101 | — | — | — | 13,101 | ||||||||||||||||
Tax effect of employee stock transactions | — | (40 | ) | — | — | — | (40 | ) | ||||||||||||||
Purchases of common stock for withholding taxes on vested restricted stock | (130,295 | ) | (1,505 | ) | — | — | — | (1,505 | ) | |||||||||||||
Balances at December 31, 2014 | 56,435,555 | $ | — | $ | (83 | ) | $ | 219,591 | $ | — | $ | 219,508 | ||||||||||
The accompanying notes are an integral part of these consolidated financial statements.
44
MICREL, INCORPORATED
CONSOLIDATED STATEMENTS OF CASH FLOWS
(In thousands)
Years Ended December 31, | 2014 | 2013 | 2012 | ||||||||
CASH FLOWS FROM OPERATING ACTIVITIES: | |||||||||||
Net income | $ | 13,547 | $ | 17,648 | $ | 12,328 | |||||
Adjustments to reconcile net income to net cash provided by operating activities: | |||||||||||
Depreciation and amortization | 13,632 | 13,122 | 12,465 | ||||||||
Share-based compensation expense | 7,624 | 7,097 | 7,592 | ||||||||
Excess tax benefits from stock-based awards | (2,046 | ) | (476 | ) | (218 | ) | |||||
Impairment of technology | — | — | 1,000 | ||||||||
(Gain) loss on disposal of assets | (21 | ) | (33 | ) | 1 | ||||||
Deferred income tax provision | (2,115 | ) | (3,677 | ) | 9,654 | ||||||
Other, net | — | 61 | — | ||||||||
Changes in operating assets and liabilities: | |||||||||||
Accounts receivable | (1,086 | ) | (1,073 | ) | (1,135 | ) | |||||
Inventories | (915 | ) | 208 | (4,684 | ) | ||||||
Prepaid taxes | (2,871 | ) | (544 | ) | 2,569 | ||||||
Prepaid expenses and other assets | 125 | (1,558 | ) | (1,469 | ) | ||||||
Accounts payable | 1,803 | (8,784 | ) | 3,928 | |||||||
Income taxes payable | (64 | ) | 683 | (3,508 | ) | ||||||
Accrued liabilities and other long-term liabilities | (402 | ) | 2,920 | (976 | ) | ||||||
Deferred income on shipments to distributors | (4,079 | ) | 1,258 | (4,903 | ) | ||||||
Net cash provided by operating activities | 23,132 | 26,852 | 32,644 | ||||||||
CASH FLOWS FROM INVESTING ACTIVITIES: | |||||||||||
Purchase of PhaseLink’s net assets, net of cash acquired | — | — | (17,370 | ) | |||||||
Purchase of Discera’s net assets | — | (6,122 | ) | — | |||||||
Purchases of property, plant and equipment | (11,734 | ) | (7,325 | ) | (9,022 | ) | |||||
Purchase of intangible asset | — | (410 | ) | — | |||||||
Purchases of investments | (55,166 | ) | (59,653 | ) | (55,819 | ) | |||||
Proceeds from sale and maturities of investments | 57,669 | 71,490 | 60,108 | ||||||||
Change in restricted cash | 1,072 | (825 | ) | (291 | ) | ||||||
Net cash used in investing activities | (8,159 | ) | (2,845 | ) | (22,394 | ) | |||||
CASH FLOWS FROM FINANCING ACTIVITIES: | |||||||||||
Repayments of debt | — | — | (282 | ) | |||||||
Proceeds from the issuance of common stock | 13,101 | 4,390 | 3,642 | ||||||||
Repurchases of common stock | (19,970 | ) | (23,336 | ) | (34,551 | ) | |||||
Payment of cash dividends | (11,299 | ) | (8,219 | ) | (12,072 | ) | |||||
Purchase of stock for withholding taxes on vested restricted stock | (1,455 | ) | (812 | ) | (534 | ) | |||||
Excess tax benefits from share-based awards | 2,046 | 476 | 218 | ||||||||
Net cash used in financing activities | (17,577 | ) | (27,501 | ) | (43,579 | ) | |||||
NET DECREASE IN CASH AND CASH EQUIVALENTS | (2,604 | ) | (3,494 | ) | (33,329 | ) | |||||
CASH AND CASH EQUIVALENTS - Beginning of year | 23,787 | 27,281 | 60,610 | ||||||||
CASH AND CASH EQUIVALENTS - End of year | $ | 21,183 | $ | 23,787 | $ | 27,281 | |||||
SUPPLEMENTAL DISCLOSURE OF CASH FLOW INFORMATION: | |||||||||||
Cash paid during the year for: | |||||||||||
Interest | $ | — | $ | — | $ | 2 | |||||
Income taxes | $ | 8,432 | $ | 5,457 | $ | 7,060 | |||||
The accompanying notes are an integral part of these consolidated financial statements.
45
MICREL, INCORPORATED
NOTES TO CONSOLIDATED FINANCIAL STATEMENTS
Years Ended December 31, 2014, 2013 and 2012
1. | SIGNIFICANT ACCOUNTING POLICIES |
Nature of Business — Micrel, Incorporated and its wholly-owned subsidiaries (collectively, the “Company”) develops, manufactures and markets analog, mixed-signal and digital semiconductor devices. The Company also provides custom and foundry services which include silicon wafer fabrication, integrated circuit (“IC”) assembly and testing. The Company’s products are sold principally in North America, Asia, and Europe for use in a variety of products, including those in the mobility, enterprise/cloud infrastructure, wireline communications and industrial and automotive markets. The Company’s wafer foundry services are provided to a wide range of customers that produce electronic systems for communications, consumer, automotive and military applications. The Company produces the majority of its wafers at the Company’s wafer fabrication facilities located in San Jose, California. After wafer fabrication, the completed wafers are then separated into individual circuits and packaged at independent assembly and final test contract facilities primarily located in Malaysia, Thailand, Taiwan and China.
Basis of Presentation — The accompanying consolidated financial data has been prepared by the Company pursuant to the rules and regulations of the U.S. Securities and Exchange Commission (“SEC”) and is presented in conformity with U.S. generally accepted accounting principles (“US GAAP”).
Principles of Consolidation — The accompanying consolidated financial statements include the accounts of Micrel, Incorporated and its wholly-owned subsidiaries. All significant intercompany accounts and transactions have been eliminated.
Use of Estimates — In accordance with US GAAP, management utilizes certain estimates and assumptions that affect the reported amounts of assets and liabilities at the date of the financial statements and the reported amounts of revenues and expenses during the reporting period. On an on-going basis, management evaluates its estimates and judgments. Management bases its estimates and judgments on historical experience and on various other assumptions that are believed to be reasonable under the circumstances, the results of which form the basis for making judgments about the carrying values of assets and liabilities that are not readily apparent from other sources. The primary estimates underlying the Company’s financial statements include allowances for doubtful accounts receivable, allowances for product returns and price adjustments, provisions for obsolete and slow moving inventory, share-based compensation, income taxes, litigation losses, valuation of auction-rate securities and accruals for other liabilities. Actual results could differ from those estimates.
Cash Equivalents — The Company considers all highly liquid investments with remaining maturities of three months or less at the time of purchase to be cash equivalents.
Investments — Investments purchased with remaining maturity of greater than three months and less than 12 months are classified as short-term. Investments purchased with remaining maturity dates of 12 months or greater are classified either as short-term or as long-term based on maturities and the Company’s intent with regard to those securities (expectations of sales and redemptions). Short-term investments at December 31, 2014, consisted primarily of liquid municipal securities, corporate debt securities, commercial paper and U.S. government agencies securities and were classified as available-for-sale securities. Long-term investments at December 31, 2014, consisted of auction-rate notes secured by student loans and were classified as available-for-sale securities. Available-for sale securities are stated at market value with unrealized gains and losses included in accumulated other comprehensive loss, a component of shareholders’ equity. At December 31, 2014, accumulated other comprehensive loss of $0.1 million consisted of unrealized gains and losses on investments. Unrealized losses are charged against income when a decline in the fair market value of an individual security is determined to be other than temporary. Realized gains and losses on investments are included in other income or expense.
Certain Significant Risks and Uncertainties — Financial instruments that potentially subject the Company to concentrations of credit risk consist of cash and cash equivalents, investments and accounts receivable. Risks associated with cash are mitigated by banking with creditworthy institutions. Cash equivalents and investments consist primarily of commercial paper, money market funds, corporate debt securities, municipal securities and auction-rate notes and are regularly monitored by management. Credit risk with respect to the trade receivables is spread over geographically diverse customers. The Company performs ongoing credit evaluations of its customers and maintains an allowance for potential credit losses. At December 31, 2014, distributors A, C and B accounted for 24%, 15%, and 13%, respectively, of total accounts receivable. At December 31, 2013, distributors A and B accounted for 36%, and 11%, respectively, of total accounts receivable.
46
MICREL, INCORPORATED
NOTES TO CONSOLIDATED FINANCIAL STATEMENTS (Continued)
Years Ended December 31, 2014, 2013 and 2012
Micrel currently purchases certain components from a limited group of vendors. The packaging of the Company’s products is performed by, and certain of the raw materials included in such products are obtained from, a limited group of suppliers. The wafer supply for the Company’s LAN products is currently dependent upon two large third-party wafer foundry suppliers. Although the Company seeks to reduce its dependence on limited source suppliers, disruption or termination of any of these sources could occur and such disruptions could have an adverse effect on the Company’s financial condition, results of operations, or cash flows.
The Company participates in a dynamic high technology industry and believes that changes in any of the following areas could have a material adverse effect on the Company’s future financial position, results of operations, or cash flows: changes in the overall demand for products offered by the Company; competitive pressures in the form of new products or price reductions on current products; advances and trends in new technologies and industry standards; changes in product mix; changes in third-party manufacturers; changes in key suppliers; changes in certain strategic relationships or customer relationships; litigation or claims against the Company based on intellectual property, patents, product, regulatory or other factors; risks associated with the ability to obtain necessary components; risks associated with the Company’s ability to attract and retain employees necessary to support its growth.
Inventories — Inventories are stated at the lower of cost (first-in, first-out method) or market. The Company records adjustments to write down the cost of obsolete and excess inventory to the estimated market value based on historical and forecasted demand for its products. Once an inventory write-down provision is established, it is maintained until the product to which it relates is sold or otherwise disposed of.
Property, Plant and Equipment — Property, plant and equipment are stated at cost, net of accumulated depreciation and amortization. Depreciation and amortization are computed using the straight-line method over the estimated useful lives of the assets.
Goodwill — Goodwill represents the excess of the purchase price over the fair value of net tangible and identifiable intangible assets acquired. Goodwill is measured and tested for impairment annually at the reporting unit level during the last quarter of the Company's fiscal year, or more frequently if the Company believes indicators of impairment exist. Events that could trigger a more frequent impairment review may include adverse industry or economic trends, restructuring actions, lower projections of profitability, or a sustained decline in our market capitalization. The Company has allocated its goodwill to its timing and communications reporting unit.
Qualitative factors are assessed to determine whether it is more likely than not that the fair value of the reporting unit is less than its carrying amount. If the qualitative assessment indicates that the carrying amount is more likely than not higher than the fair value, goodwill is tested for impairment based on a two-step test. The first step requires comparing the fair value of our reporting unit to its net book value, including goodwill. Determining the fair value of a reporting unit is judgmental in nature and involves the use of significant estimates and assumptions. These estimates and assumptions include projected revenues and forecasted operating margins used to calculate projected future cash flows, risk-adjusted discount rates, future economic and market conditions and determination of appropriate market comparables. The Company bases its fair value estimates on assumptions it believes to be reasonable. Actual future results may differ from those estimates. Future competitive, market and economic conditions could negatively impact key assumptions including our market capitalization or the carrying value of the Company’s net assets which could require it to realize an impairment of its goodwill.
A potential impairment exists if the fair value of the reporting unit is less than its net book value. The second step of the process is only performed if a potential impairment exists, and it involves determining the difference between the fair value of the reporting unit’s net assets other than goodwill to the fair value of the reporting unit and if the difference is less than the net book value of goodwill, an impairment exists and is recorded. No goodwill impairment was recognized in 2014, 2013 and 2012.
Impairment of Long-Lived Assets — The Company reviews its purchased intangible assets with finite lives for impairment whenever events or changes in circumstances indicate the carrying value of an asset may not be recoverable. Recoverability of these intangible assets is assessed based on the estimated undiscounted future cash flows expected to result from the use of the asset. If the undiscounted future cash flows are less than the carrying amount, the purchased intangible assets with finite lives are considered to be impaired. The amount of the impairment is measured as the difference between the carrying amount of these assets and the fair value.
47
MICREL, INCORPORATED
NOTES TO CONSOLIDATED FINANCIAL STATEMENTS (Continued)
Years Ended December 31, 2014, 2013 and 2012
The Company’s business combinations have included the purchase of in-process research and development assets that are not amortizable until the underlying project is complete. The Company assesses that its in-process research and development project is complete when all material research and development costs have been incurred and no significant risks remain. The Company reviews the carrying value of indefinite-lived intangible assets for impairment at least annually during the last quarter of its fiscal year, or more frequently if it believes indicators of impairment exist.
In 2012, the Company recorded an impairment of $1.0 million as a component of research and development expense for a developed technology which was replaced by more advanced technologies. In 2014 and 2013, no indicators of impairment were identified.
Revenue Recognition and Receivables — The Company generates revenue by selling products to original equipment manufacturers (“OEM”), sell-through distributors and sell-in distributors. The Company’s policy is to recognize revenue from sales to customers when the rights and risks of ownership have passed to the customer, when persuasive evidence of an arrangement exists, the product has been delivered, the price is fixed or determinable and collection of the resulting receivable is reasonably assured.
The Company provides certain sell-through distributors price protection rights and pricing adjustments subsequent to the initial product shipment to allow them to price the Company's products competitively for specific resale opportunities. As these price adjustments have historically been significant, and price adjustments are difficult to reliably estimate, the Company defers recognition of revenue and related cost of revenues (in the balance sheet line item “deferred income on shipments to distributors”) derived from sales to these distributors until they have resold the Company’s products to their customers. Although revenue and related cost of revenues are not recognized, the Company records an accounts receivable and relieves inventory at the time of initial product shipment. The Company's standard terms are EXW or FCA shipping point, payment terms are enforced from shipment date and legal title and risk of inventory loss passes to the sell-through distributor upon shipment. In addition, the Company estimates and records an adjustment for sell-through distributor price adjustments for which the specific resale transaction has been completed but the price adjustment claim has not yet been received by the Company.
During the third quarter of 2014, the Company amended the terms of its agreements with certain sell-through distributors. These amendments included the removal of significant return rights, price protection and pricing adjustments subsequent to the initial product shipment. Therefore, upon amendment of the agreements, these distributors were changed from sell-through distributors to sell-in distributors and the Company recognized the revenue for sales to these distributors upon the initial product shipments to these distributors, net of estimated allowance for returns established based upon historical return rates. In addition, revenue was recognized for unsold inventory held by these distributors on the date of change. The effect of changing these sell-through distributors to sell-in distributors resulted in a one-time increase in revenue of approximately $5.1 million and related cost of revenues of $1.6 million related to unsold inventory held by these distributors at June 30, 2014.
Sales to OEM customers and sell-in distributors are recognized based upon the shipment terms of the sale transaction when all other revenue recognition criteria have been met. The Company does not grant return rights, price protection or pricing adjustments to OEM customers. The Company offers limited contractual stock rotation rights to sell-in distributors. At the time of shipment to sell-in distributors, an allowance for returns is established based upon historical return rates, and an allowance for price adjustments is established based on an estimate of price adjustments to be granted. Actual future returns and price adjustments could be different than the allowance established.
The Company’s accounts receivable balances represent trade accounts receivables which have been recorded at invoiced amount and do not bear interest. The Company maintains an allowance for doubtful accounts for estimated uncollectible accounts receivable. This estimate is based on an analysis of specific customer creditworthiness and historical bad debt experience.
Shipping and Handling Costs — Shipping and handling costs are included in sales and marketing expense and are recognized as period expenses as incurred.
Litigation — An estimated liability is accrued when it is determined to be probable that a liability has been incurred and the amount of loss can be reasonably estimated. The liability accrual is charged to income in the period such determination is made. Legal fees are expensed as incurred. The Company regularly evaluates current information available to determine whether such accruals should be made.
48
MICREL, INCORPORATED
NOTES TO CONSOLIDATED FINANCIAL STATEMENTS (Continued)
Years Ended December 31, 2014, 2013 and 2012
Research and Development Expenses — Research and development costs are expensed as incurred and consist primarily of payroll and other headcount related costs and cost of materials associated with the development of new wafer fabrication processes and the definition, design and development of semiconductor products. The Company also expenses prototype wafers and new production mask sets related to new products as research and development costs until products based on new designs are released to production.
Self Insurance — The Company utilizes third-party insurance carriers subject to varying retention levels of self insurance. The Company is self-insured for a portion of the losses and liabilities primarily associated with earthquake damage, workers’ compensation claims and health benefit claims. Losses are accrued based upon the Company’s estimates of the aggregate liability for claims incurred using historical experience.
Advertising Expenses — The Company expenses advertising costs to selling, general and administrative expense as incurred. Advertising expenses for 2014, 2013 and 2012 were $0.3 million, $0.1 million and $1.0 million, respectively.
Income Taxes — Deferred tax assets and liabilities are recognized for the expected future tax consequences of events that have been reflected in the financial statements. Deferred tax assets and liabilities are determined based on the differences between the book and tax bases of assets and liabilities and operating loss carryforwards, using tax rates expected to be in effect for the years in which the differences are expected to reverse. A valuation allowance is provided to reduce net deferred tax assets if, based upon the available evidence, it is more likely than not that some or all of the deferred tax assets will not be realized. The Company recognizes the effect of income tax positions only if those positions are more likely than not of being sustained based on the technical merits of the position. The tax benefit of any tax position that meets the more-likely-than-not recognition threshold is calculated at the largest amount that is more than 50% likely of being realized upon resolution of the uncertainty. To the extent a full benefit is not expected to be realized on the uncertain tax position, a reduction to a deferred asset is recorded or an income tax liability is established. Interest and penalties on income tax obligations, including uncertain tax positions, are included in the income tax provision.
Share-based Compensation — Share-based compensation is measured at the grant date based on the fair value of the award and is recognized over the employee's requisite service period as expense in the consolidated statements of operations. Share-based compensation costs for stock option grants are based on the fair value calculated from a stock option pricing model on the date of grant. The Company has utilized the Black-Scholes option pricing model to determine the fair value for stock option grants. The fair value of stock option grants is recognized as compensation expense on a straight-line basis over the vesting period of the grants. Compensation expense recognized is shown in the operating activities section of the consolidated statements of cash flows. Cash flows resulting from the tax benefits from tax deductions in excess of the compensation cost recognized (excess tax benefits) is shown in the financing activities section of the consolidated statements of cash flows.
Net Income Per Common and Diluted Share — Basic net income per share is computed by dividing net income attributable to Micrel, Incorporated shareholders by the number of weighted-average common shares outstanding. Diluted net income per share reflects potential dilution from outstanding stock options and restricted stock units (“RSUs”) using the treasury stock method. Reconciliation of weighted-average shares used in computing basic and diluted net income per share attributable to Micrel, Incorporated shareholders is as follows (in thousands):
Years Ended December 31, | ||||||||
2014 | 2013 | 2012 | ||||||
Shares used in computing basic net income per share | 56,508 | 57,803 | 59,623 | |||||
Dilutive effect of stock options and restricted stock units | 1,030 | 703 | 665 | |||||
Shares used in computing diluted net income per share | 57,538 | 58,506 | 60,288 | |||||
For the years ended December 31, 2014, 2013 and 2012, 2.7 million, 5.4 million and 5.2 million shares underlying stock options and restricted stock units, respectively, have been excluded from the weighted-average number of common shares outstanding for the diluted net income per share computations as they were anti-dilutive.
49
MICREL, INCORPORATED
NOTES TO CONSOLIDATED FINANCIAL STATEMENTS (Continued)
Years Ended December 31, 2014, 2013 and 2012
Fair Value of Financial Instruments — Financial instruments included in the Company’s consolidated balance sheets at December 31, 2014 and 2013, consist of cash, cash equivalents, accounts receivable, accounts payable and investments. For cash, the carrying amount is the fair value. The carrying amount for cash equivalents, accounts receivable and accounts payable approximates fair value because of the short maturity of those instruments. The fair values of investments are based on quoted market prices, quoted prices for similar assets or valuation models for investments for which quoted market prices are unavailable.
2. | RECENTLY ISSUED ACCOUNTING STANDARDS |
In April 2014, the Financial Accounting Standards Board (“FASB”) issued an accounting standards update to change the requirements for reporting discontinued operations. This guidance modifies the definition of discontinued operations by limiting discontinued operations reporting to disposals of components of an entity that represent strategic shifts that have (or will have) a major effect on an entity's operations and financial results. The guidance requires expanded disclosures for discontinued operations for the assets, liabilities, revenues, and expenses of discontinued operations, and also requires an entity to disclose the pretax profit or loss of an individually significant component of an entity that does not qualify for discontinued operations reporting. The Company is required to adopt this standard for its interim and annual periods beginning after December 15, 2014. In the event that a future disposition meets the revised criteria, the Company expects that this standard will have an impact on the presentation of the Company's financial statements and the Company will present the appropriate disclosures at that time.
In May 2014, the FASB issued an accounting standards update on the recognition of revenue from contracts with customers. The guidance modifies the financial reporting of revenue. The core principle of the guidance is that an entity should recognize revenue to depict the transfer of promised goods or services to customers in an amount that reflects the consideration to which the entity expects to be entitled in exchange for those goods or services. The guidance requires enhanced disclosures for the nature, amount, timing, and uncertainty of revenue that is recognized. The Company is required to adopt this standard for its interim and annual periods beginning after December 15, 2016. Early adoption is not permitted. The guidance may be applied retrospectively to each prior period presented or retrospectively with the cumulative effect recognized as of the date of adoption. The Company is currently evaluating the impact of adopting this guidance on its consolidated financial statements.
In June 2014, the FASB issued an accounting standards update on the accounting for share-based payments when the terms of an award provide that a performance target could be achieved after the requisite service period. The guidance requires that a performance target that affects vesting and that could be achieved after the requisite service period be treated as a performance condition. The Company is required to adopt this standard for its interim and annual periods beginning after December 15, 2015. Early adoption is permitted. The guidance may be applied on a prospective or retrospective basis. The adoption of this standard is not expected to have a material impact on the Company's consolidated financial statements.
3. | ACQUISITIONS |
Discera, Inc.
On August 30, 2013, the Company signed a definitive agreement to acquire specific net assets of Discera, Inc. (“Discera”), a private company based in San Jose, California, which qualifies as an acquisition of a business for financial accounting purposes. The acquisition closed on September 9, 2013. The total cash consideration was approximately $7.2 million, plus $1.1 million of assumed liabilities. Of the $7.2 million, $6.1 million was paid upon closing, and $1.1 million was withheld to secure the indemnification obligations from the closing date through September 9, 2014, which was included in restricted cash on the consolidated balance sheet at December 31, 2013. The Company paid $1.0 million of the restricted cash in the second half of 2014. The objective of the acquisition is to complement and expand Micrel’s high performance clock and timing product portfolio, as well as expand its MEMS (micro-electrical mechanical systems) capabilities. The addition of the Discera MEMS product line will also enhance Micrel’s MEMS presence, intellectual property and capability. The Company has included the financial results of Discera in its consolidated financial statements beginning on the acquisition date. Pro forma financial disclosures are not presented herein as the financial results of this acquisition are considered immaterial.
During the first quarter of 2014, goodwill recorded from the Discera transaction was increased by approximately $0.1 million to $2.6 million and the purchase price allocation was completed.
50
MICREL, INCORPORATED
NOTES TO CONSOLIDATED FINANCIAL STATEMENTS (Continued)
Years Ended December 31, 2014, 2013 and 2012
Identifiable intangible assets
Fair values for the acquired developed technology, customer relationships, trademarks and non-competition agreements and in-process research and development (“IPR&D”) were determined based on various methods including excess earnings method, relief from royalty method and with-or-without method. The values of the developed technology and customer relationships are amortized over an estimated useful life of ten and three years, respectively. The non-competition agreements are amortized over one year. The values of trademarks are amortized over ten years.
The fair value of the acquired IPR&D was determined through estimates and valuation techniques applied to the projected cash flows of the acquired research projects. As it was determined that the underlying projects had not reached technological feasibility at the date of acquisition, the amounts allocated to IPR&D will not be amortized to expense until completion of the related projects. Upon the completion of development for each project, the acquired IPR&D will be amortized over its useful life. The Company expects to complete these projects and begin to amortize the related IPR&D assets in 2015.
PhaseLink Company Limited
On April 2, 2012, the Company acquired a controlling interest in PhaseLink™ Company Limited (“PhaseLink”), a private company based in Taiwan and in San Jose, California. The Company acquired approximately 95% of the outstanding shares of PhaseLink for $19.7 million in cash ($16.4 million net of cash acquired). On December 20, 2012, the Company acquired the remaining 5% noncontrolling interest in cash ($0.9 million) that resulted in 100% ownership in PhaseLink. The objective of the acquisition is to complement Micrel’s high performance clock generation products, add distribution products for the communications market and to expand its product offerings into the consumer and industrial markets. In addition, the Company expects the acquisition to enhance its technology portfolio and further expand its research and development capabilities. The Company has included the financial results of PhaseLink in its consolidated financial statements beginning on the acquisition date of April 2, 2012. Pro forma financial disclosures are not presented herein as the financial results of this acquisition are considered immaterial.
Identifiable intangible assets
Fair values for the acquired developed technology, customer relationships, trademarks and non-competition agreements and IPR&D were determined based on various methods including excess earnings method, relief from royalty method and with-or-without method. The values of the developed technology and customer relationships are amortized over an estimated useful life of 10 years. The non-competition agreements are amortized over a two-year period. The values of trademarks are amortized over two to five years.
The fair value of the acquired IPR&D was determined through estimates and valuation techniques based on the terms and details of the acquisition. As it was determined that the underlying projects had not reached technological feasibility at the date of acquisition, the amounts allocated to IPR&D will not be expensed until completion of the related projects. Upon the completion of development for each project, the acquired IPR&D will be amortized over its useful life. The Company expects to complete these projects and begin to amortize the related IPR&D assets in 2015.
4. | INVESTMENTS |
A summary of the Company’s short-term investments at December 31, 2014 and 2013 was as follows (in thousands):
December 31, 2014 | December 31, 2013 | ||||||||||||||||||||||||||||||
Cost | Gross Unrealized Gains | Gross Unrealized Losses | Fair Value | Cost | Gross Unrealized Gains | Gross Unrealized Losses | Fair Value | ||||||||||||||||||||||||
Corporate Debt Securities | $ | 43,327 | $ | 3 | $ | (68 | ) | $ | 43,262 | $ | 36,947 | $ | 10 | $ | — | $ | 36,957 | ||||||||||||||
Commercial Paper | 14,975 | 5 | (3 | ) | 14,977 | 13,991 | 2 | — | 13,993 | ||||||||||||||||||||||
Municipal Securities | 5,191 | 3 | — | 5,194 | 13,858 | — | (2 | ) | 13,856 | ||||||||||||||||||||||
U.S. Government Agencies Securities | 2,000 | — | (5 | ) | 1,995 | — | — | — | — | ||||||||||||||||||||||
Total | $ | 65,493 | $ | 11 | $ | (76 | ) | $ | 65,428 | $ | 64,796 | $ | 12 | $ | (2 | ) | $ | 64,806 | |||||||||||||
51
MICREL, INCORPORATED
NOTES TO CONSOLIDATED FINANCIAL STATEMENTS (Continued)
Years Ended December 31, 2014, 2013 and 2012
At December 31, 2014, the Company had no short-term investments that have been in a significant continuous unrealized loss position for more than twelve months.
A summary of the Company’s long-term investments at December 31, 2014 and December 31, 2013 was as follows (in thousands):
December 31, 2014 | December 31, 2013 | ||||||||||||||||||||||||||||||
Cost | Gross Unrealized Gains | Gross Unrealized Losses | Fair Value | Cost | Gross Unrealized Gains | Gross Unrealized Losses | Fair Value | ||||||||||||||||||||||||
Auction Rate Notes | $ | 1,500 | $ | — | $ | (64 | ) | $ | 1,436 | $ | 4,700 | $ | — | $ | (505 | ) | $ | 4,195 | |||||||||||||
During the year ended December 31, 2014, the Company sold $3.2 million of auction-rate notes at par value. At December 31, 2014, the Company had remaining $1.5 million principal value of auction-rate notes, the fair value of which has been measured using Level 3 inputs. Auction-rate notes are securities that are structured with short-term interest rate reset dates of generally less than ninety days, but with contractual maturities that can be in excess of ten years. At the end of each reset period, which occurs every seven or twenty eight days for the securities held by the Company, investors can sell or continue to hold the securities at par. As a result of sell orders exceeding buy orders, auctions for the student loan-backed notes held by the Company have failed at December 31, 2014. To date, the Company has collected all interest receivable on all of its auction-rate notes when due and expects to continue to do so in the future. The principal associated with failed auctions will not be accessible until a successful auction occurs, a buyer is found outside of the auction process, the issuers redeem the securities, or the issuers repay principal over time from cash flows prior to final maturity or final payments come due according to a contractual maturity of 33 years. The Company has classified all auction-rate notes as long-term investments at December 31, 2014 and 2013. In the event of a failed auction, the notes bear interest at a predetermined maximum rate based on the credit rating of notes as determined by one or more nationally recognized statistical rating organizations. For the auction-rate notes held by the Company at December 31, 2014, the maximum interest rate is generally one month LIBOR plus 1.5% based on the notes’ rating as of that date.
To determine the fair value of financial instruments, the Company uses a fair value hierarchy that prioritizes the inputs to valuation techniques used to measure fair value. The hierarchy gives the highest priority to unadjusted quoted prices in active markets for identical assets or liabilities (level 1 measurement) and the lowest priority to unobservable inputs (level 3 measurement). The three levels of the fair value hierarchy are described below:
• | Level 1 - Quoted prices in active markets for identical assets or liabilities. |
• | Level 2 - Inputs other than Level 1 that are observable, either directly or indirectly, such as quoted prices for similar assets or liabilities; quoted prices in markets that are not active; or other inputs that are observable or can be corroborated by observable market data for substantially the full term of the assets or liabilities. |
• | Level 3 - Unobservable inputs that are supported by little or no market activity and that are significant to the fair value of the assets or liabilities. |
A financial instrument’s level within the fair value hierarchy is based on the lowest level of any input that is significant to the fair value measurement. The Company's short-term investments are classified within Level 2 of the fair value hierarchy because they are valued using quoted market prices for similar securities, broker or dealer quotations, or other observable inputs.
The types of instruments valued based on quoted market prices in active markets include money market funds. Such instruments are generally classified within Level 1 of the fair value hierarchy. The types of instruments valued based on other observable inputs include commercial paper, corporate debt securities, municipal securities and U.S. government agencies securities. Such instruments are generally classified within Level 2 of the fair value hierarchy. The types of instruments valued based on unobservable inputs consist of the auction-rate notes held by the Company. Such instruments are generally classified within Level 3 of the fair value hierarchy. The Company estimated the fair value of these auction-rate notes using a combination of observable transactions for similar securities and a discounted cash flow model incorporating assumptions that market participants would use in their estimates of fair value. Some of these assumptions include estimates for interest rates, timing and amount of cash flows and expected holding periods of the auction-rate notes. Based on this assessment of fair value, at December 31, 2014, the Company determined there was a cumulative decline in the fair value of its auction-rate notes and recorded less than $0.1 million ($0.1 million pre-tax) temporary impairment of these securities to accumulated other comprehensive loss, a component of shareholders’ equity.
52
MICREL, INCORPORATED
NOTES TO CONSOLIDATED FINANCIAL STATEMENTS (Continued)
Years Ended December 31, 2014, 2013 and 2012
Financial assets and liabilities measured at fair value on a recurring basis were as follows (in thousands):
December 31, 2014 | |||||||||||||||
Quoted Prices in Active Markets for Identical Assets Level 1 | Significant Other Observable Inputs Level 2 | Significant Unobservable Inputs Level 3 | Total | ||||||||||||
Money Market Funds (1) | $ | 4,725 | $ | — | $ | — | $ | 4,725 | |||||||
Corporate Debt Securities (2) | — | 43,262 | — | 43,262 | |||||||||||
Commercial Paper (2) | — | 14,977 | — | 14,977 | |||||||||||
Municipal Securities (2) | — | 5,194 | — | 5,194 | |||||||||||
U.S. Government Agencies Securities (2) | — | 1,995 | — | 1,995 | |||||||||||
Auction-rate notes (3) | — | — | 1,436 | 1,436 | |||||||||||
Total | $ | 4,725 | $ | 65,428 | $ | 1,436 | $ | 71,589 | |||||||
December 31, 2013 | |||||||||||||||
Quoted Prices in Active Markets for Identical Assets Level 1 | Significant Other Observable Inputs Level 2 | Significant Unobservable Inputs Level 3 | Total | ||||||||||||
Money Market Funds (1) | $ | 16,945 | $ | — | $ | — | $ | 16,945 | |||||||
Corporate Debt Securities (2) | — | 36,957 | — | 36,957 | |||||||||||
Commercial Paper (2) | — | 13,993 | — | 13,993 | |||||||||||
Municipal Securities (2) | — | 13,856 | — | 13,856 | |||||||||||
Auction-rate notes (3) | — | — | 4,195 | 4,195 | |||||||||||
Total | $ | 16,945 | $ | 64,806 | $ | 4,195 | $ | 85,946 | |||||||
__________
(1) Included in cash and cash equivalents
(2) Included in short-term investments
(3) Included in long-term investments
There were no significant transfers between Level 1 and Level 2 of the fair value hierarchy.
For the year ended December 31, 2014, the changes in the Company’s Level 3 securities (consisting of auction-rate notes) were as follows (in thousands):
Fair Value Measurements Using Significant Unobservable Inputs (Level 3) | |||
Beginning balance, December 31, 2013 | $ | 4,195 | |
Transfers in and/or out of Level 3 | — | ||
Total unrealized gains, before tax, included in other comprehensive income | 441 | ||
Sales | (3,200 | ) | |
Ending balance, December 31, 2014 | $ | 1,436 | |
53
MICREL, INCORPORATED
NOTES TO CONSOLIDATED FINANCIAL STATEMENTS (Continued)
Years Ended December 31, 2014, 2013 and 2012
5. | INVENTORIES |
Inventories consisted of the following (in thousands):
December 31, 2014 | December 31, 2013 | ||||||
Finished goods | $ | 15,395 | $ | 11,592 | |||
Work in process | 27,500 | 30,109 | |||||
Raw materials | 1,241 | 1,500 | |||||
Total inventories | $ | 44,136 | $ | 43,201 | |||
6. | PROPERTY, PLANT AND EQUIPMENT |
Property, plant and equipment consisted of the following (in thousands):
Life | December 31, 2014 | December 31, 2013 | |||||||
Machinery and equipment | 5 years | $ | 189,335 | $ | 180,851 | ||||
Land | — | 8,101 | 8,101 | ||||||
Buildings and improvements | * | 54,483 | 53,915 | ||||||
Computer equipment and software | 3 years | 11,094 | 11,742 | ||||||
Office furniture and fixtures | 5 years | 1,528 | 1,928 | ||||||
264,541 | 256,537 | ||||||||
Accumulated depreciation | (204,088 | ) | (198,758 | ) | |||||
Total property, plant and equipment, net | $ | 60,453 | $ | 57,779 | |||||
__________
* Buildings are depreciated over 10 years to 30 years. Leasehold improvements are depreciated over the shorter of the useful life or respective lease terms.
Depreciation expense for the years ended December 31, 2014, 2013 and 2012 was $11.0 million, $11.1 million and $11.5 million, respectively.
The Company had received unpaid property, plant and equipment purchases, excluding asset retirement obligations, of $3.0 million and $1.0 million at December 31, 2014 and 2013, respectively.
54
MICREL, INCORPORATED
NOTES TO CONSOLIDATED FINANCIAL STATEMENTS (Continued)
Years Ended December 31, 2014, 2013 and 2012
7. | INTANGIBLE ASSETS |
Intangible Assets
The following table sets forth the components of intangible assets as follows (in thousands):
December 31, 2014 | December 31, 2013 | |||||||||||||||||||||||
Gross Carrying Amount | Accumulated Amortization | Net Carrying Amount | Gross Carrying Amount | Accumulated Amortization | Net Carrying Amount | |||||||||||||||||||
Developed and core technology | $ | 7,443 | $ | (1,810 | ) | $ | 5,633 | $ | 7,783 | $ | (986 | ) | $ | 6,797 | ||||||||||
Customer relationships | 3,800 | (1,181 | ) | 2,619 | 3,800 | (552 | ) | 3,248 | ||||||||||||||||
Trademarks | 610 | (370 | ) | 240 | 610 | (284 | ) | 326 | ||||||||||||||||
Non-competition agreements | — | — | — | 450 | (372 | ) | 78 | |||||||||||||||||
In-process research and development | 1,300 | — | 1,300 | 1,300 | — | 1,300 | ||||||||||||||||||
$ | 13,153 | $ | (3,361 | ) | $ | 9,792 | $ | 13,943 | $ | (2,194 | ) | $ | 11,749 | |||||||||||
The above intangible assets acquired in connection with the Discera acquisition in 2013 of $2.7 million, PhaseLink acquisition in 2012 of $8.3 million, and other acquired intangible assets of $2.1 million are amortized over their estimated useful lives ranging from one to ten years using the straight-line method. Total intangible amortization expense for the years ended December 31, 2014, 2013 and 2012 was $1.6 million, $1.4 million and $0.8 million, respectively.
The estimated future amortization expense of intangible assets at December 31, 2014 was as follows (in thousands):
Year Ending December 31, | |||
2015 | $ | 1,535 | |
2016 | 1,510 | ||
2017 | 1,281 | ||
2018 | 1,223 | ||
2019 | 1,140 | ||
Thereafter | 3,103 | ||
$ | 9,792 | ||
During 2012, the Company recorded an impairment of $1.0 million as a component of research and development expense for purchased technology which was replaced by more advanced technologies.
8. | BORROWING ARRANGEMENTS |
Under the terms of an unsecured credit facility with Bank of the West that expires on April 30, 2015, the Company has a $5.0 million line of credit available for general working capital needs, which includes a $5.0 million letter of credit sub-facility including a $2.0 million foreign exchange sub-facility. Interest rates under the facility are based on one of three interest rates, at the Company’s option: (1) a variable alternate base rate plus 1.0%, the alternate base rate being the greater of (x) Bank of the West’s prime rate, (y) the Fed Funds Rate plus 0.5% or (z) daily adjusted one-month LIBOR plus 1.0%; (2) floating one-month LIBOR plus 2.0% or (3) fixed LIBOR for one, two, three or six month periods, plus 2.0%. The agreement includes certain restrictive covenants and, at December 31, 2014, the Company was in compliance with such covenants. At December 31, 2014, the Company had no borrowings under the line of credit facility.
The Company's borrowing arrangements include a provision for the issuance of commercial or standby letters of credit by the bank on behalf of the Company. The letters of credit are issued to guarantee payments for the Company’s workers compensation program. At December 31, 2014, there was $0.3 million in letters of credit outstanding.
55
MICREL, INCORPORATED
NOTES TO CONSOLIDATED FINANCIAL STATEMENTS (Continued)
Years Ended December 31, 2014, 2013 and 2012
Through the PhaseLink acquisition, the Company acquired two term loans totaling $0.3 million with a local bank in Taiwan. The Company paid off the acquired bank loans in full in June 2012.
9. | SHAREHOLDERS' EQUITY AND SHARE-BASED COMPENSATION |
Preferred Stock
The Company has authorized 5.0 million shares of preferred stock, no par value, of which none were issued or outstanding at December 31, 2014. The preferred stock may be issued from time to time in one or more series. The Board of Directors is authorized to determine or alter the rights, preferences, privileges and restrictions of such preferred stock.
Share Repurchase Program
Since February 2010, the Company's Board of Directors has authorized the repurchase of $145.0 million of the Company's common stock. Shares of common stock purchased pursuant to the repurchase program are cancelled from outstanding shares upon repurchase and credited to an authorized and unissued reserve account. Share repurchases are recorded as a reduction to common stock to the extent available. Any amounts repurchased which are in excess of the existing total common stock balance are recorded as a reduction of retained earnings. Share repurchases are intended to reduce the number of outstanding shares of common stock to increase shareholder value and offset dilution from the Company’s share-based compensation plans and the Micrel, Incorporated Employee Stock Purchase Plan (“ESPP”). During the year ended December 31, 2014, the Company repurchased 1.7 million shares of its common stock for an aggregate price of $20.2 million, which included $0.2 million of share repurchases pending cash settlement at December 31, 2014. The total available for repurchase, at December 31, 2014, was $30.7 million.
Incentive Award Plans
The Company has in effect incentive stock plans under which incentive stock options have been granted to employees and restricted stock units and non-qualified stock options have been granted to employees and non-employee members of the Board of Directors.
On May 24, 2012, the Company’s shareholders approved the Micrel, Incorporated 2012 Equity Incentive Award Plan (the “2012 Plan”) and the reservation of an aggregate of 6.0 million shares of common stock for issuance pursuant to the 2012 Plan.
The 2012 Plan has replaced in its entirety the Company’s 1994 Stock Option Plan, the Micrel, Incorporated 2000 Non-Qualified Stock Incentive Plan and the Micrel, Incorporated 2003 Incentive Award Plan (the “Prior Plans”). No new award has been made under these plans since May 24, 2012. However, the shares of common stock that remained available for issuance under the Prior Plans were added to the shares reserved for issuance under the 2012 Plan. In addition, shares of common stock subject to awards already granted under the Micrel, Incorporated 2003 Incentive Award Plan that terminate, expire or lapse will become available for issuance under the 2012 Plan, provided that the aggregate number of shares of common stock available for issuance under the 2012 Plan is reduced by two (2) shares for each share of common stock delivered in settlement of any award other than a stock option or stock appreciation right. On the effective date of the 2012 Plan which was May 24, 2012, the Prior Plans were terminated, provided, that any awards outstanding under the Prior Plans remain outstanding pursuant to their respective terms. At December 31, 2014, there were 3.4 million shares available for future grants under the Company’s 2012 Plan.
Stock Options
Options granted under the 2012 Plan typically become exercisable in cumulative annual increments of either 20% or 25% per year from the date of grant. The term of each stock option is no more than ten years from the date of grant.
56
MICREL, INCORPORATED
NOTES TO CONSOLIDATED FINANCIAL STATEMENTS (Continued)
Years Ended December 31, 2014, 2013 and 2012
Option activity under the Company’s incentive stock plans is as follows:
Number of Shares | Weighted Avg. Exercise Price Per Share | ||||||
Outstanding, December 31, 2011 (3,366,610 shares exercisable at a weighted average price of $10.31 per share and a weighted average remaining contractual life of 4.3 years) | 7,960,170 | $ | 10.26 | ||||
Granted | 1,494,250 | 10.13 | |||||
Exercised | (415,156 | ) | 7.91 | ||||
Canceled | (882,995 | ) | 11.22 | ||||
Outstanding, December 31, 2012 (4,068,071 shares exercisable at a weighted average price of $9.98 per share and a weighted average remaining contractual life of 4.2 years) | 8,156,269 | 10.25 | |||||
Granted | 700,300 | 9.96 | |||||
Exercised | (522,218 | ) | 7.62 | ||||
Canceled | (821,263 | ) | 10.92 | ||||
Outstanding, December 31, 2013 (4,286,232 shares exercisable at a weighted average price of $10.12 per share and a weighted average remaining contractual life of 4.3 years) | 7,513,088 | 10.34 | |||||
Granted | 445,767 | 10.85 | |||||
Exercised | (1,485,784 | ) | 8.56 | ||||
Canceled | (586,132 | ) | 12.38 | ||||
Outstanding, December 31, 2014 (3,512,257 shares exercisable at a weighted average price of $10.53 per share and a weighted average remaining contractual life of 4.8 years) | 5,886,939 | $ | 10.64 | ||||
At December 31, 2014, the estimated number of options expected to vest and exercisable was 5.2 million shares with a weighted average remaining contractual life of 5.7 years and an estimated aggregate intrinsic value of $20.3 million.
The weighted average fair value (computed using the Black-Scholes option pricing model) of options granted under the stock option plans during the years ended December 31, 2014, 2013 and 2012 was $2.93, $2.86 and $2.96 per share, respectively. The total intrinsic value of options (which is the amount by which the stock price exceeded the exercise price of the options on the date of exercise) exercised during the years ended December 31, 2014, 2013 and 2012 was $4.2 million, $1.2 million and $1.0 million, respectively. During the years ended December 31, 2014, 2013 and 2012, the amount of cash received from the exercise of stock options was $12.7 million, $4.0 million and $3.3 million, respectively. The excess tax benefit realized from the exercise of non-qualified stock options and disqualifying dispositions of incentive stock options was $2.0 million, $0.5 million and $0.2 million for the years ended December 31, 2014, 2013 and 2012, respectively.
Additional information regarding options outstanding at December 31, 2014 was as follows:
Stock Options Outstanding | Options Exercisable | |||||||||||||||
Range of Exercise Prices | Number Outstanding | Weighted Avg. Remaining Contractual Life (yrs) | Weighted Avg. Exercise Price Per Share | Number Exercisable | Weighted Avg. Exercise Price Per Share | |||||||||||
$ 4.72 to $ 7.00 | 132,020 | 3.5 | $ | 6.63 | 132,020 | $ | 6.63 | |||||||||
$ 7.01 to $ 7.46 | 298,340 | 4.1 | 7.25 | 293,380 | 7.25 | |||||||||||
$ 7.49 to $ 8.00 | 288,283 | 4.4 | 7.82 | 283,803 | 7.82 | |||||||||||
$ 8.01 to $ 9.00 | 151,588 | 3.6 | 8.54 | 141,785 | 8.53 | |||||||||||
$ 9.01 to $10.00 | 1,282,671 | 6.5 | 9.61 | 643,954 | 9.65 | |||||||||||
$10.01 to $11.00 | 1,982,999 | 6.8 | 10.41 | 868,161 | 10.40 | |||||||||||
$11.01 to $13.00 | 697,258 | 6.0 | 12.09 | 407,874 | 12.16 | |||||||||||
$13.01 to $16.00 | 973,780 | 5.5 | 13.70 | 661,280 | 13.67 | |||||||||||
$16.01 to $49.50 | 80,000 | 1.2 | 16.21 | 80,000 | 16.21 | |||||||||||
5,886,939 | 5.9 | $ | 10.64 | 3,512,257 | $ | 10.53 | ||||||||||
57
MICREL, INCORPORATED
NOTES TO CONSOLIDATED FINANCIAL STATEMENTS (Continued)
Years Ended December 31, 2014, 2013 and 2012
At December 31, 2014, the aggregate pre-tax intrinsic value (which was the amount by which the $14.51 closing price of the Company’s common stock at December 31, 2014 exceeded the exercise price of the in the money options) of options outstanding and options exercisable was approximately $22.9 million and $14.1 million, respectively.
The fair value of the stock options granted under the Company’s option plans was estimated at the date of grant using the Black-Scholes option pricing model with the following weighted-average assumptions:
Years Ended December 31, | ||||||||
2014 | 2013 | 2012 | ||||||
Expected term (years) | 6.0 | 5.9 | 5.8 | |||||
Stock volatility | 30.7 | % | 34.5 | % | 36.6 | % | ||
Risk free interest rates | 2.0 | % | 1.6 | % | 1.0 | % | ||
Dividends during expected terms | 1.6 | % | 1.9 | % | 1.6 | % | ||
Expected term is based on an analysis of historical exercises and the remaining contractual life of options.
Stock volatility is based upon historical stock price volatility.
Risk-free rate is based on the U.S. Treasury yield curve in effect at the time of grant.
Dividend yield is based on annualized dividends per share and the Company’s average stock price.
The Company estimates potential forfeitures of stock grants and accordingly adjusts compensation cost recorded. The estimate of forfeitures will be adjusted over the requisite service period to the extent that actual forfeitures differ, or are expected to differ, from such estimates. Changes in estimated forfeitures will be recognized through a cumulative catch-up adjustment in the period of change and will also impact the amount of share-based compensation to be recognized in future periods.
Restricted Stock Units
The 2012 Plan and 2003 Plan also provide for the use of incentive awards other than stock options. In October 2007, the Company’s Compensation Committee approved a plan to begin granting restricted stock units (“RSUs”) to employees in accordance with the provisions of the 2003 Plan. At December 31, 2014, approximately 83% of the RSUs would vest in four equal installments annually over four years. Approximately 14% of the RSUs would vest one third on each of the third, fourth and fifth annual anniversaries of the grant date. Information with respect to outstanding RSU activity is as follows:
Number of Shares | Weighted Average Grant-Date Fair Value | ||||||
Outstanding, December 31, 2011 | 667,277 | $ | 9.73 | ||||
Granted | 417,531 | 9.67 | |||||
Vested | (146,327 | ) | 9.49 | ||||
Forfeited | (61,431 | ) | 9.65 | ||||
Outstanding, December 31, 2012 | 877,050 | 9.83 | |||||
Granted | 591,974 | 9.31 | |||||
Vested | (209,819 | ) | 9.60 | ||||
Forfeited | (63,943 | ) | 9.69 | ||||
Outstanding, December 31, 2013 | 1,195,262 | 9.63 | |||||
Granted | 780,225 | 10.78 | |||||
Vested | (349,451 | ) | 9.61 | ||||
Forfeited | (116,935 | ) | 9.89 | ||||
Outstanding, December 31, 2014 | 1,509,101 | $ | 10.21 | ||||
58
MICREL, INCORPORATED
NOTES TO CONSOLIDATED FINANCIAL STATEMENTS (Continued)
Years Ended December 31, 2014, 2013 and 2012
At December 31, 2014, the estimated number of RSUs expected to vest was 1.3 million shares with a weighted average remaining contractual life of 2.7 years and an estimated aggregate intrinsic value of $19.2 million. The aggregate intrinsic value of vested RSUs amount to $4.0 million for the year ended December 31, 2014.
Share-based Compensation
The following table shows total share-based compensation expense recognized in the Consolidated Statements of Operations for the years ended December 31, 2014, 2013 and 2012 (in thousands):
Years Ended December 31, | |||||||||||
2014 | 2013 | 2012 | |||||||||
Cost of revenues | $ | 997 | $ | 1,060 | $ | 1,178 | |||||
Research and development | 3,197 | 2,875 | 3,132 | ||||||||
Selling, general and administrative | 3,430 | 3,162 | 3,282 | ||||||||
Pre-tax share-based compensation expense | 7,624 | 7,097 | 7,592 | ||||||||
Less income tax effect | (2,613 | ) | (2,314 | ) | (2,583 | ) | |||||
Net share-based compensation expense | $ | 5,011 | $ | 4,783 | $ | 5,009 | |||||
Total share-based compensation capitalized as part of inventory at both December 31, 2014 and 2013 was $0.2 million, respectively. At December 31, 2014, there was $4.8 million of total unrecognized share-based compensation related to non-vested stock option awards and $10.8 million related to restricted stock units which are expected to be recognized over a weighted-average period of 2.44 years and 2.89 years, respectively.
Employee Stock Purchase Plan
Under the Company’s Employee Stock Purchase Plan (“ESPP”), eligible employees are permitted to have salary withholdings to purchase shares of common stock at a price equal to 95% of the market value of the stock at the end of each three-month offer period, subject to an annual limitation. The ESPP is considered non-compensatory per current share-based compensation accounting guidelines. The aggregate number of shares of common stock which may be issued under the plan shall be no more than 2.0 million shares. Shares of common stock issued under the ESPP during 2014, 2013 and 2012 were less than 0.1 million in each of the years at a weighted average price of $11.43, $9.32 and $9.40 respectively.
10. INCOME TAXES
The income tax provision for the years ended December 31, 2014, 2013 and 2012, as a percentage of income before income taxes, was 19%, 8% and 56%, respectively.
A reconciliation of the statutory federal income tax rate to the effective tax rate for the years ended December 31 was as follows:
2014 | 2013 | 2012 | |||||||
Statutory federal income tax rate | 35 | % | 35 | % | 35 | % | |||
Research and development credit | (14 | ) | (22 | ) | — | ||||
Qualified production activities deduction | (5 | ) | (3 | ) | (4 | ) | |||
State income taxes (net of federal income tax benefit) | — | — | (2 | ) | |||||
Non-deductible stock compensation | — | 1 | 1 | ||||||
Valuation allowance | — | — | 27 | ||||||
Deemed dividend income | — | 3 | — | ||||||
Other * | 3 | (6 | ) | (1 | ) | ||||
Effective tax rate | 19 | % | 8 | % | 56 | % | |||
* Other, in 2014 and 2013, includes foreign tax rate differential, foreign tax credits and other expenditures not deductible for tax purposes which are all individually insignificant.
59
MICREL, INCORPORATED
NOTES TO CONSOLIDATED FINANCIAL STATEMENTS (Continued)
Years Ended December 31, 2014, 2013 and 2012
The provision for income taxes for the years ended December 31, 2014, 2013, and 2012 consisted of the following (in thousands):
2014 | 2013 | 2012 | ||||||||||
Current: | ||||||||||||
Federal | $ | 4,869 | $ | 4,833 | $ | 8,847 | ||||||
State | 78 | (66 | ) | (1,731 | ) | |||||||
Foreign | 544 | 494 | 563 | |||||||||
Total current | 5,491 | 5,261 | 7,679 | |||||||||
Deferred: | ||||||||||||
Federal | (2,179 | ) | (3,698 | ) | (8,489 | ) | ||||||
State | (5 | ) | (31 | ) | 16,901 | |||||||
Foreign | (140 | ) | 52 | (125 | ) | |||||||
Total deferred | (2,324 | ) | (3,677 | ) | 8,287 | |||||||
Total provision | $ | 3,167 | $ | 1,584 | $ | 15,966 | ||||||
Pre-tax income from U.S. and non-U.S. jurisdictions was $16.6 million and less than $0.1 million, respectively, for the year ended December 31, 2014. Pre-tax income from U.S. and non-U.S. jurisdictions was $16.9 million and $2.3 million, respectively, for the year ended December 31, 2013. Pre-tax income from U.S. and non-U.S. jurisdictions was $28.0 million and $0.3 million, respectively, for the year ended December 31, 2012.
Deferred tax assets and liabilities result primarily from temporary differences between book and tax bases of assets and liabilities and state research and development credit carryforwards. The Company had net deferred tax assets of $24.3 million at December 31, 2014. The Company must regularly assess the likelihood that future taxable income levels will be sufficient to ultimately realize the tax benefits of these deferred tax assets. The Company believes that future taxable income levels will be sufficient to realize the tax benefits of net deferred tax assets. Therefore, the Company has not established a valuation allowance except for a valuation allowance of $12.2 million and $9.0 million, respectively, that was established against state deferred assets at December 31, 2014 and 2013 due to California tax law changes in 2012 which require mandatory single sales factor apportionment in California for most multi-state taxpayers for tax years beginning on or after January 1, 2013. Should the Company determine that future realization of these tax benefits is not more likely than not, additional valuation allowances would be established which would increase the Company’s tax provision in the period of such determination.
60
MICREL, INCORPORATED
NOTES TO CONSOLIDATED FINANCIAL STATEMENTS (Continued)
Years Ended December 31, 2014, 2013 and 2012
Deferred tax assets and liabilities at December 31, 2014 and 2013 were as follows (in thousands):
2014 | 2013 | |||||||
Deferred tax assets: | ||||||||
Accruals, reserves and other amounts not currently deductible | $ | 13,034 | $ | 11,346 | ||||
Deferred income | 8,106 | 9,547 | ||||||
Tax credit carryforwards | 12,184 | 9,170 | ||||||
Non-qualified share-based compensation | 6,245 | 6,115 | ||||||
Capitalized research and development | 18 | — | ||||||
Unrealized loss on investments and other | 181 | 278 | ||||||
Gross deferred tax assets | 39,768 | 36,456 | ||||||
Valuation allowance | (12,229 | ) | (8,999 | ) | ||||
Total deferred tax assets | 27,539 | 27,457 | ||||||
Deferred tax liabilities: | ||||||||
Long-lived assets | (3,265 | ) | (5,187 | ) | ||||
Foreign undistributed earnings | (18 | ) | — | |||||
Total deferred tax liability | (3,283 | ) | (5,187 | ) | ||||
Net deferred tax assets (current and non-current) | $ | 24,256 | $ | 22,270 | ||||
Included in net deferred tax assets are credit carryforwards. The Company has available state research and development credit carryforwards of approximately $22.1 million. The state research credit carryforwards are not subject to expiration and may be carried forward indefinitely until utilized.
At December 31, 2014, the gross liability for uncertain tax positions was $7.6 million and the net liability, reduced for the federal effects of potential state tax exposures, was $6.0 million. If these uncertain tax positions are sustained upon tax authority audit, or otherwise become certain, a net $3.5 million would favorably affect the Company’s tax provision in such future periods. The remaining $2.5 million would increase deferred assets on which a valuation allowance is placed and would be expected to also increase the valuation allowance by a corresponding amount. The $3.5 million liability is included in long-term income taxes payable. The Company does not anticipate a significant change to unrecognized tax benefits for uncertain income tax positions within the next 12 months.
The amount of unrecognized tax benefits for the years ended December 31 consisted of the following (in thousands):
2014 | 2013 | 2012 | |||||||||
Beginning balance | $ | 9,433 | $ | 8,259 | $ | 8,532 | |||||
Additions based on tax positions related to the current year | 909 | 762 | 487 | ||||||||
Additions for tax positions related to prior years | 662 | 1,593 | 77 | ||||||||
Subtractions for tax positions related to prior years and settlements of audits | (4,959 | ) | (1,181 | ) | (837 | ) | |||||
Ending balance | $ | 6,045 | $ | 9,433 | $ | 8,259 | |||||
The unrecognized tax benefits presented above include amounts related to potential tax exposures, which are presented net of federal tax benefits.
During 2014, the Company recognized $4.9 million of previously unrecognized tax benefits due to expiration of statutes of limitations and settlement of the California FTB audit.
61
MICREL, INCORPORATED
NOTES TO CONSOLIDATED FINANCIAL STATEMENTS (Continued)
Years Ended December 31, 2014, 2013 and 2012
The Company continues to recognize interest and penalties related to uncertain tax benefits as part of the income tax provision. At December 31, 2014 and 2013, the Company had $0.3 million and $0.3 million, respectively, accrued for interest and none accrued for penalties for both years. These accruals were included as a component of long-term income taxes payable for $3.5 million and reduction of prepaid taxes of less than $0.1 million at December 31, 2014.
The Company is required to file U.S. federal income tax returns as well as income tax returns in various states and foreign jurisdictions. The Company may be subject to examination by the Internal Revenue Service (“IRS”) for calendar years 2010 and forward. Significant state tax jurisdictions include California and Texas, and generally, the Company is subject to routine examination for years 2008 and forward in these jurisdictions. In addition, any research and development credit carryforwards that were generated in prior years and utilized in these years may also be subject to examination by respective state taxing authorities. Generally, the Company is subject to routine examination for years 2007 and forward in various immaterial foreign tax jurisdictions in which it operates.
11. | ACCRUED LIABILITIES |
Accrued liabilities consisted of the following (in thousands):
December 31, 2014 | December 31, 2013 | ||||||
Accrued compensation | $ | 7,050 | $ | 5,767 | |||
Accrued commissions | 1,605 | 1,666 | |||||
Accrued restructuring | 360 | 902 | |||||
Other accrued liabilities | 3,854 | 4,539 | |||||
Total accrued liabilities | $ | 12,869 | $ | 12,874 | |||
12. | COMMITMENTS AND CONTINGENCIES |
Lease Agreements
The Company leases some of its facilities and equipment under operating lease agreements that expire in the years 2015 through 2019. Rent expense is recognized on a straight-line basis over the term of the lease.
Future minimum payments under these agreements are as follows (in thousands):
Year Ending December 31, | |||
2015 | $ | 960 | |
2016 | 526 | ||
2017 | 420 | ||
2018 | 120 | ||
2019 | 21 | ||
Total | $ | 2,047 | |
Rent expense under operating leases for each of the years ended December 31, 2014, 2013 and 2012 was $1.1 million.
Open Purchase Orders
At December 31, 2014, the Company had approximately $19.4 million in open purchase orders. Open purchase orders are defined as agreements to purchase goods or services that are enforceable and legally binding and that specify all significant terms, including: fixed or minimum quantities to be purchased; fixed, minimum or variable pricing provisions; and the approximate timing of the transactions. These obligations primarily relate to future purchases of wafer fabrication raw materials, foundry wafers, assembly and testing services and manufacturing equipment. The amounts are based on the Company’s contractual commitments.
62
MICREL, INCORPORATED
NOTES TO CONSOLIDATED FINANCIAL STATEMENTS (Continued)
Years Ended December 31, 2014, 2013 and 2012
Letters of Credit
Micrel’s borrowing arrangements include a provision for the issuance of commercial or standby letters of credit by the bank on behalf of the Company. At December 31, 2014, there was $0.3 million in letters of credit outstanding. The letters of credit are issued to guarantee payments for the Company’s workers compensation program.
Indemnification Obligations
Micrel is a party to a variety of contractual relationships pursuant under which it may be obligated to indemnify the other party with respect to certain matters. Typically, these obligations arise in the context of contracts entered into by Micrel, for regular sales and purchasing activities, under which Micrel may agree to hold the other party harmless against losses arising from claims related to such matters as title to assets sold, certain intellectual property rights, specified environmental matters, certain income taxes, etc. In these circumstances, indemnification by Micrel is customarily conditioned on the other party making a claim pursuant to the procedures specified in the particular contract or in Micrel’s standard terms and conditions, which procedures may allow Micrel to challenge the other party’s claims, or afford Micrel the right to settle such claims in its sole discretion. Further, Micrel’s obligations under these agreements may be limited in terms of time and/or amount, and in some instances, Micrel may have recourse against third parties for certain payments made by it under these agreements.
It is not possible to predict the maximum potential amount of future payments or indemnification costs under these or similar agreements due to the conditional nature of Micrel’s obligations and the unique facts and circumstances involved in each particular agreement. Historically, payments made by Micrel under these agreements have not had a material effect on its business, financial condition, cash flows, or results of operations.
Legal Matters
On November 1, 2008, Nadatel Co., Ltd. (“Nadatel”), a video surveillance equipment supplier based in Seoul Korea, filed a complaint against the Company for product liability and tort-based damages with the Seoul Central District Court in Seoul, Korea. In 2006 and 2007, Nadatel purchased approximately 17,000 of the Company’s low-dropout voltage regulators for use in its closed circuit television digital video recorder application for security systems. Nadatel claimed that the parts failed in the field, resulting in malfunction of its application, recall of the application and replacement of circuit boards incorporating the Company’s part. The Company settled this claim in June 2012 pursuant to a court-mediated agreement without admitting to liability or product defects. Despite the Company’s assessment that the claims asserted by Nadatel are untrue, it settled this protracted litigation in order to avoid further legal expense and distraction. The settlement amount of approximately $0.2 million was recorded in June 2012 as a component of selling, general and administrative expenses for the year ended December 31, 2012.
Additional claims may arise against the Company in its normal course of business. Generally, litigation is subject to inherent uncertainties, and the Company can provide no assurance that it will prevail in any particular lawsuit. Accordingly, litigation could result in substantial costs and diversion of resources and could have a material adverse effect on the Company’s financial condition, results of operations or cash flows. At December 31, 2014, the Company has not recorded any accrual for contingent liabilities associated with legal proceedings on the assessment that liabilities are not probable. Further, ranges of possible losses in these matters cannot be reasonably estimated at this time.
13. | PROFIT-SHARING 401(k) PLAN |
The Company has a profit-sharing and deferred compensation plan (the “Plan”). All employees completing one month of service are eligible to participate in the Plan. Participants may contribute 1% to 15% of their annual compensation on a before tax basis, subject to Internal Revenue Service limitations. Profit-sharing contributions by the Company are determined at the discretion of the Board of Directors. The Company accrued $0.4 million in contributions for the year ended December 31, 2014 and made $0.2 million and $0.4 million in contributions to the Plan for the years ended December 31, 2013 and 2012, respectively. Participants vest in the Company’s contributions ratably over six years of service.
14. SEGMENT REPORTING
The Company currently operates in one segment: the design, manufacturing, marketing and sale of semiconductor products.
63
MICREL, INCORPORATED
NOTES TO CONSOLIDATED FINANCIAL STATEMENTS (Continued)
Years Ended December 31, 2014, 2013 and 2012
For the year ended December 31, 2014, no OEM customer accounted for more than 10% of the Company’s net revenues and distributors A and B accounted for 25% and 18% of the Company’s net revenues, respectively. For the year ended December 31, 2013, no OEM customer accounted for more than 10% of the Company’s net revenues and distributors A and B accounted for 29% and 17% of the Company’s net revenues, respectively. For the year ended December 31, 2012, one OEM customer accounted for 10% of the Company’s net revenues and distributors A and B accounted for 22% and 15% of the Company’s net revenues, respectively. The increase in percentage of revenue from our largest distributor from 2012 to 2013 was primarily due to its acquisition and integration of one of our other significant distributors in 2013.
The Company recorded revenue from customers located throughout the United States; Canada and Mexico (collectively referred to as “Other North American Countries”); the United Kingdom, Italy, Germany, France, Israel, Sweden, Hungary, Austria, Finland, Switzerland, and other European countries (collectively referred to as “Europe”); Korea; Taiwan; Singapore; China; Japan; Hong Kong; and Malaysia and other Asian countries (collectively referred to as “Other Asian Countries”). Revenues by major geographic area are based on the geographic location of the OEMs or the distributors who have purchased the Company’s products. The geographic locations of the Company’s distributors may be different from the geographic locations of the end customers.
Geographic Information (in thousands): | ||||||||||||||||||||||||
Years Ended December 31, | ||||||||||||||||||||||||
2014 | 2013 | 2012 | ||||||||||||||||||||||
Total Net Revenues | Long-Lived Assets (1) | Total Net Revenues | Long-Lived Assets(1) | Total Net Revenues | Long-Lived Assets (1) | |||||||||||||||||||
United States of America | $ | 55,574 | $ | 50,125 | $ | 62,667 | $ | 48,432 | $ | 66,267 | $ | 51,715 | ||||||||||||
Other North American Countries | 176 | — | 144 | — | 193 | — | ||||||||||||||||||
Korea | 23,324 | 9 | 28,050 | 16 | 36,896 | 24 | ||||||||||||||||||
Taiwan | 25,114 | 3,093 | 23,503 | 2,956 | 22,507 | 3,492 | ||||||||||||||||||
Singapore | 31,899 | 9 | 26,353 | 9 | 23,899 | 8 | ||||||||||||||||||
China | 16,073 | 1,684 | 15,873 | 2,424 | 16,183 | 1,417 | ||||||||||||||||||
Hong Kong | 43,060 | 60 | 33,881 | 86 | 37,300 | 215 | ||||||||||||||||||
Japan | 16,582 | 2 | 14,686 | 23 | 14,329 | 1 | ||||||||||||||||||
Other Asian Countries | 1,377 | 5,447 | 1,259 | 3,727 | 1,284 | 3,717 | ||||||||||||||||||
Europe | 34,415 | 24 | 30,664 | 106 | 31,254 | 103 | ||||||||||||||||||
Total | $ | 247,594 | $ | 60,453 | $ | 237,080 | $ | 57,779 | $ | 250,112 | $ | 60,692 | ||||||||||||
__________
(1) Long-lived assets consist of property, plant and equipment.
15. DIVIDENDS
During the years ended December 31, 2014, 2013 and 2012, the Company paid cash dividends of $11.3 million, $8.2 million and $12.1 million, respectively, representing $0.20, $0.1425 and $0.205 per common share, respectively.
Cash dividends per common share for the year ended December 31, 2012 included an accelerated cash dividend of $0.0425 per share of common stock totaling $2.5 million paid on December 27, 2012 to shareholders of record at December 18, 2012. The accelerated dividend was in lieu of the quarterly dividend that the Company would have otherwise announced with its quarterly financial results for the fourth quarter of 2012, and that would have been paid in the first quarter of 2013.
64
MICREL, INCORPORATED
NOTES TO CONSOLIDATED FINANCIAL STATEMENTS (Continued)
Years Ended December 31, 2014, 2013 and 2012
16. RESTRUCTURING CHARGES
In 2014, the Company continued its efforts to reduce operating expenses. Therefore, the Company recorded restructuring charges of $1.0 million related to workforce reductions and facility closure. The Company paid $1.5 million related to severance costs in the year ended December 31, 2014 and expects to pay the remaining amount accrued in 2015, which is included in accrued liabilities on the consolidated balance sheet. In 2013, the Company recorded restructuring charges of $1.4 million related to workforce reductions. The following table summarizes the activity related to the accrual for restructuring charges for the year ended December 31, 2014 and 2013 by event (in thousands):
Plan Initiated in Q4'13 | Plan Initiated in Q3'14 | Plan Initiated in Q4'14 | Total | ||||||||||||
Restructuring charges | $ | 1,376 | $ | 1,376 | |||||||||||
Payments | (474 | ) | (474 | ) | |||||||||||
Balance at December 31, 2013 | 902 | 902 | |||||||||||||
Restructuring charges | — | 631 | 361 | 992 | |||||||||||
Payments | (882 | ) | (560 | ) | (92 | ) | (1,534 | ) | |||||||
Balance at December 31, 2014 | $ | 20 | $ | 71 | $ | 269 | $ | 360 | |||||||
17. SUBSEQUENT EVENT
On January 29, 2015, the Company’s Board of Directors declared a cash dividend of $0.05 per share of common stock, payable on February 25, 2015 to shareholders of record as of February 11, 2015.
65
SUPPLEMENTAL QUARTERLY FINANCIAL SUMMARY — UNAUDITED
(in thousands, except per share amounts) | Three Months Ended 2014 | |||||||||||||||
March 31, | June 30, | Sept. 30, | Dec. 31, | |||||||||||||
Net revenues | $ | 59,857 | $ | 62,339 | $ | 67,480 | $ | 57,918 | ||||||||
Gross profit | $ | 31,219 | $ | 32,791 | $ | 34,408 | $ | 29,610 | ||||||||
Net income (1) | $ | 2,289 | $ | 3,529 | $ | 4,675 | $ | 3,054 | ||||||||
Net income per share: | ||||||||||||||||
Basic (1) | $ | 0.04 | $ | 0.06 | $ | 0.08 | $ | 0.05 | ||||||||
Diluted (1) | $ | 0.04 | $ | 0.06 | $ | 0.08 | $ | 0.05 | ||||||||
Weighted-average shares used in computing per share amounts: | ||||||||||||||||
Basic | 56,388 | 56,537 | 56,642 | 56,490 | ||||||||||||
Diluted | 57,208 | 57,448 | 57,708 | 57,710 | ||||||||||||
Cash dividends per common share | $ | 0.05 | $ | 0.05 | $ | 0.05 | $ | 0.05 | ||||||||
(in thousands, except per share amounts) | Three Months Ended 2013 | |||||||||||||||
March 31, | June 30, | Sept. 30, | Dec. 31, | |||||||||||||
Net revenues | $ | 59,733 | $ | 59,171 | $ | 58,169 | $ | 60,007 | ||||||||
Gross profit | $ | 31,080 | $ | 31,082 | $ | 29,471 | $ | 30,413 | ||||||||
Net income (2) | $ | 5,245 | $ | 5,035 | $ | 4,004 | $ | 3,364 | ||||||||
Net income: | ||||||||||||||||
Basic (2) | $ | 0.09 | $ | 0.09 | $ | 0.07 | $ | 0.06 | ||||||||
Diluted (2) | $ | 0.09 | $ | 0.09 | $ | 0.07 | $ | 0.06 | ||||||||
Weighted-average shares used in computing per share amounts: | ||||||||||||||||
Basic | 58,270 | 58,303 | 57,752 | 56,908 | ||||||||||||
Diluted | 59,030 | 59,007 | 58,440 | 57,546 | ||||||||||||
Cash dividends per common share | $ | — | $ | 0.0425 | $ | 0.05 | $ | 0.05 | ||||||||
__________
(1) During the third and fourth quarter of 2014, the Company recorded a restructuring charge of $0.5 million and $0.5 million for employee severances and facility closure, respectively.
(2) During the fourth quarter of 2013, the Company recorded a restructuring charge of $1.4 million for employee severances.
66
SCHEDULE II
MICREL, INCORPORATED
VALUATION AND QUALIFYING ACCOUNTS
For the Years Ended December 31, 2014, 2013, and 2012
(In thousands)
Description | Balance at Beginning of Year | Allowance Additions or (Reductions) | Returns and Price Adjustments | Bad Debt Write-offs | Balance at End of Year | |||||||||||||||
Year Ended December 31, 2014 | ||||||||||||||||||||
Allowances for OEM and sell-in distributor returns and price adjustments | $ | 737 | $ | 1,970 | $ | (1,889 | ) | $ | — | $ | 818 | |||||||||
Allowances for unclaimed sell-through distributor price adjustments (1) | — | 64,530 | (64,397 | ) | — | 133 | ||||||||||||||
Allowances for doubtful accounts | 23 | 114 | — | (30 | ) | 107 | ||||||||||||||
Total allowances | $ | 760 | $ | 66,614 | $ | (66,286 | ) | $ | (30 | ) | $ | 1,058 | ||||||||
Year Ended December 31, 2013 | ||||||||||||||||||||
Allowances for OEM and sell-in distributor returns and price adjustments | $ | 712 | $ | 1,954 | $ | (1,929 | ) | $ | — | $ | 737 | |||||||||
Allowances for unclaimed sell-through distributor price adjustments (1) | 51 | 77,129 | (77,180 | ) | — | — | ||||||||||||||
Allowances for doubtful accounts | 49 | (26 | ) | — | — | 23 | ||||||||||||||
Total allowances | $ | 812 | $ | 79,057 | $ | (79,109 | ) | $ | — | $ | 760 | |||||||||
Year Ended December 31, 2012 | ||||||||||||||||||||
Allowances for OEM and sell-in distributor returns and price adjustments | $ | 1,066 | $ | 1,452 | $ | (1,806 | ) | $ | — | $ | 712 | |||||||||
Allowances for unclaimed sell-through distributor price adjustments (1) | 169 | 73,674 | (73,792 | ) | — | 51 | ||||||||||||||
Allowances for doubtful accounts | 59 | (10 | ) | — | — | 49 | ||||||||||||||
Total allowances | $ | 1,294 | $ | 75,116 | $ | (75,598 | ) | $ | — | $ | 812 | |||||||||
___________
(1) The Company estimates and records an allowance for sell-through distributor price adjustments for which the specific resale transaction has been completed, but the price adjustment claim has not yet been received from the sell-through distributor. This allowance typically represents approximately one to three weeks of unclaimed price adjustments.
67
SIGNATURES
Pursuant to the requirements of Section 13 or 15(d) of the Securities and Exchange Act of 1934, the registrant has duly caused this Report to be signed on its behalf by the undersigned, thereunto duly authorized, in San Jose, California on February 24, 2015.
MICREL, INCORPORATED | ||
By | /s/ Raymond D. Zinn | |
Raymond D. Zinn | ||
President and Chief Executive Officer | ||
POWER OF ATTORNEY
KNOW ALL PERSONS BY THESE PRESENTS, that each person whose signature appears below constitutes and appoints Raymond D. Zinn and Robert E. DeBarr, and each of them, his attorneys-in-fact, each with the power of substitution, for him in any and all capacities, to sign any amendments to this Report on Form 10-K and to file the same, with exhibits thereto and other documents in connection therewith, with the Securities and Exchange Commission, hereby ratifying and confirming all that each of said attorneys-in-fact, or his substitute or substitutes, may do or cause to be done by virtue hereof.
Pursuant to the requirements of the Securities Exchange Act of 1934, as amended, this Report has been signed below by the following persons on behalf of the registrant and in the capacities and on the date indicated.
Signature | Title | Date |
/s/ Raymond D. Zinn | President, Chief Executive Officer and Chairman of the Board of Directors | February 24, 2015 |
Raymond D. Zinn | (Principal Executive Officer) | |
/s/ Robert E. DeBarr | Chief Financial Officer and Vice President of Finance and Human Resources | February 24, 2015 |
Robert E. DeBarr | (Principal Financial and Accounting Officer) | |
/s/ John E. Bourgoin | Director | February 24, 2015 |
John E. Bourgoin | ||
/s/ Daniel Heneghan | Director | February 24, 2015 |
Daniel Heneghan | ||
/s/ Robert R. Herb | Director | February 24, 2015 |
Robert R. Herb | ||
/s/ Neil J. Miotto | Director | February 24, 2015 |
Neil J. Miotto | ||
/s/ Frank W. Schneider | Director | February 24, 2015 |
Frank W. Schneider | ||
68
Micrel, Incorporated |
Exhibits Pursuant to Item 601 of Regulation S-K |
Exhibit Number | Description |
3.1 | Amended and Restated Articles of Incorporation of the Registrant. (1) |
3.2 | Certificate of Amendment of Articles of Incorporation of the Registrant. (2) |
3.3 | Amended and Restated Bylaws of the Registrant. (8) |
3.4 | Certificate of Amendment of Articles of Incorporation of the Registrant. (4) |
3.5 | Certificate of Determination of Series A Participating Preferred Stock of Micrel, Incorporated, classifying and designating the Series A Participating Preferred Stock, as filed March 28, 2008 with the Secretary of State of the State of California. (10) |
3.6 | Certificate of Amendment to the Bylaws of the Company, dated April 2, 2008. (11) |
3.7 | Certificate of Amendment to the Bylaws of the Company, dated April 22, 2008. (12) |
3.8 | Certificate of Amendment to the Bylaws of the Company, dated January 8, 2010. (14) |
4.1 | Certificate for Shares of Registrant’s Common Stock. (3) |
10.1 | Indemnification Agreement between the Registrant and each of its officers and directors. (3)* |
10.2 | 1994 Stock Option Plan and form of Stock Option Agreement. (1)* |
10.3 | 2003 Incentive Award Plan. (5)* |
10.4 | 2006 Employee Stock Purchase Plan. (7)* |
10.5 | 2012 Equity Incentive Award Plan. (17)* |
10.6 | Micrel, Incorporated 2012 Equity Incentive Award Plan Non-Employee Director Equity Compensation Policy adopted May 22, 2014 (19)* |
10.7 | Form of Domestic Distribution Agreement. (2) |
10.8 | Form of International Distributor Agreement. (2) |
10.9 | Micrel/IBM Patent License Agreement, dated September 26, 2006. (9) |
10.10 | Credit Agreement, dated as of May 7, 2009, by and between Bank of the West and Micrel, Incorporated. (13) |
10.11 | Change of Control and Severance Agreement, by and between Mansour Izadinia and Micrel Incorporated, dated March 1, 2011. (15)* |
10.12 | First Amendment entered into as of April 22, 2011 to the Credit Agreement, dated as of May 7, 2009, by and between Bank of the West and Micrel, Incorporated. (16) |
10.13 | Second Amendment entered into as of April 19, 2013 to the Credit Agreement, dated as of May 7, 2009, by and between Bank of the West and Micrel, Incorporated. (20) |
10.14 | Offer Letter, by and between Micrel Incorporated and Robert E. DeBarr, dated October 2, 2013. (18)* |
10.15 | Change of Control and Severance Agreement, by and between Raymond D. Zinn and Micrel Incorporated, dated February 28, 2014.* (20) |
10.16 | Form of Change of Control and Severance Agreement with certain officers including named executive officers.* (21) |
14.1 | Micrel, Incorporated Code of Ethics for Senior Officers. (6) |
21.1 | Subsidiaries of the Registrant. |
23.1 | Consent of Independent Registered Public Accounting Firm - KPMG LLP. |
23.2 | Consent of Independent Registered Public Accounting Firm - PricewaterhouseCoopers LLP. |
24.1 | Power of Attorney. (See Signature Page) |
31 | Certification of the Company’s Chief Executive Officer and Chief Financial Officer Pursuant to Section 302 of the Sarbanes-Oxley Act of 2002. |
32 | Certification of the Company’s Chief Executive Officer and Chief Financial Officer Pursuant to Section 906 of the Sarbanes-Oxley Act of 2002. ** |
101.INS | XBRL Instance Document. |
101.SCH | XBRL Taxonomy Extension Schema Document. |
69
101.CAL | XBRL Taxonomy Extension Calculation Linkbase Document. |
101.DEF | XBRL Taxonomy Extension Definition Linkbase Document. |
101.LAB | XBRL Taxonomy Extension Label Linkbase Document. |
101.PRE | XBRL Taxonomy Extension Presentation Linkbase Document. |
__________
* | Management contract or compensatory plan or agreement. |
** | This certification accompanies this Report pursuant to Section 906 of the Sarbanes-Oxley Act of 2002 and shall not be deemed “filed” by the Company for purposes of Section 18 of the Securities Exchange Act of 1934, as amended. |
(1) | Incorporated herein by reference to the Company’s Registration Statement on Form S-1 (“Registration Statement”), File No. 33-85694, in which this exhibit bears the same number, unless otherwise indicated. |
(2) | Incorporated by reference to Amendment No. 1 to the Registration Statement, in which this exhibit bears the same number, unless otherwise indicated. |
(3) | Incorporated by reference to the Company’s Annual Report on Form 10-K for the year ended December 31, 1995, in which this exhibit bears the same number, unless otherwise indicated. |
(4) | Incorporated by reference to exhibit 3.1 filed with the Company’s Quarterly Report on Form 10-Q for the period ended September 30, 2000. |
(5) | Incorporated by reference to exhibit 1 filed with the Company’s Proxy Statement on Schedule 14A dated May 9, 2003. |
(6) | Incorporated by reference to exhibit 14.1 filed with the Company’s Annual Report on Form 10-K for the year ended December 31, 2003. |
(7) | Incorporated by reference to appendix A filed with the Company’s Definitive Proxy Statement on Schedule 14A dated April 19, 2006. |
(8) | Incorporated by reference to exhibit 3.3 filed with the Company’s Quarterly Report on Form 10-Q for the period ended September 30, 2006. |
(9) | Incorporated by reference to exhibit 10.17 filed with the Company’s Quarterly Report on Form 10-Q for the period ended September 30, 2006. |
(10) | Incorporated by reference to exhibit 3.5 filed with the Company’s Current Report on Form 8-K dated March 24, 2008. |
(11) | Incorporated by reference to exhibit 3.1 filed with the Company’s Current Report on Form 8-K dated April 7, 2008. |
(12) | Incorporated by reference to exhibit 3.1 filed with the Company’s Current Report on Form 8-K dated April 22, 2008. |
(13) | Incorporated by reference to exhibit 10.1 filed with the Company’s Current Report on Form 8-K dated May 7, 2009. |
(14) | Incorporated by reference to exhibit 3.7 filed with the Company’s Annual Report on Form 10-K for the year ended December 31, 2009. |
(15) | Incorporated by reference to exhibit 10.1 filed with the Company’s Quarterly Report on Form 10-Q for the period ended March 31, 2011. |
(16) | Incorporated by reference to exhibit 10.1 filed with the Company’s Current Report on Form 8-K dated April 22, 2011. |
(17) | Incorporated by reference to appendix A filed with the Company’s Definitive Proxy Statement on Schedule 14A dated April 5, 2012. |
(18) | Incorporated by reference to exhibit 10.1 filed with the Company’s Current Report on Form 8-K dated October 2, 2013. |
(19) | Incorporated by reference to exhibit 10.1 filed with the Company's Quarterly Report on Form 10-Q/A for the period ended June 30, 2014. |
(20) | Incorporated by reference to exhibit 10.18 filed with the Company's Annual Report on Form 10-K for the year ended December 31, 2013. |
(21) | Incorporated by reference to exhibit 10.19 filed with the Company's Annual Report on Form 10-K for the year ended December 31, 2013. |
70