Attached files
| file | filename |
|---|---|
| 8-K - 8-K - CVR Refining, LP | cvrr8-kfebruary2015investo.htm |

Investor Presentation February 2015
Forward Looking Statements The following presentation contains forward-looking statements based on management’s current expectations and beliefs, as well as a number of assumptions concerning future events. The assumptions and estimates underlying forward-looking statements are inherently uncertain and, although considered reasonable as of the date of preparation by the management team of our general partner, are subject to a wide variety of significant business, economic, and competitive risks and uncertainties that could cause actual results to differ materially from those contained in the prospective information. Accordingly, there can be no assurance that we will achieve the future results we expect or that actual results will not differ materially from expectations. You are cautioned not to put undue reliance on such forward-looking statements (including forecasts and projections regarding our future performance) because actual results may vary materially from those expressed or implied as a result of various factors, including, but not limited to those set forth under “Risk Factors” in CVR Refining, LP’s Annual Report on Form 10-K, Quarterly Reports on Form 10-Q and any other filings CVR Refining, LP makes with the Securities and Exchange Commission. CVR Refining, LP assumes no obligation to, and expressly disclaims any obligation to, update or revise any forward-looking statements, whether as a result of new information, future events or otherwise, except as required by law. 2
Key Investment Highlights High Quality Assets − Scale and no single asset risk − Complementary logistics assets − High complexity refineries Strategically Located − Access to price-advantaged crudes – 100% of crude purchased is priced with reference to WTI Strong Financial Profile − Debt service is priority and paid before distributions − Provides flexibility to capitalize on mergers and acquisitions Growth Opportunities − Organic growth potential in logistics business − Potential to improve the operational flexibility and profitability of the refineries Experienced Management Team 3

Company Overview Canada TX AR OK MO IA NE SD ND WY MT UT MN IL Houston Shidler Kansas City Cushing Midland Des Moines Sioux Falls Sioux City Oklahoma City Tulsa Topeka Basin Pipeline Wichita Falls CO KS Plainville Phillipsburg Jayhawk Pipeline Denver Clearbrook Flanagan NM Bakken WI DJ Basin Salt Lake City Jackson Anadarko Basin (Miss Lime) Columbia Freeport Sugar Land Wichita Coffeyville Permian Basin LA Omaha Bartlesville 4 Wynnewood Refinery CVR Refining Crude Transportation CVR Refining Crude Oil Pipeline Third-Party Crude Oil Pipeline CVR Refining Headquarters Other PADD II Group 3 refineries Coffeyville Refinery Legend Company Overview Key Metrics 2005 2014 Number of Refineries 1 2 Total Crude Throughput bpd 91,100 196,545 Complexity 10.3 13.0 Distillate Yield 38.7% 41.9% Gathered Barrels 7,000 59,000 Feedstock Flexibility - Heavy Sour bpd 0 up to 25,000

High Quality Assets CVR Refining 185,000 bpcd of rated crude throughput capacity 13.0 blended complexity Located in Group 3 of the PADD II region Coffeyville Refinery Wynnewood Refinery 115,000 bpcd of rated crude throughput capacity • 13.3 complexity • Access to cost-advantaged, WTI price-linked crude oils (100% of crude slate) – local and Canadian 70,000 bpcd of rated crude throughput capacity • 12.6 complexity • Access to local cost-advantaged, WTI price- linked crude oils (100% of crude slate) Crude oil throughput (1) Production (1) Crude oil throughput (1) Production (1) 119,704 bpd 131,697 bpd 76,841 bpd 77,366 bpd (1) For the year ended December 31, 2014. (2) Other includes pet coke, NGLs, slurry, sulfur and gas oil, excludes internally produced fuel. (3) Other includes asphalt, NGL’s, slurry, sulfur, gas oil and specialty products such as propylene and solvents, excludes internally produced fuel. (4) Includes 5.0% by volume used as blendstock. Heavy Sour 12.9% Light/Medium Sour 1.0% Sweet 86.1% Other (2) 8.6% Distillate 42.8% Gasoline (4) 48.6% Light/Medium Sour 1.0% Sweet 99.0% Other (3) 10.1% Gasoline 49.5% Distillate 40.4% 5

Favorable high distillate yield (2) Low cost operator (operating expenses in $/bbl) (2) (3) Source: EIA and publicly available data (1) PADD II consolidated refinery statistics. (2) For the year ended December 31, 2014 for CVRR and TSO. For the last twelve months ended September 30, 2014 for HFC, NTI and WNR, Q4 not yet reported (3) Operating expenses calculated on a per barrel of crude throughput excluding SG&A and direct turnaround expenses. 6 “Top quartile” consolidated asset profile (1) (continued) High Quality Assets Median Rated Capacity 185.0

Marketing Network Supply Network Strategically Located Mid-Con Refineries 7

Source: Canadian Association of Petroleum Producers, “Crude Oil Forecast, Markets & Transportation, June 2014 Note: Oil sands production numbers are a combination of upgraded crude oil and bitumen. Production from off-site upgrading projects are included in the production numbers as bitumen. Increasing domestic and Canadian crude oil production Regional Play Oil and NGL Forecasts Western Canada Crude Oil Forecasts Historical Forecast (MMbpd) (MMbpd) Historical Forecast Source: EIA.gov Annual Energy Outlook as of May 2014: . Canadian production currently exceeds existing transportation capacity south to the U.S. Currently capable of gathering +/- 60,000 bpd of crudes from our gathering area at a discount to WTI Crude Advantage Sustainable Long-Term 8
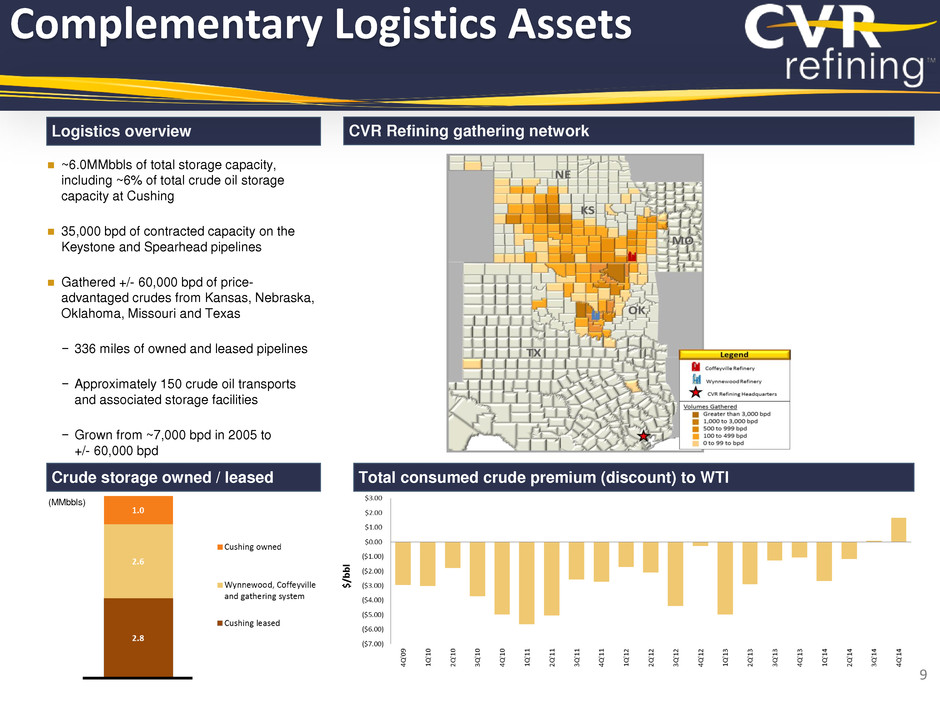
Logistics overview CVR Refining gathering network ~6.0MMbbls of total storage capacity, including ~6% of total crude oil storage capacity at Cushing 35,000 bpd of contracted capacity on the Keystone and Spearhead pipelines Gathered +/- 60,000 bpd of price- advantaged crudes from Kansas, Nebraska, Oklahoma, Missouri and Texas − 336 miles of owned and leased pipelines − Approximately 150 crude oil transports and associated storage facilities − Grown from ~7,000 bpd in 2005 to +/- 60,000 bpd Crude storage owned / leased Total consumed crude premium (discount) to WTI (MMbbls) Complementary Logistics Assets 9
Financial Overview 10

Key Investment Highlights Distributions Capital Structure Liquidity Management The $500.0 million of Notes are unsecured Debt covenants allow for distributions when fixed charge coverage ratio is 2.5x or higher $250 million senior unsecured credit facility with CVR Energy to fund growth capex program As of December 31, 2014, the cash balance at CVRR was $370 million Strong liquidity through committed credit facilities ($400 million ABL) Intermediation arrangement with Vitol reduces working capital requirements 11 Q4 2014 distribution of $0.37 per common unit Variable distribution with no MQD and no IDRs – 100% of available cash to be distributed Debt service is priority and paid before distributions Cash is reserved ratably for environmental and maintenance capital and anticipated turnaround costs associated with both refineries

Refinery crude throughput Refining gross margin (1) Pro forma for Wynnewood acquisition Pro forma for Wynnewood acquisition NYMEX 2-1-1 Crack Spread Adjusted EBITDA (2) Pro forma for Wynnewood acquisition Source: Company filings. Note: 2010 numbers for Coffeyville only. (1) Refining margin per crude oil throughput barrel adjusted for FIFO impact. Calculated as the difference between net sales and cost of product sold (exclusive of depreciation and amortization) adjusted for FIFO impact. (2) Represents EBITDA adjusted for FIFO impact, non-cash share-based compensation, loss on extinguishment of debt, major scheduled turnaround expenses, Wynnewood acquisition transaction fees and integration expenses, loss on disposition of assets and gains and losses on derivatives not settled. (mbpd) ($/bbl) ($ in millions) ($/bbl) Pro forma for Wynnewood acquisition Historical Financial Summary 12

Refinery crude throughput Refining gross margin (1) NYMEX 2-1-1 Crack Spread Source: Company filings. (1) Refining margin per crude oil throughput barrel adjusted for FIFO impact. Calculated as the difference between net sales and cost of product sold (exclusive of depreciation and amortization) adjusted for FIFO impact. (2) Represents EBITDA adjusted for FIFO impact, non-cash share-based compensation, loss on extinguishment of debt, major scheduled turnaround expenses, loss on disposition of assets and gains and losses on derivatives not settled. (mbpd) ($/bbl) ($ in millions) ($/bbl) Adjusted EBITDA (2) and Available Cash for Distribution Q3 Financial Summary 13

Hedging provides protection in a downside scenario Hedged an average of ~38,600 bpd of production in 2015 − Crack spreads hedged at an average $22.00/bbl for 2015 Hedging Summary(1) (1) Hedged crack spreads represent weighted-average price of all positions for respective quarters. Data as of February 20, 2015 Hedging Policy Locks in Attractive Spreads 14 Q1 ‘15 avg. $ 25.71 Q1 ‘15 avg. $24.01
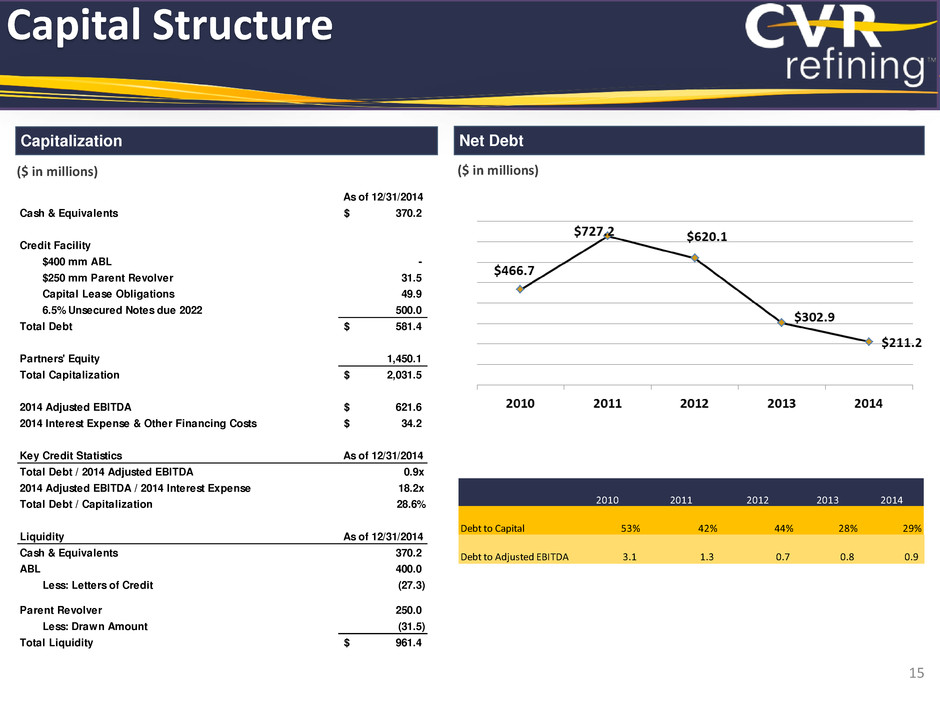
Capitalization Net Debt ($ in millions) ($ in millions) Capital Structure 15 2010 2011 2012 2013 2014 Debt to Capital 53% 42% 44% 28% 29% Debt to Adjusted EBITDA 3.1 1.3 0.7 0.8 0.9 As of 12/31/2014 Cash & Equivalents 370.2$ Credit Facility $400 mm ABL - $250 mm Parent Revolver 31.5 Capital Lease Obligations 49.9 6.5% Unsecured Notes due 2022 500.0 Total Debt 581.4$ Partners' Equity 1,450.1 Total Capitalization 2,031.5$ 2014 Adjusted EBITDA 621.6$ 2014 Interest Expense & Other Financing Costs 34.2$ Key Credit Statistics As of 12/31/2014 Total Debt / 2014 Adjusted EBITDA 0.9x 2014 Adjusted EBITDA / 2014 Interest Expense 18.2x Total Debt / Capitalization 28.6% Liquidity As of 12/31/2014 Cash & Equivalents 370.2 ABL 400.0 Less: Letters of Credit (27.3) Parent Revolver 250.0 Less: Drawn Amount (31.5) Total Liquidity 961.4$
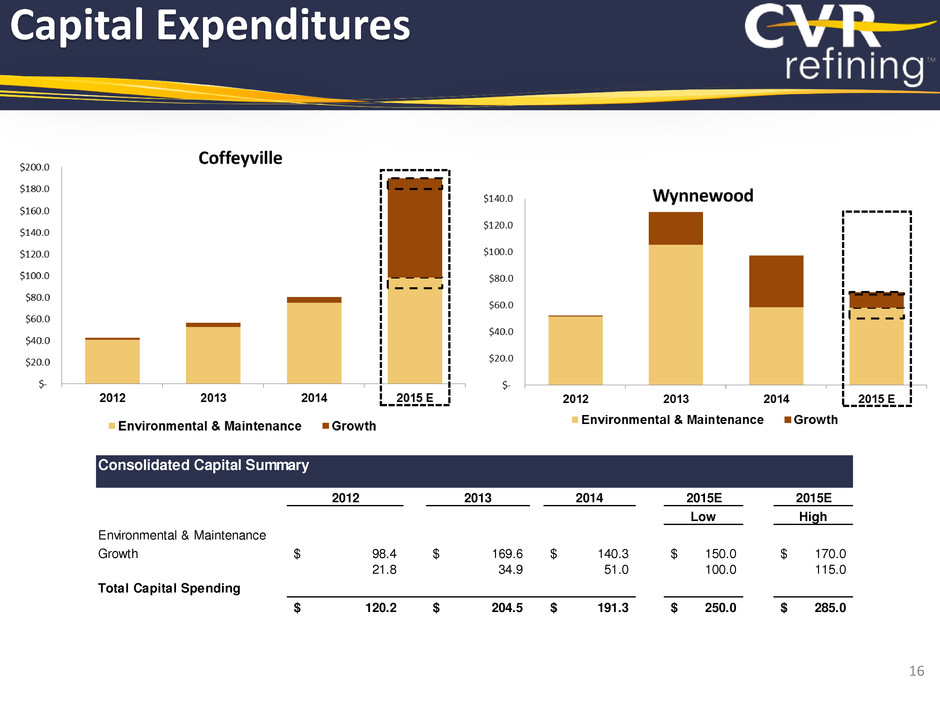
Capital Expenditures 16 Consolidated Capital Summary 2012 2013 2014 2015E 2015E Low High Environmental & Maintenance Growth 98.4$ 169.6$ 140.3$ 150.0$ 170.0$ 21.8 34.9 51.0 100.0 115.0 Total Capital Spending 120.2$ 204.5$ 191.3$ 250.0$ 285.0$

Available Cash Calculation 17 Three Months Ended December 31, 2014 (in millions, except per unit data) Reconcilation of Adjusted EBITDA to Available cash for distribtution Adjusted EBITDA 104.6$ Adjustments: Less: Cash needs for debt service (10.0) Reserves for environmental and maintenance capital expenditures (31.2) Reserves for future turnarounds (8.7) Available cash for distribution 54.7$ Available cash for distribution, per unit 0.37$ Common Units oustanding (in thousands) 147,600

Appendix 18
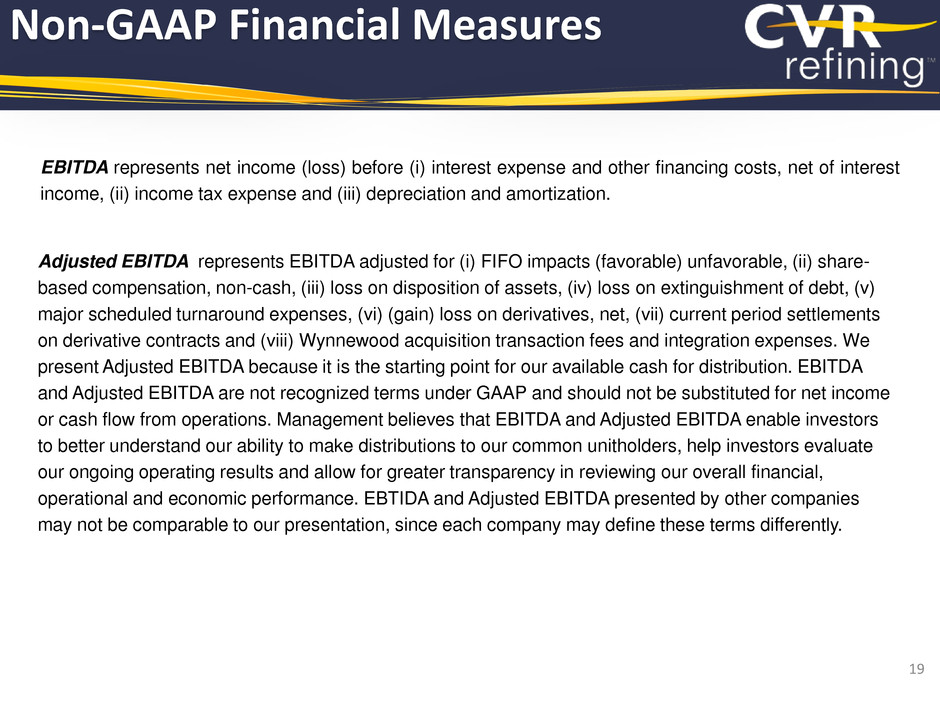
Non-GAAP Financial Measures EBITDA represents net income (loss) before (i) interest expense and other financing costs, net of interest income, (ii) income tax expense and (iii) depreciation and amortization. Adjusted EBITDA represents EBITDA adjusted for (i) FIFO impacts (favorable) unfavorable, (ii) share- based compensation, non-cash, (iii) loss on disposition of assets, (iv) loss on extinguishment of debt, (v) major scheduled turnaround expenses, (vi) (gain) loss on derivatives, net, (vii) current period settlements on derivative contracts and (viii) Wynnewood acquisition transaction fees and integration expenses. We present Adjusted EBITDA because it is the starting point for our available cash for distribution. EBITDA and Adjusted EBITDA are not recognized terms under GAAP and should not be substituted for net income or cash flow from operations. Management believes that EBITDA and Adjusted EBITDA enable investors to better understand our ability to make distributions to our common unitholders, help investors evaluate our ongoing operating results and allow for greater transparency in reviewing our overall financial, operational and economic performance. EBTIDA and Adjusted EBITDA presented by other companies may not be comparable to our presentation, since each company may define these terms differently. 19
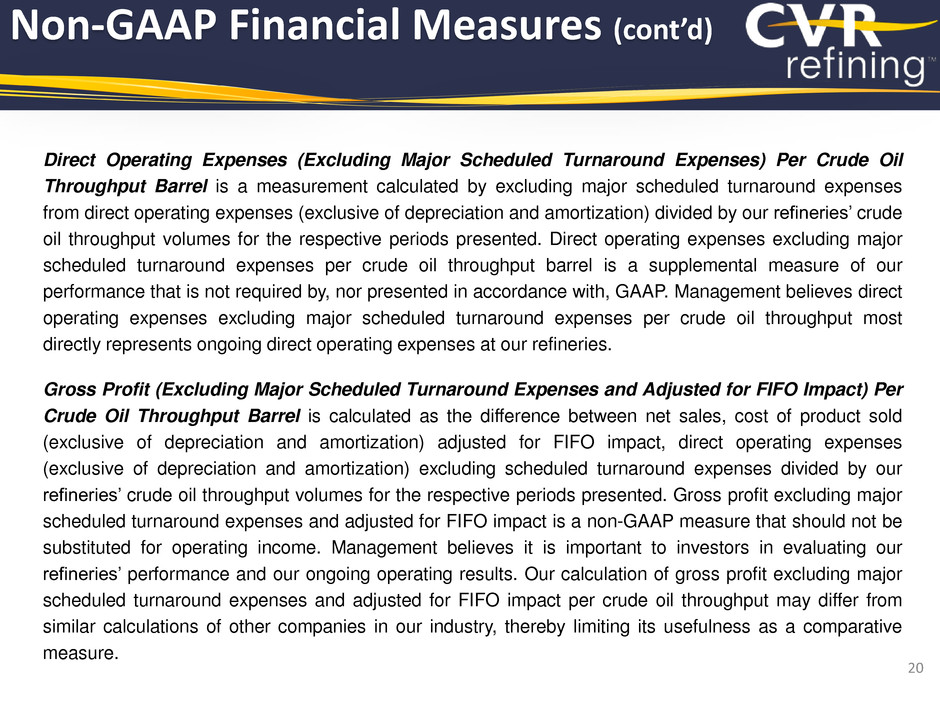
Non-GAAP Financial Measures (cont’d) Direct Operating Expenses (Excluding Major Scheduled Turnaround Expenses) Per Crude Oil Throughput Barrel is a measurement calculated by excluding major scheduled turnaround expenses from direct operating expenses (exclusive of depreciation and amortization) divided by our refineries’ crude oil throughput volumes for the respective periods presented. Direct operating expenses excluding major scheduled turnaround expenses per crude oil throughput barrel is a supplemental measure of our performance that is not required by, nor presented in accordance with, GAAP. Management believes direct operating expenses excluding major scheduled turnaround expenses per crude oil throughput most directly represents ongoing direct operating expenses at our refineries. Gross Profit (Excluding Major Scheduled Turnaround Expenses and Adjusted for FIFO Impact) Per Crude Oil Throughput Barrel is calculated as the difference between net sales, cost of product sold (exclusive of depreciation and amortization) adjusted for FIFO impact, direct operating expenses (exclusive of depreciation and amortization) excluding scheduled turnaround expenses divided by our refineries’ crude oil throughput volumes for the respective periods presented. Gross profit excluding major scheduled turnaround expenses and adjusted for FIFO impact is a non-GAAP measure that should not be substituted for operating income. Management believes it is important to investors in evaluating our refineries’ performance and our ongoing operating results. Our calculation of gross profit excluding major scheduled turnaround expenses and adjusted for FIFO impact per crude oil throughput may differ from similar calculations of other companies in our industry, thereby limiting its usefulness as a comparative measure. 20

Non-GAAP Financial Measures (cont’d) Refining Margin Per Crude Oil Throughput barrel is a measurement calculated as the difference between net sales and cost of product sold (exclusive of depreciation and amortization). Refining margin is a non-GAAP measure that we believe is important to investors in evaluating our refineries' performance as a general indication of the amount above our cost of product sold at which we are able to sell refined products. Each of the components used in this calculation (net sales and cost of product sold exclusive of depreciation and amortization) can be taken directly from our Statement of Operations. Our calculation of refining margin may differ from similar calculations of other companies in our industry, thereby limiting its usefulness as a comparative measure. In order to derive the refining margin per crude oil throughput barrel, we utilize the total dollar figures for refining margin as derived above and divide by the applicable number of crude oil throughput barrels for the period. We believe that refining margin is important to enable investors to better understand and evaluate our ongoing operating results and allow for greater transparency in the review of our overall financial, operational and economic performance. 21

Non-GAAP Financial Measures (cont’d) (a) FIFO is our basis for determining inventory value on a GAAP basis. Changes in crude oil prices can cause fluctuations in the inventory valuation of our crude oil, work in process and finished goods thereby resulting in favorable FIFO impacts when crude oil prices increase and unfavorable FIFO impacts when crude oil prices decrease. The FIFO impact is calculated based upon inventory values at the beginning of the accounting period and at the end of the accounting period. (b) Represents the portion of gain (loss) on derivatives, net related to contracts that matured during the respective periods and settled with counterparties. There are no premiums paid or received at the inception of the derivative contracts and upon settlement, there is no cost recovery associated with these contracts. 22 ($ in millions) CVR Refining, LP Pro Forma Year Ended December 31, 2010 2011 2012 2013 2014 2011 (unaudited) Net Income 38.2$ 480.3$ 595.3$ 590.4$ 358.7$ 749.0$ Add: Interest expense and other financing costs, net of interest income 49.7 53.0 76.2 43.7 33.9 41.7 Depreciation and amortization 66.4 69.8 107.6 114.3 122.5 98.9 EBITDA 154.3 603.1 779.1 748.4 515.1 889.6 Add: FIFO impact (favorable)/unfavorable (a) (31.7) (25.6) 58.4 (21.3) 160.8 (46.6) Share-based compensation, non-cash 11.5 8.9 18.5 9.5 2.3 8.9 Loss on disposition of assets 1.3 2.5 - - - 2.5 Loss on extinguishment of debt 16.6 2.1 37.5 26.1 - 2.1 Wynnewood acquisition transaction fees and integration expenses - 5.2 11.0 - - 5.2 Major scheduled turnaround expenses 1.2 66.4 123.7 - 6.8 66.4 (Gain) loss on derivatives, net 1.5 (78.1) 285.6 (57.1) (185.6) (36.4) Current period settlements on derivative contracts (b) (2.1) (7.2) (137.6) 6.4 122.2 (49.0) Adjusted EBITDA 152.6$ 577.3$ 1,176.2$ 712.0$ 621.6$ 842.7$ Year Ended December 31, CVR Refining, LP Historical Combined

Non-GAAP Financial Measures (cont’d) (a) FIFO is our basis for determining inventory value on a GAAP basis. Changes in crude oil prices can cause fluctuations in the inventory valuation of our crude oil, work in process and finished goods thereby resulting in favorable FIFO impacts when crude oil prices increase and unfavorable FIFO impacts when crude oil prices decrease. The FIFO impact is calculated based upon inventory values at the beginning of the accounting period and at the end of the accounting period. (c) Represents the portion of gain (loss) on derivatives, net related to contracts that matured during the respective periods and settled with counterparties. There are no premiums paid or received at the Inception of the derivative contracts and upon settlement, there is no cost recovery associated with these contracts. 23 (b) Represents expenses associated with certain major scheduled turnaround activities performed at our Wynnewood Refinery during the fourth quarter of 2014. ($ in millions) 12/31/2014 12/31/2013 Net Loss (108.5)$ (110.2)$ Add: Interest expense and other financing costs, net of interest income 9.6 9.2 Depreciation and amortization 32.6 29.1 EBITDA (66.3) (71.9) Add: FIFO impact (favorable)/unfavorable (a) 154.6 62.0 Share-based compensation, non-cash 0.5 1.2 Major scheduled turnaround expenses (b) 1.3 - (Gain) loss on derivatives, net (14.5) 115.9 Current period settlements on derivative contracts (c) 29.0 10.3 Adjusted EBITDA 104.6$ 117.5$ ($ in millions, except per barrel data) 12/31/2014 12/31/2013 Net sales 1,772.8$ 2,360.9$ Less: cost of product sold 1,723.8 2,209.7 Refining margin 49.0 151.2 Add: FIFO impact (favorable)/unfavorable 154.6 62.0 Refining margin adjusted for FIFO impact 203.6 213.2 Crude oil throughput (bpd) 196,146 201,774 Refining margin per crude oil throughput barrel 2.71$ 8.14$ Refining margin per crude oil throughput barrel adjusted for FIFO impact 11.28$ 11.48$ Three Months Ended Three Months Ended CVR Refining, LP CVR Refining, LP
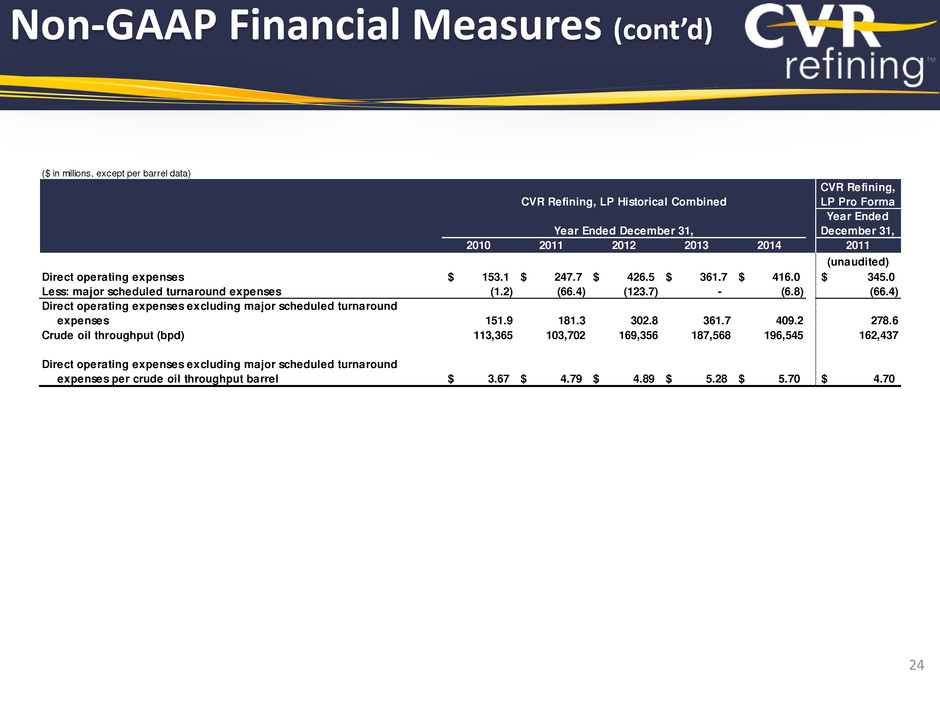
Non-GAAP Financial Measures (cont’d) 24 ($ in millions, except per barrel data) CVR Refining, LP Pro Forma Year Ended December 31, 2010 2011 2012 2013 2014 2011 (unaudited) Direct operating expenses 153.1$ 247.7$ 426.5$ 361.7$ 416.0$ 345.0$ Less: major scheduled turnaround expenses (1.2) (66.4) (123.7) - (6.8) (66.4) Direct operating expenses excluding major scheduled turnaround expenses 151.9 181.3 302.8 361.7 409.2 278.6 Crude oil throughput (bpd) 113,365 103,702 169,356 187,568 196,545 162,437 Direct operating expenses excluding major scheduled turnaround expenses per crude oil throughput barrel 3.67$ 4.79$ 4.89$ 5.28$ 5.70$ 4.70$ CVR Refining, LP Historical Combined Year Ended December 31,

Non-GAAP Financial Measures (cont’d) 25 ($ in millions, except per barrel data) CVR Refining, LP Pro Forma Year Ended December 31, 2010 2011 2012 2013 2014 2011 (unaudited) Net sales 3,905.6$ 4,752.8$ 8,281.7$ 8,683.5$ 8,829.7$ 7,398.3$ Cost of product sold 3,539.8 3,927.6 6,667.5 7,526.7 8,013.4 6,126.0 Direct operating expenses 153.1 247.7 426.5 361.7 416.0 345.0 Depreciation and amortization 66.4 69.8 107.6 114.3 122.5 98.9 Gross profit 146.3 507.7 1,080.1 680.8 277.8 828.4 Add: Major scheduled turnaround expenses 1.2 66.4 123.7 - 6.8 66.4 FIFO impact (favorable)/unfavorable (31.7) (25.6) 58.4 (21.3) 160.8 (46.6) Gross profit excluding major scheduled turnaround expenses and 115.8 548.5 1,262.2 659.5 445.4 848.2 adjusted for FIFO impact Crude oil throughput (bpd) 113,365 103,702 169,356 187,568 196,545 162,437 Gross profit excluding major scheduled turnaround expenses and 2.80$ 14.49$ 20.36$ 9.63$ 6.21$ 14.31$ adjusted for FIFO impact per barrel ($ in millions, except per barrel data) CVR Refining, LP Pro Forma Year Ended December 31, 2010 2011 2012 2013 2014 2011 (unaudited) Net sales 3,905.6$ 4,752.8$ 8,281.7$ 8,683.5$ 8,829.7$ 7,398.3$ Less: cost of product sold 3,539.8 3,927.6 6,667.5 7,526.7 8,013.4 6,126.0 Refining margin 365.8 825.2 1,614.2 1,156.8 816.3 1,272.3 Add: FIFO impact (favorable)/unfavorable (31.7) (25.6) 58.4 (21.3) 160.8 (46.6) Refining margin adjusted for FIFO impact 334.1 799.6 1,672.6 1,135.5 977.1 1,225.7 Crude oil throughput (bpd) 113,365 103,702 169,356 187,568 196,545 162,437 Refining margin per crude oil throughput barrel 8.84$ 21.80$ 26.04$ 16.90$ 11.38$ 21.46$ Refining margin per crude oil throughput barrel adjusted for FIFO impact 8.07$ 21.12$ 26.98$ 16.59$ 13.62$ 20.67$ CVR Refining, LP Historical Combined Year Ended December 31, CVR Refining, LP Historical Combined Year Ended December 31,

Capital Expenditures 26 Capital Expenditures by Refinery 2010 2011 2012 2013 2014 Low 2015 Estimate High 2015 Estimate Coffeyville refinery: Maintenance 18.2$ 49.5$ 40.4$ 52.6$ 74.8$ 88.0$ 98.0$ Growth 1.6 6.8 2.0 3.6 5.5 82.0 92.0 Coffeyville refinery total capital 19.8 56.3 42.4 56.2 80.3 170.0 190.0 Wynnewood refinery: Maintenance 0.5 51.6 105.3 58.5 50.0 58.0 Growth - 0.8 24.9 38.9 10.0 12.0 Wynnewood refinery total capital - 0.5 52.4 130.2 97.4 60.0 70.0 Other Petroleum: Maintenance 0.4 6.4 11.7 7.0 12.0 14.0 Growth 11.4 19.0 6.4 6.6 8.0 11.0 Other petroleum total capital - 11.8 25.4 18.1 13.6 20.0 25.0 Total capital spending 19.8$ 68.6$ 120.2$ 204.5$ 191.3$ 250.0$ 285.0$

Management Team with Proven Track Record of Success John Lipinski CEO & President John Walter SVP, General Counsel & Secretary Prior to the formation of CVR, Mr. Lipinski served as CEO and President of Coffeyville Resources, LLC since 2005 Mr. Lipinski has over 40 years of experience in the petroleum refining industry Prior to appointment, served as Vice President, Associate General Counsel and Assistant Secretary to CVR and its subsidiaries Mr. Walter was previously an associate with Stinson Morrison Hecker, LLP and Seigfreid, Bingham, Levy, Selzer & Gee, P.C. Susan Ball Chief Financial Officer & Treasurer Prior to joining CVR, Ms. Ball served as a Tax Managing Director with KPMG LLP Ms. Ball has over 25 years of experience in the accounting industry David Landreth SVP, Economics & Planning Prior to the formation of CVR, Mr. Landreth served as VP, Economics and Planning of Coffeyville Resources, LLC Mr. Landreth has more than 30 years experience in refining and petrochemicals Robert Haugen EVP, Refining Operations Prior to the formation of CVR, Mr. Haugen served as EVP – Engineering & Construction at Coffeyville Resources, LLC Mr. Haugen has over 30 years of experience in the refining, petrochemical and nitrogen fertilizer industries 27 Martin Power Chief Commercial Officer Prior to joining CVR, Mr. Power served as manager of business and development and trading manager for Koch Supply & Trading, LP Mr. Power has over 35 years of experience in crude oil and petroleum product trading, marketing, logistics and business development No photo available No photo available

Petroleum Refining and Logistics Operating Subsidiaries (3) CVR Refining, LLC CVR Refining, LP (CVRR) Coffeyville Finance Inc. CVR Refining Holdings, LLC 100% 100% 100% CVR Partners, LP (UAN) 100% Public Public 47% 100% 66% CVR Refining GP, LLC IEP 30% CVR GP, LLC 100% CVR Energy, Inc. (CVI) Coffeyville Resources, LLC 53% IEP 82% 18% 100% Fertilizer Operating Subsidiaries (2) Holding Companies (1) 100% (1) Includes Coffeyville Nitrogen Fertilizers, Inc., CL JV Holdings, LLC, Coffeyville Refining & Marketing Holdings, Inc., Coffeyville Refining & Marketing, Inc., Coffeyville Terminal, Inc., Coffeyville Crude Transportation, Inc., and Coffeyville Pipeline, Inc. (2) Includes Coffeyville Resources Nitrogen Fertilizers, LLC. (3) Includes Wynnewood Energy Company, LLC, Wynnewood Refining Company, LLC, Coffeyville Resources Refining & Marketing, LLC, Coffeyville Resources Crude Transportation, LLC, Coffeyville Resources Terminal, LLC, and Coffeyville Resources Pipeline, LLC. Public 4% Organizational Structure 28
