Attached files
| file | filename |
|---|---|
| EX-21.1 - LIST OF SUBSIDIARIES OF THE REGISTRANT - SolarWinds, Inc. | swi-20141231x10kexx211.htm |
| EXCEL - IDEA: XBRL DOCUMENT - SolarWinds, Inc. | Financial_Report.xls |
| EX-31.1 - CERTIFICATION OF CEO - SolarWinds, Inc. | swi-20141231x10kexx311.htm |
| EX-32.1 - CERTIFICATIONS OF CEO, CFO & CAO - SolarWinds, Inc. | swi-20141231x10kexx321.htm |
| EX-23.1 - CONSENT OF PRICEWATERHOUSECOOPERS LLP - SolarWinds, Inc. | swi-20141231x10kexx231.htm |
| EX-31.2 - CERTIFICATION OF CFO - SolarWinds, Inc. | swi-20141231x10kexx312.htm |
| EX-31.3 - CERTIFICATION OF CAO - SolarWinds, Inc. | swi-20141231x10kexx313.htm |
UNITED STATES
SECURITIES AND EXCHANGE COMMISSION
Washington, D.C. 20549
FORM 10-K
ý | ANNUAL REPORT PURSUANT TO SECTION 13 OR 15(d) OF THE SECURITIES EXCHANGE ACT OF 1934 |
For the fiscal year ended: December 31, 2014
Commission file number: 001-34358
SOLARWINDS, INC.
(Exact name of registrant as specified in its charter)
Delaware | 73-1559348 |
(State or other jurisdiction of incorporation or organization) | (I.R.S. Employer Identification Number) |
7171 Southwest Parkway, Building 400 Austin, Texas | 78735 |
(address of principal executive offices) | (zip code) |
Registrant’s telephone number, including area code: (512) 682-9300
Securities registered pursuant to Section 12(b) of the Act:
Title of Each Class | Name of Each Exchange on Which Registered |
Common Stock, $0.001 par value | New York Stock Exchange |
Indicate by check mark if the registrant is a well-known seasoned issuer, as defined in Rule 405 of the Securities Act.
Yes ý No ¨
Indicate by check mark if the registrant is not required to file reports pursuant to Section 13 or Section 15(d) of the Act.
Yes ¨ No ý
Indicate by check mark whether the registrant (1) has filed all reports required to be filed by Section 13 or 15(d) of the Securities Exchange Act of 1934 during the preceding 12 months (or for such shorter period that the registrant was required to file such reports), and (2) has been subject to such filing requirements for the past 90 days. Yes ý No ¨
Indicate by check mark whether the registrant has submitted electronically and posted on its corporate Web site, if any, every Interactive Data File required to be submitted and posted pursuant to Rule 405 of Regulation S-T (§232.405 of this chapter) during the preceding 12 months (or for such shorter period that the registrant was required to submit and post such files). Yes ý No ¨
Indicate by check mark if disclosure of delinquent filers pursuant to Item 405 of Regulation S-K (§229.405 of this chapter) is not contained herein, and will not be contained, to the best of registrant’s knowledge, in definitive proxy or information statements incorporated by reference in Part III of this Form 10-K or any amendment to this Form 10-K. ¨
Indicate by check mark whether the registrant is a large accelerated filer, an accelerated filer, a non-accelerated filer, or a smaller reporting company. See the definitions of “large accelerated filer,” “accelerated filer,” and “smaller reporting company” in Rule 12b-2 of the Exchange Act.
Large accelerated filer ý | Accelerated filer ¨ | Non-accelerated filer ¨ | Smaller reporting company ¨ |
(Do not check if a smaller reporting company) | |||
Indicate by check mark whether the registrant is a shell company (as defined in Rule 12b-2 of the Exchange Act).
Yes ¨ No ý
Based on the closing price of the registrant’s common stock on the last business day of the registrant’s most recently completed second fiscal quarter, which was June 30, 2014, the aggregate market value of its shares held by non-affiliates on that date was approximately $2,528,576,823.
On February 18, 2015, 76,266,285 shares of common stock were outstanding.
DOCUMENTS INCORPORATED BY REFERENCE
Part III of this Annual Report on Form 10-K incorporates certain information by reference from the definitive proxy statement for the registrant’s 2015 Annual Meeting of Stockholders to be filed within 120 days of the registrant’s fiscal year ended December 31, 2014 (the “Proxy Statement”). Except with respect to information specifically incorporated by reference in this Form 10-K, the Proxy Statement is not deemed to be filed as part of this Form 10-K.
Page No. | ||
Item 1. | ||
Item 1A. | ||
Item 1B. | ||
Item 2. | ||
Item 3. | ||
Item 4. | ||
Item 5. | ||
Item 6. | ||
Item 7. | ||
Item 7A. | ||
Item 8. | ||
Item 9. | ||
Item 9A. | ||
Item 9B. | ||
Item 10. | ||
Item 11. | ||
Item 12. | ||
Item 13. | ||
Item 14. | ||
Item 15. | ||
The SolarWinds, thwack, Pingdom, ipMonitor, Kiwi CatTools, Web Help Desk, DameWare, Mobile Admin, Kiwi Syslog, N-central, Librato, Confio, Rove, Rhinosoft, Serv-U and FTP Voyager marks are the exclusive property of SolarWinds, Inc. or its affiliates, are registered with the U.S. Patent and Trademark Office, and may be registered or pending registration in other countries. All other SolarWinds trademarks, service marks, and logos may be common law marks, registered or pending registration in the United States or in other countries. All other trademarks mentioned herein are used for identification purposes only and may be or are trademarks or registered trademarks of their respective companies.
Safe Harbor Cautionary Statement
This Annual Report on Form 10-K contains forward-looking statements within the meaning of Section 21E of the Securities Exchange Act of 1934, as amended (the "Exchange Act"), and the Private Securities Litigation Reform Act of 1995. Such statements may be signified by terms such as “anticipates,” “believes,” “seeks,” “estimates,” “expects,” “intends,” “plans,” “predicts,” “projects,” “may,” “should,” “will,” “would,” “could” or similar expressions and the negatives of those terms. In this report, forward-looking statements include statements regarding our financial projections, future financial performance and plans and objectives for future operations including, without limitation, the following:
• | expectations regarding our plans and strategies to grow our business and expand our market presence, including internationally; |
• | expectations concerning our product offerings and the expansion of our product offerings into new areas of software; |
• | expectations regarding our financial condition and results of operations, including revenue, operating expenses and effective income tax rate; |
• | expectations regarding our non-U.S. earnings in foreign operations; |
• | expectations concerning potential acquisitions and the anticipated benefits of acquisitions; |
• | competitive conditions and our relative position in the industry; |
• | our market opportunities and our ability to take advantage of such market opportunities, the demand for IT management products in various markets and factors contributing to such demand; |
• | our sales and marketing efforts and our expectations about the results of those efforts; |
• | expectations about our ability to generate and maintain customer loyalty, including our maintenance customers; |
• | expectations regarding investment plans and our capital expenditures; |
• | our research and development plans; |
• | our dividend policy; |
• | our equity compensation plans and practices; |
• | our future borrowings and our beliefs regarding the sufficiency of our cash and cash equivalents, cash flows from operating activities and borrowing capacity; and |
• | our beliefs regarding the adequacy of our current facilities and planned expansions to our facilities. |
Forward-looking statements involve known and unknown risks, uncertainties and other factors that may cause our actual results, performance or achievements to be materially and adversely different from any future results, performance or achievements expressed or implied by the forward-looking statements. Factors that could cause or contribute to such differences include, but are not limited to, those discussed under the heading “Risk Factors” in this report and in other documents we file with the Securities and Exchange Commission, or the SEC. Given these risks and uncertainties, you should not place undue reliance on these forward-looking statements. Also, forward-looking statements represent our management’s beliefs and assumptions only as of the date of this report. Except as required by law, we assume no obligation to update these forward-looking statements publicly, or to update the reasons actual results could differ materially and adversely from those anticipated in these forward-looking statements, even if new information becomes available in the future.
PART I
ITEM 1. | BUSINESS |
Overview
SolarWinds, Inc. and its subsidiaries (“SolarWinds,” the “Company,” “we,” “us” or “our”) design, develop, market, sell and support enterprise-class information technology, or IT, infrastructure management software to IT and DevOps professionals in organizations of all sizes to manage on-premise, hybrid cloud and public cloud environments. Our product offerings range from individual software tools to more comprehensive software products that solve problems encountered every day by IT and DevOps professionals and help them to efficiently and effectively manage their network, systems, application and website infrastructures. We are committed to offering products that are easy to find, easy to buy, easy to use and easy to maintain, while providing the power to address any IT management problem at any scale. Our customers include small- and mid-size businesses, large enterprises, managed service providers, or MSPs, and local, state and federal government entities.
As a core part of our strategy, we utilize a differentiated business model for providing enterprise-class software to IT and DevOps professionals within organizations of all sizes worldwide. Key differentiating elements of our business model include powerful and scalable, yet easy-to-use and affordable software that is produced utilizing a highly efficient product development and engineering process, a scalable, Internet-centric marketing model and a high-volume, transaction-oriented inside sales model. This business model has allowed us to drive and support rapid growth in our business at high operating margins while offering our products at prices that are typically lower than competing vendors.
We design our products to be easy-to-install and easy-to-evaluate, allowing potential buyers of our software to see the value that our products provide after downloading a free version of the software or signing up for a trial. We design our marketing programs to drive visitors to our websites in order to capture large volumes of highly qualified leads. We are committed to an inside sales model which we call “selling from the inside.” This approach utilizes a disciplined, transaction-oriented process to convert leads into paying customers at a higher level of productivity and a lower cost than is typically achieved with a traditional outside sales force that travels and incurs higher costs. And we manage our business with a culture and systems that are focused on metrics, helping us to achieve consistency in our execution.
SolarWinds, Inc. is a holding company whose principal operating subsidiary is SolarWinds Worldwide, LLC, or SolarWinds Worldwide. SolarWinds, Inc. was incorporated in the State of Oklahoma in 1999 and reincorporated in the State of Delaware in 2008. SolarWinds Worldwide was formed in the State of Delaware in 2005. Our principal executive offices are located at 7171 Southwest Parkway, Building 400, Austin, Texas 78735, and our telephone number is (512) 682-9300.
Acquisitions
We have made multiple acquisitions of businesses as part of our growth strategy, including one acquisition during 2014. In June 2014, we acquired Pingdom AB, or Pingdom, a provider of cloud-based website and web application monitoring and performance management solutions. The acquisition increased our product offerings and we believe will allow us to leverage the opportunity associated with performance management for critical websites and web and cloud-based applications.
In late January 2015, we acquired Librato, Inc., or Librato, a cloud-based infrastructure monitoring company. Librato enables performance monitoring of infrastructure and applications on public clouds, such as Amazon Web Services, or AWS, and Heroku, or in a company's own data centers. The acquisition of Librato represents another step in our efforts to extend and connect performance management capabilities from on-premise IT infrastructure to cloud-based application environments.
Our Growth Strategy
Our differentiated business model of providing low-cost, easy-to-install and easy-to-use software marketed and sold directly to users through a highly productive and efficient inside sales force is the core of our strategy. We also sell our software through distributors and resellers to supplement our sales force, expand our global presence, reach various market segments and help us to initiate and fulfill sales orders from state, local and federal governments and those commercial customers that prefer to make purchases through a particular reseller or distributor. To a lesser extent, we sell our software, and particularly our cloud products, directly to customers on our websites through electronic commerce with little to no sales force interaction. We evaluate all of our strategic opportunities to ensure that they are compatible with our model for providing cost-efficient, downloadable enterprise-class software that can be marketed and sold through a high volume, transaction-oriented model.
We plan to continue to focus on growth opportunities within our existing customer base and IT infrastructure management markets through increased brand awareness and product depth and breadth, through expansion into adjacent areas of IT infrastructure management and by expanding our business globally. Our objective is to extend our market presence by
1
providing IT and DevOps professionals with easy-to-use and affordable enterprise-class software that solves their specific needs. The following are key elements of our growth strategy:
• | Continue to Add New Customers in Under-Penetrated Markets. We believe that the opportunity to provide IT management products to both IT operations personnel in organizations of all sizes and MSPs throughout North America and the rest of the world remains significantly under-penetrated and represents a significant opportunity to continue our growth. We intend to penetrate these markets further by leveraging our customer base and end-user community and by using our strategic marketing programs to identify and obtain new customers. |
• | Cross-Sell and Up-Sell Existing Products into Our Growing Customer Base. Our customers are generally IT professionals in small- and mid-size businesses, enterprises, and local, state and federal government entities that have purchased one or more of our products. We believe our customers are highly satisfied users of our products and that there is a significant opportunity for follow-on sales of both incremental capacity and additional products to these customers. We seek to expand the use of our products by our customers through various marketing programs and sales activities that are largely focused on educating customers about the potential to solve additional problems, often closely related to the problems solved by the products they already own, with other products that we offer. |
• | Selectively Expand Our Product Portfolio by Pursuing Strategic Acquisitions and Product Development. We expect to continue to pursue strategic acquisitions that will enable us to utilize our go-to-market strategy and enter new markets or new segments of our existing markets by bringing new product offerings to market more quickly than we can develop them. In addition, we plan to continue to develop new software products that enhance and expand our current offerings. We also intend to continue to expand our product offerings into new areas of software in which we can provide differentiated, easy-to-use enterprise-class software products that are marketed and sold directly to end-users. We believe there is an expanding market opportunity not only to manage the existing on-premise infrastructure but also the need to manage the performance of the infrastructure and applications either fully or partially deployed in private and public clouds as businesses move to cloud-based models. |
• | Expand Our Business in International Markets. We believe a substantial opportunity exists for sales of our software in the Europe, Middle East and Africa region (“EMEA”), the Asia-Pacific region and the Latin America region, and we intend to increase our sales, marketing and support operations in these regions. We believe our market penetration is low in many geographic and end user markets in which we sell products. We anticipate continuing our international expansion to further market, sell and develop our products. In addition, we plan to continue to scale and develop our existing group of international distributors and resellers. In these markets we plan to continue to employ our strategy of delivering powerful, easy-to-use and affordable software while leveraging the web as the primary method to reach potential customers. |
• | Create the Ability to "Manage All Things IT." We aim to provide IT and DevOps professionals with the ability to manage all of the critical areas of their IT infrastructure and applications without regard to the location of the computing resources and applications, or to where the performance monitoring solution needs to be located. We believe that there is a significant need among IT and DevOps professionals for an offering that can manage all types of infrastructure, both on-premise and in the cloud, and that those professionals will prefer to use products that are easy to use, affordable and yet powerful and scalable. While we build, and after we complete, this integrated management capability, we intend to continue to provide products that solve individual problems so that customers that want to solve a single problem can do so with a low cost of entry, allowing more IT and DevOps professionals to become SolarWinds customers and satisfied users. |
Our Products
We offer a broad portfolio of IT infrastructure management products that are powerful, yet easy-to-use and affordable. We group our products into broad categories including: network management, used to monitor and manage the performance of network infrastructure; systems management, used to monitor and manage the performance of applications, physical and virtual servers, storage and databases; MSP, used by managed service providers to monitor and manage the IT infrastructure of their end clients, typically SMBs; and cloud, our cloud-based products used to monitor and manage applications and application infrastructure, both in cloud and on-premise environments.
Our network management and systems management products are sold via a perpetual license and typically installed on the customer's hardware, while our MSP and cloud products are typically sold on a subscription basis and can be hosted by us and delivered as SaaS, or software as a service.
Our network management and systems management products include both core products and tools. Our core products are typically server-based with a browser interface, have a higher average selling price than tools and are the focus of our strategies to drive revenue growth. Our tools can be server-or laptop-based, typically have a lower average selling price than our core
2
products and are primarily used by us to meet a critical need of our target customer base, but are not the focus of our revenue growth strategies.
Network Management. Our enterprise-class network management products allow network administrators and other IT professionals to monitor and manage the performance and configuration of their network infrastructure as well as collect and analyze log data for IT operations, security and compliance management. Many of our enterprise-class network management products share integrated components, databases, web servers and user administration and are designed to operate together seamlessly, while still allowing network professionals to purchase and deploy only the products they need.
Our network management core products include:
• | SolarWinds Network Performance Monitor. Our flagship product, Network Performance Monitor, is a server-based fault and performance management platform designed to minimize network downtime. Network Performance Monitor monitors and analyzes real-time, in-depth network performance metrics for routers, switches, servers and other Simple Network Management Protocol, or SNMP, enabled devices to provide both current and historical views into the availability and performance of a network and all devices attached to it. Network Performance Monitor is modular and has the ability to scale with the growth of a network. It can also be expanded through the use of add-on modules and polling engines. End-users can configure Network Performance Monitor to alert network professionals of network events, including thresholds, correlated events, sustained conditions and complex combinations of device states. Network Performance Monitor drives follow-on sales of related modules and our other products. |
We added new features to our Network Performance Monitor product with new out-of-the-box deep packet inspection, or DPI, and analysis sensors. SolarWinds Network Performance Monitor provides a comprehensive view of network fault, performance, availability, traffic and latency allowing network engineers to more effectively identify, prioritize and resolve network issues before they impact application performance, end-users and the business by continuously monitoring packets across the wire while inspecting, identifying and classifying application traffic for over 1,200 applications such as Skype, YouTube and Microsoft Lync. This data is then displayed with respect to network and application response time in easy-view charts and graphs.
• | SolarWinds NetFlow Traffic Analyzer. NetFlow Traffic Analyzer utilizes Cisco Systems’ NetFlow protocol and other similar protocols to extract data from network devices to provide an in-depth view of which end-users, protocols and applications are consuming network bandwidth. |
• | SolarWinds Network Configuration Manager. Network Configuration Manager is a server-based product that automates the processes of network device discovery, network inventory management and network change management. |
• | SolarWinds Log and Event Manager. Log and Event Manager is a server-based product that automates the collection and interpretation of logs from a wide variety of sources including network devices, physical and virtual servers, applications and storage infrastructure, providing IT professionals with real-time availability and performance monitoring of the IT infrastructure. Through log analysis and event correlation provided with approximately 700 built-in correlation rules along with customizable rules, Log and Event Manager supports compliance verification with internal policies and regulatory requirements and also provides IT professionals with real-time and forensic tools for responding to security threats and events. |
• | SolarWinds Enterprise Operations Console. Enterprise Operations Console is a server-based product that provides summarized web-based views of multiple instances of Network Performance Monitor, Network Performance Monitor modules, and Server & Application Monitor, enabling flexible deployment architectures for large or distributed environments. |
• | SolarWinds IP Address Manager. IP Address Manager tracks, manages and reports on the use of internet protocol (IP) addresses through a web interface. In addition, IP Address Manager provides a single interface for management of third party dynamic host configuration protocol (DHCP) and domain name system (DNS) IP infrastructure. |
• | SolarWinds Scalability Engines. Scalability engines increase the scale and provide fail-over for a number of our network management and systems and application management products increasing their monitoring capabilities to a larger number of devices by distributing the polling load across additional servers and ensuring up-time. |
• | SolarWinds User Device Tracker. User Device Tracker is a server-based switch port management tool for tracking and identifying the devices connected to the network, managing network port capacity and responding to network threats posed by rogue devices. |
3
• | SolarWinds VoIP & Network Quality Manager. VoIP & Network Quality Manager monitors VoIP and WAN performance from the perspective of multiple remote sites by tracking key edge-to-edge router performance statistics using Cisco IP SLA technology. |
• | SolarWinds Firewall Security Manager. Firewall Security Manager provides multi-vendor support for firewall analytics and management enabling the automation of firewall security audits, firewall and router analysis and simplified troubleshooting and change management. |
Our network management tools include Engineer's Toolset, ipMonitor, Kiwi CatTools, Kiwi Syslog Server and Kiwi Logviewer and Network Topology Mapper.
Systems Management. Our enterprise-class systems and application performance management products allow IT and DevOps professionals such as systems administrators to monitor and manage the performance of physical and virtual servers, applications, databases and storage devices. This includes products for monitoring end-user application experience, performing patch management, IT help desk ticketing and mobile device-based IT management capabilities. Many of our systems and application management products are designed to operate together seamlessly, as well as with our network management products.
Our systems management core products include:
• | SolarWinds Server & Application Monitor. Server & Application Monitor is a server-based availability and performance management system for applications and server infrastructure, both virtual and physical. Server & Application Monitor provides a view of critical IT services and allows system administrators to drill down and view application-specific server processes, performance counters, synthetic end-user transactions and custom data collected via scripts. With Server & Application Monitor, end-users can configure customized alerts and reports for tracking and managing application and server performance. These capabilities allow system administrators to monitor, manage and optimize the performance of an increasingly complex and growing number of mission-critical business applications. Server & Application Monitor supports over 200 major applications, with extensibility to support additional applications on both the Windows and Linux operating systems. |
• | SolarWinds Database Performance Analyzer. Through a unique response time analysis approach to measuring and communicating database application performance, Database Performance Analyzer provides developers, systems administrators and database administrators with the ability to speed application time-to-market and subsequently monitor and manage database performance for production applications based on Microsoft SQL Server®, Oracle®, IBM® DB2 and SAP® Sybase databases, running on VMware® virtual servers as well as physical servers. |
• | SolarWinds Virtualization Manager. Virtualization Manager is a server-based product that provides virtualization administrators with a single solution to manage all aspects of a virtual server infrastructure, including inventory, sprawl control, performance monitoring, capacity planning and configuration tracking. Using a multi-dimensional, search-based approach Virtualization Manager combines multiple disparate data points into usable insights, which are presented in management dashboards and reports. Virtualization Manager integrates with other key enterprise applications such as configuration management databases, service desks and enterprise portals. |
• | SolarWinds Storage Manager. Storage Manager is a server-based product that combines reporting, monitoring and notification on the performance of storage resources, including direct-attached storage, or DAS, network-attached storage, or NAS, and storage area networks, or SAN, from a wide range of storage hardware vendors. In addition, Storage Manager provides mapping of storage resources to physical and virtual infrastructure to help optimize storage allocation. |
• | SolarWinds Web Help Desk. Web Help Desk provides IT help desk ticketing, change management, IT asset management and self-resolution of issues using a searchable knowledge base. |
• | SolarWinds Managed File Transfer Server. Serv-U Managed File Transfer Server allows IT professionals to secure, automate and manage file transfers and workflows. In addition, Serv-U Managed File Transfer Server provides comprehensive enterprise security, tracking and reporting features to demonstrate compliance with regulatory requirements and internal corporate standards. |
• | SolarWinds Patch Manager. Patch Manager is a server-based product that allows systems administrators to automate and improve the process of deploying, managing and reporting on patches and configuration settings of Microsoft Windows® servers and workstations. |
• | SolarWinds Web Performance Monitor. Web Performance Monitor captures the user steps of any web application through an easy-to-use recorder and continuously monitors the end-user experience of those web applications. |
4
Our systems management tools include DameWare® Remote Support and DameWare Mini Remote Control, or DameWare products, which allow system administrators to remotely manage computers on their networks, and SolarWinds Mobile Admin®, which provides secure access to over 40 IT management tools through Android, iOS, and Blackberry mobile devices.
MSP Products
Our MSP products provide remote monitoring and management, or RMM, and IT service automation to MSPs to allow them to deliver outsourced IT support services to their small and medium-sized business, or SMB, customers.
• | N-Central. Our flagship MSP product is N-Central, a leading RMM and IT service automation solution. N-Central offers cloud-based, multi-tenant, remote monitoring and management for IT infrastructure such as desktops, servers, applications and network devices. |
• | Our MSP product portfolio also includes additional products that address a wide range of IT management capabilities, including bandwidth management, mobile device management, security, backup, patch management and IT service automation. |
Cloud Products
Our cloud products provide IT and DevOps professionals with a comprehensive set of cloud-based tools to monitor and manage the performance of their infrastructure and applications regardless of whether these applications are on-premise, in a public or private cloud, or in a hybrid cloud environment.
• | Pingdom. Our Pingdom website and web application management products enable web operations teams to monitor and manage the performance of their websites, web applications and supporting infrastructure, alerting web operations teams on user experience issues by user location and browser type through real-user monitoring, transaction monitoring and uptime monitoring. |
• | Librato. Librato enables full-stack performance monitoring of infrastructure and applications on public clouds, such as AWS and Heroku, or in a company's own data centers. |
Maintenance and Support
Our perpetual license customers generally receive one year of software maintenance and support as part of their initial purchase of our products and have the option to renew their maintenance agreements. These maintenance agreements provide customers the right to receive software updates, maintenance releases and patches, when and if they become available, and access to our world-wide multi-lingual team of internal support representatives. We also provide similar benefits to our subscription customers who have active subscriptions.
Our typical customers are network professionals, systems administrators, storage administrators or virtual administrators who are sophisticated users of software and related technologies. We devote significant resources to designing software products that are easy-to-install, configure and use, and to developing extensive, easy-to-understand instruction manuals and online tutorials for our products. We also utilize community websites, such as thwack, as forums for our end-users to share information, tips, tools and other valuable resources. Through these online communities, users of our software are able to find answers for many technical problems, discover new uses for our software and provide suggestions or feedback to our product development teams. As a result of these efforts, our customers are able to resolve many technical issues without having to contact our support representatives, which significantly reduces our total support expenses.
Research and Development
Our research and development organization is responsible for the design, development and testing of our software. Our current research and development efforts are focused on new releases of existing products, as well as new products and modules.
We work closely with our customers in developing our products and have designed a product development process that is responsive to customer feedback throughout the process. Our customers and end-user community provide extensive input regarding a wide variety of use cases that we incorporate into our product definitions and requirements. A subset of our customers participates in the validation of our product releases by aiding in the identification of issues prior to a product release. Our research and development organization regularly assists sales engineering and customer support personnel with customer inquiries, which provides another mechanism for customer feedback during the development process.
We utilize small development teams. Each of these teams is dedicated to specific products and work according to a structured and repeatable, iterative process. These teams apply a standard architecture to their individual products, and are managed centrally to ensure standardization, efficiency and interoperability. We use a hybrid onshore and offshore development
5
model, wherein product requirements definition and technical design are primarily performed by our technical staff in the United States who work closely with development teams in our international facilities and international contract development vendors that write code and do testing and quality assurance. Since establishing our international research and development centers, and as a result of our acquisitions, we have significantly increased our research and development employee headcount. We expect to continue to invest in our research and development activities by hiring engineers in our global locations. We believe that we have developed a differentiated process that allows us to release new software rapidly, cost effectively and with a high level of quality. Using our development model, we had 63 product releases in 2014, 75 product releases in 2013 and 82 product releases in 2012.
Our research and development costs were $56.5 million, $37.5 million and $28.8 million for the years ended December 31, 2014, 2013 and 2012, respectively.
Marketing and Sales
We have designed our marketing and sales model to be efficient for very high volumes of affordable transactions for customers of all sizes. Our marketing efforts focus on driving traffic to our websites and on generating high quality sales leads, primarily consisting of end-users who download a free evaluation of our software. Our sales efforts focus on converting these leads into paying customers through a high volume, short duration, sales process that we measure and manage frequently.
Marketing
We use a variety of online marketing programs for lead generation, as well as more traditional direct marketing and indirect channel partner marketing programs to drive awareness of our products and traffic to our websites. These efforts leverage the ubiquity of Internet search engines through search engine marketing and optimization programs. In addition, we send a series of targeted emails to end-users who have downloaded free evaluations of one or more of our software products or received our corporate communications or public relations material. Once we drive traffic to our websites, we have a well-defined process that allows us to automatically track visitors’ activities, communicate with potential customers, encourage downloads of our software and provide highly qualified leads to our sales organization.
Our historical marketing approach, which continues to be important to us, was based on word-of-mouth and customer references. It allowed us to build a substantial customer base and community of network engineers and IT professionals who use our products and act as advocates for them. We continue to build our customer base and this community through marketing of relevant web-based content and online communications. Examples of our initiatives include thwack, a community website designed for IT professionals that provides our end-users and the broader IT management community with information, tools and valuable resources, several company sponsored blogs in which we provide perspectives and information relevant to the IT management marketplace and other technical topics, and web-based events designed to train and inform users about deeper aspects of our products. These activities keep us connected to our end-user base and other prospective customers. Other marketing activities include attending IT management related trade shows, social marketing programs, communicating with industry analysts, influential bloggers and trade media, as well as hosting webinars on IT management issues to create awareness of our brand and software products.
Sales
We sell our software to our customers both directly and through partners. The majority of our sales leads come from potential customers or existing customers who have downloaded one of our core products and use that full featured product during a no-charge evaluation period. Therefore, our sales force typically contacts leads that are potential buyers and the potential buyers already understand how our products are used and the value our products provide in solving IT problems. As a result, our sales cycles are not as long as they are for companies making “cold” calls.
We execute all of our direct sales either through electronic commerce on our websites or through a sales organization that is physically located in one of our sales offices in the United States, Canada, Europe, Australia or Asia. Our efficient and low-cost sales process is predicated on these sales professionals being physically located in one of our offices and having a deep knowledge of our sales model and process. We call this “selling from the inside” as it is different from other companies that simply use personnel that they call “inside sales” to create leads or to sell to only smaller organizations. Our sales teams sell our products to companies of all sizes, from small businesses to Fortune 500 companies. We believe that our selling from the inside process has been one of the keys to our success.
We also sell our software through distributors and resellers to supplement our direct sales force, expand our global presence, reach various market segments and help us to initiate and fulfill sales orders from state, local and federal governments and those commercial customers that prefer to make purchases through a particular reseller. Sales to our channel partners often involve three tiers of distribution: a distributor, a reseller and an end-user customer. Our direct sales force works collaboratively with our channel partners to introduce them to customers and new sales opportunities. We provide licenses
6
directly to the end user in sales of our software through our distributors and resellers. As we expand geographically, we expect to continue to add additional channel partners.
Our sales approach focuses on driving a high volume of relatively standardized transactions. We implement our approach through a disciplined sales process that provides clear guidelines for our sales force, and we actively measure and manage our sales results. We offer our products at low prices and typically using standard contract terms. We enable our customers to buy our products in a manner convenient to them, whether by purchase order, online with a credit card or through our channel partners.
We have experienced, and expect to continue to experience, some seasonality in our new license sales and, consequently, our cash collections. We typically achieve the highest levels of new license sales for the year in the third and fourth quarters. We believe that, in general, historical seasonality results primarily from the budgeting cycles of our customers being typically higher in the third and fourth quarters. New license sales for our U.S. federal business tend to peak in the third quarter of each calendar year as September 30 is the fiscal year end for the U.S. federal government. As a result, cash collections have historically been the highest in the fourth quarter of each calendar year. New license sales for our commercial business tend to peak in the fourth quarter of each calendar year as many companies typically have a December 31 fiscal year end.
We believe we have built a sales process and culture that is unique in the software industry, and that our sales force is able to achieve and maintain a higher level of productivity at a lower cost than most other enterprise software companies. Because our sales personnel do not need a professional software sales background, we have been able to keep our personnel costs low and can expand our direct sales force quickly.
Customers
No single distributor, reseller or customer represented over 10% of our consolidated revenue in 2013 and 2014. In 2012, we had one distributor that represented 10.2% of our consolidated revenue from sales to various end-users. In 2013 and 2014, this distributor represented less than 10% of our consolidated revenue. We do not believe that our business is substantially dependent on this distributor or that the loss of the relationship would have a material adverse effect on our business, as we are generally directly involved with the end user in all of our sales regardless of whether we make the sale directly or through the reseller channel.
In 2012, revenue attributed to the U.S. federal government, including its departments and agencies, represented 10.9% of our consolidated revenue. In 2013 and 2014, consolidated revenue attributable to the U.S. federal government represented less than 10% of our total revenue. Consolidated revenue attributable to the U.S. federal government includes sales that have gone through our distributors and resellers, as well as direct sales. 77.0% of our revenue attributable to the U.S. federal government and its departments and agencies in the fiscal year ended December 31, 2012 was made through the distributor noted above.
For further information regarding concentrations of risks, see Note 1, Summary of Significant Accounting Policies, in the Notes to Consolidated Financial Statements in Item 8 of Part II of this Annual Report on Form 10-K.
For information regarding our international operations, see Note 15, Operating Segment and Geographic Information, in the Notes to Consolidated Financial Statements in Item 8 of Part II of this Annual Report on Form 10-K. See also the risk factor “Because our long-term success depends on our ability to operate our business internationally and increase sales of our products to customers located outside of the United States, our business will be susceptible to risks associated with international operations” in Part I, Item 1A under the heading “Risk Factors” for information regarding risks involving our international operations.
Intellectual Property
We rely on a combination of patent, copyright, trademark, trade dress and trade secret laws, as well as confidentiality procedures and contractual restrictions, to establish and protect our proprietary rights. These laws, procedures and restrictions provide only limited protection. We currently have eighteen patents. We have also filed patent applications, but we cannot guarantee that patents will be issued with respect to our current patent applications in a manner that gives us the protection that we seek or at all. Our patents and any future patents issued to us may be challenged, invalidated or circumvented and may not provide sufficiently broad protection or may not prove to be enforceable in actions against alleged infringers.
We endeavor to enter into agreements with our employees and contractors and with parties with which we do business in order to limit access to and disclosure of our proprietary information. We cannot be certain that the steps we have taken will prevent unauthorized use or reverse engineering of our technology. Moreover, others may independently develop technologies that are competitive with ours or that infringe our intellectual property. The enforcement of our intellectual property rights also depends on any legal actions against these infringers being successful, but these actions may not be successful, even when our rights have been infringed.
7
Furthermore, effective patent, trademark, trade dress, copyright and trade secret protection may not be available in every country in which our products are available over the Internet. In addition, the legal standards relating to the validity, enforceability and scope of protection of intellectual property rights are uncertain and still evolving.
Competition
We face competition from both traditional, larger software vendors offering enterprise-wide software frameworks and services and smaller companies offering point solutions for application, database, log and event, network, remote monitoring and management, storage resource or virtualization management. We also compete with network equipment vendors and systems management product providers whose products and services also address network and IT management requirements. Our principal competitors vary depending on the product we offer and include Hewlett Packard, IBM, CA Technologies, Cisco Systems, Inc., VMware, Inc., EMC Corporation, NetApp, Inc., BMC Software, Inc., Quest Software, now a part of Dell Inc., Infoblox Inc., and several smaller vendors.
Competition in our market is based on the level of difficulty in using, maintaining and installing solutions; total cost of ownership, including product price and implementation and support costs; professional services implementation; product performance, functionality, flexibility, scalability and interoperability; brand and reputation; distribution channels; vertical markets or industries; and financial resources of the vendor. We generally compete favorably with respect to these factors; however, many of our actual and potential competitors enjoy substantial competitive advantages over us, such as greater name recognition, more comprehensive and varied products and services and substantially greater financial, technical and other resources. In addition, many of our competitors have established marketing relationships and access to larger customer bases, and have major distribution agreements with consultants, system integrators and resellers. We expect competition to continue to increase both from existing competitors and new market entrants.
Employees
As of December 31, 2014, we had 1,646 full-time employees, of which 645 were employed in the United States and 1,001 were employed outside of the United States. We consider our current relationship with our employees to be good. None of our employees is represented by a labor union or is a party to a collective bargaining agreement.
Additional Information
Our website address is www.solarwinds.com. Our website and the contents therein or connected thereto are not intended to be incorporated into this Annual Report on Form 10-K. Through a link on the Investor Relations section of our website, we make available the following filings as soon as reasonably practicable after they are electronically filed with or furnished to the SEC: our Annual Reports on Form 10-K, Quarterly Reports on Form 10-Q, Current Reports on Form 8-K, and any amendments to those reports filed or furnished pursuant to Section 13(a) or 15(d) of the Exchange Act. All such filings are available free of charge. The public may read and copy any materials we file with the SEC at the SEC’s Public Reference Room at 100 F Street, NE, Washington, DC 20549. The public may obtain information on the operation of the Public Reference Room by calling the SEC at 1-800-SEC-0330. In addition, the SEC maintains an Internet site (http://www.sec.gov) that contains reports, proxy and information statements, and other information regarding issuers that file electronically with the SEC.
8
ITEM 1A. | RISK FACTORS |
Risks Related to Our Business and Industry
Our quarterly revenue and operating results have fluctuated in the past and may fluctuate in the future due to a number of factors. As a result, we may fail to meet or exceed the expectations of securities analysts or investors, which could cause our stock price to decline.
We believe our quarterly revenue and operating results may vary significantly in the future. As a result, you should not rely on the results of any one quarter as an indication of future performance and period-to-period comparisons of our revenue and operating results may not be meaningful.
Our quarterly results of operations may fluctuate as a result of a variety of factors, including, but not limited to, those listed below, many of which are outside of our control:
• | our ability to maintain and increase sales to existing customers and to attract new customers; |
• | general economic, industry and market conditions that impact expenditures for enterprise IT management software in the United States and other countries where we sell our software; |
• | potential foreign exchange gains and losses related to expenses and sales denominated in currencies other than the functional currency of an associated entity; |
• | fluctuations in foreign currency exchange rates that may negatively impact our reported results of operations; |
• | decline in maintenance or subscription renewals; |
• | our ability to capture a significant volume of qualified sales leads; |
• | our ability to convert qualified sales leads into new business sales at acceptable conversion rates; |
• | the amount and timing of operating expenses and capital expenditures related to the expansion of our operations and infrastructure and customer acquisition; |
• | our failure to achieve the growth rate that was anticipated by us in setting our operating and capital expense budgets; |
• | the timing of revenue and expenses related to the development or acquisition of technologies, products or businesses; |
• | potential goodwill and intangible asset impairment charges and amortization associated with acquired businesses; |
• | the timing and success of new product introductions by us or our competitors; |
• | changes in our pricing policies or those of our competitors; |
• | occasional large customer orders, including in particular those placed by the U.S. federal government; |
• | unpredictability and timing of buying decisions by the U.S. federal government; and |
• | changes in tax rates in jurisdictions in which we operate. |
Fluctuations in our quarterly operating results might lead analysts to change their models for valuing our common stock. As a result, our stock price could decline rapidly and we could face costly securities class action suits or other unanticipated issues.
Our actual operating results may differ significantly from information we provide regarding our financial outlook.
From time to time, we may provide information regarding our financial outlook in our quarterly earnings releases, quarterly earnings conference calls, or otherwise, that represents our management’s estimates as of the date of release. This information regarding our financial outlook, which includes forward-looking statements, will be based on projections, including those related to certain of the factors listed above, prepared by our management. Neither our independent registered public accounting firm nor any other independent expert or outside party will compile or examine the projections nor, accordingly, will any such person express any opinion or any other form of assurance with respect thereto.
These projections will be based upon a number of assumptions and estimates that, while presented with numerical specificity, will be inherently subject to significant business, economic and competitive uncertainties and contingencies, many of which will be beyond our control, and will also be based upon specific assumptions with respect to future business decisions, some of which will change. For example, our management has excluded and currently intends to continue to exclude in their projections the potential revenue associated with certain transactions with U.S. federal government entities that are associated with projects involving larger end user technology implementations that typically involve multiple companies, resellers and/or
9
service providers, or what we refer to as project-based transactions, which are difficult to predict. To the extent we recognize revenue from these project-based transactions during a specific quarter, our actual operating results may differ significantly from information we may have provided regarding our financial outlook. We intend to state possible outcomes as high and low ranges, which will be intended to provide a sensitivity analysis as variables are changed but will not be intended to represent that actual results could not fall outside of the suggested ranges. The principal reason that we release such information is to provide a basis for our management to discuss our business outlook with analysts and investors. We do not accept any responsibility for any projections or reports published by analysts.
Information regarding our financial outlook is necessarily speculative in nature, and it can be expected that some or all of the assumptions underlying such information furnished by us will not materialize or will vary significantly from actual results. Accordingly, information that we provide regarding our financial outlook will only be an estimate of what management believes is realizable as of the date of release. Actual results will vary from our financial outlook, and the variations may be material and adverse. In light of the foregoing, investors are urged to consider these factors, not to rely exclusively upon information we provide regarding our financial outlook in making an investment decision regarding our common stock, and to take such information into consideration only in connection with other information included in our filings filed with or furnished to the SEC, including “Risk Factors” such as this one.
Any failure to implement our operating strategy successfully or the occurrence of any of the events or circumstances set forth under “Risk Factors” in this report could result in our actual operating results being different from information we provide regarding our financial outlook, and those differences might be adverse and material.
If we are unable to capture significant volumes of sales leads from Internet search engines, marketing initiatives and traffic to our websites, then our revenue may not grow as expected or may decline.
We capture many of our sales leads through visits to our websites by potential end-users interested in purchasing or downloading evaluations of our products. Many of these potential end-users find our websites by searching for enterprise IT management and monitoring products through Internet search engines, such as Google. A critical factor in attracting potential customers to our websites is how prominently our websites are displayed in response to search inquiries. If we are listed less prominently or fail to appear in search result listings for any reason, visits to our websites by customers and potential customers could decline significantly. We may not be able to replace this traffic and, if we attempt to replace this traffic, we may be required to increase our sales and marketing expenses, which may not be offset by additional revenue and could adversely affect our operating results.
We also capture leads through various other marketing activities such as targeted email campaigns, social marketing programs, attending IT management related trade shows, and hosting webinars on IT management issues. Our marketing efforts may be unsuccessful in generating evaluation downloads, resulting in fewer sales leads. If we fail to capture a sufficient volume of leads from these activities and/or such sales leads do not result in actual sales, our revenue may not grow as expected or could decrease and our operating results could suffer.
If we are unable to sell products to new customers or to sell additional products or upgrades to our existing customers, our revenue growth will be adversely affected and our operating income could decrease.
To increase our revenue, we must regularly add new customers and/or sell additional products or upgrades to existing customers. Even if we capture a significant volume of leads from our marketing activities, we must be able to sell products to a sufficient number of these new sales leads in order to achieve our expected revenue growth. We expect to incur significant additional expenses in expanding our sales personnel and our international operations in order to convert leads into sales of our products. If we are unable to sell products to new customers and additional products or upgrades to our existing customers as a result of these expenditures, we may be unable to grow our revenue and/or our operating results may be adversely affected.
Challenging or uncertain economic conditions could adversely affect our operating results.
Economies in many countries are continuing to experience uncertain and challenging conditions as a result of a multitude of factors, including, but not limited to, sovereign debt levels and threatened defaults, credit downgrades, declines in gross domestic product, increases in unemployment, political uncertainty or unrest and volatility in commodity prices and worldwide stock markets. During these challenging and uncertain economic periods, customers may reduce or delay technology purchases, including purchases of our software products. Our typically short sales cycle may lengthen if purchasing decisions are delayed as a result of uncertain information technology budgets, contract negotiations become more protracted or customers institute additional internal approvals for software purchases. Uncertain and challenging economic conditions could result in reductions in sales of our products, longer sales cycles, difficulties in collecting accounts receivable or delayed payments, slower adoption of new technologies and increased price competition. Any of these events would likely harm our business, financial condition, operating results and cash flows.
10
The ability to recruit, retain and develop key employees is critical to our success and growth, and our inability to attract and retain qualified personnel could harm our business.
Our business requires certain expertise and intellectual capital, particularly within our management team. For us to compete successfully and grow, we must retain, recruit and develop key personnel who can provide the needed expertise for our industry and products. As we move into new geographic areas, we will need to attract, recruit and retain qualified personnel in those locations. In addition, acquisitions could cause us to lose key personnel of the acquired businesses. However, the market for qualified personnel is competitive and we may not succeed in recruiting additional key personnel or may fail to effectively replace current key personnel who depart with qualified or effective successors. We believe that replacing our key personnel with qualified successors is particularly challenging as we feel that our business model and approach to marketing and selling our products are unique. Any successors that we hire from outside of the Company would likely be unfamiliar with our business model and may therefore require significant time to understand and appreciate the important aspects of our business or fail to do so altogether. Our effort to retain and develop personnel may also result in significant additional expenses, including stock-based compensation expenses, which could adversely affect our profitability. New regulations and volatility or lack of performance in our stock price could also affect the value of our equity awards, which could affect our ability to attract and retain our key employees. We have made significant changes, and may make additional changes in the future, to our senior management team and other key personnel. We cannot provide assurances that key personnel, including our executive officers, will continue to be employed by us or that we will be able to attract and retain qualified personnel in the future. Failure to retain or attract key personnel could have a material adverse effect on our business.
Failure to expand our sales operations effectively could harm our ability to increase our customer base and achieve broader market acceptance of our products.
Increasing our customer base and achieving broader market acceptance of our products will depend on our ability to expand our sales operations effectively. We are substantially dependent on our direct sales force, and to a significantly lesser extent on certain resellers and distributors, to obtain new customers. We plan to continue to expand our sales force both domestically and internationally. Our ability to achieve significant growth in revenue in the future will depend on our success in recruiting, training and retaining sufficient numbers of sales personnel, and on the productivity of those personnel. Our recent and planned personnel additions may not become as productive as we would like, and we may be unable to hire or retain sufficient numbers of qualified individuals in the future in the markets where we do or plan to do business. Our operating results will be seriously harmed if these expansion efforts do not generate a corresponding significant increase in revenue.
Our business depends on customers renewing their maintenance or subscription agreements. Any decline in customer renewal rates could harm our future operating results.
We sell most of our products pursuant to a perpetual license, which ordinarily includes one year of maintenance as part of the initial price. We sell certain of our products pursuant to subscription agreements, which ordinarily have a subscription period of one year. We generally invoice subscription agreements monthly in advance over the subscription period. We introduced our subscription offerings in the second quarter of 2013 and have expanded these offerings since with developed and acquired products. Our customers have no obligation to renew their maintenance or subscription agreements after the expiration of the initial period. Additionally, customers could cancel their subscription agreements prior to the expiration of the subscription period, which could result in us recognizing less subscription revenue than expected over the term of the agreement. We may be unable to predict future customer renewal rates accurately. Our customers’ renewal rates may decline or fluctuate as a result of a number of factors, including their level of satisfaction with our products, the prices of our products, the prices of products and services offered by our competitors or reductions in our customers’ spending levels. If our customers do not renew their maintenance or subscription arrangements or if they renew them on less favorable terms, our revenue may decline and our business will suffer. A substantial portion of our quarterly maintenance and subscription revenue is attributable to agreements entered into during previous quarters. As a result, if there is a decline in renewed maintenance or subscription agreements in any one quarter, only a small portion of the decline will be reflected in our revenue recognized in that quarter and the rest will be reflected in our revenue recognized in the following four quarters or more.
Acquisitions present many risks that could have a material adverse effect on our business and results of operations.
In order to expand our business, we have made several acquisitions and expect to continue making similar acquisitions and possibly larger acquisitions as part of our growth strategy. The success of our future growth strategy will depend on our ability to identify, negotiate, complete and integrate acquisitions and, if necessary, to obtain satisfactory debt or equity financing to fund those acquisitions. Mergers and acquisitions are inherently risky, and any mergers and acquisitions we complete may not be successful. Our past mergers and acquisitions and any mergers and acquisitions that we do in the future involve numerous risks, including, but not limited to, the following:
• | difficulties in integrating and managing the operations, personnel, systems, technologies and products of the companies we acquire; |
11
• | diversion of our management’s attention from normal daily operations of our business; |
• | our inability to maintain the key business relationships and the reputations of the businesses we acquire; |
• | uncertainty of entry into markets in which we have limited or no prior experience and in which competitors have stronger market positions; |
• | our dependence on unfamiliar affiliates, resellers, distributors and partners of the companies we acquire; |
• | our inability to increase revenues from an acquisition for a number of reasons, including our failure to drive demand in our existing customer base for acquired products and our failure to obtain maintenance renewals or upgrades and new product sales from customers of the acquired businesses; |
• | increased costs related to acquired operations and continuing support and development of acquired products; |
• | our responsibility for the liabilities of the businesses we acquire; |
• | potential goodwill and intangible asset impairment charges and amortization associated with acquired businesses; |
• | adverse tax consequences associated with acquisitions; |
• | changes in how we are required to account for our acquisitions under U.S. generally accepted accounting principles, including arrangements that we assume from an acquisition; |
• | potential negative perceptions of our acquisitions by customers, financial markets or investors; |
• | failure to obtain required approvals from governmental authorities under competition and antitrust laws on a timely basis, if at all, which could, among other things, delay or prevent us from completing a transaction, or otherwise restrict our ability to realize the expected financial or strategic goals of an acquisition; |
• | potential increases in our interest expense, leverage and debt service requirements if we incur additional debt to pay for an acquisition; |
• | our inability to apply and maintain our internal standards, controls, procedures and policies to acquired businesses; and |
• | potential loss of key employees of the companies we acquire. |
Additionally, acquisitions or asset purchases made entirely or partially for cash may reduce our cash reserves or require us to incur additional debt under our Credit Agreement or otherwise. We may seek to obtain additional cash to fund an acquisition by selling equity or debt securities. We may be unable to secure the equity or debt funding necessary to finance future acquisitions on terms that are acceptable to us. If we finance acquisitions by issuing equity or convertible debt securities, our existing stockholders will experience ownership dilution.
The occurrence of any of these risks could have a material adverse effect on our business, results of operations, financial condition or cash flows, particularly in the case of a larger acquisition or concurrent acquisitions.
Businesses that we acquire may have greater than expected liabilities for which we become responsible.
Businesses that we acquire may have liabilities or adverse operating issues, or both, that we fail to discover through due diligence or the extent of which we underestimate prior to the acquisition. For example, to the extent that any business that we acquire or any prior owners, employees or agents of any acquired businesses or properties: (i) failed to comply with or otherwise violated applicable laws, rules or regulations; (ii) failed to fulfill or disclose their obligations, contractual or otherwise, to applicable government authorities, their customers, suppliers or others; or (iii) incurred tax or other liabilities, we, as the successor owner, may be financially responsible for these violations and failures and may suffer harm to our reputation and otherwise be adversely affected. An acquired business may have problems with internal control over financial reporting, which could be difficult for us to discover during our due diligence process and could in turn lead us to have significant deficiencies or material weaknesses in our own internal control over financial reporting. These and any other costs, liabilities and disruptions associated with any of our past acquisitions and any future acquisitions could harm our operating results.
Charges to earnings resulting from acquisitions may adversely affect our operating results.
When we acquire businesses, we allocate the purchase price to tangible assets and liabilities and identifiable intangible assets acquired at their acquisition date fair values. Any residual purchase price is recorded as goodwill, which is also generally measured at fair value. We also estimate the fair value of any contingent consideration. Our estimates of fair value are based upon assumptions believed to be reasonable but which are uncertain and involve significant judgments by management. After we complete an acquisition, the following factors could result in material charges and adversely affect our operating results and may adversely affect our cash flows:
12
• | costs incurred to combine the operations of companies we acquire, such as transitional employee expenses and employee retention or relocation expenses; |
• | impairment of goodwill or intangible assets; |
• | a reduction in the useful lives of intangible assets acquired; |
• | impairment of long-lived assets; |
• | identification of, or changes to, assumed contingent liabilities; |
• | changes in the fair value of any contingent consideration; |
• | charges to our operating results due to duplicative pre-merger activities; |
• | charges to our operating results from expenses incurred to effect the acquisition; and |
• | charges to our operating results due to the expensing of certain stock awards assumed in an acquisition. |
Substantially all of these costs will be accounted for as expenses that will decrease our net income and earnings per share for the periods in which those costs are incurred. Charges to our operating results in any given period could differ substantially from other periods based on the timing and size of our acquisitions and the extent of integration activities. For further information regarding our accounting for acquisitions, see “Critical Accounting Policies and Estimates—Acquisitions” under “Management’s Discussion & Analysis of Financial Condition and Results of Operations” and Note 2, Acquisitions, in the Notes to Consolidated Financial Statements in Item 8 of Part II of this Annual Report on Form 10-K.
Our operating income could fluctuate and may continue to decline as a percentage of revenue as we make further expenditures to expand our operations in order to support additional growth in our business.
As a percentage of revenue, our operating income was 23.9%, 36.3% and 42.3% for the years ended December 31, 2014, 2013 and 2012, respectively. We have made significant investments in our operations to support additional growth, such as hiring substantial numbers of new personnel, investing in new facilities, acquiring other companies or their assets and establishing and broadening our international operations in order to expand our business. In 2013, we acquired new operations in Ottawa, Canada and Boulder, Colorado through our acquisitions of N-able Technologies, Inc., or N-able, and Confio Corporation, or Confio, respectively, which increased our operating expenses in 2014. In the second quarter of 2014, we acquired Pingdom, which increased our operating expenses in the second half of 2014. We expect these acquisitions will continue to increase our operating expenses in future periods. Beginning in the fourth quarter of 2013 and continuing through 2014, we also increased our investments in our business primarily to expand our research and development efforts, increase our sales and marketing activities and broaden our international operations. These investments may not yield increased revenue, and even if they do, the increased revenue may not offset the amount of the investments. We also expect to continue to pursue acquisitions in order to expand our presence in current markets or new markets, many or all of which may increase our operating costs more than our revenue. As a result of all of these factors, our operating income could fluctuate and may continue to decline as a percentage of revenue relative to our prior annual periods.
If we are unable to enhance existing products, particularly our core products, or to develop or acquire new products that respond to rapidly changing customer requirements, technological developments or evolving industry standards, our long-term revenue growth will be harmed.
The market for our products is characterized by rapid technological advances, changes in customer requirements, changes in protocols and evolving industry standards. Our long-term growth depends on our ability to enhance and improve our existing products and to introduce or acquire new products that respond to these demands. The success of any enhancement or new product depends on a number of factors, including its timely completion, introduction and market acceptance. New products that we develop or acquire may not be introduced in a timely or cost-effective manner and may not achieve the broad market acceptance necessary to generate significant revenue. Additionally, our existing and prospective customers may develop their own competing technologies, purchase competitive products or services or engage third party providers. If we are unable to develop or acquire enhancements to, and new features for, our existing products or acceptable new products that keep pace with rapid technological developments, our products may become obsolete, less marketable and less competitive, and our business will be harmed.
We operate much of our research and development activities internationally and outsource a portion of the coding and testing of our products and product enhancements to contract development vendors. We believe that performing research and development in our international facilities and supplementing these activities with our contract development vendors enhances the efficiency and cost-effectiveness of our product development. If we experience problems with our workforce or facilities internationally, we may not be able to develop new products or enhance existing products in an alternate manner that may be equally or less efficient and cost-effective.
13
We depend significantly on our core products, which represent a majority of our revenue in 2014, 2013 and 2012. If we are unable to add products and develop enhancements to our core products that are satisfactory to our customers, or if our customers purchase or develop their own competing products and technologies causing a reduction in demand for our core products, our operating results will be harmed.
We depend on the U.S. federal government in certain fiscal quarters for a meaningful portion of our sales, including maintenance renewals, and orders from the U.S. federal government are unpredictable. The delay or loss of these sales may harm our operating results.
A portion of our sales, including maintenance renewals, are to a number of different departments of the U.S. federal government. In certain fiscal quarters, particularly the third quarter, this portion may be meaningful. Any factors that cause a decline in government expenditures generally or government IT expenditures in particular could cause our revenue to grow less rapidly or even to decline. These factors include, but are not limited to, constraints on the budgetary process, including changes in the policies and priorities of the U.S. federal government, deficit-reduction legislation, and any shutdown of the U.S. federal government. Furthermore, sales orders from the U.S. federal government tend to be dependent on many factors and therefore unpredictable in timing. Any sales we expect to make in a fiscal quarter may not be made in that quarter or at all, and our operating results for that quarter may therefore be adversely affected.
Because our long-term success depends on our ability to operate our business internationally and increase sales of our products to customers located outside of the United States, our business will be susceptible to risks associated with international operations.
We have international operations in the Republic of Ireland, the Czech Republic, Canada, Australia, India, Singapore, the Philippines, the Netherlands, Sweden and Poland, all of which were established or acquired since 2007. We also expect to continue to expand our international operations for the foreseeable future. The continued international expansion of our operations requires significant management attention and financial resources and results in increased administrative and compliance costs. Our limited experience in operating our business in certain regions outside the United States increases the risk that our expansion efforts into those regions may not be successful. In particular, our business model may not be successful in particular countries or regions outside the United States for reasons that we currently are unable to anticipate. In addition, conducting international operations subjects us to risks that we have not generally faced in the United States. These include, but are not limited to:
• | fluctuations in currency exchange rates (which we only hedge to a limited extent at this time); |
• | the complexity of, or changes in, foreign regulatory requirements; |
• | difficulties in managing the staffing of international operations, including compliance with local labor and employment laws and regulations; |
• | potentially adverse tax consequences, including the complexities of foreign value added tax systems, overlapping tax regimes, restrictions on the repatriation of earnings and changes in tax rates; |
• | dependence on resellers and distributors to increase customer acquisition or drive localization efforts; |
• | the burdens of complying with a wide variety of foreign laws and different legal standards; |
• | increased financial accounting and reporting burdens and complexities; |
• | longer payment cycles and difficulties in collecting accounts receivable; |
• | longer sales cycles; |
• | political, social and economic instability abroad; |
• | terrorist attacks and security concerns in general; |
• | reduced or varied protection for intellectual property rights in some countries; and |
• | the risk of U.S. regulation of foreign operations. |
The occurrence of any one of these risks could negatively affect our international business and, consequently, our operating results. We cannot be certain that the investment and additional resources required to establish, acquire or integrate operations in other countries will produce desired levels of revenue or profitability. If we are unable to effectively manage our expansion into additional geographic markets, our financial condition and results of operations could be harmed.
14
If we fail to develop and maintain our brands cost-effectively, our financial condition and operating results might suffer.
We believe that developing and maintaining awareness and integrity of our brands in a cost-effective manner are important to achieving widespread acceptance of our existing and future products and are important elements in attracting new customers. We believe that the importance of brand recognition will increase as we enter new markets and as competition in our existing markets further intensifies. Successful promotion of our brands will depend on the effectiveness of our marketing efforts and on our ability to provide reliable and useful products at competitive prices. We intend to increase our expenditures on brand promotion. Brand promotion activities may not yield increased revenue, and even if they do, the increased revenue may not offset the expenses we incur in building our brands. We rely on resellers and distributors to some extent in the distribution of our products. We have limited control over these third parties and actions by these third parties could negatively impact our brand. We also rely on our customer base and community of end-users in a variety of ways, including to give us feedback on our products and to provide user-based support to our other customers through thwack, our online community website. If poor advice or misinformation regarding our products is spread among users of thwack, it could adversely affect our reputation, our financial results and our ability to promote and maintain our brands. If we fail to promote and maintain our brands successfully, maintain loyalty among our customers and our end-user community, or incur substantial expenses in an unsuccessful attempt to promote and maintain our brands, we may fail to attract new customers or retain our existing customers and our financial condition and results of operations could be harmed.
We operate in a highly competitive market, which could make it difficult for us to acquire and retain customers.
The market for enterprise IT management solutions is intensely competitive. Competition in our market is based primarily on the level of difficulty in using, maintaining and installing solutions; total cost of ownership, including product price and implementation and support costs; professional services implementation; product performance, functionality, flexibility, scalability and interoperability; brand and reputation; distribution channels; vertical markets or industries; and financial resources of the vendor. We often compete to sell our products against existing products or systems that our potential customers have already made significant expenditures to install. Many of our actual and potential competitors enjoy substantial competitive advantages over us, such as greater name recognition, more comprehensive and varied products and services, and substantially greater financial, technical and other resources. In addition, many of our competitors have established marketing relationships and access to larger customer bases, and have major distribution agreements with consultants, system integrators and resellers. Given their larger size, greater resources and existing customer relationships, our competitors may be able to compete and respond more effectively than we can to new or changing opportunities, technologies, standards or customer requirements.
We face competition from both traditional, larger software vendors offering enterprise-wide software frameworks and services and smaller companies offering point solutions for application, database, log and event, network, remote monitoring and management, storage resource or virtualization management. We also compete with network equipment vendors and systems management product providers whose products and services also address network and IT management requirements. Our principal competitors vary depending on the product we offer and include Hewlett Packard, IBM, CA Technologies, Cisco Systems, Inc., VMware, Inc., EMC Corporation, NetApp, Inc., BMC Software, Inc., Quest Software, now a part of Dell Inc., Infoblox Inc., and several smaller vendors.
Some of our competitors have made acquisitions or entered into strategic relationships with one another to offer more comprehensive or bundled or integrated product offerings. We expect this trend to continue as companies attempt to strengthen or maintain their market positions in an evolving industry and as companies enter into partnerships or are acquired. Companies and alliances resulting from these possible consolidations and partnerships may create more compelling product offerings and be able to offer more attractive pricing, making it more difficult for us to compete effectively.
We have experienced rapid growth in recent periods. If we fail to manage our growth effectively, our financial performance may suffer.
We have substantially expanded our overall business, customer base, headcount and operations since 2006 both domestically and internationally. Our expansion has placed, and our expected future growth will continue to place, a significant strain on our managerial, administrative, operational, financial and other resources. As we continue to grow, we must effectively integrate and manage expanded operations and a large number of new employees in geographically distributed locations, while maintaining the effectiveness of our business model and approach to marketing and selling our products. If we are unable to manage our growth effectively, our operating results will suffer.
Interruptions or performance problems associated with our technology and infrastructure, and our reliance on technologies from third parties, may adversely affect our ability to manage our business and meet reporting obligations.
Currently, we use NetSuite to manage our order management and financial processes, salesforce.com to track our sales and marketing efforts and other third party vendors to manage online marketing and web services. We believe the availability of
15
these services is particularly essential to the management of our high-volume, transaction-oriented business model. We also use third party vendors to manage our equity compensation plans and certain aspects of our financial reporting processes. As we expand our operations, we expect to utilize additional systems and service providers that may also be essential to managing our business. Although the systems and services that we require are typically available from a number of providers, it is time consuming and costly to qualify and implement these relationships. Therefore, if one or more of our providers suffer an interruption in their business, or experience delays, disruptions or quality control problems in their operations, or we have to change or add additional systems and services, our ability to manage our business and produce timely and accurate financial statements would suffer.
In addition, our continued growth depends in part on the ability of our existing and potential customers to access our website and download our software or encrypted access keys for our software within an acceptable amount of time. We have experienced, and may in the future experience, website disruptions, outages and other performance problems due to a variety of factors, including infrastructure changes, human or software errors, capacity constraints due to an overwhelming number of users accessing our website simultaneously and denial of service or fraud or security attacks. In some instances, we may not be able to identify the cause or causes of these website performance problems within an acceptable period of time. It may become increasingly difficult to maintain and improve our website performance, especially during peak usage times and as our user traffic increases. If our websites are unavailable or if our customers are unable to download our software or encrypted access keys within a reasonable amount of time or at all, our business would be negatively affected.
Material defects or errors in our products could harm our reputation, result in significant costs to us and impair our ability to sell our products.
Software products are inherently complex and often contain defects and errors when first introduced or when new versions are released. Any defects or errors in our products could result in:
• | lost or delayed market acceptance and sales of our products; |
• | a reduction in maintenance renewals; |
• | diversion of development resources; |
• | legal claims; and |
• | injury to our reputation and our brand. |
The costs incurred in correcting or remediating the impact of defects or errors in our products may be substantial and could adversely affect our operating results.
Litigation exposure related to our pending and any future litigation could adversely affect our results of operations, profitability and cash flows.
From time-to-time, we have been and may be involved in various legal proceedings and claims arising in our ordinary course of business. At this time, neither we nor any of our subsidiaries is a party to, and none of our respective property is the subject of, any material legal proceeding. However, the outcome of legal proceedings and claims brought against us are subject to significant uncertainty. Pending or future lawsuits may result in a diversion of management’s attention and resources, significant costs, including monetary damages and legal fees, injunctive relief, and may contribute to current and future stock price volatility. No assurance can be made that pending or future litigation will not result in material financial exposure or reputational harm, which could have a material adverse effect upon our results of operations, profitability or cash flows.
In particular, the software and technology industries are characterized by the existence of a large number of patents, copyrights, trademarks and trade secrets and by frequent litigation based on allegations of infringement or other violations of intellectual property rights. We have received, and from time to time may receive, letters claiming that our products infringe or may infringe the patents or other intellectual property rights of others. As we face increasing competition and increasing brand awareness, the possibility of additional intellectual property rights claims against us grows. Our technologies may not be able to withstand any third-party claims or rights against their use. Additionally, we have licensed from other parties proprietary technology covered by patents and other intellectual property rights, and these patents or other intellectual property rights may be challenged, invalidated or circumvented. These types of claims could harm our relationships with our customers, might deter future customers from acquiring our products or could expose us to litigation with respect to these claims. Even if we are not a party to any litigation between a customer and a third party, an adverse outcome in that litigation could make it more difficult for us to defend our intellectual property in any subsequent litigation in which we are a named as a party. Additionally, we use open source software in our products and expect to continue to use open source software in the future. We may face claims from others claiming ownership of, or seeking to enforce the terms of, an open source license, including by demanding release of the open source software, derivative works or our proprietary source code that was developed using such software. Any of these results would have a negative effect on our business and operating results.
16
Any additional intellectual property rights claim against us or our customers, with or without merit, could be time-consuming, expensive to litigate or settle, and divert management resources and attention. As a result of any successful intellectual property rights claim against us or our customers, we might have to pay damages or stop using technology found to be in violation of a third party’s rights, which could prevent us from offering our products to our customers. We could also have to seek a license for the technology, which might not be available on reasonable terms, might significantly increase our cost of revenue or might require us to restrict our business activities in one or more respects. The technology also might not be available for license to us at all. As a result, we could also be required to develop alternative non-infringing technology or cease to offer a particular product, which could require significant effort and expense or hurt our revenue and financial results of operations.
Our exposure to risks associated with the use of intellectual property may be increased as a result of our past and any future acquisitions as we have a lower level of visibility into the development process with respect to acquired technology or the care taken to safeguard against infringement risks. Third parties may make infringement and similar or related claims after we have acquired technology that had not been asserted prior to our acquisition.
The success of our business depends on our ability to protect and enforce our intellectual property rights.
We rely primarily on a combination of patent, copyright, trademark, trade dress, unfair competition and trade secret laws, as well as confidentiality procedures and contractual restrictions, to establish and protect our proprietary rights. These laws, procedures and restrictions provide only limited protection. We currently have eighteen patents and have also filed patent applications, but patents may not be issued with respect to these applications. Our patents and any future patents issued to us may be challenged, invalidated or circumvented, and may not provide sufficiently broad protection or may not prove to be enforceable in actions against alleged infringers.
We endeavor to enter into agreements with our employees and contractors and with parties with which we do business in order to limit access to and disclosure of our proprietary information. We cannot be certain that the steps we have taken will prevent unauthorized use, misappropriation or reverse engineering of our technology. Moreover, others may independently develop technologies that are competitive to ours and may infringe our intellectual property. The enforcement of our intellectual property rights also depends on our legal actions against these infringers being successful, but these actions may not be successful, even when our rights have been infringed. Further, any litigation, whether or not resolved in our favor, could be costly and time-consuming.
Our exposure to risks related to the protection of intellectual property may be increased in the context of acquired technologies as we have a lower level of visibility into the development process and the actions taken to establish and protect proprietary rights in the acquired technology. In connection with past acquisitions, we have found that some associated intellectual property rights, such as domain names and trademarks in certain jurisdictions, are owned by resellers, distributors or other third parties. In the past, we have experienced difficulties in obtaining assignments of these associated intellectual property rights from third parties.
Furthermore, effective patent, trademark, trade dress, copyright and trade secret protection may not be available in every country in which our products are available over the Internet. In addition, the legal standards relating to the validity, enforceability and scope of protection of intellectual property rights are uncertain and still evolving.
Our debt obligations contain restrictions that may impact our business and expose us to risks that could adversely affect our liquidity and financial condition.
In October 2013, we entered into a Credit Agreement with Wells Fargo Bank, National Association and certain other lenders, which provides for a $125 million revolving credit facility with a $30 million letter of credit sublimit and a $15 million swingline loan sublimit. We have in the past, and may in the future, borrow under the Credit Agreement in order to fund working capital requirements, including, without limitation, to finance acquisitions. We currently do not have any outstanding borrowings under the Credit Agreement.
The Credit Agreement contains customary affirmative and negative covenants. The covenants, among other things, limit or restrict our and our subsidiaries’ abilities to incur indebtedness, grant liens, make investments, merge or consolidate, dispose of assets, pay dividends or make distributions, make acquisitions and enter into certain transactions with affiliates, in each case subject to customary exceptions. We are also required to maintain compliance with a consolidated total leverage ratio and a consolidated interest coverage ratio. Our ability to comply with these financial covenants will depend on our future performance, which may be affected by financial, business, economic, regulatory and other factors summarized in this section “Risk Factors,” many factors of which are outside of our control.
The Credit Agreement includes customary events of default that include, among other things, non-payment defaults, defaults due to the inaccuracy of representations and warranties, covenant defaults, indebtedness cross default, change of control default, bankruptcy and insolvency defaults, defaults due to invalidity of the documents, material judgment defaults and
17
material adverse effect default. Any default that is not cured or waived could result in the acceleration of the obligations under the Credit Agreement, an increase in the applicable interest rate and a requirement that we pay the obligations in full. Any such default could have a material adverse effect on our liquidity and financial condition.
In addition, the existence of indebtedness incurred under the Credit Agreement could adversely affect our liquidity and financial condition by:
• | requiring us to dedicate a substantial portion of our cash flow from operations to payments on our indebtedness, thereby reducing the availability of our cash flow to fund acquisitions, working capital, capital expenditures, research and development efforts and other general corporate purposes; |
• | requiring us under certain circumstances to repatriate earnings from our international operations in order to make payments on our indebtedness, which would require us to incur a U.S. federal income tax liability that is not currently accrued in our financial statements; |
• | requiring us to liquidate short-term or long-term investments in order to make payments on our indebtedness, which could generate losses; |
• | exposing us to the risk of increased interest rates as borrowings under the Credit Agreement are subject to variable rates of interest; and |
• | limiting our ability to borrow additional funds. |
Even if we comply with all of the applicable covenants, the restrictions on the conduct of our business could adversely affect our business by, among other things, limiting our ability to take advantage of financings, mergers, acquisitions and other corporate opportunities that may be beneficial to the business. See Note 8, Credit Agreement, in the Notes to the Consolidated Financial Statements in Item 8 of Part II of this Annual Report on Form 10-K, for additional information regarding our Credit Agreement.
Failure to maintain proper and effective internal controls could have a material adverse effect on our business, operating results and stock price.
Section 404 of the Sarbanes-Oxley Act of 2002 (the “Sarbanes-Oxley Act”) and related requirements require an annual management assessment of the effectiveness of our internal control over financial reporting and an audit by our independent auditors of our internal control over financial reporting. Ensuring that we have adequate internal financial and accounting controls and procedures in place so that we can produce reliable financial statements on a timely basis is a costly and time-consuming effort that needs to be re-evaluated frequently. Our internal control over financial reporting is a process designed to provide reasonable assurance regarding the reliability of financial reporting and the preparation of financial statements in accordance with generally accepted accounting principles. If we fail to maintain proper and effective internal controls, our ability to produce accurate and timely financial statements could be impaired or our operating results could be harmed, either result which could have a material adverse effect on our business and stock price.
We have documented and tested our internal controls over financial reporting for the year ended December 31, 2014. If in the future we are not able to comply with the requirements of Section 404 of the Sarbanes-Oxley Act in a timely manner, or if as part of our process of documenting and testing our internal controls over financial reporting, we or our independent registered public accounting firm identify deficiencies or areas for further attention and improvement, implementing appropriate changes to our internal controls may distract our officers and employees, entail substantial costs to modify our existing processes and take significant time to complete. These changes may not, however, be effective in maintaining the adequacy of our internal controls, and any failure to maintain that adequacy, or consequent inability to produce accurate financial statements on a timely basis, could increase our operating costs and harm our business. In addition, investors’ perceptions that our internal controls are inadequate or that we are unable to produce accurate financial statements on a timely basis may harm our stock price and make it more difficult for us to effectively market and sell our services to new and existing customers.
Changes in financial accounting standards or practices may cause adverse, unexpected financial reporting fluctuations and affect our reported results of operations.
A change in accounting standards or practices can have a significant effect on our reported results and may even affect our reporting of transactions completed before the change is effective. New accounting pronouncements and varying interpretations of accounting pronouncements have occurred and may occur in the future. Changes to existing rules or the questioning of current practices may adversely affect our reported financial results or the way in which we conduct our business.
We may be subject to regulation of our marketing and customer solicitation, which could harm our business.
18
As part of our product download process and during our sales process, most of our customers agree to receive emails and other communications from us. We also use tracking technologies, including cookies and related technologies, to help us track the activities of the visitors to our websites and to communicate with existing and potential customers. However, we may be subject to restrictions on our ability to collect and use customer data and on how to communicate with customers through email and phone calls. Several jurisdictions have proposed or adopted privacy-related laws that restrict or prohibit unsolicited email or “spam” or regulate the use of cookies. We expect increased regulation related to data privacy to continue. New laws and regulations may impose significant monetary penalties for violations and complex and often burdensome requirements in connection with sending commercial email or other data-driven marketing practices. As a result of such regulation, we may be required to modify or discontinue our existing marketing practices, which could increase our marketing costs.
We offer products to customers in multiple states and foreign jurisdictions and, accordingly, may become subject to laws and regulations of different jurisdictions imposing different standards and requirements related to data privacy. Our business efficiencies and economies of scale depend on generally uniform product offerings and uniform treatment of customers across all jurisdictions in which we operate. Compliance requirements that vary significantly from jurisdiction to jurisdiction would impose added costs on our business and increase liability for compliance deficiencies.
If we fail to protect confidential information against security breaches, or if our customers or potential customers are reluctant to use our websites because of privacy concerns, we might face additional costs and activity in our websites could decline.
During the purchasing process and in connection with evaluations of our software, either we or third party providers collect and use customer information, including personally identifiable information, such as credit card numbers, email addresses, phone numbers and IP addresses. This information could be compromised or accessed as a result of misappropriation or security breaches, and we could be subject to liability as a result. Our policies concerning the collection, use and disclosure of such information are described on our websites. We could be subject to legal claims, government action or harm to our reputation if we or our third party service providers fail to comply or are seen as failing to comply with our policies concerning customer information or if our policies are inadequate. Concern among prospective customers regarding our use of information collected on our websites could keep prospective customers from purchasing our products.
Our servers and those of our third party service providers are vulnerable to various security incidents, including computer viruses or physical or electronic break-ins. Industry-wide incidents or incidents with respect to our specific websites, including misappropriation of third party information, security breaches, or changes in industry standards, regulations or laws, could deter people from using the Internet or our websites to conduct transactions that involve the transmission of confidential information, which could harm our business.
The laws of some states and countries require businesses that maintain personal information about their residents in electronic databases to implement reasonable measures to keep that information secure. In addition, under the laws of some states and countries, if there is a breach of our computer systems and we know or suspect that unencrypted personal customer information has been stolen, we may be required to inform the representative state attorney general or federal or country regulator, media and credit reporting agencies, and any customers whose information was stolen, which could harm our reputation and business. Other states and countries have enacted different and often contradictory requirements for protecting personal information collected and maintained electronically. Compliance with numerous and contradictory requirements of the different states and countries is particularly difficult for an online business such as ours that collects personal information from customers in multiple jurisdictions. Failure to comply with these laws could result in legal liability. In addition, we could suffer adverse publicity and loss of customer confidence were it known that we did not take adequate measures to assure the confidentiality of the personally identifiable information that our customers had given to us. This could result in a loss of customers and revenue that could jeopardize our success. We may not be successful in avoiding potential liability or disruption of business resulting from the failure to comply with these laws and, even if we comply with laws, may be subject to liability due to a security incident. If we were required to pay any significant amount of money in satisfaction of claims under these laws, or any similar laws enacted by other jurisdictions, or if we were forced to cease our business operations for any length of time as a result of our inability to comply fully with any of these laws, our business, operating results and financial condition could be adversely affected. Further, complying with the applicable notice requirements in the event of a security breach could result in significant costs.
If we sustain system failures, cyber attacks to our systems or to our products or other data security incidents or breaches, we could suffer a loss of revenue and increased costs, exposure to significant liability, reputational harm and other serious negative consequences.
We are heavily dependent on our technology infrastructure to sell our products and operate our business. Our infrastructure and that of our third party service providers are vulnerable to damage or interruption from natural disasters, power loss, telecommunication failures, cyber attacks such as computer viruses, computer denial-of-service attacks, physical or
19
electronic break-ins and other events. Computer programmers and hackers also may be able to develop and deploy viruses, worms, and other malicious software programs that attack our websites or our products or otherwise exploit any security vulnerabilities of our websites or our products, including those we distribute of third parties. In addition, sophisticated hardware and operating system software and applications that we procure from third parties may contain defects in design or manufacture, including “bugs” and other problems that could unexpectedly interfere with the operation of our systems.
The foregoing security problems could result in, among other consequences, loss or theft of, our customers’ proprietary or personally identifiable information. The costs to us to eliminate or address the foregoing security problems and security vulnerabilities before or after a cyber incident could be significant. Our remediation efforts may not be successful and could result in interruptions, delays or cessation of service and loss of existing or potential customers that may impede sales of our products or other critical functions. We could lose existing or potential customers in connection with any actual or perceived security vulnerabilities in our websites or our products. In addition, breaches of our security measures and the unapproved dissemination of proprietary information or sensitive or confidential data about us or our customers or other third parties, could expose us, our customers, or other third parties affected to a risk of loss or misuse of this information, result in litigation, damage our brand and reputation, or otherwise harm our business, operating results and financial condition.
Our business and financial performance could be negatively impacted by changes in tax laws or regulations.
New income, sales, use or other tax laws, statutes, rules, regulations or ordinances could be enacted at any time. Further, existing tax laws, statutes, rules, regulations or ordinances could be interpreted, changed, modified or applied adversely to us. Any changes to these existing tax laws could adversely affect our domestic and international business operations, and our business and financial performance. Additionally, these events could require us or our customers to pay additional tax amounts on a prospective or retroactive basis, as well as require us or our customers to pay fines and/or penalties and interest for past amounts deemed to be due. If we raise our product and maintenance prices to offset the costs of these changes, existing customers may elect not to renew their maintenance arrangements and potential customers may elect not to purchase our products. Additionally, new, changed, modified or newly interpreted or applied tax laws could increase our customers’ and our compliance, operating and other costs, as well as the costs of our products. Further, these events could decrease the capital we have available to operate our business. Any or all of these events could adversely impact our business and financial performance.
In the U.S., there are several proposals under consideration to reform tax law, including proposals that may reduce or eliminate the deferral of U.S. income tax on unrepatriated foreign earnings and penalize certain transfer pricing structures. In addition, foreign governments are considering, and may adopt, tax reform measures such as those recommendations set forth in the Organization for Economic Co-operation and Development’s project on “Base Erosion and Profit Shifting” (BEPS). In Ireland recently, the Ireland Finance Act of 2014 announced certain tax law changes to take effect after December 31, 2020 that, along with any other prospective changes to tax laws and regulations or enactment of new unfavorable tax laws and regulations, in the United States and/or other foreign countries in which we and our affiliates operate, could increase our worldwide effective tax rate, and harm our business and financial performance.
Our results of operations for the years ended December 31, 2014 and 2013 benefit from the tax credit incentives under the U.S. research and experimentation tax credit, or R&E tax credit. The R&E tax credit expired on December 31, 2014, and may not be renewed, or if renewed, it may be renewed on terms significantly less favorable than current tax incentives or on terms resulting in our disqualification from the benefits of the R&E tax credit. The elimination or significant reduction in the tax credit would increase our effective tax rate and would adversely affect our results of operations.
Additional liabilities related to taxes or potential tax adjustments could adversely impact our business and financial performance.
We are subject to tax and related obligations in various federal, state, local and foreign jurisdictions in which we operate or do business. The taxing rules of the various jurisdictions in which we operate or do business are often complex and subject to differing interpretations. Tax authorities could challenge our tax positions we historically have taken, or intend to take in the future, or may audit the tax filings we have made and assess additional taxes. Tax authorities may also assess taxes in jurisdictions where we have not made tax filings. Any assessments incurred could be material, and may also involve the imposition of substantial penalties and interest. Significant judgment is required in evaluating our tax positions and in establishing appropriate reserves, and the resolutions of our tax positions are unpredictable. The payment of additional taxes, penalties or interest resulting from any assessments could adversely impact our business and financial performance.
We intend to invest our non-U.S. earnings permanently in foreign operations. If for some reason our need for U.S. cash changes, and we are unable to remit these foreign earnings to our U.S. entities in a tax-free manner, we could incur material U.S. federal tax liabilities which could adversely impact our business and financial performance.
20
Government regulation of the Internet and e-commerce is evolving, and unfavorable changes or our failure to comply with regulations could harm our operating results.
As Internet commerce continues to evolve, increasing regulation by federal, state or foreign agencies becomes more likely. For example, we believe increased regulation is likely in the area of data privacy. Laws and regulations applying to the solicitation, collection, processing or use of personal or consumer information could affect our ability to use and share data, potentially increasing administration costs to obtain, collect, process or use such data or reducing the reach and demand for our products. In addition, taxation of products and services provided over the Internet or other charges imposed by government agencies or by private organizations for accessing the Internet may also be imposed. Any regulation imposing greater fees for Internet use or restricting information exchange over the Internet could result in a decline in the use of the Internet and the viability of Internet-based services and product offerings, which could harm our business and operating results.
Risks Related to Ownership of Our Common Stock
Our stock price may be volatile.
The market price of our common stock has been and could be subject to wide fluctuations in response to, among other things, the factors described in this “Risk Factors” section or otherwise, and other factors beyond our control, such as fluctuations in the valuations of companies perceived by investors to be comparable to us.
Furthermore, the stock markets have experienced price and volume fluctuations that have affected and continue to affect the market prices of equity securities of many companies. These fluctuations often have been unrelated or disproportionate to the operating performance of those companies. These broad market fluctuations, as well as general economic, political and market conditions, such as sovereign debt issues, interest rate changes and international currency fluctuations, may negatively affect the market price of our common stock.
We and other companies that have experienced volatility in the market price of their stock have become subject to securities class action litigation. We may be the target of additional litigation of this type in the future. Additional securities litigation against us could result in substantial costs and divert our management’s attention from other business concerns, which could seriously harm our business.
Your ownership percentage could be diluted and our stock price could decline due to the issuance of additional shares of stock in connection with acquisitions, our equity incentive plans or otherwise.
We have a number of shares of common stock authorized but unissued that could be issued under our equity incentive plans or otherwise. As of December 31, 2014, we had 75.9 million shares outstanding, 5.0 million shares subject to issuance upon the exercise of stock options and settlement of restricted stock units, and 12.2 million shares available for issuance under our 2008 equity incentive plan, or 2008 Plan. In addition, our 2008 Plan contains an evergreen provision, which provides for an automatic annual increase in the number of shares available for issuance under the 2008 Plan on the first day of each fiscal year in an amount equal to the lesser of 6.0 million shares, 4.75% of the number of shares outstanding on the last day of the immediately preceding fiscal year or such lesser number of shares as may be determined by our board of directors. For 2015, the annual increase pursuant to the evergreen provision was not approved by the board of directors. We intend to continue to pursue strategic acquisitions and may pay for such acquisitions, in part or in full, through the issuance of additional equity. Any issuance of shares in connection with our acquisitions, the exercise of stock options, the settlement of restricted stock units or otherwise would dilute the percentage ownership held by our then existing stockholders and could cause our stock price to decline.
We can issue shares of preferred stock without stockholder approval, which could adversely affect the rights of common stockholders.
Our amended and restated certificate of incorporation permits us to establish the rights, privileges, preferences, and restrictions, including voting rights, of future series of our preferred stock and to issue such stock without approval from our stockholders. The rights of holders of our common stock may suffer as a result of the rights granted to holders of preferred stock that we may issue in the future. In addition, we could issue preferred stock to prevent a change in control of us, depriving common stockholders of an opportunity to sell their stock at a price in excess of the prevailing market price.
Our charter documents and Delaware law could prevent a takeover that stockholders consider favorable and could also reduce the market price of our stock.
Our amended and restated certificate of incorporation and our amended and restated bylaws contain provisions that could delay or prevent a change in control of our Company. These provisions could also make it more difficult for stockholders to elect directors and take other corporate actions. These provisions include:
• | a classified board of directors with three-year staggered terms; |
21
• | not providing for cumulative voting in the election of directors; |
• | authorizing the board to issue, without stockholder approval, preferred stock with rights senior to those of our common stock; |
• | prohibiting stockholder action by written consent; and |
• | requiring advance notification of stockholder nominations and proposals. |
These and other provisions in our amended and restated certificate of incorporation and our amended and restated bylaws and under Delaware law could discourage potential takeover attempts, reduce the price that investors might be willing to pay in the future for shares of our common stock and result in the market price of our common stock being lower than it would be without these provisions.
If securities analysts do not continue to publish research or reports about our business or if they publish negative evaluations of our stock, the price of our stock could decline.
We believe that the trading price for our common stock will be affected by research or reports that industry or financial analysts publish about us or our business. If one or more of the analysts who may elect to cover us downgrade their evaluations of our stock, the price of our stock could decline. If one or more of these analysts cease coverage of our company, we could lose visibility in the market for our stock, which in turn could cause our stock price to decline.
We do not intend to pay dividends on our common stock.
We have neither declared nor paid any cash dividends on our common stock. We do not expect to pay dividends on our common stock for the foreseeable future and currently anticipate that all of our earnings will be used for the operation and growth of our business.
ITEM 1B. | UNRESOLVED STAFF COMMENTS |
None.
ITEM 2. | PROPERTIES |
We lease our offices and do not own any real estate. Our corporate headquarters is located in Austin, Texas and currently consists of approximately 172,000 square feet and will increase to approximately 230,000 square feet in the second quarter of 2015. We also lease office space domestically and internationally in various locations for our operations, including facilities located in Utah, Colorado, Canada, the Czech Republic, Ireland and India. See Note 14, Commitments and Contingencies, in the Notes to the Consolidated Financial Statements for more information about our lease commitments.
We believe our current facilities, combined with our planned expansions to our facilities, will be adequate for the foreseeable future. If we require additional or substitute space, we believe that we will be able to obtain such space on acceptable, commercially reasonable terms.
ITEM 3. | LEGAL PROCEEDINGS |
From time to time, we have been and may be involved in various legal proceedings and claims arising in our ordinary course of business. At this time, neither we nor any of our subsidiaries is a party to, and none of our respective property is the subject of, any material legal proceeding. However, the outcome of legal proceedings and claims brought against us are subject to significant uncertainty. Therefore, if one or more of these legal matters were resolved against us in the same reporting period for amounts in excess of management’s expectations, our consolidated financial statements for a particular period could be materially adversely affected. See the risk factor “Litigation exposure related to our pending and any future litigation could adversely affect our results of operations, profitability and cash flows” in Part I, Item 1A under the heading “Risk Factors.”
ITEM 4. | MINE SAFETY DISCLOSURES |
Not applicable.
22
PART II
ITEM 5. | MARKET FOR REGISTRANT’S COMMON EQUITY, RELATED STOCKHOLDER MATTERS AND ISSUER PURCHASES OF EQUITY SECURITIES |
Market Information
Our common stock is listed on the New York Stock Exchange (“NYSE”) under the symbol “SWI.” The following table sets forth for the periods indicated the high and low sales prices per share of our common stock as reported on the NYSE:
Sales Price Per Share in 2014 | |||||||
Quarter | Low | High | |||||
Fourth Quarter | $ | 39.20 | $ | 53.44 | |||
Third Quarter | $ | 37.41 | $ | 44.57 | |||
Second Quarter | $ | 36.54 | $ | 44.44 | |||
First Quarter | $ | 37.37 | $ | 46.95 | |||
Sales Price Per Share in 2013 | |||||||
Quarter | Low | High | |||||
Fourth Quarter | $ | 31.94 | $ | 39.15 | |||
Third Quarter | $ | 34.54 | $ | 46.25 | |||
Second Quarter | $ | 37.96 | $ | 59.57 | |||
First Quarter | $ | 52.06 | $ | 61.52 | |||
On February 18, 2015, the last reported sales price of our common stock on the NYSE was $50.43 per share and, as of December 31, 2014, there were 22 holders of record of our common stock. Because many of our shares of common stock are held by brokers and other institutions on behalf of stockholders, this number is not representative of the total number of stockholders represented by these stockholders of record.
Dividend Policy
We have neither declared nor paid any cash dividends on our common stock and we do not expect to pay dividends on our common stock for the foreseeable future. We anticipate that all of our earnings will be used for the operation and growth of our business. Any future determination to pay dividends on our common stock would be subject to the discretion of our board of directors and would depend upon various factors, including our results of operations, financial condition and liquidity requirements, restrictions that may be imposed by applicable law and our contracts, and other factors deemed relevant by our board of directors.
Performance Graph
The graph set forth below compares the cumulative total stockholder return on our common stock for the five year period between December 31, 2009 and December 31, 2014, with the cumulative total return of (i) the Russell Midcap Index and (ii) the Nasdaq Computer Index, or the Industry Index. This graph assumes the investment of $100 at market close on December 31, 2009 in our common stock, the Russell Midcap Index and the Industry Index, and assumes the reinvestment of dividends, if any. The Industry Index consists of NASDAQ-listed computer hardware and software companies that provide products or services. Note that historic stock price performance is not necessarily indicative of future stock price performance.
The information contained in the Stock Performance Graph shall not be deemed to be soliciting material or to be filed with the SEC nor shall such information be incorporated by reference into any future filing under the Securities Act of 1933 or the Exchange Act, except to the extent we specifically incorporate it by reference into such filing.
23
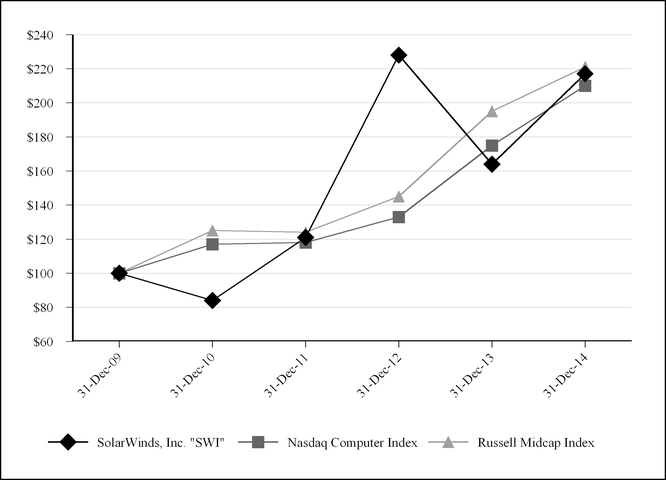
24
ITEM 6. | SELECTED CONSOLIDATED FINANCIAL DATA |
We have derived the following consolidated statement of income data for 2014, 2013 and 2012 and consolidated balance sheet data as of December 31, 2014 and 2013 from our audited consolidated financial statements contained in this Annual Report on Form 10-K. We have derived the following consolidated statement of income data for 2011 and 2010 and consolidated balance sheet data as of December 31, 2012, 2011 and 2010 from our audited consolidated financial statements included in our other SEC filings and not included in this Annual Report. You should read the consolidated financial data set forth below in conjunction with our consolidated financial statements and related notes and the information under “Management’s Discussion and Analysis of Financial Condition and Results of Operations.” Our historical results are not necessarily indicative of our results to be expected in any future period.
Consolidated Statements of Income Data: (in thousands, except per share data) | Year Ended December 31, | ||||||||||||||||||
2014 | 2013 | 2012 | 2011 | 2010 | |||||||||||||||
Revenue: | |||||||||||||||||||
License | $ | 161,795 | $ | 135,839 | $ | 123,984 | $ | 92,254 | $ | 75,603 | |||||||||
Maintenance and other | 238,892 | 191,491 | 144,980 | 106,104 | 76,790 | ||||||||||||||
Subscription (1) | 28,027 | 8,055 | — | — | — | ||||||||||||||
Total revenue | 428,714 | 335,385 | 268,964 | 198,358 | 152,393 | ||||||||||||||
Cost of revenue | 44,366 | 27,916 | 18,400 | 11,989 | 7,930 | ||||||||||||||
Gross profit | 384,348 | 307,469 | 250,564 | 186,369 | 144,463 | ||||||||||||||
Operating expenses: | |||||||||||||||||||
Sales and marketing | 148,420 | 99,289 | 73,046 | 53,850 | 43,252 | ||||||||||||||
Research and development | 56,479 | 37,514 | 28,769 | 21,332 | 15,731 | ||||||||||||||
General and administrative | 77,172 | 49,044 | 35,649 | 28,076 | 23,476 | ||||||||||||||
Accrued earnout gain | — | (125 | ) | (570 | ) | (664 | ) | — | |||||||||||
Total operating expenses | 282,071 | 185,722 | 136,894 | 102,594 | 82,459 | ||||||||||||||
Operating income | 102,277 | 121,747 | 113,670 | 83,775 | 62,004 | ||||||||||||||
Other income (expense): | |||||||||||||||||||
Interest income | 363 | 396 | 430 | 308 | 177 | ||||||||||||||
Interest expense | (684 | ) | (215 | ) | — | — | (1,146 | ) | |||||||||||
Other income (expense), net | 640 | (425 | ) | 419 | 720 | 115 | |||||||||||||
Total other income (expense) | 319 | (244 | ) | 849 | 1,028 | (854 | ) | ||||||||||||
Income before income taxes | 102,596 | 121,503 | 114,519 | 84,803 | 61,150 | ||||||||||||||
Income tax expense | 24,483 | 31,725 | 33,176 | 22,360 | 16,404 | ||||||||||||||
Net income | $ | 78,113 | $ | 89,778 | $ | 81,343 | $ | 62,443 | $ | 44,746 | |||||||||
Basic earnings per share available to common stockholders | $ | 1.03 | $ | 1.19 | $ | 1.10 | $ | 0.86 | $ | 0.65 | |||||||||
Diluted earnings per share available to common stockholders | $ | 1.02 | $ | 1.17 | $ | 1.07 | $ | 0.84 | $ | 0.61 | |||||||||
Shares used in computation of basic earnings per share | 75,476 | 75,182 | 74,166 | 72,812 | 68,664 | ||||||||||||||
Shares used in computation of diluted earnings per share | 76,462 | 76,475 | 76,035 | 74,413 | 72,862 | ||||||||||||||
25
Consolidated Balance Sheet Data: (in thousands) | December 31, | ||||||||||||||||||
2014 | 2013 | 2012 | 2011 | 2010 | |||||||||||||||
Cash and cash equivalents | $ | 237,942 | $ | 165,973 | $ | 179,702 | $ | 122,707 | $ | 142,003 | |||||||||
Short-term and long-term investments | 29,807 | 30,339 | 62,099 | 29,688 | — | ||||||||||||||
Working capital | 116,832 | 48,991 | 146,554 | 93,187 | 108,203 | ||||||||||||||
Deferred revenue | 163,408 | 135,191 | 102,756 | 77,147 | 55,758 | ||||||||||||||
Total assets | 825,032 | 706,342 | 517,395 | 362,408 | 247,477 | ||||||||||||||
Current debt obligations (2) | — | 40,000 | — | — | — | ||||||||||||||
Long-term obligations | 28,309 | 21,791 | 9,391 | 4,367 | 3,992 | ||||||||||||||
Total stockholders’ equity | 588,859 | 483,894 | 382,814 | 264,947 | 175,609 | ||||||||||||||
(1) | Subscription revenue is from the sale of products introduced as a result of our acquisition of N-able in the second quarter of 2013 and our acquisition of Pingdom in the second quarter of 2014. See Note 2, Acquisitions, in the Notes to the Consolidated Financial Statements in Item 8 of Part II of this Annual Report on Form 10-K, for additional information regarding our acquisitions of N-able and Pingdom. |
(2) | Current debt obligations as of December 31, 2013 consist of outstanding principal amounts under a revolving loan that was used to finance a portion of the consideration paid upon the acquisition of Confio. See Note 8, Credit Agreement, in the Notes to the Consolidated Financial Statements in Item 8 of Part II of this Annual Report on Form 10-K, for additional information regarding our Credit Agreement and Note 2, Acquisitions, in the Notes to the Consolidated Financial Statements in Item 8 of Part II of this Annual Report on Form 10-K, for additional information regarding our acquisition of Confio. |
26
ITEM 7. | MANAGEMENT’S DISCUSSION AND ANALYSIS OF FINANCIAL CONDITION AND RESULTS OF OPERATIONS |
The following discussion and analysis of our financial condition and results of operations should be read in conjunction with the “Selected Consolidated Financial Data” and our consolidated financial statements and related notes included elsewhere in this report. In addition to historical consolidated financial information, the following discussion contains forward-looking statements that reflect our plans, estimates and beliefs. Our actual results could differ materially and adversely from those anticipated in the forward-looking statements. See the sections entitled “Safe Harbor Cautionary Statement” and “Risk Factors” above for a discussion of the uncertainties, risks and assumptions associated with these statements.
Overview
We design, develop, market, sell and support enterprise-class information technology, or IT, infrastructure management software to IT and DevOps professionals in organizations of all sizes to manage on-premise, hybrid cloud and public cloud environments. Our product offerings range from individual software tools to more comprehensive software products that solve problems encountered every day by IT and DevOps professionals and help them to efficiently and effectively manage their network, systems, application and website infrastructures. We are committed to offering products that are easy to find, easy to buy, easy to use and easy to maintain, while providing the power to address any IT management problem at any scale. Our customers include small- and mid-size businesses, large enterprises, MSPs, and local, state and federal government entities.
Key Financial Highlights
Key financial highlights for 2014 include the following:
• | Total revenue was $428.7 million for 2014 compared to $335.4 million for 2013, representing an increase of 27.8%; |
• | Combined maintenance and subscription revenue for 2014 was $266.9 million compared to $199.5 million for 2013, representing 33.8% year-over-year growth in recurring revenue; |
• | Operating income was $102.3 million, or an operating margin of 23.9% for 2014 compared to $121.7 million, or 36.3% for 2013; |
• | Non-GAAP operating income was $187.0 million, or a non-GAAP operating margin of 43.6% for 2014 compared to $170.4 million, or 50.8% for 2013; |
• | Net income was $78.1 million for 2014 compared to $89.8 million for 2013, representing a decrease of 13.0%; |
• | Net income was $1.02 per share on a fully diluted basis for 2014 compared to $1.17 per share on a fully diluted basis for 2013, resulting in a decrease of 12.8%; and |
• | Cash flow from operating activities was $199.8 million for 2014 compared to $163.3 million for 2013, representing an increase of 22.3%. |
In 2014, we invested across our business and, in particular, invested in areas that we believe are an important foundation for our long term growth. For example:
• | We increased our investment in our marketing programs, team and systems, in an effort to increase the awareness of SolarWinds and our products as well as to better capture demand, and specifically to accomplish those goals more consistently for our different products and in our different geographies; |
• | We increased our investment in product development in an effort to accelerate new product releases and enhancements for our products in order to improve the usability and add features our customers rely on daily; |
• | We increased our investment in our sales function in an effort to better convert the demand that we capture through our marketing activities, to expand our sales efforts within our existing customer base and to expand our sales team focused on the MSP market; and |
• | We invested in the expansion of our facilities and IT infrastructure to support the growth of our operations. |
We are committed to our business model and have continued to focus on ways to leverage and refine our model. We believe our business model can be leveraged in the on-premise, hybrid cloud and public cloud environments. We believe we can expand our market opportunity in the hybrid IT environment by applying the key differentiating elements of our business model and continuing to create powerful and scalable, easy-to-use and affordable software. Our strategic focus in 2015 is centered around the following initiatives:
• | Creating the ability to "manage all things IT;" |
27
• | Improving the competitive positioning of our products by investing in new product features and infrastructure in on-premise, hybrid cloud and public cloud environments; |
• | Acquiring and internally developing products that will expand our presence in our current markets or new markets; |
• | Expanding our web presence, brand awareness and improving our communication with prospects and our current customer base both domestically and internationally; |
• | Increasing our presence in several key geographic markets including Asia-Pacific, Latin America, Europe, Middle East and Africa through demand generation activity, marketing awareness, localized marketing material and new relationships with distributors and resellers; |
• | Accelerating the rate at which we sell additional products into our install base; |
• | Expanding our international operations company-wide at lower cost locations to drive our competitive advantage; and |
• | Maintaining high renewal rates of our maintenance and subscription customers by continuing to deliver ongoing value to our customer base. |
We expect to continue to generate solid growth while delivering strong operating income and to increase our cash flows from operating activities with our disciplined approach to investing in our business combined with our large market opportunity.
Acquisitions
We have made multiple acquisitions of businesses as part of our growth strategy and expect to continue to pursue acquisitions that will enable us to enter new markets, or new segments of our existing markets, by bringing new product offerings to market more quickly than we can develop them.
In June 2014, we acquired Pingdom, a provider of website monitoring and performance management solutions. The acquisition increased our product offerings and we believe will allow us to leverage the opportunity associated with performance management for critical websites and web applications. Pingdom is based in Vasteras, Sweden.
In late January 2015, we acquired Librato, a cloud-based infrastructure monitoring company. Librato enables full-stack performance monitoring of infrastructure and applications on public clouds, such as AWS and Heroku, or in a company's own data centers. The acquisition of Librato represents another step in our efforts to extend and connect performance management capabilities from on-premise IT infrastructure to cloud-based application environments. Librato is based in San Francisco, California.
We account for our acquisitions using the acquisition method of accounting. Accordingly, the financial results for our acquisitions are included in our consolidated financial results since the applicable acquisition dates. For further information regarding these acquisitions, see Note 2, Acquisitions in the Notes to Consolidated Financial Statements in Item 8 of Part II of this Annual Report on Form 10-K.
Key Business Metrics
We review a number of key business metrics to help us monitor the performance of our business model and to identify trends affecting our business. The measures that we believe are the primary indicators of our quarterly and annual performance are as follows:
Revenue Growth
Revenue growth includes the growth in our license, maintenance and subscription revenue, which are critical to our long-term success. We have employed a differentiated business model for marketing and selling high volumes of enterprise-class software, which is focused on revenue growth at high operating margins. We have built a financial and operational model that focuses on the long-term value of our customer relationships. After the initial new license or subscription purchase, our goal is to create opportunities for sales of additional products, license or subscription upgrades and renewal purchases from the customer. This is an important component of our financial model and future revenue growth. This model is based on the premise that we will be able to deliver ongoing value to our customers and maintain a long-term financial relationship with the users of our IT management products. Our recurring revenue, which consists of maintenance and subscription revenue, is reflective of the relationship we have built with our customers. We regularly review our total revenue growth to measure the success of our investments and strategic business decisions. Our annual revenue growth percentages were 27.8%, 24.7% and 35.6% for the years ended December 31, 2014, 2013 and 2012, respectively. We currently expect our total revenue growth to be approximately 20% to 24% for fiscal year 2015.
28
Non-GAAP Operating Income and Non-GAAP Operating Margin
Our management uses non-GAAP operating income and non-GAAP operating margin as key measures of our performance. Because our non-GAAP operating income excludes certain items such as amortization of intangible assets, stock-based compensation and related employer-paid payroll taxes, certain acquisition related adjustments and restructuring charges that may not be indicative of our core business, we believe that this measure provides us with additional useful information to measure and understand our performance, particularly with respect to changes in performance from period to period. We use non-GAAP operating income and non-GAAP operating margin in the preparation of our budgets and to measure and monitor our performance. Non-GAAP operating income and non-GAAP operating margin is not determined in accordance with GAAP and is not a substitute for, or superior to, financial measures determined in accordance with GAAP. Our annual GAAP operating margins were 23.9%, 36.3% and 42.3% for the years ended December 31, 2014, 2013 and 2012, respectively. Our annual non-GAAP operating margins were 43.6%, 50.8% and 53.8% for the years ended December 31, 2014, 2013 and 2012, respectively. Our non-GAAP margins declined in each of 2013 and 2014 as a result of our increased investments in the business in late 2013 and 2014 to support our growth. We currently expect our non-GAAP operating margin to be approximately 40% to 41% for fiscal year 2015.
For further discussion regarding non-GAAP financial measures, including non-GAAP operating income and non-GAAP operating margin, see “Non-GAAP Financial Measures” below.
Opportunities, Trends and Uncertainties
Businesses, governments and other organizations are increasingly relying on networks, systems, and applications to execute their operations, facilitate their internal and external communications and transact business with their customers and partners. The size of these networks, the number of applications and servers, and the complexity of physical and virtual server environments are increasing as organizations place more reliance on them. In addition, business initiatives to capture, store and analyze an increasing amount of organizational data are creating new IT management challenges. Furthermore, the adoption of cloud computing technologies, which is shifting a growing number of critical workloads off premises, is also creating new IT management complexities and placing increasing importance on the performance of IT assets as compute resources become more distributed. The development and evolution of cloud computing technologies is also allowing a growing number of small and mid-size organizations to rely upon third parties, known as MSPs, for their IT management needs. These MSPs need powerful, yet easy-to-use and affordable solutions in order to address a wide range of IT management issues for the thousands of small and mid-size organizations they serve.
In order to address these challenges, we offer a cohesive portfolio of powerful, yet easy-to-use and affordably priced IT management products spanning networks, systems, application and web performance management across on-premise, hybrid cloud and public cloud environments. We believe that IT-related trends and the limitations of existing offerings present a significant market opportunity for our products and starting in 2013, we began to increase our investment as a percentage of revenue to take advantage of this market opportunity. We expect our revenue to continue to grow as we capitalize on these and other market opportunities through acquisitions and development. Our ability to grow revenue will depend on a number of factors and assumptions, many of which are outside of our control. Further, any revenue growth and operating synergies of our acquired products and businesses depends on our ability to successfully integrate those products and businesses and may be lower than expected if we are unable to do so in the future.
In 2014, we recognized 27.3% of our revenue from sales by our international subsidiaries, which includes all subsidiaries outside of North America. We believe there is a substantial opportunity for additional sales of our software in the Europe, Middle East and Africa, or EMEA, region, the Asia-Pacific region, and the Latin American region. We intend to increase our sales, marketing and support operations in these regions. However, we believe there is significant uncertainty regarding the economic conditions in certain of these geographic regions. While we believe that any difficult economic conditions may adversely affect the sales of our products, this could also offer us an opportunity to market and sell our products to mid-size businesses and enterprise customers at compelling prices compared to the prices of some competing products.
We expect the U.S. federal government to continue to be a significant market opportunity, as we believe the ease of deployment, power and scalability of our products gives us a competitive advantage to sell to various agencies and departments of the U.S. federal government. We have experienced and continue to expect inconsistency in the buying pattern of the U.S. federal government for larger transactions with our products. We believe that many of our larger transactions, both new licenses and maintenance renewals, with the U.S. federal government are dependent on specific projects that are largely dependent on systems integrators, distributors and resellers whose purchases from us have been difficult to predict.
29
Key Components of Our Results of Operations
Sources of Revenue
Our revenue is primarily comprised of license, maintenance and subscription revenue.
License, Maintenance and Other Revenue. We primarily license our software under perpetual licenses, which ordinarily include one year of maintenance as part of the initial purchase price of the product. License revenue reflects the revenue recognized from sales of new perpetual licenses and upgrades of license size to our software. We have experienced annual growth in license revenue. Maintenance revenue is an important source of our future revenue. Customers can renew, and generally have renewed, their maintenance agreements at our standard list maintenance renewal pricing for their software products. Current customers with maintenance agreements are entitled to receive unspecified upgrades or enhancements when and if they become available. We have experienced strong and consistent annual and quarterly growth in maintenance and other revenue. Because our maintenance base has continued to grow each year due to new license sales, high customer retention and acquisitions, we expect maintenance revenue to continue to increase in absolute dollars in future periods.
Subscription Revenue. We primarily derive subscription revenue from fees received from our MSP customers for time-based license arrangements and software-as-a-service, or SaaS, offerings. We also include the fees from sales of the Pingdom cloud products, acquired in late June 2014, in our subscription revenue. We currently sell our subscription products separately from our perpetual license offerings. In late January 2015, we acquired Librato, a cloud-based infrastructure monitoring company, which will also be included in our subscription revenue in 2015.
Cost of Revenue
Cost of revenue primarily consists of amortization of acquired developed product technologies, personnel costs related to providing technical support services and royalty fees and server and hosting fees. Personnel costs include salaries, bonuses and stock-based compensation and related employer-paid payroll taxes for technical support personnel, as well as an allocation of our facilities, information technology, employee benefit and other overhead costs. Royalty fees are primarily related to original equipment manufacturer, or OEM, arrangements in our MSP business. We allocate stock-based compensation expense and related employer-paid payroll taxes to personnel costs based on the expense category in which the option or restricted stock unit holder works. We allocate overhead, such as rent, computer and other technology costs, and employee benefit costs to personnel costs in each expense category based on worldwide headcount in that category.
The amortization of developed product technologies can vary significantly each period based on the size and timing of our acquisitions. We expect our cost of revenue to increase in absolute dollars and to fluctuate as a percentage of revenue as we acquire additional companies or cloud technologies that require additional hosting and server fees and as we increase our headcount to support new customers and product offerings.
Operating Expenses
We classify our operating expenses into three categories: sales and marketing, research and development, and general and administrative.
Our operating expenses primarily consist of personnel costs, contract research and development costs, marketing program costs and legal, accounting, consulting and other professional service fees. Personnel costs for each category of operating expenses primarily include employee compensation costs and facility overhead costs. We include restructuring charges related to severance and relocation in the employee's respective department.
Our operating expenses increased in absolute dollars and as a percentage of revenue in 2014 compared to 2013 and 2012, as we have continued to build infrastructure and add employees through acquisitions and organic growth across all departments in order to accelerate and support our growth. We increased our investment in product development, marketing and sales in late 2013 and 2014 for initiatives we believe are important to our long-term goals. These investments focused on the development of new products and strategic releases to our current products and streamlining our demand generation process in our marketing and sales organizations. The number of full-time employees as of December 31, 2014 was 1,646, as compared to 1,312 as of December 31, 2013 and 865 as of December 31, 2012.
We expect our operating expenses to continue to increase in absolute dollars as we make long-term investments in our business both domestically and internationally. Our operating expenses in future periods also may increase in absolute dollars and fluctuate as a percentage of revenue as a result of any future acquisitions and any further decisions to increase our investment in our business. In addition, we intend to continue to grant equity awards to our current executives and employees and those who join us in the future through acquisitions or otherwise, which will result in additional stock-based compensation expense.
30
Sales and Marketing. Sales and marketing expenses primarily consist of personnel costs for our sales, marketing and business development employees and executives, commissions earned by our sales personnel, the cost of marketing programs such as paid search, search engine optimization and management, trade shows, website maintenance and design and the cost of business development programs. We expect to continue to hire sales personnel in the United States and in our international sales offices to drive new license sales growth. We also expect to continue to invest in our websites, online user community site, brand awareness initiatives and marketing programs to drive customer downloads and support our new product launches.
Research and Development. Research and development expenses primarily consist of personnel costs for our product development employees and executives and, to a lesser extent, contractor fees. We have devoted our development efforts primarily to expanding our product line and increasing the functionality and enhancing the ease-of-use of our software products. We have significantly increased our research and development employee headcount through the continued expansion of our research and development centers in the Czech Republic and India and through acquisitions. We expect to continue to invest in our research and development activities by hiring engineers in our international locations.
General and Administrative. General and administrative expenses primarily consist of personnel costs for our executive, finance, legal, human resources and other administrative personnel, the amortization of acquired intangible assets, general restructuring charges and acquisition related costs. Legal, accounting and other professional service fees, along with general corporate expenses are also recorded in general and administrative expenses. Restructuring charges include the expenses related to the closing of certain offices such as severance, relocation and the estimated costs of exiting and terminating facility lease commitments. Acquisition related costs include due diligence and deferred compensation expenses related to our acquisitions. We expect to incur higher administrative costs in future periods as our business continues to grow both organically and through acquisitions.
Other Income (Expense)
Other income (expense) primarily consists of interest income, interest expense, transactional foreign exchange gains (losses), foreign exchange contracts gains (losses) and grant income.
Income Tax Expense
Income tax expense primarily consists of corporate income taxes related to profits resulting from the sale of our software offerings by our four entities that sell our software, one in the United States, one in Canada, one in Ireland and one in Sweden. The rate of taxation on income earned by our U.S. entity is higher than the rate of taxation on income earned by our Canadian, Irish and Swedish entities. If our international income, as a percentage of total income, increases as we expect, then our effective income tax rate should correspondingly decline. However, our effective tax rate may be affected by many other factors, such as changes in tax laws, regulations or rates, new interpretations of existing laws or regulations, the impact of accounting for stock-based compensation, the impact of accounting for business combinations, the impact of accounting for uncertain tax positions, changes in our international structure, shifts in the amount of taxable income earned in the United States, as compared with other regions in the world, and changes in overall levels of income before tax.
We benefited from the tax credit incentives under the U.S. research and experimentation credit extended to taxpayers engaged in qualified research and experimental activities while carrying on a trade or business. The tax credit expired on December 31, 2014, and if not renewed under similar terms as in prior years, the result could have a material impact on our financial results.
Critical Accounting Policies and Estimates
Our consolidated financial statements are prepared in conformity with United States of America generally accepted accounting principles, or GAAP, and require our management to make estimates and assumptions that affect the reported amounts of assets, liabilities, revenue, costs and expenses and related disclosures. We base our estimates on historical experience and on various other assumptions that we believe to be reasonable under the circumstances. In many instances, we could reasonably use different accounting estimates, and in some instances, changes in the accounting estimates are reasonably likely to occur from period to period. Accordingly, actual results could differ significantly from the estimates made by our management. To the extent that there are differences between our estimates and actual results, our future financial statement presentation, financial condition, results of operations and cash flows will be affected, perhaps materially.
In many cases, the accounting treatment of a particular transaction is specifically dictated by GAAP and does not require management’s judgment in its application, while in other cases, management’s judgment is required in selecting among available alternative accounting standards that allow different accounting treatment for similar transactions. We believe that these accounting policies requiring significant management judgment and estimates are critical to understanding our historical and future performance, as these policies relate to the more significant areas of our financial results. These critical accounting policies are:
31
• | Valuation of goodwill, intangibles, long-lived assets and contingent consideration, including accrued earnouts; |
• | Revenue recognition; |
• | Stock-based compensation; |
• | Income taxes; and |
• | Loss contingencies. |
Acquisitions, Goodwill and Identifiable Intangible Assets
When we acquire businesses, we allocate the purchase price to the fair value of the assets acquired and liabilities assumed, including identifiable intangible assets. Any residual purchase price is recorded as goodwill. We must also estimate the fair value of any contingent consideration. The operating results of acquisitions are included in our consolidated financial statements from the effective date of the acquisition.
The fair value of identifiable intangible assets is based on significant judgments made by management. We typically engage third party valuation appraisal firms to assist us in determining the fair values and useful lives of the assets acquired. Such valuations and useful life determinations require us to make significant estimates and assumptions. These estimates and assumptions are based on historical experience and information obtained from management, and also include, but are not limited to, future expected cash flows earned from the intangible asset and discount rates applied in determining the present value of those cash flows. Unanticipated events and circumstances may occur that could affect the accuracy or validity of such assumptions, estimates or actual results.
The acquired developed product technologies recorded for each acquisition were feasible at the date of acquisition as they were being actively marketed and sold by the acquired company at the acquisition date. In addition to the acquired developed product technologies, we also record intangible assets for the acquired company’s customer relationships, customer backlog, trademarks, in process research and development and non-competition covenants.
An impairment of goodwill is recognized when the carrying amount of the assets exceeds their fair value. The process of evaluating the potential impairment is highly subjective and requires the application of significant judgment. For purposes of the annual impairment test, we assess qualitative factors to determine if it is more likely than not that goodwill might be impaired and whether it is necessary to perform the quantitative impairment test which considers our market capitalization compared with the carrying amount of our net assets on the date of the test, since we have only one reporting unit. If an event occurs that would cause us to revise our estimates and assumptions used in analyzing the value of our goodwill, the revision could result in a non-cash impairment charge that could have a material impact on our financial results. As of December 31, 2014 and 2013, we performed our annual review of goodwill and concluded that no impairment existed for our reporting unit during any of the periods presented. No impairment charges have been required to date.
We evaluate long-lived assets, including finite-lived intangible assets and other assets, for impairment whenever events or changes in circumstances indicate that the carrying amount of the assets may not be recoverable. Events or changes in circumstances that could result in an impairment review include, but are not limited to, significant underperformance relative to historical or projected future operating results, significant changes in the manner of use of the acquired assets or the strategy for our overall business, and significant negative industry or economic trends. If an event occurs that would cause us to revise our estimates and assumptions used in analyzing the value of our property and equipment or our finite-lived intangibles and other assets, that revision could result in a non-cash impairment charge that could have a material impact on our financial results. As of December 31, 2014 and 2013, there were no indicators that our long-lived assets were impaired.
Contingent Consideration. Our acquisitions may include contingent consideration payments based on future sales or product milestones of an acquired entity. We estimate the fair value of contingent consideration liabilities based on certain milestones of the acquired companies and estimated probabilities of achievement and discount the liabilities to present value using our pre-tax cost of debt. We believe our estimates and assumptions are reasonable; however, there is significant judgment involved. Changes in the fair value of contingent consideration liabilities may result from changes in discount periods, changes in the timing and amount of sales and/or other specific milestone estimates and changes in probability assumptions with respect to the likelihood of achieving the various earnout criteria. At each reporting date, the contingent consideration liability is revalued to estimated fair value and changes in fair value subsequent to the acquisitions are reflected in net income in the consolidated statements of income and could cause a material impact to, and volatility in, our operating results.
32
Revenue Recognition
We derive substantially all of our revenue from the licensing of our software products, the sale of annual maintenance agreements for these products and, to a lesser extent, our MSP and cloud subscription products. In accordance with current guidance, we recognize revenue for software, maintenance and subscriptions when persuasive evidence of an arrangement exists, delivery has occurred, the sales price is fixed or determinable and collectability is reasonably assured. Our return policy generally does not allow our customers to return software products.
We generally use a purchase order, an authorized credit card, an electronic or manually signed license agreement, or the receipt of a cash payment as evidence of an arrangement. We consider delivery to have occurred and recognize revenue when risk of loss transfers to the customer, reseller or distributor or the customer has access to their subscription which is generally upon electronic transfer of the license key or password that provides immediate availability of the product to the purchaser. We account for sales incentives to customers, resellers or distributors as a reduction of revenue at the time we recognize the revenue from the related product sale. We report revenue net of any sales tax collected.
We sell our software products through our direct sales force and through our distributors and other resellers. Our distributors and resellers do not carry inventory of our software and we generally require them to specify the end-user of the software at the time of the order. If the distributor or reseller does not provide end-user information, then we will generally not fulfill the order. Our distributors and resellers have no rights of return or exchange for software that they purchase from us and payment for these purchases is due to us without regard to whether the distributors or resellers collect payment from their customers. Sales through resellers and distributors are typically evidenced by a reseller or distributor agreement, together with purchase orders or authorized credit cards on a transaction-by-transaction basis.
License Revenue. Under software revenue recognition guidance, we use the residual method to recognize revenue when a license agreement includes one or more elements to be delivered and vendor-specific objective evidence, or VSOE, of fair value for all undelivered elements exists. Because our software is generally sold with maintenance, we calculate the amount of revenue allocated to the software license by determining the fair value of the maintenance and subtracting it from the total invoice or contract amount. We establish VSOE of the fair value of maintenance services by the standard published list pricing for our maintenance renewals since we generally charge list prices for our maintenance renewals. If evidence of the fair value of one or more undelivered elements does not exist, all revenue is generally deferred and recognized when delivery of those elements occurs or when fair value can be established. When the undelivered element for which we do not have VSOE of fair value is support, revenue for the entire arrangement is recognized ratably over the support period. If in the future we were unable to establish VSOE of fair value of the maintenance or other services the timing of our revenue recognition could be impacted significantly.
Maintenance and Other Revenue. We derive maintenance revenue from fees for software maintenance services. We typically include one year of maintenance as part of the initial purchase price of each perpetual software offering and then sell renewals of this maintenance agreement. We generally bill maintenance renewal agreements annually in advance for services to be performed over a 12-month period. Customers have the option to purchase maintenance renewals for periods other than 12 months. We generally recognize maintenance revenue ratably on a daily basis over the contract period. Customers with maintenance agreements are entitled to receive unspecified upgrades or enhancements to new versions of their software products on a when-and-if-available basis. Other revenue is not currently significant nor do we expect it to be significant in future periods.
Subscription Revenue. We primarily derive subscription revenue from fees received from customers for time-based license arrangements and software-as-a-service, or SaaS offerings. We generally invoice subscription agreements monthly in advance over the subscription period. Subscription revenue is recognized ratably over the subscription term when all revenue recognition criteria have been met.
Stock-Based Compensation
We have granted and expect to continue to grant our employees and directors stock-based incentive awards. These awards are in the form of stock options and restricted stock units. We measure stock-based compensation expense for all share-based awards granted based on the estimated fair value of those awards on the date of grant. The fair values of stock option awards are estimated using a Black-Scholes valuation model. The fair value of restricted stock unit awards is determined using the fair market value of our common stock based on the quoted market price on the date of grant, or intrinsic value.
We use various assumptions in estimating the fair value of options at the date of grant using the Black-Scholes option model including expected dividend yield, volatility, risk-free rate of return and expected life. We have not paid and do not anticipate paying cash dividends on our common stock; therefore, we assume the expected dividend yield to be zero. We estimate the expected volatility using a weighted average of the historical volatility of our common stock and historical volatility of comparable public companies from a representative industry peer group. We based the risk-free rate of return on the average U.S. treasury yield curve for five- and seven-year terms. As allowed under current guidance, we have elected to
33
apply the “simplified method” in developing our estimate of expected life for “plain vanilla” stock options by using the midpoint between the vesting date and contractual termination date since we do not have sufficient historical exercise data to provide a reasonable basis upon which to estimate expected term due to the limited period of time our common stock has been publicly traded. For all dates, we granted employees options at exercise prices equal to the fair value of the underlying common stock on the date of grant, which is the closing price of our common stock as reported by the NYSE.
We plan to grant restricted stock units as the primary form of equity awards to our employees in 2015. We will continue to grant restricted stock units and stock options to our executives and board of directors in 2015.
Income Taxes
We use the liability method of accounting for income taxes as set forth in the authoritative guidance for accounting for income taxes. Under this method, we recognize deferred tax liabilities and assets for the expected future tax consequences of temporary differences between the respective carrying amounts and tax basis of our assets and liabilities.
The guidance on accounting for uncertainty in income taxes prescribes a recognition threshold and measurement attribute for financial statement disclosure of tax positions taken or expected to be taken on a tax return. At December 31, 2014 and 2013, we had $15.3 million and $15.1 million of gross unrecognized tax benefits, respectively, all of which, if recognized, would affect our effective tax rate.
We accrue interest and penalties related to unrecognized tax benefits as a component of income tax expense. At December 31, 2014 and 2013, we had accrued interest and penalties related to unrecognized tax benefits of approximately $1.2 million and $0.6 million, respectively.
In calculating our effective tax rate, we make judgments regarding certain tax positions, including the timing and amount of deductions and allocations of income among various tax jurisdictions.
The guidance requires us to identify, evaluate and measure all uncertain tax positions taken or to be taken on tax returns and to record liabilities for the amount of these positions that may not be sustained, or may only partially be sustained, upon examination by the relevant taxing authorities. Although we believe that our estimates and judgments are reasonable, actual results may differ from these estimates. Some or all of these judgments are subject to review by the taxing authorities.
We establish valuation allowances when necessary to reduce deferred tax assets to the amounts expected to be realized. On a quarterly basis, we evaluate the need for, and the adequacy of, valuation allowances based on the expected realization of our deferred tax assets. The factors used to assess the likelihood of realization include our latest forecast of future taxable income and available tax planning strategies that could be implemented to realize the net deferred tax assets.
We intend to invest our non-U.S. earnings permanently in foreign operations, and for this reason, we do not record federal income taxes on the undistributed earnings of our foreign subsidiaries.
34
Comparison of the Years Ended December 31, 2014 and 2013
Year Ended December 31, | |||||||||||||||||
2014 | % of Revenue | 2013 | % of Revenue | Change | |||||||||||||
(in thousands) | (in thousands) | (in thousands) | |||||||||||||||
Revenue: | |||||||||||||||||
License | $ | 161,795 | 37.7 | % | $ | 135,839 | 40.5 | % | $ | 25,956 | |||||||
Maintenance and other | 238,892 | 55.7 | 191,491 | 57.1 | 47,401 | ||||||||||||
Subscription | 28,027 | 6.5 | 8,055 | 2.4 | 19,972 | ||||||||||||
Total revenue | 428,714 | 100.0 | 335,385 | 100.0 | 93,329 | ||||||||||||
Cost of revenue | 44,366 | 10.3 | 27,916 | 8.3 | 16,450 | ||||||||||||
Gross profit | 384,348 | 89.7 | 307,469 | 91.7 | 76,879 | ||||||||||||
Operating expenses: | |||||||||||||||||
Sales and marketing | 148,420 | 34.6 | 99,289 | 29.6 | 49,131 | ||||||||||||
Research and development | 56,479 | 13.2 | 37,514 | 11.2 | 18,965 | ||||||||||||
General and administrative | 77,172 | 18.0 | 48,919 | 14.6 | 28,253 | ||||||||||||
Total operating expenses | 282,071 | 65.8 | 185,722 | 55.4 | 96,349 | ||||||||||||
Operating income | 102,277 | 23.9 | 121,747 | 36.3 | (19,470 | ) | |||||||||||
Other income (expense): | |||||||||||||||||
Interest income | 363 | 0.1 | 396 | 0.1 | (33 | ) | |||||||||||
Interest expense | (684 | ) | (0.2 | ) | (215 | ) | (0.1 | ) | (469 | ) | |||||||
Other income (expense), net | 640 | 0.1 | (425 | ) | (0.1 | ) | 1,065 | ||||||||||
Total other income | 319 | 0.1 | (244 | ) | (0.1 | ) | 563 | ||||||||||
Income before income taxes | 102,596 | 23.9 | 121,503 | 36.2 | (18,907 | ) | |||||||||||
Income tax expense | 24,483 | 5.7 | 31,725 | 9.5 | (7,242 | ) | |||||||||||
Net income | $ | 78,113 | 18.2 | % | $ | 89,778 | 26.8 | % | $ | (11,665 | ) | ||||||
Revenue
Revenue increased $93.3 million, or 27.8%, in the year ended December 31, 2014 compared to the year ended December 31, 2013. Total revenue by product group was $252.2 million and $222.5 million for network management, $134.8 million and $97.1 million for systems and application management and $41.8 million and $15.8 million for our MSP and cloud products for the years ended December 31, 2014 and 2013, respectively.
Our revenue from our international subsidiaries was 27.3% and 26.5% of total revenue in 2014 and 2013, respectively. Revenue from our international subsidiaries increased as a percentage of revenue despite a negative impact to our international revenue due to the strengthening of the U.S. dollar in the fourth quarter of 2014 against most of the international currencies, and particularly the Euro, in which we offer our products. Other than the United States, no single country accounted for 10% or more of our total revenues during these periods. We expect international sales as a percentage of our total sales in 2015 to increase slightly as compared to 2014.
License, Maintenance and Other Revenue
License revenue increased $26.0 million, or 19.1%, primarily due to increased sales of our systems and application management and network management products.
Our commercial core product transaction volume growth was 14.1% in 2014 as compared to 2013. The overall growth in commercial core product transaction volume is attributed to increased sales of our systems and application management and network management products in the year ended December 31, 2014.
As of December 31, 2014, the commercial core average transaction size for new license sales was approximately $8,200 as compared to approximately $7,900 as of December 31, 2013. The increase in our commercial core average transaction size was primarily due to a greater number of transactions over $20,000, across our network management and systems and application management product portfolios during the year ended December 31, 2014 as compared to the year ended
35
December 31, 2013. We calculate our average transaction size and product transaction volume growth using commercial core transactions only, which exclude any transactions that consist solely of our transactional products sold on a stand-alone basis, our MSP products, and our cloud products.
Maintenance and other revenue increased $47.4 million, or 24.8%, due to a growing maintenance renewal customer base and an increase in new license sales, which drives new maintenance revenue. We have maintained high customer retention and have continued to increase our renewal base each quarter as we have begun to renew and recognize the maintenance revenue associated with our acquired products.
Subscription Revenue
Subscription revenue increased $20.0 million primarily due to the growth of sales of subscriptions to our MSP products.
Cost of Revenue
Cost of revenue increased $16.5 million, or 58.9%, in 2014 compared to 2013. Cost of license revenue increased by $4.8 million in 2014 compared to 2013, primarily due to the amortization of acquired product technologies associated with our acquisitions. Cost of maintenance revenue also increased $3.7 million, primarily due to increased personnel costs, which includes an increase in stock-based compensation expense of $0.7 million, to support new customers and additional product offerings from acquisitions.
Cost of subscription revenue increased $8.0 million, or 171.0% in 2014 compared to 2013. The increase was primarily due to a $2.9 million increase in amortization of acquired developed product technologies associated with our acquisitions, a $2.7 million increase in personnel costs, which includes a $0.2 million increase in stock-based compensation expense, and a $2.3 million increase in royalty, hosting and server fees related to our subscription products.
Operating Expenses
Sales and Marketing. Sales and marketing expenses increased $49.1 million, or 49.5%, in 2014 compared to 2013. Our sales and marketing personnel costs increased $33.6 million, which includes an increase of $6.0 million in stock-based compensation expense. We have increased employee headcount in our sales, marketing and maintenance renewal teams primarily as a result of organic growth and, to a lesser extent, through acquisitions. Marketing program costs increased $14.1 million due to the increased investment around demand generation and brand awareness to create and better capture the demand for our products. Our sales expense as a percentage of revenue increased slightly in 2014 as compared to 2013 primarily due to our 2013 acquisitions.
Research and Development. Research and development expenses increased $19.0 million, or 50.6%, in 2014 compared to 2013 due to our increased investment in product development to accelerate new product releases and to improve the infrastructure of our products. In order to support the ongoing development of new products and our current products, we continued to increase the size of our Czech Republic and India research and development centers during 2013 and 2014 and supplemented our internal product development activities with additional contract services. We also increased our research and development headcount through our acquisitions. Due to this growth, our personnel costs increased $13.8 million, including a $3.3 million increase in stock-based compensation expense, and contract services increased $4.5 million in 2014 as compared to 2013. Contract services increased due to additional product development work that was completed by our offshore development vendors.
General and Administrative. General and administrative expenses increased $28.3 million, or 57.8%, in 2014 compared to 2013. This increase was primarily due to a $13.8 million increase in personnel costs, which includes an increase in stock-based compensation expense of $6.2 million, a $5.0 million increase in acquisition related costs primarily related to deferred compensation expense and a $1.4 million increase in amortization of acquired intangible assets. In addition, we recorded a $6.8 million lease abandonment charge in 2014 for the estimated fair value of our remaining obligation under the operating lease of our former corporate headquarters. See Note 14, Commitments and Contingencies, of our Notes to Consolidated Financial Statements in Item 8 of Part II of this Annual Report on Form 10-K for additional information regarding the lease abandonment charge.
Income Tax Expense
Our income tax expense decreased by $7.2 million in 2014 as compared to 2013. This decrease resulted primarily from the decrease in our income before income taxes of $18.9 million when comparing the same periods. Our effective tax rate decreased from 26.1% in 2013 to 23.9% in 2014, which was primarily attributable to an increase in international earnings as a percentage of total earnings, which are generally taxed at lower tax rates.
36
Comparison of the Years Ended December 31, 2013 and 2012
Year Ended December 31, | |||||||||||||||||
2013 | % of Revenue | 2012 | % of Revenue | Change | |||||||||||||
(in thousands) | (in thousands) | (in thousands) | |||||||||||||||
Revenue: | |||||||||||||||||
License | $ | 135,839 | 40.5 | % | $ | 123,984 | 46.1 | % | $ | 11,855 | |||||||
Maintenance and other | 191,491 | 57.1 | 144,980 | 53.9 | 46,511 | ||||||||||||
Subscription | 8,055 | 2.4 | — | — | 8,055 | ||||||||||||
Total revenue | 335,385 | 100.0 | 268,964 | 100.0 | 66,421 | ||||||||||||
Cost of revenue | 27,916 | 8.3 | 18,400 | 6.8 | 9,516 | ||||||||||||
Gross profit | 307,469 | 91.7 | 250,564 | 93.2 | 56,905 | ||||||||||||
Operating expenses: | |||||||||||||||||
Sales and marketing | 99,289 | 29.6 | 73,046 | 27.2 | 26,243 | ||||||||||||
Research and development | 37,514 | 11.2 | 28,769 | 10.7 | 8,745 | ||||||||||||
General and administrative | 49,044 | 14.6 | 35,649 | 13.3 | 13,395 | ||||||||||||
Accrued earnout gain | (125 | ) | — | (570 | ) | (0.2 | ) | 445 | |||||||||
Total operating expenses | 185,722 | 55.4 | 136,894 | 50.9 | 48,828 | ||||||||||||
Operating income | 121,747 | 36.3 | 113,670 | 42.3 | 8,077 | ||||||||||||
Other income (expense): | |||||||||||||||||
Interest income | 396 | 0.1 | 430 | 0.2 | (34 | ) | |||||||||||
Interest expense | (215 | ) | (0.1 | ) | — | — | (215 | ) | |||||||||
Other income (expense), net | (425 | ) | (0.1 | ) | 419 | 0.2 | (844 | ) | |||||||||
Total other income | (244 | ) | (0.1 | ) | 849 | 0.3 | (1,093 | ) | |||||||||
Income before income taxes | 121,503 | 36.2 | 114,519 | 42.6 | 6,984 | ||||||||||||
Income tax expense | 31,725 | 9.5 | 33,176 | 12.3 | (1,451 | ) | |||||||||||
Net income | $ | 89,778 | 26.8 | % | $ | 81,343 | 30.2 | % | $ | 8,435 | |||||||
Revenue
Revenue increased $66.4 million, or 24.7%, in the year ended December 31, 2013 compared to the year ended December 31, 2012. Total revenue by product group was $222.5 million and $198.5 million for network management, $97.1 million and $70.4 million for systems and application management and $15.8 million and $0 for our MSP products for the years ended December 31, 2013 and 2012, respectively.
Revenue from our international subsidiaries was 26.5% and 24.5% of total revenue in 2013 and 2012, respectively. Other than the United States, no single country accounted for 10% or more of our total revenues during these periods.
License, Maintenance and Other Revenue
License revenue increased $11.9 million, or 9.6%, due to continued growth in new license sales of our systems and application management products such as SolarWinds Server & Application Monitor, Web Help Desk and SolarWinds Database Performance Analyzer, which was added through the acquisition of Confio. These increases were offset by decreases in other system management products, such as DameWare and Storage Manager, and other decreases in network management products.
Our commercial core product transaction growth was 30.4% in 2013 as compared to 2012 as a result of our growth in new license sales of our systems management products, particularly Web Help Desk and Serv-U. As the number of product transactions fluctuates with changes in the business or product mixes, this also affects our average transaction size for new license sales. As of December 31, 2013, the commercial core average transaction size for new license sales, was approximately $7,900 as compared to approximately $8,900 as of December 31, 2012, a decrease of 11.6%. The decrease in our average transaction size was primarily due to the high volume of transactions of our Web Help Desk and Serv-U products in the last year combined with their lower average transaction size than our other products.
37
Maintenance and other revenue increased $46.5 million, or 32.1%, due to a growing maintenance renewal customer base and an increase in new license sales, which drives new maintenance revenue.
Subscription Revenue
Subscription revenue of $8.1 million in 2013 was from the sale of products introduced as a result of our acquisition of N-able in the second quarter of 2013, and in particular, N-Central, N-able's flagship product for MSPs.
Cost of Revenue
Cost of revenue increased $9.5 million, or 51.7%, in 2013 compared to 2012. Cost of license revenue increased by $3.4 million in 2013 compared to 2012, primarily due to the amortization of acquired product technologies associated with our acquisitions that were completed in 2012 and 2013. Cost of maintenance revenue also increased $1.4 million, primarily due to increased headcount to support new customers, additional product offerings from acquisitions and internal product development. Cost of subscription revenue consisted of personnel costs, amortization of acquired developed product technologies and other direct costs, including royalty fees and hosting fees, related to our subscription products which were introduced during the second quarter of 2013.
Operating Expenses
Sales and Marketing. Sales and marketing expenses increased $26.2 million, or 35.9%, in 2013 compared to 2012. We continue to invest in the sales and marketing efforts that drive our revenue growth. In addition, we have increased employee headcount in our sales, marketing and maintenance renewal teams as a result of organic growth and through acquisitions. As a result of these expansion efforts, our sales and marketing personnel costs increased by $18.0 million, which includes an increase of $3.4 million in stock-based compensation expense, and marketing program costs increased $6.3 million. Our sales expense as a percentage of revenue remained consistent in 2013 as compared to 2012.
Research and Development. Research and development expenses increased $8.7 million, or 30.4%, in 2013 compared to 2012. This increase was primarily related to the increase in research and development headcount related to the acquisition of N-able in the second quarter of 2013. In addition, in order to support the ongoing development of acquired and new products, we continued to increase the size of our Czech Republic and India research and development centers during 2012 and 2013. Due to this growth, our personnel costs increased by $6.1 million, including a $1.3 million increase in stock-based compensation expense, and contract services increased $2.6 million in 2013 as compared to 2012.
General and Administrative. General and administrative expenses increased $13.4 million, or 37.6%, in 2013 compared to 2012. This increase was primarily due to a $6.3 million increase in personnel costs, which includes an increase in stock-based compensation expense of $2.4 million, an increase of $1.9 million in amortization expense related to certain acquired intangible assets and a $1.7 million increase in professional fees. In addition, restructuring charges, which primarily consist of accelerated depreciation on leasehold improvements and lease abandonment charges related to the closing of certain offices, increased $1.8 million.
Accrued Earnout Gain. We recorded a $0.1 million accrued earnout gain in 2013 as compared to a $0.6 million accrued earnout gain in 2012 due to the changes in probability of achieving certain sales milestones related to our acquisition related contingent considerations during the periods.
Other Income (Expense)
Other income (expense) decreased by $1.1 million primarily due to increases in net losses on foreign currency transactions and interest expense for the year ended December 31, 2013 as compared to 2012. In 2013, we borrowed $40.0 million at an interest rate of approximately 1.4% under a revolving loan under the Credit Agreement that was used to finance a portion of the consideration paid upon the acquisition of Confio.
Income Tax Expense
Our income tax expense decreased by $1.5 million in 2013 as compared to 2012. This decrease resulted from the availability of the U.S. R&E tax credit offset by an increase in our income before income taxes of $7.0 million when comparing the same periods.
Our effective tax rate decreased from 29.0% in 2012 to 26.1% in 2013, which was primarily attributable to the availability of the U.S. R&E tax credit which resulted in the entire 2012 R&E tax credit being recognized in 2013 as well as an increase in international earnings, which are generally taxed at lower tax rates.
38
Non-GAAP Financial Measures
In addition to disclosing financial measures prepared in accordance with GAAP, this Form 10-K includes the following financial measures which are non-GAAP financial measures under SEC rules: (i) non-GAAP operating income and non-GAAP operating margin; (ii) non-GAAP net income; and (iii) non-GAAP diluted earnings per share. Each of these financial measures excludes the impact of certain items and therefore has not been calculated in accordance with GAAP. In this report, these non-GAAP financial measures typically exclude stock-based compensation expense and related employer-paid payroll taxes; amortization of intangible assets; acquisition related adjustments, including contingent consideration fair value adjustments; and restructuring charges. Each of these non-GAAP adjustments is described in more detail below. In addition to these adjustments, management may include or exclude additional items from these or similar non-GAAP financial measures in future periods to the extent that management believes such items may not be indicative of our core business. A reconciliation of each of these non-GAAP financial measures to its most comparable GAAP financial measure is also included below.
We believe that these non-GAAP financial measures provide meaningful supplemental information regarding our operating results because they exclude certain amounts that our management and board of directors do not consider part of core operating results when assessing our operational performance, allocating resources, preparing annual budgets and determining employee incentive compensation. Accordingly, these non-GAAP financial measures may provide insight to investors into the motivation and decision-making of management in operating the business. In addition, by comparing our non-GAAP financial measures in different historical periods, our investors can evaluate our operating results without the additional variations of certain items that may not be indicative of our core operations, including stock-based compensation expense, which is a non-cash expense that we believe is not a key measure of our operations.
While we believe that these non-GAAP financial measures provide useful supplemental information, there are limitations associated with the use of these non-GAAP financial measures. These non-GAAP financial measures are not prepared in accordance with GAAP, do not reflect a comprehensive system of accounting and may not be comparable to similarly titled measures of other companies due to potential differences in their financing and accounting methods, the book value of their assets, their capital structures, the method by which their assets were acquired and the manner in which they define non-GAAP measures. Items such as the amortization of intangible assets, stock-based compensation expense and related employer-paid payroll taxes, acquisition related adjustments and restructuring charges, as well as the related tax impacts of these items can have a material impact on operating and net income. As a result, these non-GAAP financial measures have limitations and should not be considered in isolation from, or as a substitute for, their most comparable GAAP measures. We compensate for these limitations by using these non-GAAP financial measures as supplements to GAAP financial measures and by reconciling the non-GAAP financial measures to their most comparable GAAP financial measure. Investors are encouraged to review the reconciliations of these non-GAAP financial measures to their most comparable GAAP financial measures below.
For a detailed explanation of the adjustments made to comparable GAAP financial measures, the reasons why management uses these measures and the usefulness of these measures, see footnotes (1)—(6) below.
Non-GAAP Operating Income and Non-GAAP Operating Margin
Year Ended December 31, | |||||||||||
(in thousands, except percentages) | 2014 | 2013 | 2012 | ||||||||
GAAP operating income | $ | 102,277 | $ | 121,747 | $ | 113,670 | |||||
Amortization of intangible assets (1) | 31,200 | 21,812 | 14,894 | ||||||||
Stock-based compensation expense and related employer-paid payroll taxes (2) | 39,836 | 23,450 | 15,819 | ||||||||
Acquisition related adjustments (3) | 6,234 | 1,108 | 445 | ||||||||
Restructuring charges (4) | 7,413 | 2,236 | — | ||||||||
Non-GAAP operating income | $ | 186,960 | $ | 170,353 | $ | 144,828 | |||||
GAAP operating margin | 23.9 | % | 36.3 | % | 42.3 | % | |||||
Non-GAAP operating margin | 43.6 | % | 50.8 | % | 53.8 | % | |||||
Non-GAAP operating income increased for the year ended December 31, 2014 as compared to the same periods in 2013 and 2012 primarily due to year-over-year increases in the sales of our products offset by the increased investment in our product development and sales and marketing teams in late 2013 and 2014. The decrease in our non-GAAP operating margins in 2013 and 2014 is also due to the increased investments in our business.
39
Stock-based compensation expense and related employer-paid payroll taxes increased in 2014 as compared to 2013 and 2012 primarily due to increased share-based incentive awards issued to employees and, to a lesser extent, the awards to employees added through organic growth and acquisitions. Our acquisition related adjustments increased in 2014 primarily due to increases in deferred compensation expense related to acquisitions. In addition, our restructuring charges increased in 2014 primarily due to a lease abandonment charge related to our former corporate headquarters of $6.8 million. See Note 14, Commitments and Contingencies, of our Notes to Consolidated Financial Statements in Item 8 of Part II of this Annual Report on Form 10-K for additional information regarding the lease abandonment charge.
Non-GAAP Net Income and Non-GAAP Diluted Earnings Per Share
Year Ended December 31, | |||||||||||
(in thousands, except per share information) | 2014 | 2013 | 2012 | ||||||||
GAAP net income | $ | 78,113 | $ | 89,778 | $ | 81,343 | |||||
Amortization of intangible assets (1) | 31,200 | 21,812 | 14,894 | ||||||||
Stock-based compensation expense and related employer-paid payroll taxes (2) | 39,836 | 23,450 | 15,819 | ||||||||
Acquisition related adjustments (3) | 6,234 | 1,112 | 519 | ||||||||
Restructuring charges (4) | 7,413 | 2,236 | — | ||||||||
Tax benefits associated with above adjustments (5) | (22,532 | ) | (13,375 | ) | (8,886 | ) | |||||
Non-GAAP net income | $ | 140,264 | $ | 125,013 | $ | 103,689 | |||||
Weighted-average number of shares used in computing diluted earnings per share | 76,462 | 76,475 | 76,035 | ||||||||
GAAP diluted earnings per share | $ | 1.02 | $ | 1.17 | $ | 1.07 | |||||
Non-GAAP diluted earnings per share (6) | $ | 1.83 | $ | 1.63 | $ | 1.36 | |||||
Non-GAAP net income for year ended December 31, 2014 increased as compared to the same periods in 2013 and 2012 primarily due to the increases in non-GAAP operating income discussed above and the income tax effects associated with the non-GAAP adjustments for the year ended December 31, 2014.
Non-GAAP Footnotes:
(1) | Amortization of Intangible Assets. We provide non-GAAP information that excludes expenses for the amortization of intangible assets that primarily relate to purchased intangible assets associated with our acquisitions. We believe that eliminating this expense from our non-GAAP measures is useful to investors, because the amortization of intangible assets can be inconsistent in amount and frequency and is significantly impacted by the timing and magnitude of our acquisition transactions, which also vary in frequency from period to period. Accordingly, we analyze the performance of our operations in each period without regard to such expenses. |
(2) | Stock-Based Compensation Expense and Related Employer-Paid Payroll Taxes. We provide non-GAAP information that excludes expenses for stock-based compensation and related employer-paid payroll taxes. We believe the exclusion of these items allows for financial results that are more indicative of our continuing operations. We believe that the exclusion of stock-based compensation expense provides for a better comparison of our operating results to prior periods and to our peer companies as the calculations of stock-based compensation vary from period to period and company to company due to different valuation methodologies, subjective assumptions and the variety of award types. Employer-paid payroll taxes on stock-based compensation is dependent on our stock price and the timing of the taxable events related to the equity awards, over which our management has little control, and does not correlate to the core operation of our business. Because of these unique characteristics of stock-based compensation and the related employer-paid payroll taxes, management excludes these expenses when analyzing the organization’s business performance. |
(3) | Acquisition Related Adjustments. We exclude certain expense items resulting from acquisitions including the following, when applicable: (i) amortization of purchased intangible assets associated with our acquisitions (see Note 1 for further discussion); (ii) legal, accounting and advisory fees to the extent associated with acquisitions; (iii) changes in fair value of contingent consideration; (iv) costs related to due diligence and integrating the acquired businesses; (v) deferred compensation expense related to acquisitions; and (vi) restructuring costs, including adjustments related to changes in estimates, related to acquisitions. We consider these adjustments, to some extent, to be unpredictable and dependent on a significant number of factors that are outside of our control. Furthermore, acquisitions result in operating expenses |
40
that would not otherwise have been incurred by us in the normal course of our organic business operations, with respect to each acquisition. We believe that providing non-GAAP information for acquisition related expense items in addition to the corresponding GAAP information allows the users of our financial statements to better review and understand the historical and current results of our continuing operations, and also facilitates comparisons to our historical results and results of less acquisitive peer companies, both with and without such adjustments.
(4) | Restructuring Charges. We provide non-GAAP information that excludes restructuring charges such as severance, relocation and benefits and the estimated costs of exiting and terminating facility lease commitments, including accelerated depreciation on leasehold improvements and fixed assets, as they relate to our corporate restructuring and exit activities. These restructuring charges are inconsistent in amount and are significantly impacted by the timing and nature of these events. Therefore, although we may incur these types of expenses in the future, we believe that eliminating these charges for purposes of calculating the non-GAAP financial measures facilitates a more meaningful evaluation of our current operating performance and comparisons to our past operating performance. |
(5) | Income Tax Effect of Non-GAAP Exclusions. We believe providing financial information with and without the income tax effect of excluding items related to our non-GAAP financial measures provide our management and users of the financial statements with better clarity regarding the ongoing performance and future liquidity of our business. |
(6) | Non-GAAP Diluted Earnings Per Share Item. We provide non-GAAP diluted earnings per share. The non-GAAP diluted earnings per share amount was calculated based on our non-GAAP net income and the shares used in the computation of GAAP diluted earnings per share. |
Liquidity and Capital Resources
Cash and cash equivalents and short-term and long-term investments were $267.7 million as of December 31, 2014. Our international subsidiaries held approximately $94.4 million of cash and cash equivalents of which 77.8% was held in Euros as of December 31, 2014. We currently intend that the earnings generated by our international operations will be invested indefinitely in those operations and we do not expect to repatriate those earnings to our domestic operations. If we were to try and repatriate these earnings, we would incur a U.S. federal income tax liability that is not currently accrued in our consolidated financial statements. Refer to Note 13, Income Taxes, of our Notes to Consolidated Financial Statements in Item 8 of Part II of this Annual Report on Form 10-K for additional details.
Our available cash and cash equivalents are primarily held in bank deposits and money market funds at December 31, 2014. Our short-term and long-term investments, classified as available-for-sale securities, consist of corporate bonds held in investment accounts in the United States.
Our emphasis is primarily on safety of principal while secondarily maximizing yield on those funds. The balances held in our demand deposit accounts in the United States may exceed the Federal Deposit Insurance Corporation, or FDIC, insurance limits. While we monitor the balances in our accounts and adjust the balances as appropriate, these balances could be impacted by adverse conditions in the financial markets or by failure of the underlying depository institutions or guarantors. We strive to maintain our cash deposits, money market funds and investments with multiple financial institutions of reputable credit quality and therefore, bear minimal credit risk. We actively monitor the third party depository institutions that hold our cash, cash equivalents and investments. To date, we have experienced no loss or lack of access to our invested cash, cash equivalents, and investments; however, we can provide no assurances that access to our funds will not be impacted by future adverse conditions.
Summarized annual cash flow information is as follows:
Year Ended December 31, | |||||||||||
(in thousands) | 2014 | 2013 | 2012 | ||||||||
Net cash provided by operating activities | $ | 199,812 | $ | 163,320 | $ | 143,447 | |||||
Net cash used in investing activities | (82,648 | ) | (205,124 | ) | (103,118 | ) | |||||
Net cash provided by (used in) financing activities | (35,387 | ) | 24,245 | 15,482 | |||||||
Effect of exchange rate changes | (9,808 | ) | 3,830 | 1,184 | |||||||
Net increase (decrease) in cash and cash equivalents | 71,969 | (13,729 | ) | 56,995 | |||||||
Operating Activities
The increase of $36.5 million in cash provided by operating activities for the year ended December 31, 2014 compared to December 31, 2013 is primarily related to increases in adjustments to net income for non-cash expenses such as stock-based compensation, depreciation and amortization and an increase in accrued liabilities and other offset by a decrease in net income.
41
The increase of $19.9 million in cash provided by operating activities for the year ended December 31, 2013 compared to December 31, 2012 is primarily related to increases in adjustments to net income for non-cash expenses such as stock-based compensation, depreciation and amortization and an increase in net income.
The change in cash flows relating to operating activities resulted from changes in operating assets and liabilities and is primarily driven by the sales of our software and maintenance renewals. The significant changes in operating assets and liabilities include the following:
• | Deferred revenue increased to $163.4 million at December 31, 2014 as compared to $135.2 million at December 31, 2013, resulting in an increase in operating liabilities and reflecting a cash inflow of $32.8 million for the year ended December 31, 2014. For the years ended December 31, 2013 and 2012, net cash provided by operating activities increased $28.6 million and $22.5 million, respectively, due to an increase in deferred revenue during those years as compared to the respective prior year. Deferred revenue primarily consists of billings and payments received in advance of revenue recognition from maintenance fees. |
• | Accrued liabilities and other increased to $35.3 million at December 31, 2014 as compared to $17.7 million at December 31, 2013, resulting in an increase in operating liabilities and reflecting a cash inflow of $18.3 million for the year ended December 31, 2014. This increase in accrued liabilities and resulting cash inflow was related to the lease abandonment liability recorded in the second quarter of 2014 related to our remaining obligation under the operating lease of our former corporate headquarters, an increase in deferred compensation accrued related to acquisitions and an increase in payroll accruals related to our growth. See Note 14, Commitments and Contingencies, in the Notes to Consolidated Financial Statements in Item 8 of Part II of this Annual Report on Form 10-K, for additional information regarding the lease abandonment charge. |
• | Changes in our income tax receivable and payable balances are also significant components of our cash flows from operating activities. Net cash provided by operating activities was reduced by income tax payments of $18.3 million in 2014, $23.3 million in 2013 and $15.3 million in 2012. |
• | Accounts receivables increased to $50.8 million at December 31, 2014 as compared to $45.7 million at December 31, 2013 resulting in an increase in operating assets and reflecting a cash outflow of $7.2 million for the year ended December 31, 2014. The increase in accounts receivable for the years ended December 31, 2013 and 2012 as compared to the respective prior year resulted in cash outflows of $6.3 million and $5.7 million, respectively. Our accounts receivable balance fluctuates from period to period depending on the timing of our sales, cash collections and changes to our allowance for doubtful accounts, which affects our cash flow from operating activities. We have historically had insignificant write-offs related to bad debts. The allowance for doubtful accounts was $1.1 million, $0.5 million and $0.3 million at December 31, 2014, 2013 and 2012, respectively. We use days sales outstanding, or DSO, calculated on a quarterly basis, as a measurement of the quality and status of our receivables. We define DSO as (a) accounts receivable divided by (b) total revenue for the most recent quarter, multiplied by (c) the number of days in the quarter. Our DSO was 39.5 days and 43.3 days at December 31, 2014 and 2013, respectively. |
• | Other long-term liabilities increased to $23.0 million at December 31, 2014 as compared to $16.8 million at December 31, 2013, resulting in an increase in operating liabilities and reflecting a cash inflow of $5.5 million for the year ended December 31, 2014. This increase in other long-term liabilities and resulting cash inflow was primarily related to the lease incentive liability recorded for the tenant improvement allowance received related to our new corporate headquarters. See Note 14, Commitments and Contingencies, in the Notes to Consolidated Financial Statements in Item 8 of Part II of this Annual Report on Form 10-K, for additional information regarding our lease for our new corporate headquarters. |
Investing Activities
Net cash used in investing activities for the year ended December 31, 2014 was primarily related to $63.7 million of cash used for the acquisition of Pingdom (refer to Note 2, Acquisitions, of our Notes to Consolidated Financial Statements in Item 8 of Part II of this Annual Report on Form 10-K for additional details), $19.2 million of cash used to purchase property and equipment, and $18.5 million of cash used to purchase available-for-sale securities classified as short-term and long-term investments, offset by $19.0 million of proceeds from maturities of investments. The purchases of property and equipment primarily related to leasehold improvements for our new corporate headquarters and equipment and furniture related to the growth of our offices globally. We received $7.1 million in tenant improvement allowances related to the purchase of leasehold improvements during the year ended December 31, 2014.
Net cash used in investing activities for the year ended December 31, 2013 was primarily related to $223.5 million of cash used for acquisitions (refer to Note 2, Acquisitions, of our Notes to Consolidated Financial Statements in Item 8 of Part II of this Annual Report on Form 10-K for additional details) and $17.3 million of cash used to purchase available-for-sale
42
securities classified as short-term and long-term investments, offset by $48.2 million of proceeds from maturities of investments.
Net cash used in investing activities for the year ended December 31, 2012 was primarily related to $66.0 million of cash used for acquisitions (refer to Note 2, Acquisitions, of our Notes to Consolidated Financial Statements in Item 8 of Part II of this Annual Report on Form 10-K for additional details) and $65.9 million of cash used to purchase available-for-sale securities classified as short-term and long-term investments. Also during 2012, we had $33.9 million of proceeds from maturities of investments.
We expect our capital expenditures in fiscal year 2015 to be approximately $20 to $25 million, primarily related to purchases of leasehold improvements, equipment and furniture in our domestic and international office locations to support their continued growth.
Financing Activities
Net cash used in financing activities for the year ended December 31, 2014 was primarily related to the repayment in August 2014 of borrowings under our Credit Agreement of $40.0 million and repurchases of common stock of $13.9 million, offset by proceeds from the exercise of employee stock options of $10.7 million and the excess tax benefit related to stock-based awards of $7.8 million, which is a reduction in cash payments related to income taxes. During the year ended December 31, 2014, we repurchased 0.2 million shares of our common stock for an aggregate purchase price of $7.5 million under our share repurchase program that expired on July 31, 2014. During the life of the share repurchase program, we repurchased 1.1 million shares of our common stock for an aggregate purchase price of $40.1 million. Shares were retired upon repurchase. In addition, for the year ended December 31, 2014, we withheld and retired shares of common stock to satisfy $6.4 million of minimum statutory withholding tax requirements that we pay in cash to the appropriate taxing authorities on behalf of our employees related to the settlement of restricted stock units during the period. These shares are treated as common stock repurchases in our consolidated financial statements.
Net cash provided by financing activities for the year ended December 31, 2013 was primarily due to proceeds received from borrowings under our Credit Agreement of $40.0 million, proceeds from the exercise of employee stock options of $13.1 million and the excess tax benefit related to stock-based awards of $9.1 million, which is a reduction in cash payments related to income taxes, offset by repurchases of common stock of $37.3 million. During the year ended December 31, 2013, we repurchased 0.9 million shares of our common stock under our share repurchase program for an aggregate purchase price of $32.6 million. In addition, we withheld and retired shares of common stock to satisfy $4.7 million of minimum statutory withholding tax requirements.
Net cash provided by financing activities for the year ended December 31, 2012 was primarily due to $10.6 million of proceeds from the exercise of employee stock options and $10.5 million of excess tax benefit related to stock-based awards, which is a reduction in cash payments related to income taxes. In addition, for the year ended December 31, 2012, we withheld and retired shares of common stock to satisfy $1.5 million of minimum statutory withholding tax requirements. Also during the year ended December 31, 2012, we paid approximately $4.5 million of cash upon the achievement of certain earnout objectives related to acquisition accrued earnouts.
Anticipated Cash Flows
We believe that our existing cash and cash equivalents, our cash flows from operating activities and our borrowing capacity under our Credit Agreement will be sufficient to fund our operations and our commitments for capital expenditures for at least the next 12 months.
Our Credit Agreement, which we entered on October 4, 2013 with a syndicated group of lenders, provides for an unsecured $125.0 million five-year revolving credit facility that is comprised of revolving loans and swingline loans and, subject to certain requirements, may be increased up to an additional $75.0 million for a maximum aggregate commitment of $200.0 million. The facility remains outstanding through October 4, 2018. On October 4, 2013, we borrowed $40.0 million at an interest rate of approximately 1.4% under a revolving loan under the Credit Agreement that was used to finance a portion of the consideration paid upon the acquisition of Confio. In August 2014, we repaid the $40.0 million of outstanding borrowings under a revolving loan under the Credit Agreement. As of December 31, 2014, no amounts were outstanding under the Credit Agreement and we were in compliance with all covenants. See Note 8, Credit Agreement, of our Notes to Consolidated Financial Statements in Item 8 of Part II of this Annual Report on Form 10-K for additional information regarding our Credit Agreement.
Although we are not currently a party to any material definitive agreement regarding potential investments in, or acquisitions of, complementary businesses, applications or technologies, we may enter into these types of arrangements, which could reduce our cash and cash equivalents, require us to seek additional equity or debt financing or repatriate cash generated
43
by our international operations that would cause us to incur a U.S. federal income tax liability. Additional funds from financing arrangements may not be available on terms favorable to us or at all.
Our future capital requirements will depend on many factors, including our rate of revenue growth, the expansion of our sales and marketing activities, the timing and extent of spending to support product development efforts and expansion into new territories, the timing of any acquisitions to expand our business, the timing of expansions to our office facilities, the timing of introductions of new software products and enhancements to existing software products, and the continuing market acceptance of our software offerings. We expect to continue to pursue acquisitions that will enable us to enter new markets or new segments of our existing markets by bringing new product offerings to market more quickly than we can develop them.
In November 2013, we filed an automatic shelf registration statement with the SEC, which enables us to offer and sell from time to time, in one or more offerings, an unspecified amount of common stock, preferred stock, depositary shares, debt securities, warrants, purchase contracts, purchase units or any combination thereof and is intended to give us flexibility to take advantage of financing opportunities as needed or deemed desirable in light of market conditions. Debt securities sold by us may be fully and unconditionally guaranteed on an unsecured basis by SolarWinds Worldwide, LLC, our principal operating subsidiary. The specific terms of any offerings of securities under the automatic shelf registration statement will be provided in one or more supplements to the prospectus to be filed by us in connection with any future offering.
Contractual Obligations and Commitments
We generally do not enter into long-term minimum purchase commitments. Our principal commitments as of December 31, 2014 consisted of operating lease obligations for our office facilities. The following table summarizes our outstanding contractual obligations as of December 31, 2014, that require us to make future cash payments:
Payments Due by Period | |||||||||||||||||||
(in thousands) | Total | Less than 1 year | 1-3 years | 3-5 years | More than 5 years | ||||||||||||||
Operating leases | $ | 99,941 | $ | 11,584 | $ | 18,549 | $ | 15,983 | $ | 53,825 | |||||||||
Purchase obligations (1) | 16,550 | 16,172 | 378 | — | — | ||||||||||||||
Deferred Compensation (2) | 8,995 | 8,995 | — | — | — | ||||||||||||||
Total (3) | $ | 125,486 | $ | 36,751 | $ | 18,927 | $ | 15,983 | $ | 53,825 | |||||||||
(1) | Purchase obligations represent corporate health insurance costs, purchases of software license and support fees, marketing activities, accounting, legal and contractor fees and computer hardware and software costs. |
(2) | Represents a deferred compensation payment associated with our Pingdom acquisition that is denominated in Euros and that we expect to pay in the first half of fiscal year 2015. The above U.S. dollar amount was calculated based on the applicable exchange rate on December 31, 2014. |
(3) | Other long-term obligations on our balance sheet at December 31, 2014 included non-current income tax liabilities of $15.3 million, which related primarily to unrecognized tax benefits. We have not included this amount in the table above because we cannot reasonably estimate the period during which this obligation may be incurred, if at all. |
Off-Balance Sheet Arrangements
During 2014, 2013 and 2012, we did not have any relationships with unconsolidated organizations or financial partnerships, such as structured finance or special purpose entities that would have been established for the purpose of facilitating off-balance sheet arrangements or other contractually narrow or limited purposes.
Recent Accounting Pronouncements
See Note 1, Summary of Significant Accounting Policies, in the Notes to Consolidated Financial Statements in Item 8 of Part II of this Annual Report on Form 10-K, for a full description of recent accounting pronouncements which is incorporated herein by reference.
ITEM 7A. | QUANTITATIVE AND QUALITATIVE DISCLOSURES ABOUT MARKET RISK |
We are exposed to certain financial market risks, including the following:
44
Interest Rate Risk
We had cash and cash equivalents of $237.9 million and $166.0 million at December 31, 2014 and 2013, respectively. We also had short-term and long-term investments classified as available-for-sale securities of $29.8 million and $30.3 million at December 31, 2014 and 2013, respectively. Our cash and cash equivalents consist primarily of bank demand deposits and money market funds, and our available-for-sale securities consist of corporate bonds and municipal bonds held in investment accounts in the United States. We hold cash, cash equivalents and available-for-sale securities for working capital purposes. Our investments are made for capital preservation purposes, and we do not enter into investments for trading or speculative purposes.
We do not have material exposure to market risk with respect to our cash and cash equivalents, as these consist primarily of highly liquid investments purchased with original maturities of three months or less at December 31, 2014. Our portfolio of available-for-sale securities classified as investments is subject to market risk due to changes in interest rates. Changes in interest rates could impact our future investment income, or we may suffer losses in principal if we are forced to sell securities that decline in market value due to changes in interest rates. However, because we classify our investment securities as “available for sale,” no gains or losses are recognized due to changes in interest rates unless such securities are sold prior to maturity or declines in fair value are determined to be other-than-temporary.
We have interest rate risk relating to the associated interest expense under our Credit Agreement, which has the option to be indexed to Wells Fargo Bank’s prime rate, the federal funds rate or LIBOR. However, due to the short-term nature and notional amount of our variable rate obligations, a hypothetical increase of 100 basis points on an annual basis would not have a material impact on our interest expense or cash flows. See Note 8, Credit Agreement, of our Notes to Consolidated Financial Statements in Item 8 of Part II of this Annual Report on Form 10-K for additional information regarding our Credit Agreement.
Foreign Currency Risk
As a global company, we face exposure to adverse movements in foreign currency exchange rates. Our revenue from our international subsidiaries was approximately 27.3% of our total revenue for the year ended December 31, 2014. The foreign currencies that we invoice and on which we collect are primarily the Euro, British Pound Sterling and Australian Dollar. Expenses incurred by our international subsidiaries are, generally, denominated in the local currency of the subsidiary. Our consolidated statements of income are translated into U.S. dollars at the average exchange rates in each applicable period. To the extent the U.S. dollar strengthens against foreign currencies, the translation of these foreign currency denominated transactions results in reduced revenues, operating expenses and net income for our international operations. Similarly, our revenues, operating expenses and net income will increase for our international operations if the U.S. dollar weakens against foreign currencies.
We utilize purchased foreign currency forward contracts to minimize our foreign exchange exposure on certain foreign balance sheet positions denominated in currencies other than the Euro. We do not enter into any derivative financial instruments for trading or speculative purposes. Our objective in managing our exposure to foreign currency exchange rate fluctuations is to reduce the impact of adverse fluctuations in such exchange rates on our earnings and cash flow. The notional amounts and currencies underlying our foreign currency forward contracts will fluctuate period to period as they are principally dependent on the balances of the balance sheet positions that are denominated in currencies other than the Euro held by our global entities. There can be no assurance that our foreign currency hedging activities will substantially offset the impact of fluctuation in currency exchange rates on our results of operations and functional positions. As of December 31, 2014, we did not have any forward contracts outstanding and while we do not have a formal policy to settle all derivatives prior to the end of each quarter, our current practice is to do so. The effect of derivative instruments on our consolidated statements of income was insignificant for the year ended December 31, 2014.
We are exposed to credit-related losses in the event of non-performance by counterparties to derivative financial instruments, but we do not expect any counterparties to fail to meet their obligations given their high credit ratings. In addition, we diversify this risk across several counterparties and actively monitor their ratings.
We are also exposed to foreign exchange rate fluctuations as we translate or remeasure the financial statements of our foreign subsidiaries into U.S. dollars in consolidation. If there is a change in foreign currency exchange rates, the conversion of the foreign subsidiaries’ financial statements into U.S dollars will lead to remeasurement gains and losses recorded in income, or translation gains or losses that are recorded as a component of accumulated other comprehensive income (loss).
ITEM 8. | FINANCIAL STATEMENTS AND SUPPLEMENTARY DATA |
The information required by this item is incorporated by reference to the Consolidated Financial Statements set forth on pages F-1 through F-36 hereof.
45
ITEM 9. | CHANGES IN AND DISAGREEMENTS WITH ACCOUNTANTS ON ACCOUNTING AND FINANCIAL DISCLOSURE |
There were no changes in or disagreements with our accountants on accounting and financial disclosure matters.
ITEM 9A. | CONTROLS AND PROCEDURES |
Evaluation of Disclosure Controls and Procedures
Our management, with the participation of our Chief Executive Officer, our Chief Financial Officer and Chief Accounting Officer, evaluated the effectiveness of our disclosure controls and procedures as of December 31, 2014. The term “disclosure controls and procedures,” as defined in Rules 13a-15(e) and 15d-15(e) under the Exchange Act, means controls and other procedures of a company that are designed to ensure that information required to be disclosed by a company in the reports that it files or submits under the Exchange Act is recorded, processed, summarized and reported, within the time periods specified in the SEC’s rules and forms. Disclosure controls and procedures include, without limitation, controls and procedures designed to ensure that information required to be disclosed by a company in the reports that it files or submits under the Exchange Act is accumulated and communicated to the company’s management, including its principal executive and principal financial officers, as appropriate to allow timely decisions regarding required disclosure. Management recognizes that any controls and procedures, no matter how well designed and operated, can provide only reasonable assurance of achieving their objectives and management necessarily applies its judgment in evaluating the cost-benefit relationship of possible controls and procedures. Based on the evaluation of our disclosure controls and procedures as of December 31, 2014, our Chief Executive Officer, Chief Financial Officer and Chief Accounting Officer concluded that, as of such date, our disclosure controls and procedures were effective at a reasonable assurance level.
Management’s Annual Report on Internal Control over Financial Reporting
Our management is responsible for establishing and maintaining adequate internal control over financial reporting to provide reasonable assurance regarding the reliability of our financial reporting and the preparation of financial statements for external purposes in accordance with generally accepted accounting principles. Internal control over financial reporting includes those policies and procedures that (i) pertain to the maintenance of records that in reasonable detail accurately and fairly reflect the transactions and dispositions of the assets of the Company, (ii) provide reasonable assurance that transactions are recorded as necessary to permit preparation of financial statements in accordance with generally accepted accounting principles, and that receipts and expenditures of the Company are being made only in accordance with authorizations of management and directors of the Company; and (iii) provide reasonable assurance regarding prevention or timely detection of unauthorized acquisition, use or disposition of the Company’s assets that could have a material effect on the financial statements. Because of its inherent limitations, internal control over financial reporting may not prevent or detect misstatements. Also, projections of any evaluation of effectiveness to future periods are subject to the risk that controls may become inadequate because of changes in conditions, or that our degree of compliance with the policies or procedures may deteriorate.
Our management conducted an evaluation of the effectiveness of our internal control over financial reporting as of the end of the period covered by this report based on the framework in Internal Control— Integrated Framework issued in 2013 by the Committee of Sponsoring Organization of the Treadway Commission. Based on this evaluation, management concluded that the Company’s internal control over financial reporting was effective as of the end of the period covered by this report.
Our independent registered public accounting firm, which has audited our consolidated financial statements, has also audited the effectiveness of the Company’s internal control over financial reporting as of December 31, 2014, as stated in their report, which is included in Part II, Item 8 of this report.
Changes in Internal Control over Financial Reporting
There were no changes in our internal control over financial reporting that occurred during the quarter ended December 31, 2014 that have materially affected, or are reasonably likely to materially affect, our internal control over financial reporting.
ITEM 9B. | OTHER INFORMATION |
None.
46
PART III
Certain information required by Part III is omitted from this report. We intend to include such information in our definitive proxy statement (“Proxy Statement”) related to our 2015 annual meeting of stockholders pursuant to Regulation 14A under the Exchange Act, which we intend to file with the Securities and Exchange Commission not later than 120 days after the end of the fiscal year covered by this report.
ITEM 10. | DIRECTORS, EXECUTIVE OFFICERS AND CORPORATE GOVERNANCE |
Except as described below, the information required by this Item will be included in our Proxy Statement and is incorporated herein by reference.
Code of Business Ethics and Conduct
Our Board adopted a code of business ethics and conduct for all employees, including our executive officers and directors. The code of business ethics and conduct is available without charge upon request in writing to SolarWinds, Inc., 7171 Southwest Parkway, Building 400, Austin, Texas 78735, Attn: Corporate Secretary or on the investor relations portion of our website at www.solarwinds.com. The Company will disclose on its website at www.solarwinds.com, to the extent and in the manner required by applicable rules of the Securities and Exchange Commission and New York Stock Exchange, the nature of any amendment to this code of business ethics and conduct (other than technical, administrative, or other non-substantive amendments), our approval of any material departure from a provision of this code of business ethics and conduct, and our failure to take action within a reasonable period of time regarding any material departure from a provision of this code of business ethics and conduct that has been made known to any of our executive officers.
ITEM 11. | EXECUTIVE COMPENSATION |
The information required by this Item will be included in our Proxy Statement and is incorporated herein by reference.
ITEM 12. | SECURITY OWNERSHIP OF CERTAIN BENEFICIAL OWNERS AND MANAGEMENT AND RELATED STOCKHOLDER MATTERS |
The information required by this Item will be included in our Proxy Statement and is incorporated herein by reference.
ITEM 13. | CERTAIN RELATIONSHIPS AND RELATED TRANSACTIONS, AND DIRECTOR INDEPENDENCE |
The information required by this Item will be included in our Proxy Statement and is incorporated herein by reference.
ITEM 14. | PRINCIPAL ACCOUNTANT FEES AND SERVICES |
The information required by this Item will be included in our Proxy Statement and is incorporated herein by reference.
47
PART IV
ITEM 15. | EXHIBITS, FINANCIAL STATEMENT SCHEDULES |
(a) Documents Filed with Report
(1) | Financial Statements. |
(2) | Financial Statement Schedules. |
The following financial statement schedule should be read in conjunction with the consolidated financial statements of SolarWinds, Inc. filed as part of this Report:
• | Schedule II—Valuation and Qualifying Accounts |
Schedules other than that listed above have been omitted since they are either not required or not applicable or because the information required is included in the consolidated financial statements included elsewhere herein or the notes thereto.
(3) | Exhibits. |
The information required by this Item is set forth on the exhibit index that follows the signature page of this Annual Report on Form 10-K.
48
SIGNATURES
Pursuant to the requirements of Section 13 or 15(d) of the Securities Exchange Act of 1934, the registrant has duly caused this report to be signed on its behalf by the undersigned thereunto duly authorized.
SOLARWINDS, INC. | |||
Dated: | February 23, 2015 | By: | /s/ Jason Ream |
Jason Ream | |||
Executive Vice President, Finance and Chief Financial Officer | |||
Pursuant to the requirements of the Securities Exchange Act of 1934, this report has been signed below by the following persons on behalf of the registrant and in the capacities and on the dates indicated.
Signature | Title | Date |
/s/ Kevin B. Thompson | President, Chief Executive Officer and Director (principal executive officer) | February 23, 2015 |
Kevin B. Thompson | ||
/s/ Jason Ream | Executive Vice President, Finance and Chief Financial Officer (principal financial officer) | February 23, 2015 |
Jason Ream | ||
/s/ J. Barton Kalsu | Executive Vice President, Finance and Chief Accounting Officer (principal accounting officer) | February 23, 2015 |
J. Barton Kalsu | ||
/s/ Steven M. Cakebread | Lead Independent Director | February 23, 2015 |
Steven M. Cakebread | ||
/s/ Paul Cormier | Director | February 23, 2015 |
Paul Cormier | ||
/s/ J. Benjamin Nye | Director | February 23, 2015 |
J. Benjamin Nye | ||
/s/ Ellen F. Siminoff | Director | February 23, 2015 |
Ellen F. Siminoff | ||
/s/ Roger J. Sippl | Director | February 23, 2015 |
Roger J. Sippl | ||
/s/ Lloyd G. Waterhouse | Director | February 23, 2015 |
Lloyd G. Waterhouse | ||
49
INDEX TO CONSOLIDATED FINANCIAL STATEMENTS
Page | |
SOLARWINDS, INC. | |
F-1
Report of Independent Registered Public Accounting Firm
To the Board of Directors and Stockholders of SolarWinds, Inc.:
In our opinion, the accompanying consolidated balance sheets and the related consolidated statements of income, of comprehensive income, of changes in stockholders’ equity and of cash flows present fairly, in all material respects, the financial position of SolarWinds, Inc. and its subsidiaries at December 31, 2014 and 2013, and the results of their operations and their cash flows for each of the three years in the period ended December 31, 2014 in conformity with accounting principles generally accepted in the United States of America. In addition, in our opinion, the financial statement schedule listed in the index appearing under Item 15(a)(2) presents fairly, in all material respects, the information set forth therein when read in conjunction with the related consolidated financial statements. Also in our opinion, the Company maintained, in all material respects, effective internal control over financial reporting as of December 31, 2014, based on criteria established in Internal Control - Integrated Framework 2013 issued by the Committee of Sponsoring Organizations of the Treadway Commission (COSO). The Company’s management is responsible for these financial statements and financial statement schedule, for maintaining effective internal control over financial reporting and for its assessment of the effectiveness of internal control over financial reporting, included in the accompanying Management’s Annual Report on Internal Control over Financial Reporting. Our responsibility is to express opinions on these financial statements, on the financial statement schedule, and on the Company’s internal control over financial reporting based on our integrated audits. We conducted our audits in accordance with the standards of the Public Company Accounting Oversight Board (United States). Those standards require that we plan and perform the audits to obtain reasonable assurance about whether the financial statements are free of material misstatement and whether effective internal control over financial reporting was maintained in all material respects. Our audits of the financial statements included examining, on a test basis, evidence supporting the amounts and disclosures in the financial statements, assessing the accounting principles used and significant estimates made by management, and evaluating the overall financial statement presentation. Our audit of internal control over financial reporting included obtaining an understanding of internal control over financial reporting, assessing the risk that a material weakness exists, and testing and evaluating the design and operating effectiveness of internal control based on the assessed risk. Our audits also included performing such other procedures as we considered necessary in the circumstances. We believe that our audits provide a reasonable basis for our opinions.
A company’s internal control over financial reporting is a process designed to provide reasonable assurance regarding the reliability of financial reporting and the preparation of financial statements for external purposes in accordance with generally accepted accounting principles. A company’s internal control over financial reporting includes those policies and procedures that (i) pertain to the maintenance of records that, in reasonable detail, accurately and fairly reflect the transactions and dispositions of the assets of the company; (ii) provide reasonable assurance that transactions are recorded as necessary to permit preparation of financial statements in accordance with generally accepted accounting principles, and that receipts and expenditures of the company are being made only in accordance with authorizations of management and directors of the company; and (iii) provide reasonable assurance regarding prevention or timely detection of unauthorized acquisition, use, or disposition of the company’s assets that could have a material effect on the financial statements.
Because of its inherent limitations, internal control over financial reporting may not prevent or detect misstatements. Also, projections of any evaluation of effectiveness to future periods are subject to the risk that controls may become inadequate because of changes in conditions, or that the degree of compliance with the policies or procedures may deteriorate.
/s/ PricewaterhouseCoopers LLP
Austin, Texas
February 23, 2015
F-2
SolarWinds, Inc.
Consolidated Balance Sheets
(In thousands, except share and per share information)
December 31, | |||||||
2014 | 2013 | ||||||
Assets | |||||||
Current assets: | |||||||
Cash and cash equivalents | $ | 237,942 | $ | 165,973 | |||
Short-term investments | 12,384 | 19,327 | |||||
Accounts receivable, net of allowances of $1,088 and $473 as of December 31, 2014 and 2013, respectively | 50,791 | 45,694 | |||||
Income tax receivable | 128 | 1,535 | |||||
Deferred taxes | 8,350 | 5,410 | |||||
Prepaid and other current assets | 6,492 | 4,846 | |||||
Total current assets | 316,087 | 242,785 | |||||
Property and equipment, net | 23,614 | 9,213 | |||||
Long-term investments | 17,423 | 11,012 | |||||
Deferred taxes | 830 | 478 | |||||
Goodwill | 363,585 | 317,054 | |||||
Intangible assets and other, net | 103,493 | 125,800 | |||||
Total assets | $ | 825,032 | $ | 706,342 | |||
Liabilities and stockholders’ equity | |||||||
Current liabilities: | |||||||
Accounts payable | $ | 6,829 | $ | 7,187 | |||
Accrued liabilities and other | 35,276 | 17,716 | |||||
Income taxes payable | 2,351 | 563 | |||||
Current portion of deferred revenue | 154,799 | 128,328 | |||||
Current debt obligation | — | 40,000 | |||||
Total current liabilities | 199,255 | 193,794 | |||||
Long-term liabilities: | |||||||
Deferred revenue, net of current portion | 8,609 | 6,863 | |||||
Non-current deferred taxes | 5,319 | 4,975 | |||||
Other long-term liabilities | 22,990 | 16,816 | |||||
Total liabilities | 236,173 | 222,448 | |||||
Commitments and contingencies (Note 14) | |||||||
Stockholders’ equity: | |||||||
Common stock, $0.001 par value: 123,000,000 shares authorized and 75,911,349 and 75,009,620 shares issued and outstanding as of December 31, 2014 and 2013, respectively | 76 | 75 | |||||
Additional paid-in capital | 279,584 | 236,481 | |||||
Accumulated other comprehensive income (loss) | (13,299 | ) | 2,953 | ||||
Accumulated earnings | 322,498 | 244,385 | |||||
Total stockholders’ equity | 588,859 | 483,894 | |||||
Total liabilities and stockholders’ equity | $ | 825,032 | $ | 706,342 | |||
The accompanying notes are an integral part of these consolidated financial statements.
F-3
SolarWinds, Inc.
Consolidated Statements of Income
(In thousands, except for per share information)
Year Ended December 31, | |||||||||||
2014 | 2013 | 2012 | |||||||||
Revenue: | |||||||||||
License | $ | 161,795 | $ | 135,839 | $ | 123,984 | |||||
Maintenance and other | 238,892 | 191,491 | 144,980 | ||||||||
Subscription | 28,027 | 8,055 | — | ||||||||
Total revenue | 428,714 | 335,385 | 268,964 | ||||||||
Cost of license revenue | 16,394 | 11,633 | 8,203 | ||||||||
Cost of maintenance and other revenue | 15,315 | 11,612 | 10,197 | ||||||||
Cost of subscription revenue | 12,657 | 4,671 | — | ||||||||
Gross profit | 384,348 | 307,469 | 250,564 | ||||||||
Operating expenses: | |||||||||||
Sales and marketing | 148,420 | 99,289 | 73,046 | ||||||||
Research and development | 56,479 | 37,514 | 28,769 | ||||||||
General and administrative | 77,172 | 48,919 | 35,079 | ||||||||
Total operating expenses | 282,071 | 185,722 | 136,894 | ||||||||
Operating income | 102,277 | 121,747 | 113,670 | ||||||||
Other income (expense): | |||||||||||
Interest income | 363 | 396 | 430 | ||||||||
Interest expense | (684 | ) | (215 | ) | — | ||||||
Other income (expense), net | 640 | (425 | ) | 419 | |||||||
Total other income (expense) | 319 | (244 | ) | 849 | |||||||
Income before income taxes | 102,596 | 121,503 | 114,519 | ||||||||
Income tax expense | 24,483 | 31,725 | 33,176 | ||||||||
Net income | $ | 78,113 | $ | 89,778 | $ | 81,343 | |||||
Net income per share: | |||||||||||
Basic earnings per share | $ | 1.03 | $ | 1.19 | $ | 1.10 | |||||
Diluted earnings per share | $ | 1.02 | $ | 1.17 | $ | 1.07 | |||||
Weighted-average shares used to compute net income per share: | |||||||||||
Shares used in computation of basic earnings per share | 75,476 | 75,182 | 74,166 | ||||||||
Shares used in computation of diluted earnings per share | 76,462 | 76,475 | 76,035 | ||||||||
The accompanying notes are an integral part of these consolidated financial statements.
F-4
SolarWinds, Inc.
Consolidated Statements of Comprehensive Income
(In thousands)
Year Ended December 31, | |||||||||||
2014 | 2013 | 2012 | |||||||||
Net income | $ | 78,113 | $ | 89,778 | $ | 81,343 | |||||
Other comprehensive income (loss): | |||||||||||
Foreign currency translation adjustment | (16,195 | ) | 4,102 | 1,597 | |||||||
Unrealized gains (losses) on investments, net of income tax expense (benefit) of $(30), $(2) and $14 for the years ended December 31, 2014, 2013 and 2012 respectively | (57 | ) | (4 | ) | 27 | ||||||
Other comprehensive income (loss) | (16,252 | ) | 4,098 | 1,624 | |||||||
Comprehensive income | $ | 61,861 | $ | 93,876 | $ | 82,967 | |||||
The accompanying notes are an integral part of these consolidated financial statements.
F-5
SolarWinds, Inc.
Consolidated Statements of Changes in Stockholders’ Equity
(In thousands)
Common Stock | Additional Paid-in Capital | Accumulated Other Comprehensive Income (Loss) | Accumulated Earnings | Total Stockholders’ Equity | ||||||||||||||||||
Shares | Amount | |||||||||||||||||||||
Balances at December 31, 2011 | 73,367 | $ | 73 | $ | 194,379 | $ | (2,769 | ) | $ | 73,264 | $ | 264,947 | ||||||||||
Comprehensive income: | ||||||||||||||||||||||
Foreign currency translation adjustment | — | — | — | 1,597 | — | 1,597 | ||||||||||||||||
Unrealized gain (losses) on investments, net of taxes | — | — | — | 27 | — | 27 | ||||||||||||||||
Net income | — | — | — | — | 81,343 | 81,343 | ||||||||||||||||
Comprehensive income | 82,967 | |||||||||||||||||||||
Exercise of stock options | 1,142 | 2 | 10,620 | — | — | 10,622 | ||||||||||||||||
Restricted stock units issued, net of shares withheld for taxes | 124 | — | (1,472 | ) | — | — | (1,472 | ) | ||||||||||||||
Stock-based compensation | — | — | 15,264 | — | — | 15,264 | ||||||||||||||||
Excess tax benefit from stock-based compensation | — | — | 10,486 | — | — | 10,486 | ||||||||||||||||
Balances at December 31, 2012 | 74,633 | 75 | 229,277 | (1,145 | ) | 154,607 | 382,814 | |||||||||||||||
Comprehensive income: | ||||||||||||||||||||||
Foreign currency translation adjustment | — | — | — | 4,102 | — | 4,102 | ||||||||||||||||
Unrealized gains (losses) on investments, net of taxes | — | — | — | (4 | ) | — | (4 | ) | ||||||||||||||
Net income | — | — | — | — | 89,778 | 89,778 | ||||||||||||||||
Comprehensive income | 93,876 | |||||||||||||||||||||
Exercise of stock options | 1,065 | 1 | 13,109 | — | — | 13,110 | ||||||||||||||||
Restricted stock units issued, net of shares withheld for taxes | 209 | — | (4,709 | ) | — | — | (4,709 | ) | ||||||||||||||
Repurchase of common stock | (897 | ) | (1 | ) | (32,570 | ) | — | — | (32,571 | ) | ||||||||||||
Stock-based compensation | — | — | 22,649 | — | — | 22,649 | ||||||||||||||||
Excess tax benefit from stock-based compensation | — | — | 8,725 | — | — | 8,725 | ||||||||||||||||
Balances at December 31, 2013 | 75,010 | 75 | 236,481 | 2,953 | 244,385 | 483,894 | ||||||||||||||||
Comprehensive income: | ||||||||||||||||||||||
Foreign currency translation adjustment | — | — | — | (16,195 | ) | — | (16,195 | ) | ||||||||||||||
Unrealized gains (losses) on investments, net of taxes | — | — | — | (57 | ) | — | (57 | ) | ||||||||||||||
Net income | — | — | — | — | 78,113 | 78,113 | ||||||||||||||||
Comprehensive income | 61,861 | |||||||||||||||||||||
Exercise of stock options | 729 | 1 | 10,702 | — | — | 10,703 | ||||||||||||||||
Restricted stock units issued, net of shares withheld for taxes | 374 | — | (6,397 | ) | — | — | (6,397 | ) | ||||||||||||||
Repurchase of common stock | (202 | ) | — | (7,494 | ) | — | — | (7,494 | ) | |||||||||||||
Stock-based compensation | — | — | 38,980 | — | — | 38,980 | ||||||||||||||||
Excess tax benefit from stock-based compensation | — | — | 7,312 | — | — | 7,312 | ||||||||||||||||
Balances at December 31, 2014 | 75,911 | $ | 76 | $ | 279,584 | $ | (13,299 | ) | $ | 322,498 | $ | 588,859 | ||||||||||
The accompanying notes are an integral part of these consolidated financial statements.
F-6
SolarWinds, Inc.
Consolidated Statements of Cash Flows
(In thousands)
Year Ended December 31, | |||||||||||
2014 | 2013 | 2012 | |||||||||
Cash flows from operating activities | |||||||||||
Net income | $ | 78,113 | $ | 89,778 | $ | 81,343 | |||||
Adjustments to reconcile net income to net cash provided by operating activities: | |||||||||||
Depreciation and amortization | 36,657 | 26,889 | 18,359 | ||||||||
Provision for doubtful accounts | 879 | 456 | 258 | ||||||||
Stock-based compensation expense | 38,980 | 22,649 | 15,264 | ||||||||
Accrued earnout gain | — | (125 | ) | (570 | ) | ||||||
Deferred taxes | (5,205 | ) | (3,612 | ) | (989 | ) | |||||
Excess tax benefit from stock-based compensation | (7,801 | ) | (9,057 | ) | (10,486 | ) | |||||
Premium on investments | (551 | ) | (596 | ) | (1,605 | ) | |||||
Other non-cash expenses | 1,091 | 1,181 | 1,432 | ||||||||
Changes in operating assets and liabilities, net of assets acquired and liabilities assumed in business combinations: | |||||||||||
Accounts receivable | (7,246 | ) | (6,323 | ) | (5,695 | ) | |||||
Income taxes receivable | 3,964 | (25 | ) | (28 | ) | ||||||
Prepaid and other current assets | (2,122 | ) | (87 | ) | (1,220 | ) | |||||
Accounts payable | (536 | ) | 1,475 | 1,807 | |||||||
Accrued liabilities and other | 18,259 | (699 | ) | 4,473 | |||||||
Income taxes payable | 7,004 | 11,754 | 18,565 | ||||||||
Deferred revenue | 32,811 | 28,616 | 22,539 | ||||||||
Other long-term liabilities | 5,515 | 1,046 | — | ||||||||
Net cash provided by operating activities | 199,812 | 163,320 | 143,447 | ||||||||
Cash flows from investing activities | |||||||||||
Purchases of investments | (18,479 | ) | (17,288 | ) | (65,929 | ) | |||||
Maturities of investments | 18,988 | 48,163 | 33,930 | ||||||||
Purchases of property and equipment | (19,228 | ) | (4,753 | ) | (3,885 | ) | |||||
Purchases of intangible assets and other long-term investments | (229 | ) | (8,361 | ) | (1,203 | ) | |||||
Acquisition of businesses, net of cash acquired | (63,700 | ) | (223,464 | ) | (66,031 | ) | |||||
Other investing activities | — | 579 | — | ||||||||
Net cash used in investing activities | (82,648 | ) | (205,124 | ) | (103,118 | ) | |||||
Cash flows from financing activities | |||||||||||
Repurchase of common stock | (13,891 | ) | (37,280 | ) | (1,472 | ) | |||||
Exercise of stock options | 10,703 | 13,110 | 10,622 | ||||||||
Excess tax benefit from stock-based compensation | 7,801 | 9,057 | 10,486 | ||||||||
Earnout payments for acquisitions | — | — | (4,154 | ) | |||||||
Proceeds from credit agreement | — | 40,000 | — | ||||||||
Repayments of borrowings from credit agreement | (40,000 | ) | — | — | |||||||
Payment of debt issuance costs | — | (642 | ) | — | |||||||
Net cash provided by (used in) financing activities | (35,387 | ) | 24,245 | 15,482 | |||||||
Effect of exchange rate changes on cash and cash equivalents | (9,808 | ) | 3,830 | 1,184 | |||||||
Net increase (decrease) in cash and cash equivalents | 71,969 | (13,729 | ) | 56,995 | |||||||
Cash and cash equivalents | |||||||||||
Beginning of period | 165,973 | 179,702 | 122,707 | ||||||||
End of period | $ | 237,942 | $ | 165,973 | $ | 179,702 | |||||
Supplemental disclosure of cash flow information | |||||||||||
Cash paid for interest | $ | 595 | $ | 139 | $ | — | |||||
Cash paid for income taxes | $ | 18,346 | $ | 23,262 | $ | 15,285 | |||||
Non-cash investing and financing transactions | |||||||||||
Accrued earnout | $ | — | $ | — | $ | 1,547 | |||||
The accompanying notes are an integral part of these consolidated financial statements.
F-7
SolarWinds, Inc.
Notes to Consolidated Financial Statements
1. Summary of Significant Accounting Policies
Organization and Nature of Operations
SolarWinds, Inc., a Delaware corporation, and its subsidiaries (“we” or “us”) design, develop, market, sell and support enterprise-class information technology, or IT, infrastructure management software to IT and DevOps professionals in organizations of all sizes to manage on-premise, hybrid cloud and public cloud environments. Our product offerings range from individual software tools to more comprehensive software products that solve problems encountered every day by IT and DevOps professionals and help them to efficiently and effectively manage their network, systems, application and website infrastructures.
Basis of Consolidation
The accompanying consolidated financial statements include our accounts and the accounts of our wholly owned subsidiaries. We have eliminated all intercompany balances and transactions.
Reclassifications
Certain reclassifications have been made to prior periods’ consolidated financial statements to conform to the current period presentation. These reclassifications did not result in any change in previously reported net income, total assets or stockholders’ equity.
Use of Estimates
The preparation of financial statements in conformity with United States of America generally accepted accounting principles, or GAAP, requires our management to make estimates and assumptions that affect the reported amounts and the disclosure of assets and liabilities at the date of the financial statements and the reported amounts of revenue and expenses during the reporting periods. The actual results that we experience may differ materially from our estimates. The accounting estimates that require our most significant, difficult and subjective judgments include:
• | the valuation of goodwill, intangibles, long-lived assets and contingent consideration, including accrued earnouts; |
• | revenue recognition; |
• | stock-based compensation; |
• | income taxes; and |
• | loss contingencies. |
Foreign Currency Translation
The functional currency of our foreign subsidiaries is determined in accordance with authoritative guidance issued by the Financial Accounting Standards Board, or FASB. We translate assets and liabilities for these subsidiaries at exchange rates in effect at the balance sheet date. We translate income and expense accounts for these subsidiaries at the average monthly exchange rates for the periods. We record resulting translation adjustments as a component of accumulated other comprehensive income (loss) within stockholders’ equity (deficit). We record gains and losses from currency transactions denominated in currencies other than the functional currency as other income (expense) in our consolidated statements of income. There were no equity transactions denominated in foreign currencies for the years ended December 31, 2014 and 2013.
Local currency transactions of international subsidiaries that have the U.S. dollar as the functional currency are remeasured into U.S. dollars using current rates of exchange for monetary assets and liabilities and historical rates of exchange for non-monetary assets and liabilities. Gains and losses from remeasurement of monetary assets and liabilities, as reflected within our consolidated statements of income, were not material for the years ended December 31, 2014, 2013 and 2012.
Recent Accounting Pronouncements
In May 2014, the FASB and the International Accounting Standards Board, or IASB, issued a converged standard to provide updated guidance on recognizing revenue from contracts with customers. The new guidance replaces the existing revenue recognition guidance under GAAP. The new guidance includes a five-step process for companies to recognize revenue to depict the transfer of promised goods or services to customers in an amount that reflects the consideration to which the company expects to be entitled in exchange for those goods or services. In addition, the standard enhances the disclosure requirements regarding revenue and specifies the accounting for some costs to obtain or fulfill a contract with a customer. The updated accounting guidance is effective for interim and annual periods beginning after December 15, 2016. Early adoption is
F-8
not permitted. The standard permits the use of either the retrospective or cumulative effect transition method. We will adopt the updated guidance in the first quarter of fiscal year 2017. We are still evaluating transition methods and the impact of the new revenue recognition guidance.
Acquisitions
We account for acquired businesses using the acquisition method of accounting, which requires that the assets acquired, liabilities assumed, contractual contingencies and contingent consideration be recorded at the date of acquisition at their respective fair values. Goodwill represents the excess of the purchase price, including any contingent consideration, over the fair value of the net assets acquired. It further requires acquisition related costs to be recognized separately from the acquisition and expensed as incurred, most restructuring costs to be expensed in periods subsequent to the acquisition date and changes in accounting for deferred tax asset valuation allowances and acquired income tax uncertainties after the measurement period to impact the provision for income taxes. The acquired developed product technologies recorded for each acquisition were feasible at the date of acquisition as they were being actively marketed and sold by the acquired company at the acquisition date. In addition to the acquired developed product technologies, we also recorded intangible assets for the acquired companies’ customer relationships, customer backlog, trademarks and tradenames, in process research and development and certain non-competition covenants. We include the operating results of acquisitions in our consolidated financial statements from the effective date of the acquisitions. Acquisition related costs are included in general and administrative expenses in our consolidated statements of income.
The fair value of identifiable intangible assets is based on significant judgments made by management. We typically engage third party valuation appraisal firms to assist us in determining the fair values and useful lives of the assets acquired. Such valuations and useful life determinations require us to make significant estimates and assumptions. These estimates and assumptions are based on historical experience and information obtained from management, and also include, but are not limited to, future expected cash flows earned from the product technology and discount rates applied in determining the present value of those cash flows. Unanticipated events and circumstances may occur that could affect the accuracy or validity of such assumptions, estimates or actual results. Acquired identifiable intangible assets are amortized on the net cash flow method over their estimated economic lives, which are generally three to eight years for trademarks, customer relationships, customer backlog, non-competition covenants and acquired developed product technologies and ten years for intellectual property. We include amortization of acquired developed product technologies in cost of license revenue or cost of subscription revenue and amortization of other acquired intangible assets in general and administrative expenses in our consolidated statements of income. We record acquired in process research and development as indefinite-lived intangible assets. On completion of the related development projects, the in process research and development assets are reclassified to developed technology and amortized over their estimated economic lives.
Goodwill, Intangible Assets and Long-lived Assets
As we operate our business in one operating segment and one reporting unit, our goodwill is assessed at the consolidated level for impairment in the fourth quarter of each year or more frequently if events or changes in circumstances indicate that impairment may exist. If we perform a qualitative assessment, we first determine whether it is more likely than not that the fair value of our reporting unit is less than its carrying amount and whether the two-step quantitative analysis is necessary. If determined necessary, for the first step of our quantitative analysis, we consider our market capitalization compared with the carrying amount of our net assets on the date of the test, since we have only one reporting unit. An impairment of goodwill is recognized when the carrying amount exceeds the fair value.
We also evaluate indefinite-lived intangible assets for impairment annually during our fourth fiscal quarter and whenever events or changes in circumstances indicate impairment may exist. We first perform a qualitative assessment to determine whether it is more likely than not that the fair value of our indefinite-lived intangible assets is less than its carrying amount and whether the quantitative analysis is necessary. The quantitative analysis compares the fair value of our indefinite-lived intangible assets to their carrying amount and an impairment loss is recognized when the carrying amount exceeds the fair value.
The process of evaluating the potential impairment related to our goodwill and indefinite-lived intangible assets is highly subjective and requires the application of significant judgment. If an event occurs that would cause us to revise our estimates and assumptions used in analyzing the value of our goodwill and other intangible assets with indefinite lives, the revision could result in a non-cash impairment charge that could have a material impact on our financial results. As of December 31, 2014 and 2013, we performed our annual review of goodwill and indefinite-lived intangible assets and concluded that no impairment existed for our reporting unit during any of the periods presented. No impairment charges have been required to date.
F-9
We evaluate long-lived assets, including finite-lived intangible assets and other assets, for impairment whenever events or changes in circumstances indicate that the carrying amount of the assets may not be recoverable. Events or changes in circumstances that could result in an impairment review include, but are not limited to, significant underperformance relative to historical or projected future operating results, significant changes in the manner of use of the acquired assets or the strategy for our overall business, and significant negative industry or economic trends. Impairment is recognized when the asset is not recoverable and the carrying amount of an asset exceeds its fair value as calculated on a discounted cash flow basis. If an event occurs that would cause us to revise our estimates and assumptions used in analyzing the value of our property and equipment or our finite-lived intangibles and other assets, that revision could result in a non-cash impairment charge that could have a material impact on our financial results. As of December 31, 2014 and 2013, there were no indicators that our long-lived assets were impaired.
Investments
Short-term and long-term investments at December 31, 2014 and 2013 were as follows:
December 31, | |||||||
(in thousands) | 2014 | 2013 | |||||
Short-term investments | $ | 12,384 | $ | 19,327 | |||
Long-term investments | 17,423 | 11,012 | |||||
Total investments | $ | 29,807 | $ | 30,339 | |||
Our short-term and long-term investments, classified as available-for-sale securities, consist of marketable securities such as corporate bonds and municipal bonds. We determine the appropriate classification of our investments at the time of purchase and reevaluate such determination at each balance sheet date. All securities classified as short-term investments have contractual maturities of less than twelve months. All securities classified as long-term investments have contractual maturities greater than twelve months.
Available-for-sale securities are carried at fair value, with the unrealized gains and losses, net of tax, reported as a separate component of stockholders’ equity (deficit). Any premiums or discounts are amortized or accreted, respectively, to maturity as a component of other income (expense) in our consolidated statements of income. Cash flows from the principal amount of purchases, sales and maturities of available-for-sale securities are classified as cash flows from investing activities. Any amount of premium on purchased securities and discount on matured and sold securities and the related amortization and accretion are classified as cash flows from operating activities in our consolidated statements of cash flows.
The cost of securities sold is based on the specific-identification method. In determining if and when a decline in fair value is judged to be other-than-temporary, we evaluate, among other factors: the duration and extent to which the fair value has been less than the carrying value and the intent and ability to retain the investment for a period of time sufficient to allow for any anticipated recovery in fair market value. Declines in fair value deemed other-than-temporary are included as a component of other income (expense). We have not recorded any other-than-temporary impairments related to marketable securities. See Note 4 for a summary of our investments.
Fair Value Measurements
We apply the authoritative guidance on fair value measurements for financial assets and liabilities that are measured at fair value on a recurring basis and non-financial assets and liabilities, such as goodwill, intangible assets and property, plant and equipment that are measured at fair value on a non-recurring basis.
The guidance establishes a three-tiered fair value hierarchy that prioritizes inputs to valuation techniques used in fair value calculations. The three levels of inputs are defined as follows:
Level 1: Unadjusted quoted prices for identical assets or liabilities in active markets accessible by us.
Level 2: Inputs that are observable in the marketplace other than those inputs classified as Level 1.
Level 3: Inputs that are unobservable in the marketplace and significant to the valuation.
We determine the fair value of our available-for-sale securities based on inputs obtained from multiple pricing vendors, who may use quoted prices in active markets for identical assets (Level 1 inputs) or inputs other than quoted prices that are observable either directly or indirectly (Level 2 inputs) in determining fair value. However, we classify all of our available-for-
F-10
sale securities as being valued using Level 2 inputs. The valuation techniques used to determine the fair value of our financial instruments having Level 2 inputs are derived from unadjusted, non-binding market consensus prices that are corroborated by observable market data, quoted market prices for similar instruments, or pricing models. Our procedures include controls to ensure that appropriate fair values are recorded by a review of the valuation methods and assumptions.
See Note 5 for a summary of our financial instruments accounted for at fair value on a recurring basis. The carrying amounts reported in our consolidated balance sheets for cash, accounts receivable, accounts payable and other accrued expenses approximate fair value due to relatively short periods to maturity.
Contingent Consideration
Contingent consideration, which includes earnout payments in connection with our acquisitions, is recognized at fair value on the acquisition date and remeasured each reporting period with subsequent adjustments recognized in our consolidated statements of income. We estimate the fair value of contingent consideration liabilities based on certain milestones of the acquired companies and estimated probabilities of achievement and discount the liabilities to present value using our pre-tax cost of debt. Contingent consideration is valued using significant inputs that are not observable in the market which are defined as Level 3 inputs pursuant to fair value measurement accounting. We believe our estimates and assumptions are reasonable; however, there is significant judgment involved. At each reporting date, the contingent consideration liability is revalued to estimated fair value.
Changes in the fair value of contingent consideration liabilities may result from changes in discount periods, changes in the timing and amount of sales and/or other specific milestone estimates and changes in probability assumptions with respect to the likelihood of achieving the various earnout criteria. These changes could cause a material impact to, and volatility in our operating results. Earnout payments are reflected in cash flows from financing activities and the changes in fair value are reflected in cash flows from operating activities in our consolidated statements of cash flows.
Derivative Instruments
We utilize purchased foreign currency forward contracts to minimize our foreign exchange exposure on certain foreign balance sheet positions denominated in currencies other than the Euro. We do not use forward contracts for trading or speculative purposes. Our use of foreign currency forward exchange contracts is intended to principally offset gains and losses associated with these exposures. Therefore, the notional amounts and currencies underlying our foreign currency forward contracts will fluctuate period to period as they are principally dependent on the balances of the balance sheet positions maintained by our international entities that are denominated in currencies other than the Euro.
These foreign currency forward contracts are not designated as hedging instruments, and the gain or loss on the derivatives is recognized in our consolidated statements of income as other income (expense). The fair value of our outstanding foreign currency forward contracts in a gain position is recorded within prepaid and other current assets and the fair value of contracts in a loss position is recorded within accrued liabilities and other in our consolidated balance sheets. The maturities of the forward contracts are generally less than three months. As of December 31, 2014 and 2013, we did not have any forward contracts outstanding. The effects of derivative instruments on our consolidated statements of income were insignificant for the years ended December 31, 2014, 2013 and 2012.
Accounts Receivable
Accounts receivable represent trade receivables from customers when we have provided software licenses and/or software maintenance agreements or software subscription agreements and we have not yet received payment. We present accounts receivable net of an allowance for doubtful accounts. We maintain an allowance for doubtful accounts for estimated losses resulting from the inability of customers to make required payments. In doing so, we consider the current financial condition of the customer, the specific details of the customer account, the age of the outstanding balance and the current economic environment. Any change in the assumptions used in analyzing a specific account receivable might result in an additional allowance for doubtful accounts being recognized in the period in which the change occurs. We have historically had insignificant write-offs related to bad debts.
F-11
Property and Equipment
We record property and equipment at cost and depreciate them using the straight-line method over their estimated useful lives as follows:
Useful Life | |
(in years) | |
Equipment and other | 3 - 5 |
Furniture and fixtures | 5 - 7 |
Software | 3 - 5 |
Leasehold improvements | Lesser of lease term or useful life |
Upon retirement or sale of property and equipment, we remove the cost of assets disposed of and any related accumulated depreciation from our accounts and credit or charge any resulting gain or loss to operating expense. We expense repairs and maintenance as they are incurred.
Costs related to software developed or obtained for internal use are included in property and equipment and are depreciated on a straight line basis over the useful life of the software. Costs incurred during the preliminary planning and evaluation stage of the project and during the post implementation operational stage are expensed as incurred. Costs incurred during the application development stage of the project are capitalized.
Research and Development and Capitalized Software Development Costs
Research and development expenses primarily consist of personnel costs and contractor fees related to the development of new software products and enhancements to existing software products. Research and development costs are charged to operations as incurred with the exception of those software development costs that may qualify for capitalization. Software development costs incurred subsequent to establishing technological feasibility through the general release of the software products are capitalized. Generally, new software products and significant enhancements to our existing products are available for general release soon after technological feasibility has been established.
Capitalized product costs are included in intangible assets and other, net in our consolidated balance sheets and are amortized over their estimated useful life, generally three to five years. At December 31, 2014 and 2013, we had unamortized capitalized software development costs of $0.2 million and $0.3 million, respectively, primarily related to localizing our products. Amortization of capitalized software development costs is included in cost of license revenue in our consolidated statements of income and was insignificant for the years ended December 31, 2014, 2013 and 2012.
Website Development Costs
We capitalize certain direct costs to develop functionality as well as certain upgrades and enhancements that are probable to result in additional functionality to our website. The costs incurred in the preliminary stages of development are expensed as incurred. Once an application has reached the development stage, costs are capitalized until the software is substantially complete and ready for its intended use. Capitalized website development costs are recorded in intangible assets and other, net in our consolidated balance sheets and amortized over their estimated useful life, generally three years, as general and administrative expenses in our consolidated statements of income. Capitalized website development costs at December 31, 2014 and 2013 were insignificant.
Credit Agreement and Debt Issuance Costs
On October 4, 2013, we entered into a Credit Agreement with a syndicated group of lenders that provides for an unsecured $125.0 million five-year revolving credit facility that is comprised of revolving loans or swingline loans. The Credit Agreement contains customary affirmative and negative covenants, including covenants that limit or restrict our ability to, among other things, incur indebtedness, grant liens, make investments, merge or consolidate, dispose of assets, pay dividends or make distributions, make acquisitions and enter into certain transactions with affiliates, in each case subject to customary exceptions for a credit facility of this size and type. We are also required to maintain compliance with a consolidated total leverage ratio and a consolidated interest coverage ratio. Principal amounts borrowed under our Credit Agreement are recorded in current debt obligations in our consolidated balance sheets as the term of each borrowing is short-term and allows for subsequent renewals. See Note 8 for further discussion of our credit agreement.
F-12
Debt issuance costs are recorded in intangible assets and other, net in our consolidated balance sheets and amortized on a straight-line basis over the term of the associated debt as interest expense in our consolidated statements of income. The gross carrying amount of debt issuance costs was $0.6 million at December 31, 2014 and 2013 and accumulated amortization was $0.2 million at December 31, 2014. Amortization of debt issuance costs included in interest expense was $0.1 million for the year ended December 31, 2014 and was insignificant for the year ended December 31, 2013.
Contingencies
We account for claims and contingencies in accordance with authoritative guidance that requires we record an estimated loss from a claim or loss contingency when information available prior to issuance of our consolidated financial statements indicates that it is probable that an asset has been impaired or a liability has been incurred at the date of our consolidated financial statements and the amount of the loss can be reasonably estimated. If we determine that it is reasonably possible but not probable that an asset has been impaired or a liability has been incurred, we disclose the amount or range of estimated loss if material or that the loss cannot be reasonably estimated. Accounting for claims and contingencies requires us to use our judgment. We consult with legal counsel on those issues related to litigation and seek input from other experts and advisors with respect to matters in the ordinary course of business. See Note 14 for a discussion of contingencies.
Accumulated Other Comprehensive Income (Loss)
Changes in accumulated other comprehensive income (loss) by component for the years ended December 31, 2014 and 2013 are summarized below:
(in thousands) | Unrealized Gain (Loss) on Available-for-Sale Investments, net of tax | Foreign Currency Translation Adjustments | Accumulated Other Comprehensive Income (Loss) | ||||||||
Balance at December 31, 2012 | $ | 16 | $ | (1,161 | ) | $ | (1,145 | ) | |||
Other comprehensive gain (loss) before reclassification | (4 | ) | 4,102 | 4,098 | |||||||
Amount reclassified from accumulated other comprehensive income (loss) | — | — | — | ||||||||
Net current period other comprehensive income (loss) | (4 | ) | 4,102 | 4,098 | |||||||
Balance at December 31, 2013 | 12 | 2,941 | 2,953 | ||||||||
Other comprehensive gain (loss) before reclassification | (57 | ) | (16,195 | ) | (16,252 | ) | |||||
Amount reclassified from accumulated other comprehensive income (loss) | — | — | — | ||||||||
Net current period other comprehensive income (loss) | (57 | ) | (16,195 | ) | (16,252 | ) | |||||
Balance at December 31, 2014 | $ | (45 | ) | $ | (13,254 | ) | $ | (13,299 | ) | ||
Revenue Recognition
We derive substantially all of our revenue from the licensing of our software products, the sale of annual maintenance agreements for these products and, to a lesser extent, our MSP and cloud subscription products. In accordance with current guidance, we recognize revenue for software, maintenance and subscriptions when persuasive evidence of an arrangement exists, delivery has occurred, the sales price is fixed or determinable and collectability is reasonably assured. Our return policy generally does not allow our customers to return software products.
We generally use a purchase order, an authorized credit card, an electronic or manually signed license agreement, or the receipt of a cash payment as evidence of an arrangement. We consider delivery to have occurred and recognize revenue when risk of loss transfers to the customer, reseller or distributor or the customer has access to their subscription which is generally upon electronic transfer of the license key or password that provides immediate availability of the product to the purchaser. We account for sales incentives to customers, resellers or distributors as a reduction of revenue at the time we recognize the revenue from the related product sale. We report revenue net of any sales tax collected.
We sell our software products through our direct sales force and through our distributors and other resellers. Our distributors and resellers do not carry inventory of our software and we generally require them to specify the end-user of the software at the time of the order. If the distributor or reseller does not provide end-user information, then we will generally not fulfill the order. Our distributors and resellers have no rights of return or exchange for software that they purchase from us and
F-13
payment for these purchases is due to us without regard to whether the distributors or resellers collect payment from their customers. Sales through resellers and distributors are typically evidenced by a reseller or distributor agreement, together with purchase orders or authorized credit cards on a transaction-by-transaction basis.
License Revenue. Under software revenue recognition guidance, we use the residual method to recognize revenue when a license agreement includes one or more elements to be delivered and vendor-specific objective evidence, or VSOE, of fair value for all undelivered elements exists. Because our software is generally sold with maintenance, we calculate the amount of revenue allocated to the software license by determining the fair value of the maintenance and subtracting it from the total invoice or contract amount. We establish VSOE of the fair value of maintenance services by the standard published list pricing for our maintenance renewals since we generally charge list prices for our maintenance renewals. If evidence of the fair value of one or more undelivered elements does not exist, all revenue is generally deferred and recognized when delivery of those elements occurs or when fair value can be established. When the undelivered element for which we do not have VSOE of fair value is support, revenue for the entire arrangement is recognized ratably over the support period.
Maintenance and Other Revenue. We derive maintenance revenue from fees for software maintenance services. We typically include one year of maintenance as part of the initial purchase price of each perpetual software offering and then sell renewals of this maintenance agreement. We generally recognize maintenance revenue ratably on a daily basis over the contract period. Customers with maintenance agreements are entitled to receive unspecified upgrades or enhancements to new versions of their software products on a when-and-if-available basis. Other revenue for the years ended December 31, 2014, 2013 and 2012 was not significant nor do we expect it to be significant in future periods.
Subscription Revenue. We primarily derive subscription revenue from fees received from customers for time-based license arrangements and software-as-a-service, or SaaS offerings. We generally invoice subscription agreements monthly in advance over the subscription period. Subscription revenue is recognized ratably over the subscription term when all revenue recognition criteria have been met.
Deferred Revenue
Deferred revenue primarily consists of billings or payments received in advance of revenue recognition from maintenance fees. We generally bill maintenance agreements annually in advance for services to be performed over a 12 month period. Customers have the option to purchase maintenance renewals for periods other than 12 months. We initially record the amounts to be paid under maintenance agreements as deferred revenue and recognize these amounts ratably on a daily basis over the term of the maintenance agreement. We record deferred revenue that will be recognized during the succeeding 12 month period as current deferred revenue and the remaining portion is recorded as long-term deferred revenue.
Cost of Revenue
Cost of License Revenue. Cost of license revenue consists primarily of amortization of acquired developed product technologies. Amortization of acquired developed product technologies included in cost of license revenue was as follows:
Year Ended December 31, | |||||||||||
(in thousands) | 2014 | 2013 | 2012 | ||||||||
Acquired developed product technologies | $ | 15,971 | $ | 10,957 | $ | 7,300 | |||||
Cost of Maintenance and Other Revenue. Cost of maintenance and other revenue consists of technical support personnel costs which includes salaries, bonuses and stock-based compensation and related employer-paid payroll taxes, as well as an allocation of our facilities, information technology, employee benefit and other overhead costs.
Cost of Subscription Revenue. Cost of subscription revenue consists primarily of technical support personnel costs, amortization of acquired developed product technologies and royalty and hosting and server fees related to our subscription products.
F-14
Advertising
We expense advertising costs as incurred. Advertising expense is included in sales and marketing expenses in our consolidated statements of income.
Year Ended December 31, | |||||||||||
(in thousands) | 2014 | 2013 | 2012 | ||||||||
Advertising expense | $ | 9,960 | $ | 4,177 | $ | 3,360 | |||||
Leases
We lease facilities worldwide and certain equipment under non-cancellable lease agreements. The terms of some of our lease agreements provide for rental payments on a graduated basis. We recognize rent expense on a straight-line basis over the lease period and accrue rent expense incurred but not paid. Cash or lease incentives, or tenant allowances, received pursuant to certain leases are recognized on a straight-line basis as a reduction to rent over the lease term. The unamortized portion of tenant allowances is included in accrued liabilities and other and other long-term liabilities.
Income Taxes
We use the liability method of accounting for income taxes as set forth in the authoritative guidance for accounting for income taxes. Under this method, we recognize deferred tax liabilities and assets for the expected future tax consequences of temporary differences between the respective carrying amounts and tax basis of our assets and liabilities.
The guidance on accounting for uncertainty in income taxes prescribes a recognition threshold and measurement attribute for financial statement disclosure of tax positions taken or expected to be taken on a tax return. We accrue interest and penalties related to unrecognized tax benefits as a component of income tax expense. At December 31, 2014 and 2013, we had accrued interest and penalties related to unrecognized tax benefits of approximately $1.2 million and $0.6 million, respectively.
We establish valuation allowances when necessary to reduce deferred tax assets to the amounts expected to be realized. On a quarterly basis, we evaluate the need for, and the adequacy of, valuation allowances based on the expected realization of our deferred tax assets. The factors used to assess the likelihood of realization include our latest forecast of future taxable income and available tax planning strategies that could be implemented to realize the net deferred tax assets.
We intend either to invest our non-U.S. earnings permanently in foreign operations or to remit these earnings to our U.S. entities in a tax-free manner. For this reason, we do not record federal income taxes on the undistributed earnings of our foreign subsidiaries.
Stock-Based Compensation
We have granted our employees and directors stock-based incentive awards. These awards are in the form of stock options and restricted stock units. We measure stock-based compensation expense for all share-based awards granted based on the estimated fair value of those awards on the date of grant. The fair values of stock option awards are estimated using a Black-Scholes valuation model. The fair value of restricted stock unit awards is determined using the fair market value of our common stock based on the quoted market price on the date of grant, or intrinsic value.
We estimated the fair value for options at the date of grant using the Black-Scholes option pricing model with the following weighted-average assumptions:
Year Ended December 31, | ||||||||
2014 | 2013 | 2012 | ||||||
Expected dividend yield | — | % | — | % | — | % | ||
Volatility | 46.4 | % | 48.2 | % | 54.2 | % | ||
Risk-free rate of return | 1.6-2.2% | 0.9-2.3% | 0.8-1.4% | |||||
Expected life | 6.04 years | 6.11 years | 6.14 years | |||||
We have not paid and do not anticipate paying cash dividends on our common stock; therefore, we assume the expected dividend yield to be zero. We estimate the expected volatility using a weighted average of the historical volatility of our
F-15
common stock and historical volatility of comparable public companies from a representative industry peer group. We based the risk-free rate of return on the average U.S. treasury yield curve for five- and seven-year terms for the years ended December 31, 2014, 2013 and 2012. As allowed under current guidance, we have elected to apply the “simplified method” in developing our estimate of expected life for “plain vanilla” stock options by using the midpoint between the vesting date and contractual termination date since we do not have sufficient historical exercise data to provide a reasonable basis upon which to estimate expected term due to the limited period of time our common stock has been publicly traded. For all dates, we granted employees options at exercise prices equal to the fair value of the underlying common stock on the date of grant, which is the closing price of our common stock as reported by the NYSE.
The reduction in income before income taxes due to stock-based compensation expense and the related income tax benefits were as follows:
Year Ended December 31, | |||||||||||
(in thousands) | 2014 | 2013 | 2012 | ||||||||
Reduction in income before income taxes due to stock-based compensation | $ | 38,980 | $ | 22,649 | $ | 15,264 | |||||
Income tax benefit related to stock-based compensation | 9,835 | 6,016 | 4,197 | ||||||||
An excess tax benefit arises when the tax deduction related to a stock-based award is greater than the award’s original grant date fair value pursuant to the authoritative guidance. For financial reporting purposes, this excess tax benefit is not recorded as a tax benefit in our consolidated statements of income and is instead treated as additional paid-in capital in our consolidated balance sheets.
Tax benefits and excess tax benefits from the exercise of stock-based awards were as follows:
Year Ended December 31, | |||||||||||
(in thousands) | 2014 | 2013 | 2012 | ||||||||
Tax benefit from the exercise of stock-based awards | $ | 12,848 | $ | 14,718 | $ | 12,051 | |||||
Excess tax benefit from the exercise of stock-based awards | 7,801 | 9,057 | 10,486 | ||||||||
These excess tax benefits are a reduction to our cash payments related to income taxes and must be reported as cash flows from financing activities in our consolidated statements of cash flows.
Earnings Per Share
We computed basic earnings per share available to common stockholders by dividing net income available to common stockholders by the weighted average number of common shares outstanding during the reporting period. We computed diluted earnings per share similarly to basic earnings per share except that it reflects the potential dilution that could occur if dilutive securities or other obligations to issue common stock were exercised or converted into common stock.
Concentrations of Risks
Financial instruments that potentially subject us to concentrations of credit risk consist principally of cash and cash equivalents, short-term and long-term investments and accounts receivable. We consider all highly liquid investments with original maturities of three months or less to be cash equivalents. Our cash and cash equivalents consisted of the following:
December 31, | |||||||
(in thousands) | 2014 | 2013 | |||||
Demand deposit accounts | $ | 169,387 | $ | 128,630 | |||
Money market funds | 68,555 | 37,343 | |||||
Total cash and cash equivalents | $ | 237,942 | $ | 165,973 | |||
Our cash deposited with banks in demand deposit accounts may exceed the amount of insurance provided on these deposits. Our cash equivalents invested in money market funds are not insured and we are therefore at risk of losing our full
F-16
investment. Generally, we may withdraw our cash deposits and redeem our invested cash equivalents upon demand. We strive to maintain our cash deposits and invest in money market funds with multiple financial institutions of reputable credit and therefore bear minimal credit risk.
We provide credit to distributors, resellers and direct customers in the normal course of business. We generally extend credit to new customers based upon industry reputation and existing customers based upon prior payment history. The following distributor represented more than 10% of our revenue:
Year Ended December 31, | ||||||
2014 | 2013 | 2012 | ||||
Distributor A | * % | * % | 10.2 | % | ||
* Represented less than 10% of our revenue
Consolidated revenue ultimately attributable to the U.S. federal government, including its departments and agencies, represented 10.9% of our total revenue for the fiscal year ended December 31, 2012. For the fiscal years ended December 31, 2014 and 2013, consolidated revenue ultimately attributable to the U.S. federal government represented less than 10% of our total revenue. Consolidated revenue ultimately attributable to the U.S. federal government includes sales that have gone through our distributors and resellers, as well as direct sales. 77.0% of our revenue attributable to the U.S. federal government and its departments and agencies in the fiscal year ended December 31, 2012 was made through Distributor A and is included in the table above.
At December 31, 2014 and 2013, no distributor, reseller or direct customer represented more than 10% of our outstanding accounts receivable balance. We do not believe that our business is substantially dependent on any distributor or that the loss of a distributor relationship would have a material adverse effect on our business.
2. Acquisitions
2014 Acquisition
Pingdom
In June 2014, we acquired Pingdom, a provider of website monitoring and performance management solutions, for closing cash consideration of approximately $67.0 million in cash, including $3.1 million of cash acquired. The acquisition increased our subscription product offerings and we believe will allow us to leverage the opportunity associated with web-based performance management for critical websites and web applications. The acquisition was financed with available cash and we incurred $1.1 million in acquisition related costs, which are included in general and administrative expense for the year ended December 31, 2014.
The consideration paid was allocated to the assets acquired and liabilities assumed based on their estimated fair values and resulted in the recognition of approximately $55.8 million of goodwill and $11.2 million of intangible assets. The weighted average amortization period for the intangible assets is 4.8 years. Goodwill is not deductible for tax purposes.
The amounts of revenue and net loss related to the Pingdom acquisition included in our consolidated financial statements from the effective date of the acquisition for the year ended December 31, 2014 are insignificant. We recognize revenue on the acquired products in accordance with our revenue recognition policy as described in Note 1. Pro forma information for the acquisition has not been provided because the impact of the historical financials on our revenue, net income and earnings per share is not material.
F-17
2013 Acquisitions
N-able
In May 2013, we acquired N-able, a provider of cloud-based remote monitoring and management and service automation software serving small and medium-sized businesses, or SMBs, through the MSP channel, for approximately $127.5 million in cash, including cash acquired. The acquisition increased our product offerings and we believe will allow us to leverage the opportunity associated with rapidly growing adoption of the cloud and SaaS-based services among SMBs by enhancing our remote monitoring and management offerings and adding MSP service automation to the broad range of management challenges that we address for the IT industry. The acquisition was financed with available cash and we incurred $1.0 million in acquisition related costs, which are included in general and administrative expense for the year ended December 31, 2013. The weighted average amortization period for the intangible assets was 6.0 years. Goodwill is not deductible for tax purposes.
Confio
In October 2013, we acquired Confio, a privately-held database performance management company, for approximately $103.0 million in cash. By acquiring Confio, we have added database performance management solutions to our product portfolio. The acquisition was financed with available cash and borrowings under our Credit Agreement. We incurred $0.2 million in acquisition related costs, which are included in general and administrative expense for the year ended December 31, 2013. The weighted average amortization period for the intangible assets was 5.0 years. Goodwill is not deductible for tax purposes.
We recognize revenue on the acquired products in accordance with our revenue recognition policy as described above in Note 1.
The following table summarizes the consideration paid and the amounts recognized for the assets acquired and liabilities assumed, including measurement period adjustments, for our 2013 acquisitions:
Total | N-able | Confio | |||||||||
Fair Value | Fair Value | Fair Value | |||||||||
(in thousands) | |||||||||||
Current assets, including cash acquired (1) | $ | 16,428 | $ | 11,577 | $ | 4,851 | |||||
Property and equipment | 733 | 535 | 198 | ||||||||
Deferred tax assets | 125 | 125 | — | ||||||||
Identifiable intangible assets | 68,740 | 30,080 | 38,660 | ||||||||
Goodwill | 157,017 | 94,261 | 62,756 | ||||||||
Current liabilities | (5,750 | ) | (3,486 | ) | (2,264 | ) | |||||
Deferred tax liabilities | (4,402 | ) | (3,804 | ) | (598 | ) | |||||
Deferred revenue | (2,402 | ) | (1,796 | ) | (606 | ) | |||||
Total consideration | $ | 230,489 | $ | 127,492 | $ | 102,997 | |||||
(1) Current assets includes cash acquired of $6.8 million and $0.4 million for N-able and Confio, respectively.
F-18
The following table summarizes the fair value of the acquired identifiable intangible assets and weighted-average useful lives for our 2013 acquisitions:
Total | N-able | Confio | |||||||||||
Fair Value | Fair Value | Fair Value | Useful Life | ||||||||||
(in thousands) | (in years) | ||||||||||||
Developed product technologies | $ | 39,720 | $ | 17,170 | $ | 22,550 | 5 | ||||||
Customer relationships | 25,200 | 9,330 | 15,870 | 6 | |||||||||
Customer backlog | 2,170 | 2,170 | — | 4 | |||||||||
Tradenames | 970 | 970 | — | 8 | |||||||||
Non-competition covenant | 680 | 440 | 240 | 6 | |||||||||
Total identifiable intangible assets | $ | 68,740 | $ | 30,080 | $ | 38,660 | |||||||
The following table presents our unaudited pro forma results of operations for the years ended December 31, 2013 and 2012 as if our 2013 acquisitions had occurred at the beginning of the earliest period presented, or January 1, 2012. The pro forma financial information illustrates the measurable effects of a particular transaction, while excluding effects that rely on highly judgmental estimates of how operating decisions may or may not have changed as a result of that transaction. Accordingly, we adjusted the pro forma results for quantifiable items such as the amortization of acquired intangible assets and the estimated income tax provision of the pro forma combined results. The acquisition pro forma results were not adjusted for post-acquisition operational decisions made by management such as changes in the product offerings, pricing and packaging of the products. We prepared the pro forma financial information for the combined entities for comparative purposes only, and it is not indicative of what actual results would have been if the acquisition had taken place on January 1, 2012, or of any future results.
Year ended December 31, | |||||||
2013 | 2012 | ||||||
(in thousands) | Pro Forma | ||||||
Revenue | $ | 360,259 | $ | 306,338 | |||
Net income | 83,202 | 74,745 | |||||
2012 Acquisitions
In January 2012, we acquired certain assets of EminentWare, Inc., or EminentWare, a provider of patch management software. We released SolarWinds Patch Manager, based on the products acquired from EminentWare, which added patch management capabilities to our systems and application management product portfolio.
In April 2012, we acquired certain assets of Rove Mobile, Inc., or Rove, a provider of mobile IT management software. We acquired the Mobile Admin product from Rove, which allows IT administrators to monitor and manage their corporate IT infrastructure from mobile devices.
In July 2012, we acquired the assets related to the Web Help Desk software product from MacsDesign, LLC, or MacsDesign, for approximately $20.0 million in cash. By acquiring these assets, we increased our product offerings to include IT help desk software that solves problems around IT-specific ticketing, change management and asset management.
In August 2012, we acquired Athena Security, Inc., or Athena, a provider of firewall analytics and management software. We released SolarWinds Firewall Security Manager, based on the acquired Athena technology, which allows IT administrators to address key issues in managing firewalls and router security management.
In December 2012, we acquired Rhino Software, Inc., or RhinoSoft, a provider of file transfer management software products. We released SolarWinds Serv-U Managed File Transfer Server and SolarWinds FTP Voyager, based on the acquired RhinoSoft technology, which are secure managed file transfer solutions that allows IT administrators to monitor the movement and transfers of sensitive company materials and business-critical information.
F-19
We recorded $48.0 million of goodwill for our 2012 acquisitions of which $27.4 million is deductible for tax purposes. The acquisitions were financed with available cash and we incurred $1.0 million in acquisition related costs for the year ended December 31, 2012. The weighted average amortization period for the intangible assets was 5.1 years.
The following table summarizes the consideration paid and the amounts recognized for the assets acquired and liabilities assumed for our 2012 acquisitions:
Fair Value | Useful Life | |||||
(in thousands) | (in years) | |||||
Intangible assets: | ||||||
Developed product technologies | $ | 19,112 | 5 | |||
Customer relationships | 4,264 | 5 | ||||
Non-competition covenant | 551 | 5 | ||||
In process research and development | 1,889 | — | ||||
Identifiable intangible assets | 25,816 | |||||
Goodwill | 48,040 | |||||
Deferred revenue | (2,498 | ) | ||||
Net other liabilities | (3,056 | ) | ||||
Total purchase price, net of cash acquired | $ | 68,302 | ||||
3. Goodwill and Intangible Assets
Goodwill
The following table reflects the changes in goodwill for the years ended December 31, 2014 and 2013:
(in thousands) | |||
Balance at December 31, 2012 | $ | 158,601 | |
Acquisitions | 157,360 | ||
Foreign currency translation and other adjustments | 1,093 | ||
Balance at December 31, 2013 | 317,054 | ||
Acquisitions | 55,768 | ||
Foreign currency translation and other adjustments | (9,237 | ) | |
Balance at December 31, 2014 | $ | 363,585 | |
The goodwill from acquisitions resulted primarily from our expectations that we will now be able to offer our customers additional products in new markets. Additionally, we expect the acquisitions will attract new customers for our entire line of products.
F-20
Intangible Assets
Intangible assets consisted of the following at December 31, 2014 and 2013:
December 31, 2014 | December 31, 2013 | ||||||||||||||||||||||
(in thousands) | Gross Carrying Amount | Accumulated Amortization | Net | Gross Carrying Amount | Accumulated Amortization | Net | |||||||||||||||||
Developed product technologies | $ | 107,094 | $ | (44,318 | ) | $ | 62,776 | $ | 101,165 | $ | (24,910 | ) | $ | 76,255 | |||||||||
Customer relationships | 48,600 | (23,073 | ) | 25,527 | 46,972 | (14,902 | ) | 32,070 | |||||||||||||||
Intellectual property | 1,493 | (693 | ) | 800 | 1,373 | (549 | ) | 824 | |||||||||||||||
Trademarks | 4,605 | (2,033 | ) | 2,572 | 4,689 | (1,466 | ) | 3,223 | |||||||||||||||
Non-competition covenant | 3,154 | (1,847 | ) | 1,307 | 3,053 | (1,163 | ) | 1,890 | |||||||||||||||
Customer backlog | 2,170 | (2,106 | ) | 64 | 2,170 | (1,384 | ) | 786 | |||||||||||||||
Total intangible assets | $ | 167,116 | $ | (74,070 | ) | $ | 93,046 | $ | 159,422 | $ | (44,374 | ) | $ | 115,048 | |||||||||
Intangible asset amortization expense was as follows:
Year Ended December 31, | |||||||||||
(in thousands) | 2014 | 2013 | 2012 | ||||||||
Intangible asset amortization expense | $ | 31,342 | $ | 21,938 | $ | 15,007 | |||||
As of December 31, 2014, we estimate aggregate intangible asset amortization expense to be as follows:
(in thousands) | |||
2015 | $ | 32,149 | |
2016 | 27,988 | ||
2017 | 19,644 | ||
2018 | 9,862 | ||
2019 | 1,446 | ||
The expected amortization expense is an estimate. Actual amounts of amortization expense may differ from estimated amounts due to additional intangible asset acquisitions, changes in foreign currency exchange rates, impairment of intangible assets, accelerated amortization of intangible assets and other events. We had $0.6 million of trademarks recorded with an indefinite life that are not amortized at December 31, 2014 and 2013.
F-21
4. Investments
Our cash equivalents as of December 31, 2014 and 2013 consisted of money market funds. Our short-term and long-term investments as of December 31, 2014 and 2013 consisted of available-for-sale securities, such as corporate bonds and municipal bonds. The following table summarizes our short-term and long-term available-for-sale securities as of December 31, 2014 and 2013:
December 31, 2014 | December 31, 2013 | ||||||||||||||||||||||||||||||
(in thousands) | Cost | Gross Unrealized Gains | Gross Unrealized Losses | Fair Value | Cost | Gross Unrealized Gains | Gross Unrealized Losses | Fair Value | |||||||||||||||||||||||
Short-term investments: | |||||||||||||||||||||||||||||||
Available-for-sale securities: | |||||||||||||||||||||||||||||||
Corporate bonds | $ | 12,382 | $ | 5 | $ | (3 | ) | $ | 12,384 | $ | 18,257 | $ | 21 | $ | — | $ | 18,278 | ||||||||||||||
Municipal bonds | — | — | — | — | 1,048 | 1 | — | 1,049 | |||||||||||||||||||||||
Total short-term investments | $ | 12,382 | $ | 5 | $ | (3 | ) | $ | 12,384 | $ | 19,305 | $ | 22 | $ | — | $ | 19,327 | ||||||||||||||
Long-term investments: | |||||||||||||||||||||||||||||||
Available-for-sale securities: | |||||||||||||||||||||||||||||||
Corporate bonds | $ | 17,494 | $ | — | $ | (71 | ) | $ | 17,423 | $ | 11,015 | $ | 8 | $ | (11 | ) | $ | 11,012 | |||||||||||||
Total long-term investments | $ | 17,494 | $ | — | $ | (71 | ) | $ | 17,423 | $ | 11,015 | $ | 8 | $ | (11 | ) | $ | 11,012 | |||||||||||||
The following table summarizes the fair value of our available-for-sale securities with unrealized losses aggregated by type of investment instrument and length of time those securities have been in a continuous unrealized loss position:
Less Than 12 Months | 12 Months or Greater | Total | |||||||||||||||||||||
(in thousands) | Fair Value | Gross Unrealized Losses | Fair Value | Gross Unrealized Losses | Fair Value | Gross Unrealized Losses | |||||||||||||||||
As of December 31, 2014 | |||||||||||||||||||||||
Corporate bonds | $ | 22,021 | $ | (75 | ) | $ | — | $ | — | $ | 22,021 | $ | (75 | ) | |||||||||
$ | 22,021 | $ | (75 | ) | $ | — | $ | — | $ | 22,021 | $ | (75 | ) | ||||||||||
Less Than 12 Months | 12 Months or Greater | Total | |||||||||||||||||||||
(in thousands) | Fair Value | Gross Unrealized Losses | Fair Value | Gross Unrealized Losses | Fair Value | Gross Unrealized Losses | |||||||||||||||||
As of December 31, 2013 | |||||||||||||||||||||||
Corporate bonds | $ | 6,104 | $ | (11 | ) | $ | — | $ | — | $ | 6,104 | $ | (11 | ) | |||||||||
$ | 6,104 | $ | (11 | ) | $ | — | $ | — | $ | 6,104 | $ | (11 | ) | ||||||||||
F-22
The following table summarizes the contractual underlying maturities of our available-for-sale securities as of December 31, 2014:
(in thousands) | Cost | Fair Value | |||||
Due in one year or less | $ | 12,382 | $ | 12,384 | |||
Due after one year through five years | 17,494 | 17,423 | |||||
$ | 29,876 | $ | 29,807 | ||||
5. Fair Value Measurements
The following table summarizes the fair value of our financial assets that were measured on a recurring basis as of December 31, 2014 and 2013. We did not have any financial liabilities as of December 31, 2014 and 2013.
Fair Value Measurements at | Fair Value Measurements at | ||||||||||||||||||||||||||||||
December 31, 2014 Using | December 31, 2013 Using | ||||||||||||||||||||||||||||||
(in thousands) | Quoted Prices in Active Markets for Identical Assets (Level 1) | Significant Other Observable Inputs (Level 2) | Significant Unobservable Inputs (Level 3) | Total | Quoted Prices in Active Markets for Identical Assets (Level 1) | Significant Other Observable Inputs (Level 2) | Significant Unobservable Inputs (Level 3) | Total | |||||||||||||||||||||||
Assets: | |||||||||||||||||||||||||||||||
Cash equivalents: | |||||||||||||||||||||||||||||||
Money market funds | $ | 68,555 | $ | — | $ | — | $ | 68,555 | $ | 37,343 | $ | — | $ | — | $ | 37,343 | |||||||||||||||
Total cash equivalents | 68,555 | — | — | 68,555 | 37,343 | — | — | 37,343 | |||||||||||||||||||||||
Short-term investments: | |||||||||||||||||||||||||||||||
Corporate bonds | — | 12,384 | — | 12,384 | — | 18,278 | — | 18,278 | |||||||||||||||||||||||
Municipal bonds | — | — | — | — | — | 1,049 | — | 1,049 | |||||||||||||||||||||||
Total short-term investments | — | 12,384 | — | 12,384 | — | 19,327 | — | 19,327 | |||||||||||||||||||||||
Long-term investments: | |||||||||||||||||||||||||||||||
Corporate bonds | — | 17,423 | — | 17,423 | — | 11,012 | — | 11,012 | |||||||||||||||||||||||
Total long-term investments | — | 17,423 | — | 17,423 | — | 11,012 | — | 11,012 | |||||||||||||||||||||||
Total assets | $ | 68,555 | $ | 29,807 | $ | — | $ | 98,362 | $ | 37,343 | $ | 30,339 | $ | — | $ | 67,682 | |||||||||||||||
There have been no transfers between fair value measurement levels during the years ended December 31, 2014 and 2013.
F-23
6. Property and Equipment
Property and equipment, including software, consisted of the following at December 31, 2014 and 2013:
December 31, | |||||||
(in thousands) | 2014 | 2013 | |||||
Equipment and other | $ | 12,836 | $ | 9,965 | |||
Furniture and fixtures | 5,749 | 3,946 | |||||
Software | 2,146 | 1,061 | |||||
Leasehold improvements | 13,589 | 4,319 | |||||
$ | 34,320 | $ | 19,291 | ||||
Less: Accumulated depreciation and amortization | (10,706 | ) | (10,078 | ) | |||
Property and equipment, net | $ | 23,614 | $ | 9,213 | |||
The increase in leasehold improvements for the year ended December 31, 2014 is primarily due to the leasehold improvements associated with our new corporate headquarters in Austin, Texas. See Note 14 for a further discussion of the corporate headquarter lease.
Depreciation and amortization expense on property and equipment for the years ended December 31, 2014, 2013 and 2012 was as follows:
Year Ended December 31, | |||||||||||
(in thousands) | 2014 | 2013 | 2012 | ||||||||
Depreciation and amortization expense | $ | 4,952 | $ | 4,626 | $ | 2,985 | |||||
7. Accrued Liabilities and Other
Accrued liabilities and other current liabilities at December 31, 2014 and 2013 were as follows:
December 31, | |||||||
(in thousands) | 2014 | 2013 | |||||
Payroll-related accruals | $ | 23,393 | $ | 12,307 | |||
Other accrued expenses and current liabilities | 11,883 | 5,409 | |||||
Total accrued liabilities and other | $ | 35,276 | $ | 17,716 | |||
8. Credit Agreement
On October 4, 2013, we entered into a Credit Agreement with a syndicated group of lenders that provides for an unsecured $125.0 million five-year revolving credit facility that is comprised of revolving loans and swingline loans. The credit facility includes a $30.0 million letter of credit sub-facility and a $15.0 million swingline sub-facility available on same-day notice. Available borrowings under the credit facility are reduced by the amount of any outstanding borrowings on the sub-facilities. We may also, subject to certain requirements, request an increase in the facility up to an additional $75.0 million for a maximum aggregate commitment of $200.0 million. The proceeds from the facility may be used for general corporate purposes, including, without limitation, to finance acquisitions.
Loans under the credit agreement will bear interest at either (i) the one-, three-, or six-month per annum London Interbank Offered Rate ("LIBOR"), multiplied by the statutory reserve adjustment plus a margin, based on our consolidated total leverage ratio, ranging from 1.25% and 2.00% or (ii) the base rate, which is defined as the highest of (a) the agent's prime rate, (b) the
F-24
federal funds rate plus 0.50% or (c) LIBOR for a period of one month plus 1.00% plus a margin, based on our consolidated total leverage ratio, ranging from 0.25% to 1.00%. Commitment fees are payable quarterly in arrears at rates between 0.20% and 0.35% per year also based on our consolidated total leverage ratio. Subject to certain conditions stated in the Credit Agreement, we may borrow, prepay and re-borrow amounts under the revolving credit facility at any time during the term of the Credit Agreement.
Our obligations under the Credit Agreement are guaranteed by SolarWinds Worldwide and our future domestic subsidiaries, subject to certain exceptions, pursuant to the guaranty agreement, dated as of October 4, 2013, by SolarWinds Worldwide in favor of and for the benefit of the lenders.
The Credit Agreement contains customary affirmative and negative covenants, including covenants that limit or restrict our ability to, among other things, incur indebtedness, grant liens, make investments, merge or consolidate, dispose of assets, pay dividends or make distributions, make acquisitions and enter into certain transactions with affiliates, in each case subject to customary exceptions for a credit facility of this size and type. We are also required to maintain compliance with a consolidated total leverage ratio and a consolidated interest coverage ratio.
On October 4, 2013, we borrowed $40.0 million at an interest rate of approximately 1.4% under a revolving loan under the Credit Agreement that was used to finance a portion of the consideration paid upon the acquisition of Confio. In August 2014, we repaid the $40.0 million of outstanding borrowings under a revolving loan under the Credit Agreement. As of December 31, 2014, no amounts were outstanding under the Credit Agreement and we were in compliance with all covenants associated with the Credit Agreement.
9. Stockholders’ Equity and Stock-Based Compensation
Common Stock and Preferred Stock
As set by our certificate of incorporation, the Company has authorized capital stock of 133,000,000 shares with a par value of $0.001 per share, comprised of 123,000,000 shares of common stock and 10,000,000 shares of preferred stock.
2005 Stock Plan
Our Amended and Restated Stock Incentive Plan, or 2005 Stock Plan, was adopted by our board of directors and approved by our stockholders on December 14, 2005. Our 2005 Stock Plan provides for the grant of incentive stock options, nonstatutory stock options and restricted stock to our employees, directors and consultants. Our ability to grant any future equity awards under the 2005 Stock Plan was terminated in May 2009 following the consummation of our IPO. As of December 31, 2014, options to purchase 259,251 shares of common stock were outstanding under the 2005 Stock Plan. Our 2005 Stock Plan will continue to govern the terms and conditions of the outstanding equity awards granted under the 2005 Stock Plan.
The standard form of option agreement under the 2005 Stock Plan provides that options will vest over 4 years with 25% of the options vesting on the first anniversary of the vesting commencement date and the remainder vesting ratably on a monthly basis over the remaining period, subject to continued service through each applicable date and have a ten year contractual term. Under our 2005 Stock Plan, our board of directors, or its designated committee, has the authority to grant options with early exercise rights, subject to our repurchase right that lapses as the shares vest on the original vesting schedule, and to provide for accelerated vesting.
Our 2005 Stock Plan provides that our board of directors, or its designated committee, shall equitably and proportionally adjust or substitute outstanding options upon certain events, including, without limitation, changes in our capitalization through stock splits, recapitalizations, mergers or consolidations. In lieu of an adjustment, our board of directors, or its designated committee, may terminate and cancel outstanding options in exchange for a cash payment or other consideration to the optionholder upon certain corporate events, including a change of control. The payment must equal the amount paid per share in connection with the event less the applicable exercise price per share for each canceled option subject to exercise.
2008 Stock Plan
Our board of directors adopted and our stockholders approved our 2008 Equity Incentive Plan, or 2008 Stock Plan, in May 2008. Our 2008 Stock Plan provides for the grant of incentive stock options, within the meaning of Section 422 of the Internal Revenue Code of 1986, as amended, or the Code, to our employees and any parent and subsidiary corporations’ employees, and for the grant of nonstatutory stock options, restricted stock, restricted stock units, stock appreciation rights, performance shares and performance units to our employees, directors and consultants and our parent and subsidiary corporations’ employees and consultants. All equity awards that have been granted following our IPO were granted under our
F-25
2008 Stock Plan. As of December 31, 2014, stock-based incentive awards of 4,768,885 were outstanding and 12,199,186 shares of common stock were reserved for future grants under the 2008 Stock Plan.
The exercise price of an option granted under our 2008 Stock Plan must be at least equal to the fair market value of our common stock on the date of grant unless granted pursuant to a transaction described in, and in a manner consistent with, Section 424(a) of the Code. Options and restricted stock units granted under our 2008 Stock Plan generally vest over three to four years with the first tranche of the options vesting on the first anniversary of the vesting commencement date and the remainder vesting ratably on a monthly basis over the remaining period, subject to continued service through each applicable date. The term of an incentive stock option granted under our 2008 Stock Plan may not exceed ten years, except that, with respect to any participant who owns 10% or more of the voting power of all classes of our outstanding stock as of the grant date, the term must not exceed five years and the exercise price must equal at least 110% of the fair market value on the grant date unless granted pursuant to a transaction described in, and in a manner consistent with, Section 424(a) of the Code.
Option grant activity under the 2005 and 2008 Stock Plans were as follows:
Number of Shares Outstanding | Weighted- Average Exercise Price | Aggregate Intrinsic Value (in thousands) | Weighted- Average Remaining Contractual Term (in years) | |||||||||
Outstanding balances at December 31, 2013 | 2,805,632 | $ | 27.30 | |||||||||
Options granted | 813,107 | 41.65 | ||||||||||
Options exercised | (729,440 | ) | 14.67 | |||||||||
Options forfeited | (132,810 | ) | 44.24 | |||||||||
Outstanding balances at December 31, 2014 | 2,756,489 | $ | 34.06 | |||||||||
Options exercisable at December 31, 2014 | 1,191,672 | $ | 26.55 | $ | 28,288 | 6.13 | ||||||
Options vested and expected to vest at December 31, 2014 | 2,705,796 | $ | 33.95 | $ | 44,128 | 7.53 | ||||||
Additional information regarding options follows (in thousands except for per share amounts):
Year Ended December 31, | |||||||||||
2014 | 2013 | 2012 | |||||||||
Weighted-average grant date fair value per share of options granted during the period | $ | 19.32 | $ | 20.24 | $ | 17.63 | |||||
Aggregate intrinsic value of options exercised during the period | 22,189 | 33,305 | 38,952 | ||||||||
Aggregate fair value of options vested during the period | 8,442 | 9,733 | 8,506 | ||||||||
The total unrecognized stock-based compensation expense related to unvested stock options and subject to recognition in future periods was $24.3 million as of December 31, 2014 and we expect to recognize this expense over a weighted-average period of 2.76 years.
F-26
Restricted Stock Units
The following table summarizes restricted stock unit activity under the 2008 Stock Plan:
Number of Units Outstanding | Weighted- Average Grant Date Fair Value Per Share | Aggregate Intrinsic Value (in thousands) | Weighted- Average Remaining Contractual Term (in years) | |||||||||
Unvested balances at December 31, 2013 | 1,765,111 | $ | 37.31 | |||||||||
Restricted stock units granted | 1,316,630 | 41.77 | ||||||||||
Restricted stock units vested | (528,941 | ) | 35.15 | |||||||||
Restricted stock units forfeited | (281,153 | ) | 38.55 | |||||||||
Unvested balances at December 31, 2014 | 2,271,647 | $ | 40.25 | $ | 113,196 | 8.64 | ||||||
The aggregate fair value of restricted stock units vested during the years ended December 31, 2014, 2013, and 2012 was $18.6 million, $7.8 million and $3.4 million respectively. The total unrecognized stock-based compensation expense related to unvested restricted stock units and subject to recognition in future periods was $62.7 million as of December 31, 2014 and we expect to recognize this expense over a weighted-average period of 2.85 years.
For restricted stock units granted, the number of shares issued on the date the restricted stock units vest is generally net of the minimum statutory withholding requirements that we pay in cash to the appropriate taxing authorities on behalf of our employees. We withheld and retired approximately 156,000, 86,000 and 45,000 shares to satisfy $6.4 million, $4.7 million and $1.5 million of employees’ tax obligations during 2014, 2013 and 2012, respectively. These shares are treated as common stock repurchases in our consolidated financial statements as of December 31, 2014, 2013 and 2012.
10. Earnings Per Share
We computed basic earnings per share using the weighted-average number of our common shares outstanding during the reporting period. We adjusted diluted earnings per share for the after-tax impact of incremental shares that would be issued upon the assumed exercise of stock options and vesting of restricted stock units using the treasury stock method.
A reconciliation of the number of shares in the calculation of basic and diluted earnings per share follows:
Year Ended December 31, | |||||||||||
(in thousands) | 2014 | 2013 | 2012 | ||||||||
Basic earnings per share | |||||||||||
Numerator: | |||||||||||
Net income | $ | 78,113 | $ | 89,778 | $ | 81,343 | |||||
Denominator: | |||||||||||
Weighted-average common shares outstanding used in computing basic earnings per share | 75,476 | 75,182 | 74,166 | ||||||||
Diluted earnings per share | |||||||||||
Numerator: | |||||||||||
Net income | $ | 78,113 | $ | 89,778 | $ | 81,343 | |||||
Denominator: | |||||||||||
Weighted-average shares used in computing basic earnings per share | 75,476 | 75,182 | 74,166 | ||||||||
Add options and restricted stock units to purchase common stock | 986 | 1,293 | 1,869 | ||||||||
Weighted-average shares used in computing diluted earnings per share | 76,462 | 76,475 | 76,035 | ||||||||
Dilution from assumed exercises of stock options and vesting of restricted stock units is dependent upon several factors, including the market price of our common stock. The following stock-based incentive awards were outstanding but were not
F-27
included in the computation of diluted earnings per share because the average market price of the underlying stock did not exceed the sum of the exercise price, unrecognized compensation expense and the excess tax benefit and thus the results would have been antidilutive:
Year Ended December 31, | ||||||||
(in thousands) | 2014 | 2013 | 2012 | |||||
Antidilutive shares | 1,727 | 1,441 | 305 | |||||
The calculation of diluted earnings per share requires us to make certain assumptions related to the use of proceeds that would be received upon the assumed exercise of stock options and vesting of restricted stock units. These assumed proceeds include the excess tax benefit that we receive upon assumed exercises of stock options and vesting of restricted stock units.
On July 29, 2013, we announced that our board of directors approved a share repurchase program, authorizing us to purchase up to $50.0 million of our outstanding common stock. Our share repurchase program expired on July 31, 2014. Purchases under our share repurchase program were made in the open market pursuant to a Rule 10b5-1 plan. During the years ended December 31, 2014 and 2013, we repurchased 0.2 million and 0.9 million shares of our common stock for an aggregate purchase price of $7.5 million and $32.6 million, respectively. Shares were retired upon repurchase.
11. Employee Benefit Plan
In October 2008, we established a 401(k) matching program for all eligible employees. We match an amount equal to 100% of the employee’s contributions for the first 3%, and 50% for the next 2% of the employee’s total eligible compensation. The total contributions per participant per year were limited to $17,500 for 2014 and 2013 and $17,000 for 2012. We, as sponsor of the plan, use an independent third party to provide administrative services to the plan. We have the right to terminate the plan at any time. Employees are fully vested in all contributions to the plan. Our expense related to the plan was as follows:
Year Ended December 31, | |||||||||||
(in thousands) | 2014 | 2013 | 2012 | ||||||||
Employee benefit plan expense | $ | 2,509 | $ | 1,910 | $ | 1,637 | |||||
12. Related Party Transactions
On August 31, 2006, we entered into a license agreement with NetSuite Inc. Our President and Chief Executive Officer became a member of NetSuite’s Board of Directors in September 2006. Under the terms of the agreement, we paid the following amounts for the use of their services:
Year Ended December 31, | |||||||||||
(in thousands) | 2014 | 2013 | 2012 | ||||||||
NetSuite expense | $ | 722 | $ | 755 | $ | 639 | |||||
In September 2013, we entered into a stock purchase agreement with AppNeta, Inc., or AppNeta, a privately-held application performance management software company, in which we invested approximately $8.0 million in convertible preferred stock. J. Benjamin Nye, a member of our Board of Directors, currently serves on the Board of Directors of AppNeta and is a Managing Director for Bain Capital Venture Partners, LLC, which also has an ownership interest in AppNeta. Our investment is carried at cost as we have a non-controlling interest, the investment is not in substance common stock and we do not have significant influence over the operating and financial activities of AppNeta. During the year ended December 31, 2014, there were no indicators of impairment or change of circumstance that had a significant impact on the fair value of the investment. The investment is recorded in intangible assets and other, net in our consolidated balance sheets.
F-28
13. Income Taxes
U.S. and international components of income before income taxes were as follows:
Year Ended December 31, | |||||||||||
(in thousands) | 2014 | 2013 | 2012 | ||||||||
U.S. | $ | 66,871 | $ | 86,805 | $ | 83,188 | |||||
International | 35,725 | 34,698 | 31,331 | ||||||||
Income before income taxes | $ | 102,596 | $ | 121,503 | $ | 114,519 | |||||
Income tax expense was composed of the following:
Year Ended December 31, | |||||||||||
(in thousands) | 2014 | 2013 | 2012 | ||||||||
Current: | |||||||||||
Federal | $ | 25,549 | $ | 33,416 | $ | 32,300 | |||||
State | 1,560 | 896 | 927 | ||||||||
International | 2,256 | 1,127 | 937 | ||||||||
29,365 | 35,439 | 34,164 | |||||||||
Deferred: | |||||||||||
Federal | (3,225 | ) | (1,624 | ) | (489 | ) | |||||
State | (31 | ) | (268 | ) | (20 | ) | |||||
International | (1,626 | ) | (1,822 | ) | (479 | ) | |||||
(4,882 | ) | (3,714 | ) | (988 | ) | ||||||
$ | 24,483 | $ | 31,725 | $ | 33,176 | ||||||
The difference between the income tax expense derived by applying the federal statutory income tax rate to our income before income taxes and the amount recognized in our consolidated financial statements is as follows:
Year Ended December 31, | |||||||||||
(in thousands) | 2014 | 2013 | 2012 | ||||||||
Expense derived by applying the federal statutory income tax rate to income before income taxes | $ | 35,909 | $ | 42,526 | $ | 40,081 | |||||
State taxes, net of federal benefit | 1,000 | 409 | 582 | ||||||||
Permanent items | 1,439 | 463 | (275 | ) | |||||||
Domestic production activities deduction | (1,793 | ) | (2,065 | ) | (1,609 | ) | |||||
Research and experimentation tax credits | (1,851 | ) | (2,810 | ) | — | ||||||
Stock-based compensation | 2,295 | 805 | 503 | ||||||||
Effect of foreign operations | (12,516 | ) | (7,603 | ) | (6,106 | ) | |||||
$ | 24,483 | $ | 31,725 | $ | 33,176 | ||||||
F-29
The components of the net deferred tax amounts recognized in the accompanying consolidated balance sheets were:
December 31, | |||||||
(in thousands) | 2014 | 2013 | |||||
Deferred tax assets: | |||||||
Allowance for doubtful accounts | $ | 156 | $ | 47 | |||
Accrued expenses | 5,938 | 1,455 | |||||
Stock-based compensation | 9,860 | 6,683 | |||||
Deferred revenue | 176 | 255 | |||||
Net operating loss | 12,889 | 18,704 | |||||
Property and equipment | — | 790 | |||||
Foreign royalty | 431 | 65 | |||||
Research and experimentation credits | 2,092 | 2,177 | |||||
Total deferred tax assets | 31,542 | 30,176 | |||||
Deferred tax liabilities: | |||||||
Property and equipment | 1,941 | — | |||||
Prepaid expenses | 1,399 | 961 | |||||
Intangibles | 24,341 | 28,325 | |||||
Total deferred tax liabilities | 27,681 | 29,286 | |||||
Net deferred tax asset | $ | 3,861 | $ | 890 | |||
At December 31, 2014 and 2013, we had net operating loss carry forwards for U.S. federal income tax purposes of approximately $29.1 million and $42.4 million, respectively, which are limited due to IRC Section 382 limitations. These U.S. federal net operating losses are available to offset future U.S. federal taxable income, and begin to expire at various dates from 2026 through 2033.
At December 31, 2014 and 2013, we had net operating loss carry forwards for certain U.S. state income tax purposes of approximately $28.1 million and $27.1 million, respectively, which are limited due to IRC Section 382. These U.S. state net operating losses are available to offset future U.S. state taxable income, and begin to expire in 2033.
At December 31, 2014 and 2013, we had foreign net operating loss carry forwards, excluding Canada, of approximately $1.1 million and $2.5 million, respectively, which are available to offset future foreign taxable income, and do not expire. Of these loss carry forwards, $0.4 million were generated from the excess tax benefit related to the exercise of stock options and therefore no current benefit has been recorded in the financial statements as of December 31, 2014. The recording of the excess tax benefit of approximately $0.1 million will be deferred, and will be recorded as a reduction in foreign income taxes payable, and an increase to stockholder’s equity, after the net operating losses have been utilized.
At December 31, 2014 and 2013, we had Canadian net operating loss carry forwards of approximately $1.9 million and $4.9 million, respectively, which are available to offset future Canadian taxable income, and begin to expire in 2029.
At December 31, 2014 and 2013, we had deductible scientific research and experimental development expenditure carry forwards of approximately $4.5 million and $6.7 million, respectively, which are available to offset future Canadian taxable income and do not expire.
At December 31, 2014 and 2013, we had Canadian scientific research and experimental development tax credit carry forwards of approximately $0.3 million and $0.2 million, respectively, which are available to offset future Canadian income tax, and begin to expire in 2026.
At December 31, 2014 and 2013, we had research and experimentation tax credit carry forwards of approximately $1.4 million and $1.8 million, respectively, which are available to offset future U.S. federal income tax. These U.S. federal tax credits begin to expire in 2021.
The federal research and experimentation tax credit was extended through December 31, 2014 by the signing of the Tax Increase Prevention Act of 2014. The income tax benefit related to the 2014 research and experimentation tax credit is reflected in our results of operations for the year ended December 31, 2014. The tax credit was previously extended by the signing of the
F-30
American Taxpayer Relief Act of 2012, or the 2012 Act, on January 2, 2013. The 2012 Act retroactively extended this tax credit from January 1, 2012 through December 31, 2013. Since the 2012 Act was enacted during 2013, the income tax benefit related to the 2012 research and experimentation tax credit was reflected in our results of operations for the year ended December 31, 2013.
We received a corporate income tax holiday in the Philippines which will expire in 2017 unless extended to 2020. The income tax benefit attributable to this holiday is insignificant as of December 31, 2014.
We establish valuation allowances when necessary to reduce deferred tax assets to amounts expected to be realized. As of December 31, 2014 and 2013, we have not recorded a valuation allowance as it is more likely than not that the deferred tax assets will be realized.
We do not record federal income taxes on the undistributed earnings of our foreign subsidiaries that we consider to be permanently reinvested in foreign operations.
The cumulative amount of these undistributed earnings and the estimated amount of the unrecognized deferred tax liability associated with these undistributed earnings, which includes a benefit related to foreign tax credits generated by the repatriation of foreign earnings, would be approximately as follows:
December 31, | |||||||||||
(in thousands) | 2014 | 2013 | 2012 | ||||||||
Cumulative amount of these undistributed earnings | $ | 152,422 | $ | 107,255 | $ | 70,256 | |||||
Estimated amount of the unrecognized deferred tax liability associated with undistributed earnings | 50,624 | 34,683 | 23,838 | ||||||||
Gross unrecognized tax benefits, all of which, if recognized, would affect our effective tax rate were as follows:
December 31, | |||||||||||
(in thousands) | 2014 | 2013 | 2012 | ||||||||
Gross unrecognized tax benefits | $ | 15,264 | $ | 15,136 | $ | 8,776 | |||||
Our policy is to include interest and penalties related to unrecognized tax benefits as a component of income tax expense. At December 31, 2014 and 2013, we had accrued interest and penalties related to unrecognized tax benefits of approximately $1.2 million and $0.6 million, respectively.
The aggregate changes in the balance of our gross unrecognized tax benefits, excluding accrued interest, were as follows:
Year End December 31, | |||||||||||
(in thousands) | 2014 | 2013 | 2012 | ||||||||
Balance, beginning of year | $ | 15,136 | $ | 8,776 | $ | 3,992 | |||||
Increases for tax positions related to the current year | 984 | 5,681 | 4,890 | ||||||||
Increases for tax positions related to prior years | — | 679 | — | ||||||||
Decreases for tax positions related to prior years | (856 | ) | — | (106 | ) | ||||||
Reductions due to lapsed statute of limitations | — | — | — | ||||||||
Balance, end of year | $ | 15,264 | $ | 15,136 | $ | 8,776 | |||||
We do not believe that it is reasonably possible that our unrecognized tax benefits will significantly change in the next twelve months.
We file U.S., state and foreign income tax returns in jurisdictions with varying statutes of limitations. The 2008 through 2013 tax years generally remain open and subject to examination by federal authorities. The 2007 through 2013 tax years generally remain open and subject to examination by the state tax authorities. The 2010 through 2013 tax years generally remain open and subject to examination by foreign tax authorities. During 2014, the U.S. Internal Revenue Service, or IRS,
F-31
concluded its examination of the 2008, 2009 and 2010 tax years. As a result of the IRS examination closure, we recorded an insignificant impact to the income tax provision and income tax liability during the year ended December 31, 2014. We are also under audit by the Indian Taxing Authority for the 2012 tax year. We are not currently under audit in any other taxing jurisdictions.
14. Commitments and Contingencies
Leases
At December 31, 2014, future minimum lease payments under non-cancellable operating leases were as follows:
(in thousands) | |||
2015 | $ | 11,584 | |
2016 | 10,675 | ||
2017 | 7,874 | ||
2018 | 7,898 | ||
2019 | 8,085 | ||
Thereafter | 53,825 | ||
Total minimum lease payments | $ | 99,941 | |
Rent expense for the years ended December 31, 2014, 2013 and 2012 was as follows:
Year ended December 31, | |||||||||||
(in thousands) | 2014 | 2013 | 2012 | ||||||||
Rent expense | $ | 8,064 | $ | 5,298 | $ | 4,136 | |||||
In April 2014, we moved into our new corporate headquarters in Austin, Texas, which has an initial lease term of thirteen years. In connection with the lease, the property owner provided a tenant improvement allowance of $8.0 million for leasehold improvements. For the year ended December 31, 2014, we received lease incentives of $7.1 million relating to tenant improvement allowances for leasehold improvements. The lease incentive liability will be amortized on a straight-line basis over the term of the lease as an offset to rent expense.
In May 2014, we ceased using our former corporate headquarters and recognized a loss in the year ended December 31, 2014 for the estimated fair value of our remaining obligation of $6.8 million. The lease abandonment costs are recorded in the consolidated statements of income in general and administrative expenses.
Other Commitments
In connection with our acquisition of Pingdom, in the second quarter of fiscal year 2014, we began to incur, and will continue to incur, an additional €7.4 million of compensation expense contingent upon fulfillment of specified future employment conditions. The compensation expense is recognized as general and administrative expense ratably over the requisite service period of twelve months and is expected to be paid in the first half of fiscal year 2015.
Legal Proceedings
From time to time, we have been and may be involved in various legal proceedings arising in our ordinary course of business. In the opinion of management, there was not at least a reasonable possibility we may have incurred a material loss, or a material loss in excess of a recorded accrual, with respect to loss contingencies. However, the outcome of litigation is inherently uncertain. Therefore, although management considers the likelihood of such an outcome to be remote, if one or more of these legal matters were resolved against us in the same reporting period for amounts in excess of management’s expectations, our consolidated financial statements could be materially adversely affected.
F-32
Registration Rights
We entered into an agreement in 2005 providing certain of our stockholders with rights to have the offer and sale of their shares of our common stock registered under the Securities Act of 1933, if requested by a majority of the holders of the shares. As of December 31, 2014, these registration rights have not been exercised.
15. Operating Segment and Geographic Information
We operate as a single segment. Our chief operating decision-maker is considered to be our Chief Executive Officer. The chief operating decision-maker allocates resources and assesses performance of the business at the consolidated level.
The authoritative guidance for disclosures about segments of an enterprise establishes standards for reporting information about operating segments. It defines operating segments as components of an enterprise about which separate financial information is available that is evaluated regularly by the chief operating decision-maker in deciding how to allocate resources and in assessing performance. Our Chief Executive Officer reviews financial information including new license and subscription sales and maintenance renewals for purposes of allocating resources and evaluating financial performance. We have one business activity, and there are no segment managers who are held accountable for operating results or components below the consolidated unit level. Accordingly, we considered ourselves to be in a single operating and reporting segment structure.
We group our products into three categories including: network management, systems management and MSP and cloud. Our network management and systems management products are sold via a perpetual license while our MSP and cloud products are typically sold on a subscription basis. The following tables sets forth our revenue by product group:
Year Ended December 31, | |||||||||||
(in thousands) | 2014 | 2013 | 2012 | ||||||||
Revenue | |||||||||||
Network management | $ | 252,162 | $ | 222,480 | $ | 198,518 | |||||
Systems and application management | 134,763 | 97,094 | 70,446 | ||||||||
MSP and cloud | 41,789 | 15,811 | — | ||||||||
Total revenue | $ | 428,714 | $ | 335,385 | $ | 268,964 | |||||
We based revenue by geography on the billing address of each customer. The following table sets forth revenue and our net long-lived assets by geographic area:
Year Ended December 31, | |||||||||||
(in thousands) | 2014 | 2013 | 2012 | ||||||||
Revenue | |||||||||||
United States, country of domicile | $ | 286,982 | $ | 227,008 | $ | 187,922 | |||||
International | 141,732 | 108,377 | 81,042 | ||||||||
Total revenue | $ | 428,714 | $ | 335,385 | $ | 268,964 | |||||
December 31, | |||||||||||
(in thousands) | 2014 | 2013 | 2012 | ||||||||
Long-lived assets, net | |||||||||||
United States, country of domicile | $ | 84,269 | $ | 94,059 | $ | 62,045 | |||||
Canada | 21,528 | 26,982 | 17 | ||||||||
All other international | 21,310 | 13,972 | 16,911 | ||||||||
Total long-lived assets, net | $ | 127,107 | $ | 135,013 | $ | 78,973 | |||||
F-33
16. Quarterly Results of Operations
The following table sets forth our unaudited quarterly condensed consolidated statements of operations data for each of the eight quarters ended December 31, 2014. The data has been prepared on the same basis as the audited consolidated financial statements and related notes included in this Annual Report on Form 10-K and you should read the following tables in conjunction with such financial statements. The table includes all necessary adjustments, consisting only of normal recurring adjustments that we consider necessary for a fair presentation of this data. The results of historical periods are not necessarily indicative of future results.
December 31, 2014 | September 30, 2014 | June 30, 2014 | March 31, 2014 | December 31, 2013 | September 30, 2013 | June 30, 2013 | March 31, 2013 | ||||||||||||||||||||||||
(in thousands, except per share data-unaudited) | |||||||||||||||||||||||||||||||
Revenue | $ | 118,439 | $ | 112,862 | $ | 101,504 | $ | 95,909 | $ | 97,093 | $ | 87,863 | $ | 77,519 | $ | 72,910 | |||||||||||||||
Gross profit | 106,577 | 101,284 | 90,606 | 85,881 | 88,064 | 80,764 | 71,362 | 67,279 | |||||||||||||||||||||||
Income before income taxes | 30,732 | 31,892 | 18,086 | 21,886 | 29,189 | 31,946 | 31,084 | 29,284 | |||||||||||||||||||||||
Net income | 22,967 | 24,121 | 13,379 | 17,646 | 21,159 | 22,823 | 22,797 | 22,999 | |||||||||||||||||||||||
Basic earnings per share | $ | 0.30 | $ | 0.32 | $ | 0.18 | $ | 0.23 | $ | 0.28 | $ | 0.30 | $ | 0.30 | $ | 0.31 | |||||||||||||||
Diluted earnings per share | $ | 0.30 | $ | 0.32 | $ | 0.18 | $ | 0.23 | $ | 0.28 | $ | 0.30 | $ | 0.30 | $ | 0.30 | |||||||||||||||
Shares used in computation of basic earnings per share | 75,778 | 75,508 | 75,411 | 75,207 | 75,119 | 75,371 | 75,250 | 74,987 | |||||||||||||||||||||||
Shares used in computation of diluted earnings per share | 76,925 | 76,463 | 76,296 | 76,198 | 76,048 | 76,466 | 76,592 | 76,672 | |||||||||||||||||||||||
17. Subsidiary Guarantor
In November 2013, we filed an automatic shelf registration statement with the SEC, which enables us to offer and sell from time to time, in one or more offerings, an unspecified amount of common stock, preferred stock, depositary shares, debt securities, warrants, purchase contracts, purchase units or any combination thereof and is intended to give us flexibility to take advantage of financing opportunities as needed or deemed desirable in light of market conditions. Debt securities sold by us may be fully and unconditionally guaranteed on an unsecured basis by SolarWinds Worldwide, LLC, our principal operating subsidiary. The guarantee is subject to release under certain customary circumstances. The indenture governing any debt securities that may be issued by SolarWinds, Inc. provides that the guarantees may be automatically and unconditionally released only upon the following circumstances: 1) the guarantor is sold or sells all of its assets in compliance with the terms of the indenture; and 2) the requirements under the terms of the indenture for defeasance or covenant defeasance or satisfaction and discharge have been satisfied. SolarWinds, Inc. has no independent assets or operations, and any other direct subsidiaries of SolarWinds, Inc. other than SolarWinds Worldwide are minor. The guarantee by SolarWinds Worldwide of any debt securities to be offered pursuant to the automatic shelf registration statement from time to time will be full and unconditional. There are no restrictions on the ability of SolarWinds, Inc. to obtain funds from SolarWinds Worldwide through dividends, loans or advances other than certain restrictions on intercompany indebtedness as set forth in the Credit Agreement.
18. Subsequent Event
Acquisition
On January 28, 2015, we acquired Librato, Inc., or Librato, a cloud-based infrastructure monitoring company, for approximately $40.0 million in cash. By acquiring Librato, we have added cloud-based performance management solutions to our product portfolio. The transaction will be accounted for using the acquisition method of accounting. Accordingly, the results of operations of Librato since the acquisition date will be included in our condensed consolidated financial statements for the first quarter of 2015. We are in the process of gathering information to allocate the purchase price to the assets acquired
F-34
and liabilities assumed. All of the assets acquired and liabilities assumed in the transaction will be recognized at their acquisition date fair values.
F-35
SOLARWINDS, INC.
FINANCIAL STATEMENT SCHEDULE
SCHEDULE II—VALUATION AND QUALIFYING ACCOUNTS
Beginning Balance | Additions (Charge to Expense) | Deductions (Write-offs, net of Recoveries) | Ending Balance | ||||||||||||
Allowance for doubtful accounts, customers and other: | |||||||||||||||
Year ended December 31, 2012 | $ | 192 | $ | 269 | $ | 190 | $ | 271 | |||||||
Year ended December 31, 2013 | 271 | 464 | 262 | 473 | |||||||||||
Year ended December 31, 2014 | 473 | 731 | 116 | 1,088 | |||||||||||
F-36
EXHIBIT INDEX
Exhibit No. | Provided Herewith | Incorporated by Reference | ||||||||||
Exhibit Description | Form | SEC File No. | Exhibit | Filing Date | ||||||||
2.1 | Agreement and Plan of Merger and Reorganization dated as of May 17, 2013 by and among SolarWinds Worldwide, LLC, North Acquisition Corp., N-able Technologies International, Inc., the Equity Holder Representatives and U.S. Bank, National Association*** | 8-K | 001-34358 | 2.1 | 5/28/2013 | |||||||
2.2 | Agreement and Plan of Merger and Reorganization dated as of October 1, 2013 by and among SolarWinds Worldwide, LLC, Optimus Acquisition Corp., Confio Corporation, the Equity Holder Representative and U.S. Bank, National Association*** | 8-K | 001-34358 | 2.1 | 10/7/2013 | |||||||
3.1 | Amended and Restated Certificate of Incorporation of the Registrant | S-1/A | 333-162661 | 3.1 | 11/5/2009 | |||||||
3.2 | Amended and Restated Bylaws of the Registrant | 8-K | 001-34358 | 3.1 | 9/24/2013 | |||||||
4.1 | Specimen Common Stock Certificate of the Registrant | S-1/A | 333-149851 | 4.1 | 7/18/2008 | |||||||
4.2 | Form of Indenture | S-3 | 333-192180 | 4.5 | 11/7/2013 | |||||||
10.1 | Form of Indemnification Agreement for directors and officers | S-1/A | 333-149851 | 10.1 | 8/22/2008 | |||||||
10.2 | Indemnification Agreement by and between the Registrant and Donald C. Yonce, dated July 22, 2008 | S-1/A | 333-149851 | 10.1A | 8/22/2008 | |||||||
10.3 | Registration Rights Agreement by and among the Registrant and certain preferred and common stock holders, dated December 13, 2005, with Amendment No. 1 to the Registration Rights Agreement by and among the Registrant and certain preferred and common stock holders, dated December 20, 2006 | S-1 | 333-149851 | 4.4 | 3/21/2008 | |||||||
10.4 | Amended and Restated Stock Incentive Plan # | S-1 | 333-149851 | 10.2 | 3/21/2008 | |||||||
10.5 | Form of Stock Option Agreement under Amended and Restated Stock Incentive Plan (Standard Form) # | S-1 | 333-149851 | 10.3A | 3/21/2008 | |||||||
10.6 | Form of Stock Option Agreement under Amended and Restated Stock Incentive Plan (Early Exercise Form) # | S-1 | 333-149851 | 10.3B | 3/21/2008 | |||||||
10.7 | 2008 Equity Incentive Plan # | S-1/A | 333-149851 | 10.4 | 6/10/2008 | |||||||
10.8 | Form of Stock Option Agreement under 2008 Equity Incentive Plan # | S-1/A | 333-149851 | 10.5 | 6/10/2008 | |||||||
10.9 | Form of Restricted Stock Purchase Agreement under 2008 Equity Incentive Plan # | S-1/A | 333-149851 | 10.6 | 6/10/2008 | |||||||
10.10 | Form of Restricted Stock Unit Agreement under 2008 Equity Incentive Plan # | S-1/A | 333-149851 | 10.6A | 6/10/2008 | |||||||
10.11 | Registrant Bonus Plan # | 8-K | 001-34358 | 10.1 | 5/25/2010 | |||||||
Exhibit No. | Provided Herewith | Incorporated by Reference | ||||||||||
Exhibit Description | Form | SEC File No. | Exhibit | Filing Date | ||||||||
10.12 | Amended and Restated Employment Agreement between SolarWinds Worldwide, LLC and Kevin B. Thompson, dated February 23, 2011 # | 10-K | 001-34358 | 10.13 | 2/25/2011 | |||||||
10.13 | Amended and Restated Employment Agreement between the Registrant, SolarWinds Worldwide, LLC, SolarWinds Australia Pty. Ltd. and Douglas G. Hibberd, dated January 31, 2011 # | 10-K | 001-34358 | 10.17 | 2/25/2011 | |||||||
10.14 | Amendment to Amended and Restated Employment Agreement between the Registrant, SolarWinds Worldwide, LLC, SolarWinds Australia Pty. Ltd. and Douglas G. Hibberd, dated February 25, 2011 # | 10-K | 001-34358 | 10.17A | 2/25/2011 | |||||||
10.15 | Amended and Restated Employment Agreement between SolarWinds Worldwide, LLC and J. Barton Kalsu, dated February 23, 2011 # | 10-K | 001-34358 | 10.19 | 2/25/2011 | |||||||
10.16 | Employment Agreement between SolarWinds Worldwide, LLC and Jason Ream, dated October 1, 2013 # | 10-Q | 001-34358 | 10.3 | 10/30/2013 | |||||||
10.17 | Amended and Restated Employment Agreement between SolarWinds Worldwide, LLC and Paul Strelzick, dated February 23, 2011 # | 10-K | 001-34358 | 10.21 | 2/25/2011 | |||||||
10.18 | Credit Agreement, dated as of October 4, 2013, by and among SolarWinds, Inc., the Lenders referred to therein, Wells Fargo Bank, National Association, as administrative agent for the Lenders, and Wells Fargo Securities, LLC | 8-K | 001-34358 | 10.1 | 10/7/2013 | |||||||
10.19 | Guaranty Agreement, dated as of October 4, 2013, by SolarWinds Worldwide, LLC in favor of and for the benefit of Wells Fargo Bank, National Association as administrative agent for the Lenders | 8-K | 001-34358 | 10.2 | 10/7/2013 | |||||||
21.1 | List of subsidiaries of the Registrant | * | ||||||||||
23.1 | Consent of PricewaterhouseCoopers LLP, Independent Registered Public Accounting Firm | * | ||||||||||
31.1 | Certification of Chief Executive Officer pursuant to Exchange Act Rules 13a-14(a) and 15d-14(a), as adopted pursuant to Section 302 of the Sarbanes-Oxley Act of 2002 | * | ||||||||||
31.2 | Certification of Chief Financial Officer pursuant to Exchange Act Rules 13a-14(a) and 15d-14(a), as adopted pursuant to Section 302 of the Sarbanes-Oxley Act of 2002 | * | ||||||||||
31.3 | Certification of Chief Accounting Officer pursuant to Exchange Act Rules 13a-14(a) and 15d-14(a), as adopted pursuant to Section 302 of the Sarbanes-Oxley Act of 2002 | * | ||||||||||
Exhibit No. | Provided Herewith | Incorporated by Reference | ||||||||||
Exhibit Description | Form | SEC File No. | Exhibit | Filing Date | ||||||||
32.1 | Certifications of Chief Executive Officer, Chief Financial Officer and Chief Accounting Officer pursuant to 18 U.S.C. Section 1350, as adopted pursuant to Section 906 of the Sarbanes-Oxley Act of 2002 | ** | ||||||||||
101.INS | XBRL Instance Document | * | ||||||||||
101.SCH | XBRL Taxonomy Extension Schema Document | * | ||||||||||
101.CAL | XBRL Taxonomy Calculation Linkbase Document | * | ||||||||||
101.DEF | XBRL Taxonomy Definition Linkbase Document | * | ||||||||||
101.LAB | XBRL Taxonomy Label Linkbase Document | * | ||||||||||
101.PRE | XBRL Taxonomy Presentation Linkbase Document | * | ||||||||||
# | Indicates management contract or compensatory plan or arrangement. |
* | Filed herewith |
** | Furnished herewith |
*** | Schedules and exhibits have been omitted pursuant to Item 601(b)(2) of Regulation S-K. SolarWinds, Inc. hereby undertakes to furnish supplementally copies of any of the omitted schedules and exhibits upon request by the Securities and Exchange Commission. |