Attached files
| file | filename |
|---|---|
| 8-K - 8-K - CEB Inc. | d879172d8k.htm |
| Exhibit 99.1
|

Investor Slide Show
Q1 2015
|
|
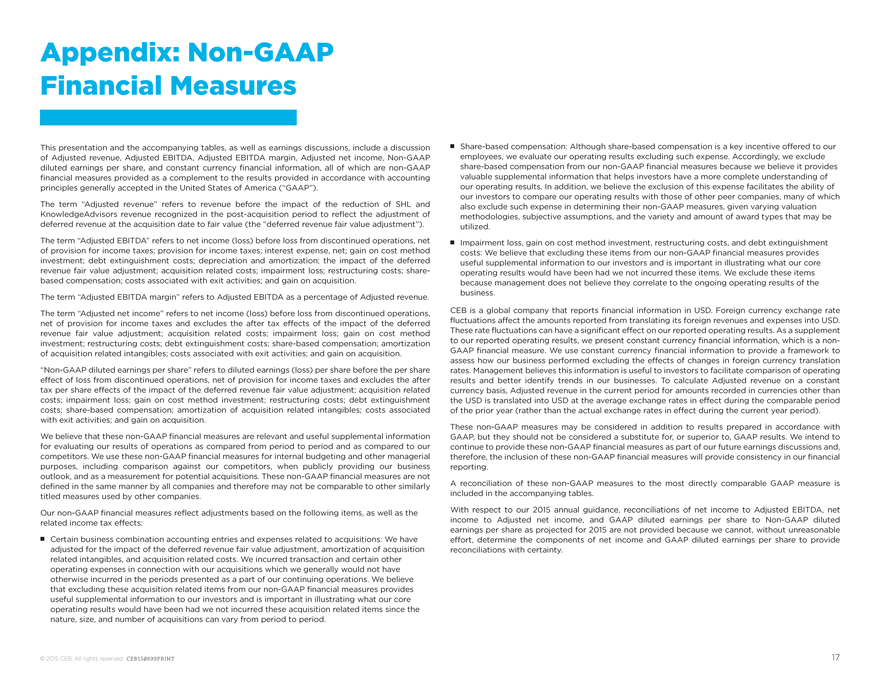
Appendix: Non-GAAP Financial Measures
This presentation and the accompanying tables, as well as earnings discussions, include a discussion of Adjusted revenue, Adjusted EBITDA, Adjusted EBITDA margin, Adjusted net income, Non-GAAP diluted earnings per share, and constant currency financial information, all of which are non-GAAP financial measures provided as a complement to the results provided in accordance with accounting principles generally accepted in the United States of America (“GAAP”).
The term “Adjusted revenue” refers to revenue before the impact of the reduction of SHL and KnowledgeAdvisors revenue recognized in the post-acquisition period to reflect the adjustment of deferred revenue at the acquisition date to fair value (the “deferred revenue fair value adjustment”).
The term “Adjusted EBITDA” refers to net income (loss) before loss from discontinued operations, net of provision for income taxes; provision for income taxes; interest expense, net; gain on cost method investment; debt extinguishment costs; depreciation and amortization; the impact of the deferred revenue fair value adjustment; acquisition related costs; impairment loss; restructuring costs; share-based compensation; costs associated with exit activities; and gain on acquisition.
The term “Adjusted EBITDA margin” refers to Adjusted EBITDA as a percentage of Adjusted revenue.
The term “Adjusted net income” refers to net income (loss) before loss from discontinued operations, net of provision for income taxes and excludes the after tax effects of the impact of the deferred revenue fair value adjustment; acquisition related costs; impairment loss; gain on cost method investment; restructuring costs; debt extinguishment costs; share-based compensation; amortization of acquisition related intangibles; costs associated with exit activities; and gain on acquisition.
“Non-GAAP diluted earnings per share” refers to diluted earnings (loss) per share before the per share effect of loss from discontinued operations, net of provision for income taxes and excludes the after tax per share effects of the impact of the deferred revenue fair value adjustment; acquisition related costs; impairment loss; gain on cost method investment; restructuring costs; debt extinguishment costs; share-based compensation; amortization of acquisition related intangibles; costs associated with exit activities; and gain on acquisition.
We believe that these non-GAAP financial measures are relevant and useful supplemental information for evaluating our results of operations as compared from period to period and as compared to our competitors. We use these non-GAAP financial measures for internal budgeting and other managerial purposes, including comparison against our competitors, when publicly providing our business outlook, and as a measurement for potential acquisitions. These non-GAAP financial measures are not defined in the same manner by all companies and therefore may not be comparable to other similarly titled measures used by other companies.
Our non-GAAP financial measures refiect adjustments based on the following items, as well as the related income tax effects:
Certain business combination accounting entries and expenses related to acquisitions: We have adjusted for the impact of the deferred revenue fair value adjustment, amortization of acquisition related intangibles, and acquisition related costs. We incurred transaction and certain other operating expenses in connection with our acquisitions which we generally would not have otherwise incurred in the periods presented as a part of our continuing operations. We believe that excluding these acquisition related items from our non-GAAP financial measures provides useful supplemental information to our investors and is important in illustrating what our core operating results would have been had we not incurred these acquisition related items since the nature, size, and number of acquisitions can vary from period to period.
Share-based compensation: Although share-based compensation is a key incentive offered to our employees, we evaluate our operating results excluding such expense. Accordingly, we exclude share-based compensation from our non-GAAP financial measures because we believe it provides valuable supplemental information that helps investors have a more complete understanding of our operating results. In addition, we believe the exclusion of this expense facilitates the ability of our investors to compare our operating results with those of other peer companies, many of which also exclude such expense in determining their non-GAAP measures, given varying valuation methodologies, subjective assumptions, and the variety and amount of award types that may be utilized.
Impairment loss, gain on cost method investment, restructuring costs, and debt extinguishment costs: We believe that excluding these items from our non-GAAP financial measures provides useful supplemental information to our investors and is important in illustrating what our core operating results would have been had we not incurred these items. We exclude these items because management does not believe they correlate to the ongoing operating results of the business.
CEB is a global company that reports financial information in USD. Foreign currency exchange rate fiuctuations affect the amounts reported from translating its foreign revenues and expenses into USD. These rate fiuctuations can have a significant effect on our reported operating results. As a supplement to our reported operating results, we present constant currency financial information, which is a non-GAAP financial measure. We use constant currency financial information to provide a framework to assess how our business performed excluding the effects of changes in foreign currency translation rates. Management believes this information is useful to investors to facilitate comparison of operating results and better identify trends in our businesses. To calculate Adjusted revenue on a constant currency basis, Adjusted revenue in the current period for amounts recorded in currencies other than the USD is translated into USD at the average exchange rates in effect during the comparable period of the prior year (rather than the actual exchange rates in effect during the current year period).
These non-GAAP measures may be considered in addition to results prepared in accordance with GAAP, but they should not be considered a substitute for, or superior to, GAAP results. We intend to continue to provide these non-GAAP financial measures as part of our future earnings discussions and, therefore, the inclusion of these non-GAAP financial measures will provide consistency in our financial reporting.
A reconciliation of these non-GAAP measures to the most directly comparable GAAP measure is included in the accompanying tables.
With respect to our 2015 annual guidance, reconciliations of net income to Adjusted EBITDA, net income to Adjusted net income, and GAAP diluted earnings per share to Non-GAAP diluted earnings per share as projected for 2015 are not provided because we cannot, without unreasonable effort, determine the components of net income and GAAP diluted earnings per share to provide reconciliations with certainty.
17
|
|
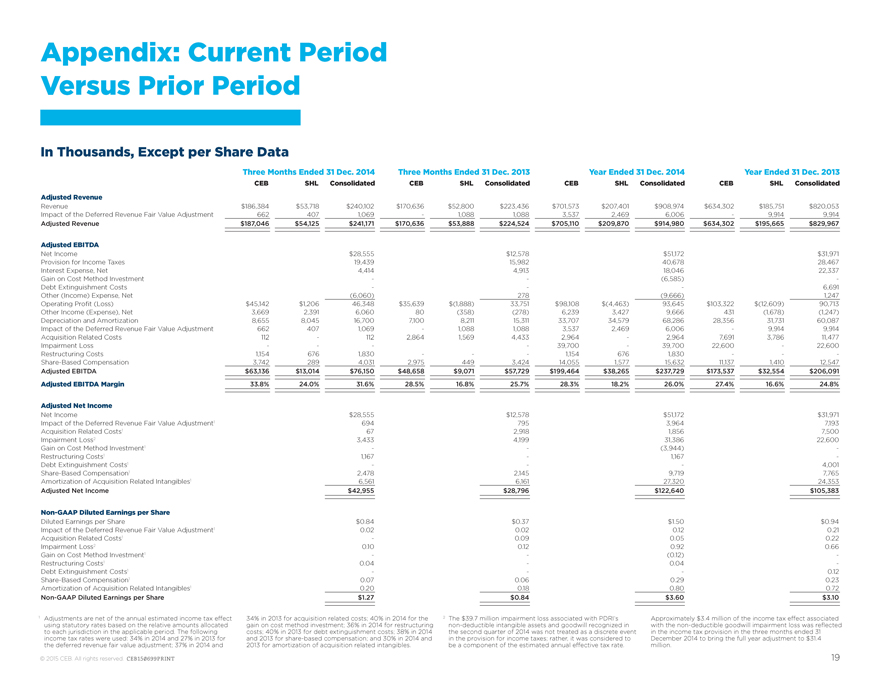
Appendix: Current Period Versus Prior Period
In Thousands, Except per Share Data
Three Months Ended 31 Dec. 2014 Three Months Ended 31 Dec. 2013 Year Ended 31 Dec. 2014 Year Ended 31 Dec. 2013
CEB SHL Consolidated CEB SHL Consolidated CEB SHL Consolidated CEB SHL Consolidated
Adjusted Revenue
Revenue $186,384 $53,718 $240,102 $170,636 $52,800 $223,436 $701,573 $207,401 $908,974 $634,302 $185,751 $820,053
Impact of the Deferred Revenue Fair Value Adjustment 662 407 1,069 — 1,088 1,088 3,537 2,469 6,006 — 9,914 9,914
Adjusted Revenue $187,046 $54,125 $241,171 $170,636 $53,888 $224,524 $705,110 $209,870 $914,980 $634,302 $195,665 $829,967
Adjusted EBITDA
Net Income $28,555 $12,578 $51,172 $31,971
Provision for Income Taxes 19,439 15,982 40,678 28,467
Interest Expense, Net 4,414 4,913 18,046 22,337
Gain on Cost Method Investment — — (6,585) -
Debt Extinguishment Costs — — — 6,691
Other (Income) Expense, Net (6,060) 278 (9,666) 1,247
Operating Profit (Loss) $45,142 $1,206 46,348 $35,639 $(1,888) 33,751 $98,108 $(4,463) 93,645 $103,322 $(12,609) 90,713
Other Income (Expense), Net 3,669 2,391 6,060 80 (358) (278) 6,239 3,427 9,666 431 (1,678) (1,247)
Depreciation and Amortization 8,655 8,045 16,700 7,100 8,211 15,311 33,707 34,579 68,286 28,356 31,731 60,087
Impact of the Deferred Revenue Fair Value Adjustment 662 407 1,069 — 1,088 1,088 3,537 2,469 6,006 — 9,914 9,914
Acquisition Related Costs 112 — 112 2,864 1,569 4,433 2,964 — 2,964 7,691 3,786 11,477
Impairment Loss ——— — 39,700 — 39,700 22,600 — 22,600
Restructuring Costs 1,154 676 1,830 ——— 1,154 676 1,830 —— -
Share-Based Compensation 3,742 289 4,031 2,975 449 3,424 14,055 1,577 15,632 11,137 1,410 12,547
Adjusted EBITDA $63,136 $13,014 $76,150 $48,658 $9,071 $57,729 $199,464 $38,265 $237,729 $173,537 $32,554 $206,091
Adjusted EBITDA Margin 33.8% 24.0% 31.6% 28.5% 16.8% 25.7% 28.3% 18.2% 26.0% 27.4% 16.6% 24.8%
Adjusted Net Income
Net Income $28,555 $12,578 $51,172 $31,971
Impact of the Deferred Revenue Fair Value Adjustment1 694 795 3,964 7,193
Acquisition Related Costs1 67 2,918 1,856 7,500
Impairment Loss2 3,433 4,199 31,386 22,600
Gain on Cost Method Investment1 — — (3,944) -
Restructuring Costs1 1,167 — 1,167 -
Debt Extinguishment Costs1 — — — 4,001
Share-Based Compensation1 2,478 2,145 9,719 7,765
Amortization of Acquisition Related Intangibles1 6,561 6,161 27,320 24,353
Adjusted Net Income $42,955 $28,796 $122,640 $105,383
Non-GAAP Diluted Earnings per Share
Diluted Earnings per Share $0.84 $0.37 $1.50 $0.94
Impact of the Deferred Revenue Fair Value Adjustment1 0.02 0.02 0.12 0.21
Acquisition Related Costs1 — 0.09 0.05 0.22
Impairment Loss2 0.10 0.12 0.92 0.66
Gain on Cost Method Investment1 — — (0.12) -
Restructuring Costs1 0.04 — 0.04 -
Debt Extinguishment Costs1 — — — 0.12
Share-Based Compensation1 0.07 0.06 0.29 0.23
Amortization of Acquisition Related Intangibles1 0.20 0.18 0.80 0.72
Non-GAAP Diluted Earnings per Share $1.27 $0.84 $3.60 $3.10
1 Adjustments are net of the annual estimated income tax effect 34% in 2013 for acquisition related costs; 40% in 2014 for the 2 The $39.7 million impairment loss associated with PDRI’s Approximately $3.4 million of the income tax effect associated
using statutory rates based on the relative amounts allocated gain on cost method investment; 36% in 2014 for restructuring non-deductible intangible assets and goodwill recognized in with the non-deductible goodwill impairment loss was refiected
to each jurisdiction in the applicable period. The following costs; 40% in 2013 for debt extinguishment costs; 38% in 2014 the second quarter of 2014 was not treated as a discrete event in the income tax provision in the three months ended 31
income tax rates were used: 34% in 2014 and 27% in 2013 for and 2013 for share-based compensation; and 30% in 2014 and in the provision for income taxes; rather, it was considered to December 2014 to bring the full year adjustment to $31.4
the deferred revenue fair value adjustment; 37% in 2014 and 2013 for amortization of acquisition related intangibles. be a component of the estimated annual effective tax rate. million.
© 2015 CEB. All rights reserved. CEB150699PRINT 19
|
|
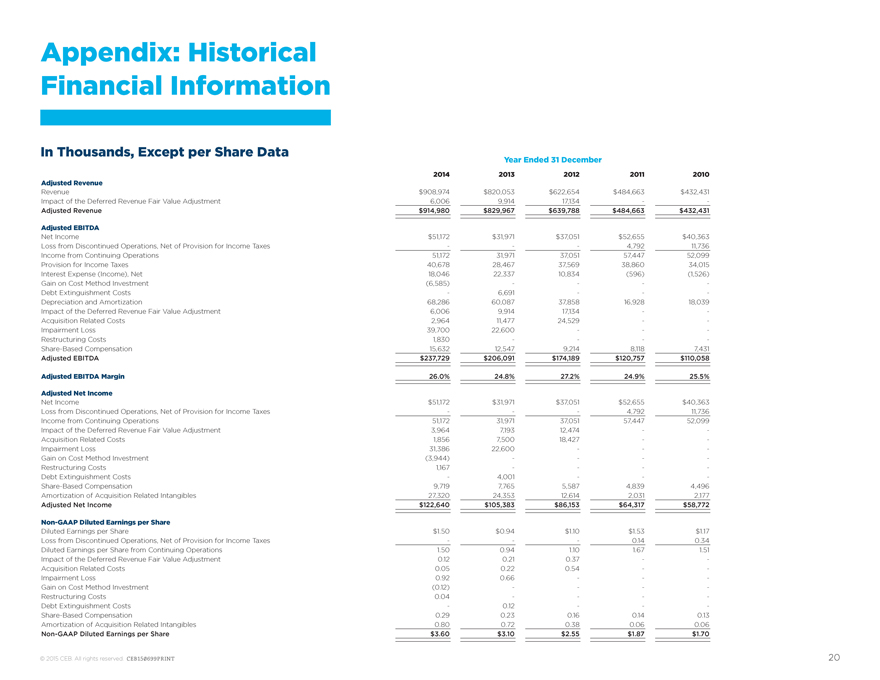
Appendix: Historical Financial Information
In Thousands, Except per Share Data
Year Ended 31 December
2014 2013 2012 2011 2010
Adjusted Revenue
Revenue $908,974 $820,053 $622,654 $484,663 $432,431
Impact of the Deferred Revenue Fair Value Adjustment 6,006 9,914 17,134 — -
Adjusted Revenue $914,980 $829,967 $639,788 $484,663 $432,431
Adjusted EBITDA
Net Income $51,172 $31,971 $37,051 $52,655 $40,363
Loss from Discontinued Operations, Net of Provision for Income Taxes ——— 4,792 11,736
Income from Continuing Operations 51,172 31,971 37,051 57,447 52,099
Provision for Income Taxes 40,678 28,467 37,569 38,860 34,015
Interest Expense (Income), Net 18,046 22,337 10,834 (596) (1,526)
Gain on Cost Method Investment (6,585) ——— -
Debt Extinguishment Costs — 6,691 —— -
Depreciation and Amortization 68,286 60,087 37,858 16,928 18,039
Impact of the Deferred Revenue Fair Value Adjustment 6,006 9,914 17,134 — -
Acquisition Related Costs 2,964 11,477 24,529 — -
Impairment Loss 39,700 22,600 —— -
Restructuring Costs 1,830 ——— -
Share-Based Compensation 15,632 12,547 9,214 8,118 7,431
Adjusted EBITDA $237,729 $206,091 $174,189 $120,757 $110,058
Adjusted EBITDA Margin 26.0% 24.8% 27.2% 24.9% 25.5%
Adjusted Net Income
Net Income $51,172 $31,971 $37,051 $52,655 $40,363
Loss from Discontinued Operations, Net of Provision for Income Taxes ——— 4,792 11,736
Income from Continuing Operations 51,172 31,971 37,051 57,447 52,099
Impact of the Deferred Revenue Fair Value Adjustment 3,964 7,193 12,474 — -
Acquisition Related Costs 1,856 7,500 18,427 — -
Impairment Loss 31,386 22,600 —— -
Gain on Cost Method Investment (3,944) ——— -
Restructuring Costs 1,167 ——— -
Debt Extinguishment Costs — 4,001 —— -
Share-Based Compensation 9,719 7,765 5,587 4,839 4,496
Amortization of Acquisition Related Intangibles 27,320 24,353 12,614 2,031 2,177
Adjusted Net Income $122,640 $105,383 $86,153 $64,317 $58,772
Non-GAAP Diluted Earnings per Share
Diluted Earnings per Share $1.50 $0.94 $1.10 $1.53 $1.17
Loss from Discontinued Operations, Net of Provision for Income Taxes ——— 0.14 0.34
Diluted Earnings per Share from Continuing Operations 1.50 0.94 1.10 1.67 1.51
Impact of the Deferred Revenue Fair Value Adjustment 0.12 0.21 0.37 — -
Acquisition Related Costs 0.05 0.22 0.54 — -
Impairment Loss 0.92 0.66 —— -
Gain on Cost Method Investment (0.12) ——— -
Restructuring Costs 0.04 ——— -
Debt Extinguishment Costs — 0.12 —— -
Share-Based Compensation 0.29 0.23 0.16 0.14 0.13
Amortization of Acquisition Related Intangibles 0.80 0.72 0.38 0.06 0.06
Non-GAAP Diluted Earnings per Share $3.60 $3.10 $2.55 $1.87 $1.70
© 2015 CEB. All rights reserved. CEB150699PRINT 20
|
|
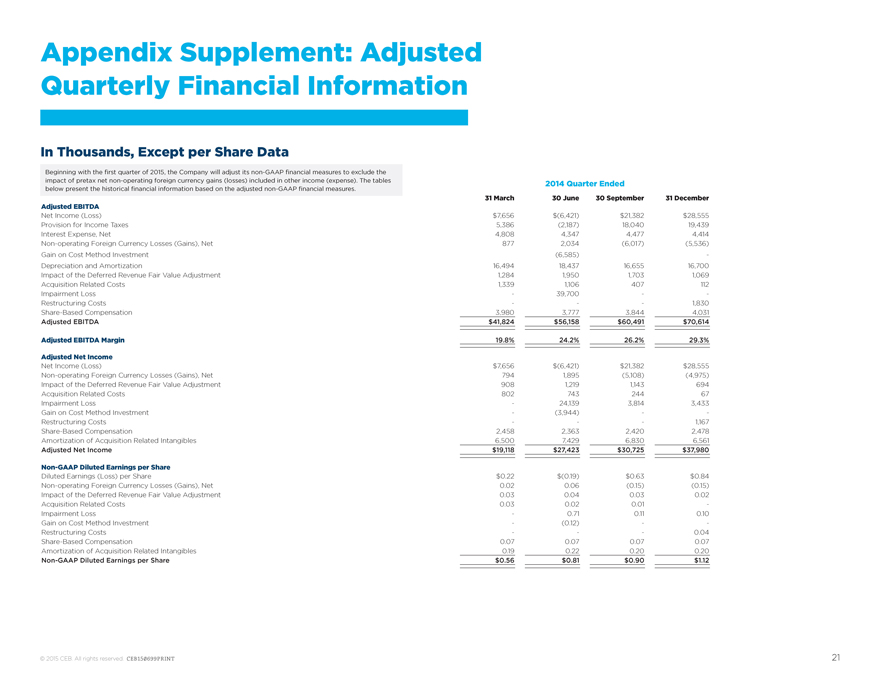
Appendix Supplement: Adjusted Quarterly Financial Information
In Thousands, Except per Share Data
Beginning with the first quarter of 2015, the Company will adjust its non-GAAP financial measures to exclude the
impact of pretax net non-operating foreign currency gains (losses) included in other income (expense). The tables 2014 Quarter Ended
below present the historical financial information based on the adjusted non-GAAP financial measures.
31 March 30 June 30 September 31 December
Adjusted EBITDA
Net Income (Loss) $7,656 $(6,421) $21,382 $28,555
Provision for Income Taxes 5,386 (2,187) 18,040 19,439
Interest Expense, Net 4,808 4,347 4,477 4,414
Non-operating Foreign Currency Losses (Gains), Net 877 2,034 (6,017) (5,536)
Gain on Cost Method Investment (6,585) -
Depreciation and Amortization 16,494 18,437 16,655 16,700
Impact of the Deferred Revenue Fair Value Adjustment 1,284 1,950 1,703 1,069
Acquisition Related Costs 1,339 1,106 407 112
Impairment Loss — 39,700 — -
Restructuring Costs ——— 1,830
Share-Based Compensation 3,980 3,777 3,844 4,031
Adjusted EBITDA $41,824 $56,158 $60,491 $70,614
Adjusted EBITDA Margin 19.8% 24.2% 26.2% 29.3%
Adjusted Net Income
Net Income (Loss) $7,656 $(6,421) $21,382 $28,555
Non-operating Foreign Currency Losses (Gains), Net 794 1,895 (5,108) (4,975)
Impact of the Deferred Revenue Fair Value Adjustment 908 1,219 1,143 694
Acquisition Related Costs 802 743 244 67
Impairment Loss — 24,139 3,814 3,433
Gain on Cost Method Investment — (3,944) — -
Restructuring Costs ——— 1,167
Share-Based Compensation 2,458 2,363 2,420 2,478
Amortization of Acquisition Related Intangibles 6,500 7,429 6,830 6,561
Adjusted Net Income $19,118 $27,423 $30,725 $37,980
Non-GAAP Diluted Earnings per Share
Diluted Earnings (Loss) per Share $0.22 $(0.19) $0.63 $0.84
Non-operating Foreign Currency Losses (Gains), Net 0.02 0.06 (0.15) (0.15)
Impact of the Deferred Revenue Fair Value Adjustment 0.03 0.04 0.03 0.02
Acquisition Related Costs 0.03 0.02 0.01 -
Impairment Loss — 0.71 0.11 0.10
Gain on Cost Method Investment — (0.12) — -
Restructuring Costs ——— 0.04
Share-Based Compensation 0.07 0.07 0.07 0.07
Amortization of Acquisition Related Intangibles 0.19 0.22 0.20 0.20
Non-GAAP Diluted Earnings per Share $0.56 $0.81 $0.90 $1.12
© 2015 CEB. All rights reserved. CEB150699PRINT 21
|
|
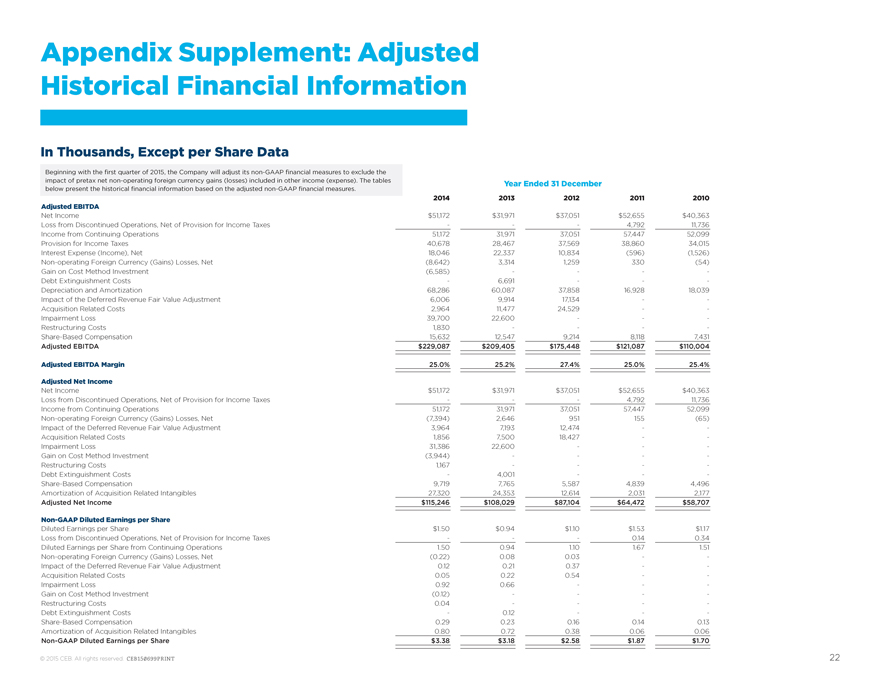
Appendix Supplement: Adjusted Historical Financial Information
In Thousands, Except per Share Data
Beginning with the first quarter of 2015, the Company will adjust its non-GAAP financial measures to exclude the
impact of pretax net non-operating foreign currency gains (losses) included in other income (expense). The tables Year Ended 31 December
below present the historical financial information based on the adjusted non-GAAP financial measures.
2014 2013 2012 2011 2010
Adjusted EBITDA
Net Income $51,172 $31,971 $37,051 $52,655 $40,363
Loss from Discontinued Operations, Net of Provision for Income Taxes ——— 4,792 11,736
Income from Continuing Operations 51,172 31,971 37,051 57,447 52,099
Provision for Income Taxes 40,678 28,467 37,569 38,860 34,015
Interest Expense (Income), Net 18,046 22,337 10,834 (596) (1,526)
Non-operating Foreign Currency (Gains) Losses, Net (8,642) 3,314 1,259 330 (54)
Gain on Cost Method Investment (6,585) ——— -
Debt Extinguishment Costs — 6,691 —— -
Depreciation and Amortization 68,286 60,087 37,858 16,928 18,039
Impact of the Deferred Revenue Fair Value Adjustment 6,006 9,914 17,134 — -
Acquisition Related Costs 2,964 11,477 24,529 — -
Impairment Loss 39,700 22,600 —— -
Restructuring Costs 1,830 ——— -
Share-Based Compensation 15,632 12,547 9,214 8,118 7,431
Adjusted EBITDA $229,087 $209,405 $175,448 $121,087 $110,004
Adjusted EBITDA Margin 25.0% 25.2% 27.4% 25.0% 25.4%
Adjusted Net Income
Net Income $51,172 $31,971 $37,051 $52,655 $40,363
Loss from Discontinued Operations, Net of Provision for Income Taxes ——— 4,792 11,736
Income from Continuing Operations 51,172 31,971 37,051 57,447 52,099
Non-operating Foreign Currency (Gains) Losses, Net (7,394) 2,646 951 155 (65)
Impact of the Deferred Revenue Fair Value Adjustment 3,964 7,193 12,474 — -
Acquisition Related Costs 1,856 7,500 18,427 — -
Impairment Loss 31,386 22,600 —— -
Gain on Cost Method Investment (3,944) ——— -
Restructuring Costs 1,167 ——— -
Debt Extinguishment Costs — 4,001 —— -
Share-Based Compensation 9,719 7,765 5,587 4,839 4,496
Amortization of Acquisition Related Intangibles 27,320 24,353 12,614 2,031 2,177
Adjusted Net Income $115,246 $108,029 $87,104 $64,472 $58,707
Non-GAAP Diluted Earnings per Share
Diluted Earnings per Share $1.50 $0.94 $1.10 $1.53 $1.17
Loss from Discontinued Operations, Net of Provision for Income Taxes ——— 0.14 0.34
Diluted Earnings per Share from Continuing Operations 1.50 0.94 1.10 1.67 1.51
Non-operating Foreign Currency (Gains) Losses, Net (0.22) 0.08 0.03 — -
Impact of the Deferred Revenue Fair Value Adjustment 0.12 0.21 0.37 — -
Acquisition Related Costs 0.05 0.22 0.54 — -
Impairment Loss 0.92 0.66 —— -
Gain on Cost Method Investment (0.12) ——— -
Restructuring Costs 0.04 ——— -
Debt Extinguishment Costs — 0.12 —— -
Share-Based Compensation 0.29 0.23 0.16 0.14 0.13
Amortization of Acquisition Related Intangibles 0.80 0.72 0.38 0.06 0.06
Non-GAAP Diluted Earnings per Share $3.38 $3.18 $2.58 $1.87 $1.70
© 2015 CEB. All rights reserved. CEB150699PRINT 22