Attached files
| file | filename |
|---|---|
| 8-K - FORM 8-K - AVIV REIT, INC. | d878689d8k.htm |
Exhibit 99.1

Fourth Quarter 2014 Results
| Table of Contents |
||||
| Earnings Release |
2-5 | |||
| Consolidated Statements of Operations |
6 | |||
| Reconciliations of Net Income to EBITDA, Adjusted EBITDA, FFO, Normalized FFO and AFFO |
7 | |||
| Consolidated Balance Sheets |
8 | |||
| Consolidated Statements of Cash Flows |
9-10 | |||
| Portfolio Summary |
11-13 | |||
| Investment Activity |
14 | |||
| Debt Summary and Capitalization |
15 | |||
| Common Share and OP Unit Weighted Average Amounts Outstanding |
16 | |||
| Definitions and Footnotes |
17-18 | |||
Note: This earnings release and the related supplemental information contain certain non-GAAP financial measures that we believe are helpful in understanding our business, as further discussed herein. These financial measures, which include Funds From Operations, Normalized Funds From Operations, AFFO, EBITDA and Adjusted EBITDA, should not be considered as an alternative to net income, earnings per share or any other GAAP measurement of performance or as an alternative to cash flows from operating, investing or financing activities. Furthermore, these non-GAAP financial measures are not intended to be a measure of cash flow or liquidity. Information included in this supplemental package is unaudited. For a reconciliation of each such non-GAAP financial measure to the most directly comparable GAAP financial measure, please see page 7.
1
AVIV REIT REPORTS FOURTH QUARTER 2014 RESULTS
$707 MILLION OF ACQUISITIONS IN 2014 AT 8.9% BLENDED INITIAL CASH YIELD
CHICAGO, IL – February 23, 2015 – Aviv REIT, Inc. (NYSE: AVIV) today reported results for the fourth quarter and year ended December 31, 2014. All per share results are reported on a fully diluted basis.
Highlights
| • | On October 31, 2014, Aviv announced that the Boards of Directors of Aviv and Omega Healthcare Investors (NYSE:OHI) unanimously approved a definitive agreement under which Omega will acquire all of the outstanding shares of Aviv in a stock-for-stock merger. |
| • | $340.1 million of acquisitions |
| • | $33.1 million acquisition of three SNFs at a blended initial cash yield of 9.1% |
| • | $305.0 million single transaction acquisition of 23 SNFs, four ALFs, one ILF an office building at a blended initial cash yield of 8.5% |
| • | $2.0 million acquisition of two land parcels for the new construction of two ALF/ALZ facilities |
| • | Invested $17.5 million of property reinvestment and new construction |
| • | AFFO for the quarter ended December 31, 2014 of $31.3 million, or $0.51 per share, a 24% per share increase over Q4 2013 |
| • | AFFO for the year ended December 31, 2014 of $110MM, or $1.88 per share, an 11.2% increase over full year 2013 |
| • | Adjusted EBITDA of $46.1 million, a 38% increase over Q4 2013 |
Q1 2015 Highlights
| • | $4.5 million related to one SNF acquisition at an initial cash yield of 9.0% |
| • | On February 2, 2015, AVIV announced that it has set the date of its special meeting of stockholders to consider and vote on, among other things, a proposal to approve its previously announced merger with Omega. The special meeting will be held on Friday, March 27, 2015, at 10:00 a.m. Eastern time. Aviv stockholders of record as of the close of business on February 12, 2015 will be entitled to receive notice of and to participate at the special meeting. Additional information about the special meeting is included in the preliminary joint proxy statement/prospectus filed by Omega with the Securities and Exchange Commission (the “SEC”) on January 5, 2015, as amended on February 17, 2015, and the definitive joint proxy statement/prospectus which is expected to be mailed to stockholders of record after the related registration statement is declared effective by the SEC. Completion of the transaction is subject to satisfaction of customary closing conditions, including the approval of stockholders of both companies. The transaction is currently expected to close early in the second quarter of 2015. |
2
Fourth Quarter 2014 Results
AFFO for the quarter ended December 31, 2014 was $31.3 million, or $0.51 per share, compared to $20.9 million, or $0.41 per share, for the quarter ended December 31, 2013, an increase of 24% per share. The growth in AFFO per share was driven primarily by the Company’s strong acquisition activity partially offset by the 9.2 million of additional shares of common stock issued during the second quarter of 2014.
Adjusted EBITDA for the quarter ended December 31, 2014 was $46.1 million, compared to $33.5 million for the quarter ended December 31, 2013, an increase of 38%. Net income for the quarter ended December 31, 2014 was $12.9 million, or $0.21 per share, compared to $11.0 million, or $0.22 per share, for the quarter ended December 31, 2013.
Full Year 2014 Results
AFFO for the year ended December 31, 2014 was $109.6 million, or $1.88 per share, compared to $79.5 million, or $1.69 per share, for the year ended December 31, 2013, an increase of 11% per share. The growth in AFFO per share was driven primarily by the Company’s strong acquisition activity.
Adjusted EBITDA for the year ended December 31, 2014 was $166.3 million, compared to $128.8 million for the year ended December 31, 2013, an increase of 29%. Net income for the year ended December 31, 2014 was $44.9 million, or $0.77 per share, compared to $23.1 million, or $0.49 per share, for the year ended December 31, 2013.
Portfolio Update
Acquisitions:
During the fourth quarter, the Company completed three transactions acquiring 34 properties in seven states with three operators for $340.1 million, comprised of the following:
| • | One SNF in Kentucky for $4.6 million triple-net leased to existing operator Diversicare at an initial annual cash yield of 10.0%, Diversicare is an operator of 52 facilities in nine states, 13 of which they lease from Aviv |
| • | Two SNFs in Texas for $28.5 million triple-net leased to existing operator Fundamental at an initial annual cash yield of 9.0%, Fundamental is an operator of 77 facilities in eight states, 19 of which they lease from Aviv |
| • | 28 properties consisting of 23 SNFs, four assisted livings facilities, one independent living facility and one office building for $305 million triple-net leased to new Aviv operator Laurel Health Care at an initial cash yield of 8.5%, Laurel is an operator of 42 facilities in five states |
| • | Two land parcels in Ohio for the new construction of two separate ALF/Memory Care facilities |
For the year ended December 31, 2014, the Company has completed 19 transactions acquiring 69 properties in 15 states with 10 operators for $707 million at a blended initial annual cash yield of 8.9%. The Company also invested $58.1 million through December 31, 2014 for property reinvestment and new construction and acquired five land parcels for $11.9 million for planned new construction projects.
During the first quarter of 2015, the Company completed one transaction acquiring one SNF facility for $4.5 million.
Dispositions:
During the fourth quarter, the Company sold one SNF facility recording a net GAAP loss of $0.6 million.
3
As of December 31, 2014, the Company sold eight properties for $2.4 million recording $2.3 million of impairments and a net GAAP loss of $2.5 million related to such sales. Five of the eight properties were closed in conjunction with the operators agreeing to continue to pay the Company 90% of the remaining contractual rent owed of approximately $8.1 million under the cross-defaulted existing triple-net lease.
Balance Sheet and Liquidity
As of December 31, 2014, the Company had $10 million of cash and $245 million of availability on its $600 million unsecured credit facility. As of today, the Company has $440 million outstanding under its credit facility.
Dividends
On November 20, 2014, the Company announced that its Board of Directors declared a dividend for the fourth quarter of $0.36 per share. The dividend was paid in cash on December 19, 2014 to stockholders of record on December 12, 2014.
Full Year 2015 AFFO Guidance
In light of the pending merger with Omega noted above, the Company will not provide 2015 guidance.
Conference Call and Webcast Information
A conference call to review the fourth quarter 2014 earnings and year end results will take place tomorrow, February 24, 2015 at 9:00 a.m. Central time / 10:00 a.m. Eastern time. The dial-in number for the conference call is (888) 278-8471 (U.S.) or (913) 312-0693 (International). The participant passcode is 6933393. The conference call can also be accessed via webcast at www.avivreit.com under the Investor Relations tab. A replay of the call will be available for approximately two weeks on the Company’s website or by calling (888) 203-1112, access code 6933393.
About Aviv
Aviv REIT, Inc., based in Chicago, is a real estate investment trust that specializes in owning post-acute and long-term care SNFs and other healthcare properties. Aviv is one of the largest owners of SNFs in the United States and has been in the business for over 30 years. As of today, the Company owns 347 properties that are triple-net leased to 37 operators in 30 states.
For more information about the Company, please visit our website at www.avivreit.com or contact:
Craig Bernfield, Chairman & Chief Executive Officer, at 312-855-0930.
Forward-Looking Statements
The information presented herein includes forward-looking statements within the meaning of Section 27A of the Securities Act of 1933, as amended and Section 21E of the Securities Exchange Act of 1934, as amended. Forward-looking statements provide our current expectations or forecasts of future events. Forward-looking statements include statements about our expectations, beliefs, intentions, plans, objectives, goals, strategies, future events, performance and underlying assumptions and other statements that are not historical facts. Examples of forward-looking statements include all statements regarding our expected future financial position, results of operations, cash flows, liquidity, business strategy, projected growth opportunities and potential acquisitions and plans, objectives of management for future operations and completion of the proposed merger transaction with Omega. You can identify forward-looking statements by their use of forward-looking words, such as “may,” “will,” “anticipate,” “expect,” “believe,” “estimate,” “intend,” “plan,” “should,” “seek” or comparable terms, or the negative use of those words, but the absence of these words does not necessarily mean that a statement is not forward-looking.
These forward-looking statements are made based on our current expectations and beliefs concerning future events affecting us and are subject to uncertainties and factors relating to our operations and business environment, all of which are difficult to
4
predict and many of which are beyond our control, that could cause our actual results to differ materially from those matters expressed in or implied by these forward-looking statements. Important factors, risks and uncertainties that could cause actual results to differ materially from our expectations include those disclosed under Part I, Item 1A, “Risk Factors” in our Annual Report on Form 10-K for the year ended December 31, 2013, Part II, Item 1A, “Risk Factors” in our Quarterly Report on Form 10-Q for the quarter ended March 31, 2014 and elsewhere in filings made by us with the Securities and Exchange Commission (the “SEC”). These factors include, among others: uncertainties relating to the operations of our operators, including those relating to reimbursement by government and other third-party payors, compliance with regulatory requirements and occupancy levels; our ability to successfully engage in strategic acquisitions and investments; competition in the acquisition and ownership of healthcare properties; our ability to monitor our portfolio; environmental liabilities associated with our properties; our ability to re-lease or sell any of our properties; the availability and cost of capital; changes in interest rates; the amount and yield of any additional investments; changes in tax laws and regulations affecting real estate investment trusts (REITs); our ability to maintain our status as a REIT; the ability of Aviv and Omega to close the proposed transaction; risks relating to the integration of Aviv’s operations and employees into Omega and the possibility that the anticipated synergies and other benefits of the proposed acquisition will not be realized or will not be realized within the expected timeframe; the outcome of any legal proceedings related to the proposed transaction; and other factors identified in Aviv’s and Omega’s filings with the SEC.
There may be additional risks of which we are presently unaware or that we currently deem immaterial. You are cautioned not to place undue reliance on these forward-looking statements, which speak only as of the date as of which such statements are made. Forward-looking statements are not guarantees of future performance. Except as required by law, we do not undertake any responsibility to release publicly any revisions to these forward-looking statements to take into account events or circumstances that occur after the date as of which such statements are made or to update you on the occurrence of any unanticipated events which may cause actual results to differ from those expressed or implied by the forward-looking statements contained herein.
Additional Information about the Proposed Transaction and Where to Find It
This press release does not constitute an offer to sell or the solicitation of an offer to buy any securities or a solicitation of any proxy, vote or approval. In connection with the proposed transaction, Omega filed with the SEC a registration statement on Form S-4 containing a preliminary joint proxy statement/prospectus. The information in the preliminary joint proxy statement/prospectus is not complete and may be changed. The definitive joint proxy statement/prospectus will be mailed to stockholders of Omega and Aviv after the registration statement is declared effective by the SEC. INVESTORS ARE URGED TO READ THE JOINT PROXY STATEMENT/PROSPECTUS (INCLUDING ALL AMENDMENTS AND SUPPLEMENTS THERETO) AND OTHER RELEVANT DOCUMENTS TO BE FILED WITH THE SEC CAREFULLY AND IN THEIR ENTIRETY WHEN THEY BECOME AVAILABLE BECAUSE THEY WILL CONTAIN IMPORTANT INFORMATION ABOUT THE PROPOSED TRANSACTION.
Investors may obtain free copies of the registration statement, the joint proxy statement/prospectus and other relevant documents filed by Omega and Aviv with the SEC (if and when they become available) through the website maintained by the SEC at www.sec.gov. Copies of the documents filed by Omega with the SEC will also be available free of charge on Omega’s website at www.omegahealthcare.com and copies of the documents filed by Aviv with the SEC are available free of charge on Aviv’s website at www.avivreit.com.
Omega, Aviv and their respective directors and executive officers may be deemed to be participants in the solicitation of proxies from Omega’s and Aviv’s shareholders in respect of the proposed transaction. Information regarding Omega’s directors and executive officers can be found in Omega’s definitive proxy statement filed with the SEC on April 29, 2014. Information regarding Aviv’s directors and executive officers can be found in Aviv’s definitive proxy statement filed with the SEC on April 15, 2014. Additional information regarding the interests of such potential participants will be included in the joint proxy statement/prospectus and other relevant documents filed with the SEC in connection with the proposed transaction if and when they become available. These documents are available free of charge on the SEC’s website and from Omega and Aviv, as applicable, using the sources indicated above.
5
Aviv REIT, Inc.
Consolidated Statements of Operations
(unaudited, in thousands except share and per share data)
| Three Months Ended December 31, | Year ended December 31, | |||||||||||||||
| 2014 | 2013 | 2014 | 2013 | |||||||||||||
| Revenues |
||||||||||||||||
| Rental income |
$ | 50,005 | $ | 37,307 | $ | 177,947 | $ | 136,513 | ||||||||
| Interest on loans and financing lease |
1,220 | 1,128 | 4,483 | 4,400 | ||||||||||||
| Interest and other income |
380 | 26 | 1,612 | 154 | ||||||||||||
|
|
|
|
|
|
|
|
|
|||||||||
| Total revenues |
51,605 | 38,461 | 184,042 | 141,067 | ||||||||||||
| Expenses |
||||||||||||||||
| Interest expense incurred |
13,191 | 11,186 | 49,680 | 40,785 | ||||||||||||
| Amortization of deferred financing costs |
998 | 943 | 3,942 | 3,459 | ||||||||||||
| Depreciation and amortization |
12,553 | 8,826 | 44,023 | 33,226 | ||||||||||||
| General and administrative |
7,079 | 5,737 | 24,039 | 26,886 | ||||||||||||
| Transaction costs |
4,788 | 1,208 | 8,601 | 3,114 | ||||||||||||
| Loss on impairment |
— | 500 | 2,341 | 500 | ||||||||||||
| Reserve for uncollectible loans and other receivables |
14 | 12 | 3,523 | 68 | ||||||||||||
| Loss (gain) on sale of assets, net |
60 | (990 | ) | 2,518 | (1,016 | ) | ||||||||||
| Loss on extinguishment of debt |
— | — | 501 | 10,974 | ||||||||||||
|
|
|
|
|
|
|
|
|
|||||||||
| Total expenses |
38,683 | 27,422 | 139,168 | 117,996 | ||||||||||||
|
|
|
|
|
|
|
|
|
|||||||||
| Net income |
12,922 | 11,039 | 44,874 | 23,071 | ||||||||||||
| Net income allocable to noncontrolling interests—operating partnership |
(2,398 | ) | (4,269 | ) | (9,082 | ) | (6,010 | ) | ||||||||
|
|
|
|
|
|
|
|
|
|||||||||
| Net income allocable to common stockholders |
$ | 10,524 | $ | 6,770 | $ | 35,792 | $ | 17,061 | ||||||||
|
|
|
|
|
|
|
|
|
|||||||||
| Earnings per common share: |
||||||||||||||||
| Basic: |
||||||||||||||||
| Net income allocable to common stockholders |
$ | 0.22 | $ | 0.22 | $ | 0.80 | $ | 0.51 | ||||||||
| Diluted: |
||||||||||||||||
| Net income allocable to common stockholders |
$ | 0.21 | $ | 0.22 | $ | 0.77 | $ | 0.49 | ||||||||
| Weighted average common shares outstanding: |
||||||||||||||||
| Basic |
47,755,148 | 37,534,676 | 44,629,901 | 33,700,834 | ||||||||||||
| Diluted |
61,373,736 | 50,950,662 | 58,166,924 | 44,324,214 | ||||||||||||
| Dividends declared per common share |
$ | 0.36 | $ | 0.36 | $ | 1.44 | $ | 1.40 | ||||||||
6
Aviv REIT, Inc.
Reconciliations of Net Income to EBITDA and Adjusted EBITDA 1
(unaudited, in thousands)
| Three Months Ended December 31, | Year Ended December 31, | |||||||||||||||
| 2014 | 2013 | 2014 | 2013 | |||||||||||||
| Net income |
$ | 12,922 | $ | 11,039 | $ | 44,874 | $ | 23,071 | ||||||||
| Interest expense, net |
13,191 | 11,186 | 49,680 | 40,784 | ||||||||||||
| Amortization of deferred financing costs |
998 | 943 | 3,942 | 3,459 | ||||||||||||
| Depreciation and amortization |
12,553 | 8,826 | 44,023 | 33,226 | ||||||||||||
|
|
|
|
|
|
|
|
|
|||||||||
| EBITDA |
39,664 | 31,994 | 142,519 | 100,540 | ||||||||||||
| Loss on impairment |
— | 500 | 2,341 | 500 | ||||||||||||
| Loss (gain) on sale of assets, net |
60 | (990 | ) | 2,518 | (1,016 | ) | ||||||||||
| Transaction costs |
4,788 | 1,208 | 8,601 | 3,114 | ||||||||||||
| Write-off of straight-line rents |
170 | — | 1,549 | 2,887 | ||||||||||||
| Non-cash stock-based compensation |
1,258 | 823 | 4,861 | 11,752 | ||||||||||||
| Loss on extinguishment of debt |
— | — | 501 | 10,974 | ||||||||||||
| Reserve for uncollectible loan receivables |
195 | — | 3,406 | 11 | ||||||||||||
|
|
|
|
|
|
|
|
|
|||||||||
| Adjusted EBITDA |
$ | 46,135 | $ | 33,535 | $ | 166,296 | $ | 128,762 | ||||||||
|
|
|
|
|
|
|
|
|
|||||||||
| (1) | See definitions and footnotes on pages 17 and 18 |
Aviv REIT, Inc.
Reconciliations of Net Income to FFO, Normalized FFO and AFFO 1
(unaudited, in thousands except per share data)
| Three Months Ended December 31, | Year Ended December 31, | |||||||||||||||
| 2014 | 2013 | 2014 | 2013 | |||||||||||||
| Net income |
$ | 12,922 | $ | 11,039 | $ | 44,874 | $ | 23,071 | ||||||||
| Depreciation and amortization |
12,553 | 8,826 | 44,023 | 33,226 | ||||||||||||
| Loss on impairment |
— | 500 | 2,341 | 500 | ||||||||||||
| Loss (gain) on sale of assets, net |
60 | (990 | ) | 2,518 | (1,016 | ) | ||||||||||
|
|
|
|
|
|
|
|
|
|||||||||
| FFO |
25,535 | 19,375 | 93,756 | 55,781 | ||||||||||||
| Loss on extinguishment of debt |
— | — | 501 | 10,974 | ||||||||||||
| Reserve for uncollectible loan receivables |
195 | — | 3,406 | 11 | ||||||||||||
| Severance cost |
— | 276 | — | 276 | ||||||||||||
| Transaction costs |
4,788 | 1,208 | 8,601 | 3,114 | ||||||||||||
|
|
|
|
|
|
|
|
|
|||||||||
| Normalized FFO |
30,518 | 20,859 | 106,264 | 70,156 | ||||||||||||
| Amortization of deferred financing costs |
998 | 943 | 3,942 | 3,459 | ||||||||||||
| Non-cash stock-based compensation |
1,258 | 823 | 4,861 | 11,752 | ||||||||||||
| Straight-line rental income, net |
(1,368 | ) | (1,480 | ) | (4,788 | ) | (4,478 | ) | ||||||||
| Rental income from intangible amortization, net |
(127 | ) | (272 | ) | (666 | ) | (1,369 | ) | ||||||||
|
|
|
|
|
|
|
|
|
|||||||||
| AFFO |
$ | 31,279 | $ | 20,873 | $ | 109,613 | $ | 79,520 | ||||||||
|
|
|
|
|
|
|
|
|
|||||||||
| Weighted average common shares and units outstanding, basic |
58,637 | 49,210 | 55,958 | 45,573 | ||||||||||||
|
|
|
|
|
|
|
|
|
|||||||||
| Weighted average common shares and units outstanding, diluted |
61,374 | 50,951 | 58,167 | 47,104 | ||||||||||||
|
|
|
|
|
|
|
|
|
|||||||||
| AFFO per share and unit, basic |
$ | 0.53 | $ | 0.42 | $ | 1.96 | $ | 1.74 | ||||||||
|
|
|
|
|
|
|
|
|
|||||||||
| AFFO per share and unit, diluted |
$ | 0.51 | $ | 0.41 | $ | 1.88 | $ | 1.69 | ||||||||
|
|
|
|
|
|
|
|
|
|||||||||
| (1) | See definitions and footnotes on pages 17 and 18 |
7
Aviv REIT, Inc.
Consolidated Balance Sheets
(unaudited, in thousands except share data)
| December 31, 2014 |
December 31, 2013 |
|||||||
| Assets |
||||||||
| Income producing property |
||||||||
| Land |
$ | 190,300 | $ | 138,150 | ||||
| Buildings and improvements |
1,845,992 | 1,138,173 | ||||||
| Assets under direct financing leases |
11,291 | 11,175 | ||||||
|
|
|
|
|
|||||
| 2,047,583 | 1,287,498 | |||||||
| Less accumulated depreciation |
(188,286 | ) | (147,302 | ) | ||||
| Construction in progress and land held for development |
23,150 | 23,292 | ||||||
|
|
|
|
|
|||||
| Net real estate |
1,882,447 | 1,163,488 | ||||||
| Cash and cash equivalents |
10,036 | 50,764 | ||||||
| Straight-line rent receivable, net |
45,368 | 40,580 | ||||||
| Tenant receivables, net |
4,095 | 1,647 | ||||||
| Deferred finance costs, net |
19,024 | 16,643 | ||||||
| Loan receivables, net |
42,697 | 41,686 | ||||||
| Other assets |
16,763 | 15,625 | ||||||
|
|
|
|
|
|||||
| Total assets |
$ | 2,020,430 | $ | 1,330,433 | ||||
|
|
|
|
|
|||||
| Liabilities and equity |
||||||||
| Secured loans |
$ | 193,418 | $ | 13,654 | ||||
| Unsecured notes payable |
652,292 | 652,752 | ||||||
| Line of credit |
355,000 | 20,000 | ||||||
| Accrued interest payable |
15,126 | 15,284 | ||||||
| Dividends and distributions payable |
— | 17,694 | ||||||
| Accounts payable and accrued expenses |
18,582 | 10,555 | ||||||
| Tenant security and escrow deposits |
26,259 | 21,586 | ||||||
| Other liabilities |
9,805 | 10,463 | ||||||
|
|
|
|
|
|||||
| Total liabilities |
1,270,482 | 761,988 | ||||||
| Equity: |
||||||||
| Stockholders’ equity |
||||||||
| Common stock (par value $0.01; 48,425,224 and 37,593,910 shares issued and outstanding, as of December 31, 2014 and December 31, 2013, respectively) |
484 | 376 | ||||||
| Additional paid-in-capital |
737,262 | 523,658 | ||||||
| Accumulated deficit |
(119,039 | ) | (89,742 | ) | ||||
|
|
|
|
|
|||||
| Total stockholders’ equity |
618,707 | 434,292 | ||||||
| Noncontrolling interests—operating partnership |
131,241 | 134,153 | ||||||
|
|
|
|
|
|||||
| Total equity |
749,948 | 568,445 | ||||||
|
|
|
|
|
|||||
| Total liabilities and equity |
$ | 2,020,430 | $ | 1,330,433 | ||||
|
|
|
|
|
|||||
8
Aviv REIT, Inc.
Consolidated Statements of Cash Flows
(unaudited, in thousands)
| Year Ended December 31 | ||||||||
| 2014 | 2013 | |||||||
| Operating activities |
||||||||
| Net income |
$ | 44,874 | $ | 23,071 | ||||
| Adjustments to reconcile net income to net cash provided by operating activities: |
||||||||
| Depreciation and amortization |
44,023 | 33,226 | ||||||
| Amortization of deferred financing costs |
3,942 | 3,459 | ||||||
| Accretion of debt premium |
(539 | ) | (507 | ) | ||||
| Straight-line rental income, net |
(4,788 | ) | (4,478 | ) | ||||
| Rental income from intangible amortization, net |
(666 | ) | (1,369 | ) | ||||
| Non-cash stock-based compensation |
4,861 | 11,752 | ||||||
| Loss (gain) on sale of assets, net |
2,518 | (1,016 | ) | |||||
| Non-cash loss on extinguishment of debt |
494 | 5,161 | ||||||
| Loss on impairment |
2,341 | 500 | ||||||
| Reserve for uncollectible secured loan and other receivables |
3,523 | 68 | ||||||
| Changes in assets and liabilities: |
||||||||
| Tenant receivables |
(2,577 | ) | (3,511 | ) | ||||
| Other assets |
(1,356 | ) | (5,229 | ) | ||||
| Accounts payable and accrued expenses |
2,880 | 3,949 | ||||||
| Tenant security deposits and other liabilities |
5,079 | 2,277 | ||||||
|
|
|
|
|
|||||
| Net cash provided by operating activities |
104,609 | 67,353 | ||||||
| Investing activities |
||||||||
| Purchase of real estate |
(706,737 | ) | (197,388 | ) | ||||
| Proceeds from sales of real estate , net |
2,277 | 15,549 | ||||||
| Capital improvements |
(14,997 | ) | (12,003 | ) | ||||
| Development projects |
(43,083 | ) | (18,738 | ) | ||||
| Loan receivables received from others |
19,642 | 4,086 | ||||||
| Loan receivables funded to others |
(24,376 | ) | (10,407 | ) | ||||
|
|
|
|
|
|||||
| Net cash used in investing activities |
(767,274 | ) | (218,901 | ) | ||||
9
Aviv REIT, Inc.
Consolidated Statements of Cash Flows (continued)
(unaudited, in thousands)
| Year Ended December 31 | ||||||||
| 2014 | 2013 | |||||||
| Financing activities |
||||||||
| Borrowings of debt |
$ | 668,000 | $ | 470,000 | ||||
| Repayment of debt |
(153,157 | ) | (488,241 | ) | ||||
| Payment of financing costs |
(6,980 | ) | (10,448 | ) | ||||
| Capital contributions |
60 | 575 | ||||||
| Proceeds from issuance of common stock |
221,720 | 303,600 | ||||||
| Cost of raising capital |
(10,558 | ) | (25,829 | ) | ||||
| Shares issued for settlement of vested stock and exercised stock options, net |
1,707 | — | ||||||
| Cash distributions to partners |
(20,215 | ) | (16,314 | ) | ||||
| Cash dividends to stockholders |
(78,640 | ) | (48,907 | ) | ||||
|
|
|
|
|
|||||
| Net cash provided by financing activities |
621,937 | 184,436 | ||||||
|
|
|
|
|
|||||
| Net (decrease) increase in cash and cash equivalents |
(40,728 | ) | 32,888 | |||||
| Cash and cash equivalents: |
||||||||
| Beginning of year |
50,764 | 17,876 | ||||||
|
|
|
|
|
|||||
| End of year |
$ | 10,036 | $ | 50,764 | ||||
|
|
|
|
|
|||||
| Supplemental cash flow information |
||||||||
| Cash paid for interest |
$ | 50,972 | $ | 40,008 | ||||
| Supplemental disclosure of noncash activity |
||||||||
| Accrued dividends payable to stockholders |
$ | — | $ | 13,551 | ||||
| Accrued distributions payable to partners |
$ | — | $ | 4,143 | ||||
| Write-off of straight-line rent receivable, net |
$ | 1,549 | $ | 2,887 | ||||
| Write-off of deferred financing costs, net |
$ | 501 | $ | 5,161 | ||||
10
Aviv REIT, Inc.
Portfolio Summary 1
Portfolio Composition
| Property Type |
Property Count |
Number of Beds |
Square Feet |
Investment (GBV) |
Annualized Cash Rent |
% of Total Rent |
||||||||||||||||||
| Skilled Nursing |
285 | 26,879 | 10,225 | $ | 1,661,828 | $ | 181,184 | 82.8 | % | |||||||||||||||
| Senior Housing |
37 | 2,555 | 1,677 | 291,877 | 29,971 | 13.7 | % | |||||||||||||||||
| Other Healthcare Properties |
24 | 212 | 255 | 93,878 | 7,588 | 3.5 | % | |||||||||||||||||
|
|
|
|
|
|
|
|
|
|
|
|
|
|||||||||||||
| Total |
346 | 29,646 | 12,157 | $ | 2,047,583 | $ | 218,743 | 100.0 | % | |||||||||||||||
|
|
|
|
|
|
|
|
|
|
|
|
|
|||||||||||||
Portfolio Performance
| EBITDARM | EBITDAR | Facility Revenue Mix | EBITDAR | |||||||||||||||||||||||||
| Core Portfolio |
Coverage | Coverage | Occupancy | Private Pay | Medicare | Medicaid | Margin | |||||||||||||||||||||
| Skilled Nursing |
1.74x | 1.35x | 77.4 | % | 21.3 | % | 25.1 | % | 53.6 | % | 13.6 | % | ||||||||||||||||
| Senior Housing |
1.22x | 1.04x | 77.0 | % | 85.8 | % | 4.2 | % | 10.0 | % | 23.2 | % | ||||||||||||||||
| Other Healthcare Properties |
6.37x | 5.70x | 85.3 | % | 89.4 | % | 10.6 | % | 0.0 | % | 34.0 | % | ||||||||||||||||
|
|
|
|
|
|
|
|
|
|
|
|
|
|
|
|||||||||||||||
| Total |
1.77x | 1.39x | 77.4 | % | 26.0 | % | 23.8 | % | 50.2 | % | 14.6 | % | ||||||||||||||||
|
|
|
|
|
|
|
|
|
|
|
|
|
|
|
|||||||||||||||
State Diversification
| Investment | Annualized Rent | |||||||||||||||
| State |
Properties | (GBV) | $ | % | ||||||||||||
| Texas |
68 | $ | 316,453 | $ | 36,832 | 16.8 | % | |||||||||
| Ohio |
38 | 300,867 | 30,621 | 14.0 | % | |||||||||||
| California |
39 | 182,752 | 21,046 | 9.6 | % | |||||||||||
| Conneticut |
6 | 109,474 | 11,149 | 5.1 | % | |||||||||||
| Michigan |
12 | 124,117 | 10,619 | 4.9 | % | |||||||||||
| Washington |
15 | 122,335 | 10,566 | 4.8 | % | |||||||||||
| Massachusetts |
10 | 88,205 | 9,901 | 4.5 | % | |||||||||||
| Pennsylvania |
10 | 79,746 | 9,433 | 4.3 | % | |||||||||||
| Missouri |
18 | 93,073 | 9,307 | 4.3 | % | |||||||||||
| Kentucky |
11 | 64,658 | 7,005 | 3.2 | % | |||||||||||
| Other States |
119 | 565,903 | 62,264 | 28.5 | % | |||||||||||
|
|
|
|
|
|
|
|
|
|||||||||
| 346 | $ | 2,047,583 | $ | 218,743 | 100.0 | % | ||||||||||
|
|
|
|
|
|
|
|
|
|||||||||
Operator Diversification
| Properties | Investment | Annualized Rent | ||||||||||||||||||||||
| Operator (Location) |
Aviv | Total | (GBV) | $ | % | States | ||||||||||||||||||
| Laurel Health Care Company |
29 | 42 | $ | 304,493 | $ | 26,376 | 12.1 | % | 5 | |||||||||||||||
| Daybreak (Denton, TX) |
50 | 69 | 165,122 | 21,949 | 10.0 | % | 2 | |||||||||||||||||
| Saber (Bedford Heights, OH) |
30 | 79 | 186,043 | 21,538 | 9.8 | % | 6 | |||||||||||||||||
| EmpRes (Vancouver, WA) |
23 | 49 | 196,267 | 20,348 | 9.3 | % | 6 | |||||||||||||||||
| Maplewood (Westport, CT) |
14 | 14 | 203,024 | 18,768 | 8.6 | % | 3 | |||||||||||||||||
| Fundamental (Sparks, MD) |
19 | 75 | 177,289 | 16,902 | 7.7 | % | 8 | |||||||||||||||||
| Preferred Care (Plano, TX) |
17 | 111 | 68,982 | 10,761 | 4.9 | % | 12 | |||||||||||||||||
| Diversicare (Brentwood, TN) |
13 | 52 | 95,139 | 9,554 | 4.4 | % | 9 | |||||||||||||||||
| Sun Mar (Brea, CA) |
13 | 25 | 71,144 | 9,167 | 4.2 | % | 2 | |||||||||||||||||
| Providence (National City, CA) |
10 | 13 | 48,350 | 5,258 | 2.4 | % | 5 | |||||||||||||||||
| Other 28 Operators |
128 | 402 | 531,731 | 58,122 | 26.6 | % | ||||||||||||||||||
|
|
|
|
|
|
|
|
|
|
|
|||||||||||||||
| 346 | 931 | $ | 2,047,583 | $ | 218,743 | 100.0 | % | |||||||||||||||||
|
|
|
|
|
|
|
|
|
|
|
|||||||||||||||
| (1) | Dollars and square feet in thousands. Data as of December 31, 2014. Coverage, occupancy, margin and revenue mix information is provided on a trailing twelve month basis through September 30, 2014. Annualized cash rent for leases in place as of December 31, 2014 and includes income from a deferred financing lease. Totals may not add due to rounding. |
11
Aviv REIT, Inc.
Portfolio Summary
State Occupancy 1
| State |
Aviv Occupancy |
State Average |
Variance | |||||||||
| Texas |
71.5 | % | 70.8 | % | 0.7 | % | ||||||
| Ohio |
75.5 | % | 84.3 | % | (8.8 | %) | ||||||
| California |
91.5 | % | 85.5 | % | 6.0 | % | ||||||
| Conneticut |
70.9 | % | 87.7 | % | N/A | |||||||
| Michigan |
94.8 | % | 85.0 | % | 9.8 | % | ||||||
| Washington |
84.6 | % | 80.4 | % | 4.2 | % | ||||||
| Massachusetts |
79.5 | % | 87.0 | % | (7.5 | %) | ||||||
| Pennsylvania |
86.1 | % | 90.4 | % | (4.3 | %) | ||||||
| Missouri |
70.9 | % | 72.3 | % | (1.4 | %) | ||||||
| Kentucky |
84.0 | % | 87.8 | % | (3.8 | %) | ||||||
Lease Maturity Schedule 2
| Year |
Number of Properties |
% of Total Rent |
||||||
| 2015 |
4 | 1.0 | % | |||||
| 2016 |
3 | 1.2 | % | |||||
| 2017 |
11 | 2.8 | % | |||||
| 2018 |
29 | 8.3 | % | |||||
| 2019 |
4 | 1.1 | % | |||||
| Thereafter |
291 | 85.6 | % | |||||
|
|
|
|
|
|||||
| Total |
342 | 100.0 | % | |||||
|
|
|
|
|
|||||
| (1) | Occupancy information as of September 30, 2014. State occupancy represents nursing facility occupancies per American Health Care Association. Aviv only has assisted living properties in Connecticut. |
| (2) | Excludes five development properties with rent start dates in the future and one office building with two leases. |
12
Aviv REIT, Inc.
Portfolio Summary as of December 31, 2014
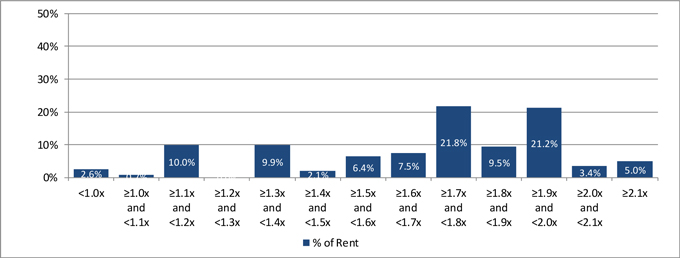
EBITDARM Coverage Distribution
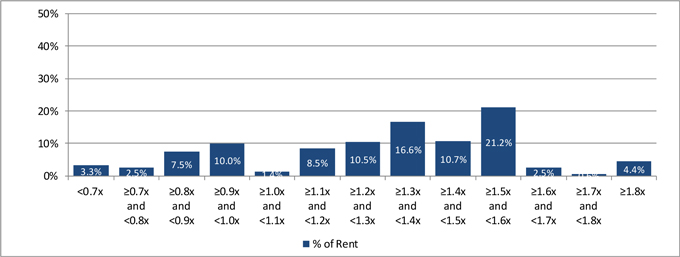
EBITDAR (4% Mgmt Fee) Coverage Distribution
13
Aviv REIT, Inc.
Investment Activity as of December 31, 2014
(in thousands)
2014 Property Reinvestment and New Construction
| Period |
Property Reinvestment |
New Construction |
Total | |||||||||
| Fourth quarter |
$ | 4,704 | $ | 12,767 | $ | 17,471 | ||||||
| Third quarter |
5,027 | 19,597 | 24,624 | |||||||||
| Second quarter |
3,422 | 5,023 | 8,445 | |||||||||
| First quarter |
1,844 | 5,696 | 7,540 | |||||||||
|
|
|
|||||||||||
| $ | 58,080 | |||||||||||
|
|
|
|||||||||||
New Construction Projects
| Operator—Location |
Property Type |
Beds | Expected Opening Date |
Construction in Progress at 12/31/2014 |
Remaining Costs to be Spent |
Total Expected Cost |
Expected Yield |
|||||||||||||||||||||
| Care Meridian—numerous locations |
— | — | — | 807 | 2,929 | 3,736 | 9.5 | % | ||||||||||||||||||||
| Property reinvestment—numerous locations |
— | — | — | 3,759 | 8,425 | 12,184 | — | |||||||||||||||||||||
| Land held for development |
— | — | — | 18,584 | — | 18,584 | — | |||||||||||||||||||||
|
|
|
|
|
|
|
|||||||||||||||||||||||
| Total |
$ | 23,150 | $ | 11,354 | $ | 34,504 | ||||||||||||||||||||||
|
|
|
|
|
|
|
|||||||||||||||||||||||
2014 Acquisitions
| Period |
Property Type | Location | Beds | Amount | Initial Cash Yield |
|||||||||||
| Fourth quarter |
SNF, ALF, ILF | 7 states | 3,211 | 338,100 | 8.5 | % | ||||||||||
| Third quarter |
SNF, ALF | 2 states | 1,420 | $ | 181,800 | 8.7 | % | |||||||||
| Second quarter |
SNF | 4 states | 1,110 | 82,650 | 9.8 | % | ||||||||||
| First quarter |
SNF, ALF, ILF | 4 states | 1,497 | 104,420 | 10.0 | % | ||||||||||
|
|
|
|
|
|
|
|||||||||||
| Total |
7,238 | $ | 706,970 | (1) | 8.9 | % | ||||||||||
|
|
|
|
|
|
|
|||||||||||
| (1) | Excludes $16.4 million paid for five land parcels and entitlements for the construction of two ALFs and a 50-unit expansion to an existing ALF. |
14
Aviv REIT, Inc.
Debt Summary and Capitalization as of December 31, 2014
Debt Maturities
| Year |
Senior Unsecured Notes |
Line of Credit | Mortgage Debt (1) |
GE Debt | Total Debt |
|||||||||||||||
| 2015 |
$ | — | $ | — | $ | 165 | $ | — | $ | 165 | ||||||||||
| 2016 |
— | — | 174 | — | 174 | |||||||||||||||
| 2017 |
— | — | 183 | 2,021 | 2,204 | |||||||||||||||
| 2018 |
— | 355,000 | 192 | 2,335 | 357,527 | |||||||||||||||
| 2019 |
400,000 | — | 202 | 175,644 | 575,846 | |||||||||||||||
| Thereafter |
250,000 | — | 10,165 | — | 260,165 | |||||||||||||||
|
|
|
|
|
|
|
|
|
|
|
|||||||||||
| Subtotal |
650,000 | 355,000 | 11,081 | 180,000 | 1,196,081 | |||||||||||||||
| (Discounts) and premiums, net |
2,292 | — | 2,337 | — | 4,629 | |||||||||||||||
|
|
|
|
|
|
|
|
|
|
|
|||||||||||
| Total debt |
$ | 652,292 | $ | 355,000 | $ | 13,418 | $ | 180,000 | $ | 1,200,710 | ||||||||||
|
|
|
|
|
|
|
|
|
|
|
|||||||||||
| Weighted average interest rate |
5.1 | % | ||||||||||||||||||
|
|
|
|||||||||||||||||||
| Weighted average maturity in years |
4.8 | |||||||||||||||||||
|
|
|
|||||||||||||||||||
Fixed and Floating Rate Debt
| Amount | % of Total | |||||||
| Fixed rate debt |
||||||||
| Senior unsecured notes |
$ | 652,292 | 54.3 | % | ||||
| Mortgage debt |
13,418 | 1.1 | % | |||||
|
|
|
|
|
|||||
| Total fixed rate debt |
665,710 | 55.4 | % | |||||
| Floating rate debt |
||||||||
| Revolver |
355,000 | 29.6 | % | |||||
| GE debt |
180,000 | 15.0 | % | |||||
|
|
|
|
|
|||||
| Total floating rate debt |
535,000 | 44.6 | % | |||||
|
|
|
|
|
|||||
| Total debt |
$ | 1,200,710 | 100.0 | % | ||||
|
|
|
|
|
|||||
Covenants for Senior Unsecured Notes (2)
| Covenant |
Requirement | Q4 2014 | Q4 2013 | |||||||
| Total debt / total assets |
No greater than 60% | 54 | % | 46 | % | |||||
| Secured debt / total assets |
No greater than 40% | 9 | % | 2 | % | |||||
| Interest coverage |
No less than 2.00x | 3.30x | 3.16x | |||||||
| Unencumbered assets / unsecured debt |
No less than 150% | 181 | % | 185 | % | |||||
Total Market Capitalization
| Shares/units Outstanding |
12/31/2014 Closing Price |
Value | ||||||||||
| Common stock and OP units |
58,729 | $ | 34.48 | $ | 2,024,976 | |||||||
| Total debt |
1,200,710 | |||||||||||
|
|
|
|||||||||||
| Total market capitalization |
$ | 3,225,686 | ||||||||||
|
|
|
|||||||||||
Dollars and shares/units in thousands
| (1) | Mortgage debt was paid in full in January 2015. |
| (2) | Covenants are calculated in accordance with the indenture governing the senior unsecured notes. |
15
Aviv REIT, Inc.
Common Share and OP Unit
Weighted Average Amounts Outstanding
| Q4 2014 | Q4 2013 | YTD Q4 2014 |
YTD Q4 2013 |
|||||||||||||
| Weighted Average Amounts Outstanding for EPS Purposes: |
||||||||||||||||
| Common shares—basic |
47,755,148 | 37,534,676 | 44,629,901 | 33,700,834 | ||||||||||||
| Effect of dilutive securities: |
||||||||||||||||
| OP units |
10,881,474 | 11,675,517 | 11,328,049 | 9,091,974 | ||||||||||||
| Stock options |
2,581,412 | 1,696,726 | 2,136,040 | 1,518,813 | ||||||||||||
| Restricted stock units |
155,702 | 43,714 | 72,934 | 12,568 | ||||||||||||
|
|
|
|
|
|
|
|
|
|||||||||
| Total common shares—diluted |
61,373,736 | 50,950,633 | 58,166,924 | 44,324,189 | ||||||||||||
|
|
|
|
|
|
|
|
|
|||||||||
| Weighted Average Amounts Outstanding for FFO, Normalized FFO and AFFO Purposes: |
||||||||||||||||
| Common shares—basic |
47,755,148 | 37,534,676 | 44,629,901 | 33,700,834 | ||||||||||||
| OP units |
10,881,474 | 11,675,517 | 11,328,049 | 11,872,154 | ||||||||||||
| Total common shares and OP units |
58,636,622 | 49,210,193 | 55,957,950 | 45,572,988 | ||||||||||||
| Effect of dilutive securities: |
||||||||||||||||
| Stock options |
2,581,412 | 1,696,726 | 2,136,040 | 1,518,813 | ||||||||||||
| Restricted stock units |
155,702 | 43,714 | 72,934 | 12,568 | ||||||||||||
|
|
|
|
|
|
|
|
|
|||||||||
| Total common shares and units—diluted |
61,373,736 | 50,950,633 | 58,166,924 | 47,104,369 | ||||||||||||
|
|
|
|
|
|
|
|
|
|||||||||
| Period Ending Amounts Outstanding: |
||||||||||||||||
| Common shares (includes restricted stock) |
48,456,724 | 37,641,160 | ||||||||||||||
| OP units |
10,272,374 | 11,616,283 | ||||||||||||||
|
|
|
|
|
|||||||||||||
| Total common shares and units |
58,729,098 | 49,257,443 | ||||||||||||||
|
|
|
|
|
|||||||||||||
16
Aviv REIT, Inc.
Definitions and Footnotes
EBITDARM Coverage: Represents EBITDARM, which the Company defines as earnings before interest, taxes, depreciation, amortization, rent expense and management fees allocated by the operator to one of its affiliates, of our operators for the applicable period, divided by the rent paid to the Company by its operators during each period.
EBITDAR Coverage: Represents EBITDAR, which the Company defines as earnings before interest, taxes, depreciation, amortization and rent expense, of its operators for the applicable period, divided by the rent paid to Aviv by its operators during such period. Assumes a management fee of 4%.
EBITDAR Margin: Represents the operator’s EBITDAR for the applicable period divided by the operator’s total revenue for the applicable period.
Enterprise Value: Represents equity market capitalization plus net debt. Equity market capitalization is calculated as the number of shares of common stock and units multiplied by the closing price of the Company’s common stock on the last day of the period presented. Net debt represents total debt less cash and cash equivalents.
Portfolio Occupancy: Represents the average daily number of beds at the Company’s properties that are occupied during the applicable period divided by the total number of beds at the Company’s properties that are available for use during the applicable period.
Property Type: ALF = assisted living facility; LTACH = long-term acute care hospital; MOB = medical office building; TBI = traumatic brain injury facility; SNF = skilled nursing facility
State Average Occupancy: Represents the Nursing Facility State Occupancy Rate as reported by American Health Care Association (AHCA). AHCA occupancy data is calculated by dividing the sum of all facility patients in the state occupying certified beds by the sum of all the certified beds in the state reported at the time of the survey corresponding to the period presented. Aviv occupancy represents the state occupancy for the entire portfolio.
Yield: Represents annualized contractual or projected income to be received in cash divided by investment amount.
Portfolio metrics and other statistics are not derived from Aviv’s financial statements but are operating statistics that the Company derives from reports that it receives from its operators pursuant to Aviv’s triple-net leases. As a result, the Company’s portfolio metrics typically lag its own financial statements by approximately one quarter. In order to determine Aviv’s portfolio metrics for the period presented, the metrics are stated only with respect to properties owned by the Company and operated by the same operator for the portion of the period Aviv owned the properties and exclude assets held for sale, closed properties, properties under construction and, with certain exceptions for shorter periods, properties within 24 months of completion of construction. Accordingly, EBITDARM coverage, EBITDAR coverage, EBITDAR margin, portfolio occupancy and quality mix for the twelve months ended September 30, 2014 included 289 core properties of the 313 properties in the Company’s portfolio as of September 30, 2014.
When Aviv refers to the “total rent” of its portfolio, the Company is referring to the total monthly rent due under all of its triple-net leases as of the date specified, calculated based on the first full month following the specified date. Aviv calculates “annualized rent” for properties during a period by utilizing the amount of rent under contract as of the last day of the period and assume that amount of rent was received in respect of such property throughout the entire period.
Non-GAAP Financial Measures
In addition to the results of operations presented in this release, we use financial measures in this release that are derived on the basis of methodologies other than in accordance with United States generally accepted accounting principles (GAAP). We derive these non-GAAP measures as follows:
| • | FFO is defined by the National Association of Real Estate Investment Trusts, or NAREIT, as net income (computed in accordance with GAAP), excluding gains and losses from sales of property (net) and impairments of depreciated real estate, plus real estate depreciation and amortization (excluding amortization of deferred financing costs) and after adjustments for unconsolidated partnerships and joint ventures. Applying the NAREIT definition to our financial statements results in FFO representing net income before depreciation and amortization, loss on impairment, and loss (gain) on sale of assets (net). |
| • | Normalized FFO represents FFO before loss on extinguishment of debt, reserve for uncollectible loan receivables, transaction costs and severance costs. |
| • | AFFO represents Normalized FFO before amortization of deferred financing costs, non-cash stock-based compensation, straight-line rental income (net) and rental income from intangible amortization (net). |
| • | EBITDA represents net income before interest expense (net), amortization of deferred financing costs and depreciation and amortization. |
| • | Adjusted EBITDA represents EBITDA before loss on impairment, loss (gain) on sale of assets (net), transaction costs, write-off of straight-line rents, non-cash stock-based compensation, loss on extinguishment of debt and reserve for uncollectible loan receivables. |
17
Aviv REIT, Inc.
Definitions and Footnotes
Our management uses FFO, Normalized FFO, AFFO, EBITDA and Adjusted EBITDA as important supplemental measures of our operating performance and liquidity. FFO is intended to exclude GAAP historical cost depreciation and amortization of real estate and related assets, which assumes that the value of real estate assets diminishes ratably over time. Historically, however, real estate values have risen or fallen with market conditions. The term FFO was designed by the real estate industry to address this issue and as an indicator of our ability to incur and service debt. Because FFO, Normalized FFO and AFFO exclude depreciation and amortization unique to real estate, impairment, gains and losses from property dispositions and extraordinary items and because EBITDA and Adjusted EBITDA exclude certain non-cash charges and adjustments and amounts spent on interest and taxes, they provide our management with performance measures that, when compared year over year or with other REITs, reflect the impact to operations from trends in occupancy rates, rental rates, operating costs, development activities and, with respect to FFO, Normalized FFO and AFFO, interest costs, in each case providing perspective not immediately apparent from net income. In addition, we believe that FFO, Normalized FFO, AFFO, EBITDA and Adjusted EBITDA are frequently used by securities analysts, investors and other interested parties in the evaluation of REITs.
We offer these measures to assist the users of our financial statements in assessing our financial performance and liquidity under GAAP, but these measures are non-GAAP measures and should not be considered measures of liquidity, alternatives to net income or indicators of any other performance measure determined in accordance with GAAP, nor are they indicative of funds available to fund our cash needs, including our ability to make payments on our indebtedness. In addition, our calculations of these measures are not necessarily comparable to similar measures as calculated by other companies that do not use the same definition or implementation guidelines or interpret the standards differently from us. Investors should not rely on these measures as a substitute for any GAAP measure, including net income, cash flows provided by operating activities or revenues.
18