Attached files
| file | filename |
|---|---|
| 8-K - 8-K - TELEFLEX INC | a2-20x20158xkreearningscon.htm |

1 TELEFLEX INCORPORATED FOURTH QUARTER 2014 EARNINGS CONFERENCE CALL 1
Conference Call Logistics The release, accompanying slides, and replay webcast are available online at www.teleflex.com (click on “Investors”) Telephone replay available by dialing 888-286-8010 or for international calls, 617- 801-6888, pass code number 82954645 2
Introductions Benson Smith Chairman, President and CEO Thomas Powell Executive Vice President and CFO Jake Elguicze Treasurer and Vice President of Investor Relations 3

Forward-Looking Statements/Non-GAAP Financial Measures This presentation and our discussion contain forward-looking information and statements including, but not limited to, our forecasted 2015 constant currency revenue growth, adjusted gross and operating margins and adjusted earnings per share; expected contributions from Vidacare product sales, new product introductions and base volume and core product pricing to our forecasted 2015 revenue growth; expected impact of distributor-to-direct conversions and our acquisition of Mini-Lap on our forecasted 2015 revenue growth and adjusted gross and operating margins; the anticipated unfavorable impact of foreign exchange rates on our 2015 financial results; forecasted 2015 weighted average shares and interest expense; forecasted 2015 pre-tax charges, cash outlays and capital expenditures associated with our 2014 manufacturing footprint realignment plan and annualized savings we expect to achieve through implementation of the plan; and other matters which inherently involve risks and uncertainties which could cause actual results to differ from those projected or implied in the forward–looking statements. These risks and uncertainties are addressed in the Company’s SEC filings, including its most recent Form 10-K. This presentation includes the following non-GAAP financial measures: • Adjusted diluted earnings per share. This measure excludes, depending on the period presented (i) the effect of charges associated with our restructuring programs, as well as goodwill and other asset impairment charges; (ii) losses and other charges, including acquisition and integration costs, charges related to facility consolidations, the establishment of a litigation reserve and a litigation verdict against the Company with respect to a non-operating joint venture, net of, where applicable, specified reversals, including a reversal of liabilities related to certain contingent consideration arrangements and a reversal of a reserve related to a previously announced stock keeping unit benefit program; (iii) amortization of the debt discount on the Company’s convertible notes; (iv) intangible amortization expense; (v) loss on extinguishment of debt; and (vi) tax benefits resulting from the resolution of, or expiration of the statute of limitations with respect to, prior years’ tax matters. In addition, the calculation of diluted shares within adjusted earnings per share gives effect to the anti-dilutive impact of the Company’s convertible note hedge agreements, which reduce the potential economic dilution that otherwise would occur upon conversion of the Company’s senior subordinated convertible notes (under GAAP, the anti-dilutive impact of the convertible note hedge agreements is not reflected in diluted shares). • Constant currency revenue growth. This measure excludes the impact of translating the results of international subsidiaries at different currency exchange rates from period to period. • Adjusted gross margin. This measure excludes, depending on the period presented, certain losses and other charges, primarily related to facility consolidation, acquisition and integration costs. • Adjusted operating margin. This measure excludes, depending on the period presented, (i) the impact of restructuring and other impairment charges; (ii) losses and other charges primarily related to acquisition and integration costs, facility consolidation charges, charges related litigation matters, the reversal of contingent consideration liabilities and the reversal of a reserve with respect to a stock keeping unit rationalization program; and (iii) intangible amortization expense. • Adjusted tax rate. This measure is the percentage of the Company’s adjusted taxes on income from continuing operations to its adjusted income from continuing operations before taxes. Adjusted taxes on income from continuing operations excludes, depending on the period presented, the impact of tax benefits or costs associated with (i) restructuring and impairment charges, (ii) amortization of the debt discount on the Company’s convertible notes, (iii) intangible amortization expense, (iv) the resolution of, or expiration of statutes of limitations with respect to, various prior years’ tax matters and (v) losses and other charges primarily related to related to acquisition and integration costs, facility consolidation charges, charges related to litigation matters and the reversal of contingent consideration liabilities. Reconciliation of these non-GAAP financial measures to the most comparable GAAP measures is contained within this presentation. Unless otherwise noted, the following slides reflect continuing operations. 4
5 FOURTH QUARTER AND FULL YEAR 2014 HIGHLIGHTS 5

Fourth Quarter Highlights Fourth quarter constant currency revenue growth and adjusted earnings per share achievement exceeded our expectations Revenue of $476.0 million, up 5.7% vs. prior year period on an as- reported basis; up 9.0% vs. prior year period on a constant currency basis Adjusted EPS of $1.43, up 5.1% vs. prior year period 6
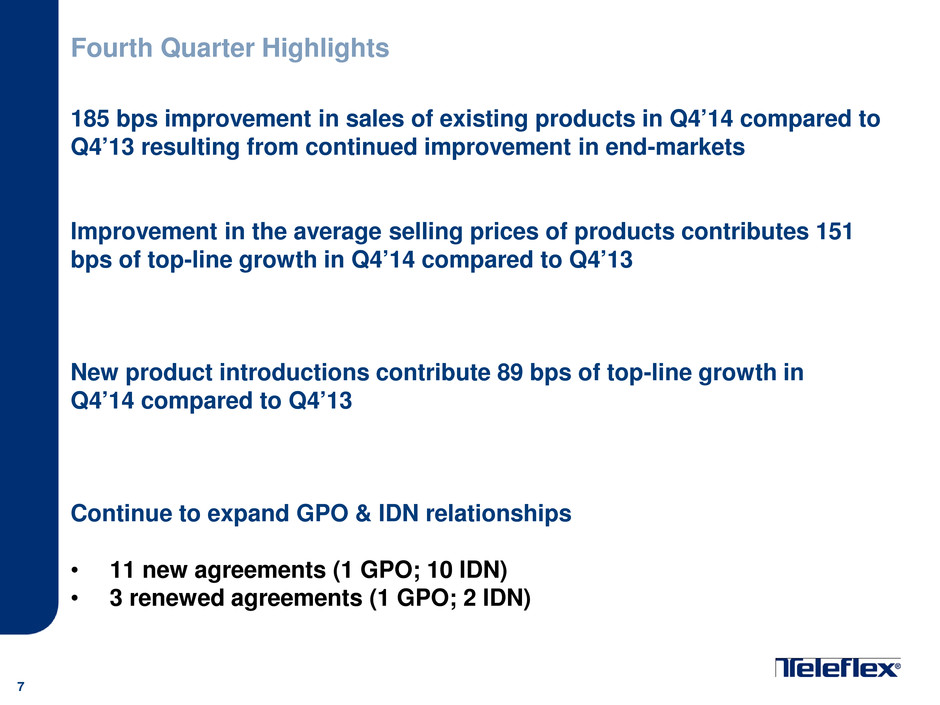
Fourth Quarter Highlights 185 bps improvement in sales of existing products in Q4’14 compared to Q4’13 resulting from continued improvement in end-markets Improvement in the average selling prices of products contributes 151 bps of top-line growth in Q4’14 compared to Q4’13 New product introductions contribute 89 bps of top-line growth in Q4’14 compared to Q4’13 Continue to expand GPO & IDN relationships • 11 new agreements (1 GPO; 10 IDN) • 3 renewed agreements (1 GPO; 2 IDN) 7

Fourth Quarter Highlights Vidacare contributes 3.5% to Teleflex’s constant currency revenue growth • Q4’14 revenue of $23.0 million, ahead of initial internal expectations • Q4’14 revenue up ~ 16% versus Q4’13 on an as-reported basis • FDA approved new pediatric indication for use for the Arrow OnControl Powered Bone Biopsy System 8

Mayo Healthcare Pty Ltd. • Contributed 1.6% to Teleflex’s constant currency revenue growth in Q4; mixture of additional volume and improved pricing • Successful SAP “go-live” in fourth quarter Fourth Quarter Highlights 9

The ARROW® VPS® Vascular Positioning System combines intravascular electrocardiogram (ECG), the intravascular Doppler ultrasound and a software algorithm, to accurately place catheter tips in the lower one-third of the Superior Vena Cava-Cavo Atrial Junction (SVC-CAJ). The system displays a Blue Bullseye on the screen when an accurate placement has been made at the SVC-CAJ. The VPS® Device is cleared to eliminate chest X-ray in adult patients, when a steady Blue Bullseye is achieved. PRODUCT DESCRIPTION PRODUCT UPDATE 10 Article published in Fall 2014 issue of the Journal of the Association for Vascular Access showed the technology can reduce improper positioning of central IV catheters Fourth Quarter Highlights ARROW® VPS® Vascular Positioning System
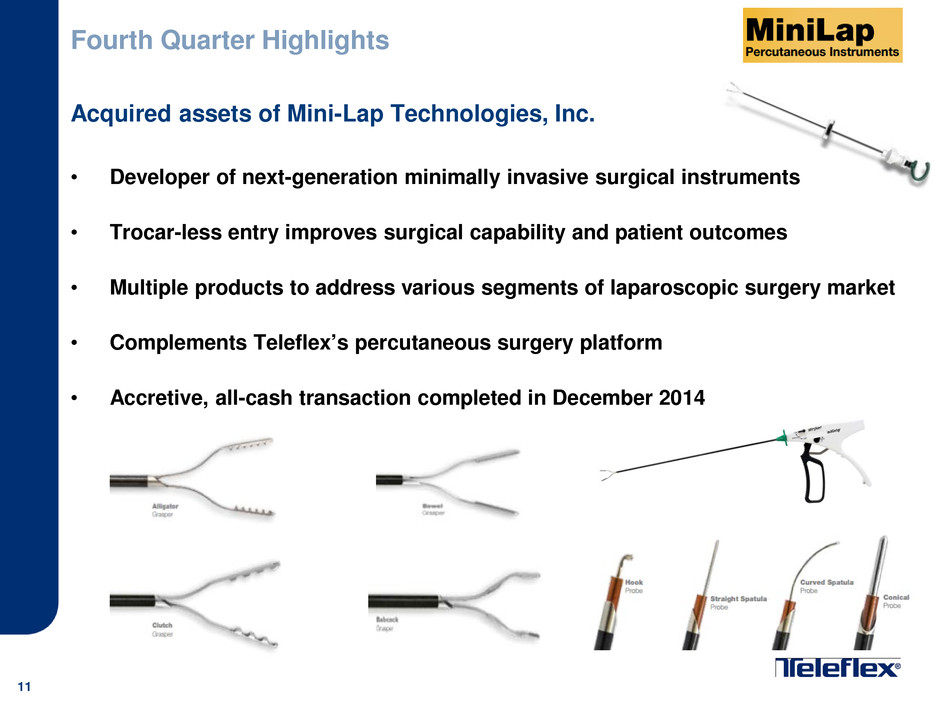
Fourth Quarter Highlights Acquired assets of Mini-Lap Technologies, Inc. • Developer of next-generation minimally invasive surgical instruments • Trocar-less entry improves surgical capability and patient outcomes • Multiple products to address various segments of laparoscopic surgery market • Complements Teleflex’s percutaneous surgery platform • Accretive, all-cash transaction completed in December 2014 11
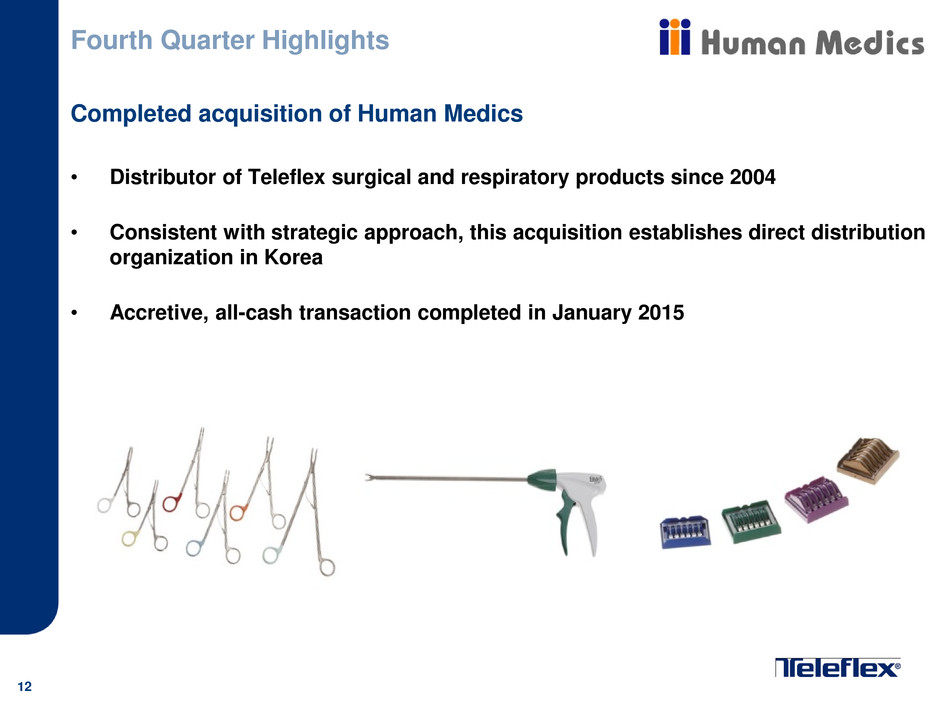
Fourth Quarter Highlights Completed acquisition of Human Medics • Distributor of Teleflex surgical and respiratory products since 2004 • Consistent with strategic approach, this acquisition establishes direct distribution organization in Korea • Accretive, all-cash transaction completed in January 2015 12
Full Year Highlights Revenue of $1.84 billion, up 8.5% vs. prior year on an as-reported basis; up 8.8% vs. prior year on a constant currency basis Adjusted gross margin of 51.5%, up 190 bps vs. prior year Adjusted operating margin of 20.0%, up 70 bps vs. prior year Adjusted EPS of $5.74, up 14.1% vs. prior year 13

14 FOURTH QUARTER 2014 FINANCIAL REVIEW 14
Financial Results Revenue of $476.0 million • Up 5.7% vs. prior year period on an as-reported basis • Up 9.0% vs. prior year period on a constant currency basis Adjusted gross margin of 51.1%, up 110 bps vs. prior year period Adjusted operating margin of 18.4%, down 60 bps vs. prior year period Adjusted tax rate of 14.2%, down 700 bps vs. prior year period Adjusted EPS of $1.43, up 5.1% vs. prior year period Cash flow from operations during 2014 of $290.2 million, up 25.5% vs. prior year 15
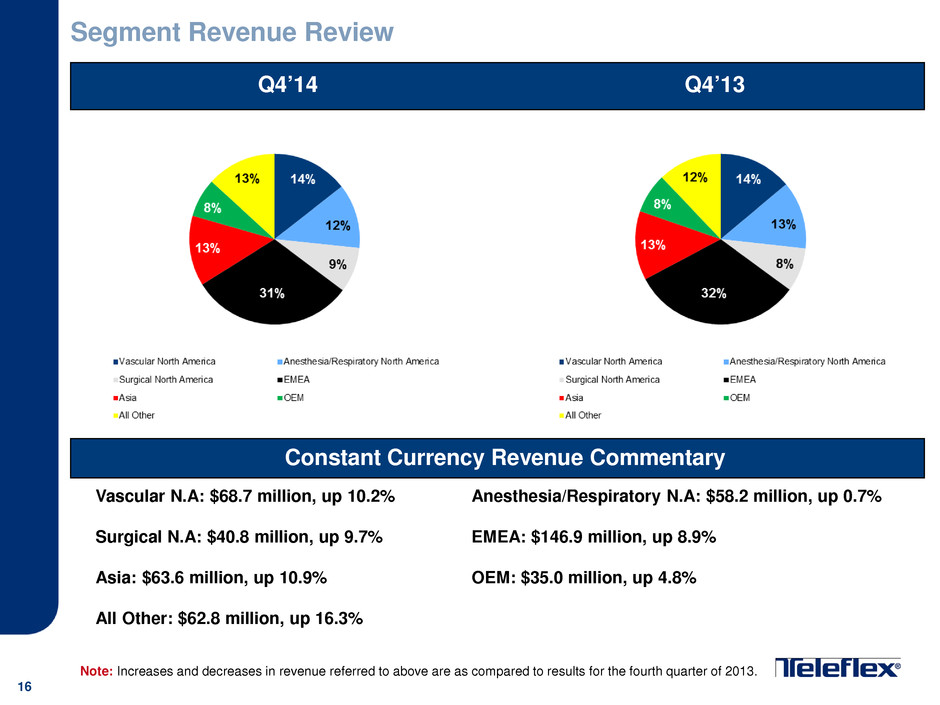
Segment Revenue Review Q4’14 Vascular N.A: $68.7 million, up 10.2% Anesthesia/Respiratory N.A: $58.2 million, up 0.7% Surgical N.A: $40.8 million, up 9.7% EMEA: $146.9 million, up 8.9% Asia: $63.6 million, up 10.9% OEM: $35.0 million, up 4.8% All Other: $62.8 million, up 16.3% Note: Increases and decreases in revenue referred to above are as compared to results for the fourth quarter of 2013. 16 Constant Currency Revenue Commentary Q4’13
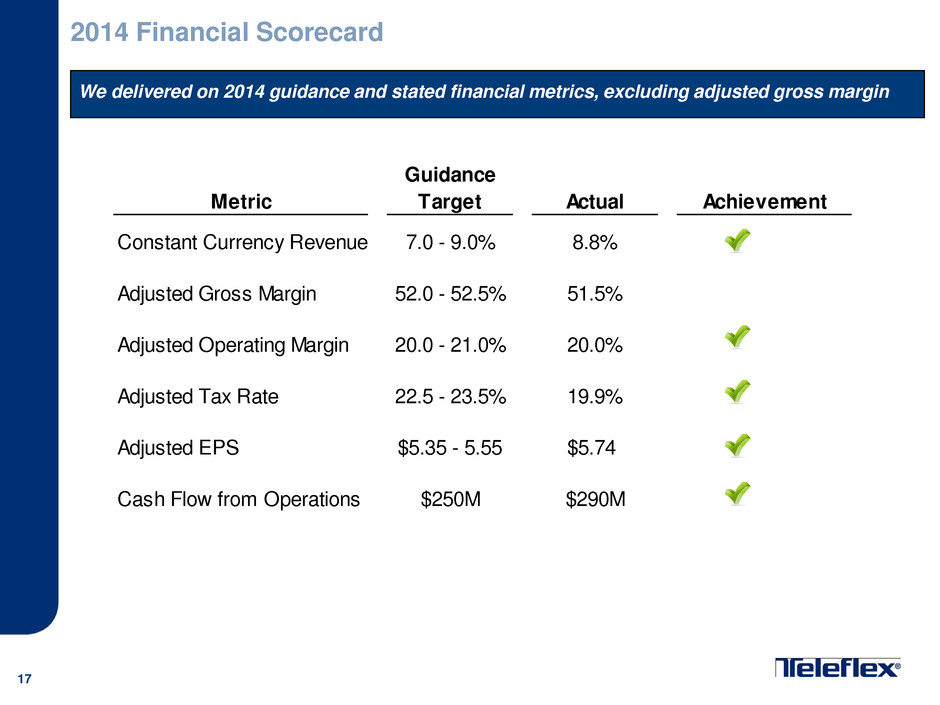
17 Guidance Metric Target Actual Achievement Constant Currency Revenue 7.0 - 9.0% 8.8% Adjusted Gross Margin 52.0 - 52.5% 51.5% Adjusted Operating Margin 20.0 - 21.0% 20.0% Adjusted Tax Rate 22.5 - 23.5% 19.9% Adjusted EPS $5.35 - 5.55 $5.74 Cash Flow from Operations $250M $290M 2014 Financial Scorecard We delivered on 2014 guidance and stated financial metrics, excluding adjusted gross margin
18 2015 FINANCIAL OUTLOOK 18

19 Constant currency revenue growth expected to be between 4% and 6% • Vidacare product sales expected to contribute to year-over-year growth • Revenue growth stemming from new product introductions expected to return to 2013 levels • Assumption of modest base volume and core product pricing growth • Distributor-to-direct conversions (i.e. Human Medics, Mayo and Japan go-direct) and Mini-Lap acquisition expected to contribute to year-over-year growth 2015 Financial Outlook Assumptions

20 2015 Financial Outlook Assumptions Adjusted Gross margin anticipated to improve by approximately 150bps to 250bps and reach 53.0% to 54.0% • Manufacturing cost improvement and productivity initiatives • Product mix, including Vidacare contribution at 85% gross margin • Pricing and margin gains from distributor to direct conversions • Contribution from Mini-Lap Technologies, Inc. acquisition • Somewhat offset by unfavorable impact from foreign exchange Adjusted operating margin expected to be between 22.0% and 22.5% • Gross margin gains and reduced EMEA operating expenses • Somewhat offset by unfavorable impact from foreign exchange and tempered by expected investments in distributor-to-direct strategy and Vidacare sales and marketing
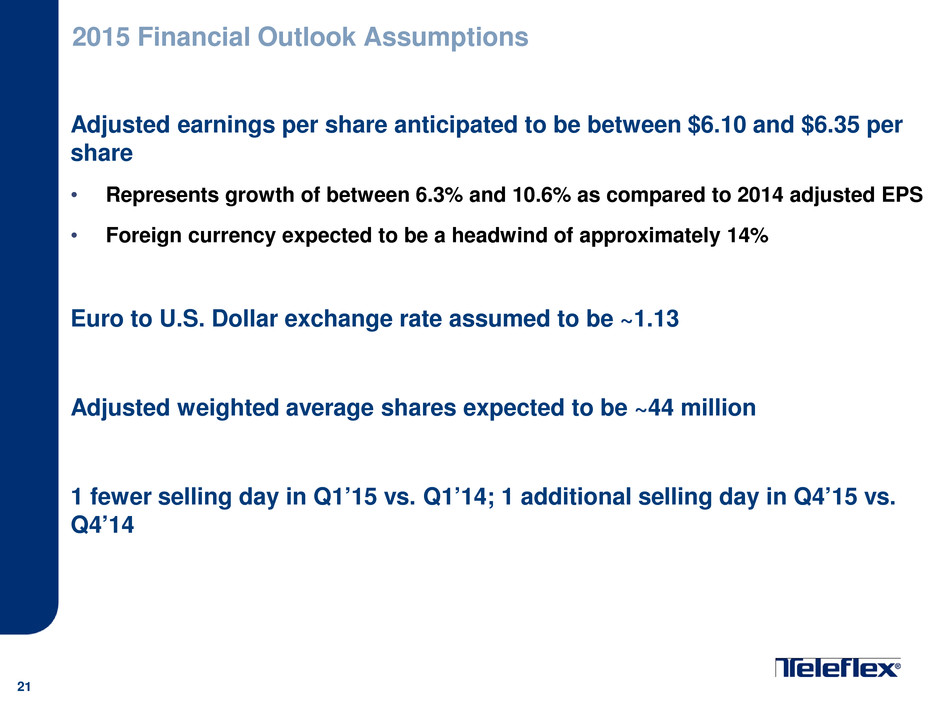
21 2015 Financial Outlook Assumptions Adjusted earnings per share anticipated to be between $6.10 and $6.35 per share • Represents growth of between 6.3% and 10.6% as compared to 2014 adjusted EPS • Foreign currency expected to be a headwind of approximately 14% Euro to U.S. Dollar exchange rate assumed to be ~1.13 Adjusted weighted average shares expected to be ~44 million 1 fewer selling day in Q1’15 vs. Q1’14; 1 additional selling day in Q4’15 vs. Q4’14

22 2015 Revenue Outlook Volume - Core Business 1.35% 1.65% New Product Introductions 0.75% 1.25% Vidacare 0.40% 0.60% Pricing - Core Business 0.00% 0.50% Forecasted Constant Currency Revenue Growth Excluding M&A and Distributor-to-Direct 2.50% 4.00% Mini-Lap Technologies 0.50% 0.75% Pricing - Distributor-to-Direct 0.50% 0.63% Volume - Distributor-to-Direct 0.50% 0.63% Forecasted 2015 Constant Currency Revenue Growth Range 4.00% 6.00% Foreign Exchange -6.00% -6.00% Forecasted 2015 GAAP Revenue Growth Range -2.00% 0.00%
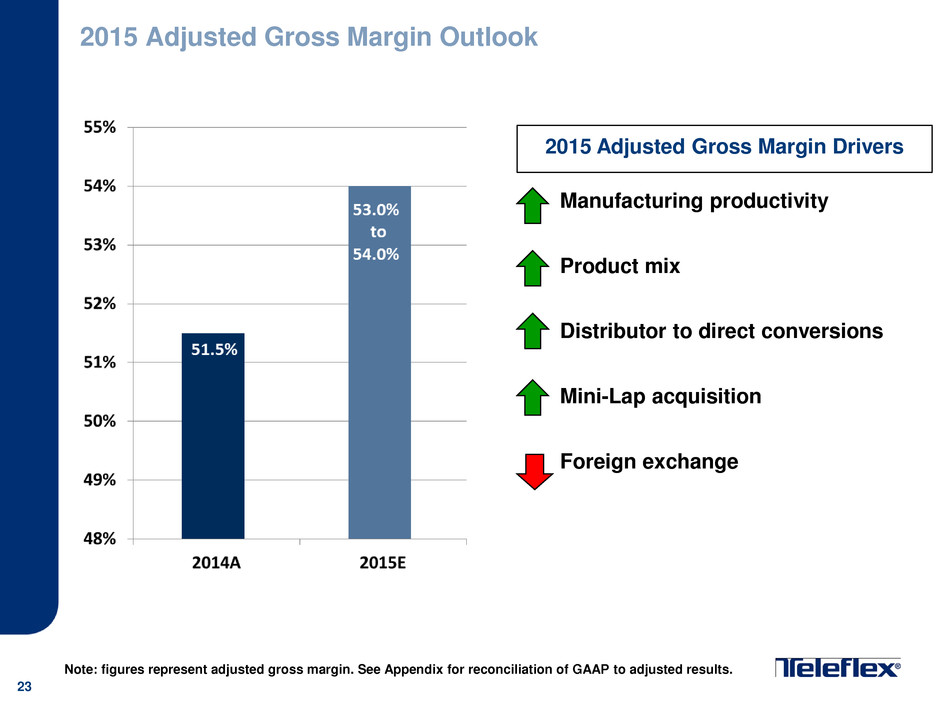
23 2015 Adjusted Gross Margin Outlook 2015 Adjusted Gross Margin Drivers Manufacturing productivity Product mix Distributor to direct conversions Mini-Lap acquisition Foreign exchange Note: figures represent adjusted gross margin. See Appendix for reconciliation of GAAP to adjusted results.
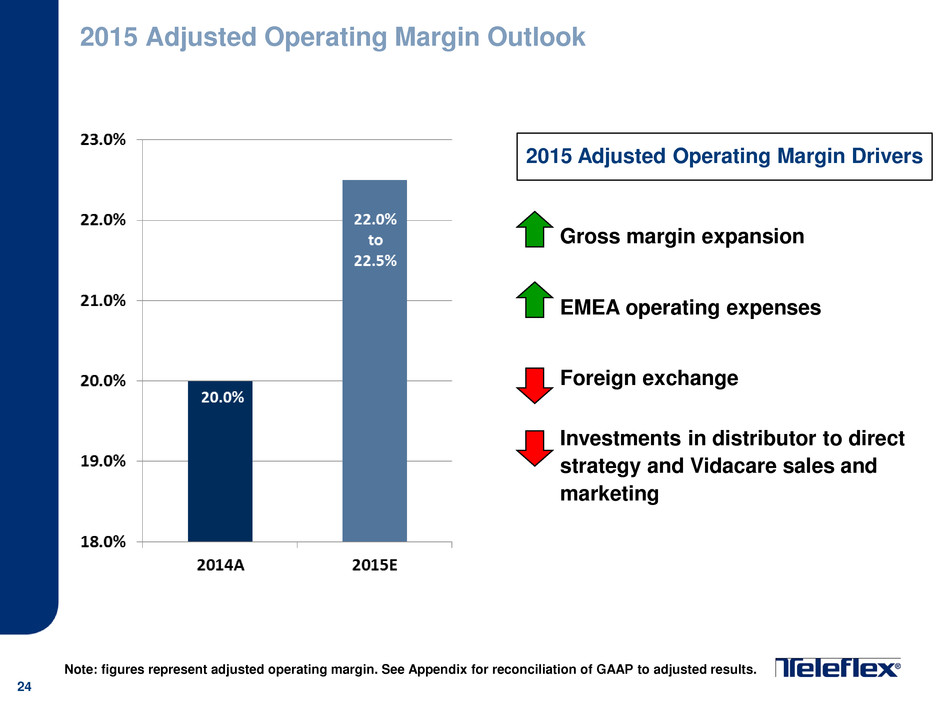
24 2015 Adjusted Operating Margin Outlook 2015 Adjusted Operating Margin Drivers Gross margin expansion EMEA operating expenses Foreign exchange Investments in distributor to direct strategy and Vidacare sales and marketing Note: figures represent adjusted operating margin. See Appendix for reconciliation of GAAP to adjusted results.
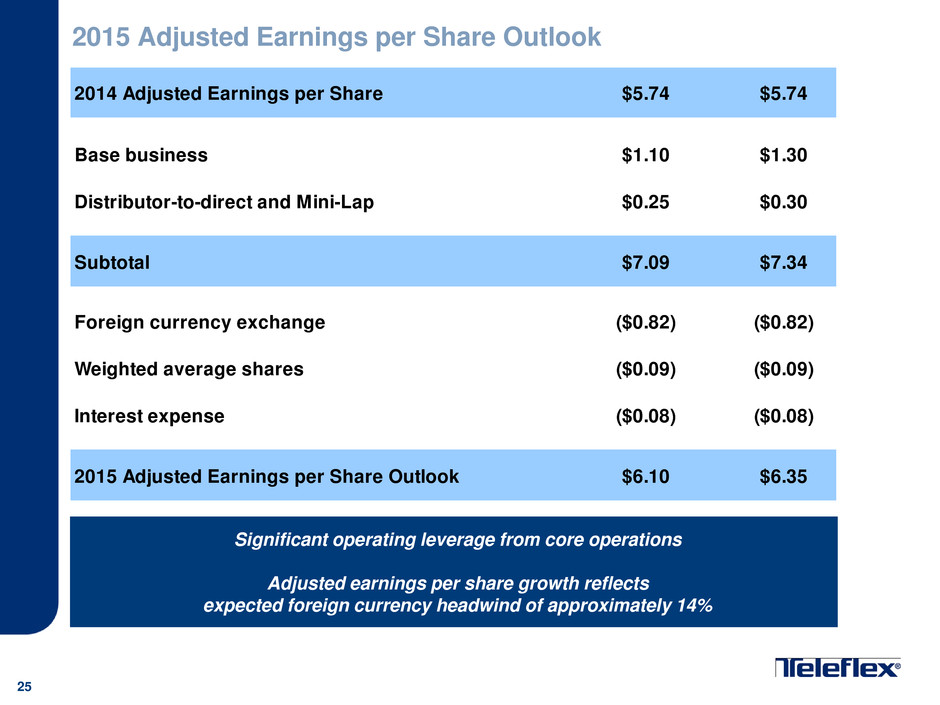
25 2015 Adjusted Earnings per Share Outlook Significant operating leverage from core operations Adjusted earnings per share growth reflects expected foreign currency headwind of approximately 14% 2014 Adjusted Earnings per Share $5.74 $5.74 Base business $1.10 $1.30 Distributor-to-direct and Mini-Lap $0.25 $0.30 Subtotal $7.09 $7.34 Foreign currency exchange ($0.82) ($0.82) Weighted average shares ($0.09) ($0.09) Interest expense ($0.08) ($0.08) 2015 Adjusted Earnings per Share Outlook $6.10 $6.35

26 2015 Financial Outlook Summary Continue to expect strong constant currency revenue growth fueled by a combination of modest volume growth, new product introductions, distributor- to-direct conversions, Vidacare and recent acquisition of Mini-Lap Technologies, Inc. Manufacturing cost improvement and productivity initiatives, distributor-to- direct conversions, favorable product mix, and contribution from Mini-Lap acquisition expected to accelerate pace of gross margin expansion Operating margin expected to improve versus prior year due to gross margin gains and lower European operating expenses; somewhat tempered by foreign exchange and investments in infrastructure requirements of distributor-to- direct conversions and Vidacare Adjusted earnings per share growth of between 6.3% and 10.6% reflects expected foreign currency headwind of approximately 14%
27 QUESTION & ANSWER 27

28 ADDITIONAL INFORMATION 28

Aggregate pre-tax charges of approximately $37 to $44 million1 , of which approximately $26 to $31 million will result in future cash outlays • 2014 pre-tax charges of $14.21 million, of which $3.1 million resulted in a cash outlay • 2015 pre-tax charges of approximately $14 to $18 million1, of which approximately $10 to $13 million will result in cash outlays; total cash outlays in 2015 of approximately $16 to $20 million Aggregate capital expenditures of approximately $24 to $30 million • 2014 capital expenditures of $6 million • 2015 capital expenditures of approximately $18 to $22 million Expect to achieve annualized savings of approximately $28 to $35 million once the plan is fully implemented, and currently expect to realize plan-related savings beginning in 2015 Other 2014 pre-tax operating expenses of $4 million that was not added-back when calculating adjusted earnings per share 2015 pre-tax operating expenses in the range of $6 to $8 million that will not be added-back when calculating adjusted earnings per share 1 = will be added-back when calculating adjusted earnings per share 29 2014 Manufacturing Footprint Realignment Plan
30 APPENDICES 30
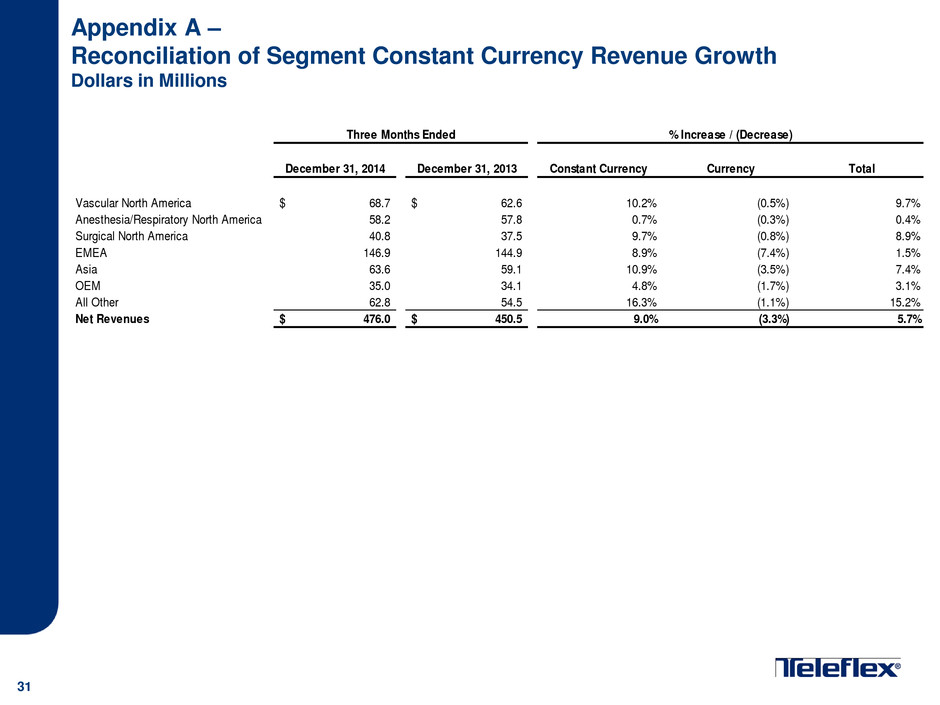
Appendix A – Reconciliation of Segment Constant Currency Revenue Growth Dollars in Millions 31 December 31, 2014 December 31, 2013 Constant Currency Currency Total Vascular North America 68.7$ 62.6$ 10.2% (0.5%) 9.7% Anesthesia/Respiratory North America 58.2 57.8 0.7% (0.3%) 0.4% Surgical North America 40.8 37.5 9.7% (0.8%) 8.9% EMEA 146.9 144.9 8.9% (7.4%) 1.5% Asia 63.6 59.1 10.9% (3.5%) 7.4% OEM 35.0 34.1 4.8% (1.7%) 3.1% All Other 62.8 54.5 16.3% (1.1%) 15.2% Net Revenues 476.0$ 450.5$ 9.0% (3.3%) 5.7% Three Months Ended % Increase / (Decrease)
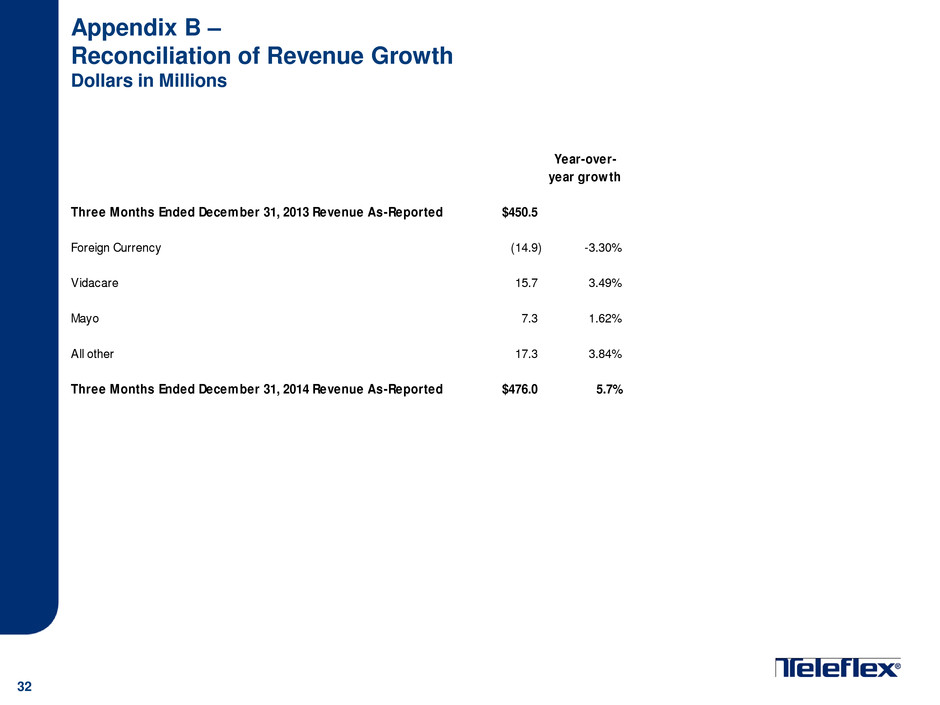
Appendix B – Reconciliation of Revenue Growth Dollars in Millions 32 Year-over- year growth Three Months Ended December 31, 2013 Revenue As-Reported $450.5 Foreign Currency (14.9) -3.30% Vidacare 15.7 3.49% Mayo 7.3 1.62% All other 17.3 3.84% Three Months Ended December 31, 2014 Revenue As-Reported $476.0 5.7%
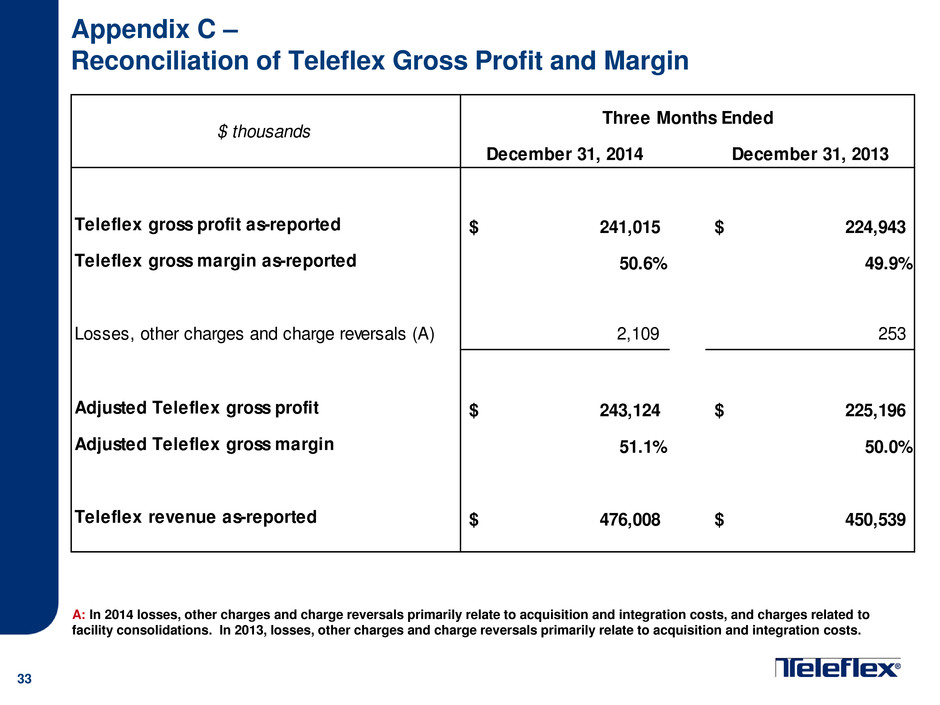
33 Appendix C – Reconciliation of Teleflex Gross Profit and Margin December 31, 2014 December 31, 2013 Teleflex gross profit as-reported 241,015$ 224,943$ Teleflex gross margin as-reported 50.6% 49.9% Losses, other charges and charge reversals (A) 2,109 253 Adjusted Teleflex gross profit 243,124$ 225,196$ Adjusted Teleflex gross margin 51.1% 50.0% Teleflex revenue as-reported 476,008$ 450,539$ $ thousands Three Months Ended A: In 2014 losses, other charges and charge reversals primarily relate to acquisition and integration costs, and charges related to facility consolidations. In 2013, losses, other charges and charge reversals primarily relate to acquisition and integration costs.

34 Appendix D – Reconciliation of Teleflex Operating Profit and Margin December 31, 2014 December 31, 2013 Teleflex income from continuing operations before interest and taxes 69,155$ 54,064$ Teleflex income from continuing operations before interest and taxes margin 14.5% 12.0% Restructuring and other impairment charges 1,358 9,247 Losses, other charges and charge reversals (A) 3,139 8,959 Adjusted Teleflex income from continuing operations before interest and taxes 73,652$ 72,270$ Adjusted Teleflex income from continuing operations before interest and taxes margin 15.5% 16.0% Intangible amortization expense 13,873 13,536 Adjusted Teleflex income from continuing operations before interest, taxes and intangible amortization expense 87,525$ 85,806$ Adjusted Teleflex income from continuing operations before interest, taxes and intangible amortization expense margin 18.4% 19.0% Teleflex revenue as-reported 476,008$ 450,539$ $ thousands Three Months Ended A: In 2014, losses, other charges and charge reversals primarily relate to acquisition and integration costs; charges related to facility consolidations; and charges related to a litigation verdict against the Company associated with a non-operating joint venture. In 2013, losses, other charges and charge reversals primarily relate to acquisition and integration costs; the establishment of a litigation reserve; and the reversal of contingent consideration liabilities.

Appendix E – EPS Reconciliation from Continuing Operations Quarter Ended – December 31, 2014 Dollars in millions, except per share data 35 Cost of goods sold Selling, general and administrative expenses Research and development expenses Restructuring and other impairment charges Interest expense, net Loss on extinguish-ment of debt Income taxes Net income (loss) attributable to common shareholders from continuing operations Diluted earnings per share available to common shareholders Shares used in calculation of GAAP and adjusted earnings per share GAAP Basis $235.0 $153.3 $17.2 $1.4 $16.6 — $0.4 $51.8 $1.10 47,112 Adjustments Restructuring and other impairment charges Losses, other charges and reversals (A) Amortization of debt discount on convertible notes Intangible amortization expense — 13.9 — — — — 3.5 10.4 $0.22 — Tax adjustment (B) — — — — — — 3.8 (3.8) ($0.08) — Shares due to Teleflex under note hedge (C) Adjusted basis $232.9 $138.4 $17.2 — $13.5 — $10.5 $63.3 $1.43 44,122 (A) In 2014, losses, other charges and charge reversals include approximately $1.6 million, net of tax, or $0.03 per share, related to acquisition and integration costs, and charges related to facility consolidations; and approximately $0.4 million, net of tax, or $0.01 per share, related to a litigation verdict against the Company with respect to a non-operating joint venture. (B) The tax adjustment represents a net benefit resulting from the resolution of, or the expiration of statute of limitations with respect to various prior years’ U.S. federal, state and foreign tax matters. (C) Adjusted diluted shares are calculated by giving effect to the anti-dilutive impact of the Company’s convertible note hedge agreements, which reduce the potential economic dilution that otherwise would occur upon conversion of our senior subordinated convertible notes. Under GAAP, the anti-dilutive impact of the convertible note hedge agreements is not reflected in diluted shares. $0.09 (2,990) $0.04 — — — — — — — — — $0.04 — — — — — 3.1 — 1.1 2.0 $0.02 — 2.1 1.0 0.0 — — — 1.1 2.0 — — — 1.4 — — 0.5 0.8

Appendix F – EPS Reconciliation from Continuing Operations Quarter Ended – December 31, 2013 Dollars in millions, except per share data 36 Cost of goods sold Selling, general and administrative expenses Research and Development expenses Restructuring and other impairment charges Interest expense, net Loss on extinguish-ment of debt Income taxes Net income (loss) attributable to common shareholders from continuing operations Diluted earnings per share available to common shareholders Shares used in calculation of GAAP and adjusted earnings per share GAAP Basis $225.6 $143.8 $17.9 $9.2 $14.2 — $4.6 $35.1 $0.78 45,033 Adjustments Restructuring and other impairment charges Losses, other charges and reversals (A) 0.3 8.2 0.5 — — — 2.5 6.5 $0.14 — Amortization of debt discount on convertible notes Intangible amortization expense — 13.5 — — — — 4.5 9.0 $0.20 — Loss on extinguishment of debt — — — — — — 0.0 0.0 $0.00 — Tax adjustment (B) Shares due to Teleflex under note hedge (C) Adjusted basis $225.3 $122.0 $17.3 — $11.3 — $15.8 $58.5 $1.36 42,868 (C) Adjusted diluted shares are calculated by giving effect to the anti-dilutive impact of the Company’s convertible note hedge agreements, which reduce the potential economic dilution that otherwise would occur upon conversion of our senior subordinated convertible notes. Under GAAP, the anti-dilutive impact of the convertible note hedge agreements is not reflected in diluted shares. — — — 9.2 — — 1.7 7.6 $0.17 — — — — — 2.9 — 1.1 1.8 $0.04 — — — — — — — 1.5 (1.5) ($0.03) — — — — — — — — — $0.06 (2,165) (A) In 2013, losses and other charges include approximately $4.5 million, net of tax, or $0.10 per share, related to acquisition and integration costs; approximately $1.9 million, net of tax, or $0.04 per share, related to the establishment of a litigation reserve; reversals included approximately $0.1 million, net of tax, or $0.00 per share, related to the reversal of contingent consideration liabilities. (B) The tax adjustment represents a net benefit resulting from the resolution of, or the expiration of statute of limitations with respect to various prior years’ U.S. federal, state and foreign tax matters.
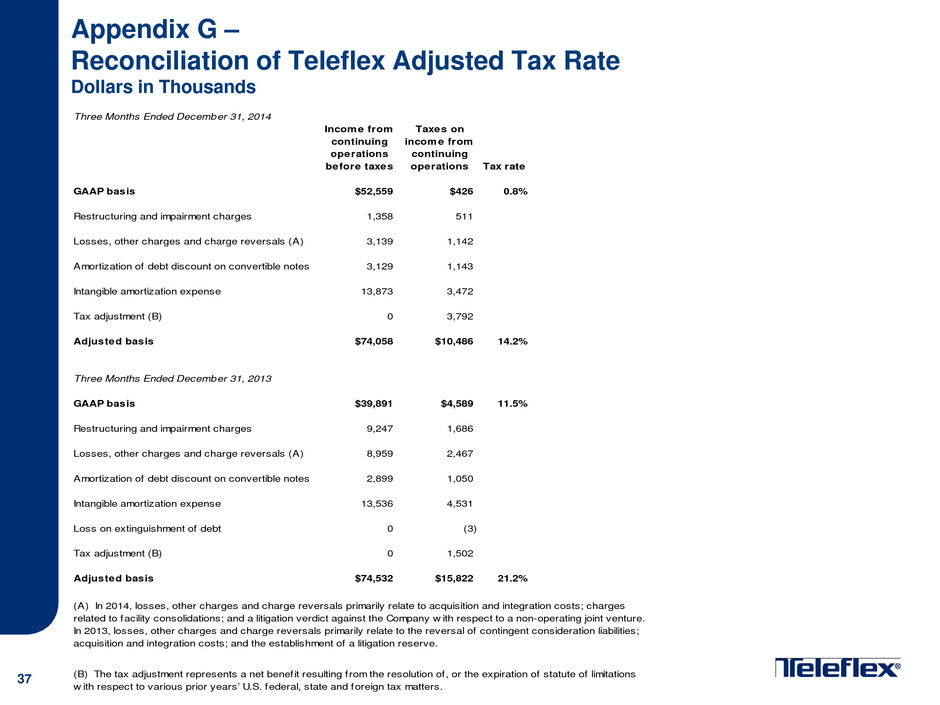
37 Appendix G – Reconciliation of Teleflex Adjusted Tax Rate Dollars in Thousands Three Months Ended December 31, 2014 Income from continuing operations before taxes Taxes on income from continuing operations Tax rate GAAP basis $52,559 $426 0.8% Restructuring and impairment charges 1,358 511 Losses, other charges and charge reversals (A) 3,139 1,142 Amortization of debt discount on convertible notes 3,129 1,143 Intangible amortization expense 13,873 3,472 Tax adjustment (B) 0 3,792 Adjusted basis $74,058 $10,486 14.2% Three Months Ended December 31, 2013 GAAP basis $39,891 $4,589 11.5% Restructuring and impairment charges 9,247 1,686 Losses, other charges and charge reversals (A) 8,959 2,467 Amortization of debt discount on convertible notes 2,899 1,050 Intangible amortization expense 13,536 4,531 Loss on extinguishment of debt 0 (3) Tax adjustment (B) 0 1,502 Adjusted basis $74,532 $15,822 21.2% (A) In 2014, losses, other charges and charge reversals primarily relate to acquisition and integration costs; charges related to facility consolidations; and a litigation verdict against the Company w ith respect to a non-operating joint venture. In 2013, losses, other charges and charge reversals primarily relate to the reversal of contingent consideration liabilities; acquisition and integration costs; and the establishment of a litigation reserve. (B) The tax adjustment represents a net benefit resulting from the resolution of, or the expiration of statute of limitations w ith respect to various prior years’ U.S. federal, state and foreign tax matters.
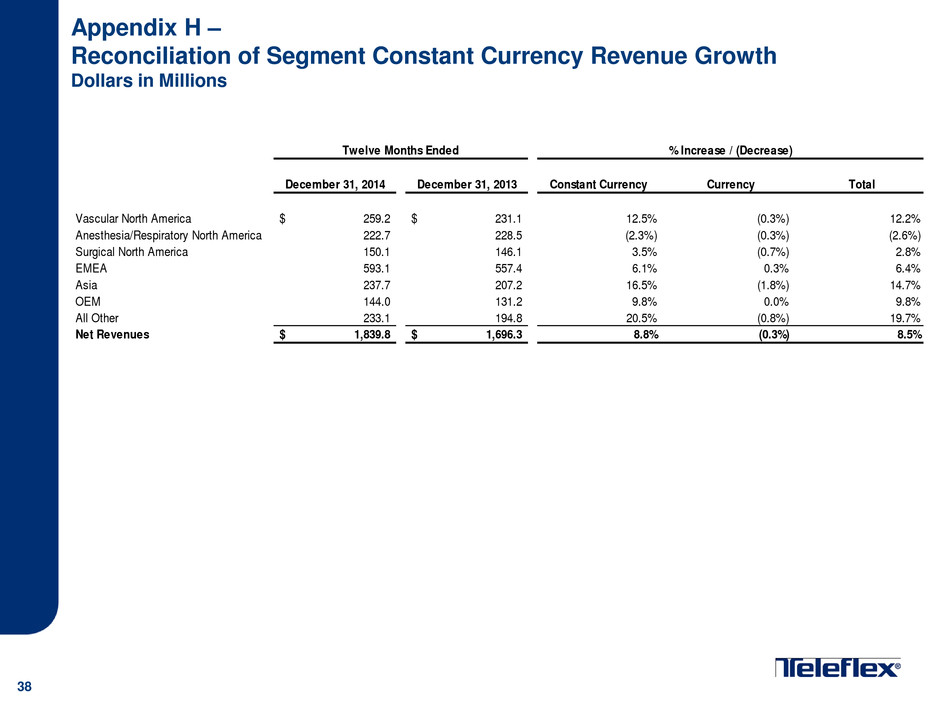
Appendix H – Reconciliation of Segment Constant Currency Revenue Growth Dollars in Millions 38 December 31, 2014 December 31, 2013 Constant Currency Currency Total Vascular North America 259.2$ 231.1$ 12.5% (0.3%) 12.2% Anesthesia/Respiratory North America 222.7 228.5 (2.3%) (0.3%) (2.6%) Surgical North America 150.1 146.1 3.5% (0.7%) 2.8% EMEA 593.1 557.4 6.1% 0.3% 6.4% Asia 237.7 207.2 16.5% (1.8%) 14.7% OEM 144.0 131.2 9.8% 0.0% 9.8% All Other 233.1 194.8 20.5% (0.8%) 19.7% Net Revenues 1,839.8$ 1,696.3$ 8.8% (0.3%) 8.5% Twelve Months Ended % Increase / (Decrease)
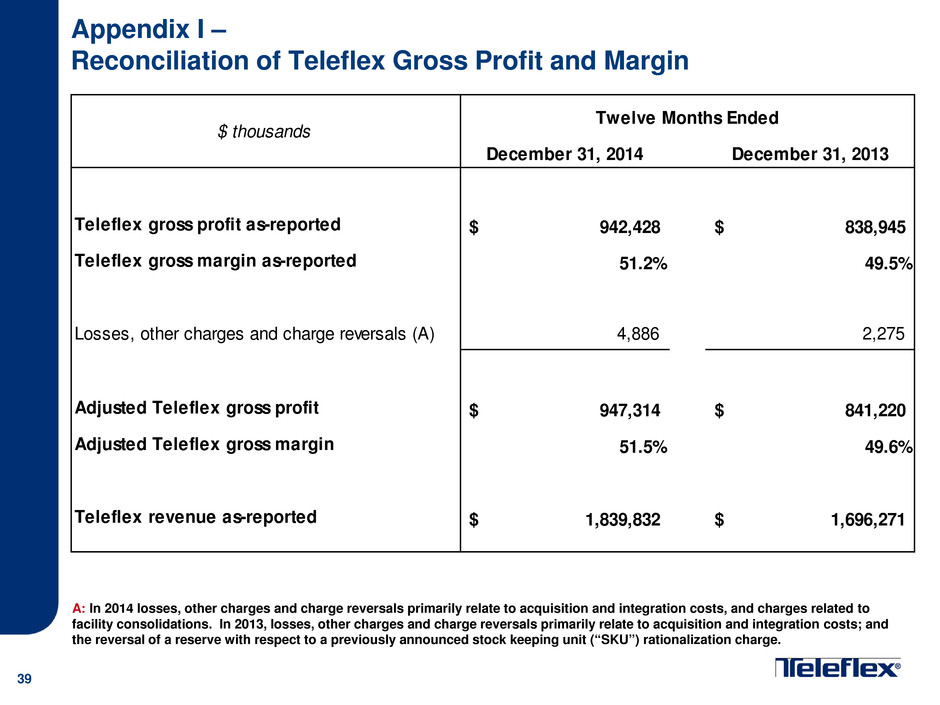
39 Appendix I – Reconciliation of Teleflex Gross Profit and Margin December 31, 2014 December 31, 2013 Teleflex gross profit as-reported 942,428$ 838,945$ Teleflex gross margin as-reported 51.2% 49.5% Losses, other charges and charge reversals (A) 4,886 2,275 Adjusted Teleflex gross profit 947,314$ 841,220$ Adjusted Teleflex gross margin 51.5% 49.6% Teleflex revenue as-reported 1,839,832$ 1,696,271$ $ thousands Twelve Months Ended A: In 2014 losses, other charges and charge reversals primarily relate to acquisition and integration costs, and charges related to facility consolidations. In 2013, losses, other charges and charge reversals primarily relate to acquisition and integration costs; and the reversal of a reserve with respect to a previously announced stock keeping unit (“SKU”) rationalization charge.
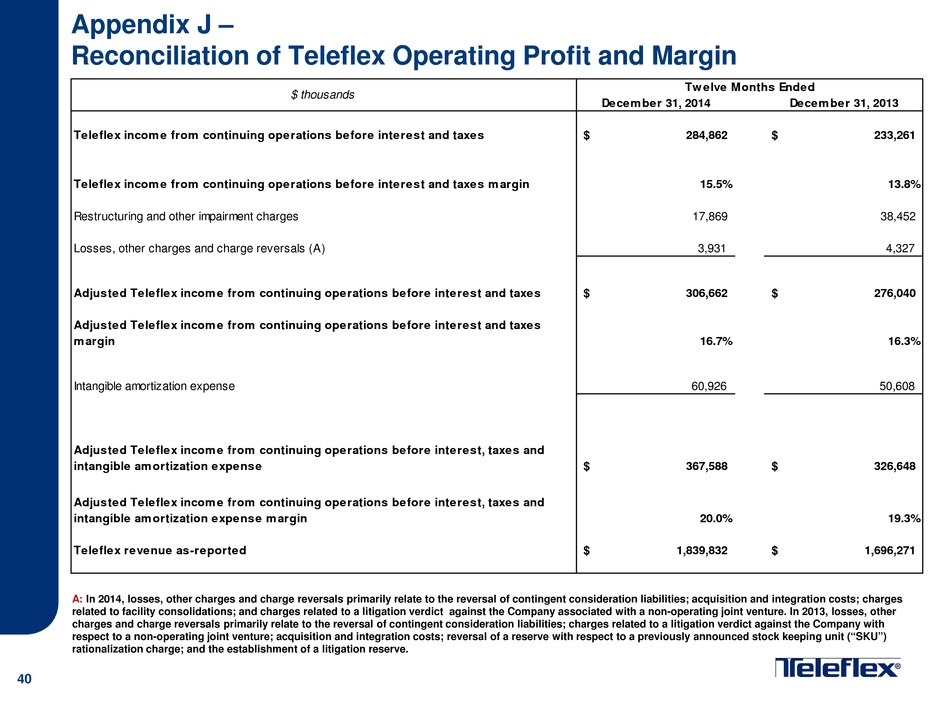
40 Appendix J – Reconciliation of Teleflex Operating Profit and Margin December 31, 2014 December 31, 2013 Teleflex income from continuing operations before interest and taxes 284,862$ 233,261$ Teleflex income from continuing operations before interest and taxes margin 15.5% 13.8% Restructuring and other impairment charges 17,869 38,452 Losses, other charges and charge reversals (A) 3,931 4,327 Adjusted Teleflex income from continuing operations before interest and taxes 306,662$ 276,040$ Adjusted Teleflex income from continuing operations before interest and taxes margin 16.7% 16.3% Intangible amortization expense 60,926 50,608 Adjusted Teleflex income from continuing operations before interest, taxes and intangible amortization expense 367,588$ 326,648$ Adjusted Teleflex income from continuing operations before interest, taxes and intangible amortization expense margin 20.0% 19.3% Teleflex revenue as-reported 1,839,832$ 1,696,271$ $ thousands Twelve Months Ended A: In 2014, losses, other charges and charge reversals primarily relate to the reversal of contingent consideration liabilities; acquisition and integration costs; charges related to facility consolidations; and charges related to a litigation verdict against the Company associated with a non-operating joint venture. In 2013, losses, other charges and charge reversals primarily relate to the reversal of contingent consideration liabilities; charges related to a litigation verdict against the Company with respect to a non-operating joint venture; acquisition and integration costs; reversal of a reserve with respect to a previously announced stock keeping unit (“SKU”) rationalization charge; and the establishment of a litigation reserve.
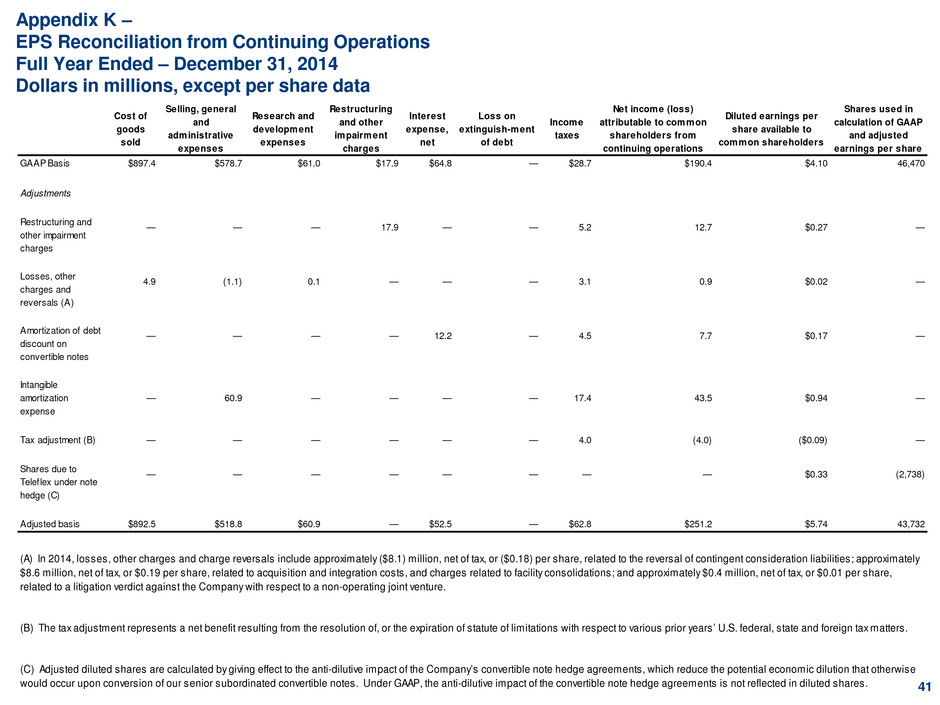
Appendix K – EPS Reconciliation from Continuing Operations Full Year Ended – December 31, 2014 Dollars in millions, except per share data 41 Cost of goods sold Selling, general and administrative expenses Research and development expenses Restructuring and other impairment charges Interest expense, net Loss on extinguish-ment of debt Income taxes Net income (loss) attributable to common shareholders from continuing operations Diluted earnings per share available to common shareholders Shares used in calculation of GAAP and adjusted earnings per share GAAP Basis $897.4 $578.7 $61.0 $17.9 $64.8 — $28.7 $190.4 $4.10 46,470 Adjustments Restructuring and other impairment charges Losses, other charges and reversals (A) Amortization of debt discount on convertible notes Intangible amortization expense — 60.9 — — — — 17.4 43.5 $0.94 — Tax adjustment (B) — — — — — — 4.0 (4.0) ($0.09) — Shares due to Teleflex under note hedge (C) Adjusted basis $892.5 $518.8 $60.9 — $52.5 — $62.8 $251.2 $5.74 43,732 (A) In 2014, losses, other charges and charge reversals include approximately ($8.1) million, net of tax, or ($0.18) per share, related to the reversal of contingent consideration liabilities; approximately $8.6 million, net of tax, or $0.19 per share, related to acquisition and integration costs, and charges related to facility consolidations; and approximately $0.4 million, net of tax, or $0.01 per share, related to a litigation verdict against the Company with respect to a non-operating joint venture. (B) The tax adjustment represents a net benefit resulting from the resolution of, or the expiration of statute of limitations with respect to various prior years’ U.S. federal, state and foreign tax matters. (C) Adjusted diluted shares are calculated by giving effect to the anti-dilutive impact of the Company’s convertible note hedge agreements, which reduce the potential economic dilution that otherwise would occur upon conversion of our senior subordinated convertible notes. Under GAAP, the anti-dilutive impact of the convertible note hedge agreements is not reflected in diluted shares. $0.33 (2,738) $0.17 — — — — — — — — — $0.02 — — — — — 12.2 — 4.5 7.7 $0.27 — 4.9 (1.1) 0.1 — — — 3.1 0.9 — — — 17.9 — — 5.2 12.7

Appendix L – EPS Reconciliation from Continuing Operations Full Year Ended – December 31, 2013 Dollars in millions, except per share data 42 Cost of goods sold Selling, general and administrative expenses Research and development expenses Restructuring and other impairment charges Interest expense, net Loss on extinguish-ment of debt Income taxes Net income (loss) attributable to common shareholders from continuing operations Diluted earnings per share available to common shareholders Shares used in calculation of GAAP and adjusted earnings per share GAAP Basis $857.3 $502.2 $65.0 $38.5 $56.3 $1.3 $23.5 $151.3 $3.46 43,693 Adjustments Restructuring and other impairment charges Losses, other charges and reversals (A) 2.3 1.5 0.5 — — — 4.9 (0.6) ($0.02) — Amortization of debt discount on convertible notes Intangible amortization expense — 50.6 — — — — 17.3 33.4 $0.76 — Loss on extinguishment of debt — — — — — 1.3 0.5 0.8 $0.02 — Tax adjustment (B) Shares due to Teleflex under note hedge (C) Adjusted basis $855.1 $450.1 $64.5 — $45.0 — $69.2 $211.6 $5.03 42,073 — — $0.19 (1,620) (A) In 2013, losses and other charges include approximately ($12.4) million, net of tax, or ($0.28) per share, related to the reversal of contingent consideration liabilities; approximately $0.8 million, net of tax, or $0.02 per share, related to a litigation verdict against the Company with respect to a non-operating joint venture; $9.5 million, net of tax, or $0.21 per share, related to acquisition and integration costs; ($0.4) million, net of tax, or ($0.01) per share, related to reversal of a reserve with respect to a previously announced stock keeping unit (“SKU”) rationalization charge; and approximately $1.9 million, net of tax, or $0.04 per share, related to the establishment of a litigation reserve. (B) The tax adjustment represents a net benefit resulting from the resolution of, or the expiration of statute of limitations with respect to various prior years’ U.S. federal, state and foreign tax matters. 11.1 (11.1) ($0.25) — — — — — — — 4.1 7.2 $0.16 — — — — — — — 7.8 30.7 $0.71 — — — — — 11.3 — — — — 38.5 — — (C) Adjusted diluted shares are calculated by giving effect to the anti-dilutive impact of the Company’s convertible note hedge agreements, which reduce the potential economic dilution that otherwise would occur upon conversion of our senior subordinated convertible notes. Under GAAP, the anti-dilutive impact of the convertible note hedge agreements is not reflected in diluted shares.
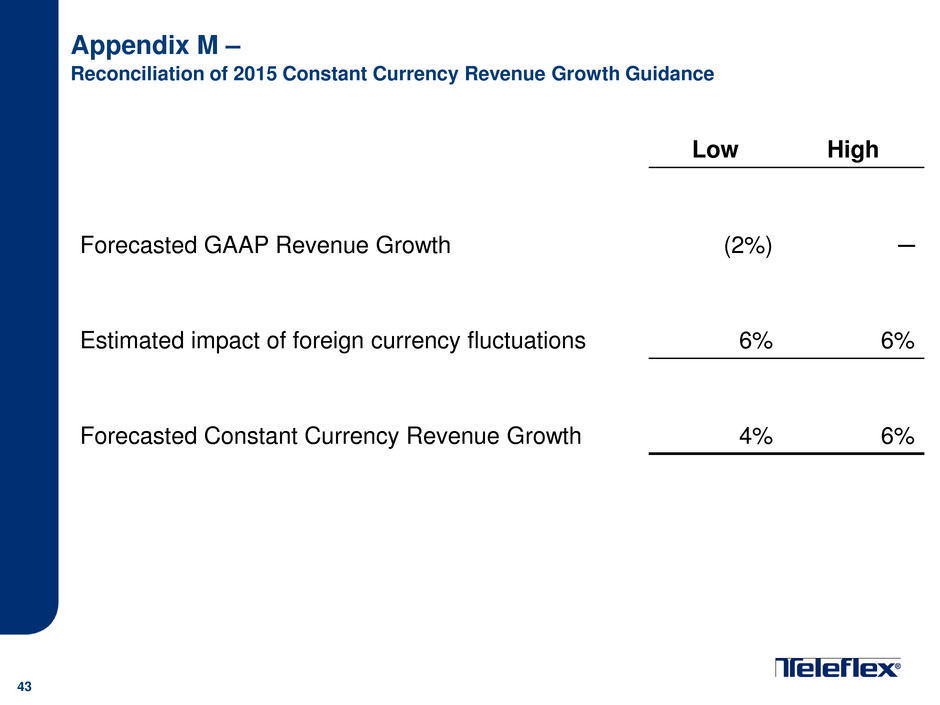
Appendix M – Reconciliation of 2015 Constant Currency Revenue Growth Guidance 43 Low High Forecasted GAAP Revenue Growth (2%) ─ Estimated impact of foreign currency fluctuations 6% 6% Forecasted Constant Currency Revenue Growth 4% 6%
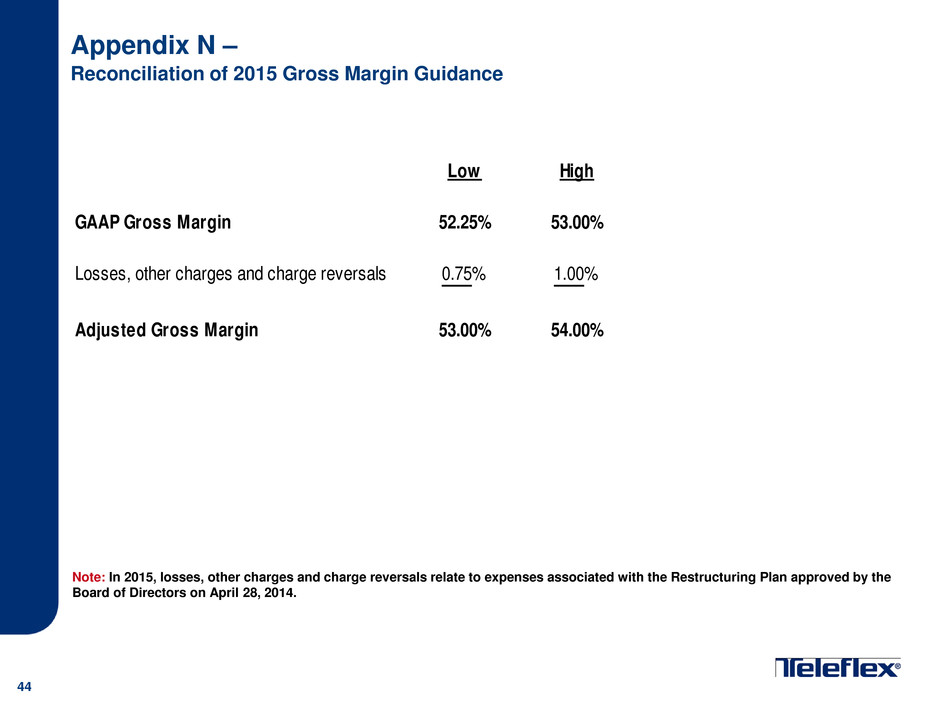
Appendix N – Reconciliation of 2015 Gross Margin Guidance 44 Note: In 2015, losses, other charges and charge reversals relate to expenses associated with the Restructuring Plan approved by the Board of Directors on April 28, 2014. Low High GAAP Gross Margin 52.25% 53.00% Losses, other charges and charge reversals 0.75% 1.00% Adjusted Gross Margin 53.00% 54.00%
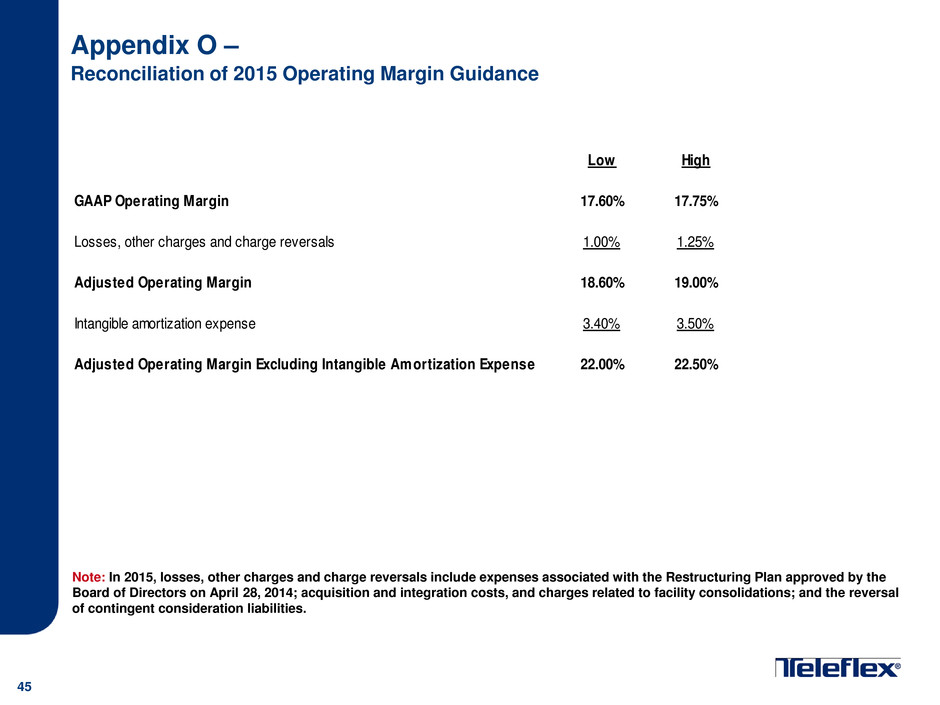
Appendix O – Reconciliation of 2015 Operating Margin Guidance 45 Note: In 2015, losses, other charges and charge reversals include expenses associated with the Restructuring Plan approved by the Board of Directors on April 28, 2014; acquisition and integration costs, and charges related to facility consolidations; and the reversal of contingent consideration liabilities. Low High GAAP Operating Margin 17.60% 17.75% Losses, other charges and charge reversals 1.00% 1.25% Adjusted Operating Margin 18.60% 19.00% Intangible amortization expense 3.40% 3.50% Adjusted Operating Margin Excluding Intangible Amortization Expense 22.00% 22.50%
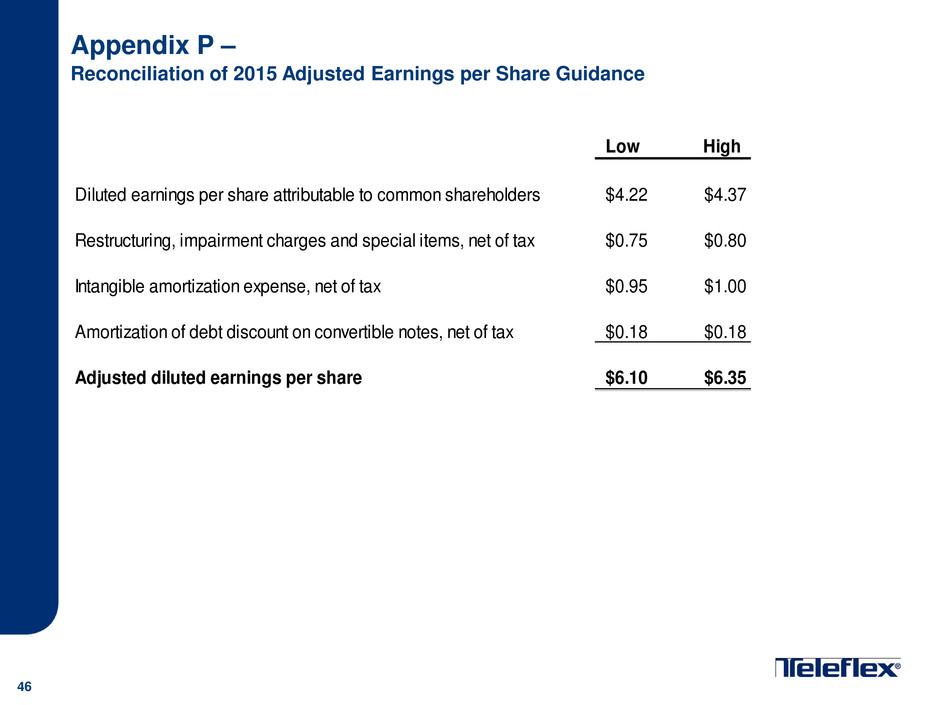
Appendix P – Reconciliation of 2015 Adjusted Earnings per Share Guidance 46 Low High Diluted earnings per share attributable to common shareholders $4.22 $4.37 Restructuring, impairment charges and special items, net of tax $0.75 $0.80 Intangible amortization expense, net of tax $0.95 $1.00 Amortization of debt discount on convertible notes, net of tax $0.18 $0.18 Adjusted diluted earnings per share $6.10 $6.35

47 Appendix Q – Reconciliation of Teleflex Adjusted Tax Rate Dollars in Thousands Twelve Months Ended December 31, 2014 Income from continuing operations before taxes Taxes on income from continuing operations Tax rate GAAP basis $220,110 $28,650 13.0% Restructuring and impairment charges 17,869 5,190 Losses, other charges and charge reversals (A) 3,931 3,058 Amortization of debt discount on convertible notes 12,207 4,459 Intangible amortization expense 60,926 17,395 Tax adjustment (B) 0 4,041 Adjusted basis $315,043 $62,793 19.9% (A) In 2014, losses, other charges and charge reversals primarily relate to acquisition and integration costs; charges related to facility consolidations; a litigation verdict against the Company w ith respect to a non-operating joint venture; and reversals related to contingent consideration liabilities. (B) The tax adjustment represents a net benefit resulting from the resolution of, or the expiration of statute of limitations w ith respect to various prior years’ U.S. federal, state and foreign tax matters.
