Attached files
| file | filename |
|---|---|
| 8-K - FORM 8-K - Monarch Financial Holdings, Inc. | d878151d8k.htm |
Exhibit 99.1
|
|
Exhibit 99.1
Investor Presentation
As of December 31, 2014 February 19, 2015
Page 1
|
|
Forward-Looking Statements
Certain information contained in this discussion may include “forward-looking statements” within the meaning of Section 27A of the Securities Act of 1933, as amended, and Section 21E of the Securities Exchange Act of 1934, as amended. These forward-looking statements relate to the Company’s future operations and are generally identified by phrases such as “the Company expects,” “the Company believes” or words of similar import. Although the Company believes that its expectations with respect to the forward-looking statements are based upon reliable assumptions within the bounds of its knowledge of its business and operations, there can be no assurance that actual results, performance or achievements of the Company will not differ materially from any future results, performance or achievements expressed or implied by such forward-looking statements. For details on factors that could affect expectations, see the Company’s most recently issued Annual Report on Form 10-K, as filed with the Securities and Exchange Commission.
Page 2
|
|

Introduction
Brad E. Schwartz
Chief Executive Officer
E. Neal Crawford, Jr.
President
Page 3
|
|
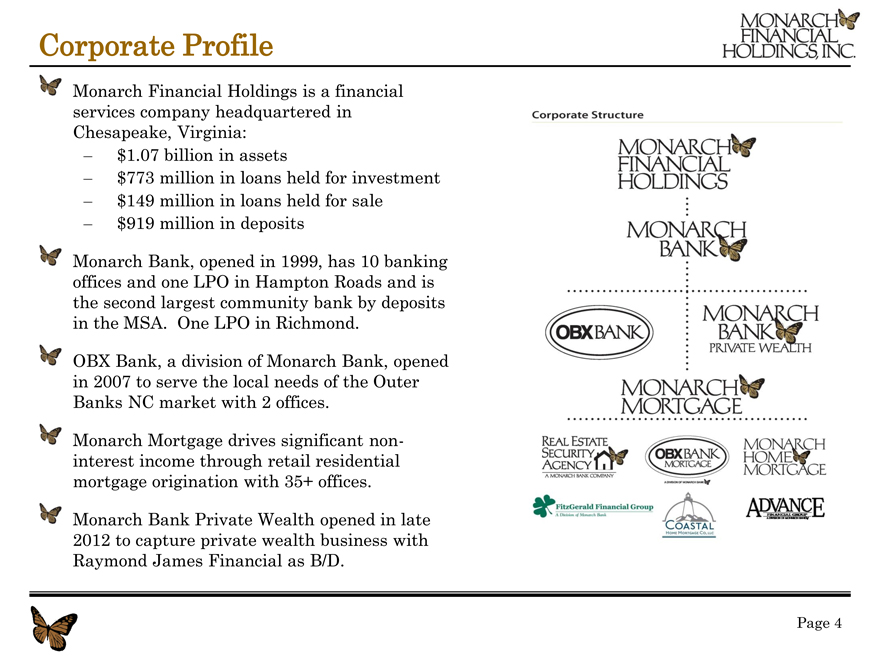
Corporate Profile
Monarch Financial Holdings is a financial services company headquartered in Chesapeake, Virginia:
$1.07 billion in assets
$773 million in loans held for investment
$149 million in loans held for sale
$919 million in deposits
Monarch Bank, opened in 1999, has 10 banking offices and one LPO in Hampton Roads and is the second largest community bank by deposits in the MSA. One LPO in Richmond.
OBX Bank, a division of Monarch Bank, opened in 2007 to serve the local needs of the Outer Banks NC market with 2 offices.
Monarch Mortgage drives significant non-interest income through retail residential mortgage origination with 35+ offices.
Monarch Bank Private Wealth opened in late 2012 to capture private wealth business with Raymond James Financial as B/D.
Page 4
|
|
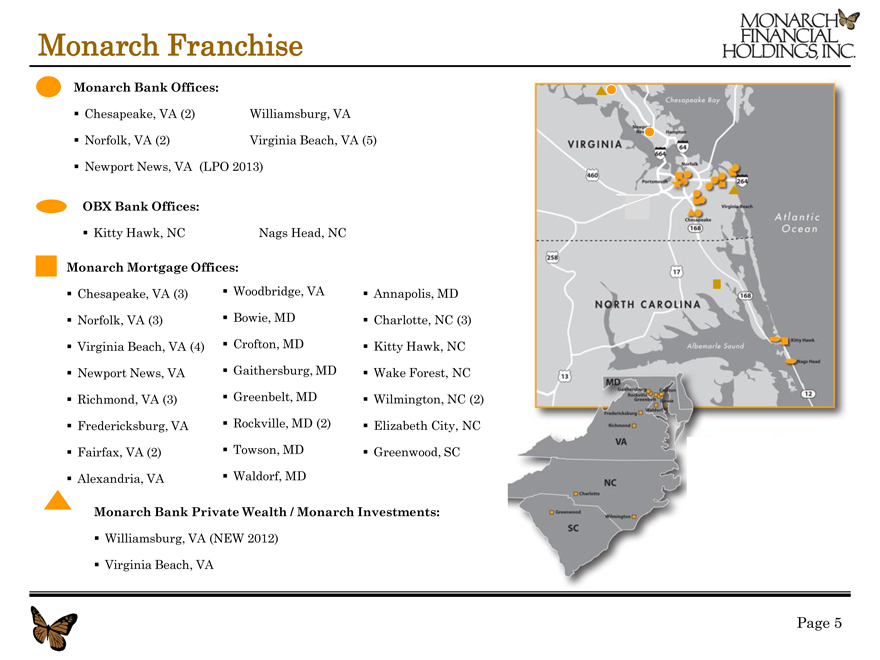
Monarch Franchise
Monarch Bank Offices:
Chesapeake, VA (2) Williamsburg, VA
Norfolk, VA (2) Virginia Beach, VA (5)
Newport News, VA (LPO 2013)
OBX Bank Offices:
Kitty Hawk, NC Nags Head, NC
Monarch Mortgage Offices:
Chesapeake, VA (3) Woodbridge, VA Annapolis, MD
Norfolk, VA (3) Bowie, MD Charlotte, NC (3)
Virginia Beach, VA (4) Crofton, MD Kitty Hawk, NC
Newport News, VA Gaithersburg, MD Wake Forest, NC
Richmond, VA (3) Greenbelt, MD Wilmington, NC (2)
Fredericksburg, VA Rockville, MD (2) Elizabeth City, NC
Fairfax, VA (2) Towson, MD Greenwood, SC
Alexandria, VA Waldorf, MD
Monarch Bank Private Wealth / Monarch Investments:
Williamsburg, VA (NEW 2012)
Virginia Beach, VA
Page 5
|
|
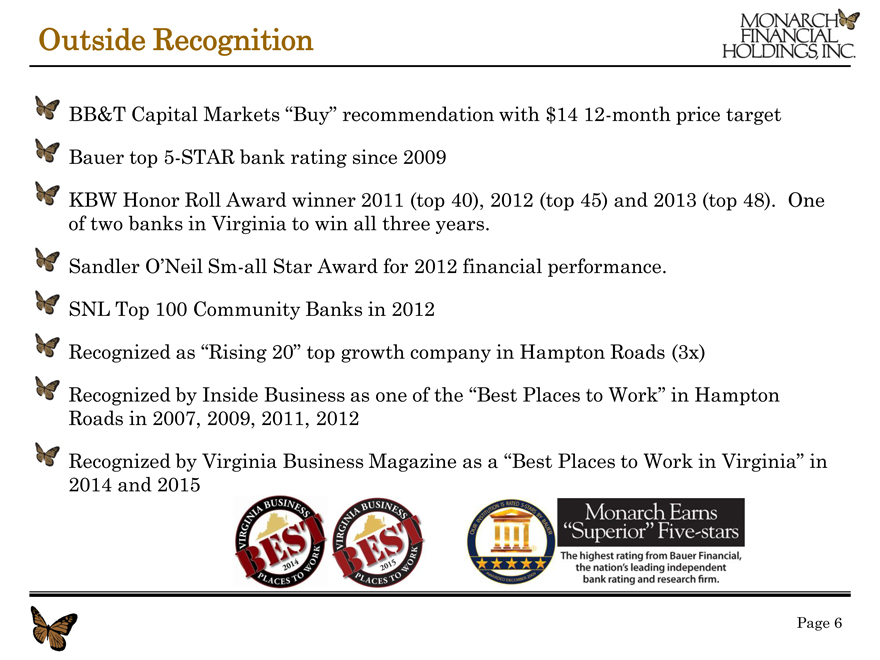
Outside Recognition
BB&T Capital Markets “Buy” recommendation with $14 12-month price target Bauer top 5-STAR bank rating since 2009 KBW Honor Roll Award winner 2011 (top 40), 2012 (top 45) and 2013 (top 48). One of two banks in Virginia to win all three years.
Sandler O’Neil Sm-all Star Award for 2012 financial performance. SNL Top 100 Community Banks in 2012
Recognized as “Rising 20” top growth company in Hampton Roads (3x)
Recognized by Inside Business as one of the “Best Places to Work” in Hampton
Roads in 2007, 2009, 2011, 2012
Recognized by Virginia Business Magazine as a “Best Places to Work in Virginia” in 2014 and 2015
Page 6
|
|
Experienced Management Team
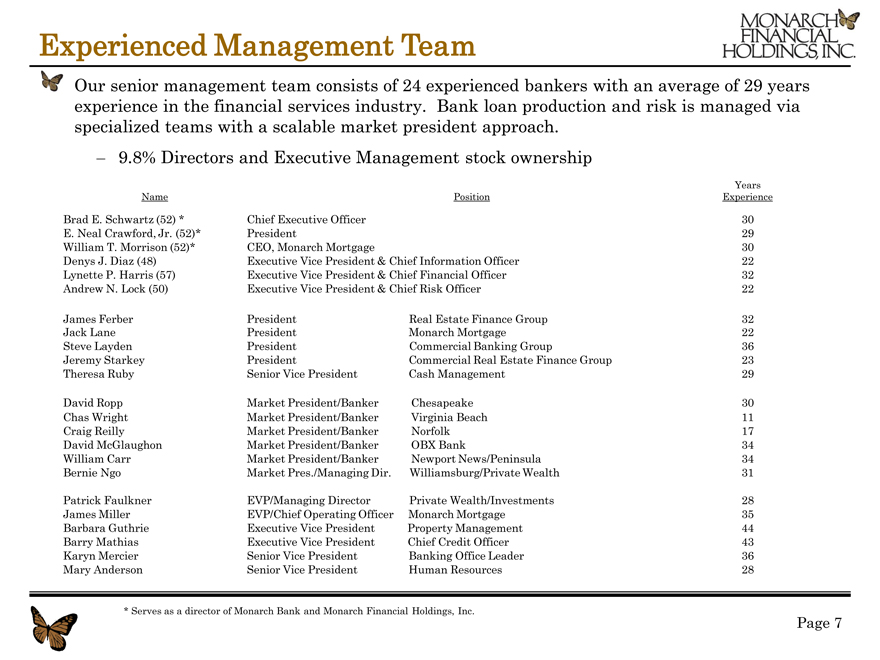
Our senior management team consists of 24 experienced bankers with an average of 29 years
experience in the financial services industry. Bank loan production and risk is managed via
specialized teams with a scalable market president approach.
– 9.8% Directors and Executive Management stock ownership
Years
Name Position Experience
Brad E. Schwartz (52) * Chief Executive Officer 30
E. Neal Crawford, Jr. (52)* President 29
William T. Morrison (52)* CEO, Monarch Mortgage 30
Denys J. Diaz (48) Executive Vice President & Chief Information Officer 22
Lynette P. Harris (57) Executive Vice President & Chief Financial Officer 32
Andrew N. Lock (50) Executive Vice President & Chief Risk Officer 22
James Ferber President Real Estate Finance Group 32
Jack Lane President Monarch Mortgage 22
Steve Layden President Commercial Banking Group 36
Jeremy Starkey President Commercial Real Estate Finance Group 23
Theresa Ruby Senior Vice President Cash Management 29
David Ropp Market President/Banker Chesapeake 30
Chas Wright Market President/Banker Virginia Beach 11
Craig Reilly Market President/Banker Norfolk 17
David McGlaughon Market President/Banker OBX Bank 34
William Carr Market President/Banker Newport News/Peninsula 34
Bernie Ngo Market Pres./Managing Dir. Williamsburg/Private Wealth 31
Patrick Faulkner EVP/Managing Director Private Wealth/Investments 28
James Miller EVP/Chief Operating Officer Monarch Mortgage 35
Barbara Guthrie Executive Vice President Property Management 44
Barry Mathias Executive Vice President Chief Credit Officer 43
Karyn Mercier Senior Vice President Banking Office Leader 36
Mary Anderson Senior Vice President Human Resources 28
* Serves as a director of Monarch Bank and Monarch Financial Holdings, Inc.
Page 7
|
|
Our “Smart Growth” Business Strategy
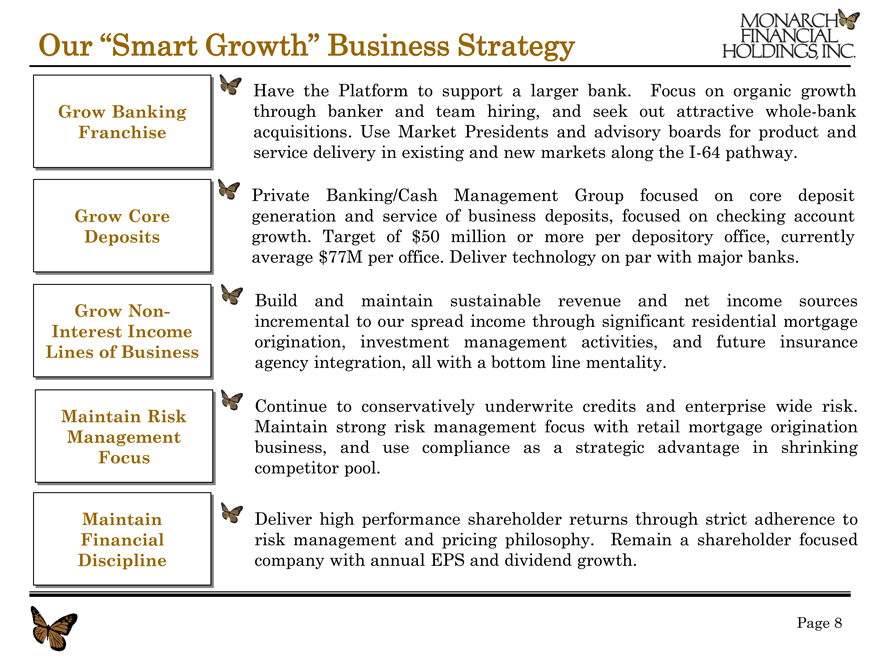
Have the Platform to support a larger bank. Focus on organic growth
Grow Banking through banker and team hiring, and seek out attractive whole-bank
Franchise acquisitions. Use Market Presidents and advisory boards for product and
service delivery in existing and new markets along the I-64 pathway.
Private Banking/Cash Management Group focused on core deposit
Grow Core generation and service of business deposits, focused on checking account
Deposits growth. Target of $50 million or more per depository office, currently
average $77M per office. Deliver technology on par with major banks.
Build and maintain sustainable revenue and net income sources
Grow Non- incremental to our spread income through significant residential mortgage
Interest Income origination, investment management activities, and future insurance
Lines of Business agency integration, all with a bottom line mentality.
Continue to conservatively underwrite credits and enterprise wide risk.
Maintain Risk Maintain strong risk management focus with retail mortgage origination
Management business, and use compliance as a strategic advantage in shrinking
Focus competitor pool.
Maintain Deliver high performance shareholder returns through strict adherence to
Financial risk management and pricing philosophy. Remain a shareholder focused
Discipline company with annual EPS and dividend growth.
Page 8
|
|
Management’s Focus
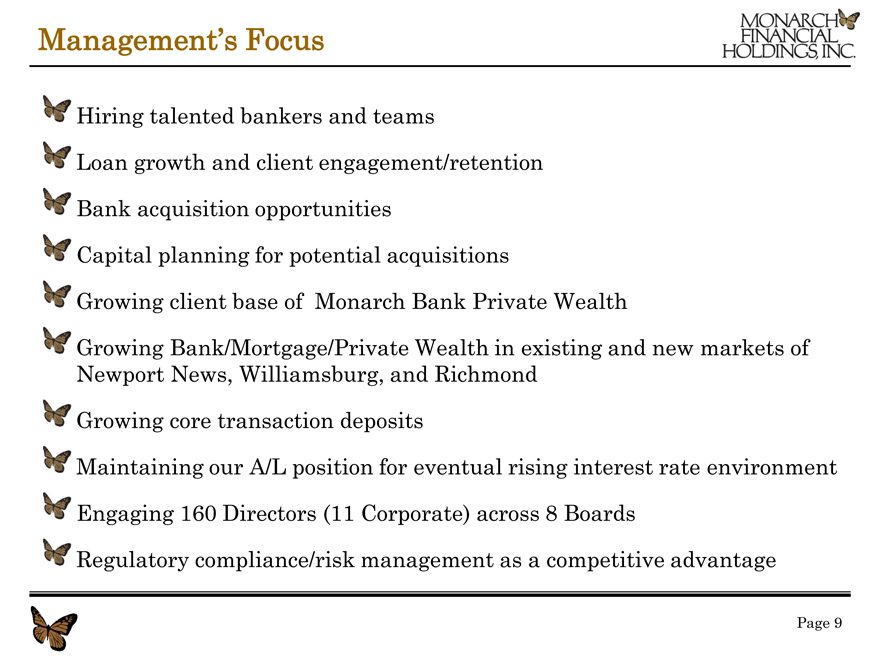
Hiring talented bankers and teams
Loan growth and client engagement/retention
Bank acquisition opportunities
Capital planning for potential acquisitions
Growing client base of Monarch Bank Private Wealth
Growing Bank/Mortgage/Private Wealth in existing and new markets of
Newport News, Williamsburg, and Richmond
Growing core transaction deposits
Maintaining our A/L position for eventual rising interest rate environment
Engaging 160 Directors (11 Corporate) across 8 Boards
Regulatory compliance/risk management as a competitive advantage
Page 9
|
|
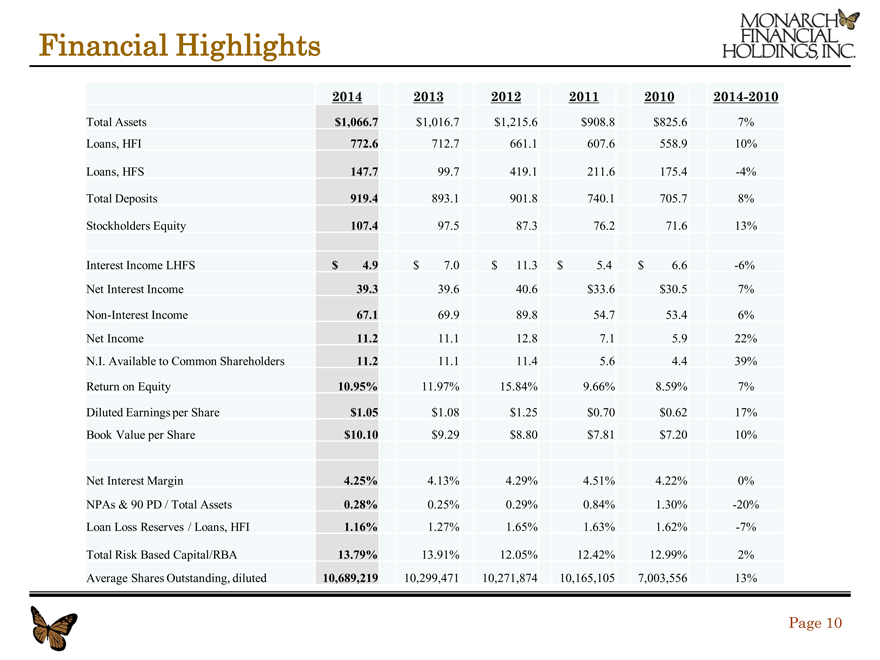
Financial Highlights
2014 2013 2012 2011 2010 2014-2010
Total Assets $1,066.7 $1,016.7 $1,215.6 $908.8 $825.6 7%
Loans, HFI 772.6 712.7 661.1 607.6 558.9 10%
Loans, HFS 147.7 99.7 419.1 211.6 175.4 -4%
Total Deposits 919.4 893.1 901.8 740.1 705.7 8%
Stockholders Equity 107.4 97.5 87.3 76.2 71.6 13%
Interest Income LHFS $ 4.9 $ 7.0 $ 11.3 $ 5.4 $ 6.6 -6%
Net Interest Income 39.3 39.6 40.6 $33.6 $30.5 7%
Non-Interest Income 67.1 69.9 89.8 54.7 53.4 6%
Net Income 11.2 11.1 12.8 7.1 5.9 22%
N.I. Available to Common Shareholders 11.2 11.1 11.4 5.6 4.4 39%
Return on Equity 10.95% 11.97% 15.84% 9.66% 8.59% 7%
Diluted Earnings per Share $1.05 $ 1.08 $ 1.25 $0.70 $0.62 17%
Book Value per Share $10.10 $ 9.29 $ 8.80 $7.81 $7.20 10%
Net Interest Margin 4.25% 4.13% 4.29% 4.51% 4.22% 0%
NPAs & 90 PD / Total Assets 0.28% 0.25% 0.29% 0.84% 1.30% -20%
Loan Loss Reserves / Loans, HFI 1.16% 1.27% 1.65% 1.63% 1.62% -7%
Total Risk Based Capital/RBA 13.79% 13.91% 12.05% 12.42% 12.99% 2%
Average Shares Outstanding, diluted 10,689,219 10,299,471 10,271,874 10,165,105 7,003,556 13%
Page 10
|
|
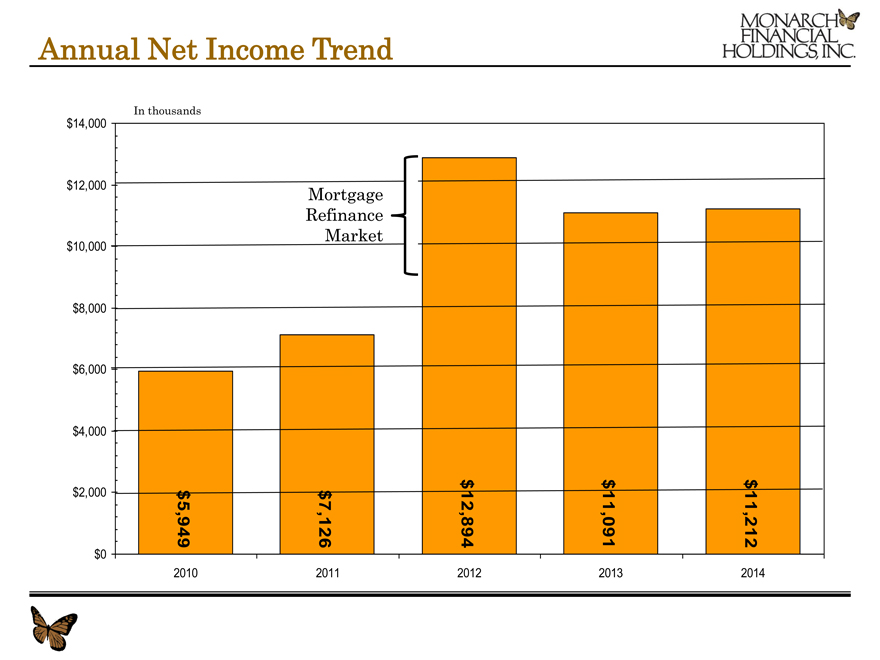
Annual Net Income Trend
In thousands
$14,000
$12,000 Mortgage
Refinance
Market
$10,000
$8,000
$6,000
$4,000
$ $ $
$2,000 $ $
5,949 7,126 4 12,89 1 11,09 2 11,21
$0
2010 2011 2012 2013 2014
|
|
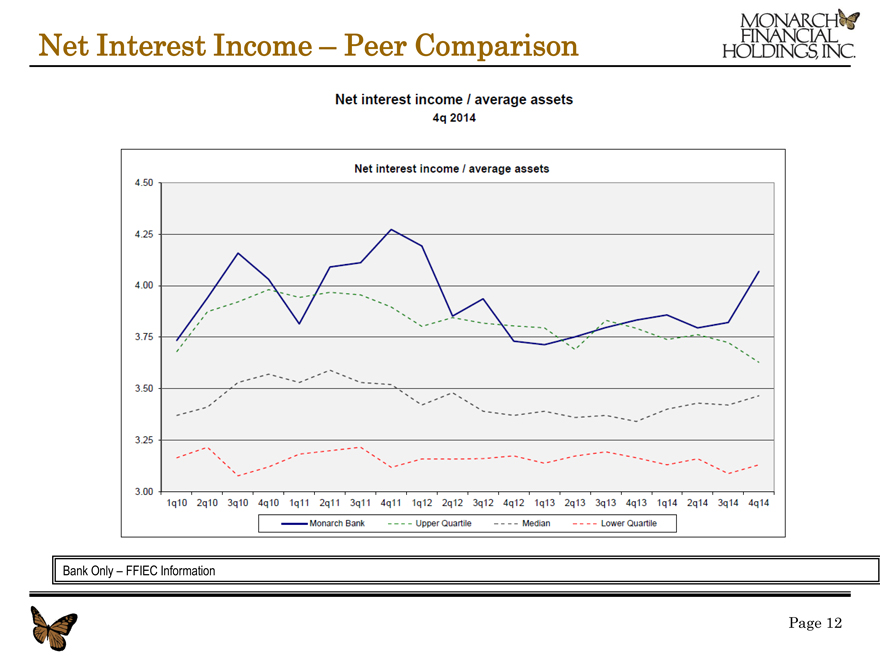
Net Interest Income – Peer Comparison
Bank Only – FFIEC Information
Page 12
|
|
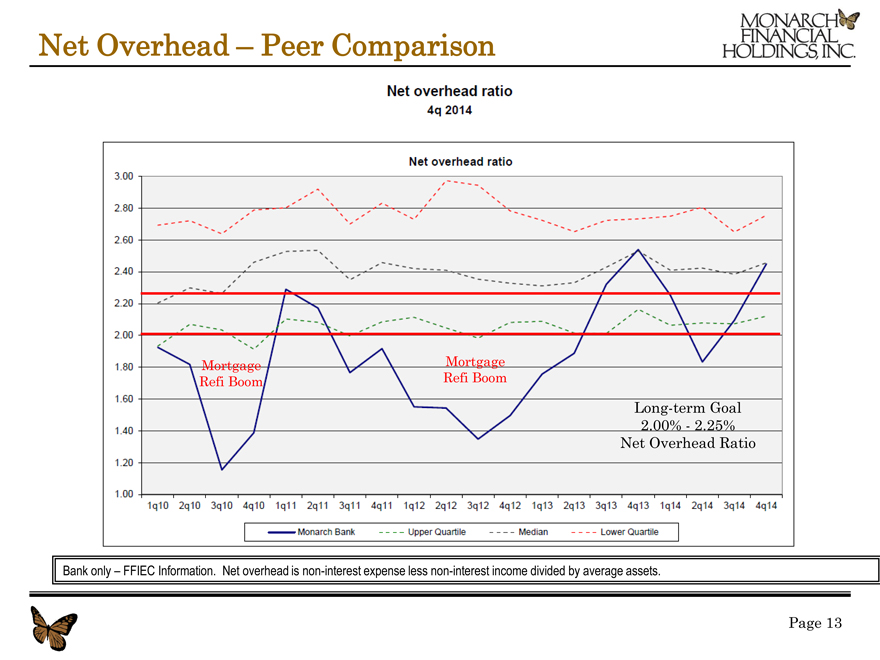
Net Overhead – Peer Comparison
Mortgage Mortgage Refi Boom Refi Boom
Long-term Goal
2.00%—2.25% Net Overhead Ratio
Bank only – FFIEC Information. Net overhead is non-interest expense less non-interest income divided by average assets.
Page 13
|
|
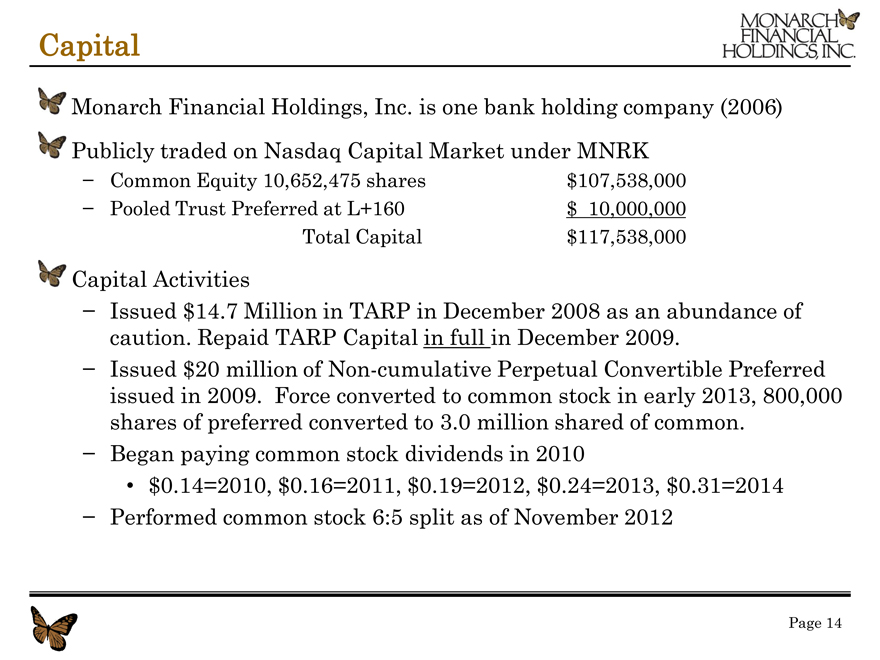
Capital
Monarch Financial Holdings, Inc. is one bank holding company (2006) Publicly traded on Nasdaq Capital Market under MNRK
- Common Equity 10,652,475 shares $107,538,000
- Pooled Trust Preferred at L+160 $ 10,000,000 Total Capital $117,538,000
Capital Activities
- Issued $14.7 Million in TARP in December 2008 as an abundance of caution. Repaid TARP Capital in full in December 2009.
- Issued $20 million of Non-cumulative Perpetual Convertible Preferred issued in 2009. Force converted to common stock in early 2013, 800,000 shares of preferred converted to 3.0 million shared of common.
- Began paying common stock dividends in 2010
$0.14=2010, $0.16=2011, $0.19=2012, $0.24=2013, $0.31=2014
- Performed common stock 6:5 split as of November 2012
Page 14
|
|
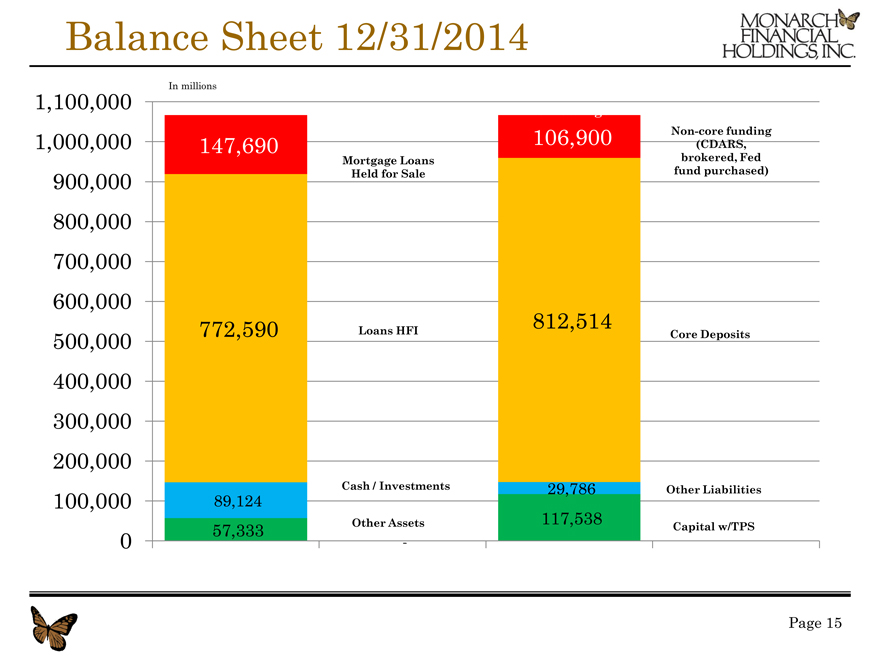
Balance Sheet 12/31/2014
In millions
1,100,000 Borrowings
106,900 Non-core funding
1,000,000 147,690 (CDARS,
Mortgage Loans brokered, Fed
900,000 Held for Sale fund purchased)
800,000
700,000
600,000
772,590 812,514
500,000 Loans HFI Core Deposits
400,000
300,000
200,000
100,000 89,124 Cash / Investments 29,786 Other Liabilities
57,333 Other Assets 117,538 Capital w/TPS
0 —
Page 15
|
|
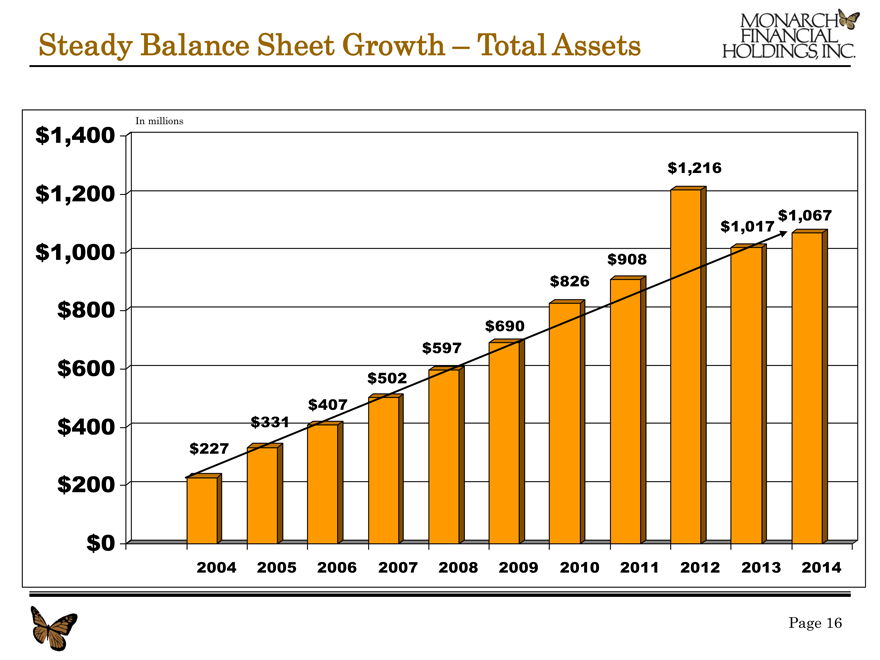
Steady Balance Sheet Growth – Total Assets
In millions
$1,400
$1,216
$1,200
$1,017 $1,067
$1,000 $908
$826
$800
$690
$597
$600 $502
$407
$400 $331
$227
$200
$0
2004 2005 2006 2007 2008 2009 2010 2011 2012 2013 2014
Page 16
|
|
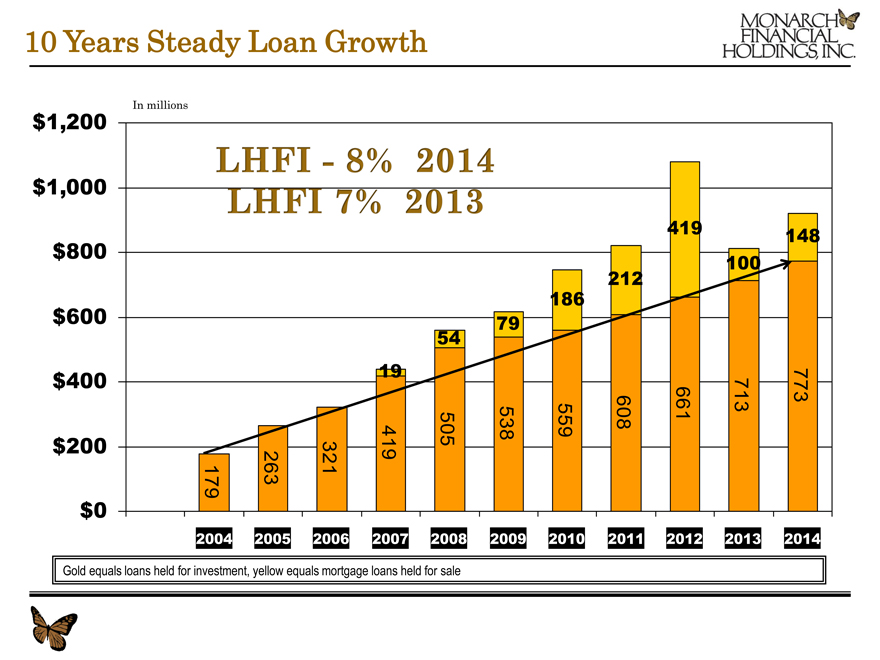
10 Years Steady Loan Growth
In millions
$1,200
$1,000
419 148
$800 100
212
186
$600 79
54
19
$ $ 200 400 419 505 538 559 608 661 713 773
179 263 321
$0
2004 2005 2006 2007 2008 2009 2010 2011 2012 2013 2014
Gold equals loans held for investment, yellow equals mortgage loans held for sale
|
|
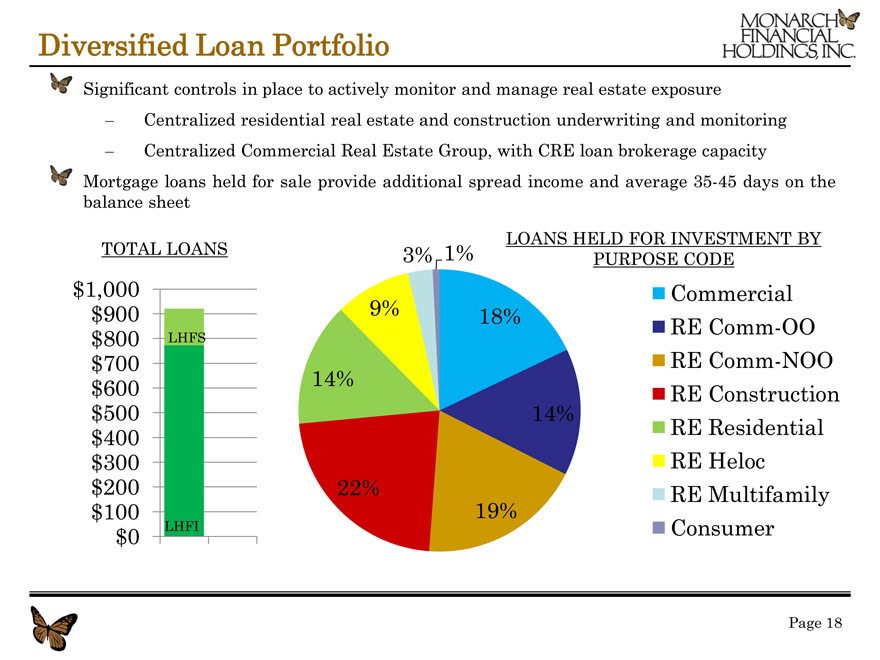
Diversified Loan Portfolio
Significant controls in place to actively monitor and manage real estate exposure
– Centralized residential real estate and construction underwriting and monitoring
– Centralized Commercial Real Estate Group, with CRE loan brokerage capacity
Mortgage loans held for sale provide additional spread income and average 35-45 days on the
balance sheet
LOANS HELD FOR INVESTMENT BY
TOTAL LOANS 3% 1% PURPOSE CODE
$1,000 Commercial
$900 9% 18%
$800 LHFS RE Comm-OO
$700 RE Comm-NOO
$600 14% RE Construction
$500 14%
$400 RE Residential
$300 RE Heloc
$200 22% RE Multifamily
$100 19%
$0 LHFI Consumer
Page 18
|
|
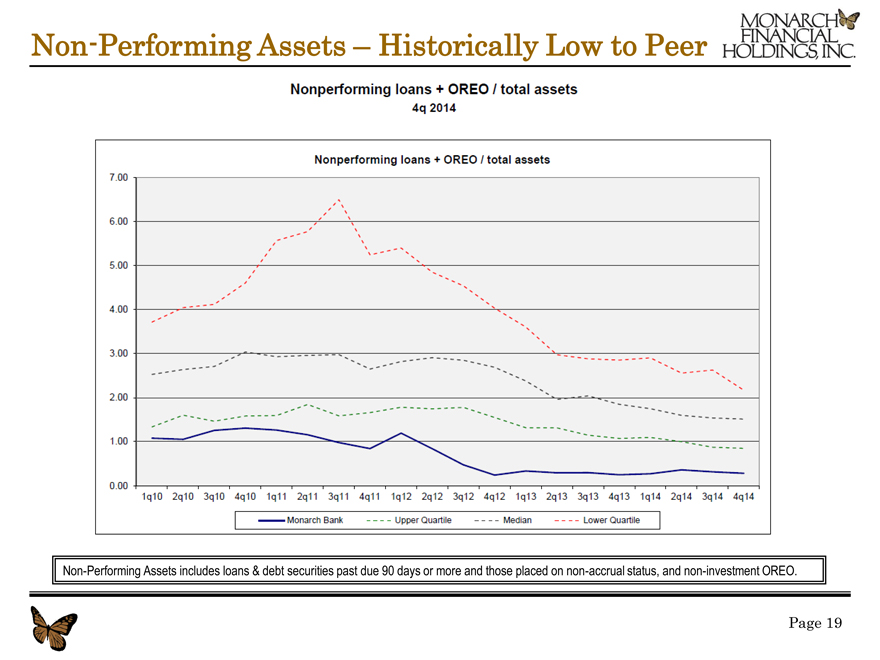
Non-Performing Assets – Historically Low to Peer
Non-Performing Assets includes loans & debt securities past due 90 days or more and those placed on non-accrual status, and non-investment OREO.
Page 19
|
|
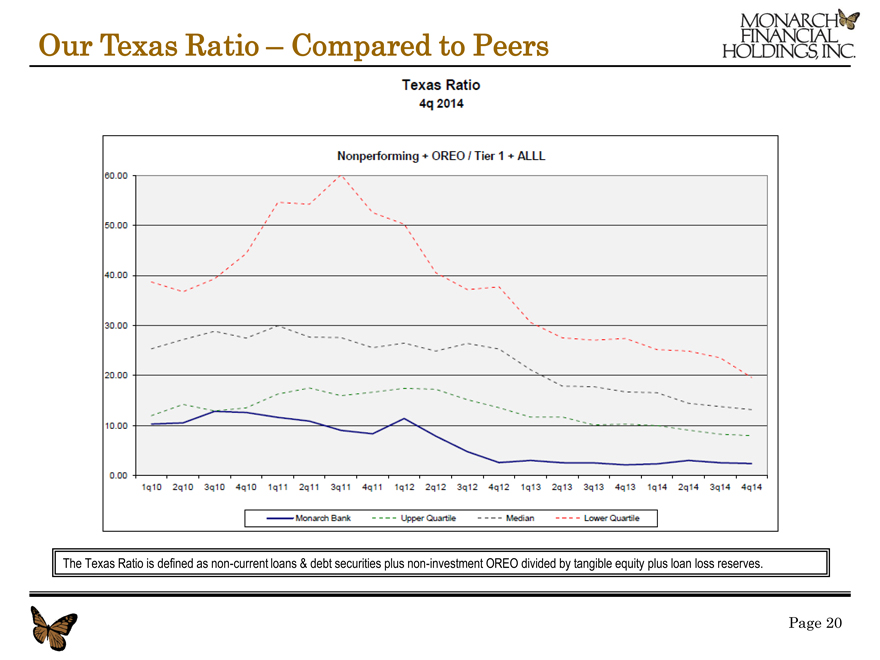
Our Texas Ratio – Compared to Peers
The Texas Ratio is defined as non-current loans & debt securities plus non-investment OREO divided by tangible equity plus loan loss reserves.
Page 20
|
|
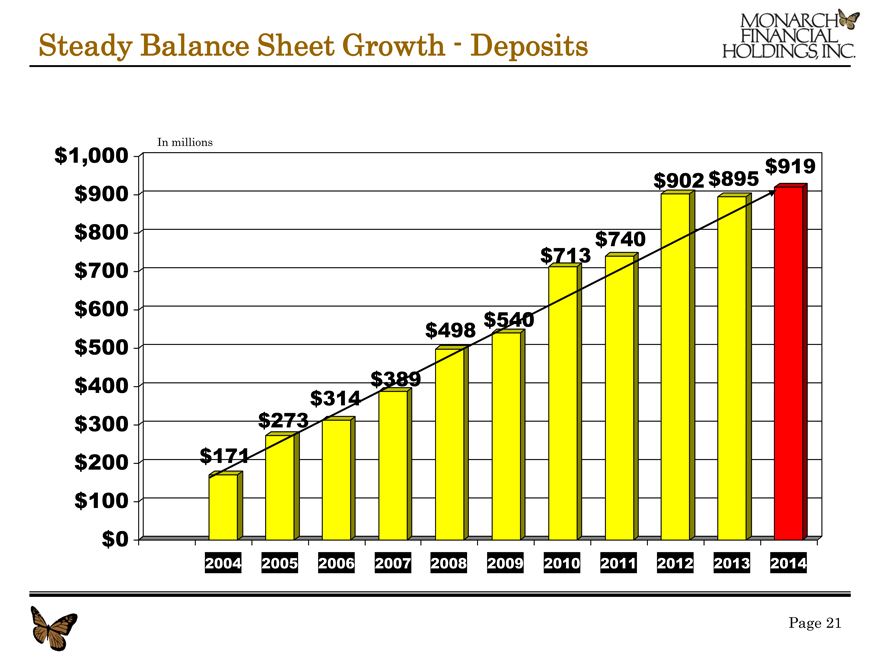
Steady Balance Sheet Growth—Deposits
$1,000 In millions
$919 $902 $895 $900 $800 $740 $713 $700 $600 $540 $498 $500 $400 $389 $273$314 $300 $200 $171 $100 $0
2004 2005 2006 2007 2008 2009 2010 2011 2012 2013 2014
Page 21
|
|
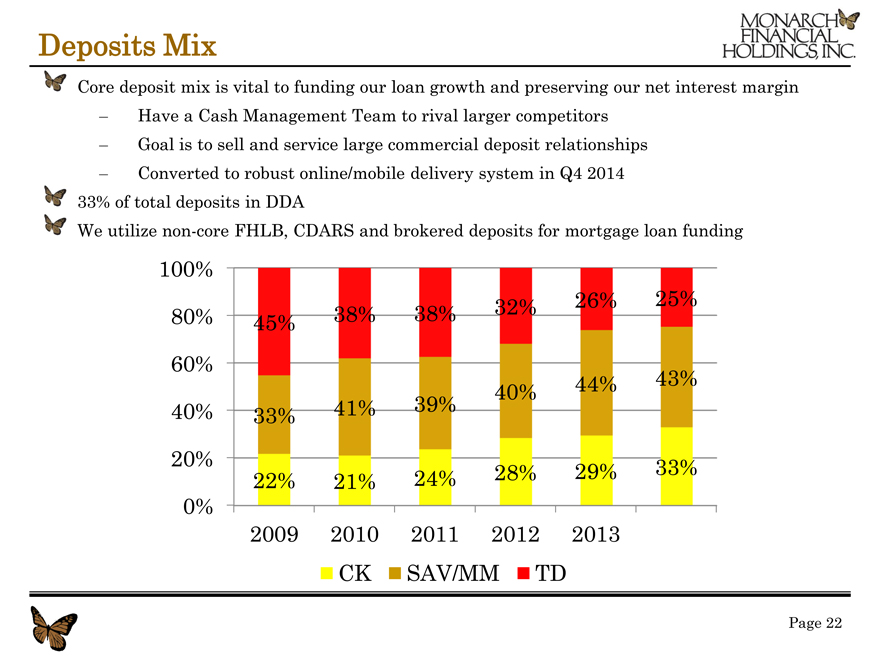
Deposits Mix
Core deposit mix is vital to funding our loan growth and preserving our net interest margin
– Have a Cash Management Team to rival larger competitors
– Goal is to sell and service large commercial deposit relationships
– Converted to robust online/mobile delivery system in Q4 2014 33% of total deposits in DDA
We utilize non-core FHLB, CDARS and brokered deposits for mortgage loan funding
100%
32% 26% 25% 80% 45% 38% 38% 60% 44% 43% 40% 40% 41% 39% 33% 20% 33% 22% 21% 24% 28% 29% 0% 2009 2010 2011 2012 2013 CK SAV/MM TD
Page 22
|
|
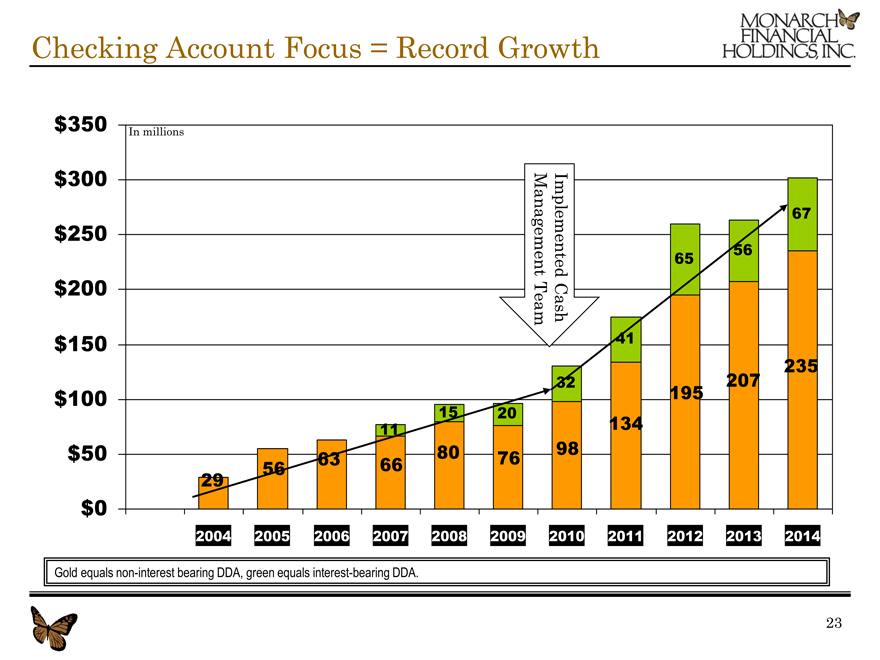
Checking Account Focus = Record Growth
$350 In millions
$300
67
$250
56
Management Implemented 65
$200
TeamCash
$150 41
235
32 207
$100 195
15 20
11 134
$50 80 76 98
56 63 66 29
$0
2004 2005 2006 2007 2008 2009 2010 2011 2012 2013 2014
Gold equals non-interest bearing DDA, green equals interest-bearing DDA.
23
|
|
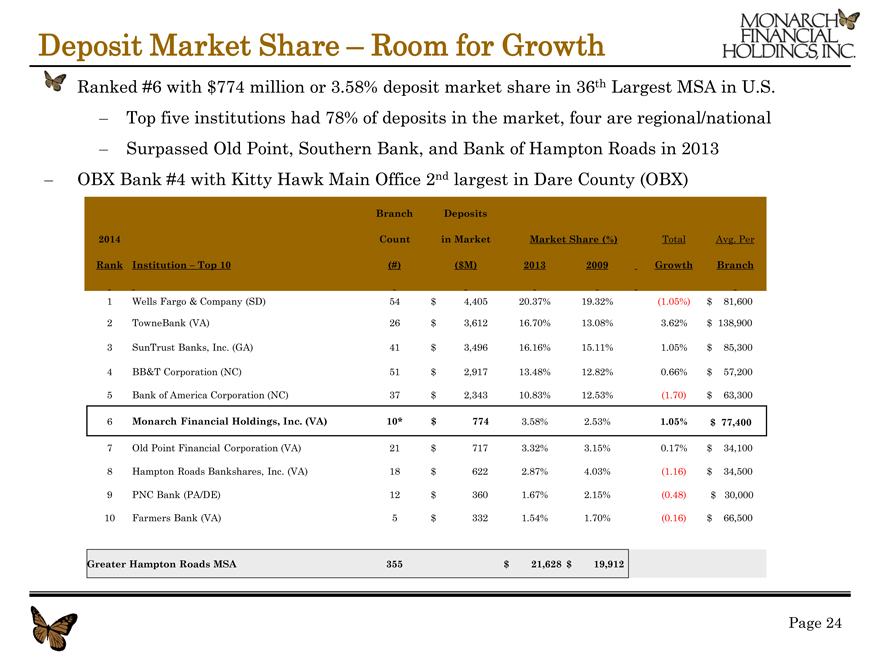
Deposit Market Share – Room for Growth
Ranked #6 with $774 million or 3.58% deposit market share in 36th Largest MSA in U.S.
– Top five institutions had 78% of deposits in the market, four are regional/national
– Surpassed Old Point, Southern Bank, and Bank of Hampton Roads in 2013
– OBX Bank #4 with Kitty Hawk Main Office 2nd largest in Dare County (OBX)
Branch Deposits
2014 Count in Market Market Share (%) Total Avg. Per
Rank Institution – Top 10 (#) ($M) 2013 2009 Growth Branch
1 Wells Fargo & Company (SD) 54 $ 4,405 20.37% 19.32% (1.05%) $ 81,600
2 TowneBank (VA) 26 $ 3,612 16.70% 13.08% 3.62% $ 138,900
3 SunTrust Banks, Inc. (GA) 41 $ 3,496 16.16% 15.11% 1.05% $ 85,300
4 BB&T Corporation (NC) 51 $ 2,917 13.48% 12.82% 0.66% $ 57,200
5 Bank of America Corporation (NC) 37 $ 2,343 10.83% 12.53% (1.70) $ 63,300
6 Monarch Financial Holdings, Inc. (VA) 10* $ 774 3.58% 2.53% 1.05% $ 77,400
7 Old Point Financial Corporation (VA) 21 $ 717 3.32% 3.15% 0.17% $ 34,100
8 Hampton Roads Bankshares, Inc. (VA) 18 $ 622 2.87% 4.03% (1.16) $ 34,500
9 PNC Bank (PA/DE) 12 $ 360 1.67% 2.15% (0.48) $ 30,000
10 Farmers Bank (VA) 5 $ 332 1.54% 1.70% (0.16) $ 66,500
Greater Hampton Roads MSA 355 $ 21,628 $ 19,912
Page 24
|
|
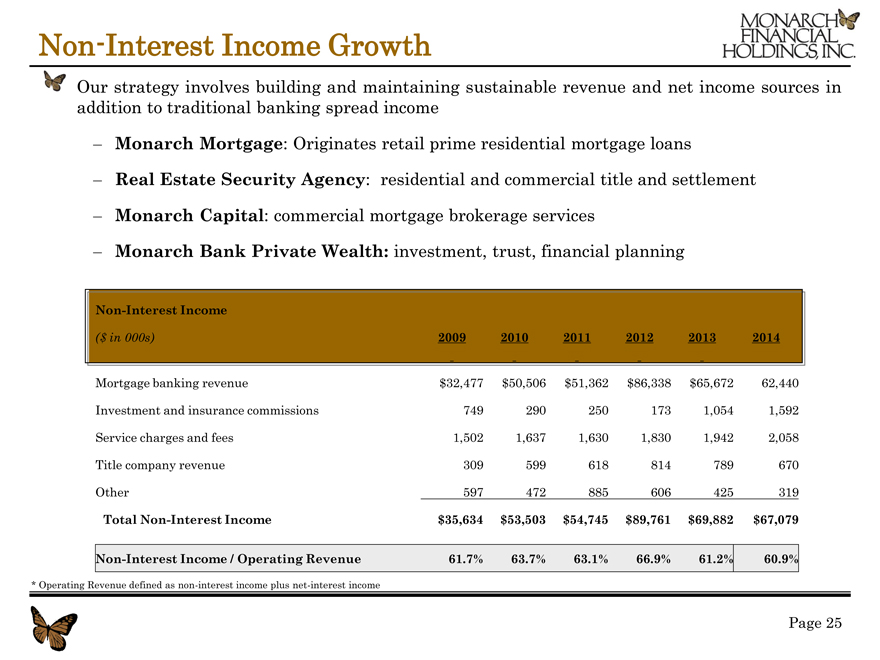
Non-Interest Income Growth
Our strategy involves building and maintaining sustainable revenue and net income sources in addition to traditional banking spread income
– Monarch Mortgage: Originates retail prime residential mortgage loans
– Real Estate Security Agency: residential and commercial title and settlement
– Monarch Capital: commercial mortgage brokerage services
– Monarch Bank Private Wealth: investment, trust, financial planning
Mortgage banking revenue $32,477 $50,506 $51,362 $86,338 $65,672 62,440 Investment and insurance commissions 749 290 250 173 1,054 1,592
Service charges and fees 1,502 1,637 1,630 1,830 1,942 2,058 Title company revenue 309 599 618 814 789 670
Other 597 472 885 606 425 319
Total Non-Interest Income $35,634 $53,503 $54,745 $89,761 $69,882 $67,079
Non-Interest Income / Operating Revenue 61.7% 63.7% 63.1% 66.9% 61.2% 60.9%
* Operating Revenue defined as non-interest income plus net-interest income
Page 25
|
|
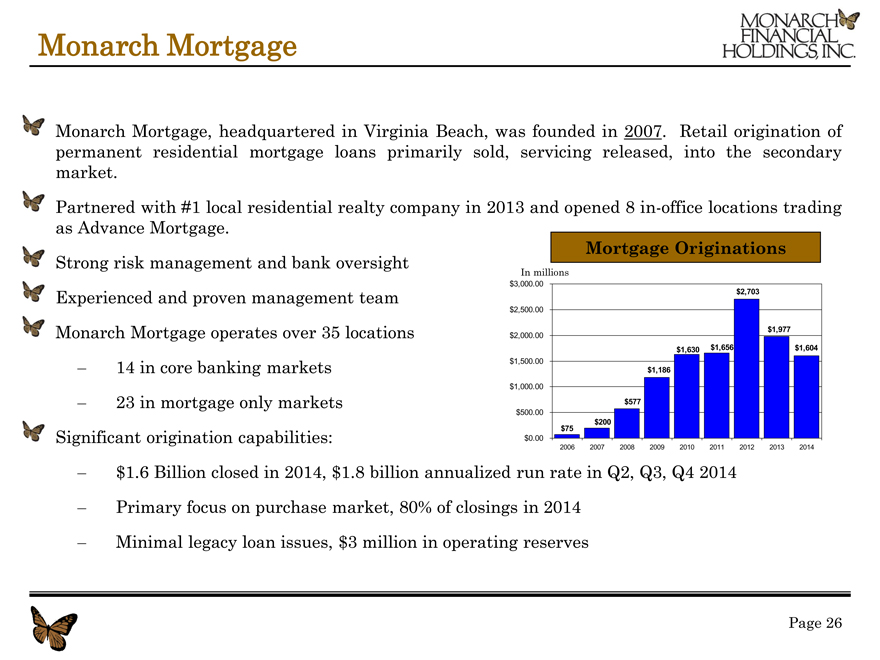
Monarch Mortgage
Monarch Mortgage, headquartered in Virginia Beach, was founded in 2007. Retail origination of permanent residential mortgage loans primarily sold, servicing released, into the secondary market.
Partnered with #1 local residential realty company in 2013 and opened 8 in-office locations trading as Advance Mortgage.
Mortgage Originations
Strong risk management and bank oversight
In millions $3,000.00
Experienced and proven management team $2,703
$2,500.00
$1,977
Monarch Mortgage operates over 35 locations $2,000.00
$1,630 $1,656 $1,604 $1,500.00
– 14 in core banking markets $1,186
$1,000.00
– 23 in mortgage only markets $577
$500.00
$75 $200
Significant origination capabilities: $0.00
2006 2007 2008 2009 2010 2011 2012 2013 2014
– $1.6 Billion closed in 2014, $1.8 billion annualized run rate in Q2, Q3, Q4 2014
– Primary focus on purchase market, 80% of closings in 2014
– Minimal legacy loan issues, $3 million in operating reserves
Page 26
|
|
Monarch Bank Private Wealth
Opened Monarch Bank Private Wealth in September 2012 Hired proven team from Suntrust Bank
- Investment Professionals, Private Bankers, Commercial Lender, CFPs
- Non-compete and non-solicitations didn’t expire until September 2013 Raymond James Financial Services (RJFS) serves as Broker-Dealer Target market is retiree and professionals with $500,000+ in investible assets Through December 31, 2014
- $235 million in assets under management
- $76 million in discretionary fee-based equity model portfolio accounts
- 221 client relationships, 81% with Goal Planning & Monitoring plans Plans to integrate/grow the business throughout banking footprint with offices:
- Williamsburg – Headquarters, retirement market
- Virginia Beach – Recently hired experience leader
Page 27
|
|
Risk Management
Company has an Enterprise Risk Management Committee to ensure risk is properly identified and managed
The credit risk within the company is overseen by our experienced Chief Risk Officer and Chief Credit Officer
- All loans are reviewed and loan relationships that exceed $1,500,000 are approved by either a management loan committee or a board of directors’ loan committee weekly
- All loans are risk rated with those ratings reviewed annually by an independent third-party loan review service
Mortgage operational risks are managed through an experienced senior management team at Monarch Mortgage along with oversight from Monarch Bank senior management. William Morrison, Monarch Mortgage CEO, previously served as a chief credit officer for a local community bank
Investment risk oversight of Raymond James Financial Services
Other than credit risk our banking risk includes interest rate risk, which we manage through an active Asset/Liability Management Committee
Page 28
|
|
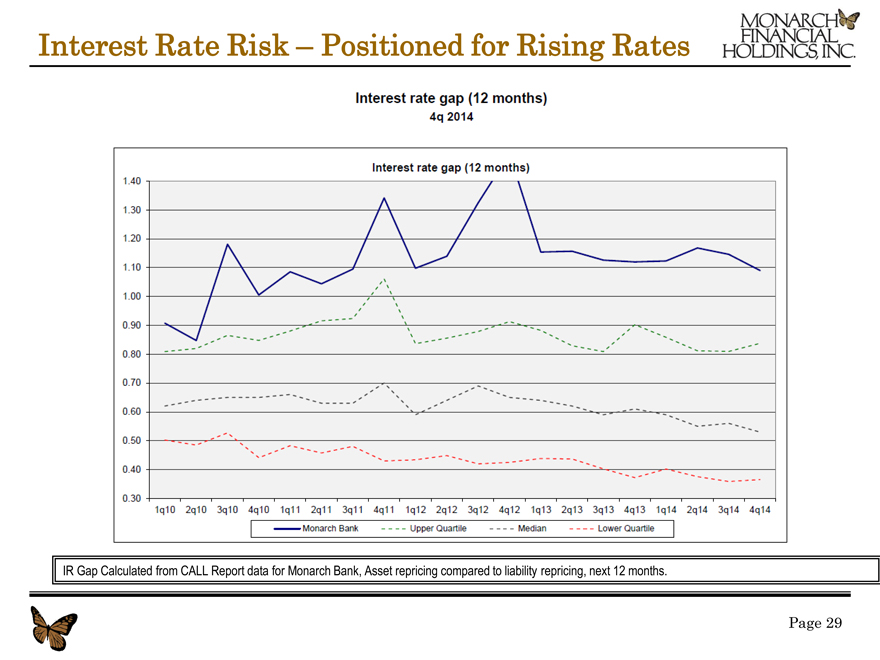
Interest Rate Risk – Positioned for Rising Rates
IR Gap Calculated from CALL Report data for Monarch Bank, Asset repricing compared to liability repricing, next 12 months.
Page 29
|
|
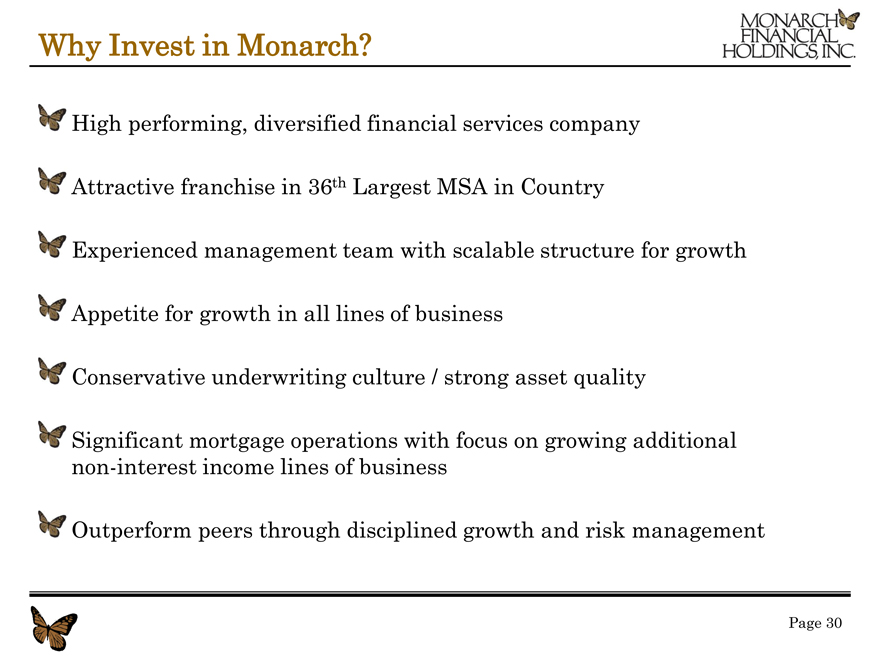
Why Invest in Monarch?
High performing, diversified financial services company
Attractive franchise in 36th Largest MSA in Country
Experienced management team with scalable structure for growth Appetite for growth in all lines of business Conservative underwriting culture / strong asset quality
Significant mortgage operations with focus on growing additional non-interest income lines of business
Outperform peers through disciplined growth and risk management
Page 30
|
|
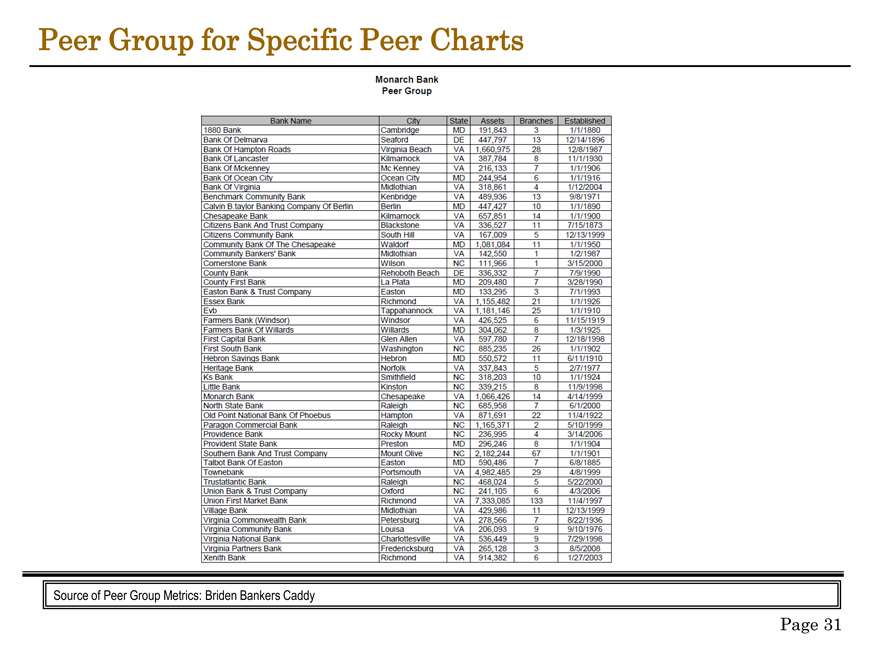
Peer Group for Specific Peer Charts
Source of Peer Group Metrics: Briden Bankers Caddy
Page 31
|
|
Thank You
Page 32