Attached files
| file | filename |
|---|---|
| 8-K - 8-K - IRON MOUNTAIN INC | a15-4975_18k.htm |
Exhibit 99.1
|
|
Earnings Commentary and Supplemental Information Fourth Quarter 2014 Unaudited |
|
|
Safe Harbor Statement 2 Safe Harbor Statement Under the Private Securities Litigation Reform Act of 1995: This presentation contains certain forward - looking statements within the meaning of the Private Securities Litigation Reform Act of 1995 and other securities laws and is subject to the sa fe - harbor created by such Act. Forward - looking statements include our financial performance out loo k and statements regarding our operations, economic p erformance, financial condition, goals, beliefs, future growth strategies, investment objectives, plans and current expectations, and the anticipated benefits of our conversion to a real estate investment trust for federal income tax purposes, including the opportunity to create value by acquiring leased space, our potential for a broadened investor base and enhan ced valuations and the estimated range of our remaining special distribution and our ordinary dividends . These forward - looking statements are subject to various known and unknown risks, uncertainties and other factors. When we use words such as "believes, " "expects," "anticipates," "estimates" or similar expressions, we are maki ng forward - lookin g statements. You should not rely upon forward - looking statements except as statements of our present intentions and of our present expectations, which may or may not occur. Although we believe that our forward - looking statements are based on reasonable assumptions, our expected results may not be achieved, and actual results may differ ma terially from our expectations. Important factors that could cause actual res ults to differ from our other expectations include, among others: (i) our expected ordinary dividends may be materially different from our estimates ; (ii) the cost to comply with current and future laws, regulation s and customer demands relating to privacy issues; (iii) the impact of litigation or disputes that may arise in connection with incidents in which we fail to protect our custom ers' information; (iv) changes in the price for our storage and information management services relative to the cost of providing such storage and information management services; (v) changes in customer preferences and demand for our storage and information management services; (vi) the adoption of alternative technologies and shifts by our customer s to storage of data through non - paper based technologies; (vii) the cost or potential liabilities associated with real estate necessary for our business; (viii) the performance of business partners upon whom we depend for technical assistance or managemen t expertise outside the U.S.; (ix) changes in the political and economic environments in the countries in which our international subsidiaries operate; (x) claims that our technology violates the intellectual property rights of a third party ; (xi) changes in the cost of our debt; (xii) the impact of alternative, more attractive investments on dividends; (xiii) our ability to qualify or remain qualifie d for taxation as a real estate investment trust ( “ REIT ” ); (xiv ) our ability or inability to complete acquisitions on satisfactory terms and to integrate acq uired companies efficiently; (x v) other trends in compet itive or economic conditions affecting our financial condition or results of operations not presently contemplated; and (xv i ) other risks described more fully in our filings with the Securities and Exchange Commission, including under the caption “ Risk Factors ” in our periodic reports, or incorporated therein . Except as required by law, we undertake no obligation to release publicly the result of any revision to these forward - looking statements that may be made to reflect events or circumstances after the date hereof or to reflect the occurrence of unanticipated events. |

|
|
All figures except per share and facility counts in 000s unless noted All figures in R$ unless noted Figures may not foot due to rounding Table of Contents 3 Investor Relations Contacts: Faten Freiha, 617-535-8404 Director, Investor Relations faten.freiha@ironmountain.com Melissa Marsden, 617-535-8595 Senior Vice President, Investor Relations melissa.marsden@ironmountain.com Earnings Commentary 4 Company Profile 7 Financial Highlights 8 Components of Year-over-Year Revenue Growth 9 Guidance Summary 10 FY 2014 Results Compared with Guidance 11 Quarterly Operating Performance 12 FY 2014 Operating Performance 13 Consolidated Balance Sheets 14 Consolidated Statements of Operations 15 Reconciliation of Operating Income to Adjusted OIBDA 16 Reconciliation of Reported Earnings per Share to Adjusted Earnings per Share 17 Reconciliation of Net Income Attributable to IRM to FFO & AFFO 18 Storage Net Operating Income (NOI) 19 Global Real Estate Portfolio 20 Revenue from Rental Activities and Storage NOI per Racked Square Foot 21 Portfolio Utilization 22 Gross Book Value of Real Estate Assets 23 Service Business Detail 24 Customer Data 25 Debt Schedule 26 Capitalization 27 Lease Obligations 28 Components of Value 29 Appendix 30 |

|
|
Earnings Commentary 4 Reconciliation of Non-GAAP Measures: Throughout this document, Iron Mountain will discuss (1) Adjusted Operating Income Before Depreciation, Amortization, Intangible Impairments, (Gain) Loss on Disposal / Write-down of Property, Plant and Equipment, Net (Excluding Real Estate) and REIT Costs (Adjusted OIBDA), (2) Adjusted Earnings Per Share (Adjusted EPS), (3) Funds From Operations (FFO NAREIT), (4) FFO (Normalized), (5) Adjusted Funds From Operations (AFFO) and (6) Storage Net Operating Income. These measures do not conform to accounting principles generally accepted in the United States (GAAP). The reconciliations of these measures to the appropriate GAAP measure, as required by the Regulation G under the Securities Exchange Act of 1934, as amended, are included later in this document (see Table of Contents). Iron Mountain Fourth Quarter 2014 Financial Results – Strong Fourth Quarter Operating Performance Driven by Solid Constant Dollar Storage Rental Growth and Continued Volume Gains – – Full-year Results in Line with Guidance Prior to the Impact of Currency Translation – – 2015 Guidance Updated to Reflect Impact of Foreign Currency, while C$ Expectations are Unchanged – Total reported revenues for the quarter were $778 million, compared with $768 million in 2013, while full-year total reported revenues were $3,118 million, compared with $3,025 million in 2013. On a constant dollar (C$) basis, total revenue growth for the quarter was 4.6%, reflecting solid storage rental revenue gains of 5.2% and service revenue growth of 3.7%. For the year, C$ total revenue growth was 4.4%, driven by storage rental revenue gains of 5.4% and service revenue growth of 2.9%. Adjusted OIBDA for the quarter was $220 million, compared with $195 million in 2013, while Adjusted OIBDA for the year was $926 million, compared with $895 million in 2013. Adjusted OIBDA for 2013 included $19 million of costs associated with the company’s restructuring in the fourth quarter and $23 million for the full year. Adjusted OIBDA for 2014 included $3.5 million of restructuring costs. Adjusted EPS for the fourth quarter was $0.25 per diluted share, compared with $0.21 per diluted share in 2013, while Adjusted EPS for the year was $1.36 per diluted share, compared with $1.40 per diluted share in 2013. Adjusted EPS for the quarter and full-year 2014 reflects a structural tax rate of 14.4%, while 2013 results have been restated to reflect a structural tax rate of 15.0%, for comparability with 2014, the year in which the company’s conversion to a REIT became effective. Both 2013 and 2014 Adjusted EPS include the impacts to Adjusted OIBDA noted above. GAAP EPS for the fourth quarter of 2014 was $0.06 per share, primarily due to charges related to the early extinguishment of debt, which reduced GAAP EPS by $0.08 per share. GAAP EPS for 2014 of $1.67 per share includes net tax benefits related to the deferred tax adjustment and other taxes related to the company’s conversion to a REIT effective January 1, 2014, partially offset by incremental taxes related to foreign repatriation. Funds From Operations, or FFO (Normalized), per share was $0.52 for the quarter and $2.27 for the year. C$ total storage rental growth of 5.4% for 2014 reflected strong increases of 12.9% in the company’s International business (including 27.6% C$ growth in Emerging Markets) and storage rental growth in the North American Records and Information Management (RIM) and North American Data Management (DM) segments of 2.8% and 2.7%, respectively. |

|
|
Earnings Commentary 5 In support of its strategic plan, during 2014, the company: Improved customer retention and increased positive volume growth by 0.5% in the North American Records Management (RM) business and 12.3% in the International business, supporting global Records Management net volume growth of 3.6%, Expanded revenue from Emerging Markets to 13.9% of total revenue in the quarter on a constant dollar basis, demonstrating progress toward the company’s goal to increase contribution from these markets to 16% by the end of 2016, Acquired 13 storage-related businesses and the records inventory of 14 document storage companies for total investment of approximately $189 million in 2014, with $125 million of the total consideration in emerging markets, and Expanded inventory space in the company’s underground and Boston Data Center facilities to support multiyear plan and ended year with strong commercial bookings and improved pipeline. “Our 2014 results reflect the sustainability of our storage rental business and the strong execution of our strategy to extend that durability with improved customer retention, a focus on new sales and continued volume gains,” said William L. Meaney, Iron Mountain’s president and chief executive officer. “During the fourth quarter, we made progress on key initiatives while delivering solid internal growth in both developed and emerging markets and continuing to grow our business in emerging markets. Our business fundamentals were strong and in line with our expectations, and we are pleased with our momentum moving into 2015.” Operations Review Operating performance continued to strengthen, with internal storage rental growth of 3.5% in the fourth quarter and 2.2% for the year. For 2014, internal storage rental gains in the International business were 6.3% (including 12.2% internal growth in emerging markets) and 0.3% and 2.3% in the North American RIM and North American DM segments, respectively. Foreign currency rate changes reduced reported storage rental revenue growth rates by 3.0% in the fourth quarter and 1.3% for the full year. As the company has previously noted, service revenues reflect a trend toward reduced retrieval/re-file activity and related transportation revenues, although in the North American RIM segment, the contribution from these core activities has stabilized in recent periods. Fourth quarter internal service revenue in North American RIM improved by 3.0% compared with the prior year, driven by growth in imaging revenue, higher revenue from non-recurring projects and a 9% increase in recycled paper pricing compared with the prior year. Financial Review Consolidated Adjusted OIBDA margins for the year of 29.7% included the 2013 restructuring costs noted earlier and ongoing REIT compliance costs. Adjusted OIBDA margins in the North American RIM segment remained strong at 38.5% for the year, and North American DM Adjusted OIBDA margins were 57.6%. The International business continued to deliver profitability on a portfolio basis in line with the company’s mid-20% target, with Adjusted OIBDA margins of 23.4% for the year. For 2014, real estate investment, including racking, totaled $200 million, acquisition spend was $189 million and other investments totaled $51 million. Maintenance capital expenditures were $77 million, or 2.5% of revenues for the year. The company had liquidity of more than $730 million primarily under its revolving credit facility and a net total lease adjusted leverage ratio of 5.4x at year end, as compared to a maximum allowable ratio of 6.5x. |

|
|
Earnings Commentary 6 The calculation for this ratio is net debt including the capitalized value of lease obligations divided by EBITDAR as defined in the company’s credit agreement. 2015 Guidance As noted in its preliminary 2015 guidance, the company expects C$ Total Reported Revenues and Adjusted OIBDA to be generally in line with its strategic plan. Adjusted EPS and FFO (Normalized) per share are expected to grow roughly in line with growth in Adjusted OIBDA, or 1% to 5% on a C$ basis. The company has updated its guidance for reported results to reflect the impact of the strengthening dollar, and details are available on page 10. |

|
|
Company Profile Iron Mountain is a global leader in enterprise storage with a high-return, real estate-based, business model, yielding revenues over $3 billion per annum. The company provides storage and information management services to a high-quality, diversified customer base across numerous industries and government organizations. Iron Mountain serves over 155,000 customers, including more than 92% of the Fortune 1000, and no single customer accounts for more than 2% of revenues. Iron Mountain provides storage and information management services in 36 countries on five continents, storing 530 million cubic feet of records in a portfolio of approximately 1,100 facilities containing more than 67 million square feet of space. The company employs over 20,000 people. Iron Mountain is organized as a REIT and its financial model is based on the recurring nature of its storage rental revenues and the resulting storage net operating income (NOI). Supported by its consistent, predictable storage rental revenues, which have increased for 26 consecutive years, the company generates predictable, low volatility growth in key metrics such as storage NOI and AFFO. This fundamental financial characteristic provides stability through economic cycles. Iron Mountain has the opportunity to invest capital at attractive returns both domestically and internationally. The company believes that there remains a large un-vended opportunity that can support sustained storage volumes in developed markets such as North America and high growth opportunities in emerging markets that are just beginning to outsource their storage of physical documents. Diversification of Total Revenue (As of 12/31/2014) 7 Countries Served (1) Includes Fulfillment Services, Document Management Services, Intellectual Property Management, Data Center, Consulting, Entertainment Services and other auxiliary services 3.3% 7.9% 18.3% 70.5% 68.2% 7.5% 8.2% 16.1% Asia Pacific Latin America Europe North America Records Mgmt Other Shredding Data Protection 2014 C$ Storage Rental Growth 5.4% 25-year Compound Annual Growth Rate 17.2% 26 YEARS OF STORAGE RENTAL GROWTH ’11 ’14 ’13 ’10 ’09 ’08 ’07 ’06 ’05 ’04 ’03 ’02 ’01 ’00 ’99 ’98 ’97 ’96 ’12 ’95 ’94 ’93 ’92 ’91 ’90 ’89 (1) Product Region $1,860 |

|
|
Financial Highlights 8 (1) Ordinary dividends per share for Q4 2014 and FY 2014 include a “catch-up” distribution of $0.255 per share or $53 million in total. The board declared a catch-up dividend because dividends in the first half of the year were declared and paid before the board had determined that we could elect REIT status effective January 1, 2014 and were lower than they otherwise would have been if the final determination to elect REIT status effective January 1, 2014 had been made prior to such distributions. The catch-up dividend brings the aggregate amount of ordinary distributions paid in 2014 to approximately $400 million. (2) Based on the payment date of November 4, 2014; declaration date was September 15, 2014 (3) Excludes $5.1 million of CapEx in FY 2014 related to the company’s REIT conversion (4) Includes Land, Buildings, Improvements, and Racking Structures (5) Includes CapEx related to service-related businesses, as well as corporate overhead support and office outfitting (6) Includes the sale of a stake in Iron Mountain India and the sale of the International Shredding Operations (in December 2014, the company divested operations in Australia, Ireland, and the United Kingdom). Q4 2013 Q4 2014 % Change FY 2013 FY 2014 % Change Storage Rental $455,364 $465,401 2.2% $1,784,721 $1,860,243 4.2% Service 312,843 312,577 (0.1)% 1,239,902 1,257,450 1.4% Total Revenues $768,207 $777,978 1.3% $3,024,623 $3,117,693 3.1% Gross Margin $432,126 $440,954 2.0% $1,735,745 $1,773,057 2.1% Gross Margin % 56.3% 56.7% 40 bps 57.4% 56.9% -50 bps Adjusted OIBDA $194,920 $220,033 12.9% $894,581 $925,797 3.5% Adjusted OIBDA % 25.4% 28.3% 290 bps 29.6% 29.7% 10 bps Adjusted EPS $0.21 $0.25 19.0% $1.40 $1.36 (2.9)% FFO (Normalized) per Share $0.52 $2.27 Ordinary Dividends per Share (1) $0.27 $0.73 n/a $1.08 $2.02 86.6% Special Dividends per Share (2) $3.61 $3.61 Weighted Average Fully-diluted Shares Outstanding 192,699 205,494 6.6% 192,412 196,749 2.3% Storage Net Operating Income (NOI) $381,878 $1,514,999 Capital Expenditures (3) and Investments Real Estate: Investment (4) $47,415 $54,254 14.4% $135,708 $199,663 47.1% Maintenance 34,072 26,344 (22.7)% 61,863 57,574 (6.9)% 81,487 80,598 (1.1)% 197,571 257,237 30.2% Non-Real Estate: Investment (5) 34,899 17,391 (50.2)% 68,405 50,854 (25.7)% Maintenance 8,374 6,156 (26.5)% 22,644 19,527 (13.8)% 43,273 23,547 (45.6)% 91,049 70,381 (22.7)% Business and Customer Acquisitions (6) 218,048 61,610 (71.7)% 346,140 153,805 (55.6)% Total Capital Expenditures and Investments $342,808 $165,755 (51.6)% $634,760 $481,423 (24.2)% |

|
|
Components of Year-over-Year Revenue Growth 9 Net Volume Growth Rate Records Management Volume Growth Q4-14 3.6% -1.9% -4.4% 5.9% 2.2% 1.7% Q3-14 5.5% -1.9% -4.5% 6.1% 2.1% 3.7% Q2-14 7.6% -2.0% -4.7% 6.1% 2.2% 5.9% Q1-14 6.7% -2.3% -4.5% 6.2% 2.1% 5.2% Q4-13 5.8% -2.5% -4.6% 6.3% 2.1% 4.5% Q3-13 3.2% -2.6% -4.6% 6.3% 2.0% 2.1% Q2-13 1.4% -2.6% -4.6% 6.3% 1.9% 0.3% Q1-13 2.6% -2.7% -4.7% 6.6% 1.9% 1.5% Outperm/Terms New Volume from Existing Customers Destructions New Sales Business & Customer Acquisitions Revenue Growth Rates Reported 2.2% (0.1)% 1.3% 4.2% 1.4% 3.1% Less: Impact of FX Rate Changes and Adjustments (3.0)% (3.8)% (3.3)% (1.2)% (1.5)% (1.3)% Constant Currency 5.2% 3.7% 4.6% 5.4% 2.9% 4.4% Less: Impact of Acquisitions and Dispositions 1.7% 1.4% 1.6% 3.2% 3.6% 3.4% Internal Growth Rate 3.5% 2.3% 3.0% 2.2% (0.7)% 1.0% Service Revenue Total Revenue Q4 2014 FY 2014 Storage Rental Revenue Service Revenue Total Revenue Storage Rental Revenue |

|
|
Guidance Summary 10 Financial Performance Outlook (1) YOY growth compared to 2014 constant dollar (C$) budget rates; includes 0% - 2% internal revenue growth (2) Assumes 212 million shares outstanding (3) AFFO (New Definition) is defined in the appendix (page 30) and further adjusts for Non-Real Estate Investment $MM 2015 Guidance C$ YOY Growth 2015 Guidance C$ YOY Growth Operating Performance Revenue $3,030 - $3,150 1% - 5% (1) $3,135 - $3,290 1% - 5% (1) Adjusted OIBDA $905 - $945 1% - 5% (1) $945 - $985 2% - 5% (1) Adjusted EPS – Fully Diluted $1.15 - $1.30 (2) $1.23 - $1.38 FFO (Normalized) $425 - $465 $440 - $480 FFO (Normalized) per share $2.00 - $2.20 (2) $2.12 - $2.28 AFFO (Old Definition) $550 - $590 $570 - $610 AFFO (New Definition) (3) $480 - $520 n/a Capital Allocation Total Capital and Investments (excluding Dividends) $550 - $650 $550 - $650 Real Estate Investment $230 - $270 $240 - $280 Maintenance CapEx $70 - $90 $80 - $100 Non-Real Estate Investment $70 - $90 $40 - $60 Business and Customer Acquisitions $150 - $250 $150 - $250 As of December 31, 2014 As of September 30, 2014 |

|
|
FY 2014 Results Compared with Guidance GrowthFY 2014 Results R$ 2014% Growth FY 2014 Guidance R$as of 9/30/2014 %Growth C$ $MM Operating Performance Operating Performance Revenue $3,118 3.1% 4.4% $3,100 - $3,150 1% - 5% Adjusted OIBDA(1) $926 3.5% 4.7% $925 - $945 2% - 5% Adjusted EPS – Fully Diluted $1.36 $1.33 - $1.44 FFO (NAREIT) $502 FFO (NAREIT) per share $2.55 FFO (Normalized) $447 $435 - $465 FFO (Normalized) per share $2.27 $2.21 - $2.46 AFFO $578 $555 - $595 Capital Allocation Ordinary Dividends $401 $400 Total Capital and Investments (excluding Dividends) $517 $540 Real Estate Investment(2) $200 $190 - $210 Maintenance CapEx(3) $77 $80 - $100 Non-Real Estate Investment(4) $51 $45 - $55 Business and Customer Acquisitions(5) $189 $190 - $200 (1) Adjusted OIBDA for FY 2014 includes $3.5 million of restructuring charges and $23 million for FY 2013 (2) Includes Data Center construction costs of $35.2 million (3) Includes real estate and non-real estate maintenance (4) Includes ~$7 million related to the relocation of the company’s corporate headquarters (5) Includes the purchase of records inventory of 14 document storage companies; does not reflect the sale of a stake of Iron Mountain India nor the sale of the International Shredding Operations (in December 2014, the company divested operations in Australia, Ireland, and the United Kingdom). Selected metric definitions are available in the appendix |

|
|
Quarterly Operating Performance 12 (1) Excludes certain costs and expenditures associated with the company’s conversion to a REIT Q4 Results (1) % Growth Q4 2013 Q4 2014 Reported - Impact of FX Rate Changes and Adjustments = Constant Currency - Impact of Acquisitions and Dispositions = Internal Growth NA Records and Information Management Storage Revenue $267,285 $269,611 0.9% (0.8)% 1.7% 0.8% 0.9% Service Revenue 174,896 177,068 1.3% (1.1)% 2.4% (0.6)% 3.0% Total Revenue $442,181 $446,679 1.0% (1.0)% 2.0% 0.2% 1.8% Adjusted OIBDA 146,301 171,793 Adjusted OIBDA Margin % 33.1% 38.5% NA Data Management Storage Revenue $60,516 $63,593 5.1% (0.6)% 5.7% (0.4)% 6.1% Service Revenue 37,349 35,604 (4.7)% (0.5)% (4.2)% (0.1)% (4.1)% Total Revenue $97,865 $99,197 1.4% (0.5)% 1.9% (0.3)% 2.2% Adjusted OIBDA 55,022 57,009 Adjusted OIBDA Margin % 56.2% 57.5% International Storage Revenue $124,667 $128,891 3.4% (8.8)% 12.2% 4.7% 7.5% Service Revenue 100,243 99,469 (0.8)% (9.7)% 8.9% 5.2% 3.7% Total Revenue $224,910 $228,360 1.5% (9.2)% 10.7% 4.8% 5.9% Adjusted OIBDA 49,534 45,634 Adjusted OIBDA Margin % 22.0% 20.0% Corporate and Other Storage Revenue $2,896 $3,305 14.1% 0.0% 14.1% 0.0% 14.1% Service Revenue 355 437 23.1% 0.0% 23.1% 0.0% 23.1% Total Revenue $3,251 $3,742 15.1% 0.0% 15.1% 0.0% 15.1% Adjusted OIBDA (55,937) (54,403) |

|
|
FY 2014 Operating Performance 13 (1) Excludes certain costs and expenditures associated with the company’s conversion to a REIT FY Results (1) % Growth FY 2013 FY 2014 Reported - Impact of FX Rate Changes and Adjustments = Constant Currency - Impact of Acquisitions and Dispositions = Internal Growth NA Records and Information Management Storage Revenue $1,057,126 $1,080,013 2.2% (0.6)% 2.8% 2.5% 0.3% Service Revenue 712,107 715,348 0.5% (0.9)% 1.4% 1.9% (0.5)% Total Revenue $1,769,233 $1,795,361 1.5% (0.8)% 2.3% 2.3% 0.0% Adjusted OIBDA 645,575 690,419 Adjusted OIBDA Margin % 36.5% 38.5% NA Data Management Storage Revenue $241,772 $247,017 2.2% (0.5)% 2.7% 0.4% 2.3% Service Revenue 154,747 143,190 (7.5)% (0.5)% (7.0)% 0.5% (7.5)% Total Revenue $396,519 $390,207 (1.6)% (0.5)% (1.1)% 0.4% (1.5)% Adjusted OIBDA 235,380 224,696 Adjusted OIBDA Margin % 59.4% 57.6% International Storage Revenue $473,723 $521,127 10.0% (2.9)% 12.9% 6.6% 6.3% Service Revenue 371,876 397,418 6.9% (3.0)% 9.9% 7.9% 2.0% Total Revenue $845,599 $918,545 8.6% (2.9)% 11.5% 7.0% 4.5% Adjusted OIBDA 206,003 214,891 Adjusted OIBDA Margin % 24.4% 23.4% Corporate and Other Storage Revenue $12,100 $12,086 (0.1)% 0.0% (0.1)% 0.0% (0.1)% Service Revenue 1,172 1,494 27.5% 0.0% 27.5% 0.0% 27.5% Total Revenue $13,272 $13,580 2.3% 0.0% 2.3% 0.0% 2.3% Adjusted OIBDA (192,377) (204,209) |

|
|
Consolidated Balance Sheets 14 ASSETS 12/31/2013 12/31/2014 Current Assets: Cash and Cash Equivalents $120,526 $125,933 Restricted Cash 33,860 33,860 Accounts Receivable, Net 616,797 604,265 Other Current Assets 162,424 153,661 Total Current Assets 933,607 917,719 Property, Plant and Equipment: Property, Plant and Equipment at Cost 4,631,067 4,668,705 Less: Accumulated Depreciation (2,052,807) (2,117,978) Property, Plant and Equipment, Net 2,578,260 2,550,727 Other Assets, Net: Goodwill 2,463,352 2,423,783 Other Non-Current Assets, Net: 677,786 678,113 Total Other Assets, Net 3,141,138 3,101,896 Total Assets $6,653,005 $6,570,342 LIABILITIES AND EQUITY Current Liabilities: Current Portion of Long-Term Debt $52,583 $52,095 Other Current Liabilities 916,518 804,641 Total Current Liabilities 969,101 856,736 Long-Term Debt, Net of Current Portion 4,119,139 4,611,436 Other Long-term Liabilities 513,031 232,215 Total Long-term Liabilities 4,632,170 4,843,651 Total Liabilities $5,601,271 $5,700,387 Equity Total Stockholders' Equity $1,041,238 $856,355 Noncontrolling Interests 10,496 13,600 Total Equity 1,051,734 869,955 Total Liabilities and Equity $6,653,005 $6,570,342 |

|
|
Consolidated Statements of Operations 15 Q4 2013 Q4 2014 % Change FY 2013 FY 2014 % Change Revenues: Storage Rental $455,364 $465,401 2.2% $1,784,721 $1,860,243 4.2% Service 312,843 312,577 (0.1)% 1,239,902 1,257,450 1.4% Total Revenues $768,207 $777,978 1.3% $3,024,623 $3,117,693 3.1% Operating Expenses: Cost of Sales (excluding Depreciation and Amortization) $336,081 $337,024 0.3% $1,288,878 $1,344,636 4.3% Selling, General and Administrative 250,844 224,648 (10.4)% 924,031 869,572 (5.9)% Depreciation and Amortization 83,249 88,575 6.4% 322,037 353,143 9.7% (Gain) Loss on Disposal/Write-Down of PP&E (excluding Real Estate), Net 958 (164) (117.1)% 430 1,065 n/a Total Operating Expenses $671,132 $650,083 (3.1)% $2,535,376 $2,568,416 1.3% Operating Income (Loss) $97,075 $127,895 31.7% $489,247 $549,277 12.3% Interest Expense, Net 63,518 72,984 14.9% 254,174 260,717 2.6% Other Expense (Income), Net 11,235 42,200 n/a 75,202 65,187 (13.3)% Income (Loss) from Continuing Operations before Provision (Benefit) 22,322 12,711 (43.1)% 159,871 223,373 39.7% for Income Taxes and (Gain) Loss on Sale of Real Estate Provision (Benefit) for Income Taxes (26,017) 876 (103.4)% 62,127 (97,275) n/a (Gain) Loss from Sale of Real Estate, Net of Tax - (839) 0.0% (1,417) (8,307) n/a Income (Loss) from Continuing Operations 48,339 12,674 (73.8)% 99,161 328,955 n/a Income (Loss) from Discontinued Operations, Net of Tax (684) 729 n/a 831 (209) n/a Net Income (Loss) 47,655 13,403 (71.9)% 99,992 328,746 n/a Less: Net Income (Loss) Attributable to Noncontrolling Interests 596 654 9.7% 3,530 2,627 (25.6)% Net Income (Loss) Attributable to Iron Mountain Incorporated $47,059 $12,749 (72.9)% $96,462 $326,119 n/a Earnings (Losses) per Share - Basic: Income (Loss) from Continuing Operations $0.25 $0.06 (76.0)% $0.52 $1.68 n/a Total Income (Loss) from Discontinued Operations - - 0.0% - - 0.0% Net Income (Loss) Attributable to Iron Mountain Incorporated $0.25 $0.06 (76.0)% $0.51 $1.67 n/a Earnings (Losses) per Share - Diluted: Income (Loss) from Continuing Operations $0.25 $0.06 (76.0)% $0.52 $1.67 n/a Total (Loss) Income from Discontinued Operations - - 0.0% - - 0.0% Net Income (Loss) Attributable to Iron Mountain Incorporated $0.24 $0.06 (75.0)% $0.50 $1.66 n/a Weighted Average Common Shares Outstanding - Basic 191,606 203,489 6.2% 190,994 195,278 2.2% Weighted Average Common Shares Outstanding - Diluted 192,699 205,494 6.6% 192,412 196,749 2.3% |

|
|
16 Reconciliation of Operating Income to Adjusted OIBDA (1) Includes realized and unrealized FX (gains) losses (2) Excludes realized and unrealized FX (gains) losses; FY 2013 includes $44 million loss on extinguishment of debt and FY 2014 includes $16 million Q4 2013 Q4 2014 % Change FY 2013 FY 2014 % Change Net Income (Loss) Attributable to Iron Mountain Incorporated $47,059 $12,749 (72.9)% $96,462 $326,119 n/a Add: Net Income (Loss) Attributable to Noncontrolling Interests 596 654 9.7% 3,530 2,627 (25.6)% Loss (Income) from Discontinued Operations, Net of Tax 684 (729) n/a (831) 209 n/a (Gain) Loss from Disposition of Real Estate, Net of Tax - (839) 0.0% (1,417) (8,307) n/a Provision (Benefit) for Income Taxes (26,017) 876 (103.4)% 62,127 (97,275) n/a FX (Gains) Losses (1) 13,660 32,726 n/a 36,203 58,318 61.1% Other (Income) Expense (2) (2,425) 9,473 n/a 38,999 6,869 (82.4)% Interest Expense, Net 63,518 72,984 14.9% 254,174 260,717 2.6% Operating Income (Loss) $97,075 $127,894 31.7% $489,247 $549,277 12.3% Depreciation and Amortization 83,249 88,575 6.4% 322,037 353,143 9.7% (Gain) Loss on Disposal/Write-Down of PP&E (excluding Real Estate), Net 958 (164) (117.1)% 430 1,065 n/a REIT Costs 13,638 3,728 (72.7)% 82,867 22,312 (73.1)% Adjusted OIBDA $194,920 $220,033 12.9% $894,581 $925,797 3.5% |

|
|
17 Reconciliation of Reported Earnings per Share to Adjusted Earnings per Share(1) (1) The Adjusted EPS for the three and twelve months ended December 31, 2013 has been restated to reflect a structural tax rate of approximately 15% for comparability with 2014, the year in which the company’s conversion to a REIT became effective. The Adjusted EPS for the three and twelve months ended December 31, 2014 reflects a structural tax rate of approximately 14.4%. Q4 2013 Q4 2014 % Change FY 2013 FY 2014 % Change Reported EPS - Fully Diluted from Continuing Operations $0.25 $0.06 (76.0)% $0.52 $1.67 n/a Add: Gain (Loss) on Disposal/Write-Down of PP&E (excluding Real Estate), Net - - 0.0% - 0.01 0.0% REIT Costs 0.07 0.02 (71.4)% 0.43 0.11 (74.4)% Other (Income) Expense, Net 0.06 0.21 n/a 0.39 0.33 (15.4)% Gain (Loss) from Disposition of Real Estate, Net of Tax - - 0.0% (0.01) (0.04) n/a Tax Impact of Reconciling Items and Discrete Tax Items (0.17) (0.04) (76.5)% 0.07 (0.72) n/a Adjusted EPS - Fully Diluted from Continuing Operations $0.21 $0.25 19.0% $1.40 $1.36 (2.9)% |

|
|
18 Reconciliation of Net Income Attributable to IRM to FFO & AFFO (1) Includes realized and unrealized FX (gains) losses (2) Excludes realized and unrealized FX (gains) losses (3) Includes repatriation, recapture (including amended return impact) and other current tax expenses; excludes normalized cash tax expense of $(3,079) in Q4 2014 and $46,879 in FY 2014 (4) Includes deferred financing charges (5) Represents total maintenance capital expenditures, including maintenance capital expenditures related to real estate and non-real estate assets; includes REIT-related costs Q4 2014 FY 2014 Net Income Attributable to Iron Mountain $12,749 $326,119 Add: Real Estate Depreciation 46,427 184,170 (Gain) Loss from Disposition of Real Estate, Net of Tax (839) (8,307) FFO (NAREIT) $58,337 $501,982 Add: (Gain) Loss on Disposal/Write-Down of PP&E (excluding Real Estate), Net (164) 1,065 FX (Gains) Losses (1) 32,726 58,318 Other (Income) Expense (2) 9,473 6,869 Deferred Taxes and Current REIT Tax Adjustments (3) 3,955 (144,154) Income (Loss) from Discontinued Operations, Net of Tax (729) 209 REIT Costs 3,728 22,312 FFO (Normalized) $107,326 $446,601 Add: Non-Real Estate Depreciation 30,254 120,387 Amortization Expense (4) 14,368 56,595 Non-Cash Rent Expense (Income) (1,414) 1,405 Non-Cash Equity Compensation Expense (Income) 6,495 29,624 Less: Maintenance CapEx (5) 32,500 77,101 AFFO $124,529 $577,511 Per Share Amounts (Fully Diluted Shares) FFO (NAREIT) $0.28 $2.55 FFO (Normalized) $0.52 $2.27 |

|
|
19 Storage Net Operating Income (NOI) (1) Includes Fulfillment Services, Document Management Services, Intellectual Property Management, Data Center, Entertainment Services and other auxiliary services (2) Includes Building Maintenance, Property Taxes, Utilities and Insurance costs (3) Refer to ‘Components of Value’ and appendix for overhead allocations and definitions Effective July 1, 2013, in preparation for electing REIT status, we established taxable REIT subsidiaries (“TRSs”) in our identified REIT countries and transferred the designation of employees who perform services in our warehouses and were previously categorized as storage-related. The transfer of these employees in REIT countries resulted in a shift of labor expenses previously categorized as storage rental labor to services labor. We expect to transfer additional storage rental labor costs in the future as we establish TRS service entities in future REIT countries. Q4 2014 FY 2014 Revenue from Storage Rental Activities Records Management $369,650 $1,484,843 Data Protection 76,305 300,164 Other (1) 19,446 75,236 Total Storage Rental 465,401 1,860,243 Terminations/Permanent Withdrawal Fees 5,864 23,740 Total Revenue from Storage Rental Activities $471,265 $1,883,982 Less: Storage Rental Costs Facility Costs (2) 103,842 412,788 Less: Storage Rent 53,274 205,904 Adjusted Facility Costs 50,568 206,884 Storage Rental Labor 2,192 6,391 Other Storage Rental Costs 3,754 16,083 Allocated Overhead (3) 32,873 139,625 Total Storage Rental Costs $89,387 $368,983 Storage Net Operating Income $381,878 $1,514,999 Storage Net Operating Income Margin 81.0% 80.4% |

|
|
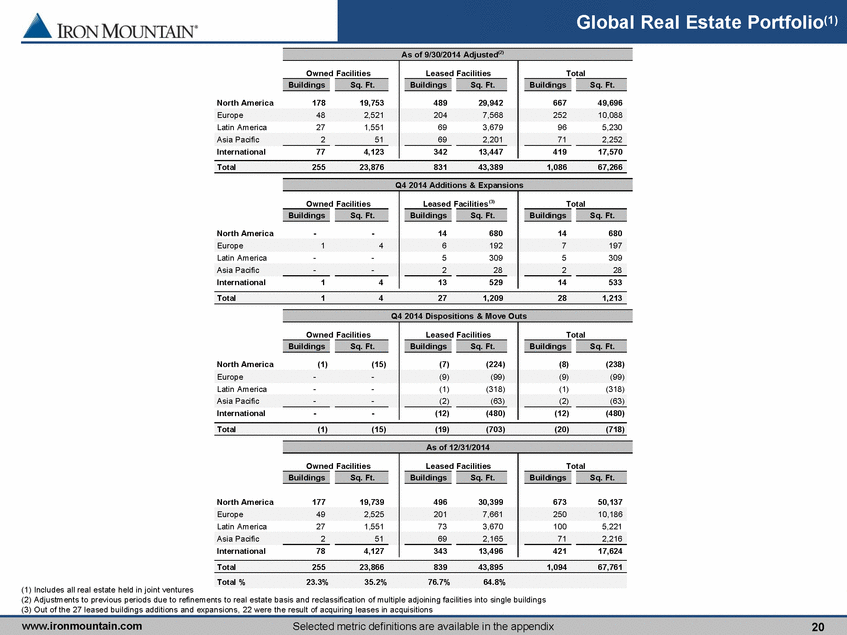
Global Real Estate Portfolio(1) 20 (1) Includes all real estate held in joint ventures (2) Adjustments to previous periods due to refinements to real estate basis and reclassification of multiple adjoining facilities into single buildings (3) Out of the 27 leased buildings additions and expansions, 22 were the result of acquiring leases in acquisitions As of 9/30/2014 Adjusted (2) Total Buildings Sq. Ft. Buildings Sq. Ft. Buildings Sq. Ft. North America 178 19,753 489 29,942 667 49,696 Europe 48 2,521 204 7,568 252 10,088 Latin America 27 1,551 69 3,679 96 5,230 Asia Pacific 2 51 69 2,201 71 2,252 International 77 4,123 342 13,447 419 17,570 Total 255 23,876 831 43,389 1,086 67,266 Q4 2014 Additions & Expansions Total Buildings Sq. Ft. Buildings Sq. Ft. Buildings Sq. Ft. North America - - 14 680 14 680 Europe 1 4 6 192 7 197 Latin America - - 5 309 5 309 Asia Pacific - - 2 28 2 28 International 1 4 13 529 14 533 Total 1 4 27 1,209 28 1,213 Q4 2014 Dispositions & Move Outs Total Buildings Sq. Ft. Buildings Sq. Ft. Buildings Sq. Ft. North America (1) (15) (7) (224) (8) (238) Europe - - (9) (99) (9) (99) Latin America - - (1) (318) (1) (318) Asia Pacific - - (2) (63) (2) (63) International - - (12) (480) (12) (480) Total (1) (15) (19) (703) (20) (718) As of 12/31/2014 Total Buildings Sq. Ft. Buildings Sq. Ft. Buildings Sq. Ft. North America 177 19,739 496 30,399 673 50,137 Europe 49 2,525 201 7,661 250 10,186 Latin America 27 1,551 73 3,670 100 5,221 Asia Pacific 2 51 69 2,165 71 2,216 International 78 4,127 343 13,496 421 17,624 Total 255 23,866 839 43,895 1,094 67,761 Total % 23.3% 35.2% 76.7% 64.8% Leased Facilities Leased Facilities (3) Owned Facilities Owned Facilities Owned Facilities Leased Facilities Owned Facilities Leased Facilities |
|
|
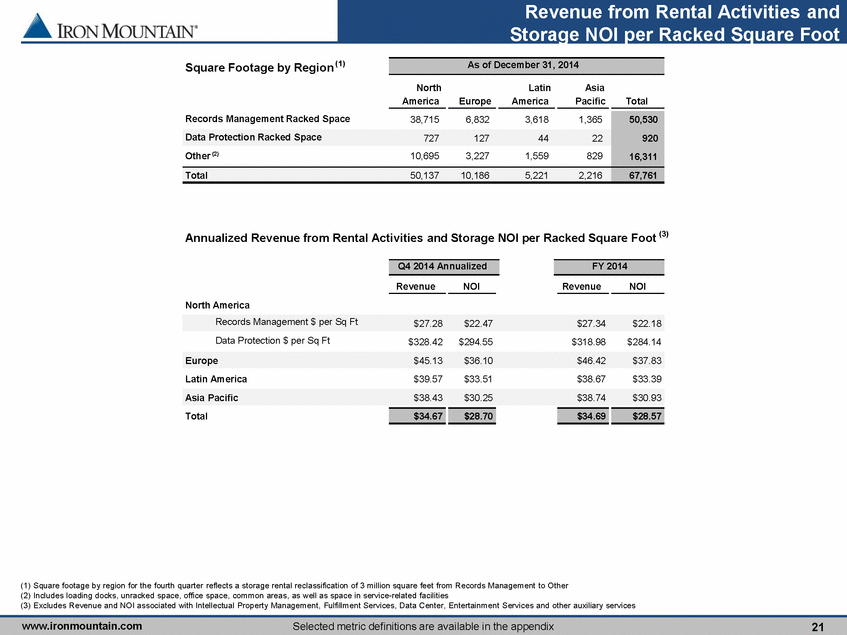
Revenue from Rental Activities and Storage NOI per Racked Square Foot 21 (1) Square footage by region for the fourth quarter reflects a storage rental reclassification of 3 million square feet from Records Management to Other (2) Includes loading docks, unracked space, office space, common areas, as well as space in service-related facilities (3) Excludes Revenue and NOI associated with Intellectual Property Management, Fulfillment Services, Data Center, Entertainment Services and other auxiliary services Square Footage by Region (1) North America Europe Latin America Asia Pacific Total Records Management Racked Space 38,715 6,832 3,618 1,365 50,530 Data Protection Racked Space 727 127 44 22 920 Other (2) 10,695 3,227 1,559 829 16,311 Total 50,137 10,186 5,221 2,216 67,761 Annualized Revenue from Rental Activities and Storage NOI per Racked Square Foot (3) Revenue NOI Revenue NOI North America Records Management $ per Sq Ft $27.28 $22.47 $27.34 $22.18 Data Protection $ per Sq Ft $328.42 $294.55 $318.98 $284.14 Europe $45.13 $36.10 $46.42 $37.83 Latin America $39.57 $33.51 $38.67 $33.39 Asia Pacific $38.43 $30.25 $38.74 $30.93 Total $34.67 $28.70 $34.69 $28.57 Q4 2014 Annualized FY 2014 As of December 31, 2014 |
|
|
Portfolio Utilization Records Management Storage Portfolio (CuFt MM) As of 12/31/2014 550 500 450 400 50 0 +13.4% Total IRM 378 +4.4% +1.5% +13.3% +9.9% 530 507 Asia Pacific Latin America Europe North America 384 650 600 550 500 100 450 50 0 Total IRM 636 580 83% 91% Asia Pacific 19 17 83% 94% Latin America 53 48 80% 89% Europe 112 95 78% 92% North America 452 420 85% 91% Q4 2014 Total Potential Building Capacity Q4 2014 Total Installed Racking Capacity Capacity and Utilization(2) (%) 0 80 10 70 60 +0.9% +3.4% +8.6% +74.7% +14.3% Total IRM 76 74 Asia Pacific Latin America Europe North America 60 60 10 0 110 120 100 90 80 20 3 1 48% 89% Latin America 43% 66% North America 80 72 75% 84% 6 70% 77% Europe 23 15 7 Total IRM 112 94 68% 81% Asia Pacific Data Protection Storage Portfolio (DPUs MM) As of 12/31/2014 Q4 2013 Q3 2014 Q2 2014 Q4 2014 Q1 2014 (1) RM units stored includes cubic feet of storage in dedicated space leased to customers on a square foot basis; these dedicated space storage units are excluded from our RM volume growth chart on page 9 (2) Iron Mountain operates its storage business to achieve a desired utilization of between 94% – 98% to attain maximum operating efficiency 22 Units Stored(1) 14 37 77 16 42 88 1 4 9 1 5 10 |

|
|
Gross Book Value of Real Estate Assets 23 (1) Includes warehouse equipment, vehicles, furniture, fixtures, computer hardware and software Real Estate Assets Storage Operations Land $197,927 Buildings & Building Improvements 1,393,479 Leasehold Improvements 432,242 Racking 1,453,372 Construction In Progress 121,864 Total Storage Gross Book Value $3,598,884 Service Operations Land $7,536 Buildings & Building Improvements 15,851 Leasehold Improvements 34,935 Racking 106,011 Construction In Progress 9,024 Total Service Gross Book Value $173,357 Total Real Estate Gross Book Value $3,772,241 Non-Real Estate Assets All Other Non-Real Estate Assets Gross Book Value (1) 896,463 Total PP&E Gross Book Value $4,668,705 As of 12/31/2014 |

|
|
Service Business Detail 24 (1) Includes Fulfillment Services, Document Management Services, Intellectual Property Management, Data Center, Consulting, Entertainment Services and other auxiliary services Q4 2014 FY 2014 Service Operations Revenue by Product Line Records Management $161,796 $642,372 Data Protection 48,552 200,588 Shredding 62,202 256,579 Other (1) 40,028 157,911 Total Service Revenue $312,577 $1,257,450 Q4 2014 FY 2014 Service Revenues $312,577 $1,257,450 Less: Terminations / Permanent Withdrawals 5,864 23,740 Adjusted Service Revenue $306,713 $1,233,710 Service Expenses 227,237 909,375 Allocated Overhead 25,358 108,070 Total Service Adjusted OIBDA $54,118 $216,266 Total Service Adjusted OIBDA % 17.6% 17.5% Service Rent 1,424 8,318 Total Service Adjusted OIBDAR $55,542 $224,583 Total Service Adjusted OIBDAR % 18.1% 18.2% |

|
|
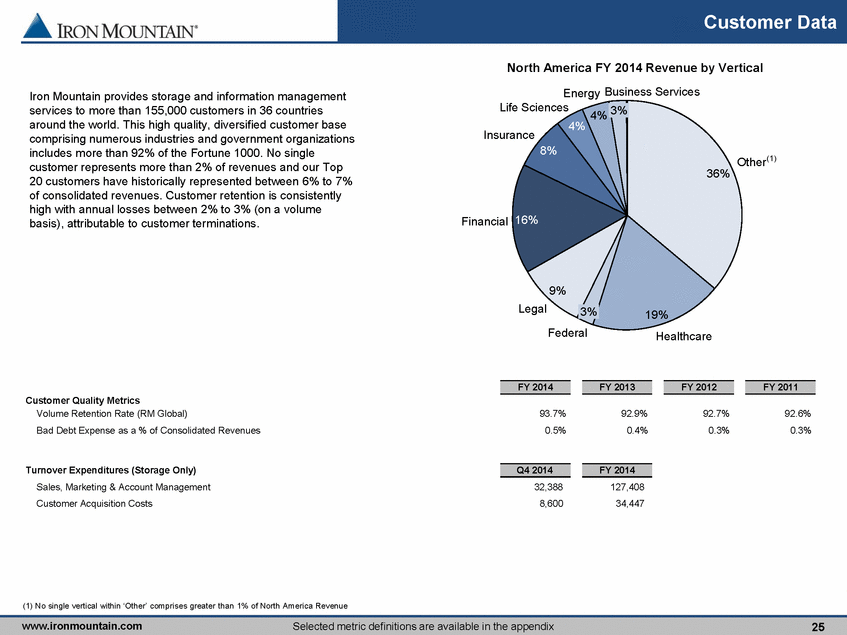
Customer Data 25 (1) No single vertical within ‘Other’ comprises greater than 1% of North America Revenue Federal Healthcare Financial Legal Insurance Life Sciences Energy Business Services 36% Other 19% 3% 9% 16% 8% 4% 4% 3% North America FY 2014 Revenue by Vertical Iron Mountain provides storage and information management services to more than 155,000 customers in 36 countries around the world. This high quality, diversified customer base comprising numerous industries and government organizations includes more than 92% of the Fortune 1000. No single customer represents more than 2% of revenues and our Top 20 customers have historically represented between 6% to 7% of consolidated revenues. Customer retention is consistently high with annual losses between 2% to 3% (on a volume basis), attributable to customer terminations. (1) FY 2014 FY 2013 FY 2012 FY 2011 Customer Quality Metrics Volume Retention Rate (RM Global) 93.7% 92.9% 92.7% 92.6% Bad Debt Expense as a % of Consolidated Revenues 0.5% 0.4% 0.3% 0.3% Turnover Expenditures (Storage Only) Q4 2014 FY 2014 Sales, Marketing & Account Management 32,388 127,408 Customer Acquisition Costs 8,600 34,447 |
|
|
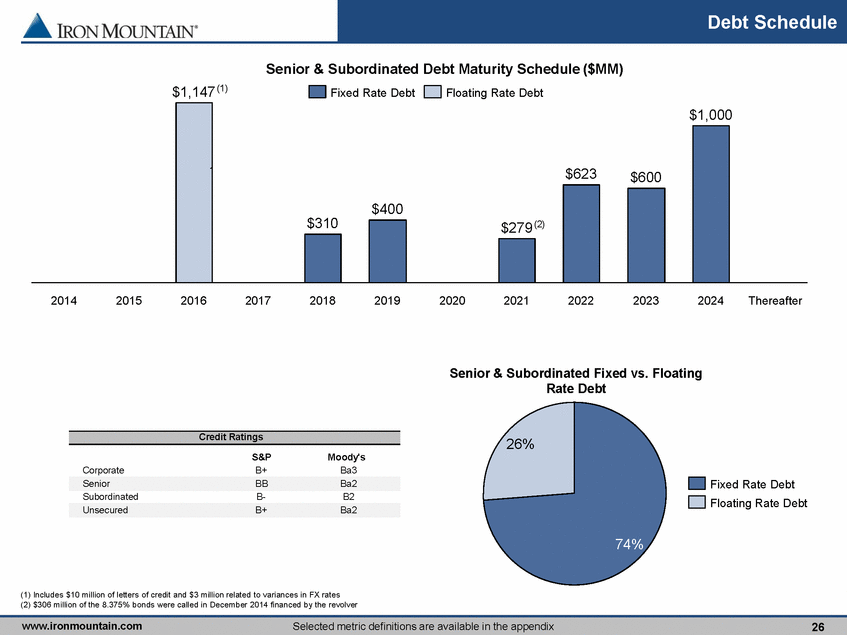
Debt Schedule 26 (1) Includes $10 million of letters of credit and $3 million related to variances in FX rates (2) $306 million of the 8.375% bonds were called in December 2014 financed by the revolver Thereafter 2024 2023 2022 2021 $1,147 2020 2019 2018 $1,000 2017 2016 2015 2014 $600 $623 $279 $400 $310 Floating Rate Debt Fixed Rate Debt 74% 26% Senior & Subordinated Fixed vs. Floating Rate Debt Senior & Subordinated Debt Maturity Schedule ($MM) Fixed Rate Debt Floating Rate Debt 1 (1) (2) S&P Moody's Corporate B+ Ba3 Senior BB Ba2 Subordinated B- B2 Unsecured B+ Ba2 Credit Ratings |
|
|
Capitalization 27 0.0 4.0 5.0 6.0 4.7x 5.0x 5.4x Net Lease Adjusted Leverage Ratio (1) Debt net of cash is calculated as total debt, including: total senior and subordinated notes of $4,359 million, capital leases of $203 million, other long-term debt of $65 million, and short-term portion of long-term debt of $52 million, less cash and cash equivalents of $126 million. Debt net of cash excludes letters of credit of $10 million, non-compete liabilities of $2 million and FX related variances of $3 million. Revolving Credit Facility (as of 12/31/2014) Capacity $1,749,375 Outstanding $1,136,117 Letters of Credit $10,403 Remaining Capacity $602,855 Interest Rate Spread (Prime) 1.25% Interest Rate Spread (LIBOR) 2.25% Weighted Average Interest Rate 2.68% Maturity Date 6/27/16 # of Shares Outstanding at 12/31/2014 209,819 Share Price at 12/31/2014 $38.66 Total Equity Value $8,111,595 Total Debt, Net of Cash (1) $4,537,598 Total Market Capitalization $12,649,193 Net Debt to Total Market Capitalization 36% Adj. OIBDA to Interest Expense 3.0x Total Market Capitalization to Adjusted OIBDA 13.7x Total Market Capitalization Interest 5.6% Maturity 5.9 years Total Debt Weighted Average Rates (as of 12/31/2014) Type of Note Subordinated Subordinated Unsecured Subordinated Unsecured Unsecured Subordinated Issuance Date 1/15/07 9/20/11 8/13/13 8/10/09 9/18/14 8/13/13 8/7/12 Denomination EUR USD CAD USD GBP USD USD Original Principal Amount (FX Rate on Issue Date) $329,792 $400,000 $193,720 $550,000 $654,960 $600,000 $1,000,000 Exchange Rate at 12/31/14 1.2143 1.0000 0.8621 1.0000 1.5574 1.0000 1.0000 Principal Amount at 12/31/14 $309,634 $400,000 $172,420 $106,250 $622,960 $600,000 $1,000,000 Yield (on Issue Date) 6.750% 7.750% 6.125% 8.375% 6.125% 6.000% 5.750% Maturity Date 10/15/18 10/1/19 8/15/21 8/15/21 9/15/22 8/15/23 8/15/24 Current Call Price 100.000 107.750 N/A 104.188 N/A N/A N/A Next Call Date 10/15/14 10/1/15 8/15/17 8/15/15 9/15/17 10/15/18 8/15/17 Next Call Price 100.000 103.875 103.063 102.792 104.594 103.000 102.875 Senior Unsecured and Senior Subordinated Notes 2012 2013 2014 Metric Limit Current Fixed Charge Ratio ? 1.5x 2.5x Net Total Lease Adjusted Leverage Ratio ? 6.5x 5.4x Net Secured Lease Adjusted Leverage Ratio ? 4.0x 2.6x Revolving Credit Facility Debt Covenant Analysis |

|
|
Lease Obligations(1) (1) Includes capital and operating lease obligations Weighted Average Remaining Lease Obligations (no exercise of extension options): 5.6 years Weighted Average Remaining Lease Obligations (exercise of all extension options): 12.4 years 2026 0.1% 2025 2.3% 2024 3.5% 2023 5.4% 2022 4.9% 2021 8.5% 2020 7.2% 2019 13.5% 2018 11.9% 2017 11.8% 2016 12.9% 2015 9.0% Thereafter 9.0% 57.2% Thereafter 2026 4.3% 2025 2.4% 2024 3.5% 2023 2.0% 2022 2.2% 2021 5.0% 2020 4.6% 2019 4.2% 2018 3.1% 2017 2.8% 2016 3.4% 2015 5.4% Assuming No Exercise of Extension Options Facility Lease Expirations (% of total square feet subject to lease) Assuming Exercise of All Extension Options 28 |

|
|
Components of Value 29 (1) Trailing four quarter prior to rental expense (2) Includes Cash, Cash Equivalents, Restricted Cash, Accounts Receivable, Other Tangible Current Assets, Deferred Income Taxes and Prepaid Expenses (3) Includes Storage and Service Components Annualized NOI $ North America Records Management 869,853 Data Protection 214,223 Other 30,149 Europe 252,978 Latin America 118,756 Asia Pacific 41,551 Total Portfolio Storage NOI $1,527,509 Service Adjusted OIBDAR (1) 224,583 Balance at 12/31/2014 Cash, Cash Equivalents & Other Tangible Assets (2) 917,719 Building & Racking Investment 115,922 Business and Customer Acquisition Consideration 153,805 Less: Debt, Gross Book Value 4,663,531 Non-Controlling Interests 13,600 Annualized Rental Expense (3) 218,791 Estimated Tax Liability 7,627 Components of Overhead Total overhead costs have been allocated as follows: Q4 2014 FY 2014 Storage $32,873 $139,625 Service 25,358 108,070 Corporate 112,276 408,346 Sales, Marketing, & Account Management 54,142 213,531 Total Overhead $224,648 $869,572 |

|
|
Appendix 30 Non-GAAP Measures Non-GAAP measures are supplemental metrics designed to enhance our disclosure and to provide additional information that we believe to be important for investors to consider when evaluating our financial performance. These non-GAAP measures should be considered in addition to, but not as a substitute for, other measures of financial performance reported in accordance with accounting principles generally accepted in the Unites States of America (“GAAP”), such as operating or net income (loss) or cash flows from operating activities from continuing operations (as determined in accordance with GAAP). Adjusted Earnings Per Share, or Adjusted EPS Adjusted EPS is defined as reported earnings per share from continuing operations excluding: (1) (gain) loss on the disposal/write-down of property, plant and equipment, net; (2) intangible impairments; (3) other (income) expense, net; (4) REIT Costs; and (5) the tax impact of reconciling items and discrete tax items. We do not believe these excluded items to be indicative of our ongoing operating results, and they are not considered when we are forecasting our future results. We believe Adjusted EPS is of value to our current and potential investors when comparing our results from past, present and future periods. Adjusted Funds From Operations, or AFFO AFFO is defined as FFO (Normalized) excluding non-cash rent expense or income, plus depreciation on non-real estate assets, amortization expense (including amortization of deferred financing costs) and non-cash equity compensation expense, less maintenance capital expenditures. We believe AFFO is a useful measure in determining our ability to generate excess cash that may be used for reinvestment in the business, discretionary deployment in investments such as real estate or acquisition opportunities, returning of capital to our stockholders and voluntary prepayments of indebtedness. Adjusted Operating Income Before Depreciation, Amortization, Intangible Impairments, and REIT Costs, or Adjusted OIBDA Adjusted OIBDA is defined as operating income before depreciation, amortization, intangible impairments, (gain) loss on disposal/write-down of property, plant and equipment, net, and REIT Costs. These measures are an integral part of the internal reporting system we use to assess and evaluate the operating performance of our business. We use multiples of current or projected Adjusted OIBDA in conjunction with our discounted cash flow models to determine our overall enterprise valuation and to evaluate acquisition targets. We believe Adjusted OIBDA provides our current and potential investors with relevant and useful information regarding our ability to generate cash flow to support business investment. |

|
|
Appendix Non-GAAP Measures (continued) Funds From Operations, or FFO (NAREIT), and FFO (Normalized) FFO is a non-GAAP financial measure commonly used in the REIT industry. FFO is defined by the National Association of Real Estate Investment Trusts (“NAREIT”) and us as net income excluding gains and losses on the sale or write-down of real estate assets plus depreciation on real estate assets. FFO does not give effect to real estate depreciation and amortization because these amounts are computed, under GAAP, to allocate the cost of a property over its useful life. Because values for well-maintained real estate assets have historically increased or decreased based upon prevailing market conditions, we believe that FFO (Normalized) provides investors with a clearer view of our operating performance. Our most directly comparable GAAP measure to FFO (Normalized) is net income attributable to Iron Mountain. Although NAREIT has published a definition of FFO, modifications to the NAREIT calculation of FFO are common among REITs as companies seek to provide financial measures that most meaningfully reflect their business. Our definition of FFO (Normalized) excludes other items that we believe do not appropriately reflect our underlying operations such as intangible impairment charges, other income and expense (including foreign exchange gains and losses), income and losses from discontinued operations, provision or benefit from deferred taxes and REIT Costs. Service Adjusted OIBDA Service Adjusted OIBDA is calculated by taking service revenues excluding terminations and permanent withdrawals less direct expenses and allocated overhead tied to the service business. Terminations and permanent withdrawals are excluded from this calculations as they are included in the Storage NOI calculation. Service Adjusted OIBDAR Service Adjusted OIBDA as defined above, excluding rent expense associated with the service business. This is provided to enable valuation of Service Adjusted OIBDA irrespective of whether the company’s properties are leased or owned. Related rent expense is provided in the Components of Value slide. Storage Net Operating Income, or Storage NOI Storage NOI is defined as revenue from rental activities (storage rental revenue, termination fees and permanent withdrawal fees) less storage rental costs. Storage rental costs include facility costs (excluding rent), storage rental labor, other storage costs and allocated overhead. Storage NOI is commonly used in the REIT industry and enables investors to understand and value the income generated from the company’s real estate. Rent expense is excluded to enable valuation of this income irrespective of whether the company’s properties are leased or owned. Related rent expense is provided in the Components of Value slide. 31 |
|
|
Appendix Definitions Building Investment – The cumulative sum of investment to date for all approved building projects in progress. Business Segments North American Records and Information Management Business (“RIM”) — Storage and information management services throughout the United States and Canada, including the storage of paper documents, as well as other media such as microfilm and microfiche, master audio and videotapes, film, X-rays and blueprints, including healthcare information services, vital records services, service and courier operations, and the collection, handling and disposal of sensitive documents for corporate customers ("Records Management"); information destruction services ("Destruction"); Document Management Services; Fulfillment Services; and Intellectual Property Management. North American Data Management Business (“DM”) — The storage and rotation of backup computer media as part of corporate disaster recovery plans throughout the United States and Canada, including service and courier operations ("Data Protection & Recovery"); server and computer backup services; digital content repository systems to house, distribute, and archive key media assets; and storage, safeguarding and electronic or physical delivery of physical media of all types, primarily for entertainment and media industry clients. International Business — Storage and information management services throughout Europe, Latin America and Asia Pacific, including Records Management, Data Protection & Recovery, Destruction and DMS. Our European operations provide Records Management, Data Protection & Recovery and DMS throughout Europe, and Destruction services are primarily provided in the United Kingdom and Ireland. Our Latin America operations provide Records Management, Data Protection & Recovery, Destruction and DMS throughout Argentina, Brazil, Chile, Colombia, Mexico and Peru. Our Asia Pacific operations provide Records Management, Data Protection & Recovery, Destruction and DMS throughout Australia, with Records Management and Data Protection & Recovery services also provided in certain cities in India, Singapore, Hong Kong-SAR and China. Corporate and Other — Consists of our data center business in the United States, the primary product offering of our Emerging Businesses segment, as well as costs related to executive and staff functions, including finance, human resources and information technology, which benefit the enterprise as a whole. These costs are primarily related to the general management of these functions on a corporate level and the design and development of programs, policies and procedures that are then implemented in the individual segments, with each segment bearing its own cost of implementation. Corporate and Other also includes non-cash equity compensation expense associated with all employee stock-based awards. 32 |
|
|
Appendix 33 Definitions (continued) Capacity Measures Building Capacity – The maximum number of cubic feet of records or standard DPUs that can be stored in a given facility. Building Capacity Utilization – The number of cubic feet of records or standard DPUs in storage divided by the Building Capacity. Installed Racking Capacity – The storage capacity of the racking installed in a given facility. Capacity is generally measured in cubic feet or standard DPUs. Installed Racking Capacity Utilization – The number of cubic feet of records or standard DPUs in storage divided by the Installed Racking Capacity. Capital Expenditures – Our business requires capital expenditures to support our expected storage rental revenue and service revenue growth and ongoing operations, new products and services and increased profitability. The majority of our capital goes to support business line growth and our ongoing operations. Additionally, we invest capital to acquire or construct real estate. We also expend capital to support the development and improvement of products and services and projects designed to increase our profitability. These expenditures are generally relatively small and discretionary in nature. We categorize our capital expenditures as follows: Real Estate: Investment – These expenditures are primarily related to investments in land, buildings, building improvements, leasehold improvements and racking structures that expand our revenue capacity in existing or new geographies, replace a long-term operational obligation or create operational efficiencies. Maintenance – These expenditures are primarily related to the purchase or replacement of real estate assets such as buildings, building improvements, leasehold improvements and racking structures. Non-Real Estate: Investment – These expenditures support either (i) the growth of our business and/or increase our profitability by investing in either supporting assets such as carton storage systems, tape storage systems and containers, shredding plants and bins, and technology service storage and processing capacity, or (ii) they are directly related to the development of new products or services in support of our integrated value proposition and enhancements that support our leadership position in the industry, including items such as increased feature functionality, security upgrades or system enhancements. |
|
|
Appendix 34 Definitions (continued) Capital Expenditures Non-Real Estate (continued) Maintenance – These expenditures are primarily related to the purchase or replacement of customer-facing assets such as containers and shred bins, warehouse equipment, fixtures, computer hardware, or third-party or internally-developed software assets. This category also includes operational support initiatives such as sales and marketing and information technology projects to support infrastructure requirements. Components of Overhead Allocated Overhead – Includes overhead expenses directly associated with storage and service business operations allocated as follows: Field Operation Costs – Allocated to storage and service operations based on percent of revenue. Bad Debt Expenses – Allocated to storage and service operations based on percent of revenue. Transportation Costs – Allocated fully to service operations. Corporate Overhead – Includes all other overhead expenses associated with business support functions, including: Executive, Legal, Real Estate/Facilities, Accounting, Financial Performance & Analysis, Treasury, Tax, Internal Audit, M&A, Security, Procurement, HR, REIT, Other G&A, Integration Costs, IT, Product Engineering and Product Management. Customer Turnover Overhead – Overhead associated with customer acquisition and retention including Sales, Marketing and Account Management expenses. Constant Dollar Growth (C$) – The year-over-year growth rate excluding the impact of changes to foreign currency exchange rates. Constant currency growth rates are calculated by translating the 2013 results at the 2014 constant dollar budget rates. Destruction Rate – Calculated by dividing the total number of cubic feet of records removed from inventory due to destructions in a one-year period divided by the total number of cubic feet of records in storage at the beginning of the period. DPUs – Data protection units, a unit of measurement specific to our Data Protection storage services. Internal Revenue Growth – Internal revenue growth represents the year-over-year growth rate of revenues excluding the impacts of changes to foreign currency exchange rates, acquisitions and other unusual items. In general, only acquisitions that have been in our results for the full calendar year prior to the quarter of measurement are included in internal revenue growth. |

|
|
Appendix 35 Definitions (continued) Lease Adjusted Leverage Ratio – The calculation for this ratio is EBITDA plus rent expense divided by net debt including the capitalized value of lease obligations. Net Volume Growth – New Records Management storage volume from existing customers, plus volume from new customers and volume from acquisitions, offset by volume related to destructions, permanent withdrawals and customer terminations. Quarterly percentages are calculated by dividing the trailing four quarters’ total activity by the ending balance of the same prior-year period. Non-Cash Rent Expense – Calculated as rent expense less cash paid for rent. Permanent Withdrawal Rate – Calculated by dividing the total number of cubic feet of records removed from inventory due to permanent withdrawals in a one-year period divided by the total number of cubic feet of records in storage at the beginning of the period. Permanent withdrawals occur when records are permanently removed from inventory by customers for reasons other than the customer terminating its relationship. Racking Investment – The cumulative sum of investment to date for all approved racking projects in progress. REIT Costs – Includes costs associated with our 2011 proxy contest, the previous work of the former Strategic Review Special Committee of the board of directors and costs associated with the Company’s conversion to a REIT, excluding REIT compliance costs beginning January 1, 2014 which we expect to recur in future periods. REIT Countries – Countries where we operate that have been converted into a Qualified REIT Subsidiary and Taxable REIT Subsidiary structure, the group includes the following: Australia, Canada, Germany, Ireland, Mexico, Netherlands, Spain, United Kingdom and the United States. Regional NOI / CF or DPU – The average expected NOI for a specific region (NA, Europe, Latin America, Asia Pac) and product (Records Management or Data Protection). Tangible Assets – Includes PP&E, cash and cash equivalents, restricted cash, accounts receivable, deferred income taxes, and prepaid expenses. Volume Retention Rate – One minus the result of dividing the total number of cubic feet of records removed from inventory due to customer terminations in a one-year period by the total number of cubic feet of records in storage at the beginning of the period. |
