Attached files
| file | filename |
|---|---|
| 8-K - 8-K/A AMENDED - Genesis Healthcare, Inc. | form8-ka.htm |
| EX-16.1 - EXHIBIT 16.1 - Genesis Healthcare, Inc. | ex_161a.htm |

Exhibit 99.1 Genesis HealthCare Contact: Investor Relations 610-925-2000 GENESIS HEALTHCARE REPORTS FISCAL YEAR END 2014 RESULTS Genesis HealthCare Combination with Skilled Healthcare Complete 2014 Results Reported for Genesis HealthCare and Skilled Healthcare 2015 Guidance Provided for Combined Company KENNETT SQUARE, PA – (February 19, 2015) – Genesis Healthcare, Inc. (Genesis) (NYSE:GEN), one of the largest post-acute care providers in the United States, today announced the consolidated operating results for the quarter and year ended December 31, 2014, separately for each of FC-GEN Operations Investment, LLC, the parent company of Genesis HealthCare, LLC prior to the combination (also referred to as “Genesis” or the “Company” herein), and Skilled Healthcare Group (Skilled). Genesis HealthCare, LLC and Skilled combined on February 2, 2015 to form Genesis Healthcare, Inc. “The combination of our portfolios enables Genesis to re-enter the public equity markets and expand opportunities in new markets with our sub-acute and long-term care facilities and our rehabilitation services business,” stated Genesis Chief Executive Officer, George V. Hager, Jr. “We believe the opportunities of scale created by this combination better position Genesis to meet the challenges facing the post-acute industry and enhance our ability to partner successfully with payors and providers across the country.” Full Year 2014 Results Genesis’ revenue and adjusted revenue for the year ended December 31, 2014 was $4.77 billion and $4.75 billion, respectively, up from revenue and adjusted revenue of $4.71 billion and $4.69 billion, respectively, in the year ended December 31, 2013. Genesis’ skilled patient days mix remained relatively constant at 21.7% in the year ended 2014 versus 21.8% in the same period a year ago. Occupancy based on available operating beds increased 90 basis points to 89.2% at the year ended 2014 from 88.3% at the year ended 2013. Skilled’s revenue for the year ended December 31, 2014 was $833.3 million, a decrease of 1.1% when compared to $842.3 million in the year ended December 31, 2013. Skilled’s skilled patient days mix remained constant at 21.8% in the year ended 2014 and for the same period a year ago. Occupancy based on available operating beds declined 60 basis points to 81.6% at December 31, 2014 from 82.2% at December 31, 2013. Genesis reported adjusted EBITDAR of $589.8 million and adjusted EBITDA of $140.6 million for the year ended December 31, 2014, an increase of less than 1% from adjusted EBITDAR of $589.7 million and a decrease of 11.9% from adjusted EBITDA of $159.6 million in the prior year. For the year ended December 31, 2014, Skilled reported adjusted EBITDAR of $98.8 million and adjusted EBITDA of $78.8 million, an increase of 8.4% from adjusted EBITDAR of $91.2 million and an increase of 9.0% from adjusted EBITDA of $72.3 million in the prior year. Genesis’ loss from continuing operations for the year ended December 31, 2014 totaled $237.5 million, as compared to a loss from continuing operations of $169.6 million in the prior year. Genesis’ adjusted income from continuing operations for the year ended December 31, 2014 totaled $24.7 million compared to adjusted income from continuing operations of $26.6 million in the prior year. Adjusted income from continuing
2 operations excludes other adjustments as found in the Reconciliation of Net (Loss) Income to EBITDA, EBITDAR, Adjusted EBITDA and Adjusted EBITDAR table in this press release. Skilled’s loss from continuing operations for the year ended December 31, 2014 totaled $0.9 million, as compared to a loss from continuing operations of $6.2 million in the prior year. Skilled’s adjusted income from continuing operations for the year ended December 31, 2014 totaled $15.5 million compared to adjusted income from continuing operations of $12.0 million in the prior year. Adjusted income from continuing operations excludes certain items as described in the Reconciliation of Net (Loss) Income to EBITDA, EBITDAR, Adjusted EBITDA and Adjusted EBITDAR table at the end of this press release. Skilled’s loss from continuing operations per diluted share was $0.02 for the year ended December 31, 2014, as compared to loss from continuing operations per diluted share $0.17 for the year ended December 31, 2013. Adjusted income from continuing operations per diluted share was $0.40 for the year ended December 31, 2014, an increase of 25.0% compared to adjusted income from continuing operations per diluted share of $0.32 for the year ended December 31, 2013. Fourth Quarter 2014 Results Genesis’ revenue and adjusted revenue for the quarter ended December 31, 2014 was $1.19 billion, respectively, up from revenue and adjusted revenue of $1.19 and $1.18 billion, respectively, in the comparable period of the prior year. Genesis’ skilled patient days mix increased 60 basis points to 21.4% in the fourth quarter of 2014 from 20.8% in the fourth quarter of 2013. Occupancy based on available operating beds increased 30 basis points to 88.6% in the fourth quarter of 2014 from 88.3% in the fourth quarter of 2013. Skilled’s revenue for the quarter ended December 31, 2014 was $210.4 million, an increase of 1% when compared to $208.3 million in the fourth quarter of 2013. Skilled’s skilled patient days mix increased 10 basis points to 21.4% in the fourth quarter of 2014 from 21.3% in the fourth quarter of 2013. Occupancy based on available operating beds declined 110 basis points to 81.1% in the fourth quarter of 2014 from 82.2% in the fourth quarter of 2013. For the quarter ended December 31, 2014, Genesis’ adjusted EBITDAR was $125.7 million and adjusted EBITDA was $12.0 million, a decrease of 15.4% from adjusted EBITDAR of $148.5 million and a decrease of 70.2% from adjusted EBITDA of $40.4 million in the comparable period in the prior year. For the quarter ended December 31, 2014, Skilled reported adjusted EBITDA of $20.9 million and adjusted EBITDAR of $26.1 million, an increase of 26.3% from adjusted EBITDA of $16.5 million and an increase of 22.9% from adjusted EBITDAR of $21.2 million in the comparable period in the prior year. Genesis’ loss from continuing operations for the quarter ended December 31, 2014 totaled $123.2 million, as compared to a loss from continuing operations of $54.2 million in the comparable period in the prior year. Genesis’ adjusted loss from continuing operations for the quarter ended December 31, 2014 totaled $2.3 million compared to adjusted income from continuing operations of $2.8 million in the same period in the prior year. Adjusted income from continuing operations excludes other adjustments as found in the Reconciliation of Net (Loss) Income to EBITDA, EBITDAR, Adjusted EBITDA and Adjusted EBITDAR table in this press release. For the quarter ended December 31, 2014, Skilled’s loss from continuing operations totaled less than $0.1 million, as compared to income from continuing operations of $0.6 million for the fourth quarter of 2013. Adjusted income from continuing operations for the quarter ended December 31, 2014 totaled $5.2 million compared to adjusted income from continuing operations of $2.1 million for the fourth quarter of 2013. Adjusted income from continuing operations excludes certain items as described in the Reconciliation of Net

3 (Loss) Income to EBITDA, EBITDAR, Adjusted EBITDA and Adjusted EBITDAR table at the end of this press release. Skilled’s loss from continuing operations per diluted share was less than $0.01 for the quarter ended December 31, 2014, as compared to income from continuing operations per diluted share of $0.02 for the same period in 2013. Adjusted income from continuing operations per diluted share was $0.14 for the quarter ended December 31, 2014 compared to adjusted income from continuing operations per diluted share of $0.06 for the quarter ended December 31, 2013. Management Commentary “After strong performance for the first three quarters of 2014, fourth quarter earnings were below our expectations,” said George V. Hager, CEO of Genesis. “Our occupancy and skilled mix in the fourth quarter were relatively stable as compared to the first three quarters of 2014 and the fundamentals of the business remain strong. The earnings shortfall as compared to our guidance is primarily attributed to a few controllable areas of the business and unexpected growth in employee health benefit expenses.” Genesis’ adjusted EBITDAR for the full fiscal year 2014 and fourth quarter was approximately $31 million below the low end range of previously announced guidance. The shortfall is primarily attributed to the following: EBITDAR V iance Summary (Genesis) ($ in millions) Variance Therapist efficiency 10.0$ Controllable inpatient services routine costs 9.8 Current year self-insured expenses, principally employee health benefits 10.3 Total 30.1$ Therapist Efficiency Therapist efficiency in the fourth quarter fell short of Genesis’ expectations by approximately 300 basis points. After three consecutive quarters of improvement over the prior year, fourth quarter 2014 therapist labor hours were elevated relative to patient volumes. Therapist efficiency for the first nine months of 2014 was 69% as compared to 67% for the first nine months of 2013. In the fourth quarter of 2014, therapist efficiency dropped to 65% from 68% in the same period of the prior year. Therapist efficiency is computed by dividing billable labor minutes related to patient care by total labor minutes for the period. Controllable Routine Costs Controllable routine costs in Genesis’ inpatient services segment were $9.8 million higher than projected. About half of the incremental cost was driven by variable nursing labor hours that were not matched to occupancy levels. The remaining half of the increased costs was attributable to higher dietary and property maintenance costs. Self-Insured Expenses Self-insured expenses recognized in the fourth quarter were $10.3 million higher than projected, largely driven by greater utilization of self-insured employee health benefits in the fourth quarter as compared to the first three quarters of 2014. Genesis believes the increased utilization was, in part, a response to employee health benefit plan modifications set to take effect January 1, 2015 and does not expect this level of elevated utilization to reoccur.
4 “We take pride in our ability to manage cost levels to business volume and have implemented a number of actions to improve performance and adjust our cost structure permanently,” noted Mr. Hager. We are focused on better managing variable costs to patient volume while maintaining quality of care. I expect that we will be back on track with respect to routine cost management in the first quarter of 2015 and our results in January 2015 are encouraging.” The planned cost reductions are expected to result in year-over-year improvement in pre-tax cash flow between $30 and $40 million. All actions necessary to realize these savings have been executed, including: the elimination of overhead positions and reduction in staff hours approximating over 300 full time equivalent employees and modifications to employee benefit programs. The cost reductions also include leveraging best practices across Genesis’ portfolio of centers. Skilled Healthcare’s fourth quarter and full year 2014 results fell approximately $1.5 million short of the low end of previously announced guidance. The shortfall is attributed to higher than anticipated professional liability expenses and a higher than anticipated drop in hospice segment patient days. Cash Flow and Balance Sheet For the year ended December 31, 2014, Genesis generated operating cash flow of $107.7 million and Skilled generated operating cash flow of $26.3 million. In connection with the Skilled combination, Genesis entered into a five year Revolving Credit Facility having a total commitment size of $550 million, with borrowings subject to a borrowing base. Genesis also entered into a two year $360 million Real Estate Bridge Loan with proceeds used to refinance Skilled’s previously held non-HUD real estate and revolving credit facility loans. Total net debt at the date of the combination approximated $970 million, resulting in pro forma net funded leverage of 3.5x and lease adjusted net leverage of 6.4x, using the mid-point of the guidance described below. “We are committed to reducing our leverage and fixed charges during this year,” stated Tom DiVittorio, Chief Financial Officer of Genesis. “The Company is in the process of initiating a HUD financing program. Our goal is to refinance, within the next twelve months, 67 properties currently under the bridge loan with HUD mortgages at an estimated annual pretax interest savings of approximately $14 million. We also continue to evaluate the prospect of selling non-core assets and other deleveraging initiatives as a means to reduce our debt and fixed charges.” 2015 Guidance The Company expects adjusted net income from continuing operations on a diluted per share basis of $0.34 to $0.39 in 2015, adjusted EBITDAR of $755.0 million to $770.0 million and adjusted EBITDA of $267.6 million to $282.6 million. The 2015 guidance is based on 154.6 million diluted weighted average common shares outstanding and common stock equivalents on a fully exchanged basis. The Company’s earnings guidance was prepared on a pro forma basis to reflect full year estimates assuming the operations of Skilled were combined with Genesis as of January 1, 2015. It also assumes realization of approximately $13.0 million of synergies in 2015, with fourth quarter 2015 synergies approximating $5.2 million. The Company expects to reach approximately $25.0 million of annualized run-rate synergies by mid-2016. The following table illustrates projected key growth drivers to bridge proforma combined 2014 adjusted EBITDAR to the low and high end ranges of the Company’s 2015 adjusted EBITDAR guidance:
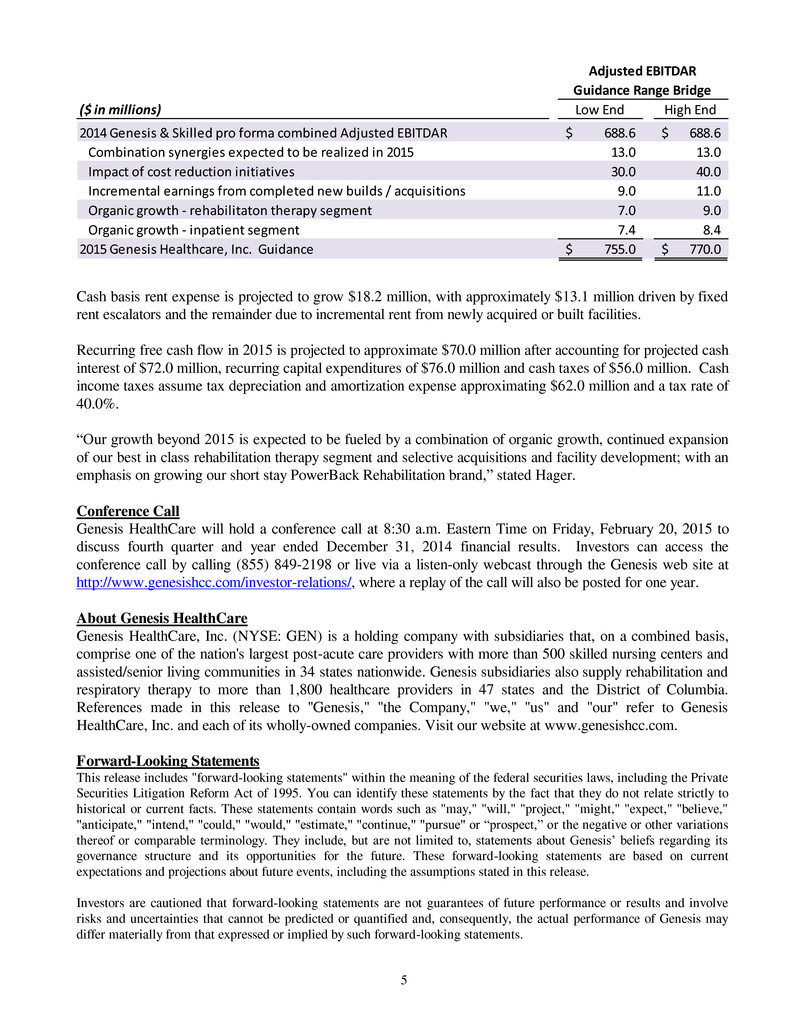
5 ($ in millions) Low End High End 2014 Genesis & Skilled pro forma combined Adjusted EBITDAR 688.6$ 688.6$ Combination synergies expected to be realized in 2015 13.0 13.0 Impact of cost reduction initiatives 30.0 40.0 Incremental earnings from completed new builds / acquisitions 9.0 11.0 Organic growth - rehabilitaton therapy segment 7.0 9.0 Organic growth - inpatient segment 7.4 8.4 2015 Genesis Healthcare, Inc. Guidance 755.0$ 770.0$ Adjusted EBITDAR Guidance Range Bridge Cash basis rent expense is projected to grow $18.2 million, with approximately $13.1 million driven by fixed rent escalators and the remainder due to incremental rent from newly acquired or built facilities. Recurring free cash flow in 2015 is projected to approximate $70.0 million after accounting for projected cash interest of $72.0 million, recurring capital expenditures of $76.0 million and cash taxes of $56.0 million. Cash income taxes assume tax depreciation and amortization expense approximating $62.0 million and a tax rate of 40.0%. “Our growth beyond 2015 is expected to be fueled by a combination of organic growth, continued expansion of our best in class rehabilitation therapy segment and selective acquisitions and facility development; with an emphasis on growing our short stay PowerBack Rehabilitation brand,” stated Hager. Conference Call Genesis HealthCare will hold a conference call at 8:30 a.m. Eastern Time on Friday, February 20, 2015 to discuss fourth quarter and year ended December 31, 2014 financial results. Investors can access the conference call by calling (855) 849-2198 or live via a listen-only webcast through the Genesis web site at http://www.genesishcc.com/investor-relations/, where a replay of the call will also be posted for one year. About Genesis HealthCare Genesis HealthCare, Inc. (NYSE: GEN) is a holding company with subsidiaries that, on a combined basis, comprise one of the nation's largest post-acute care providers with more than 500 skilled nursing centers and assisted/senior living communities in 34 states nationwide. Genesis subsidiaries also supply rehabilitation and respiratory therapy to more than 1,800 healthcare providers in 47 states and the District of Columbia. References made in this release to "Genesis," "the Company," "we," "us" and "our" refer to Genesis HealthCare, Inc. and each of its wholly-owned companies. Visit our website at www.genesishcc.com. Forward-Looking Statements This release includes "forward-looking statements" within the meaning of the federal securities laws, including the Private Securities Litigation Reform Act of 1995. You can identify these statements by the fact that they do not relate strictly to historical or current facts. These statements contain words such as "may," "will," "project," "might," "expect," "believe," "anticipate," "intend," "could," "would," "estimate," "continue," "pursue" or “prospect,” or the negative or other variations thereof or comparable terminology. They include, but are not limited to, statements about Genesis’ beliefs regarding its governance structure and its opportunities for the future. These forward-looking statements are based on current expectations and projections about future events, including the assumptions stated in this release. Investors are cautioned that forward-looking statements are not guarantees of future performance or results and involve risks and uncertainties that cannot be predicted or quantified and, consequently, the actual performance of Genesis may differ materially from that expressed or implied by such forward-looking statements.

6 These risks and uncertainties include, but are not limited to the following: • reductions in Medicare reimbursement rates, or changes in the rules governing the Medicare program could have a material adverse effect on our revenue, financial condition and results of operations; • continued efforts of federal and state governments to contain growth in Medicaid expenditures could adversely affect our revenue and profitability; • recent federal government proposals could limit the states' use of provider tax programs to generate revenue for their Medicaid expenditures, which could result in a reduction in our reimbursement rates under Medicaid; • revenue we receive from Medicare and Medicaid is subject to potential retroactive reduction; • our success is dependent upon retaining key executive and personnel; • health reform legislation could adversely affect our revenue and financial condition; • annual caps that limit the amounts that can be paid for outpatient therapy services rendered to any Medicare beneficiary may negatively affect our results of operations; • we are subject to a Medicare cap amount for our hospice business. Our net patient service revenue and profitability could be adversely affected by limitations on Medicare payments; • we are subject to extensive and complex laws and government regulations. If we are not operating in compliance with these laws and regulations or if these laws and regulations change, we could be required to make significant expenditures or change our operations in order to bring our facilities and operations into compliance; • we face inspections, reviews, audits and investigations under federal and state government programs and contracts. These audits could have adverse findings that may negatively affect our business; • significant legal actions, which are commonplace in our professions, could subject us to increased operating costs and substantial uninsured liabilities, which would materially and adversely affect our results of operations, liquidity and financial condition; • insurance coverage may become increasingly expensive and difficult to obtain for health care companies, and our self-insurance may expose us to significant losses; • we may be unable to reduce costs to offset decreases in our patient census levels or other expenses completely; • future acquisitions may use significant resources, may be unsuccessful and could expose us to unforeseen liabilities; • we lease a significant number of our facilities and may experience risks relating to lease termination, lease extensions and special charges; • our substantial indebtedness could adversely affect our financial health and prevent us from fulfilling our financial obligations; • following the combination of FC-GEN Operations Investment LLC and Skilled Healthcare Group, Inc., we may not be able to successfully integrate our operations, which could adversely affect us and the market price of our common stock; • We have incurred substantial costs and expect to incur additional transaction and integration costs in connection with the combination of FC-GEN Operations Investment LLC and Skilled Healthcare Group, Inc; • the holders of a majority of the voting power of Genesis’ common stock have entered into a voting agreement, and the control group’s interests may conflict with yours; • some of our directors are significant stockholders or representatives of significant stockholders, which may result in the diversion of corporate opportunities and other potential conflicts; and • we are a “controlled company” within the meaning of NYSE rules and, as a result, qualify for and rely on exemptions from certain corporate governance requirements. Genesis’ (formerly known as Skilled) Annual Report on Form 10-K for the year ended December 31, 2013, subsequent Quarterly Reports on Form 10-Q, recent Current Reports on Form 8-K, and other filings with the U.S. Securities and Exchange Commission, including the Company’s Annual Report on Form 10-K for the year ended December 31, 2014 when it is filed, discuss the foregoing risks as well as other important risks and uncertainties. Any forward-looking statements contained herein are made only as of the date of this release. Genesis disclaims any obligation to update the forward-looking statements. Investors are cautioned not to place undue reliance on these forward-looking statements. Note Regarding Use of Non-GAAP Financial Measures For a discussion of the reasons why the Company utilizes non-GAAP financial measures and believes that the presentation of such measures provides useful information to investors regarding the Company’s financial condition and results of operations, see the Current Report on Form 8-K furnished with the U.S. Securities and Exchange Commission on February 19, 2015. ###
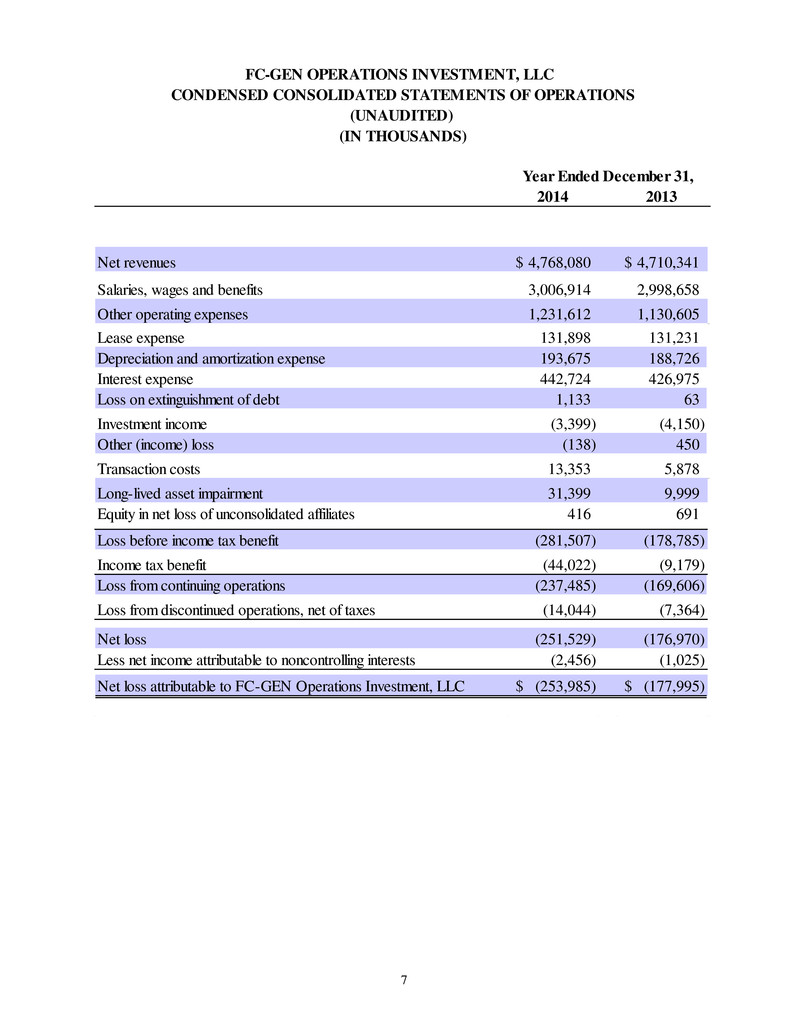
7 2014 2013 Net revenues 4,768,080$ 4,710,341$ Salaries, wages and benefits 3,006,914 2,998,658 Other operating expenses 1,231,612 1,130,605 Lease expense 131,898 131,231 Depreciation and amortization expense 193,675 188,726 Interest expense 442,724 426,975 Loss on extinguishment of debt 1,133 63 Investment income (3,399) (4,150) Other (income) loss (138) 450 Transaction costs 13,353 5,878 Long-lived asset impairment 31,399 9,999 Equity in net loss of unconsolidated affiliates 416 691 Loss before income tax benefit (281,507) (178,785) Income tax benefit (44,022) (9,179) Loss from continuing operations (237,485) (169,606) Loss from discontinued operations, net of taxes (14,044) (7,364) Net loss (251,529) (176,970) Less net income attributable to noncontrolling interests (2,456) (1,025) Net loss attributable to FC-GEN Operations Investment, LLC (253,985)$ (177,995)$ CONDENSED CONSOLIDATED STATEMENTS OF OPERATIONS (IN THOUSANDS) Year Ended December 31, (UNAUDITED) FC-GEN OPERATIONS INVESTMENT, LLC

8 2014 2013 Net revenues 1,193,267$ 1,188,852$ Salaries, wages and benefits 768,263 752,159 Other operating expenses 348,701 292,322 Lease expense 33,269 33,113 Depreciation and amortization expense 48,544 47,063 Interest expense 111,953 108,848 Loss on extinguishment of debt 453 273 Investment income (552) (2,277) Other loss 499 - Transaction costs 8,070 2,554 Long-lived asset impairment 31,399 9,999 Equity in net loss of unconsolidated affiliates 555 6 Loss before income tax benefit (157,887) (55,208) Income tax benefit (34,655) (978) Loss from continuing operations (123,232) (54,230) Loss from discontinued operations, net of taxes (8,483) (642) Net loss (131,715) (54,872) Less net income attributable to noncontrolling interests (1,086) (180) Net loss attributable to FC-GEN Operations Investment, LLC (132,801)$ (55,052)$ CONDENSED CONSOLIDATED STATEMENTS OF OPERATIONS (UNAUDITED) (IN THOUSANDS) Three Months Ended December 31, FC-GEN OPERATIONS INVESTMENT, LLC

9 December 31, 2014 December 31, 2013 Assets: Current assets: Cash and equivalents 87,548$ 61,413$ Accounts receivable, net of allowances for doubtful accounts 605,830 659,164 Other current assets 202,808 206,450 Total current assets 896,186 927,027 Property and equipment, net of accumulated depreciation 3,493,250 3,550,950 Identifiable intangible assets, net of accumulated amortization 173,112 194,513 Goodwill 169,681 169,681 Other long-term assets 409,179 294,834 Total assets 5,141,408$ 5,137,005$ Liabilities and Members' Interest: Current liabilities: Accounts payable and accrued expenses 318,122$ 342,986$ Accrued compensation 192,838 185,099 Other current liabilities 149,622 157,598 Total current liabilities 660,582 685,683 Long-term debt 525,728 473,165 Capital lease obligations 1,002,762 972,760 Financing obligations 2,911,200 2,785,103 Other long-term liabilities 498,626 404,175 Members' interest (457,490) (183,881) Total liabilities and members' interest 5,141,408$ 5,137,005$ FC-GEN OPERATIONS INVESTMENT, LLC CONDENSED CONSOLIDATED BALANCE SHEETS (IN THOUSANDS) (UNAUDITED) 2014 2013 Net cash provided by operating activities 107,652$ 82,149$ Net cash used in investing activities (95,675) (91,702) Net cash provided by financing activities 14,158 20,748 Net increase in cash and equivalents 26,135 11,195 Beginning of period 61,413 50,218 End of period 87,548$ 61,413$ (IN THOUSANDS) CONDENSED CONSOLIDATED STATEMENTS OF CASH FLOWS Year ended December 31, (UNAUDITED) FC-GEN OPERATIONS INVESTMENT, LLC

10 As reported As adjusted Year ended December 31, 2014 Conversion to cash basis leases (a) Newly acquired or constructed businesses with start-up losses (b) Other adjustments (c) Total adjustments Year ended December 31, 2014 Net revenues 4,768,080$ -$ (18,526)$ 4,260$ (14,266)$ 4,753,814$ - Salaries, wages and benefits 3,006,914 - (16,233) (2,579) (18,812) 2,988,102 Other operating expenses 1,231,612 - (8,372) (44,361) (52,733) 1,178,879 Lease expense 131,898 320,306 (3,005) - 317,301 449,199 Depreciation and amortization expense 193,675 (132,326) (434) - (132,760) 60,915 Interest expense 442,724 (391,962) - - (391,962) 50,762 Loss (gain) on extinguishment of debt 1,133 - - (1,133) (1,133) - Other (income) loss (138) - - 138 138 - Investment income (3,399) - - - - (3,399) Transaction costs 13,353 - - (13,353) (13,353) - Long-lived asset impairment 31,399 - - (31,399) (31,399) - Equity in net income of unconsolidated affiliates 416 - - - - 416 Income tax (benefit) expense (44,022) 31,697 1,479 15,065 48,241 4,219 (Loss) income from continuing operations (237,485)$ 172,285$ 8,039$ 81,882$ 262,206$ 24,721$ Loss (income) from discontinued operations, net of taxes 14,044 (2,041) - - (2,041) 12,003 Net income attributable to noncontrolling interests 2,456 - - - - 2,456 Net (loss) income attributable to FC-GEN Operations Investment, LLC (253,985)$ 174,326$ 8,039$ 81,882$ 264,247$ 10,262$ Depreciation and amortization expense 193,675 (132,326) (434) - (132,760) 60,915 Interest expense 442,724 (391,962) - - (391,962) 50,762 Loss (gain) on extinguishment of debt 1,133 - - (1,133) (1,133) - Other (income) loss (138) - - 138 138 - Transaction costs 13,353 - - (13,353) (13,353) - Long-lived asset impairment 31,399 - - (31,399) (31,399) - Income tax (benefit) expense (44,022) 31,697 1,479 15,065 48,241 4,219 Loss (income) from discontinued operations, net of taxes 14,044 (2,041) - - (2,041) 12,003 Net income attributable to noncontrolling interests 2,456 - - - - 2,456 EBITDA / Adjusted EBITDA 400,639$ (320,306)$ 9,084$ 51,200$ (260,022)$ 140,617$ Lease expense 131,898 320,306 (3,005) - 317,301 449,199 EBITDAR / Adjusted EBITDAR 532,537$ -$ 6,079$ 51,200$ 57,279$ 589,816$ FC-GEN OPERATIONS INVESTMENT, LLC RECONCILIATION OF NET (LOSS) INCOME TO EBITDA, EBITDAR, ADJUSTED EBITDA AND ADJUSTED EBITDAR (UNAUDITED) (IN THOUSANDS) Adjustments See (a), (b), (c) footnotes references contained herein.

11 As reported As adjusted Year ended December 31, 2013 Conversion to cash basis leases (a) Newly acquired or constructed businesses with start-up losses (b) Other adjustments (c) Total adjustments Year ended December 31, 2013 Net revenues 4,710,341$ -$ (21,131)$ -$ (21,131)$ 4,689,210$ Salaries, wages and benefits 2,998,658 - (12,263) (1,616) (13,879) 2,984,779 Other operating expenses 1,130,605 - (8,824) (3,564) (12,388) 1,118,217 Lease expense 131,231 303,328 (4,450) - 298,878 430,109 Depreciation and amortization expense 188,726 (131,839) (247) - (132,086) 56,640 Interest expense 426,975 (377,556) - - (377,556) 49,419 Loss (gain) on extinguishment of debt 63 - - (63) (63) - Other (income) loss 450 - - (450) (450) - Investment income (4,150) - - - - (4,150) Transaction costs 5,878 - - (5,878) (5,878) - Long-lived asset impairment 9,999 - - (9,999) (9,999) - Equity in net income of unconsolidated affiliates 691 - - - - 691 Income tax (benefit) expense (9,179) 32,021 723 3,352 36,096 26,917 (Loss) income from continuing operations (169,606)$ 174,046$ 3,930$ 18,218$ 196,194$ 26,588$ Loss (income) from discontinued operations, net of taxes 7,364 (57) - - (57) 7,307 Net income attributable to noncontrolling interests 1,025 - - - - 1,025 Net (loss) income attributable to FC-GEN Operations Investment, LLC (177,995)$ 174,103$ 3,930$ 18,218$ 196,251$ 18,256$ Depreciation and amortization expense 188,726 (131,839) (247) - (132,086) 56,640 Interest expense 426,975 (377,556) - - (377,556) 49,419 Loss (gain) on extinguishment of debt 63 - - (63) (63) - Other (income) loss 450 - - (450) (450) - Transaction costs 5,878 - - (5,878) (5,878) - Long-lived asset impairment 9,999 - - (9,999) (9,999) - Income tax (benefit) expense (9,179) 32,021 723 3,352 36,096 26,917 Loss (income) from discontinued operations, net of taxes 7,364 (57) - - (57) 7,307 Net income attributable to noncontrolling interests 1,025 - - - - 1,025 EBITDA / Adjusted EBITDA 453,306$ (303,328)$ 4,406$ 5,180$ (293,742)$ 159,564$ Lease expense 131,231 303,328 (4,450) - 298,878 430,109 EBITDAR / Adjusted EBITDAR 584,537$ -$ (44)$ 5,180$ 5,136$ 589,673$ FC-GEN OPERATIONS INVESTMENT, LLC RECONCILIATION OF NET (LOSS) INCOME TO EBITDA, EBITDAR, ADJUSTED EBITDA AND ADJUSTED EBITDAR (UNAUDITED) (IN THOUSANDS) Adjustments See (a), (b), (c) footnotes references contained herein.
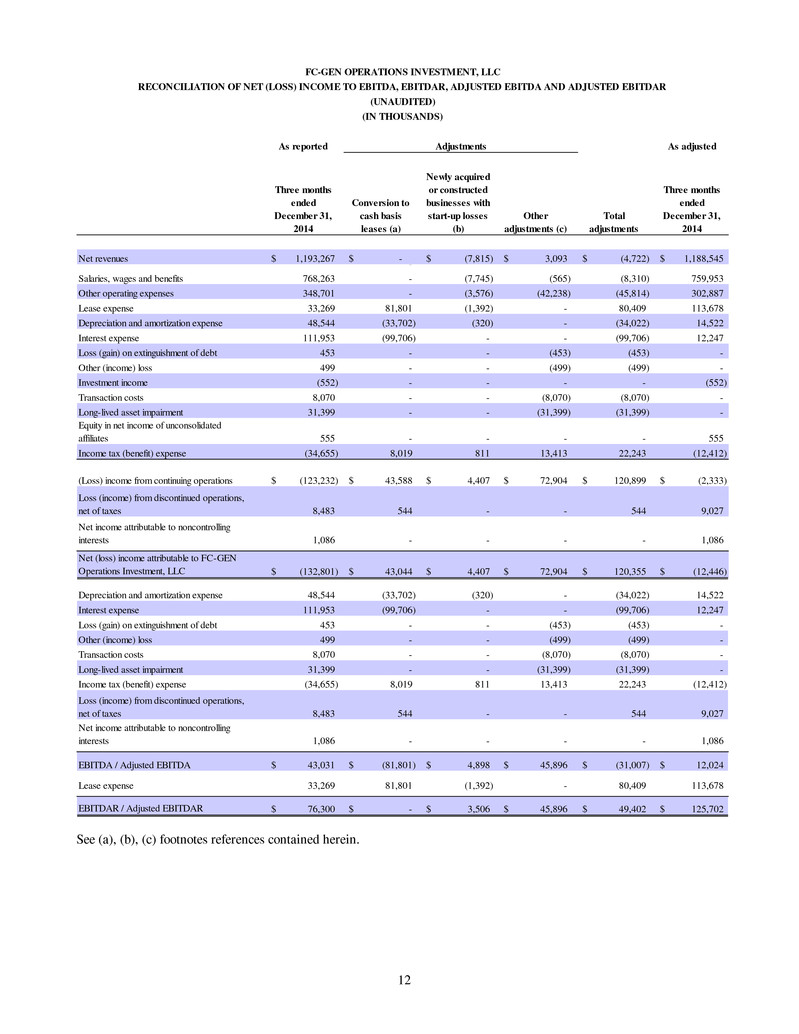
12 As reported As adjusted Three months ended December 31, 2014 Conversion to cash basis leases (a) Newly acquired or constructed businesses with start-up losses (b) Other adjustments (c) Total adjustments Three months ended December 31, 2014 Net revenues 1,193,267$ -$ (7,815)$ 3,093$ (4,722)$ 1,188,545$ - Salaries, wages and benefits 768,263 - (7,745) (565) (8,310) 759,953 Other operating expenses 348,701 - (3,576) (42,238) (45,814) 302,887 Lease expense 33,269 81,801 (1,392) - 80,409 113,678 Depreciation and amortization expense 48,544 (33,702) (320) - (34,022) 14,522 Interest expense 111,953 (99,706) - - (99,706) 12,247 Loss (gain) on extinguishment of debt 453 - - (453) (453) - Other (income) loss 499 - - (499) (499) - Investment income (552) - - - - (552) Transaction costs 8,070 - - (8,070) (8,070) - Long-lived asset impairment 31,399 - - (31,399) (31,399) - Equity in net income of unconsolidated affiliates 555 - - - - 555 Income tax (benefit) expense (34,655) 8,019 811 13,413 22,243 (12,412) (Loss) income from continuing operations (123,232)$ 43,588$ 4,407$ 72,904$ 120,899$ (2,333)$ Loss (income) from discontinued operations, net of taxes 8,483 544 - - 544 9,027 Net income attributable to noncontrolling interests 1,086 - - - - 1,086 Net (loss) income attributable to FC-GEN Operations Investment, LLC (132,801)$ 43,044$ 4,407$ 72,904$ 120,355$ (12,446)$ Depreciation and amortization expense 48,544 (33,702) (320) - (34,022) 14,522 Interest expense 111,953 (99,706) - - (99,706) 12,247 Loss (gain) on extinguishment of debt 453 - - (453) (453) - Other (income) loss 499 - - (499) (499) - Transaction costs 8,070 - - (8,070) (8,070) - Long-lived asset impairment 31,399 - - (31,399) (31,399) - Income tax (benefit) expense (34,655) 8,019 811 13,413 22,243 (12,412) Loss (income) from discontinued operations, net of taxes 8,483 544 - - 544 9,027 Net income attributable to noncontrolling interests 1,086 - - - - 1,086 EBITDA / Adjusted EBITDA 43,031$ (81,801)$ 4,898$ 45,896$ (31,007)$ 12,024$ Lease expense 33,269 81,801 (1,392) - 80,409 113,678 EBITDAR / Adjusted EBITDAR 76,300$ -$ 3,506$ 45,896$ 49,402$ 125,702$ FC-GEN OPERATIONS INVESTMENT, LLC RECONCILIATION OF NET (LOSS) INCOME TO EBITDA, EBITDAR, ADJUSTED EBITDA AND ADJUSTED EBITDAR (UNAUDITED) (IN THOUSANDS) Adjustments See (a), (b), (c) footnotes references contained herein.

13 As reported As adjusted Three months ended December 31, 2013 Conversion to cash basis leases (a) Newly acquired or constructed businesses with start-up losses (b) Other adjustments (c) Total adjustments Three months ended December 31, 2013 Net revenues 1,188,852$ -$ (7,890)$ -$ (7,890)$ 1,180,962$ Salaries, wages and benefits 752,159 - (4,010) - (4,010) 748,149 Other operating expenses 292,322 - (2,939) (2,806) (5,745) 286,577 Lease expense 33,113 76,184 (1,179) - 75,005 108,118 Depreciation and amortization expense 47,063 (32,170) (146) - (32,316) 14,747 Interest expense 108,848 (96,051) 541 - (95,510) 13,338 Loss (gain) on extinguishment of debt 273 - - (273) (273) - Other (income) loss - - - - - - Investment income (2,277) - - - - (2,277) Transaction costs 2,554 - - (2,554) (2,554) - Long-lived asset impairment 9,999 - - (9,999) (9,999) - Equity in net income of unconsolidated affiliates 6 - - - - 6 Income tax (benefit) expense (978) 8,086 (24) 2,429 10,491 9,513 (Loss) income from continuing operations (54,230)$ 43,951$ (133)$ 13,203$ 57,021$ 2,791$ Loss (income) from discontinued operations, net of taxes 642 204 - - 204 846 Net income attributable to noncontrolling interests 180 - - - - 180 Net (loss) income attributable to FC-GEN Operations Investment, LLC (55,052)$ 43,747$ (133)$ 13,203$ 56,817$ 1,765$ Depreciation and amortization expense 47,063 (32,170) (146) - (32,316) 14,747 Interest expense 108,848 (96,051) 541 - (95,510) 13,338 Loss (gain) on extinguishment of debt 273 - - (273) (273) - Other (income) loss - - - - - - Transaction costs 2,554 - - (2,554) (2,554) - Long-lived asset impairment 9,999 - - (9,999) (9,999) - Income tax (benefit) expense (978) 8,086 (24) 2,429 10,491 9,513 Loss (income) from discontinued operations, net of taxes 642 204 - - 204 846 Net income attributable to noncontrolling interests 180 - - - - 180 EBITDA / Adjusted EBITDA 113,529$ (76,184)$ 238$ 2,806$ (73,140)$ 40,389$ Lease expense 33,113 76,184 (1,179) - 75,005 108,118 EBITDAR / Adjusted EBITDAR 146,642$ -$ (941)$ 2,806$ 1,865$ 148,507$ FC-GEN OPERATIONS INVESTMENT, LLC RECONCILIATION OF NET (LOSS) INCOME TO EBITDA, EBITDAR, ADJUSTED EBITDA AND ADJUSTED EBITDAR (UNAUDITED) (IN THOUSANDS) Adjustments See (a), (b), (c) footnotes references contained herein.

14 (a) Our leases are classified as either operating leases, capital leases or financing obligations pursuant to applicable guidance under U.S. GAAP. We view the primary provisions and economics of these leases, regardless of their accounting treatment, as being nearly identical. Virtually all of our leases are structured with triple net terms, have fixed annual rent escalators and have long-term initial maturities with renewal options. Accordingly, in connection with our evaluation of the financial performance of the Company, we reclassify all of our leases to operating lease treatment and reflect lease expense on a cash basis. This approach allows us to better understand the relationship in each reporting period of our operating performance, as measured by EBITDAR and Adjusted EBITDAR, to the cash basis obligations to our landlords in that reporting period, regardless of the lease accounting treatment. This presentation and approach is also consistent with the financial reporting and covenant compliance requirements contained in all of our major lease and loan agreements. The following table summarizes the reclassification adjustments necessary to present all leases as operating leases on a cash basis. 2014 2013 2014 2013 Lease expense: Cash rent - capital leases 22,497$ 21,604$ 89,683$ 88,549$ Cash rent - financing obligations 61,911 58,229 242,918 229,452 Non-cash - operating lease arrangements (2,607) (3,649) (12,295) (14,673) Lease expense adjustments 81,801$ 76,184$ 320,306$ 303,328$ Depreciation and amortization expense: Captial lease accounting (8,257)$ (8,464)$ (35,385)$ (35,116)$ F na i g obligation accounting (25,445) (23,706) (96,941) (96,723) Depreci ti n and amortization expense adjustments (33,702)$ (32,170)$ (132,326)$ (131,839)$ I terest exp ns : Captial lease accounting (26,350)$ (24,203)$ (100,846)$ (98,870)$ Financing obligation accounting (73,356) (71,848) (291,116) (278,686) Interest expense adjustments (99,706)$ (96,051)$ (391,962)$ (377,556)$ Total pre-tax lease accounting adjustments (51,607)$ (52,037)$ (203,982)$ (206,067)$ Three months ended December 31, Years ended December 31, (in thousands) (b) The acquisition and construction of new businesses has become an important element of our growth strategy. Many of the businesses we acquire have a history of operating losses and continue to generate operating losses in the months that follow our acquisition. Newly constructed or developed businesses also generate losses while in their start-up phase. We view these losses as both temporary and an expected component of our long-term investment in the new venture. We adjust these losses when computing Adjusted EBITDAR and Adjusted EBITDA in order to better evaluate the performance of our core business. The activities of such businesses are adjusted when computing Adjusted EBITDAR and Adjusted EBITDA until such time as a new business generates positive Adjusted EBITDA. The operating performance of new businesses are no longer adjusted when computing Adjusted EBITDAR and Adjusted EBITDA beginning the period in which a new business generates positive Adjusted EBITDA and all periods thereafter. There were six and seven acquired or newly constructed businesses eliminated from our reported results when computing adjusted results for the three months and the year ended December 31, 2014, respectively; and six acquired or newly constructed businesses eliminated from our reported results when computing adjusted results for the three months and the year ended December 31, 2013. (c) Other adjustments represent costs or gains associated with transactions or events that we do not believe are reflective of our core recurring operating business. The following items were realized in the periods presented.

15 2014 2013 2014 2013 Severance and restructuring (1) 6,762$ 2,743$ 8,975$ 3,254$ Regulatory defense and related costs (2) 3,124 63 5,085 310 New business development costs (3) 511 - 1,641 - New contract obligation assumption (4) - - - 1,616 Prior period GLPL insurance adjustment (5) 35,499 - 35,499 - Transaction costs (6) 8,070 2,554 13,353 5,878 Long-lived asset impairments (7) 31,399 9,999 31,399 9,999 Loss (gain) on early extinguishment of debt 453 273 1,133 63 Other loss (income) 499 - (138) 450 Tax benefit from total adjustments (13,413) (2,429) (15,065) (3,352) Total other adjustments 72,904$ 13,203$ 81,882$ 18,218$ (in thousands) Three months ended December 31, Years ended December 31, (1) We incurred costs related to the termination, severance and restructuring of certain components of the Company’s business. (2) We incurred legal defense and other related costs in connection with certain matters in dispute or under appeal with regulatory agencies. (3) We incurred business development costs in connection with the evaluation and start-up of services outside our existing service offerings. (4) We incurred a paid time off obligation upon assumption of two significant rehabilitation therapy contracts. (5) We incurred a cumulative GLPL insurance adjustment for the development of prior period claims associated with the acquisition of Sun Healthcare Group, Inc. (6) We incurred costs associated with transactions including the acquisition of Sun Healthcare Group, Inc., the combination with Skilled Healthcare Group, Inc. and other transactions. (7) We incurred non-cash charges in connection with our annual long-lived impairment testing.
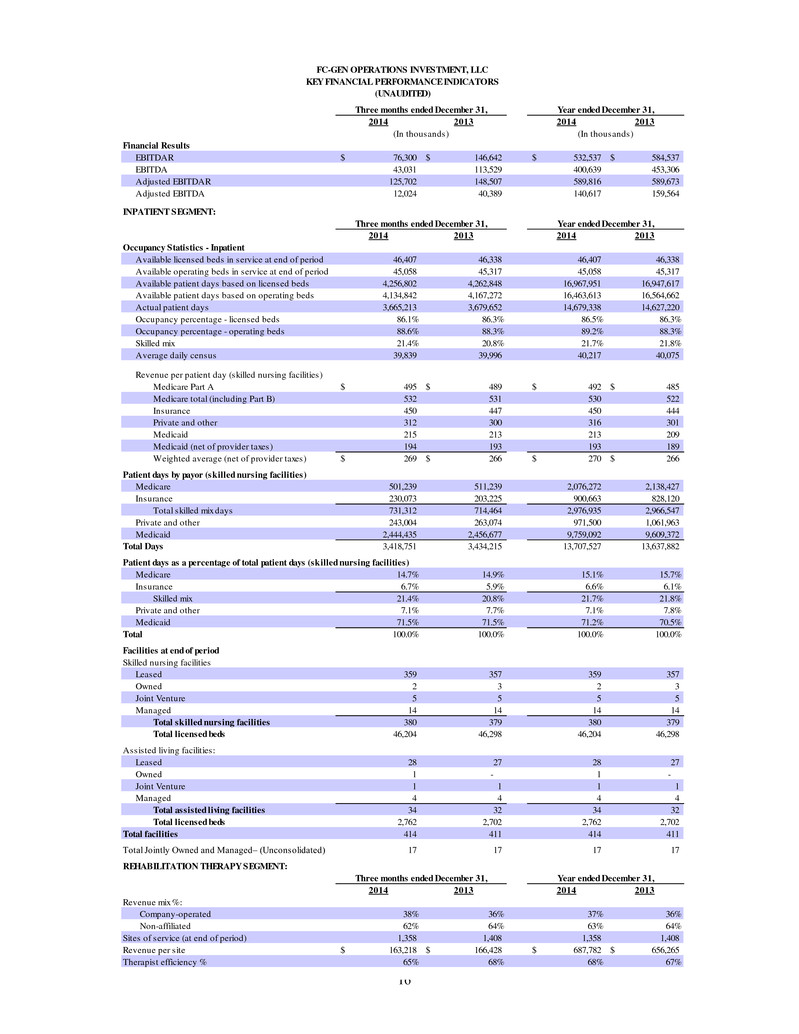
16 2014 2013 2014 2013 Financial Results EBITDAR 76,300$ 146,642$ 532,537$ 584,537$ EBITDA 43,031 113,529 400,639 453,306 Adjusted EBITDAR 125,702 148,507 589,816 589,673 Adjusted EBITDA 12,024 40,389 140,617 159,564 INPATIENT SEGMENT: 2014 2013 2014 2013 Occupancy Statistics - Inpatient Available licensed beds in service at end of period 46,407 46,338 46,407 46,338 Available operating beds in service at end of period 45,058 45,317 45,058 45,317 Available patient days based on licensed beds 4,256,802 4,262,848 16,967,951 16,947,617 Available patient days based on operating beds 4,134,842 4,167,272 16,463,613 16,564,662 Actual patient days 3,665,213 3,679,652 14,679,338 14,627,220 Occupancy percentage - licensed beds 86.1% 86.3% 86.5% 86.3% Occupancy percentage - operating beds 88.6% 88.3% 89.2% 88.3% Skilled mix 21.4% 20.8% 21.7% 21.8% Average daily census 39,839 39,996 40,217 40,075 Revenue per patient day (skilled nursing facilities) Medicare Part A 495$ 489$ 492$ 485$ Medicare total (including Part B) 532 531 530 522 Insurance 450 447 450 444 Private and other 312 300 316 301 Medicaid 215 213 213 209 Medicaid (net of provider taxes) 194 193 193 189 Weighted average (net of provider taxes) 269$ 266$ 270$ 266$ Patient days by payor (skilled nursing facilities) Medicare 501,239 511,239 2,076,272 2,138,427 Insurance 230,073 203,225 900,663 828,120 Total skilled mix days 731,312 714,464 2,976,935 2,966,547 Private and other 243,004 263,074 971,500 1,061,963 Medicaid 2,444,435 2,456,677 9,759,092 9,609,372 Total Days 3,418,751 3,434,215 13,707,527 13,637,882 Patient days as a percentage of total patient days (skilled nursing facilities) Medicare 14.7% 14.9% 15.1% 15.7% Insurance 6.7% 5.9% 6.6% 6.1% Skilled mix 21.4% 20.8% 21.7% 21.8% Private and other 7.1% 7.7% 7.1% 7.8% Medicaid 71.5% 71.5% 71.2% 70.5% Total 100.0% 100.0% 100.0% 100.0% Facilities at end of period Skilled nursing facilities Leased 359 357 359 357 Owned 2 3 2 3 Joint Venture 5 5 5 5 Managed 14 14 14 14 Total skilled nursing facilities 380 379 380 379 Total licensed beds 46,204 46,298 46,204 46,298 Assisted living facilities: Leased 28 27 28 27 Owned 1 - 1 - Joint Venture 1 1 1 1 Managed 4 4 4 4 Total assisted living facilities 34 32 34 32 Total licensed beds 2,762 2,702 2,762 2,702 Total facilities 414 411 414 411 Total Jointly Owned and Managed– (Unconsolidated) 17 17 17 17 REHABILITATION THERAPY SEGMENT: 2014 2013 2014 2013 Revenue mix %: Company-operated 38% 36% 37% 36% Non-affiliated 62% 64% 63% 64% Sites of service (at end of period) 1,358 1,408 1,358 1,408 Revenue per site 163,218$ 166,428$ 687,782$ 656,265$ Therapist efficiency % 65% 68% 68% 67% (In thousands) (In thousands) FC-GEN OPERATIONS INVESTMENT, LLC KEY FINANCIAL PERFORMANCE INDICATORS (UNAUDITED) Three months ended December 31, Year ended December 31, Three months ended December 31, Year ended December 31, Three months ended December 31, Year ended December 31,
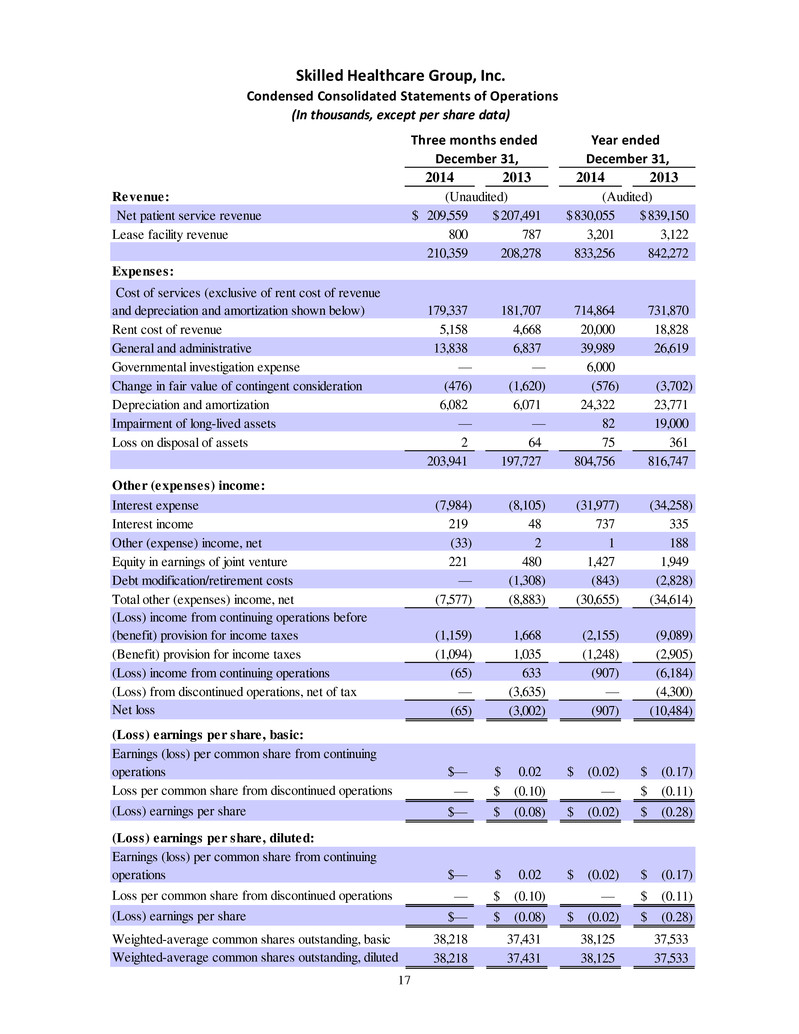
17 2014 2013 2014 2013 Revenue: Net patient service revenue 209,559$ 207,491$ 830,055$ 839,150$ Lease facility revenue 800 787 3,201 3,122 210,359 208,278 833,256 842,272 Expenses: Cost of services (exclusive of rent cost of revenue and depreciation and amortization shown below) 179,337 181,707 714,864 731,870 Rent cost of revenue 5,158 4,668 20,000 18,828 General and administrative 13,838 6,837 39,989 26,619 Governmental investigation expense — — 6,000 Change in fair value of contingent consideration (476) (1,620) (576) (3,702) Depreciation and amortization 6,082 6,071 24,322 23,771 Impairment of long-lived assets — — 82 19,000 Loss on disposal of assets 2 64 75 361 203,941 197,727 804,756 816,747 Other (expenses) income: Interest expense (7,984) (8,105) (31,977) (34,258) Interest income 219 48 737 335 Other (expense) income, net (33) 2 1 188 Equity in earnings of joint venture 221 480 1,427 1,949 Debt modification/retirement costs — (1,308) (843) (2,828) Total other (expenses) income, net (7,577) (8,883) (30,655) (34,614) (Loss) income from continuing operations before (benefit) provision for income taxes (1,159) 1,668 (2,155) (9,089) (Benefit) provision for income taxes (1,094) 1,035 (1,248) (2,905) (Loss) income from continuing operations (65) 633 (907) (6,184) (Loss) from discontinued operations, net of tax — (3,635) — (4,300) Net loss (65) (3,002) (907) (10,484) (Loss) earnings per share, basic: Earnings (loss) per common share from continuing operations $— 0.02$ (0.02)$ (0.17)$ Loss per common share from discontinued operations — (0.10)$ — (0.11)$ (Loss) earnings per share $— (0.08)$ (0.02)$ (0.28)$ (Loss) earnings per share, diluted: Earnings (loss) per common share from continuing operations $— 0.02$ (0.02)$ (0.17)$ Loss per common share from discontinued operations — (0.10)$ — (0.11)$ (Loss) earnings per share $— (0.08)$ (0.02)$ (0.28)$ Weighted-average common shares outstanding, basic 38,218 37,431 38,125 37,533 Weighted-average common shares outstanding, diluted 38,218 37,431 38,125 37,533 (Unaudited) (Audited) December 31,December 31, Skilled Healthcare Group, Inc. Condensed Consolidated Statements of Operations (In thousands, except per share data) Three months ended Year ended
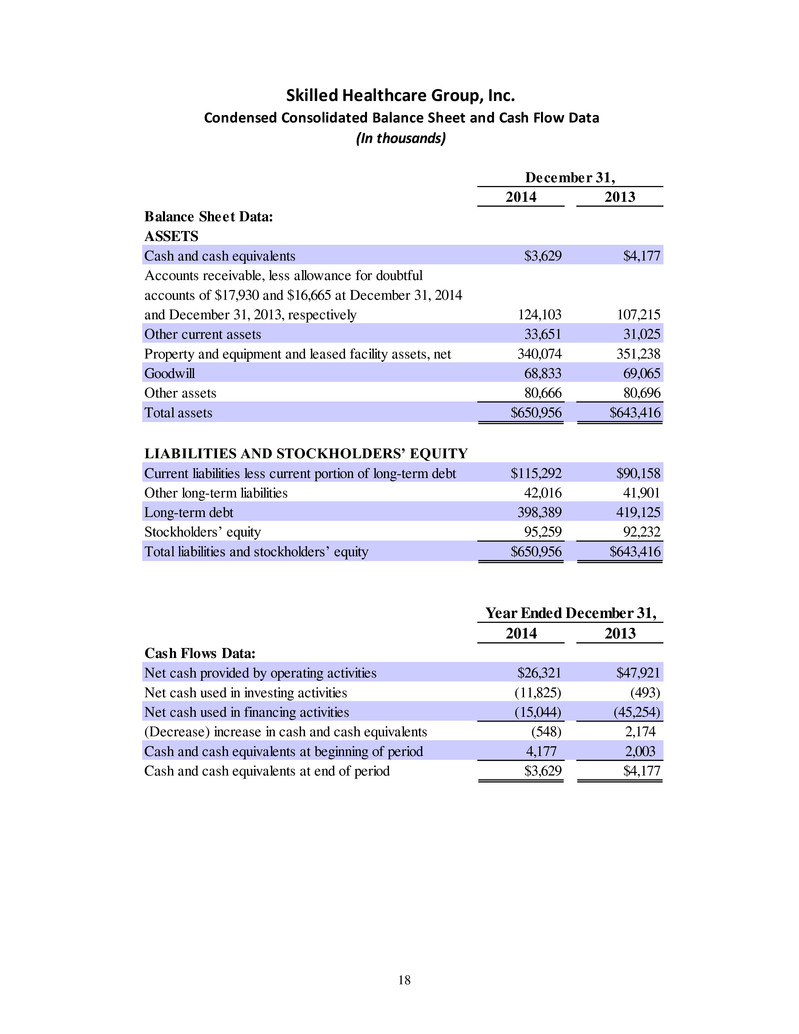
18 2014 2013 Balance Sheet Data: ASSETS Cash and cash equivalents $3,629 $4,177 Accounts receivable, less allowance for doubtful accounts of $17,930 and $16,665 at December 31, 2014 and December 31, 2013, respectively 124,103 107,215 Other current assets 33,651 31,025 Property and equipment and leased facility assets, net 340,074 351,238 Goodwill 68,833 69,065 Other assets 80,666 80,696 Total assets $650,956 $643,416 LIABILITIES AND STOCKHOLDERS’ EQUITY Current liabilities less current portion of long-term debt $115,292 $90,158 Other long-term liabilities 42,016 41,901 Long-term debt 398,389 419,125 Stockholders’ equity 95,259 92,232 Total liabilities and stockholders’ equity $650,956 $643,416 2014 2013 Cash Flows Data: Net cash provided by operating activities $26,321 $47,921 Net cash used in investing activities (11,825) (493) Net cash used in financing activities (15,044) (45,254) (Decrease) increase in cash and cash equivalents (548) 2,174 Cash and cash equivalents at beginning of period 4,177 2,003 Cash and cash equivalents at end of period $3,629 $4,177 December 31, Skilled Healthcare Group, Inc. Condensed Consolidated Balance Sheet and Cash Flow Data (In thousands) Year Ended December 31,
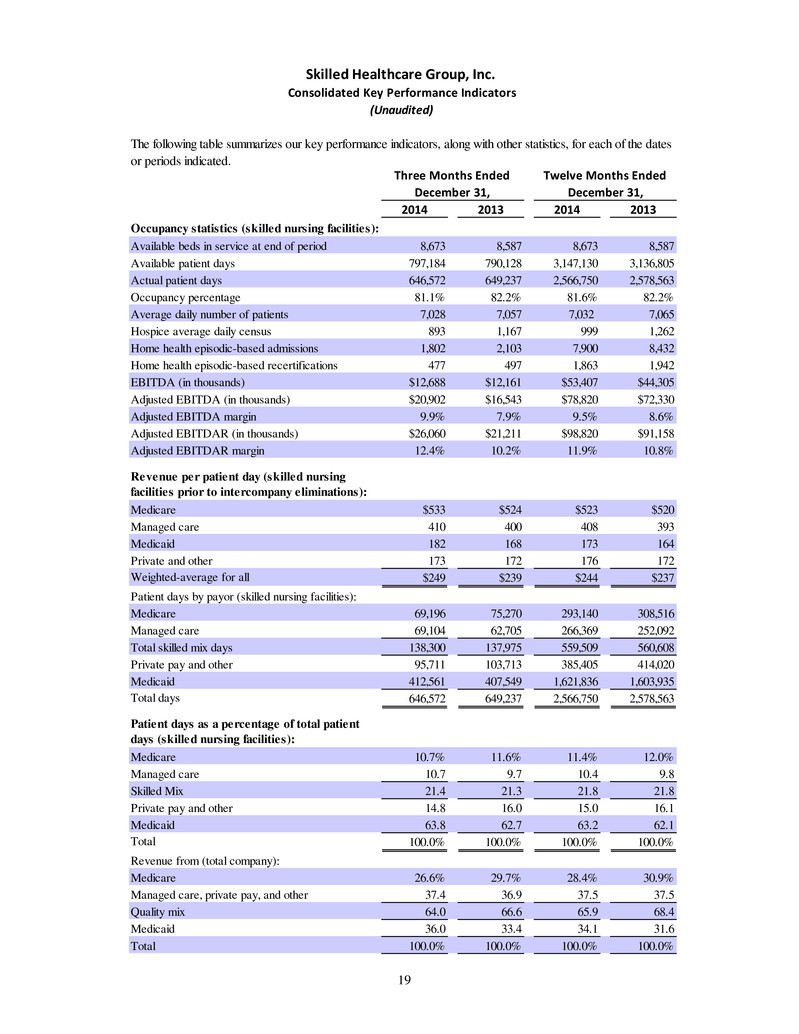
19 The following table summarizes our key performance indicators, along with other statistics, for each of the dates or periods indicated. 2014 2013 2014 2013 Occupancy statistics (skilled nursing facilities): Available beds in service at end of period 8,673 8,587 8,673 8,587 Available patient days 797,184 790,128 3,147,130 3,136,805 Actual patient days 646,572 649,237 2,566,750 2,578,563 Occupancy percentage 81.1% 82.2% 81.6% 82.2% Average daily number of patients 7,028 7,057 7,032 7,065 Hospice average daily census 893 1,167 999 1,262 Home health episodic-based admissions 1,802 2,103 7,900 8,432 Home health episodic-based recertifications 477 497 1,863 1,942 EBITDA (in thousands) $12,688 $12,161 $53,407 $44,305 Adjusted EBITDA (in thousands) $20,902 $16,543 $78,820 $72,330 Adjusted EBITDA margin 9.9% 7.9% 9.5% 8.6% Adjusted EBITDAR (in thousands) $26,060 $21,211 $98,820 $91,158 Adjusted EBITDAR margin 12.4% 10.2% 11.9% 10.8% Revenue per patient day (skilled nursing facilities prior to intercompany eliminations): Medicare $533 $524 $523 $520 Managed care 410 400 408 393 Medicaid 182 168 173 164 Private and other 173 172 176 172 Weighted-average for all $249 $239 $244 $237 Patient days by payor (skilled nursing facilities): Medicare 69,196 75,270 293,140 308,516 Managed care 69,104 62,705 266,369 252,092 Total skilled mix days 138,300 137,975 559,509 560,608 Private pay and other 95,711 103,713 385,405 414,020 Medicaid 412,561 407,549 1,621,836 1,603,935 Total days 646,572 649,237 2,566,750 2,578,563 Patient days as a percentage of total patient days (skilled nursing facilities): Medicare 10.7% 11.6% 11.4% 12.0% Managed care 10.7 9.7 10.4 9.8 Skilled Mix 21.4 21.3 21.8 21.8 Private pay and other 14.8 16.0 15.0 16.1 Medicaid 63.8 62.7 63.2 62.1 Total 100.0% 100.0% 100.0% 100.0% Revenue from (total company): Medicare 26.6% 29.7% 28.4% 30.9% Managed care, private pay, and other 37.4 36.9 37.5 37.5 Quality mix 64.0 66.6 65.9 68.4 Medicaid 36.0 33.4 34.1 31.6 Total 100.0% 100.0% 100.0% 100.0% Three Months Ended December 31, Twelve Months Ended December 31, Skilled Healthcare Group, Inc. Consolidated Key Performance Indicators (Unaudited)

20 As of December 31, As of December 31, 2014 2013 Facilities: Skilled nursing facilities operated: Owned 51 51 Leased 22 21 Total skilled nursing facilities operated 73 72 Total licensed beds 9,063 8,967 Skilled nursing facilities leased to unaffiliated third party operator 5 5 Assisted living facilities Owned 21 21 Leased 1 1 Total assisted living facilities 22 22 Total licensed beds 1,212 1,212 Total facilities 100 99 Available bed in service (SNF only) 8,673 8,587 Percentage owned facilities 77.0% 77.8% Skilled Healthcare Group, Inc. Facility Ownership
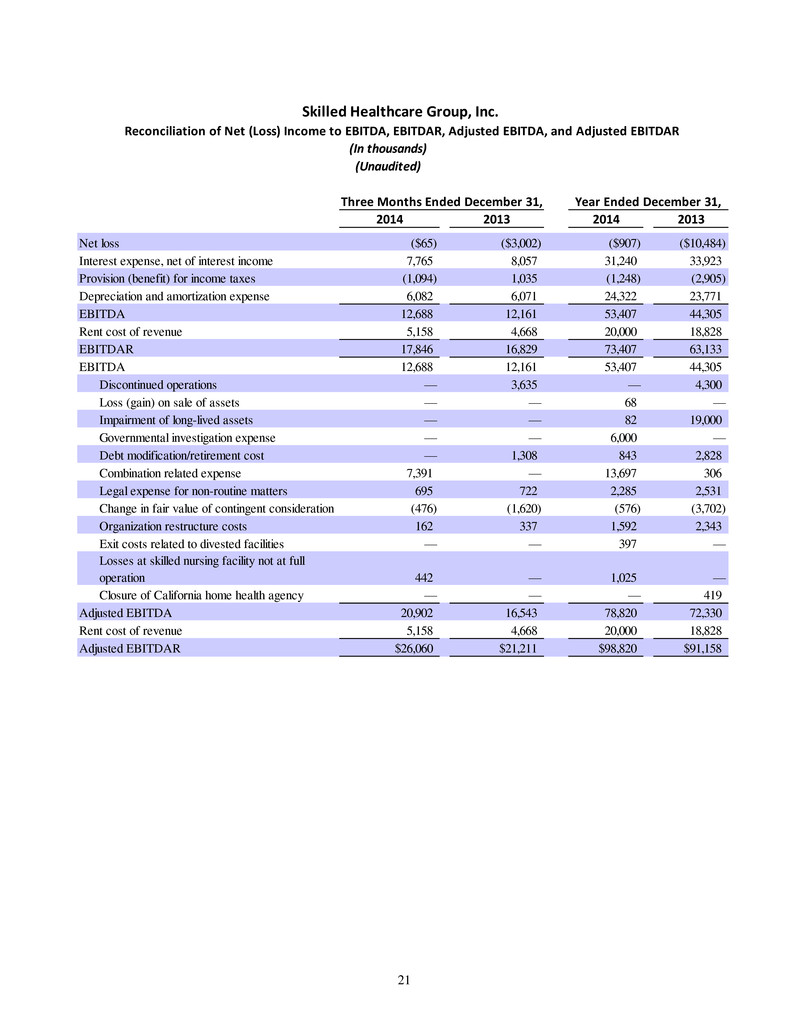
21 (In thousands) (Unaudited) 2014 2013 2014 2013 Net loss ($65) ($3,002) ($907) ($10,484) Interest expense, net of interest income 7,765 8,057 31,240 33,923 Provision (benefit) for income taxes (1,094) 1,035 (1,248) (2,905) Depreciation and amortization expense 6,082 6,071 24,322 23,771 EBITDA 12,688 12,161 53,407 44,305 Rent cost of revenue 5,158 4,668 20,000 18,828 EBITDAR 17,846 16,829 73,407 63,133 EBITDA 12,688 12,161 53,407 44,305 Discontinued operations — 3,635 — 4,300 Loss (gain) on sale of assets — — 68 — Impairment of long-lived assets — — 82 19,000 Governmental investigation expense — — 6,000 — Debt modification/retirement cost — 1,308 843 2,828 Combination related expense 7,391 — 13,697 306 Legal expense for non-routine matters 695 722 2,285 2,531 Change in fair value of contingent consideration (476) (1,620) (576) (3,702) Organization restructure costs 162 337 1,592 2,343 Exit costs related to divested facilities — — 397 — Losses at skilled nursing facility not at full operation 442 — 1,025 — Closure of California home health agency — — — 419 Adjusted EBITDA 20,902 16,543 78,820 72,330 Rent cost of revenue 5,158 4,668 20,000 18,828 Adjusted EBITDAR $26,060 $21,211 $98,820 $91,158 Three Months Ended December 31, Year Ended December 31, Skilled Healthcare Group, Inc. Reconciliation of Net (Loss) Income to EBITDA, EBITDAR, Adjusted EBITDA, and Adjusted EBITDAR

22 2014 2013 2014 2013 (Loss) income from continuing operations before provision (benefit) for income taxes ($1,159) $1,668 ($2,155) ($9,089) Organization restructure costs 162 337 1,592 2,343 Exit costs related to divested facilities — — 397 — Legal expense for non-routine matters 695 722 2,285 2,531 Losses at skilled nursing facility not at full operation 442 — 1,025 — Governmental investigation expense — — 6,000 — Impairment of long lived assets — — 82 19,000 Closure of California home health agency — — — 419 Debt modification/retirement costs — 1,308 843 2,828 Combination related expenses 7,391 — 13,697 306 Adjusted income before provision for income taxes 7,531 4,035 23,766 18,338 Tax expense (1,094) 1,030 (1,248) (2,905) Tax benefit from total adjustments 3,389 923 10,109 10,697 Tax difference from shares that vested at a lower price than the grant price 130 — (495) — California Enterprise Zone tax credit valuation allowance (124) — (124) (1,500) Adjusted tax expense 2,301 1,953 8,242 6,292 Adjusted net income from continuing operations $5,230 $2,082 $15,524 $12,046 Weighted-average common shares outstanding, diluted 38,766 37,793 38,595 37,964 Adjusted net income per share, diluted 0.14$ 0.06$ 0.40$ 0.32$ Effective tax rate 30.6% 48.4% 34.7% 34.3% Three Months Ended December 31, Year Ended December 31, Skilled Healthcare Group, Inc. Reconciliation of (Loss) Income Before (Benefit) Provision for Income Taxes to Adjusted Net Income (In thousands, except per share data) (Unaudited)
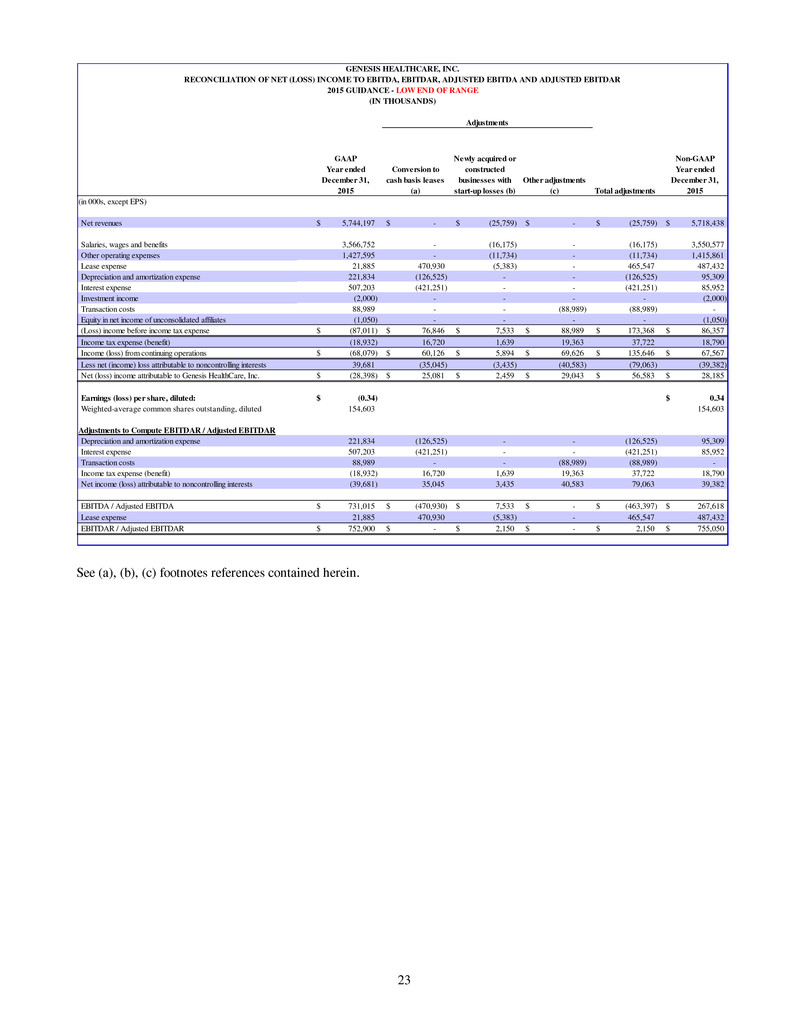
23 GAAP Year ended December 31, 2015 Conversion to cash basis leases (a) Newly acquired or constructed businesses with start-up losses (b) Other adjustments (c) Total adjustments Non-GAAP Year ended December 31, 2015 (in 000s, except EPS) Net revenues 5,744,197$ -$ (25,759)$ -$ (25,759)$ 5,718,438$ Salaries, wages and benefits 3,566,752 - (16,175) - (16,175) 3,550,577 Other operating expenses 1,427,595 - (11,734) - (11,734) 1,415,861 Lease expense 21,885 470,930 (5,383) - 465,547 487,432 Depreciation and amortization expense 221,834 (126,525) - - (126,525) 95,309 Interest expense 507,203 (421,251) - - (421,251) 85,952 Investment income (2,000) - - - - (2,000) Transaction costs 88,989 - - (88,989) (88,989) - Equity in net income of unconsolidated affiliates (1,050) - - - - (1,050) (Loss) income before income tax expense (87,011)$ 76,846$ 7,533$ 88,989$ 173,368$ 86,357$ Income tax expense (benefit) (18,932) 16,720 1,639 19,363 37,722 18,790 Income (loss) from continuing operations (68,079)$ 60,126$ 5,894$ 69,626$ 135,646$ 67,567$ Less net (income) loss attributable to noncontrolling interests 39,681 (35,045) (3,435) (40,583) (79,063) (39,382) Net (loss) income attributable to Genesis HealthCare, Inc. (28,398)$ 25,081$ 2,459$ 29,043$ 56,583$ 28,185$ Earnings (loss) per share, diluted: (0.34)$ 0.34$ Weighted-average common shares outstanding, diluted 154,603 154,603 Adjustments to Compute EBITDAR / Adjusted EBITDAR Depreciation and amortization expense 221,834 (126,525) - - (126,525) 95,309 Interest expense 507,203 (421,251) - - (421,251) 85,952 Transaction costs 88,989 - - (88,989) (88,989) - Income tax expense (benefit) (18,932) 16,720 1,639 19,363 37,722 18,790 Net income (loss) attributable to noncontrolling interests (39,681) 35,045 3,435 40,583 79,063 39,382 EBITDA / Adjusted EBITDA 731,015$ (470,930)$ 7,533$ -$ (463,397)$ 267,618$ Lease expense 21,885 470,930 (5,383) - 465,547 487,432 EBITDAR / Adjusted EBITDAR 752,900$ -$ 2,150$ -$ 2,150$ 755,050$ GENESIS HEALTHCARE, INC. RECONCILIATION OF NET (LOSS) INCOME TO EBITDA, EBITDAR, ADJUSTED EBITDA AND ADJUSTED EBITDAR 2015 GUIDANCE - LOW END OF RANGE (IN THOUSANDS) Adjustments See (a), (b), (c) footnotes references contained herein.

24 GAAP Year ended December 31, 2015 Conversion to cash basis leases (a) Newly acquired or constructed businesses with start-up losses (b) Other adjustments (c) Total adjustments Non-GAAP Year ended December 31, 2015 (in 000s, except EPS) Net revenues 5,824,197$ -$ (25,759)$ -$ (25,759)$ 5,798,438$ Salaries, wages and benefits 3,614,512 - (16,175) - (16,175) 3,598,337 Other operating expenses 1,446,798 - (11,734) - (11,734) 1,435,064 Lease expense 21,885 470,930 (5,383) - 465,547 487,432 Depreciation and amortization expense 222,554 (126,525) - - (126,525) 96,029 Interest expense 508,003 (421,251) - - (421,251) 86,752 Investment income (3,000) - - - - (3,000) Transaction costs 88,989 - - (88,989) (88,989) - Equity in net income of unconsolidated affiliates (2,000) - - - - (2,000) (Loss) income before income tax expense (73,544)$ 76,846$ 7,533$ 88,989$ 173,368$ 99,824$ Income tax (benefit) expense (16,002) 16,720 1,639 19,363 37,722 21,720 Income (loss) from continuing operations (57,542)$ 60,126$ 5,894$ 69,626$ 135,646$ 78,104$ Less net (income) loss attributable to noncontrolling interests 33,539 (35,045) (3,435) (40,583) (79,063) (45,524) Net (loss) income attributable to Genesis HealthCare, Inc. (24,003)$ 25,081$ 2,459$ 29,043$ 56,583$ 32,580$ Earnings (loss) per share, diluted: (0.29)$ 0.39$ Weighted-average common shares outstanding, diluted 154,603 154,603 Adjustments to Compute EBITDAR / Adjusted EBITDAR Depreciation and amortization expense 222,554 (126,525) - - (126,525) 96,029 Interest expense 508,003 (421,251) - - (421,251) 86,752 Transaction costs 88,989 - - (88,989) (88,989) - Income tax (benefit) expense (16,002) 16,720 1,639 19,363 37,722 21,720 Net income (loss) attributable to noncontrolling interests (33,539) 35,045 3,435 40,583 79,063 45,524 EBITDA / Adjusted EBITDA 746,002$ (470,930)$ 7,533$ -$ (463,397)$ 282,605$ Lease expense 21,885 470,930 (5,383) - 465,547 487,432 EBITDAR / Adjusted EBITDAR 767,887$ -$ 2,150$ -$ 2,150$ 770,037$ RECONCILIATION OF NET (LOSS) INCOME TO EBITDA, EBITDAR, ADJUSTED EBITDA AND ADJUSTED EBITDAR 2015 GUIDANCE - HIGH END OF RANGE (IN THOUSANDS) Adjustments GENESIS HEALTHCARE, INC. See (a), (b), (c) footnotes references contained herein.
