Attached files
| file | filename |
|---|---|
| EXCEL - IDEA: XBRL DOCUMENT - CONTROL4 CORP | Financial_Report.xls |
| EX-31.1 - EX-31.1 - CONTROL4 CORP | a14-25497_1ex31d1.htm |
| EX-21.1 - EX-21.1 - CONTROL4 CORP | a14-25497_1ex21d1.htm |
| EX-32.1 - EX-32.1 - CONTROL4 CORP | a14-25497_1ex32d1.htm |
| EX-31.2 - EX-31.2 - CONTROL4 CORP | a14-25497_1ex31d2.htm |
| EX-23.1 - EX-23.1 - CONTROL4 CORP | a14-25497_1ex23d1.htm |
| XML - IDEA: XBRL DOCUMENT - CONTROL4 CORP | R9999.htm |
UNITED STATES
SECURITIES AND EXCHANGE COMMISSION
Washington, D.C. 20549
FORM 10-K
(Mark One)
x ANNUAL REPORT PURSUANT TO SECTION 13 OR 15(d) OF THE SECURITIES EXCHANGE ACT OF 1934
For the fiscal year ended December 31, 2014
OR
o TRANSITION REPORT PURSUANT TO SECTION 13 OR 15(d) OF THE SECURITIES EXCHANGE ACT OF 1934
For the transition period from to .
Commission file number 001-36017
Control4 Corporation
(Exact name of registrant as specified in its charter)
|
Delaware |
|
42-1583209 |
|
|
|
|
|
11734 S. Election Road |
|
84020 |
(801) 523-3100
(Registrant’s telephone number, including area code)
Securities registered pursuant to Section 12(b) of the Act:
|
Title of each class |
|
Name of each exchange on which registered |
|
Common Stock, $0.0001 par value per share |
|
The NASDAQ Stock Market LLC |
Securities registered pursuant to Section 12(g) of the Act:
None
Indicate by check mark if the registrant is a well-known seasoned issuer, as defined in Rule 405 of the Securities Act. Yes o No x
Indicate by check mark if the registrant is not required to file reports pursuant to Section 13 or Section 15(d) of the Act. Yes o No x
Indicate by check mark whether the registrant (1) has filed all reports required to be filed by Section 13 or 15(d) of the Securities Exchange Act of 1934 during the preceding 12 months (or for such shorter period that the registrant was required to file such reports), and (2) has been subject to such filing requirements for the past 90 days. Yes x No o
Indicate by check mark whether the registrant has submitted electronically and posted on its corporate Web site, if any, every Interactive Data File required to be submitted and posted pursuant to Rule 405 of Regulation S-T (§232.405 of this chapter) during the preceding 12 months (or for such shorter period that the registrant was required to submit and post such files). Yes x No o
Indicate by check mark if disclosure of delinquent filers pursuant to Item 405 of Regulation S-K (§ 229.405 of this chapter) is not contained herein, and will not be contained, to the best of registrant’s knowledge, in definitive proxy or information statements incorporated by reference in Part III of this Form 10-K or any amendment to this Form 10-K. x
Indicate by check mark whether the registrant is a large accelerated filer, an accelerated filer, a non-accelerated filer or a smaller reporting company. See definition of “accelerated filer”, “large accelerated filer” and “smaller reporting company” in Rule 12b-2 of the Exchange Act.
|
Large accelerated filer o |
Accelerated filer x |
Non-accelerated filer o |
Smaller reporting company o |
Indicate by check mark whether the registrant is a shell company (as defined in Rule 12b-2 of the Exchange Act). Yes o No x
The aggregate market value of voting and non-voting common equity held by non-affiliates of the registrant as of June 30, 2014 was approximately $307.1 million (based on a closing sale price of $19.56 per share as reported for the NASDAQ Global Select Market on June 30, 2014). For purposes of this calculation, shares of common stock held by officers, directors and their affiliated holders and shares of common stock held by persons who hold more than 10% of the outstanding common stock of the registrant have been excluded from this calculation because such persons may be deemed to be affiliates. This determination of executive officer or affiliate status is not necessarily a conclusive determination for other purposes.
As of February 10, 2015, 24,308,287 shares of the registrant’s Common Stock, $0.0001 par value, were outstanding.
DOCUMENTS INCORPORATED BY REFERENCE
Portions of the registrant’s definitive Proxy Statement relating to its 2015 Annual Meeting of Stockholders are incorporated by reference into Part III of this Annual Report on Form 10-K where indicated. Such Proxy Statement will be filed with the U.S. Securities and Exchange Commission (“SEC”) within 120 days after the end of the fiscal year to which this report relates.
Control4 Corporation
Form 10-K
For Fiscal Year Ended December 31, 2014
Cautionary Note Regarding Forward-Looking Statements
This Annual Report on Form 10-K (“Form 10-K”) contains “forward-looking statements” that involve risks and uncertainties, as well as assumptions that, if they never materialize or prove incorrect, could cause our results to differ materially from those expressed or implied by such forward-looking statements. All statements other than statements of historical fact contained in this Form 10-K are forward-looking statements within the meaning of Section 27A of the Securities Act of 1933, as amended, or the Securities Act, and Section 21E of the Securities Exchange Act of 1934, as amended, or the Exchange Act. In some cases, you can identify forward-looking statements by terminology such as “may,” “will,” “should,” “could,” “expects,” “plans,” “anticipates,” “believes,” “estimates,” “predicts,” “potential” or “intends” or the negative of these terms or other comparable terminology. We caution investors that any forward-looking statements are made as of the date they were first issued and are based on management’s beliefs, expectations, and on assumptions made by, and information currently available to, management. Forward-looking statements are subject to risks, assumptions and uncertainties, many of which involve factors or circumstances that are beyond Control4’s control. Control4’s actual results could differ materially from those stated or implied in forward-looking statements due to a number of factors, including but not limited to, those discussed in the section titled “Risk Factors” included in this Form 10-K, as well as other documents that may be filed by the Company from time to time with the SEC. Control4 urges investors to consider these factors carefully in evaluating the forward-looking statements contained in this Form 10-K and not to give any such forward-looking statement any undue reliance. Moreover, we operate in a very competitive and rapidly changing environment. New risk factors emerge from time to time and it is not possible for management to predict all such risk factors, nor can we assess the impact of all such risk factors on our business or the extent to which any factor, or combination of factors, may cause actual results to differ materially from those contained in any forward-looking statements. The forward-looking statements included in this Form 10-K represent Control4’s views as of the date of this Form 10-K, and the Company anticipates that subsequent events and developments will cause its views to change. Control4 undertakes no intention or obligation to update or revise any forward-looking statements, whether as a result of new information, future events, or otherwise.
References in this Form 10-K to the “Company,” “Control4,” “we,” “us,” and “our” refer to Control4 Corporation and, where appropriate, its subsidiaries, unless otherwise stated.
Overview
We are a leading provider of automation and control solutions for the connected home. We unlock the potential of connected devices, making entertainment systems easier to use, homes more comfortable and energy efficient, and families more secure. We provide our consumers with the ability to integrate music, video, lighting, temperature, security, communications and other functionalities into a unified home automation solution that enhances our consumers’ daily lives. More than 78% of our consumers have integrated two or more of these functionalities with our solution. At the center of our solution is our advanced software platform, which we provide through our products that interface with a wide variety of connected devices that are developed both by us and by third parties.
Our solution functions as the operating system of the home, making connected devices work together to control, automate and personalize the homes of our consumers.
Consumer need for simplicity and a personalized experience, combined with advances in technology, are driving rapid growth in the connected home market. As a result of the significant growth in smart devices, mobile data networks, home broadband access and in-home wireless networking, consumers are more comfortable with ubiquitous connectivity and device interoperability. Accustomed to network connectivity and control of their digital lives, consumers are now looking for affordable ways to extend this functionality into their homes, driving growth in the mainstream home automation market.
We were founded in 2003 to deliver a mainstream home automation solution by enabling consumers to unify their connected devices into a personalized system at an accessible and affordable entry point. Sold through our worldwide network of over 3,250 active direct dealers, our solution sits at the center of the mainstream home automation market by providing integrated and extensible control of over 8,700 third-party devices and services. These devices and services span a broad variety of product categories including music, video, lighting, temperature, security, communications and other devices. Our platform capabilities provide consumers with solutions that are easy to use, comprehensive, personalized, flexible and affordable.
Based on our analysis, we estimate that we have automated more than 180,000 homes representing cumulative sales of more than 410,000 of our controller appliances, the brain of the connected home. We sell and deliver our solutions through an extensive worldwide dealer and distributor network and have solutions installed in 91 countries. In 2014, our top 100 dealers represented 22% of our total revenue and our top 10 dealers represented 6% of our total revenue.
We generated revenue of $109.5 million, $128.5 million and $148.8 million in 2012, 2013 and 2014, respectively. We had a net loss of $3.7 million in 2012, and net income of $3.5 million and $8.2 million in 2013 and 2014, respectively.
Our Industry
Within the last decade, the pace of innovation in the electronics industry has accelerated rapidly. Network-aware devices—such as televisions, smartphones, tablets, thermostats, audio systems, lighting, security systems and other appliances—that separately connect to a home network create the “connected home.” Home automation technology integrates devices in the connected home, unlocking the collective potential of these devices working together to improve consumers’ lives. The home automation market has reached a major inflection point and is becoming a mainstream offering accessible by a broad base of consumers.
Home automation solutions unify the control of music, video, lighting, temperature, security, communications and other devices in the connected home to provide consumers with improved convenience, comfort, energy efficiency and security. The key functional elements of home automation include:
· Control. Controlling devices is the most basic capability of home automation solutions. From a single interface, consumers can operate a wide array of devices using wired or wireless connections. With the growth in smartphones and tablets, control functionality is increasingly being extended to these mobile devices;
· Automation. After initial programming, automation enables devices to function without additional human intervention. Automation also enables various devices to work in concert to perform more complex tasks and to take actions based on external conditions; and
· Personalization. Personalization enables home automation solutions to be tailored to the unique lifestyle requirements of individual consumers and their families. Personalization unlocks the full potential of home automation to enhance, enrich and simplify the lives of consumers.
We expect the home automation market to experience three intertwined phases:
· the Connected Home (the number of network-aware devices in the home increases);
· the Automated Home (network-aware devices are connected and collectively orchestrated across devices based on personal preferences and actions, with and without human triggering); and
· the Intelligent Home (homes and the network-aware devices in them become dynamically anticipative and reactive without human prompting or intervention).
Our Solution
The Control4 solution, built around our advanced software platform, sits at the center of the fast growing mainstream segment of the home automation market. We unlock the potential of connected devices, making entertainment systems easier to use, homes more comfortable and energy efficient, and families more secure. Our solution functions as the operating system of the home, integrating music, video, lighting, temperature, security, communications and other devices into a unified automation solution that enhances our consumers’ lives.
The Control4 solution integrates more than 8,700 third-party devices and systems into a unified, easy-to-use solution for mainstream consumers. As a result, our solution provides the consumer with the following benefits:
· Easy to Use. Our solution is designed to be simple and intuitive. Through our unified software platform, consumers can easily interact with their entire automated home without learning multiple interfaces or numerous remote controls. We have designed our solution so that anyone, from a young child to a grandparent, can pick up a Control4 device, push a button and watch a movie without any prior instruction;
· Broad Device Interoperability. Our open and flexible platform provides consumers with access to a broad universe of third-party devices that become connected and interoperable through our solution. The Control4 software platform currently operates with over 8,700 discrete third-party devices;
· Advanced Personalization. Our adaptable solution enables our consumers to personalize the features and functionality of their Control4 system. Our modular design also enables the smooth integration of new third-party products to meet the evolving needs of our consumers as their lifestyles change;
· Attractive Entry Point. Consumers can start with a single room multi-media automation experience for under $1,200 and scale to an integrated solution with an average cost of approximately $25,000. Based on our research, more than half of our consumers have Control4 system configurations with one controller, with an average cost of $4,500 and a median cost of $2,800 (including estimated installation costs);
· Professional Installation and Support through Our Global Dealer Network. As the number and types of connected devices continues to grow, the need for local professional consultation, installation and support is essential for a successful home automation experience. We have built a global network of over 3,250 active direct dealers. Our certified dealers receive in-depth training, on-going education and support, enabling them to help consumers develop and install their personalized home automation experiences with the Control4 solution. To further increase consumer satisfaction, we also maintain a Customer Advocacy & Care Group that responds directly to consumer questions and concerns; and
· Remote Access. We have developed service offerings that complement our product solutions in order to provide consumers even more access, control and enhanced functionality over their automated homes. We offer a subscription service called 4Sight that provides consumers with the ability to remotely monitor and adjust settings in their homes (such as lights, temperature settings, door locks, gates and cameras) as well as receive event-based email alerts when predefined events either occur or do not occur by a specific time.
Our Growth Strategy
Our goal is to be the leading provider of mainstream home automation solutions and the operating system of choice for the home. The following are key elements of our growth strategy:
· Enhance Our Software Platform and Products. We believe that our success to-date has been largely driven by the capabilities of our software platform delivering personalized solutions for the end consumer. In 2014, with the release of Control4 OS 2.6, we introduced Composer Express, a productivity tool that allows Control4 dealers and installers to complete home installation projects more efficiently. In addition, our key software releases added new features that substantially enhanced the consumer experience, particularly related to our comfort, entertainment and security solutions. We will continue to invest in our software platform to develop and support new products, features and capabilities that deliver exceptional performance and value to our consumers;
· Strengthen and Expand Our Global Dealer and Distributor Network. We have developed a global network of over 3,250 active direct dealers and 28 distributors to sell, install and support our solutions. We will continue to expand and optimize our dealer and distributor network to ensure that we have sufficient geographic coverage across both existing and new markets. We will also continue to devote significant resources to increase the productivity and competency of our dealers and distributors by providing them with ongoing training, tools and support. In December 2014, we began the transition from a distribution model to a dealer-direct model in Germany;
· Increase Penetration of Our North America Core Market. We intend to continue to focus on the residential market in North America, which represented approximately 75% of our revenue for the year ended December 31, 2014. We believe the residential market offers us an opportunity for significant long-term growth, and we will continue to devote sales and marketing resources to increase penetration of that core market;
· Expand Our Focus on Adjacent Markets. We are also making investments to capitalize on opportunities outside the residential market and internationally. Internationally, our user interfaces are now available in 27 languages and our products are distributed in 91 countries. In addition, we have had initial success in the
multi-dwelling unit and hospitality markets, and we plan to continue our focus on these and other adjacent opportunities to expand our addressable market;
· Enhance Our Solution with Services and Apps. In addition to automating devices within the home, our solution also enables a wide variety of service and application opportunities. We plan to continue to enhance our 4Sight subscription services to provide consumers with enhanced home monitoring and control capabilities from any Internet-connected mobile device or computer;
· Pursue Technology Licensing Opportunities. We plan to make our technology increasingly available to third parties through licensing agreements. We make our device auto-discovery technology, Simple Device Discovery Protocol (“SDDP”), available on a royalty-free basis to third parties to streamline and automate the setup, identification and configuration of their devices into our system. As of December 31, 2014, 112 third parties had agreed to license SDDP from us, representing 546 devices, and 35 of them had begun shipping SDDP-enabled devices. We also plan to expand our licensing activities to leverage third-party distribution channels, grow our partner relationships, simplify the home automation experience for dealers and consumers, and increase interoperability; and
· Pursue Strategic Acquisitions. We believe that our software platform has a strategic position as the operating system of the connected home. As a result, we believe we are ideally positioned to identify, acquire and integrate strategic acquisitions that are complementary to our current offerings, strengthen and expand our technology foundation, enhance our market positioning, distribution channels and sales, and are consistent with our overall growth strategy. For example, in January 2015, we acquired Nexus Technologies Pty, Ltd. a leading distributed audio/video provider, including its full line of Leaf branded products (“Leaf”).
Our Products and Services
The primary benefits we provide consumers and dealers lie in the value and competitive differentiation of our software platform. We deliver value and differentiation to consumers and generate revenues by embedding our software into a range of physical products.
Software Platform
At the center of the Control4 product line is the Control4 Home Operating System, which we refer to as the C4 OS, and the associated application software and software development kits, or SDKs. The high-level software components include:
· Director. Director is a real-time, extensible home operating system that is responsible for monitoring and receiving events from numerous devices and services, processing those events according to consumer personalized settings, and then dispatching commands to the appropriate devices to perform predefined actions. Director runs on our controller appliances;
· Navigator. Navigator displays intuitive and rich graphical user interfaces on televisions, in-wall and table-top touch panels, smartphones and tablets, as well as list-based devices such as remote controls with LCD text-displays;
· Composer Express. Composer Express is a mobile configuration tool that simplifies the set-up process for Control4 home automation installation projects. The tool allows authorized Control4 dealers and installers to more quickly and easily configure one-room home theaters, and enables the installer to set-up hundreds of devices in complex whole-home installations by simply walking around the home using a WiFi-enabled tablet or smartphone to auto-integrate the devices within the Control4 Home Operating System. Composer Express uses Control4’s Simple Device Discovery Protocol (SDDP) to automatically discover all SDDP-enabled devices allowing the installer to integrate these devices with a single touch. Authorized Control4 dealers and installers may also use Composer Express to quickly add new customer accounts, register controllers, update the Control4 OS and assign 4Sight licenses using an iOS or Android tablet or smartphone;
· Composer Professional Edition. Composer Professional Edition is a software application that enables trained and certified Control4 dealers and installers to design, configure and personalize a Control4 home automation system for consumers;
· Composer Home Edition and Composer Media Edition. Composer Home Edition and Media Edition enable consumers to view and configure their Control4 managed devices. These drag-and-drop programs provide the ability to manage digital media and create and modify simple programs and policies (such as changing lighting scenes, modifying custom buttons and controlling behaviors among devices based on schedules or times of the day);
· DriverWorks SDK. DriverWorks SDK is a software development kit that enables dealers, programmers and device manufacturers to independently develop and test custom two-way interface drivers to support the integration of a new device or device model into our system, or to customize and enhance an existing driver. DriverWorks SDK has enabled 8,700 different products and services to be incorporated into the Control4 ecosystem; and
· Navigator SDK and Application SDK. Navigator SDK and Application SDK are software development kits that enable third-party dealers and programmers to customize and deliver new application functionality within Navigator user interfaces on Control4 interface devices through the development of apps.
Products with Embedded Software and Services
Our products leverage our software platform to provide consumers with a comprehensive and easy-to-use connected home experience. We designed our software platform to be extensible, which has allowed us to improve and augment the functionality of hardware products (both those designed by us and by others) over time. We also design and manufacture our products via contract manufacturers as well as certify partner products for sale through our dealers. Our products and services include:
· Controller Appliances. Our controller appliances run our Director software to monitor, process and automate events, statuses and actions for numerous devices and services, creating a comprehensive connected home experience. Currently we offer the HC-800, a whole home controller appliance, and the HC-250, a single-room controller appliance.
· Interface Devices. We offer touch panels, handheld remote controls and keypads as interface devices. We also develop and deliver software applications for Apple iOS and Android smartphones and tablets that enable these personal devices to become control interfaces to Control4 connected homes, both on-premise and remotely.
· Audio Solutions. We offer audio distribution and amplification products that scale from single room systems to whole home distributed audio systems. We offer 4-zone and 8-zone power amplifiers, 4x4 and 8x8 matrix amplifiers, a 16x16 audio matrix switch, and a single-zone wireless amplifier for retrofit installations. These products make up the backbone of a distributed audio solution. Consumers are able to listen to their personal music library as well as streaming music services via our music streamer, which is built into the HC-800 and HC-250 controllers. We also offer the Wireless Music Bridge, which enables consumers to enjoy music available on their smartphone, tablet or computer—their personal music collection and as streaming services like Pandora, Rhapsody, Spotify or TuneIn—by wirelessly streaming their selection to their home audio system using AirPlay, DLNA or Bluetooth technologies.
· Video Solutions. We offer a broad line of video matrix switches ranging from 4x4 to 20x20, which includes HDMI as well as HDBaseT switches that are capable of distributing HD video images up to 100 meters over cat5/6e cable. This product line also includes a variety of additional extender kits, mounting kits, and various packages for maximum flexibility in offering systems that allow customers to watch what they want, when and where they want to watch it.
· Lighting Products. We offer a suite of lighting products that provide personalized control and energy management. Our suite of wireless light switches and dimmers can easily replace devices in an existing home or be installed in new homes. We offer innovative in-wall wireless switches and dimmers for 120V, 240V and 277V electrical loads, which meet the requirements of North America and many international markets. We also offer centralized lighting systems, where all of the lighting control will be done on a remote panel. In addition to providing lighting control, our keypads can be programmed to operate other systems in the home, such as allowing consumers to access their favorite music playlist with the touch of a button.
· Thermostats. Our wireless multi-stage thermostat is completely programmable, allowing the homeowner to create schedules that fit their lifestyle, comfort and economical needs. Using our 4Sight subscription service, the thermostat is remotely accessible and controllable. Through the Control4 operating system, we also integrate with third-party comfort products (such as automated shades and pool controls) that provide additional energy savings, convenience and efficiency.
· Security Products. We offer Control4-branded security products and distribute certified third-party products, including deadbolts, motion sensors, garage access systems and water leak detection systems, from our security partners such as Baldwin, Nyce, Kwikset and Yale. Through our SDDP technology, we also integrate with over 2,200 network video recorders and surveillance cameras sold by five of the top security monitoring manufacturers.
· Communication Products. We offer full motion video and high quality audio intercom capability through our in-wall and tabletop touchscreens, as well as our exterior weather-resistant door stations.
· Subscription Services. 4Sight is a subscription service that enables 24x7 home monitoring and control from virtually anywhere, remote home programming and support, and instant email alerts based on home events so that homeowners are always in-the-know. For example, 4Sight allows consumers to remotely unlock the front door to let in a repairman, to turn on the air conditioning on the way home, and to monitor their home security cameras from a smartphone.
Sales of our controller appliances, represented 35% of our total revenue in 2014. Our installed solutions include functionalities such as music, video, lighting, temperature, security, communications as well as other functionalities used in a unified home automation solution that enhances consumers’ daily lives. More than 78% of our consumers have integrated two or more of these functionalities with our solution.
Our Distribution Network
In 2005, we started selling our solutions through a network of over 450 independent dealers. Since that time, our distribution network has grown to over 3,250 active direct dealers and 28 distributors in 91 countries. Dealers range in size from small family businesses to large enterprises.
Our dealers are home automation specialists that have significant experience in designing, installing and servicing both low- and high-voltage systems including music, video, security, communications and temperature control. Every authorized Control4 dealer has gone through extensive training and has passed the necessary certification tests—either in one of our training facilities located in the United States, the United Kingdom, China, or India or in a training facility of one of our 28 distributors. In order to become certified to sell and install our solutions, every installer for each dealer must complete course work and pass pre-training examinations, as well as pass rigorous testing at the conclusion of the multi-day formal training.
We sell directly through dealers in the United States, Canada, the United Kingdom and 47 other countries. We partner with 28 distributors to serve 41 additional countries where currently we do not have dealer training and support facilities. Our distributors recruit, train and manage dealers within their region and also help dealers find country specific solutions for unique needs based on the special home automation market characteristics within each country. In recent years, we have moved more toward a dealer-direct model in specific international regions as we have added and continue to add sales and support staff, namely in the United Kingdom, China and India. In December 2014, we began the transition from a distribution model to a dealer-direct model in Germany.
During the years ended December 31, 2012, 2013 and 2014, respectively, none of our dealers or distributors accounted for more than 5% of our revenue. None of our dealers or distributors have minimum or long-term purchase obligations. Dealer orders are typically placed on a project-by-project basis. As such, our dealers do not typically carry significant levels of inventory. The resulting just-in-time model helps reduce dealer inventory investment. Our dealers around the world are each responsible for local marketing, selling, installing and servicing our solution for the consumer.
Our Partners
The home automation market is made up of a collection of thousands of electronically controllable products made by hundreds of key manufacturers. We believe that our success has come, in part, due to our ability to establish relationships with many of these manufacturers. As of December 31, 2014, 68 separate manufacturers had formally submitted 826 devices
to us for Control4 certification so that our worldwide dealer and distributor network can be assured that these third-party devices work optimally with our platform.
In addition to standard interoperability with the Control4 system, more and more manufacturers are realizing the value our technology can bring when it is embedded inside their products. For example, in 2013, we launched our device auto-discovery technology, Simple Device Discovery Protocol, or SDDP, which enables seamless installation of devices by embedding code at the manufacturer, making it easier for dealers and consumers to add new products to existing systems. As of December 31, 2014, 112 third parties had agreed to license SDDP from us, representing 546 devices, and 35 of them had begun shipping SDDP-enabled devices.
Third-party manufacturers are currently selling over 1,100 different products representing 31 brands (including brands such as Sony, Baldwin, Kwikset, Yale and TruAudio) through our online store. Our online store provides manufacturers valuable reach into our trained dealer network, and it helps our dealers gain easy access to products that they know are certified by Control4. We also partner with other companies for purposes of strategic initiatives.
Our Technology
Core Automation Enabling Technology
At the core of the Control4 platform is the C4 OS. The C4 OS consists of two main components, our Director and Navigator software that work in concert with different modules within the system to provide consumers with a unified and comprehensive connected home experience. These modules help our software platform manage media, update connected devices and interoperate using a variety of communication protocols including Ethernet, Wi-Fi, Bluetooth, ZigBee, Infrared, or IR, serial interfaces and more.
· Director Software. Director is the brain of the C4 OS and interfaces with a Linux kernel. Director architecture includes a proprietary “driver pairing” technology that creates a hardware abstraction layer and exposes a single common software Applications Programming Interface (“API”) for all devices of the same type. For example, this enables an application developer to write an application to manage a lighting system that will work with any brand of lighting control equipment. Director also includes an advanced scheduling engine and astronomical clock that allows for time-based control of anything in a Control4 system. Director has a component called “Connection Manager” that is responsible for discovering new devices and maintaining connections with all of the diverse devices in an automation system.
· Navigator Software. Navigator is the C4 OS user interface application. Navigator connects to Director through the Director API and based on what is in the system, automatically provides a customized user interface for control of the system. All Control4 controller appliances and touch panels run Navigator. When running on a controller appliance, Navigator produces an “On-Screen” interface for use on TVs and projection systems with a remote control. Navigator can also produce an interface that is touch-based. Navigator is also available for Macs, PCs, Apple iOS and Android devices.
· Media Manager. Media Manager discovers, scrubs and indexes media audio and video content across various sources—from local content spread across Macs, PCs, NAS drives, tablets, smartphones, cable boxes and satellite receivers to streaming content scattered across online services such as Rhapsody, Pandora, TuneIn, Netflix, Vudu, Hulu and Amazon Prime. Using the C4 OS, a consumer can search for music by a particular artist and get a unified result of all content from that artist across all devices and services.
· Update Manager. Update Manager manages complex device and system updates in a synchronized way. The Update Manager will automatically check for updates on devices connected to the Control4 system, and when prompted update all of the disparate devices in the correct order, whether or not they are directly connected to the Internet.
· Audio Server. Audio Server is the C4 OS component that manages music playback in a Control4 system. Audio Server implements Control4’s patented audio synchronization system that enables synchronized music playback across traditional analog, wired digital and wireless digital audio devices.
· ZigBee Server. ZigBee Server creates an Internet Protocol-to-ZigBee bridge and maintains a robust wireless communications system through ZigBee’s open wireless mesh networking standard. Our controller appliances
use this bridge to communicate with low-bandwidth, low-cost and low-power applications such as thermostats, light switches and remote controls.
· IO Server. IO Server functions as an Internet Protocol bridge to various incompatible communication protocols such as IR, RS-232, RS-485 and contact closures. Our controller appliances implement these physical layers in order to handle the devices that do not implement Internet Protocol, allowing the connected home to communicate with more devices.
Simple Device Discovery Protocol (SDDP)
We have patented an automatic device discovery technology called Simple Device Discovery Protocol, or SDDP, that enables seamless installation of devices in our system. When a new SDDP-enabled device is installed in a home, the device sends out a signal that is immediately discovered by the system, thereby allowing the new device to easily be added.
4Sight Subscription Service
We offer a subscription service called 4Sight that enables secure remote access to the connected home without exposing the installer or consumer to the complexities of communicating around firewalls and private Internet Protocol addresses. This service facilitates connections between remote client devices and our systems through a cloud-based service. Using 4Sight, consumers can remotely monitor and control their Control4 systems as if they were in their homes.
Our Research and Development
Our flexible research and development model relies upon a combination of in-house staff and offshore design and manufacturing partners to improve and enhance our existing products and services, as well as develop new products, features and functionality in a cost-effective manner. We believe that our software platform is critical to expanding our leadership position within the mainstream home automation market. As a result, we devote the majority of our research and development resources to software development. We work closely with our consumers to understand their current and future needs and have designed a product development process that captures and integrates feedback from our consumers.
As of December 31, 2014, we had 169 employees in our research and development organization, most of whom were located at our headquarters in Salt Lake City, Utah. Our research and development expenses were $20.3 million in 2012 $25.0 million in 2013, and $27.4 million in 2014. We intend to continue to invest in research and development to expand our solutions and capabilities in the future.
Our Manufacturing
We outsource the manufacturing of our hardware products to contract manufacturers. The majority of our hardware products are manufactured by Sanmina and LiteOn at their respective facilities located in southern China, with additional manufacturing performed by six contract manufacturers located throughout Asia. Our agreement with Sanmina expires in June 2017, after which it automatically renews for successive one-year terms unless either party give written notice of its intent to terminate the agreement at least 90 days’ notice prior to the end of the then current term, or in the case of Sanmina at any other time with at least 120 days written notice. Our agreement with LiteOn automatically renewed for a one-year term in December 2014 and will continue to renew for successive one-year periods unless either party gives written notice of its intent to terminate the agreement at least 180 days’ prior to the end of the then current term. Our manufacturing partners assemble our products using our design specifications, quality assurance programs and standards, and procure components and assemble our products based on our demand forecasts. These forecasts represent our estimates of future demand for our products based upon historical trends and analysis from our sales and product management functions. We maintain fulfillment centers in Salt Lake City, Utah and York, England. Our manufacturing partners currently ship all hardware products to our fulfillment centers and then we ship them directly to our dealers and distributors around the world.
We have multiple sources for most of our components. However, we do depend on single source manufacturers for certain critical components, including processors, memory modules and touch panels. We can choose to change processor and memory modules for any of our products but because of high implementation costs, we generally choose to make these changes only upon development of new products. We also rely on certain custom connectors, cables and mechanical enclosures for our hardware products that are single sourced because of the high tooling costs of sourcing the components from multiple suppliers. In each of these cases, we own the drawings and design of these custom components.
Our Marketing
Our marketing team supports our sales channel with dealer-directed advertising and promotions, lead-generation, social media engagements and training events, as well as the design and production of consumer-facing collateral, showroom signage and market-specific advertising. Our website is the anchor to our online and social media strategy, from which we direct leads to our dealers. Control4’s bi-annual magazine, Home Smart Home, features lifestyle stories of Control4 installations from around the world and is available for download on our website. The publication is also reproduced and distributed to customers and prospects on our behalf by our dealers and partners.
We are active participants at global industry conferences and maintain a significant presence at CEDIA trade shows. Beyond CEDIA in the United States, we exhibit at ISE, the annual industry trade show held in Amsterdam. Additionally, beginning in the second quarter of 2014, we will be participating in CEDIA-specific events and tradeshows throughout China to assist in the recruitment and training of new dealers in that region. We are frequently featured in the trade press and maintain strong relationships with the industry’s key analysts and associations.
In 2013 and early 2014, we invested in an automated marketing platform to deliver leads and creative assets to our dealers that can be customized at a local level. Dealers can leverage the automated marketing platform to run online advertising campaigns, download and customize video and ad creative, showroom collateral, direct mail templates and newsletters. More importantly, we have generated a significant number of inquiries from the local microsites, and, as a result, in the first quarter of 2015, we will create a new telemarketing and sales group, whose focus is to qualify inbound leads and direct them to independent dealers in their market.
We believe that partnering with device manufacturers, leveraging co- marketing partnerships, expanding our sales channels and increasing our brand recognition among consumers are key components of our growth strategy.
Our Competition
The market for home automation systems is fragmented, highly competitive and continually evolving. Our current competitors fall into several categories:
· providers that focus primarily on the luxury segment of the home automation market, including Savant, Crestron and Elan;
· providers of point products that address a narrow set of control and automation capabilities, including Lutron, Sonos, Nest Labs (acquired by Google), Universal Remote Control, Logitech, and Roku;
· providers of managed home automation and security services, including ADT, Comcast and Vivint (which in turn may utilize third-party software from companies including Alarm.com and iControl); and
· providers of device control platforms such as Apple HomeKit, Wink and SmartThings (acquired by Samsung).
In the past, companies that provide popular point solutions have eliminated or restricted, and may again eliminate or restrict, our ability to control and be compatible with their products.
In addition, large technology companies such as Apple, Google, Microsoft and Samsung offer control capabilities among their own products, applications and services, and have ongoing development efforts to address the broader home automation market. Given the growth dynamics of this market, there are many new and existing companies targeting portions of the mainstream home automation market. To the extent that consumers adopt products, applications and services from a single large technology company, or if any of these companies broaden their home automation capabilities, we will face increased competition.
The principal competitive factors in our market include the:
· breadth of home automation capabilities provided;
· simplicity of use and installation;
· interoperability with third-party devices;
· price and total cost of ownership;
· sales reach and local installation and support capabilities; and
· brand awareness and reputation.
We believe that our home automation solution competes favorably with respect to these factors. Nevertheless, many of our competitors have substantially greater financial, technical and other resources, greater name recognition, larger sales and marketing budgets, broader distribution channels, and larger and more mature intellectual property portfolios than we do.
Our Intellectual Property
Our success and ability to compete effectively depend in part on our ability to protect our proprietary technology and to establish and adequately protect our intellectual property rights. To accomplish these objectives, we rely on a combination of patent, trademark, copyright and trade secret laws in the United States and other jurisdictions, as well as license agreements, confidentiality agreements and other contractual protections.
As of December 31, 2014, we owned 43 issued United States patents (16 of which are design patents) that are scheduled to expire between 2025 and 2031, with respect to utility patents, and between 2020 and 2022, with respect to design patents. We continue to file patent applications in multiple jurisdictions and as of December 31, 2014, we had 14 patent applications published and 9 patent applications pending in the United States. We also had 3 issued patents and 10 pending patent applications under foreign jurisdictions and treaties such as WIPO, Canada, Australia, New Zealand, the United Kingdom and the European Patent Convention. The claims for which we have sought patent protection apply to both our hardware and software products. Our patent and patent applications generally apply to the features and functions of our C4 OS and the applications associated with our platform.
We also rely on several registered and unregistered trademarks to protect our brand. As of December 31, 2014, we registered the trademarks (a) Control4, Control4 My Home, the Control4 Design, the 4 Design, 4Store, 4Sight and Everyday Easy in the United States, (b) Control4 in the European Union and Mexico, and (c) the 4 Design in China, the European Union and Mexico. As of December 31, 2014, we also have a trademark application pending in the United States, and 9 trademark applications, for various marks, pending in Brazil, Canada, China, and India.
We have filed for United States copyright protection for our source code for all major releases of our software. We also license software from third parties for integration into or use with our products, including open-source software and other commercially available software.
In addition, we seek to protect our intellectual property rights by requiring our employees and independent contractors involved in development to enter into agreements acknowledging that all inventions, trade secrets, works of authorship, developments, concepts, processes, improvements and other works generated by them on our behalf are our intellectual property, and assigning to us any rights, including intellectual property rights, that they may claim in those works.
Employees
As of December 31, 2014, we had 417 employees, including 379 employees in the United States and 38 employees internationally. None of our employees are represented by a labor union with respect to his or her employment with us. We have not experienced any work stoppages and we consider our relations with our employees to be good.
Available Information
We were incorporated in Delaware in 2003. Our principal executive offices are located at 11734 South Election Road, Salt Lake City, Utah 84020, and our telephone number is (801) 523-3100. Our principal website address is www.control4.com. Information contained on our website does not constitute a part of, and is not incorporated by reference into, this Form 10-K or in any other report or document we file with the Securities and Exchange Commission (“SEC”).
Control4, Control4 MyHome, the Control4 logo, the Control4 design, 4Store, 4Sight and Everyday Easy are registered trademarks or trademarks of Control4 Corporation in the United States and, in certain cases, in other countries. This Form 10-K contains additional trade names, trademarks and service marks of other companies. We do not intend our use
or display of these companies’ trade names, trademarks or service marks to imply a relationship with, or endorsement or sponsorship of us by, these other companies.
We are an emerging growth company as defined in the Jumpstart Our Business Startups Act of 2012 (the “JOBS Act”). We will remain an emerging growth company until the earliest to occur of: the last day of the fiscal year in which we have more than $1.0 billion in annual revenue; the date we qualify as a “large accelerated filer,” with at least $700 million of equity securities held by non-affiliates determined as of the last business day of the previous second fiscal quarter; the issuance, in any three-year period, by us of more than $1.0 billion in non-convertible debt securities; or December 31, 2018, the last day of the fiscal year ending after the fifth anniversary of our initial public offering.
We file reports with the SEC, including Annual Reports on Form 10-K, Quarterly Reports on Form 10-Q, Current Reports on Form 8-K, and any other filings required by the SEC. Through our website, we make available free of charge our Annual Reports on Form 10-K, Quarterly Reports on Form 10-Q, Current Reports on Form 8-K, and all amendments to those reports, as soon as reasonably practicable after we electronically file such material with, or furnish it to, the SEC.
The public may read and copy any materials we file with, or furnish to, the SEC at the SEC’s Public Reference Room at 100 F Street, NE, Washington, DC 20549. The public may obtain information on the operation of the Public Reference Room by calling the SEC at 1-800-SEC-0330. The SEC maintains an Internet site (www.sec.gov) that contains reports, proxy and information statements, and other information regarding issuers that file electronically with the SEC.
A description of the risks and uncertainties associated with our business is set forth below. You should carefully consider such risks and uncertainties, together with the other information contained in this report, and in our other public filings. If any of such risks and uncertainties actually occurs, our business, financial condition or operating results could differ materially from the plans, projections and other forward-looking statements included in the section titled “Management’s Discussion and Analysis of Financial Condition and Results of Operations” and elsewhere in this report and in our other public filings. In addition, if any of the following risks and uncertainties, or if any other risks and uncertainties, actually occurs, our business, financial condition or operating results could be harmed substantially, which could cause the market price of our stock to decline, perhaps significantly.
Risks Related to Our Business and Industry
We have incurred operating losses in the past, may incur operating losses in the future, and may not achieve or maintain profitability.
We began our operations in 2003. For most of our history, we have experienced net losses and negative cash flows from operations. As of December 31, 2014, we had an accumulated deficit of $93.9 million. We expect our operating expenses to increase in the future as we expand our operations. Furthermore, as a public company, we incur additional legal, accounting and other expenses that we did not incur as a private company. If our revenue does not grow to offset these increased expenses, we will not remain profitable. We may incur significant losses in the future for a number of reasons, including without limitation the other risks and uncertainties described herein. Additionally, we may encounter unforeseen operating or legal expenses, difficulties, complications, delays and other unknown factors that may result in losses in future periods. If these losses exceed our expectations or our revenue growth expectations are not met in future periods, our financial performance will be harmed.
The markets in which we participate are highly competitive and many companies, including large technology companies, broadband and security service providers and other managed service providers, are actively targeting the home automation market. Our failure to differentiate ourselves and compete successfully with these companies would make it difficult for us to add and retain consumers, and would reduce or impede the growth of our business.
The market for automation and control solutions for the connected home is increasingly competitive and global. Many large technology companies have expanded into the connected home market by developing their own solutions, or by acquiring other companies with home automation solution offerings. For example, in 2014, Google acquired Nest Labs, a manufacturer of thermostats and smoke detectors; Nest Labs acquired Dropcam, a home-monitoring camera company; Apple introduced HomeKit, a new framework for communicating with and controlling connected devices in a user’s home; and Samsung acquired home automation startup, SmartThings. These large technology companies already have broad consumer awareness and sell a variety of devices for the home, and consumers may choose their offerings instead of ours, even if we offer superior products and services. Similarly, many managed service providers, such as cable TV, telephone and security
companies, are offering services that provide device control and automation capability within the home for an additional monthly service fee. For example, Comcast’s Xfinity service now offers residential security, energy and automation services. These managed service providers have the advantage of leveraging their existing consumer base, network of installation and support technicians and name recognition to gain traction in the home automation market. In addition, consumers may prefer the monthly service fee with little to no upfront cost offered by some of these managed service providers over a larger upfront cost with little to no monthly service fees.
We expect competition from these large technology companies and managed service providers to increase in the future. This increased competition could result in pricing pressure, reduced sales, lower margins or the failure of our solutions to achieve or maintain broad market acceptance. To remain competitive and to maintain our position as a leading provider of automation and control solutions for the connected home, we will need to invest continuously in product development, marketing, dealer and distributor service and support, and product delivery infrastructure. We may not have sufficient resources to continue to make the investments in all of the areas needed to maintain our competitive position. In addition, most of our competitors have longer operating histories, greater name recognition, larger consumer bases and significantly greater financial, technical, sales, marketing and other resources than us, which may provide them with an advantage in developing, marketing or servicing new solutions. Increased competition could reduce our market share, revenue and operating margins, increase our operating costs, harm our competitive position or otherwise harm our business and results of operations.
Consumers may choose to adopt point products that provide control of discrete home functionality rather than adopting our unified home automation solution. If we are unable to increase market awareness of the benefits of our unified solution, our revenue may not continue to grow, or it may decline.
Many vendors have emerged, and may continue to emerge, to provide point products with advanced functionality for use in the home, such as a thermostat that can be controlled by an application on a smartphone. We expect more and more consumer electronic and consumer appliance products to be network-aware and connected—each very likely to have its own smart device (phone or tablet) application. Consumers may be attracted to the relatively low costs of these point products and the ability to expand their home control solution over time with minimal upfront costs, despite some of the disadvantages of this approach. While we have built our solution to be flexible and support third-party point products, these products may reduce the revenue we receive for each installation. It is therefore important that we have technical expertise and provide attractive top quality products in many areas, such as lighting, audio, video, thermostats and security, and establish broad market awareness of these solutions as well as the advantages of integrating them in a unified solution. If a significant number of consumers in our target market choose to adopt point products rather than our unified automation solution, then our business, financial condition and results of operations will be harmed, and we may not be able to achieve sustained growth or our business may decline.
Many of the competitors in our market, including providers of luxury integrated installations with long operating histories, established markets, broad user bases and proven consumer acceptance, may be successful in expanding into the mainstream home automation market, which may harm our growth and future prospects.
Many companies with which we directly compete have been operating in this industry for many years and, as a result, have established significant name recognition in the home automation industry. For example, Crestron, a provider of luxury integrated installations, has been in business for over 40 years and has become an established presence in the home automation industry. Another provider of luxury integrated installations is Savant Systems, which provides home automation based on the Apple iOS operating platform. To the extent these providers are able to develop more affordable products that compete more directly with our solution, our growth may be constrained and our business could suffer. In addition, given the strong growth potential of the market, we expect there to be many new entrants in the future.
Since we rely on third-party dealers and distributors to sell and install our solutions, we do not have a direct sales pipeline, which makes it difficult for us to accurately forecast future sales and correctly predict manufacturing requirements.
We depend on our independent dealer and distributor network to sell and install our solution. As a result, we do not directly develop or control our sales pipeline, making it difficult for us to accurately predict future sales. In addition, because the production of certain of our products requires long lead times, we enter into agreements for the manufacture and purchase of certain of our products well in advance of the time in which those products will be sold. These contracts are based on our best estimates of our near-term product needs. If we underestimate consumer demand, we may forego revenue opportunities, lose market share and damage our relationships. Conversely, if we overestimate consumer demand, we may purchase more inventory than we are able to sell at any given time, or at all. If we fail to accurately estimate demand for our products, we could have excess or obsolete inventory, resulting in a decline in the value of our inventory, which would increase our costs
of revenues and reduce our liquidity. Our failure to accurately manage inventory relative to demand would adversely affect our results of operations.
We have relatively limited visibility regarding the consumers that ultimately purchase our products, and we often rely on information from third-party dealers and distributors to help us manage our business. If these dealers and distributors fail to provide timely or accurate information, our ability to quickly react to market changes and effectively manage our business may be harmed.
We sell our solutions through independent dealers and distributors. These dealers and distributors work with consumers to design, install, update and maintain their home automation installations. While we are able to track orders from dealers and distributors and have access to certain information about the configurations of their Control4 systems that we receive through our controller appliances, we also rely on dealers and distributors to provide us with information about consumer behavior, product and system feedback, consumer demographics, buying patterns and information on our competitors. We use this channel sell-through data, along with other metrics, to assess consumer demand for our solutions, develop new products, adjust pricing and make other strategic business decisions. Channel sell-through data is subject to limitations due to collection methods and the third-party nature of the data and thus may not be complete or accurate. In addition, to the extent we collect information directly from consumers, for example through surveys that we conduct, the consumers who supply this sell-through data self select and vary by geographic region and from period to period, which may impact the usefulness of the results. If we do not receive consumer information on a timely or accurate basis, or if we do not properly interpret this information, our ability to quickly react to market changes and effectively manage our business may be harmed.
Our quarterly results of operations have fluctuated and may continue to fluctuate. As a result, we may fail to meet or exceed the expectations of investors or securities analysts, which could cause our stock price to decline.
Our quarterly revenue and results of operations may fluctuate as a result of a variety of factors, many of which are outside of our control. If our quarterly revenue or results of operations fall below the expectations of investors or securities analysts, the price of our common stock could decline substantially. Fluctuations in our results of operations may be due to a number of factors, including but not limited to:
· Demand for and market acceptance of our solutions;
· Our ability to increase, retain and incentivize the independent dealers and distributors that market, sell, install and support our solutions;
· The ability of our contract manufacturers to continue to manufacture high-quality products, and to supply sufficient products to meet our demands;
· The timing and success of introductions of new products, solutions or upgrades by us or by our competitors;
· The strength of regional, national and global economies;
· The impact of harsh seasonal weather, natural disasters or manmade problems such as terrorism;
· Changes in our business and pricing policies, or those of our competitors;
· Competition, including entry into the industry by new competitors and new offerings by existing competitors;
· The impact of seasonality on our business;
· A systemic impairment or failure of one or more of our products that erodes dealer and/or end user confidence;
· Political or regulatory changes in the markets in which we operate;
· The cost of component parts used in our products;
· The amount and timing of expenditures, including those related to expanding our operations, increasing research and development, introducing new solutions or costs related to disputes and litigation; and
· Changes in the payment terms for our solutions.
Due to the foregoing factors and the other risks discussed herein, you should not rely on quarter-to-quarter comparisons of our results of operations as an indication of our future performance, nor should you consider our recent revenue growth as indicative of our future performance.
If we are unable to develop new solutions, sell our solutions into new markets or further penetrate our existing markets, our revenue may not grow as expected.
Our ability to increase sales will depend in large part on our ability to enhance and improve our solutions, to introduce new solutions in a timely manner, to sell into new markets and to further penetrate our existing markets. The success of any enhancement or new product or solution depends on several factors, including the timely completion, introduction and market acceptance of enhanced or new solutions, the ability to attract, retain and effectively train sales and marketing personnel, the ability to develop relationships with dealers and distributors and the effectiveness of our marketing programs. Any new product or solution we develop or acquire may not be introduced in a timely or cost-effective manner, and may not achieve the broad market acceptance necessary to generate significant revenue. Any new markets into which we attempt to sell our solutions, including new vertical markets and new countries or regions, may not be receptive. Our ability to further penetrate our existing markets depends on the quality of our solutions and our ability to design our solutions to meet consumer demand. Moreover, we are frequently required to enhance and update our solutions as a result of changing standards and technological developments, which makes it difficult to recover the cost of development and forces us to continually qualify new solutions with our consumers. If we are unable to successfully develop or acquire new solutions, enhance our existing solutions to meet consumer requirements, sell solutions into new markets or sell our solutions to additional consumers in our existing markets, our revenue may not grow as expected or it may decline.
Our success depends, in part, on our ability to develop and expand our global network of independent dealers and distributors.
As of December 31, 2014, we have developed a global network of over 3,250 active direct dealers and 28 distributors to sell, install and support our solutions. We rely on our independent dealers and distributors to provide consumers with a successful Control4 home automation experience. In some cases, dealers may choose not to offer our solution and instead offer a product from one of our competitors or, in other cases, the dealer may simply discontinue its operations. In order to continue our growth and expand our business, it is important that we continue to add new dealers and distributors and maintain most of our existing relationships. We must also work to expand our network of dealers and distributors to ensure that we have sufficient geographic coverage and technical expertise to address new markets and technologies. While it is difficult to estimate the total number of available dealers in our markets, there are a finite number of dealers that are able to perform the types of technical installations required for home automation systems. In the event that we saturate the available dealer pool, or if market or other forces cause the available pool of dealers to decline, it may be increasingly difficult to grow our business. As consumers’ home automation options grow, it is important that we enhance our dealer footprint by broadening the expertise of our dealers, working with larger and more sophisticated dealers and expanding the mainstream consumer products our dealers offer. If we are unable to expand our network of dealers and distributors, our business could be harmed.
We rely on our dealers and distributors to sell our solution, and if our independent dealers and distributors fail to perform, our ability to sell and distribute our products and services will be limited, and our results of operations may be harmed.
Substantially all of our revenue is generated through the sales of our solution by our dealers and distributors. Our dealers and distributors are independent businesses that voluntarily sell our products as well as the products of other companies to consumers. We provide our dealers and distributors with specific training and programs to assist them in selling, installing and servicing our products, but we cannot assure that these steps will be effective. We have observed, and expect to continue to observe, high volatility in the monthly, quarterly and annual sales performance of individual dealers and distributors. Although we can make estimated forecasts of cumulative sales of large numbers of dealers and distributors, we cannot assure their accuracy collectively or individually. Accordingly, we may not be able to reduce or slow our spending quickly enough if our actual sales fall short of our expectations. As a result, we expect that our revenues, results of operations and cash flows may fluctuate significantly on a quarterly basis. We believe that period-to-period comparisons of our revenues, results of operations and cash flows may not be meaningful and should not be relied upon as an indication of future performance.
Our independent dealers and distributors may be unsuccessful in marketing, selling, installing and supporting our products and services. If we are unable to develop and maintain effective sales incentive programs for our dealers and distributors, we may not be able to incentivize them to sell our products to consumers and, in particular, to larger businesses and organizations. Our dealers and distributors may also market, sell and support products and services that are competitive with ours, and may devote more resources to the marketing, sales, and support of such competitive products. Our dealers and distributors may have incentives to promote our competitors’ products to the detriment of our own, or may cease selling our products altogether. Our agreements with our dealers and distributors may generally be terminated for any reason by either party with advance notice. We cannot assure that we will retain these dealers and distributors, or that we will be able to secure additional or replacement dealers and distributors. For example, in December 2014, we began the process of transitioning from a distributor to a direct sales model in Germany, and our sales may be impacted in connection with this or any similar change in our sales process in the future.
In addition, while we take certain steps to protect ourselves from liability for the actions of our dealers and distributors, consumers may seek to recover amounts from us for any damages caused by dealers in connection with system installations, or the failure of a system to perform properly due to an incorrect installation by a dealer. Furthermore, dealers and distributors may initiate claims against us related to any failure or perceived failure to operate our business in accordance with our contracts and the law. In addition, our dealers and distributors may use our name and our brand in ways we do not authorize, and any such improper use may harm our reputation or expose us to liability for their actions.
If we fail to effectively manage our existing sales channels, if our dealers or distributors are unsuccessful in fulfilling the orders for our products, or if we are unable to enter into arrangements with, and retain a sufficient number of, high quality dealers and distributors in each of the regions in which we sell products, and keep them motivated to sell our products, then our results of operations may be harmed. The termination of our relationship with any significant dealer or distributor may also adversely impact our sales and results of operations.
We have entered into several strategic arrangements and intend to pursue additional strategic opportunities in the future. If the intended benefits from our strategic relationships are not realized, our results of operations may be harmed.
We are in the process of growing our relationships with strategic partners in order to increase awareness of our solution and to attempt to reach markets that we cannot currently address cost-effectively. If these relationships do not develop in the manner we intend, our future growth could be impacted. For example, in February 2014 we allowed our agreement with Cisco Systems to expire without renewal. Furthermore, the termination of our relationship with a partner may cause us to incur expenses without corresponding revenue, incur a termination penalty and harm our sales and results of operations. For example, in 2012, we discontinued energy products for utility customers and, in connection with that decision, we incurred an expense related to an inventory purchase commitment and paid a fee to our counterparty to terminate the arrangement. Any loss of a major partner or distribution channel or other channel disruption could harm our results of operations and make us more dependent on alternate channels, damage our reputation, increase pricing and promotional pressures from other partners and distribution channels, increase our marketing costs, or harm buying and inventory patterns, payment terms or other contractual terms.
If we do not maintain the compatibility of our solutions with third-party products and applications that our consumers use, demand for our solutions could decline.
Our solutions are designed to interoperate with a wide range of other third-party products, including products in the areas of music, video, lighting, temperature and security. If we do not support the continued integration of our solutions with third-party products and applications, including through the provision of application programming interfaces, proxies and drivers that enable data to be transferred readily between our solutions and third-party products and applications, demand for our solutions could decline and we could lose sales. We will also be required to make our solutions compatible with new or additional third-party products and applications that are introduced into the markets that we serve. In addition, in the past, companies that provide popular point solutions have eliminated or restricted, and may, in the future, eliminate or restrict, our ability to integrate with, control and otherwise be compatible with these products. As a result, we may not be successful in making our solutions compatible with these third-party products and applications, which could reduce demand for our solutions. In addition, if prospective consumers require customized features or functions that we do not offer, then the market for our solutions may be harmed.
Our inability to adapt to technological change could impair our ability to remain competitive.
The market for home automation and control solutions is characterized by rapid technological change, frequent introductions of new products and evolving industry standards. Our ability to attract new consumers and increase revenue
from existing consumers will depend in significant part on our ability to anticipate changes in industry standards and to continue to enhance or introduce existing solutions on a timely basis to keep pace with technological developments. We are currently changing several aspects of our operating system, and may utilize Android open source technology in the future, which may cause difficulties including compatibility, stability and time to market. The success of this possible change, or any enhanced or new product or solution will depend on several factors, including the timely completion and market acceptance of the enhanced or new product or solution. Similarly, if any of our competitors implement new technologies before we are able to implement them, those competitors may be able to provide more effective products than ours, possibly at lower prices. Any delay or failure in the introduction of new or enhanced solutions could harm our business, results of operations and financial condition.
We currently rely on contract manufacturers to manufacture our products and on component vendors to supply parts used in our products. The majority of our components are supplied by a single source. Any disruption in our supply chain, or our failure to successfully manage our relationships with our contract manufacturers or component vendors could harm our business.
Our reliance on contract manufacturers reduces our control over the assembly process, exposing us to risks, including reduced control over quality assurance, production costs and product supply. We rely on a limited number of contract manufacturers to manufacture substantially all of our products. We also do business with a number of component vendors, and the parts they supply may not perform as expected. For certain of our products and components, we rely on a sole-source manufacturer or supplier. For the year ended December 31, 2014, two contract manufacturers, Sanmina and LiteOn, manufactured approximately 70% of our inventory purchases. Most of our contract manufacturers and component vendors are located outside of the United States, and all of them may be subject to political, economic, social and legal uncertainties that may harm our relationships with them. If we fail to manage our relationships with our contract manufacturers or component vendors effectively, or if our contract manufacturers or component vendors experience delays, disruptions, capacity constraints or quality control problems in their operations, our ability to ship products may be impaired and our competitive position and reputation could be harmed. In addition, any adverse change in our contract manufacturers’ or component vendors’ financial or business condition could disrupt our ability to supply quality products to our dealers and distributors. If we are required to change contract manufacturers or component vendors, we may lose revenue, incur increased costs or damage our relationships, or we might be unable to find a new contract manufacturer or component vendor on acceptable terms, or at all. In addition, qualifying a new contract manufacturer or component vendor could be an expensive and lengthy process. If we experience increased demand that our contract manufacturers or component vendors are unable to fulfill, or if they are unable to provide us with adequate supplies of high-quality products for any reason, we could experience a delay in our order fulfillment, and our business, results of operations and financial condition would be harmed.
Growth of our business will depend on market awareness and a strong brand, and any failure to develop, maintain, protect and enhance our brand would hurt our ability to retain or attract consumers.
Because of the early stage of development of the mainstream home automation market, we believe that building and maintaining market awareness, brand recognition and goodwill is critical to our success. This will depend largely on our ability to continue to provide high-quality solutions, and we may not be able to do so effectively. While we may choose to engage in a broader marketing campaign to further promote our brand, this effort may not be successful. Our efforts in developing our brand may be affected by the marketing efforts of our competitors, social media commentary and our reliance on our independent dealers, distributors and strategic partners to promote our brand effectively. If we are unable to cost-effectively maintain and increase positive awareness of our brand, our business, results of operations and financial condition could be harmed.
We operate in the emerging and evolving home automation market, which may develop more slowly or differently than we expect. If the mainstream home automation market does not grow as we expect, or if we cannot expand our solutions to meet the demands of this market, our revenue may decline, fail to grow or fail to grow at an accelerated rate, and we may incur additional operating losses.
The market for home automation and control solutions is developing, and it is uncertain whether, how rapidly or how consistently this market will develop, and even if it does develop, whether our solutions will achieve and sustain high levels of demand and market acceptance. Some consumers may be reluctant or unwilling to use our solutions for a number of reasons, including satisfaction with traditional solutions, concerns for additional costs and lack of awareness of our solutions. Unified home automation solutions such as ours have traditionally been luxury purchases for the high end of the residential market. Our ability to expand the sales of our solutions to a broader consumer base depends on several factors, including market awareness of our solutions, the timely completion, introduction and market acceptance of our solutions, the ability to attract, retain and effectively train sales and marketing personnel, the ability to develop relationships with dealers and
distributors, the effectiveness of our marketing programs, the costs of our solutions and the success of our competitors. If we are unsuccessful in developing and marketing our home automation solutions to mainstream consumers, or if these consumers do not perceive or value the benefits of our solutions, the market for our solutions might not continue to develop or might develop more slowly than we expect, either of which would harm our revenue and growth prospects.
Our consumers may experience service failures or interruptions due to defects in the software, infrastructure, third-party components or processes that comprise our existing or new solutions, or due to errors in product installation or servicing by our independent dealers, any of which could harm our business.
Our solutions may contain undetected defects in the software, infrastructure, third-party components or processes. If these defects lead to service failures after introduction of or an upgrade to a product or solution by an independent dealer, we could experience harm to our branded reputation, claims by our consumers, dealers, distributors, strategic partners or developers or lost revenue during the period required to address the cause of the defects. We may find defects in new or upgraded solutions, resulting in loss of, or delay in, market acceptance of our solutions, which could harm our business, results of operations and financial condition.
Since our solutions are installed by independent dealers, if they do not install or maintain our solutions correctly, our solutions may not function properly. If the improper installation or maintenance of our solutions leads to service failures after introduction of, or an upgrade to, a product or solution, we could experience harm to our branded reputation, claims by our consumers, dealers, distributors, strategic partners or developers or lost revenue during the period required to address the cause of the problem. This could harm our business, results of operations and financial condition.
Any defect in, or disruption to, our solutions could cause consumers to remove their products, not to purchase additional products from us, prevent potential consumers from purchasing our solutions, or harm our reputation. Although our contracts limit our liability to our consumers for these defects, disruptions or errors, we nonetheless could be subject to litigation for actual or alleged losses to our consumers’ businesses, which may require us to spend significant time and money in litigation or arbitration, or to pay significant settlements or damages. Defending a lawsuit, regardless of its merit, could be costly, divert management’s attention and affect our ability to obtain or maintain liability insurance on acceptable terms and could harm our business. Although we currently maintain some warranty reserves, we cannot assure you that these warranty reserves will be sufficient to cover future liabilities. Furthermore, we may be required to indemnify our dealers, distributors and partners against certain liabilities they may incur as a result of defects of our products. For example, in 2012 we incurred significant costs associated with the recall and replacement of a defective chip from a third-party component used within one of our products.
We encounter seasonality in sales, which could harm the amount, timing and predictability of our revenue and cause our stock price to fluctuate.
We have little recurring revenue or backlog, and our revenue is generated from orders of our solutions from new and existing consumers, which may cause our quarterly results to fluctuate. We may experience seasonality in the sales of our solutions. Historically, our revenue is generally highest in the fourth quarter and lowest in the first quarter. Seasonal variations in our sales may lead to significant fluctuations in our cash flows and results of operations on a quarterly basis. Given our seasonal sales, if we experience a delay in signing or a failure to sign a significant partner agreement in any particular quarter, then our results of operations for such quarter and for subsequent quarters may be below the expectations of securities analysts or investors, which may result in a decline in our stock price.
We may not generate significant revenue as a result of our current research and development efforts.
We have made and expect to continue to make significant investments in research and development and related product opportunities. For the year ended December 31, 2014, we spent $27.4 million on research and development expenses. High levels of expenditures for research and development could harm our results of operations, especially if not offset by corresponding future revenue increases. We believe that we must continue to dedicate a significant amount of resources to our research and development efforts to maintain our competitive position. However, it is difficult to estimate when, if ever, we will generate significant revenue as a result of these investments.
Our strategy includes pursuing acquisitions and our potential inability to successfully integrate newly-acquired technologies, assets or businesses may harm our financial results.
We believe part of our growth will be driven by acquisitions of other companies or their technologies, assets and businesses. Any acquisitions we complete will give rise to risks, including:
· Incurring higher than anticipated capital expenditures and operating expenses;
· Failing to assimilate the operations and personnel, or failing to retain the key personnel of the acquired company or business;
· Failing to integrate the acquired technologies, or incurring significant expense to integrate acquired technologies into our solutions;
· Disrupting our ongoing business;
· Dissipating or diverting our management resources;
· Failing to maintain uniform standards, controls and policies;
· Incurring significant accounting charges;
· Impairing relationships with employees, dealers, distributors, partners or consumers;
· Finding that the acquired technology, asset or business does not further our business strategy, that we overpaid for the technology, asset or business, or that we may be required to write off acquired assets or investments partially or entirely;
· Failing to realize the expected synergies of the transaction;
· Being exposed to unforeseen liabilities and contingencies that were not identified during diligence conducted prior to acquiring the company; and
· Being unable to generate sufficient revenue from acquisitions to offset the associated acquisition costs.
Fully integrating an acquired technology, asset or business into our operations may take a significant amount of time. We may not be successful in overcoming these risks or any other problems encountered with acquisitions. To the extent we do not successfully avoid or overcome the risks or problems related to any such acquisitions, our results of operations and financial condition could be harmed. Acquisitions also could impact our financial position and capital needs, or could cause fluctuations in our quarterly and annual results of operations.
Acquisitions could include significant goodwill and intangible assets, which may result in future impairment charges that would reduce our stated earnings. We may incur significant costs in our efforts to engage in strategic transactions and these expenditures may not result in successful acquisitions.
Future acquisitions of technologies, assets or businesses, which are paid for partially or entirely through the issuance of stock or stock rights, could dilute the ownership of our existing stockholders.
We expect that the consideration we might pay for any future acquisitions of technologies, assets or businesses could include stock, rights to purchase stock, cash or some combination of the foregoing. If we issue stock or rights to purchase stock in connection with future acquisitions, net income (loss) per share and then-existing holders of our common stock may experience dilution.
Our gross margins can vary significantly depending on multiple factors, which can result in fluctuations in our results of operations.
Our gross margins are likely to vary due to consumer demand, product mix, new product introductions, unit volumes, commodity and supply chain costs, product delivery costs, geographic sales mix, excess and obsolete inventory and the complexity and functionality of new product innovations. In particular, if we are not able to introduce new solutions in a timely manner at the cost we expect, or if consumer demand for our solutions is less than we anticipate, or if there are product pricing, marketing and other initiatives by our competitors to which we need to react that lower our margins, then our overall gross margin will be less than we project. The impact of these factors on gross margins can create unanticipated fluctuations in our results of operations, which may cause volatility in our stock price.
If we are unable to substantially utilize our net operating loss carryforwards, our financial results will be harmed.
As of December 31, 2014, our net operating loss (“NOL”) carryforward amounts for U.S. federal income and state tax purposes were $85.6 million and $86.1 million, respectively. While we are currently profitable in the U.S. for book purposes, we have had periods of substantial losses in the past and have generated substantial deductions associated with excess tax benefits; there is no assurance that we will continue to remain profitable in the U.S. or that we will be able to generate sufficient taxable income to utilize our NOLs before they expire.
Governmental regulations affecting the import or export of products could harm our revenue.
The U.S. and various foreign governments have imposed controls, export license requirements and restrictions on the import or export of some technologies, especially encryption technology, and may impose additional or broader controls, export license requirements and restrictions on the import or export of some technologies in the future. In addition, from time to time, governmental agencies have proposed additional regulation of encryption technology, such as requiring the escrow and governmental recovery of private encryption keys. Although we do not believe that any of our products currently require an export license, if our products or components of our products become subject to governmental regulation of encryption technology or other governmental regulation of imports or exports, we may be required to obtain import or export approval for such products, which could increase our costs and harm our international and domestic sales and our revenue. In addition, failure to comply with such regulations could result in penalties, costs and restrictions on export privileges, which would harm our results of operations.
If we are unable to manage our growth and diverse and complex operations, our reputation in the market and our ability to generate revenue from new or existing consumers may be harmed.
Because our operations are geographically diverse and complex, our personnel resources and infrastructure could become strained and our reputation in the market and our ability to successfully implement our business plan may be harmed. We have experienced a period of rapid growth in our headcount and operations. The growth in the size, complexity and diverse nature of our business and the expansion of our product lines and consumer base have placed increased demands on our management and operations, and further growth, if any, may place additional strains on our resources in the future. Our ability to effectively compete and to manage our planned future growth will depend on, among other things:
· Maintaining continuity in our senior management and key personnel;
· Increasing the productivity of our existing employees;
· Attracting, training, motivating and retaining our employees, particularly our technical and management personnel;
· Maintaining existing relationships and developing new relationships with contract manufacturers, dealers and distributors;
· Improving our operational, financial and management controls; and
· Improving our information reporting systems and procedures.
If we do not manage the size, complexity and diverse nature of our business effectively, we could experience delayed product releases and longer response times by our dealers in assisting our consumers in implementing our solutions, and could lack adequate resources to support our consumers on an ongoing basis, any of which could harm our reputation in the market, our ability to successfully implement our business plan and our ability to generate revenue from new or existing consumers.
If we fail to retain our key employees, our business would be harmed and we might not be able to implement our business plan successfully.
Given the complex nature of the technology on which our business is based and the speed with which such
technology advances, our future success is dependent, in large part, upon our ability to attract and retain highly qualified executive, managerial, engineering and sales personnel. Competition for talented personnel is intense, and we cannot be certain that we can retain our executive, managerial, engineering and sales personnel or that we can attract, assimilate or retain such personnel in the future. Our inability to attract and retain such personnel could harm our business, results of operations and financial condition.
Downturns in general economic and market conditions, including but not limited to downturns in the housing market and reductions in consumer spending, may reduce demand for our solutions, which could harm our revenue, results of operations, financial condition and cash flows.
Our revenue, results of operations and cash flows depend on the overall demand for our solutions, which can be significantly reduced in economic environments characterized by market and interest rate volatility, decreased consumer confidence, high unemployment, declines in residential remodeling and housing starts, and diminished growth expectations in the U.S. economy and abroad. During periods of weak or unstable economic and market conditions, providers of products and services that represent discretionary purchases are disproportionately affected. In addition, during these periods, the number of independent dealers and distributors may decline as the prospects for home building and home renovation projects diminish, which may have a corresponding impact on our growth prospects. Furthermore, during challenging economic times consumers may face issues in gaining timely access to sufficient credit, which could impair their ability to make timely payments. There is also an increased risk during these periods that an increased percentage of our dealers will file for bankruptcy protection, which may harm our reputation, revenue, profitability and results of operations. We cannot predict the timing, strength or duration of any economic slowdown, instability or recovery, generally or within any particular geography or industry. Any downturns in the general economic conditions of the geographies and industries in which we operate, or any other factors negatively impacting the housing market or consumer spending, could materially and adversely impact our revenue, results of operations, financial condition and cash flows.
If our estimates or judgments relating to our critical accounting policies are based on assumptions that change or prove to be incorrect, our results of operations could fall below expectations of securities analysts and investors, resulting in a decline in our stock price.
The preparation of financial statements in conformity with generally accepted accounting principles (“GAAP”) requires management to make estimates and assumptions that affect the amounts reported in our consolidated financial statements and accompanying notes. We base our estimates on historical experience and on various other assumptions that we believe to be reasonable under the circumstances, as provided in “Management’s Discussion and Analysis of Financial Condition and Results of Operations,” the results of which form the basis for making judgments about the carrying values of assets, liabilities and equity, and the amount of revenue and expenses that are not readily apparent from other sources. Significant assumptions and estimates used in preparing our consolidated financial statements include, or may in the future include, those related to revenue recognition, allowance for doubtful accounts, inventories, product warranties, income taxes and stock-based compensation expense. Our results of operations may be harmed if our assumptions change or if actual circumstances differ from those in our assumptions, which could cause our results of operations to fall below the expectations of securities analysts and investors, resulting in a decline in our stock price.
Changes in existing financial accounting standards or practices, or taxation rules or practices, may harm our results of operations.
Changes in existing accounting or taxation rules or practices, new accounting pronouncements or taxation rules, or varying interpretations of current accounting pronouncements or taxation practice could harm our results of operations or the manner in which we conduct our business.
Mergers or other strategic transactions involving our competitors could weaken our competitive position, which could harm our results of operations.
Our industry is highly fragmented, and we believe it is likely that some of our existing competitors will consolidate or be acquired. In addition, some of our competitors may enter into new alliances with each other or may establish or strengthen cooperative relationships with systems integrators, third-party consulting firms or other parties. For example, in 2014, Google Inc. acquired Nest Labs, a manufacturer of thermostats and smoke detectors; Nest Labs acquired Dropcam, a home-monitoring camera company; Apple Inc. introduced HomeKit, a framework for communicating with and controlling connected devices in a user’s home; and Samsung Electronics Co., Ltd. acquired home automation startup, SmartThings. These transactions and product introductions, as well as any additional consolidations, acquisitions, alliances or cooperative relationships in our industry, could lead to pricing pressure, reduce our market share or result in a competitor with greater
financial, technical, marketing, service and other resources than ours, all of which could harm our business, results of operations and financial condition.
We incur increased costs and demands upon management as a result of complying with the laws and regulations affecting public companies, which could harm our results of operations and our ability to attract and retain qualified executives and board members.
As a public company, we have and will continue to incur significant legal, accounting and other expenses that we did not incur as a private company, including costs associated with public company reporting and corporate governance requirements. These requirements include compliance with Section 404 and other provisions of the Sarbanes-Oxley Act of 2002, the Dodd-Frank Wall Street Reform and Consumer Protection Act (the “Dodd-Frank Act”), as well as rules implemented by the Securities and Exchange Commission (“SEC”), The NASDAQ Stock Market LLC, and other applicable securities or exchange-related rules and regulations. In addition, our management team has also had to adapt to the requirements of being a public company. We expect complying with these rules and regulations will substantially increase our legal and financial compliance costs and make some activities more difficult, time consuming or costly, particularly if we are no longer an “emerging growth company,” as defined in the Jumpstart Our Business Startups Act of 2012 (the “JOBS Act”).
As a public company, we also expect that it may be more difficult and more expensive for us to maintain director and officer liability insurance, and we may be required to accept reduced policy limits and coverage or incur substantially higher costs to obtain the same or similar coverage. As a result, it may be more difficult for us to attract and retain qualified individuals to serve on our board of directors or as our executive officers.
We are an “emerging growth company,” and any decision on our part to comply with certain reduced disclosure requirements applicable to emerging growth companies could make our common stock less attractive to investors.
We are an “emerging growth company,” as defined in the JOBS Act, and we may take advantage of certain exemptions from various reporting requirements that are applicable to other public companies that are not “emerging growth companies,” including not being required to comply with the auditor attestation requirements of Section 404 of the Sarbanes-Oxley Act, reduced disclosure obligations regarding executive compensation in our periodic reports and proxy statements, and exemptions from the requirements of holding an annual non-binding advisory vote on executive compensation and nonbinding stockholder approval of any golden parachute payments not previously approved. If we choose not to comply with the auditor attestation requirements of Section 404 of the Sarbanes-Oxley Act, our auditors will not be required to opine on the effectiveness of our internal control over financial reporting. As a result, investors may become less comfortable with the effectiveness of our internal controls and the risk that material weaknesses or other deficiencies in our internal controls go undetected may increase. If we choose to provide reduced disclosures in our periodic reports and proxy statements while we are an emerging growth company, investors would have access to less information and analysis about our executive compensation, which may make it difficult for investors to evaluate our executive compensation practices. We cannot predict if investors will find our common stock less attractive because we may rely on these exemptions and provide reduced disclosure. If some investors find our common stock less attractive as a result, there may be a less active trading market for our common stock and our stock price may be harmed. We will remain an “emerging growth company” for up to five years following our initial public offering or such earlier time that we are no longer an emerging growth company. We will remain an emerging growth company until the earliest to occur of: the last day of the fiscal year in which we have more than $1.0 billion in annual revenue; the date we qualify as a “large accelerated filer,” with at least $700 million of equity securities held by non-affiliates determined as of the last business day of the previous second fiscal quarter; the issuance, in any three-year period, by us of more than $1.0 billion in non-convertible debt securities; or the last day of the fiscal year ending after the fifth anniversary of our initial public offering.
In addition, Section 107 of the JOBS Act provides that an emerging growth company can take advantage of the extended transition period provided in Section 7(a)(2)(B) of the Securities Act of 1933, as amended (the “Securities Act”), for complying with new or revised accounting standards. In other words, an emerging growth company can delay the adoption of certain accounting standards until those standards would otherwise apply to private companies. However, we have chosen to “opt out” of such extended transition period, and as a result, we will comply with new or revised accounting standards on the relevant dates on which adoption of such standards is required for non-emerging growth companies. Section 107 of the JOBS Act provides that our decision to opt out of the extended transition period for complying with new or revised accounting standards is irrevocable.
Failure to achieve and maintain effective internal control over financial reporting could result in our failure to accurately report our financial results. Any inability to report and file our financial results accurately and timely could harm our business and adversely impact investor confidence in our company and, as a result, the value of our common stock.
Effective internal controls are necessary for us to produce reliable financial reports and are important to helping prevent financial fraud. If we cannot provide reliable financial reports or prevent fraud, our business and results of operations could be harmed, investors could lose confidence in our reported financial information, and the trading price of our stock could drop significantly. We are required to perform system and process evaluation and testing of our internal control over financial reporting to allow management to report on the effectiveness of our internal control over financial reporting, as required by Section 404 of the Sarbanes-Oxley Act, or Section 404. This assessment includes disclosure of any material weaknesses identified by our management in our internal control over financial reporting. However, our auditors will not be required to formally opine on the effectiveness of our internal control over financial reporting pursuant to Section 404 until we are no longer an “emerging growth company” as defined in the JOBS Act, and we continue to take advantage of the exemptions available to us through the JOBS Act.
Our compliance with Section 404 may require us to continue to incur substantial expense and expend significant management efforts. We may not be able to remediate any future material weaknesses, or to complete our evaluation, testing and any required remediation in a timely fashion. During the evaluation and testing process, if we identify one or more material weaknesses in our internal control over financial reporting, we will be unable to assert that our internal controls are effective. If we are unable to assert that our internal control over financial reporting is effective, or if our auditors are unable to express an opinion on the effectiveness of our internal controls when they are required to issue such opinion, investors could lose confidence in the accuracy and completeness of our financial reports, which could harm our stock price.
Our failure to raise additional capital or generate cash flows necessary to expand our operations and invest in new technologies in the future could reduce our ability to compete successfully and harm our results of operations.
We believe that our existing cash and cash equivalents will be sufficient to meet our anticipated cash requirements for at least the next 12 months. We may need to raise additional funds, and we may not be able to obtain additional debt or equity financing on favorable terms, if at all. If we raise additional equity financing, our security holders may experience significant dilution of their ownership interests and the value of shares of our common stock could decline. If we engage in debt financing, we may be required to accept terms that restrict our ability to incur additional indebtedness, force us to maintain specified liquidity or other ratios or restrict our ability to pay dividends or make acquisitions. If we need additional capital and cannot raise it on acceptable terms, if at all, we may not be able to, among other things:
· Develop and enhance our solutions;
· Continue to expand our research and development, sales and marketing organizations;
· Hire, train and retain employees;
· Respond to competitive pressures or unanticipated working capital requirements; or
· Pursue acquisition opportunities.
Our inability to do any of the foregoing could reduce our ability to compete successfully and harm our results of operations.
We may be subject to additional tax liabilities, which would harm our results of operations.
We are subject to income, sales, use, value added and other taxes in the United States and other countries in which we conduct business, which laws and rates vary greatly by jurisdiction. Certain jurisdictions in which we do not collect sales, use, value added or other taxes on our sales may assert that such taxes are applicable, which could result in tax assessments, penalties and interest, and we may be required to collect such taxes in the future. Significant judgment is required in determining our worldwide provision for income taxes. These determinations are highly complex and require detailed analysis of the available information and applicable statutes and regulatory materials. In the ordinary course of our business, there are many transactions and calculations where the ultimate tax determination is uncertain. Although we believe our tax estimates are reasonable, the final determination of tax audits and any related litigation could be different from our historical tax practices, provisions and accruals. If we receive an adverse ruling as a result of an audit, or we unilaterally determine that we have misinterpreted provisions of the tax regulations to which we are subject, our tax provision, results of operations or cash flows could be harmed. In addition, liabilities associated with taxes are often subject to an extended or indefinite statute of limitations period. Therefore, we may be subject to additional tax liability (including penalties and interest) for any particular year for extended periods of time.
Our business is subject to the risks of earthquakes, fire, power outages, floods and other catastrophic events, and to interruption by man-made problems such as terrorism.
A significant natural disaster, such as an earthquake, fire or a flood, or a significant power outage could harm our business, results of operations and financial condition. Natural disasters could affect our manufacturing vendors or logistics providers’ ability to perform services such as manufacturing products or assisting with shipments on a timely basis. Sanmina and LiteOn, two of our contract manufacturers that manufactured 70% of our inventory purchases for the year ended December 31, 2014, have manufacturing facilities located in China. In the event our manufacturing vendors’ information technology systems or manufacturing or logistics abilities are hindered by any of the events discussed above, shipments could be delayed, resulting in missing financial targets, such as revenue and shipment targets, for a particular quarter. Further, if a natural disaster occurs in a region from which we derive a significant portion of our revenue, such as metropolitan areas in North America, consumers in that region may delay or forego purchases of our solutions from dealers and distributors in the region, which may harm our results of operations for a particular period. In addition, acts of terrorism and cyber terrorism could cause disruptions in our business or the business of our manufacturers, logistics providers, dealers, distributors, consumers or the economy as a whole. Given our typical concentration of sales at the end of each month and quarter, any disruption in the business of our manufacturers, logistics providers, dealers, distributors and consumers that impacts sales at the end of our quarter could have a greater impact on our quarterly results. All of the aforementioned risks may be augmented if the disaster recovery plans for us and our suppliers prove to be inadequate. To the extent that any of the above results in delays or cancellations of orders, or delays in the manufacture, deployment or shipment of our products, our business, financial condition and results of operations would be harmed.
Global or regional economic, political and social conditions could harm our business and results of operations.
External factors such as potential terrorist attacks, acts of war, financial crises, trade friction or geopolitical and social turmoil in those parts of the world that serve as markets for our solutions, such as Europe, Asia or elsewhere, could harm our business and results of operations. These uncertainties may cause our consumers to reduce discretionary spending on their home and make it difficult for us to accurately plan future business activities. More generally, these geopolitical, social and economic conditions could result in increased volatility in worldwide financial markets and economies that could harm our sales. We are not insured for losses or interruptions caused by terrorist acts or acts of war. The occurrence of any of these events or circumstances could harm our business and results of operations.
Failure to comply with laws and regulations could harm our business.
Our business is subject to regulation by various federal, state, local and foreign governmental agencies, including agencies responsible for monitoring and enforcing employment and labor laws, workplace safety, product safety, environmental laws, consumer protection laws, anti-bribery laws, import/export controls, federal securities laws and tax laws and regulations. In certain jurisdictions, these regulatory requirements may be more stringent than in the United States. Noncompliance with applicable regulations or requirements could subject us to investigations, sanctions, mandatory product recalls, enforcement actions, disgorgement of profits, fines, damages, civil and criminal penalties or injunctions. If any governmental sanctions are imposed, or if we do not prevail in any possible civil or criminal litigation, our business, results of operations and financial condition could be materially harmed. In addition, responding to any action will likely result in a significant diversion of management’s attention and resources and an increase in professional fees. Enforcement actions and sanctions could further harm our business, results of operations and financial condition.
Risks Related to Our International Operations
In recent years, a significant amount of our revenue has come from sales outside of the United States, and we are therefore subject to a number of risks associated with international sales and operations.
We have a limited history of marketing, selling, installing and supporting our products and services internationally. However, international revenue (excluding Canada) accounted for 24% of our total revenue for the year ended December 31, 2014, and we expect that percentage to grow in the future. As a result, we must hire and train experienced personnel to staff and manage our foreign operations. To the extent that we experience difficulties in recruiting, training, managing, and retaining international dealers, distributors, and international staff, and specifically staff related to sales management and sales personnel, we may experience difficulties in productivity in foreign markets.
If we are not able to increase the sales of our solutions to consumers located outside of North America, our results of operations or revenue growth may be harmed. In addition, in connection with our expansion into foreign markets, we are a
receiver of currencies other than the U.S. dollar. Accordingly, changes in exchange rates, and in particular a strengthening of the U.S. dollar, will negatively affect our net sales as expressed in U.S. dollars. There is also a risk that we will have to adjust local currency product pricing due to competitive pressures when there has been significant volatility in foreign currency exchange rates.
Conducting and launching operations on an international scale requires close coordination of activities across multiple jurisdictions and time zones and consumes significant management resources. Our limited experience in operating our business outside of the United States increases the risk that our current and any future international expansion efforts will not be successful. Conducting international operations subjects us to risks that, generally, we do not face in the United States, including:
· Fluctuations in currency exchange rates;
· Unexpected changes in foreign regulatory requirements;
· Longer accounts receivable payment cycles and difficulties in collecting accounts receivable;
· Difficulties in managing and staffing international operations, including differences in labor laws, which may result in higher personnel-related liabilities and expenses;
· Potentially adverse tax consequences, including the complexities of foreign value added tax systems and restrictions on the repatriation of earnings;
· Localization of our solutions and other materials, including translation into foreign languages and associated expenses;
· Localization of our customer agreements under applicable foreign law;
· The burdens of complying with a wide variety of foreign laws and different legal standards, including laws and regulations related to privacy and data security and limitations on liability;
· Increased financial accounting and reporting burdens and complexities;
· Political, social and economic instability abroad, terrorist attacks and security concerns in general, including cyber security; and
· Reduced or varied protection for intellectual property rights in some countries.
The impact of any one of these risks could harm our international business and, consequently, our results of operations generally. Additionally, operating in international markets also requires significant management attention and financial resources. We cannot be certain that the investment and additional resources required in establishing, acquiring or integrating operations in other countries will produce desired levels of revenue or profitability.
Due to the global nature of our business, we could be harmed by violations of the U.S. Foreign Corrupt Practices Act, the U.K. Bribery Act or similar anti-corruption laws in other jurisdictions in which we operate, or various international trade and export laws.
The global nature of our business creates various domestic and local regulatory challenges. The U.S. Foreign Corrupt Practices Act (the “FCPA”), the U.K. Bribery Act 2010 (the “U.K. Bribery Act”), and similar anti-corruption laws in other jurisdictions generally prohibit U.S.-based companies and their intermediaries from making improper payments to non-U.S. officials for the purpose of obtaining or retaining business. In addition, U.S.-based companies are required to maintain records that accurately and fairly represent their transactions and have an adequate system of internal accounting controls. We operate in areas of the world that experience corruption by government officials to some degree and, in certain circumstances, compliance with anti-corruption laws may conflict with local customs and practices. Although we periodically train our employees and agents about these anti-corruption laws, we cannot assure that our training is effective in reducing the risks attendant to such anti-corruption laws. Our global operations require us to import from and export to several countries, which geographically stretches our compliance obligations. In addition, changes in such laws could result in increased regulatory requirements and compliance costs, which could harm our business, financial condition and results of
operations. Our employees or other agents may engage in prohibited conduct and render us responsible under the FCPA, the U.K. Bribery Act or similar anti-corruption laws. If we are found to be in violation of the FCPA, the U.K. Bribery Act or other anti-corruption laws (either due to acts or inadvertence of our employees, or due to the acts or inadvertence of others), we could suffer criminal or civil penalties or other sanctions, which could harm our business.
Risks Related to Our Intellectual Property
From time to time, we are defendants in legal proceedings and are threatened with litigation as to which we are unable to assess our exposure and which could become significant liabilities in the event of an adverse judgment.
We are defendants in legal proceedings from time to time. Companies in our industry have been subject to claims and litigation related to patent infringement and product liability, as well as contract and employment-related claims. We may not be able to accurately assess the risks related to these claims and lawsuits, and we may be unable to accurately assess our level of exposure. Furthermore, we are unable to predict the outcome of assertions of infringement made against us and therefore cannot estimate the range of possible loss. A court determination that our products or manufacturing processes infringe the intellectual property rights of others could result in significant liability and/or require us to make material changes to our products and/or manufacturing processes or enter into royalty or licensing arrangements, the terms of which could be onerous. Any of the foregoing could have a material adverse effect on our business, results of operations or financial condition. In the past, we have entered into settlement agreements relating to contractual claims and alleged patent infringements, which have included future royalty payments on certain products, the payment of a lump sum amount for alleged past damages, and/or the payment of a fixed amount in exchange for a covenant not to sue.
If we fail to protect our intellectual property and proprietary rights adequately, our business could be harmed.
We believe that proprietary technology is essential to establishing and maintaining our leadership position. We seek to protect our intellectual property through trade secrets, copyrights, confidentiality, non-compete and nondisclosure agreements, patents, trademarks, domain names and other measures, some of which afford only limited protection. We also rely on patent, trademark, trade secret and copyright laws to protect our intellectual property. Despite our efforts to protect our proprietary rights, unauthorized parties may attempt to copy aspects of our technology or to obtain and use information that we regard as proprietary. Our means of protecting our proprietary rights may not be adequate or our competitors may independently develop similar or superior technology, or design around our intellectual property. In addition, the laws of some foreign countries do not protect our proprietary rights to as great an extent as the laws of the United States. Intellectual property protections may also be unavailable, limited or difficult to enforce in some countries, which could make it easier for competitors to capture market share. Our failure or inability to adequately protect our intellectual property and proprietary rights could harm our business, financial condition and results of operations.
To prevent substantial unauthorized use of our intellectual property rights, it may be necessary to prosecute actions for infringement and/or misappropriation of our proprietary rights against third parties. Any such action could result in significant costs and diversion of our resources and management’s attention, and we cannot assure that we will be successful in such action. Furthermore, many of our current and potential competitors have the ability to dedicate substantially greater resources to enforce their intellectual property rights than we do. Accordingly, despite our efforts, we may not be able to prevent third parties from infringing upon or misappropriating our intellectual property.
An assertion by a third party that we are infringing its intellectual property could subject us to costly and time-consuming litigation or expensive licenses that could harm our business and results of operations.
The industries in which we compete are characterized by the existence of a large number of patents, copyrights, trademarks and trade secrets, and by frequent litigation based on allegations of infringement or other violations of intellectual property rights. We have been subject to patent litigation in the past and we may be subject to similar litigation in the future. Given that our solution integrates with all aspects of the home, the risk that our solution may be subject to these allegations is exacerbated. As we seek to extend our solutions, we could be constrained by the intellectual property rights of others. In addition, our dealer and distributor contracts require us to indemnify them against certain liabilities they may incur as a result of our infringement of any third-party intellectual property.
We might not prevail in any intellectual property infringement litigation given the complex technical issues and inherent uncertainties in such litigation. Defending such claims, regardless of their merit, could be time-consuming and distracting to management, result in costly litigation or settlement, cause development delays or require us to enter into royalty or licensing agreements. In addition, we currently have a limited portfolio of issued patents compared to our larger competitors, and therefore may not be able to effectively utilize our intellectual property portfolio to assert defenses or
counterclaims, or negotiate cross-licenses in response to patent infringement claims or litigation brought against us by third parties. Further, litigation may involve patent holding companies or other adverse patent owners who have no relevant products or revenues and against which our potential patents provide no deterrence, and many other potential litigants have the capability to dedicate substantially greater resources to enforce their intellectual property rights and to defend claims that may be brought against them. If our solutions exceed the scope of in-bound licenses or violate any third-party proprietary rights, we could be required to withdraw those solutions from the market, re-develop those solutions or seek to obtain licenses from third parties, which might not be available on reasonable terms or at all. Any efforts to re-develop our solutions, obtain licenses from third parties on favorable terms or license a substitute technology might not be successful and, in any case, might substantially increase our costs and harm our business, financial condition and results of operations. If we were compelled to withdraw any of our solutions from the market, our business, financial condition and results of operations could be harmed.
We are generally obligated to indemnify our independent dealers, distributors and partners for certain expenses and liabilities resulting from intellectual property infringement claims regarding our products, which could force us to incur substantial costs.
We have agreed, and expect to continue to agree, to indemnify our independent dealers, distributors and partners for certain intellectual property infringement claims regarding our products. As a result, in the case of infringement claims against these dealers, distributors and partners, we could be required to indemnify them for losses resulting from such claims or to refund amounts they have paid to us. We expect that some of our dealers, distributors and partners may seek indemnification from us in connection with infringement claims brought against them. We evaluate each such request on a case-by-case basis and we may not succeed in refuting all such claims. If a dealer, distributor or partner elects to invest resources in enforcing a claim for indemnification against us, we could incur significant costs disputing it. If we do not succeed in disputing it, we could face substantial liability.
The use of open source software in our solutions may expose us to additional risks and harm our intellectual property.
Some of our solutions use or incorporate software that is subject to one or more open source licenses. Open source software is typically freely accessible, usable and modifiable. Certain open source software licenses require a user who intends to distribute the open source software as a component of the user’s software to disclose publicly part or all of the source code to the user’s software. In addition, certain open source software licenses require the user of such software to make any derivative works of the open source code available to others on potentially unfavorable terms or at no cost.
The terms of many open source licenses to which we are subject have not been interpreted by U.S. or foreign courts, and accordingly there is a risk that those licenses could be construed in a manner that imposes unanticipated conditions or restrictions on our ability to commercialize our solutions. In that event, we could be required to seek licenses from third parties in order to continue offering our solutions, to re-develop our solutions, to discontinue sales of our solutions or to release our proprietary software code under the terms of an open source license, any of which could harm our business. Further, given the nature of open source software, it may be more likely that third parties might assert copyright and other intellectual property infringement claims against us based on our use of these open source software programs.
We monitor the use of all open source software in our products, solutions, processes and technology and seek to ensure that no open source software is used in such a way as to require us to disclose the source code to the related product or solution when we do not wish to do so. Despite these precautions, if a third-party software provider has incorporated certain types of open source software into software we license from such third party for our solutions without our knowledge or if we have otherwise incorporated unfavorable open source software into our solutions, we could, under certain circumstances, be required to disclose the related source code to our solutions. This could harm our intellectual property position and our business, results of operations and financial condition.
We rely on the availability of third-party licenses. If these licenses are available to us only on less favorable terms or not at all in the future, our business and results of operations may be harmed.
We have incorporated third-party licensed technology into our products. It may be necessary in the future to renew licenses relating to various aspects of these products or to seek additional licenses for existing or new products. The necessary licenses may not be available on acceptable terms, or at all. The inability to obtain certain licenses or other rights, or to obtain those licenses or rights on favorable terms, or the need to engage in litigation regarding these matters, could result in our inability to include certain features in our products or delays in product releases until such time, if ever, as equivalent technology could be identified, licensed or developed and integrated into our products, which may have a material adverse effect on our business, results of operations and financial condition. Moreover, the inclusion in our products of
intellectual property licensed from third parties on a nonexclusive basis could limit our ability to protect our proprietary rights in our products.
Failure to maintain the security of our information and technology networks, including information relating to our dealers, distributors, consumers and employees, could adversely affect us. Furthermore, if security breaches in connection with the delivery of our products and services allow unauthorized third parties to obtain control of or otherwise access consumers’ appliances, our reputation, business, results of operations and financial condition could be harmed.
We are dependent on information technology networks and systems, including the Internet, to process, transmit and store electronic information and, in the normal course of our business, we collect and retain certain information pertaining to our dealers, distributors, consumers and employees. The protection of dealer, distributor, consumer and employee data is critical to the Company. We devote significant resources to addressing security vulnerabilities in our products and information technology systems, however, the security measures put in place by the Company cannot provide absolute security, and our information technology infrastructure may be vulnerable to criminal cyber-attacks or data security incidents due to employee or dealer error, malfeasance, or other vulnerabilities. Cybersecurity attacks are increasingly sophisticated, change frequently, and often go undetected until after an attack has been launched. We may fail to identify these new and complex methods of attack, or fail to invest sufficient resources in security measures. We have and will continue to experience cyber-attacks, and we cannot be certain that advances in cyber-capabilities or other developments will not permit compromise or breach the technology protecting the networks that access our products and services and repositories where we store this information.
We have acquired a number of companies over the years and may continue to do so in the future. While we make significant efforts to address any information technology security issues with respect to our acquisitions, we may still inherit such risks when we integrate the acquired products and systems within the Company.
In addition, consumers can use our tools to access their automations systems remotely, and certain of our employees and dealers can access and update certain of our home automation products and services through the Internet. Security breaches by third parties or by, or originating from, one or more of our dealers, distributors or employees, that allow unauthorized third parties to obtain control of our consumers’ appliances containing our products or to obtain, collect, use or disclosure any the personal data of consumers, could harm our reputation, business, results of operations and financial condition. Furthermore, although we do not recommend or approve of port forwarding for remote access to our solutions, certain of our dealers have in the past and may in the future enable port forwarding, which could create security vulnerabilities in a consumer’s home network. If a security breach occurs, our reputation, business, results of operations and financial condition could be harmed. In addition, even the perception that there is a security risk associated with home automation devices generally, or that we or our dealers, distributors or employees have improperly used our technology or mishandled personal information could have a negative effect on our business. This negative perception may be increased in the event of a security breach or cyber-attack impacting one of our competitors or their products and services.
Though it is difficult to determine what harm may directly result from any specific interruption or security breach, any failure or perceived failure to maintain performance, reliability, security and availability of systems or the actual or potential theft, loss, fraudulent use or misuse of our products or the personally identifiable data of a dealer, distributor, consumer, employee , could result in:
· harm to our reputation or brand, which could lead some consumers to stop using certain of our products or services, reduce or delay future purchases of our products or services, use competing products or services, or materially and adversely affect the overall market perception of the security and reliability of our services and home automation products generally;
· individual and/or class action lawsuits, which could result in financial judgments against us and which would cause us to incur legal fees and costs;
· legal or regulatory enforcement action, which could result in fines and/or penalties and which would cause us to incur legal fees and costs; and/or
· additional costs associated with responding to the interruption or security breach, such as investigative and remediation costs, the costs of providing individuals and/or data owners with notice of the breach, legal fees, the costs of any additional fraud detection activities, or the costs of prolonged system disruptions or shutdowns.
Any of these actions could materially adversely impact our business and results of operations.
Risks Related to Owning Our Common Stock
Our share price may be volatile, which may result in securities class action litigation against us.
The market price of our common stock could be subject to wide fluctuations in response to many risk factors listed in this section, and other factors beyond our control, including:
· Actual or anticipated fluctuations in our financial condition and results of operations;
· Overall conditions in our industry and market;
· Addition or loss of consumers;
· Changes in laws or regulations applicable to our solutions;
· Actual or anticipated changes in our growth rate relative to our competitors;
· Announcements by us or our competitors of significant acquisitions, strategic partnerships, joint ventures or capital commitments;
· Additions or departures of key personnel;
· Competition from existing products or new products that may emerge;
· Issuance of new or updated research or reports by securities analysts;
· Fluctuations in the valuation of companies perceived by investors to be comparable to us;
· Disputes or other developments related to proprietary rights, including patents, litigation matters and our ability to obtain intellectual property protection for our technologies;
· Sales of our common stock by us or our stockholders;
· Share price and volume fluctuations attributable to inconsistent trading volume levels of our shares; and
· General economic and market conditions.
Furthermore, the stock markets have experienced extreme price and volume fluctuations that have affected and continue to affect the market prices of equity securities of many companies. These fluctuations often have been unrelated or disproportionate to the operating performance of those companies. These broad market and industry fluctuations, as well as general economic, political and market conditions such as recessions, interest rate changes or international currency fluctuations, may harm the market price of our common stock. In the past, companies that have experienced volatility in the market price of their stock have been subject to securities class action litigation. We may be the target of this type of litigation in the future. Securities litigation against us could result in substantial costs and divert our management’s attention from other business concerns, which could harm our business.
If securities or industry analysts do not publish research or reports about our business, or publish negative reports about our business, our share price and trading volume could decline.
The trading market for our common stock depends in part on the research and reports that securities or industry analysts publish about us or our business. We do not have any control over these analysts. If one or more of the analysts who cover us downgrade our shares or change their opinion of our shares, our share price will likely decline. If one or more of these analysts cease coverage of our company or fail to regularly publish research or reports on us, we could lose visibility in the financial markets, which could cause our stock price or trading volume to decline.
The concentration of ownership of our capital stock limits your ability to influence corporate matters.
As of December 31, 2014, our directors, executive officers and holders of more than 5% of our common stock, together with their affiliates, beneficially own, in the aggregate, 49.0% of our outstanding common stock. As a result, these stockholders, acting together, would have the ability to significantly influence the outcome of matters submitted to our stockholders for approval, including the election of directors and any merger, consolidation or sale of all or substantially all of our assets. In addition, these stockholders, acting together, would have the ability to control the management and affairs of our company. Accordingly, this concentration of ownership might harm the market price of our common stock by:
· Delaying, deferring or preventing a change in corporate control;
· Impeding a merger, consolidation, takeover or other business combination involving us; or
· Discouraging a potential acquirer from making a tender offer or otherwise attempting to obtain control of us.
Anti-takeover provisions in our charter documents and under Delaware law could make an acquisition of us, which may be beneficial to our stockholders, more difficult and may prevent attempts by our stockholders to replace or remove our current management and limit the market price of our common stock.
Provisions in our amended and restated certificate of incorporation and amended and restated bylaws may have the effect of delaying or preventing a change of control or changes in our management. Our amended and restated certificate of incorporation and amended and restated include provisions that:
· Authorize our board of directors to issue, without further action by the stockholders, up to 25,000,000 shares of undesignated preferred stock;
· Require that any action to be taken by our stockholders be effected at a duly called annual or special meeting and not by written consent;
· Specify that special meetings of our stockholders can be called only by our board of directors, the Chairman of the Board, the Chief Executive Officer or the President;
· Establish an advance notice procedure for stockholder approvals to be brought before an annual meeting of our stockholders, including proposed nominations of persons for election to our board of directors;
· Provide that directors may be removed only for cause;
· Provide that vacancies on our board of directors may be filled only by a majority of directors then in office, even though less than a quorum;
· Establish that our board of directors is divided into three classes—Class I, Class II and Class III—with each class serving staggered terms; and
· Require a super-majority of votes to amend certain of the above-mentioned provisions.
These provisions, alone or together, could delay or prevent hostile takeovers and changes in control. These provisions may also frustrate or prevent any attempts by our stockholders to replace or remove our current management by making it more difficult for stockholders to replace members of our board of directors, which is responsible for appointing the members of our management.
As a Delaware corporation, we are also subject to provisions of Delaware law, including Section 203 of the Delaware General Corporation law, which prevents some stockholders holding more than 15% of our outstanding common stock from engaging in certain business combinations without approval of the holders of substantially all of our outstanding common stock.
Any provision of our certificate of incorporation or bylaws or Delaware law that has the effect of delaying or deterring a change of control could limit the opportunity for our stockholders to receive a premium for their shares of our common stock, and could also affect the price that some investors are willing to pay for our common stock.
ITEM 1B. Unresolved Staff Comments
None.
Our corporate headquarters are located in Salt Lake City, Utah, where we lease approximately 75,000 square feet of commercial space under a lease that expires on June 30, 2018. We use this space for sales, research and development, dealer and distributor service and support, administrative purposes. We also lease approximately 45,000 square feet of warehouse space in Salt Lake City, Utah under a lease that expires on March 31, 2017.
In connection with our sales efforts in the United States and abroad, we lease office space typically on a short-term renewable basis domestically in San Jose, California; Charlotte, North Carolina and Chicago, Illinois, and internationally in York, United Kingdom; Shanghai, China; Bangalore, India; and, beginning January 2015, in Melbourne, Australia.
We believe that our facilities are suitable to meet our current needs. We intend to expand our existing facilities or add new facilities as we add employees and enter new geographic markets, and we believe that suitable additional or alternative space will be available as needed to accommodate any such growth. However, we expect to incur additional expenses in connection with such new or expanded facilities.
From time to time, we may become involved in legal proceedings arising in the ordinary course of our business. We are not presently a party to any legal proceedings[, other than specifically identified below,] that, if determined adversely to us, we believe would individually or in the aggregate have a material adverse effect on our business, results of operations, financial condition or cash flows. Currently, a range of loss associated with any individual material legal proceeding cannot be reasonably estimated.
On August 12, 2014 and September 16, 2014, respectively, we received letters from Nokia Corporation alleging that we manufacture or supply products that practice IEEE 802.11 Standards related to wireless technology, and that Nokia is the owner of a portfolio of patents essential to that standard. We are conducting an investigation of the claims made by Nokia regarding its patent portfolio. Nokia has not initiated litigation against us, but we believe that Nokia may do so. We intend to defend ourselves vigorously with respect to this and any other claims or litigation. Since no complaint has been filed and the outcome of any potential legal proceedings related to these claims is uncertain at this time, we cannot estimate the amount of liability, if any, that could result from an adverse resolution of this matter.
ITEM 4. Mine Safety Disclosures
Not applicable.
ITEM 5. Market for Registrant’s Common Equity, Related Stockholder Matters and Issuer Purchases of Equity Securities
Market Information
Our common stock has been listed on the NASDAQ Global Select Market under the symbol “CTRL” since August 2, 2013. Prior to that time, there was no public market for our common stock.
Price Range of Common Stock
The price range per share of common stock presented below represents the highest and lowest closing prices for our common stock on the NASDAQ Global Select Market during each quarter since our initial public offering. On February 10, 2015, the last reported sale price for our common stock on the NASDAQ Global Select Market was $12.86 per share.
|
2013 |
|
High |
|
Low |
| ||
|
Third Quarter (commencing August 2, 2013) |
|
$ |
23.80 |
|
$ |
17.32 |
|
|
Fourth Quarter |
|
$ |
17.86 |
|
$ |
14.17 |
|
|
2014 |
|
High |
|
Low |
| ||
|
First Quarter |
|
$ |
31.45 |
|
$ |
17.94 |
|
|
Second Quarter |
|
$ |
21.47 |
|
$ |
15.83 |
|
|
Third Quarter |
|
$ |
19.89 |
|
$ |
12.82 |
|
|
Fourth Quarter |
|
$ |
15.84 |
|
$ |
11.98 |
|
Holders of Record
As of February 10, 2015, there were 34 holders of record of our common stock. The actual number of stockholders is greater than this number of holders of record, and includes stockholders who are beneficial owners, but whose shares are held in street name by brokers and other nominees. This number of holders of record also does not include stockholders whose shares may be held in trust by other entities.
Stock Performance Graph and Cumulative Total Return
Notwithstanding any statement to the contrary in any of our previous or future filings with the SEC, the following information relating to the price performance of our common stock shall not be deemed to be “filed” with the SEC or to be “soliciting material” under the Securities Exchange Act of 1934, as amended, or the Exchange Act, and it shall not be deemed to be incorporated by reference into any of our filings under the Securities Act or the Exchange Act, except to the extent we specifically incorporate it by reference into such filing.
The following graph shows a comparison from August 2, 2013 (the date our common stock commenced trading on the NASDAQ Global Select Market) through December 31, 2014 of the total cumulative return of our common stock with the total cumulative return of the S&P 500 Index and S&P 500 Information Technology Sector Index. The comparisons in this graph below are based on historical data and are not intended to forecast or be indicative of future performance of our common stock.
The comparison assumes that $100.00 was invested in our common stock, the S&P 500 Index and S&P 500 Information Technology Sector Index, and assumes reinvestment of dividends, if any. The graph assumes the initial value of our common stock on August 2, 2013 was the closing sale price on that day of $20.05 per share and not the initial offering price to the public of $16.00 per share. The performance shown on the graph below is based on historical results and is not intended to suggest future performance.
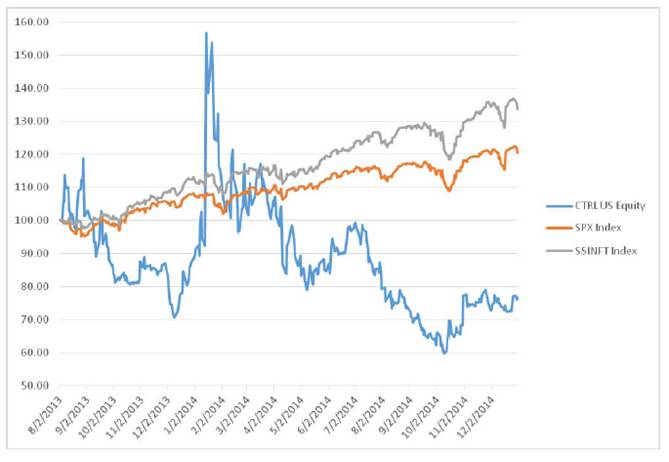
Dividend Policy
We have never declared or paid any cash dividends on our common stock and do not intend to pay any cash dividends in the foreseeable future. We anticipate that we will retain all of our future earnings for use in the operation of our business and for general corporate purposes. Any determination to pay dividends in the future will be at the discretion of our board of directors. Accordingly, investors must rely on sales of their common stock after price appreciation, which may never occur, as the only way to realize any future gains on their investments.
Unregistered Sale of Equity Securities
In February 2014, we issued 7,763 shares of common stock pursuant to the cashless net exercise of warrants to purchase our common stock.
Issuer Purchases of Equity Securities
None.
Use of Proceeds from Public Offering of Common Stock
On August 7, 2013, we closed our initial public offering (“IPO”), in which we sold 4,600,000 shares of common stock at a price to the public of $16.00 per share. The offer and sale of all of the shares in the IPO were registered under the Securities Act pursuant to a registration statement on Form S-1 (File No. 333-189736), which was declared effective by the SEC on August 1, 2013. We raised $65.6 million in net proceeds after deducting underwriting discounts and commissions of $5.2 million and offering expenses of $2.8 million. No payments were made by us to directors, officers or persons owning ten percent or more of our common stock or to their associates, or to our affiliates, other than payments in the ordinary course of business to officers for salaries. There has been no material change in the planned use of proceeds from our IPO as described in our final prospectus filed with the SEC on August 2, 2013 pursuant to Rule 424(b). We invested the funds received in
accordance with our board approved investment policy. The managing underwriters of our IPO were Merrill Lynch, Pierce, Fenner & Smith Incorporated and Raymond James & Associates, Inc.
Securities Authorized for Issuance under Equity Compensation Plans
See Part III, Item 12 of this Form 10-K for disclosure relating to our equity compensation plans. Such information will be included in our proxy statement relating to our 2015 annual meeting of stockholders, which is incorporated herein by reference.
ITEM 6. Selected Financial Data
We have derived the selected consolidated statements of operations data for the years ended December 31, 2012, 2013 and 2014 and the selected consolidated balance sheet data as of December 31, 2013 and 2014 from our audited consolidated financial statements and related notes included elsewhere in this Form 10-K. We have derived the selected consolidated statements of operations data for the years ended December 31, 2010 and 2011 and the selected consolidated balance sheet data as of December 31, 2012 from our audited consolidated financial statements not included in this Form 10-K. The following selected consolidated financial data should be read in conjunction with “Management’s Discussion and Analysis of Financial Condition and Results of Operations” and our consolidated financial statements and related notes included elsewhere in this Form 10-K. Our historical results are not necessarily indicative of the results to be expected for any future period and the results for any interim period are not necessarily indicative of the results to be expected in the full year.
|
|
|
Years Ended December 31, |
| |||||||||||||
|
|
|
2010 |
|
2011 |
|
2012 |
|
2013 |
|
2014 |
| |||||
|
|
|
(In thousands, except per share data) |
| |||||||||||||
|
Consolidated Statements of Operations Data: |
|
|
|
|
|
|
|
|
|
|
| |||||
|
Revenue |
|
$ |
74,925 |
|
$ |
93,376 |
|
$ |
109,512 |
|
$ |
128,511 |
|
$ |
148,800 |
|
|
Cost of revenue |
|
43,357 |
|
50,534 |
|
57,225 |
|
64,234 |
|
72,443 |
| |||||
|
Cost of revenue—inventory purchase commitment |
|
— |
|
— |
|
1,840 |
|
(380 |
) |
— |
| |||||
|
Gross margin |
|
31,568 |
|
42,842 |
|
50,447 |
|
64,657 |
|
76,357 |
| |||||
|
Operating expenses: |
|
|
|
|
|
|
|
|
|
|
| |||||
|
Research and development |
|
15,922 |
|
19,211 |
|
20,310 |
|
24,979 |
|
27,365 |
| |||||
|
Sales and marketing |
|
22,491 |
|
17,546 |
|
20,182 |
|
21,975 |
|
25,887 |
| |||||
|
General and administrative |
|
8,876 |
|
9,805 |
|
10,150 |
|
12,329 |
|
14,195 |
| |||||
|
Litigation settlement |
|
— |
|
— |
|
2,869 |
|
440 |
|
47 |
| |||||
|
Total operating expenses |
|
47,289 |
|
46,562 |
|
53,511 |
|
59,723 |
|
67,494 |
| |||||
|
Income (loss) from operations |
|
(15,721 |
) |
(3,720 |
) |
(3,064 |
) |
4,934 |
|
8,863 |
| |||||
|
Interest and other expense, net |
|
(544 |
) |
(165 |
) |
(518 |
) |
(1,183 |
) |
(296 |
) | |||||
|
Income (loss) before income taxes |
|
(16,265 |
) |
(3,885 |
) |
(3,582 |
) |
3,751 |
|
8,567 |
| |||||
|
Income tax expense |
|
— |
|
— |
|
141 |
|
248 |
|
411 |
| |||||
|
Net income (loss) |
|
$ |
(16,265 |
) |
$ |
(3,885 |
) |
$ |
(3,723 |
) |
$ |
3,503 |
|
$ |
8,156 |
|
|
Net income (loss) per common share: |
|
|
|
|
|
|
|
|
|
|
| |||||
|
Basic |
|
$ |
(9.93 |
) |
$ |
(2.02 |
) |
$ |
(1.58 |
) |
$ |
0.33 |
|
$ |
0.34 |
|
|
Diluted |
|
$ |
(9.93 |
) |
$ |
(2.02 |
) |
$ |
(1.58 |
) |
$ |
0.16 |
|
$ |
0.32 |
|
Non-GAAP Financial Measures
In addition to our GAAP operating results, we use certain non-GAAP financial measures to understand and evaluate our operating performance and trends, to prepare and approve our annual budget, and to develop short- and long-term operational plans. These measures, which we refer to as our non-GAAP financial measures, are not prepared in accordance with generally accepted accounting principles in the United States. Non-GAAP gross margin, non-GAAP income from operations, and non-GAAP net income exclude non-cash expenses related to stock-based compensation as well as gains or losses on inventory purchase commitments. We further exclude expenses related to litigation settlements and executive severance from non-GAAP income from operations and non-GAAP net income as well as expenses related to stock warrants from non-GAAP net income.
Management believes that it is useful to exclude stock-based compensation expense because the amount of such expense in any specific period may not directly correlate to the underlying performance of our business operations. We
believe it is useful to exclude gains or losses on inventory purchase commitments because it is income or expense that arose from our commitment to purchase energy-related products from our contract manufacturing partner that we will not use due to our decision to discontinue our energy product line for utility customers. We have not recognized that type of income or expense in periods prior to 2012, and we believe that past and future periods are more comparable if we exclude that income or expense.
Furthermore, we believe it is useful to exclude expenses related to litigation settlements, stock warrants and executive severance because of the variable and unpredictable nature of these expenses which are not indicative of past or future operating performance. We believe that past and future periods are more comparable if we exclude those expenses.
We believe these adjustments provide useful comparative information to investors. Non-GAAP results are presented for supplemental informational purposes only for understanding our operating results. The non-GAAP results should not be considered a substitute for financial information presented in accordance with generally accepted accounting principles, and may be different from non-GAAP measures used by other companies. Our non-GAAP financial measures may not provide information that is directly comparable to that provided by other companies in our industry, as other companies in our industry may calculate non-GAAP financial results differently, particularly related to non-recurring, unusual items. We urge our investors to review the reconciliation of our non-GAAP financial measures to the comparable GAAP financial measures included below, and not to rely on any single financial measure to evaluate our business.
|
|
|
Years Ended December 31, |
| |||||||||||||
|
|
|
2010 |
|
2011 |
|
2012 |
|
2013 |
|
2014 |
| |||||
|
|
|
(in thousands, except percentages and per share data) |
| |||||||||||||
|
Reconciliation of Gross Margin to Non-GAAP Gross Margin: |
|
|
|
|
|
|
|
|
|
|
| |||||
|
Gross margin |
|
$ |
31,568 |
|
$ |
42,842 |
|
$ |
50,447 |
|
$ |
64,657 |
|
$ |
76,357 |
|
|
Stock-based compensation expense in cost of revenue |
|
28 |
|
49 |
|
78 |
|
63 |
|
105 |
| |||||
|
Cost of revenue—inventory purchase commitment |
|
— |
|
— |
|
1,840 |
|
(380 |
) |
— |
| |||||
|
Non-GAAP gross margin |
|
$ |
31,596 |
|
$ |
42,891 |
|
$ |
52,365 |
|
$ |
64,340 |
|
$ |
76,462 |
|
|
Revenue |
|
$ |
74,925 |
|
$ |
93,376 |
|
$ |
109,512 |
|
$ |
128,511 |
|
$ |
148,800 |
|
|
Gross margin percentage |
|
42.1 |
% |
45.9 |
% |
46.1 |
% |
50.3 |
% |
51.3 |
% | |||||
|
Non-GAAP gross margin percentage |
|
42.2 |
% |
45.9 |
% |
47.8 |
% |
50.1 |
% |
51.4 |
% | |||||
|
Reconciliation of Income (Loss) From Operations to Non-GAAP Income (Loss) From Operations: |
|
|
|
|
|
|
|
|
|
|
| |||||
|
Income (loss) from operations |
|
$ |
(15,721 |
) |
$ |
(3,720 |
) |
$ |
(3,064 |
) |
$ |
4,934 |
|
$ |
8,863 |
|
|
Stock-based compensation expense |
|
1,469 |
|
2,013 |
|
2,869 |
|
3,760 |
|
5,341 |
| |||||
|
Cost of revenue—inventory purchase commitment |
|
— |
|
— |
|
1,840 |
|
(380 |
) |
— |
| |||||
|
Litigation settlement |
|
— |
|
— |
|
2,869 |
|
440 |
|
47 |
| |||||
|
Executive severance |
|
— |
|
— |
|
— |
|
340 |
|
— |
| |||||
|
Non-GAAP income (loss) from operations |
|
$ |
(14,252 |
) |
$ |
(1,707 |
) |
$ |
4,514 |
|
$ |
9,094 |
|
$ |
14,251 |
|
|
Revenue |
|
$ |
74,925 |
|
$ |
93,376 |
|
$ |
109,512 |
|
$ |
128,511 |
|
$ |
148,800 |
|
|
Operating margin percentage |
|
-21.0 |
% |
-4.0 |
% |
-2.8 |
% |
3.8 |
% |
6.0 |
% | |||||
|
Non-GAAP operating margin percentage |
|
-19.0 |
% |
-1.8 |
% |
4.1 |
% |
7.1 |
% |
9.6 |
% | |||||
|
Reconciliation of Net Income (Loss) to Non-GAAP Net Income (Loss): |
|
|
|
|
|
|
|
|
|
|
| |||||
|
Net income (loss) |
|
$ |
(16,265 |
) |
$ |
(3,885 |
) |
$ |
(3,723 |
) |
$ |
3,503 |
|
$ |
8,156 |
|
|
Stock-based compensation expense |
|
1,469 |
|
2,013 |
|
2,869 |
|
3,760 |
|
5,341 |
| |||||
|
Cost of revenue—inventory purchase commitment |
|
— |
|
— |
|
1,840 |
|
(380 |
) |
— |
| |||||
|
Litigation settlement |
|
— |
|
— |
|
2,869 |
|
440 |
|
47 |
| |||||
|
Convertible preferred stock warrant |
|
140 |
|
(227 |
) |
254 |
|
709 |
|
— |
| |||||
|
Executive severance |
|
— |
|
— |
|
— |
|
340 |
|
— |
| |||||
|
Non-GAAP net income (loss) |
|
$ |
(14,656 |
) |
$ |
(2,099 |
) |
$ |
4,109 |
|
$ |
8,372 |
|
$ |
13,544 |
|
|
Reconciliation of Net Income (Loss) per Share to Non-GAAP Net Income (Loss) per Share: |
|
|
|
|
|
|
|
|
|
|
| |||||
|
Basic net income (loss) per share |
|
$ |
(9.93 |
) |
$ |
(2.02 |
) |
$ |
(1.58 |
) |
$ |
0.33 |
|
$ |
0.34 |
|
|
Stock-based compensation expense |
|
0.90 |
|
1.05 |
|
1.22 |
|
0.36 |
|
0.23 |
| |||||
|
Cost of revenue—inventory purchase commitment |
|
— |
|
— |
|
0.78 |
|
(0.04 |
) |
— |
| |||||
|
Litigation settlement |
|
— |
|
— |
|
1.22 |
|
0.04 |
|
— |
| |||||
|
Convertible preferred stock warrant |
|
0.08 |
|
(0.12 |
) |
0.10 |
|
0.07 |
|
— |
| |||||
|
Executive severance |
|
— |
|
— |
|
— |
|
0.03 |
|
— |
| |||||
|
Non-GAAP basic net income (loss) per share |
|
$ |
(8.95 |
) |
$ |
(1.09 |
) |
$ |
1.74 |
|
$ |
0.79 |
|
$ |
0.57 |
|
|
Diluted net income (loss) per share |
|
$ |
(9.93 |
) |
$ |
(2.02 |
) |
$ |
(0.20 |
) |
$ |
0.16 |
|
$ |
0.32 |
|
|
Stock-based compensation expense |
|
0.90 |
|
1.05 |
|
0.15 |
|
0.17 |
|
0.21 |
| |||||
|
Cost of revenue—inventory purchase commitment |
|
— |
|
— |
|
0.10 |
|
(0.02 |
) |
— |
| |||||
|
Litigation settlement |
|
— |
|
— |
|
0.15 |
|
0.02 |
|
— |
| |||||
|
Convertible preferred stock warrant |
|
0.08 |
|
(0.12 |
) |
0.02 |
|
0.03 |
|
— |
| |||||
|
Executive severance |
|
— |
|
— |
|
— |
|
0.02 |
|
— |
| |||||
|
Non-GAAP diluted net income (loss) per share |
|
$ |
(8.95 |
) |
$ |
(1.09 |
) |
$ |
0.22 |
|
$ |
0.38 |
|
$ |
0.53 |
|
|
Weighted-average number of shares: |
|
|
|
|
|
|
|
|
|
|
| |||||
|
Basic |
|
1,638 |
|
1,923 |
|
2,360 |
|
10,609 |
|
23,685 |
| |||||
|
Diluted |
|
1,638 |
|
1,923 |
|
18,909 |
|
22,263 |
|
25,646 |
| |||||
Consolidated Balance Sheet Data
The following table sets forth our selected consolidated balance sheet data as of the dates presented:
|
|
|
As of December 31, |
| |||||||
|
|
|
2012 |
|
2013 |
|
2014 |
| |||
|
|
|
(In thousands) |
| |||||||
|
Consolidated Balance Sheet Data: |
|
|
|
|
|
|
| |||
|
Cash and cash equivalents |
|
$ |
18,695 |
|
$ |
84,546 |
|
$ |
29,187 |
|
|
Investments, net |
|
— |
|
— |
|
68,032 |
| |||
|
Property and equipment, net |
|
2,666 |
|
3,943 |
|
5,089 |
| |||
|
Working capital, excluding deferred revenue |
|
23,832 |
|
95,422 |
|
98,782 |
| |||
|
Total assets |
|
50,638 |
|
122,686 |
|
142,030 |
| |||
|
Long-term debt, including current portion |
|
3,159 |
|
2,966 |
|
1,828 |
| |||
|
Redeemable convertible preferred stock and warrant liability |
|
116,914 |
|
— |
|
— |
| |||
|
Total stockholders’ equity (deficit) |
|
(92,603 |
) |
98,474 |
|
118,302 |
| |||
ITEM 7. Management’s Discussion and Analysis of Financial Condition and Results of Operations
You should read the various sections in our Management’s Discussion and Analysis of Financial Condition and Results of Operations (MD&A) in conjunction with our consolidated financial statements and the notes thereto included elsewhere in this Annual Report on Form 10-K. The following discussion contains forward-looking statements that reflect our plans, estimates and beliefs. Our actual results could differ materially from those discussed in the forward-looking statements. Factors that could cause or contribute to these differences include those discussed below and elsewhere in this Annual Report on Form 10-K, particularly in the “Cautionary Note Regarding Forward-Looking Statements” and the “Risk Factors” section.
Our MD&A is provided in addition to the accompanying consolidated financial statements and notes to assist readers in understanding our operations, financial condition and cash flows. MD&A is organized as follows:
· Overview. Discussion of our business and overall analysis of financial and other highlights affecting the company in order to provide context for the remainder of MD&A.
· Factors and Trends Affecting our Performance. A summary of certain market factors and trends that we believe are important to our business which we must successfully address in order to continue to grow our business.
· Key Operating and Financial Metrics. Key operating and financial metrics that we use to evaluate and manage our business.
· Results of Operations. An analysis of our financial results comparing 2013 to 2012 and comparing 2014 to 2013.
· Quarterly Results of Operations and Other Data. An analysis of our quarterly results of operations for each of the quarters in the two-year period ended December 31, 2014.
· Liquidity and Capital Resources. An analysis of changes in our balance sheets and cash flows, and discussion of our financial condition and potential sources of liquidity.
· Critical Accounting Estimates. Accounting estimates that we believe are most important to understanding the assumptions and judgments incorporated in our reported financial results and forecasts.
· Contractual Obligations and Off-Balance Sheet Arrangements. Overview of contractual obligations, contingent liabilities, commitments and off-balance sheet arrangements outstanding as of December 31, 2014, including expected payment schedule.
Overview
Control4 is a leading provider of automation and control solutions for the connected home. We unlock the potential of connected devices, making entertainment systems easier to use, homes more comfortable and energy efficient, and families more secure. We provide our consumers with the ability to integrate music, video, lighting, temperature, security,
communications and other functionalities into a unified home automation solution that enhances our consumers’ daily lives. At the center of our solution is our advanced software platform, which we provide through our products that interface with a wide variety of connected devices that are developed by us and by third parties.
Consumers purchase our products from our worldwide network of certified independent dealers, regional and national retailers and distributors. These dealers, retailers and distributors design and install a solution to fit the specific needs of each consumer, whether it is a one-room home theatre solution or a whole-home automation solution that includes the integration of music, video, lighting, temperature, security and communications devices. Our products are installed in both new and existing residences, multi-dwelling units and small commercial facilities. We refer to revenue from sales of our products through these dealers, retailers and distributors as our Core revenue (“Core revenue”). In addition, a portion of our revenue is attributable to sales in the hospitality industry, which is excluded from our calculation of Core revenue. Our revenue from sales to hotels is generally project-based and has been significant in some periods and insignificant in other periods. In the future, we expect revenue from hospitality to continue to be attributable to large projects and will continue to be uneven from period to period. During the year ended December 31, 2014, we sold our products directly to over 3,250 active direct dealers in the United States, Canada, the United Kingdom and 47 other countries, and partnered with 28 distributors to cover an additional 41 countries where we do not have direct dealer relationships. These distributors sell our solutions through dealers and provide warehousing, training, technical support, billing and service for dealers in each of those countries.
We derive substantially all of our revenue from the sale of products that contain our proprietary software, which functions as the operating system of the home. In 2013, we derived a smaller portion of our revenue from licensing our Control4 App software, which allows consumers to access their home control system from within their home using their smartphone, tablet or laptop. In April 2013, we began bundling the Control4 App software licenses with our controller appliances. As a result, we began selling Control4 App software licenses only to legacy system owners. Sales of individual Control4 App software licenses have declined since April 2013 and are insignificant for all periods presented. We also generate revenue from the sale of annual subscriptions to our 4Sight subscription service, which allows consumers to remotely access and control their home control system, as well as receive alerts regarding activities in their home. 4Sight also allows dealers to perform remote diagnostic and programming services. Revenues associated with this subscription service are not material in any period.
We were founded in 2003 and began shipping our products and generating revenue in 2005. Our revenue growth rates for the last five years are shown in the following table (dollars in millions):
|
|
|
For the Years Ended December 31, |
| |||||||||||||
|
|
|
2010 |
|
2011 |
|
2012 |
|
2013 |
|
2014 |
| |||||
|
Core revenue |
|
$ |
70.9 |
|
$ |
88.3 |
|
$ |
105.6 |
|
$ |
126.4 |
|
$ |
144.7 |
|
|
Core revenue growth over prior year |
|
26 |
% |
25 |
% |
20 |
% |
20 |
% |
14 |
% | |||||
|
|
|
|
|
|
|
|
|
|
|
|
| |||||
|
Other revenue |
|
$ |
4.0 |
|
$ |
5.1 |
|
$ |
3.9 |
|
$ |
2.1 |
|
$ |
4.1 |
|
|
Other revenue changes over prior year |
|
-65 |
% |
28 |
% |
-24 |
% |
-46 |
% |
95 |
% | |||||
|
|
|
|
|
|
|
|
|
|
|
|
| |||||
|
Total revenue |
|
$ |
74.9 |
|
$ |
93.4 |
|
$ |
109.5 |
|
$ |
128.5 |
|
$ |
148.8 |
|
|
Total revenue growth over prior year |
|
11 |
% |
25 |
% |
17 |
% |
17 |
% |
16 |
% | |||||
Over the past five years, we have experienced double digit Core revenue growth. Our annual Core revenue growth during that period has been the result of both the net addition of new dealers and distributors to our sales channels and an increase in revenue from existing dealers and distributors. We believe our ability to grow our core sales channel has been enhanced through product innovation and expansion of our product offerings and helping our dealers and distributors grow their business and gross margins by providing enhanced dealer installation and marketing tools. For example, during 2014 we:
· We have now partnered with over 110 manufacturers of consumer electronics, security, lighting and HVAC that have now adopted the Control4 Simple Device Discovery Protocol (SDDP), making it easier to connect and integrate their products with one another via the Control4 home automation platform;
· Introduced new lighting design tools and services to assist Dealers in the sales and installation of Control4 wireless and panelized lighting systems;
· Released Control4 Hospitality 2.5.3, an update to our powerful hotel automation solution, which adds simple, seamless, and secure wireless music streaming capabilities for hotel guests and improved energy intelligence solutions for hotel owners;
· Partnered with national and regional builders, leveraging the opportunity to sell Control4 to prospective homebuyers;
· Announced the release of our new operating system, Control4 OS 2.6, which brings an enhanced music experience, intuitive pool and spa control, and extensive integration with A/V equipment, comfort solutions, IP cameras, blinds, and irrigation systems;
· Launched Composer Express, a mobile configuration tool that enables Control4 Dealers to simplify and accelerate the set-up process for home automation systems; and
· Announced a new initiative to encourage customers to pay to upgrade legacy Control4 systems with our current primary controllers at a discount, so that they can enjoy better system performance, the latest Control4 OS, an improved user experience and enhanced functionality and features.
While our historical revenue growth has been organic, we have completed several small acquisitions which we believe enhance our product offerings and position us for continued growth in the future. Recent acquisitions of technology and distribution-related business are as follows:
· In July 2014, we acquired the home automation products and related intellectual property assets of Card Access, Inc., an engineering and technology company based in Utah. We previously sold these products through a distribution agreement with Card Access. We determined the Card Access acquisition to be an immaterial transaction for public reporting purposes.
· In September 2014, we acquired Extra Vegetables Limited, a UK-based company that developed integration modules and third-party drivers for Control4 and other third-party home automation systems. The acquired drivers will be provided in Control4’s driver database and made freely available to Control4 dealers through our installation software, strengthening the Company’s interoperability strategy.
· In January 2015, we acquired Nexus Technologies Pty Ltd. (“Nexus”), a developer and manufacturer of the Leaf Brand of custom audio/video distribution and switching systems. We previously sold certain Leaf products under our Control4 brand and sold other Leaf Products through our on-line ordering platform. We determined the Nexus Technologies acquisition to be an immaterial transaction for public reporting purposes.
We plan to continue to identify, acquire and integrate strategic technologies, assets and businesses that we believe will enhance the overall strength of our business, allow us to streamline sales, technical support and training, and enhance our dealers’ ability to grow their businesses.
We have historically experienced seasonal variations in our revenue as a result of holiday-related factors that are common in our industry. Our revenue is generally highest in the fourth quarter due to consumers’ desires to complete their home installations prior to the Thanksgiving and Christmas holidays. We generally see decreased sales in the first quarter due to the number of installations that were completed in the fourth quarter and the resulting decline in dealer activity in the first quarter. We generally expect these seasonal trends to continue in the future, which may cause quarterly fluctuations in our results of operations and certain financial metrics. We also expect the seasonality of the first quarter of 2015 to be more pronounced than in prior years.
Factors and Trends Affecting Our Performance
A number of industry trends have facilitated our growth over the past several years, including the proliferation of connected devices and the ubiquity and growth of network-enabled homes. From smartphones to smart watches to smart cars, technology is transforming nearly every aspect of our lives, streamlining daily routines and providing quick, easy access to the capabilities and content we want most. Not only are new technologies providing convenience on-the-go, but they are becoming increasingly accessible.
We estimate that the majority of our installations are in existing homes. We expect that future increases in either
new home construction or existing home renovations will have a positive impact on our revenue.
In new home construction, our builder programs continue to gain traction with regional builders as well as with national builders. Toll Brothers’ embrace of Control4 solutions continues to expand, and Toll Brothers’ staff are now trained and selling at 18 under-construction communities (up six from our last quarterly report), showcasing Control4 products in 22 models homes and eight design centers, and supported by a strong set of local Control4 dealers. Additionally, in December 2014, we signed another leading U.S national home-builder to a similar program and expect to start installation of model homes in select communities in the coming months. We also plan to continue to engage other national builders in similar strategic alliances. We believe we are well-positioned to benefit from the U.S. housing market resurgence as home automation increasingly becomes a higher priority for home buyers.
We believe that the growth of our business and our future success are dependent upon many factors, including the rates at which consumers adopt our products and services, our ability to strengthen and expand our dealer and distributor network, our ability to expand internationally and our ability to meet competitive challenges. While each of these areas presents significant opportunities for us, they also pose important challenges that we must successfully address in order to sustain or expand the growth of our business and improve our results of operations. These challenges include:
· Increasing Adoption Rates of Our Products and Services. We are focused on increasing adoption rates of our products and services through enhancements to our software platform and product offerings. We intend to accomplish these enhancements through both continued investment in research and development activities and acquisitions of complementary businesses and technologies.
· Increasing Our Brand Awareness. Our historical marketing efforts have been focused on attracting and retaining qualified dealers and distributors and providing them with consumer-facing materials and tools to market to prospects on their own. We recently expanded activities to drive online awareness and sales leads in their local markets. As a result, traffic to our dealers’ sites has increased over 75% since the launch of these initiatives in late 2013. In 2014, Marketing tested a number of lead generation strategies that yielded good responses from interested homeowners. We discovered the need for Control4 to play a more active role in lead qualification and delivery to dealers to ensure proper follow through to close. Before we begin a planned 2015 consumer ad campaign to boost awareness and interest, we are creating an inside telemarketing and sales group to ensure inbound inquiries are directed to dealers who are able to service a new customer.
· Optimizing Our North America Dealer Network. We intend to continue to optimize the performance of and expand our network of dealers in North America to ensure that we have geographic coverage and technical expertise to address our existing markets and new markets into which we plan to expand. We have added, and expect to continue to add, field sales and service personnel to assist in the optimization of our North America channel.
· Expanding our International Dealer and Distributor Network. We believe that our future growth will be significantly impacted by our ability to expand our dealer and distributor network outside of North America, adapt our products and services to foreign markets and increase our brand awareness internationally. In particular, we believe that we will have significant opportunities to expand our business in emerging markets such as China and India. We have added, and expect to continue to add, field sales and service personnel to assist in the optimization of our international channels. In February 2015, we announced a shift in our distribution model in Germany, and we are now working directly with home automation integrators in that region. To support the initiative, we are adding local staff to manage sales, technical support and training activities.
· Managing Competition. The market for home automation is fragmented, highly competitive and continually evolving. A number of large technology companies such as Apple, Google, Microsoft and Samsung offer device control capabilities among some of their own products, applications and services and could be engaged in ongoing development efforts to address the broader home automation market. For example, during 2014, Google acquired Nest Labs, Inc. which manufactures thermostats and smoke detectors; Nest Labs, Inc. acquired Dropcam, a home-monitoring camera company; Apple introduced HomeKit, a new framework for communicating with and controlling connected devices in a user’s home; and Samsung acquired home automation startup SmartThings. Our ability to gain significant market share in the home automation market and interoperate with the new technologies developed by other large technology companies over the next several years will be key factors in our ability to continue to grow our business and meet or exceed our future expectations.
Key Operating and Financial Metrics
We use the following key operating and financial metrics to evaluate and manage our business.
North America Direct Dealers
|
|
|
December 31, |
| ||||
|
|
|
2012 |
|
2013 |
|
2014 |
|
|
Authorized dealers at the beginning of the year |
|
2,304 |
|
2,388 |
|
2,544 |
|
|
Additions |
|
323 |
|
289 |
|
315 |
|
|
Terminations |
|
(239 |
) |
(133 |
) |
(183 |
) |
|
Authorized dealers at the end of the year |
|
2,388 |
|
2,544 |
|
2,676 |
|
|
|
|
|
|
|
|
|
|
|
Number of active dealers |
|
2,350 |
|
2,465 |
|
2,588 |
|
|
% of active dealers |
|
98 |
% |
97 |
% |
97 |
% |
International Direct Dealers
|
|
|
December 31, |
| ||||
|
|
|
2012 |
|
2013 |
|
2014 |
|
|
Authorized dealers at the beginning of the year |
|
474 |
|
629 |
|
635 |
|
|
Additions |
|
198 |
|
157 |
|
176 |
|
|
Terminations |
|
(43 |
) |
(151 |
) |
(24 |
) |
|
Authorized dealers at the end of the year |
|
629 |
|
635 |
|
787 |
|
|
|
|
|
|
|
|
|
|
|
Number of active dealers |
|
501 |
|
578 |
|
685 |
|
|
% of active dealers |
|
80 |
% |
91 |
% |
87 |
% |
|
|
|
For the Years Ended |
| ||||
|
|
|
2012 |
|
2013 |
|
2014 |
|
|
Number of controller appliances sold |
|
69,209 |
|
66,674 |
|
76,707 |
|
|
Core revenue growth |
|
20 |
% |
20 |
% |
14 |
% |
|
International Core revenue as a percentage of total revenue |
|
22 |
% |
22 |
% |
22 |
% |
Number of North America and Direct International Dealers
Because our dealers promote, sell, install and support our products, a broader dealer network allows us to reach more potential consumers across more geographic regions. We expect our dealer network to continue to grow, both in North America and internationally. While we have historically focused on dealers affiliated with the Custom Electronics Design and Installation Association (“CEDIA”), we believe there is an opportunity to establish relationships with dealers outside of CEDIA, including electrical contractors, and security system installers. We define an active, authorized dealer (“active dealer”) as one that has placed an order with us in the trailing 12-month period.
Our active international direct dealer network is generally growing at a faster percentage rate than our active North America dealer network, and we expect this trend to continue as we increase our presence in new and existing international markets.
While our North America dealer network is growing at a slower percentage rate, we continue to add new dealers and invest in tools and technologies to help our dealers be more successful and increase the year-over-year sales of our products. Our goal is to continuously increase our dealers’ productivity and capacity to grow. Enabling our dealers to increase productivity will ultimately drive our revenue growth. Late in the third quarter of 2014, we announced the availability of Composer Express, a powerful mobile configuration tool available on iOS and Android to empower our dealers to simplify and accelerate the onsite set-up process for Control4 system installations. As of December 31, 2014, 15 weeks after release, we have more than 4,600 technicians using Composer Express employed by more than 2,500 independent dealers worldwide.
In addition, in some international markets, we plan to establish direct relationships with selected dealers that we previously served through distributors, which we expect will further increase our number of direct international dealers. The number of active international dealers increased 19% between the years ended December 31, 2013 and 2014, compared to an increase of 5% in the number of active North American direct dealers during the same period.
While we believe that we continue to have significant international opportunities, it is difficult to anticipate the exact timing and amount of growth, particularly in new and emerging markets. During the year ended December 31, 2014, we experienced 18% year-over-year growth in International Core revenue, driven primarily by strong sales in the United Kingdom, one of our more mature geographies. Divergent regional and local economic and political trends, particularly relating to new home construction and strengthening of the U.S. dollar versus certain local currencies are examples of challenges we must address in order to continue our international expansion. Such challenges may cause our growth rate to be slower than anticipated, offsetting our efforts to expand into these emerging geographies. That said, we are starting to see increasing revenue growth in China and India, suggesting that our investments in those markets, including the opening of technical support and training centers in the third quarter of 2013, are contributing to increased margin and profitability.
Number of Controller Appliances Sold
Our controller appliances contain our proprietary software and provide consumers with the essential software technology to enable home control, automation and personalization. The number of controller appliances we sell in a given period provides us with an indication of consumer adoption of our technology. Our sales of controller appliances also create significant opportunity to sell our other products and services. Once a consumer has deployed our controller appliances, we believe that the consumer is more likely to remain committed to our technology platform and purchase more of our products, applications and services in the future.
During the year ended December 31, 2014, we sold 76,707 controllers, compared to 66,674 and 69,209 controllers sold in the same periods in 2013 and 2012, respectively. Controller sales grew 15% during the year ended December 31, 2014 compared to 2013. This compares to our overall growth in revenue of 16% during the same period.
Core Revenue Growth
The majority of our revenue comes from sales of our products through our distribution channels comprised of dealers in the United States and Canada, and dealers and distributors located throughout the rest of the world. We refer to revenue attributable to sales through dealers located in the United States and Canada as North America Core revenue, and revenue attributable to sales through dealers and distributors located throughout the rest of the world as International Core revenue. Core revenue does not include revenue from sales to hotels or certification fees paid to us. Our revenue from sales to hotels is generally project-based and has been significant in some periods and insignificant in other periods. In the future, we expect revenue from hospitality to continue to be attributable to large projects and will continue to be uneven from period to period. We therefore believe that our Core revenue growth is a good measure of our market penetration and the growth of our business.
International Revenue as a Percentage of Total Revenue
We believe that the international market represents a large and underpenetrated opportunity for us. We have established offices in the U.K., China, and India, we have formed relationships with international dealers and distributors, and we have expanded foreign language support for our solutions. In February 2015, we announced a shift in our distribution model in Germany, and we are now working directly with dealers in the region. We track International revenue as a percentage of total revenue as a key measure of our success in expanding our business internationally.
Results of Operations
Revenue
The following is a breakdown of our revenue between North America and International Core revenue and other revenue:
|
|
|
Years Ended December 31, |
| |||||||
|
|
|
2012 |
|
2013 |
|
2014 |
| |||
|
|
|
(in thousands) |
| |||||||
|
North America Core Revenue |
|
$ |
81,130 |
|
$ |
98,070 |
|
$ |
111,246 |
|
|
International Core Revenue |
|
24,471 |
|
28,323 |
|
33,444 |
| |||
|
Other Revenue |
|
3,911 |
|
2,118 |
|
4,110 |
| |||
|
Total Revenue |
|
$ |
109,512 |
|
$ |
128,511 |
|
$ |
148,800 |
|
|
North America Core Revenue as a % of Total Revenue |
|
74 |
% |
76 |
% |
75 |
% | |||
|
International Core Revenue as a % of Total Revenue |
|
22 |
% |
22 |
% |
22 |
% | |||
2013 Compared to 2012. North America Core revenue increased $16.9 million or 21% from 2012 to 2013 primarily as a result of a net increase in the number of active direct dealers selling our products and services and an increase in sales from existing direct dealers. In addition, while the number of controllers sold in 2013 decreased 4% from 2012, the average selling price per controller was up 29% during that same period.
International Core revenue increased $3.9 million or 16% from 2012 to 2013 primarily due to an increase in the number of dealers and distributors selling our products and services and the resulting increase in the number of system sales.
Our international Core revenue growth declined from 46% in 2012 to 16% in 2013. The number of international dealers was relatively flat at the end of 2013 compared to 2012, but the percentage of those dealers who are active increased from 80% in 2012 to 91% in 2013 as a result of our efforts to terminate non-performing dealers.
2014 Compared to 2013. North America Core revenue increased $13.2 million or 13% from 2013 to 2014 primarily as a result of a net increase in the number of active direct dealers selling our products and services as well as an increase in sales from existing direct dealers. The decrease in the growth rate between 2013 and 2014 of our North America Core revenue was due primarily to a decline in the growth rate from sales to existing direct dealers. We are optimistic that the introduction of dealer tools such as Composer Express, that improves dealer efficiency and expands their installation capacity, as well as the introduction of new products in 2015, will have a positive impact on sales to existing dealers.
International Core revenue increased $5.1 million or 18% from 2013 to 2014 primarily due to an increase in the number of dealers and distributors selling our products and services and the resulting increase in the number of system sales. Our International Core revenue growth continues to be fueled by strong dealer-direct performance in the U.K., which is our largest region by revenue outside of North America and contributes the highest dollar amount to the international growth. We also experienced year-over-year revenue growth in China and India indicating that our investment in the dealer-direct model in those regions is starting to contribute to growth and profitability.
Gross Margin
As a percentage of revenue, our gross margin has been and will continue to be affected by a variety of factors. Our gross margin is relatively consistent across our products. Our gross margin on third-party products we sell through our online distribution platform is higher than our gross margin on our other product sales because we only recognize our net profit on these sales as revenue. Our gross margin is higher on software licensing and subscription revenue than it is on product sales. Our gross margin is also higher on our sales made directly through dealers than it is on our sales made through distributors. Gross margin may be negatively affected by price competition in our target markets and associated promotional or volume incentive rebates offered to our customers.
Gross margin for the years ended December 31, 2012, 2013, and 2014 was as follows (in thousands, except percentages):
|
|
|
Years Ended December 31, |
| |||||||
|
|
|
2012 |
|
2013 |
|
2014 |
| |||
|
Gross margin |
|
$ |
50,447 |
|
$ |
64,657 |
|
$ |
76,357 |
|
|
Percentage of revenue |
|
46 |
% |
50 |
% |
51 |
% | |||
2013 Compared to 2012. As a percentage of revenue, our gross margin increased from 46% in 2012 to 50% in 2013. In 2013, we reduced our reserve for the loss on inventory purchase commitments by approximately $0.4 million, as our proceeds from liquidating the underlying inventory and our ability to consume common components exceeded our original estimates. Adjusting for the impact in 2012 and 2013 on inventory purchase commitment reserves, our gross margin as a percent of revenue would have increased from 47.7% in 2012 to 50.0% in 2013. That increase was due to a variety of factors, including higher prices charged for our controller products, higher sales of third party products sold through our online distribution platform and lower component costs as a percent of revenue.
2014 Compared to 2013. As a percentage of revenue, our gross margin increased from 50% in 2013 to 51% in 2014. The increase was due to a variety of factors, including component cost reductions, lower manufacturing overhead expenses as a percentage of revenue, favorable channel sales mix and lower freight costs.
We expect product component cost reductions to continue to have a positive impact on our gross margin as a percentage of revenue as those reductions are the result of negotiated price decreases with our contract manufacturers that are
long term in nature.
The impact of lower manufacturing overhead as a percentage of revenue on our gross margin percentage will vary depending on overhead spending in a given period.
We expect the positive impact on our gross margin percentage resulting from increased sales of third-party products sold through our online distribution platform to continue in future periods; however, the impact will be less significant if the growth rate of that revenue slows in future periods. In January 2015, we acquired Nexus and the Leaf branded products, many of which were sold through our online distribution platform. As a result, we will recognize revenue from future sales of these products on a gross revenue basis as opposed to recognizing revenue on a net basis as we have done for these products previously, consistent with our revenue recognition policy for all third-party products sold through our online distribution platform. This change will result in increased revenue, but lower gross margins with respect to these products.
Research and Development Expenses
Research and development expenses consist primarily of compensation for our engineers and product managers. Research and development expenses also include prototyping and field-testing expenses incurred in the development of our products. We also include fees paid to agencies to obtain regulatory certifications.
Research and development expenses for the years ended December 31, 2012, 2013, and 2014 were as follows (in thousands, except percentages):
|
|
|
Years Ended December 31, |
| |||||||
|
|
|
2012 |
|
2013 |
|
2014 |
| |||
|
Research and development |
|
$ |
20,310 |
|
$ |
24,979 |
|
$ |
27,365 |
|
|
Percentage of revenue |
|
19 |
% |
19 |
% |
18 |
% | |||
2013 Compared to 2012. Research and development expenses increased by $4.7 million, or 23%, in 2013 compared to 2012. These increases were primarily due to an increase in headcount and related expenses, including non-cash stock-based compensation expense, to support on-going and expanded product development activities.
2014 Compared to 2013. Research and development expenses increased by $2.4 million, or 10%, in 2014 compared to 2013. The increase were primarily due to an increase in headcount and related expenses, including non-cash stock based compensation expense, to support ongoing and expanded product development activities.
We expect our research and development expenses to increase in absolute dollars for the foreseeable future as we continue to invest in the development of new solutions; however, we expect those expenses to fluctuate as a percentage of our revenue in future periods based on fluctuations in our revenue and the timing of those expenses.
Sales and Marketing Expenses
Sales and marketing expenses consist primarily of compensation and related travel expenses for our sales and marketing personnel. Sales and marketing expenses also include expenses associated with trade shows, marketing events, advertising and other marketing-related programs.
Sales and marketing expenses for the years ended December 31, 2012, 2013, and 2014 were as follows (in thousands, except percentages):
|
|
|
Years Ended December 31, |
| |||||||
|
|
|
2012 |
|
2013 |
|
2014 |
| |||
|
Sales and marketing |
|
$ |
20,182 |
|
$ |
21,975 |
|
$ |
25,887 |
|
|
Percentage of revenue |
|
18 |
% |
17 |
% |
17 |
% | |||
2013 Compared to 2012. Sales and marketing expenses increased by $1.8 million, or 9%, in 2013 compared to 2012. The period over period increases in absolute dollars for sales and marketing expenses was primarily due to headcount increases and the related expenses as well as increased credit card merchant fees, which grew proportionate to our growth in revenue. In addition, we increased our spending for tradeshow and other marketing related expenses to support new product releases and grow our dealer and distributor networks throughout the world.
2014 Compared to 2013. Sales and marketing expenses increased by $3.9 million, or 18%, in 2014 compared to 2013. The period over period increases in absolute dollars for sales and marketing expenses were primarily due to headcount increases and the related expenses as well as increased marketing expenses to launch new solutions at the CEDIA Expo in September, grow our dealer and distributor networks throughout the world and to deliver tools to the sales channel to support local marketing and sales lead generation.
We expect our sales and marketing expenses to increase in absolute dollars for the foreseeable future as we add sales personnel, particularly in our international channel, and continue to invest in advertising and promotions to increase awareness of our products.
General and Administrative Expenses
General and administrative expenses consist primarily of compensation for our employees in our executive administration, finance, information systems, human resource and legal departments. Also included in general and administrative expenses are outside legal fees, audit fees, facilities expenses and insurance costs.
General and administrative expenses for the years ended December 31, 2012, 2013, and 2014 were as follows (in thousands, except percentages):
|
|
|
Years Ended December 31, |
| |||||||
|
|
|
2012 |
|
2013 |
|
2014 |
| |||
|
General and administrative |
|
$ |
10,150 |
|
$ |
12,329 |
|
$ |
14,195 |
|
|
Percentage of revenue |
|
9 |
% |
10 |
% |
10 |
% | |||
2013 Compared to 2012. General and administrative expenses increased by $2.2 million, or 21%, in 2013 compared to 2012. The increase in absolute dollars in general and administrative expenses was due primarily to increased headcount and related expenses, professional fees and facilities related costs as we prepared to be a public reporting company. In addition, we incurred $0.3 million in expenses resulting from an executive severance agreement.
2014 Compared to 2013. General and administrative expenses increased by $1.9 million, or 15%, in 2014 compared to 2013. The increases in absolute dollars in general and administrative expenses were due primarily to increased professional fees and insurance premiums associated with being a public company and non-cash stock compensation expense.
We expect our general and administrative expenses to increase in absolute dollars primarily as a result of the increased cost associated with being a public company. However, we also expect our general and administrative expenses to fluctuate as a percentage of our revenue in future periods based on fluctuations in our revenue and the timing of those expenses.
Litigation Settlement Expenses
Litigation settlement expenses for the years ended December 31, 2012, 2013, and 2014 were as follows (in thousands, except percentages):
|
|
|
Years Ended December 31, |
| |||||||
|
|
|
2012 |
|
2013 |
|
2014 |
| |||
|
Litigation settlement |
|
$ |
2,869 |
|
$ |
440 |
|
$ |
47 |
|
|
Percentage of revenue |
|
3 |
% |
0 |
% |
0 |
% | |||
2013 Compared to 2012. During 2013, we expensed $440,000 in connection with two separate legal matters.
2014 Compared to 2013. During 2014, we expensed $47,000 in connection with certain legal matters.
Other Income (Expense)
Other income (expense), net consists primarily of foreign currency transaction gains (losses) and non-cash expenses associated with the revaluation of preferred stock warrant liabilities. Other income (expense) for the years ended December 31, 2012, 2013, and 2014 were as follows (in thousands, except percentages):
|
|
|
Years Ended December 31, |
| |||||||
|
|
|
2012 |
|
2013 |
|
2014 |
| |||
|
Other income (expense) |
|
$ |
(254 |
) |
$ |
(729 |
) |
$ |
(358 |
) |
|
Percentage of revenue |
|
0 |
% |
(1 |
)% |
0 |
% | |||
Other expense increased by $0.5 million in 2013 compared to 2012 and decreased by $0.4 million in 2014 compared to 2013. The fluctuations were due primarily to foreign currency transaction gains and losses as well as a change in the fair value of the warrant liability. Upon the effective date of our initial public offering, we adjusted the liability to fair value based upon the offering price of $16.00 per share. As a result, we recognized $0.7 million of other expense in 2013. Upon the closing of our initial public offering, the holders of the Series G-1 warrants net-exercised their warrants in exchange for 76,964 shares of our common stock. The warrant liability of $1.3 million was reclassified from long-term liabilities to additional paid-in capital, a component of stockholders’ equity, and we ceased to record any further periodic fair value adjustments relating to the warrant liability.
Income Tax Expense
Income tax expense for the years ended December 31, 2012, 2013, and 2014 were as follows (in thousands, except percentages):
|
|
|
Years Ended December 31, |
| |||||||
|
|
|
2012 |
|
2013 |
|
2014 |
| |||
|
Income tax expense |
|
$ |
141 |
|
$ |
248 |
|
$ |
411 |
|
|
Percentage of revenue |
|
0 |
% |
0 |
% |
0 |
% | |||
Income tax expense was approximately 4%, 7% and 5% of income before income taxes for the years ended December 31, 2012, 2013 and 2014, respectively. The effective tax rate differs from the U.S. federal statutory rate of 34% primarily due to the domestic valuation allowance offsetting most of the statutory rate, state income taxes, foreign income taxes, U.S. federal alternative minimum tax and incentive stock options.
Significant judgment is required in determining our provision for income taxes and evaluating our uncertain tax positions. In evaluating our ability to recover our deferred tax assets, in full or in part, we consider all available positive and negative evidence, including our past operating results, our forecast of future market growth, forecasted earnings, future taxable income and prudent and feasible tax planning strategies. Due to historical net losses incurred and the uncertainty of realizing the deferred tax assets, for all the periods presented, we have a full valuation allowance against our domestic deferred tax assets. To the extent that we generate positive domestic income and expect, with reasonable certainty, to continue to generate positive income, we may release all or a portion of our valuation allowance in a future period. This release would result in the recognition of certain deferred tax assets and a decrease to income tax expense for the period such release is made.
Quarterly Results of Operations and Other Data
The following table presents our quarterly consolidated results of operations and other data for each of the quarters presented, both in absolute dollars and as a percentage of revenue. This quarterly consolidated information has been prepared on the same basis as our audited consolidated financial statements and, in the opinion of management, the statement of operations data includes all adjustments, consisting of normal recurring adjustments, necessary for the fair presentation of the results of operations for these periods. You should read this table in conjunction with our audited consolidated financial statements and related notes located elsewhere in this Annual Report on Form 10-K. The results of operations for any quarter are not necessarily indicative of the results of operations for a full year or any future periods.
|
|
|
Three Months Ended |
| ||||||||||||||||||||||
|
|
|
March 31, |
|
June 30, |
|
Sept 30, |
|
Dec 31, |
|
March 31, |
|
June 30, |
|
Sept 30, |
|
Dec 31, |
| ||||||||
|
|
|
(In thousands) |
| ||||||||||||||||||||||
|
Revenue |
|
$ |
26,571 |
|
$ |
32,543 |
|
$ |
33,641 |
|
$ |
35,756 |
|
$ |
31,855 |
|
$ |
36,661 |
|
$ |
39,120 |
|
$ |
41,164 |
|
|
Gross margin |
|
13,021 |
|
16,736 |
|
17,049 |
|
17,851 |
|
16,236 |
|
18,967 |
|
20,273 |
|
20,881 |
| ||||||||
|
Gross margin percentage |
|
49.0 |
% |
51.4 |
% |
50.7 |
% |
49.9 |
% |
51.0 |
% |
51.7 |
% |
51.8 |
% |
50.7 |
% | ||||||||
|
Total operating expenses |
|
14,499 |
|
14,779 |
|
15,052 |
|
15,393 |
|
16,764 |
|
16,936 |
|
17,063 |
|
16,731 |
| ||||||||
|
Income (loss) from operations |
|
(1,478 |
) |
1,957 |
|
1,997 |
|
2,458 |
|
(528 |
) |
2,031 |
|
3,210 |
|
4,150 |
| ||||||||
|
Net income (loss) |
|
$ |
(1,471 |
) |
$ |
973 |
|
$ |
1,731 |
|
$ |
2,270 |
|
$ |
(539 |
) |
$ |
2,011 |
|
$ |
2,763 |
|
$ |
3,921 |
|
|
Net income (loss) per common share: |
|
|
|
|
|
|
|
|
|
|
|
|
|
|
|
|
| ||||||||
|
Basic |
|
$ |
(0.59 |
) |
$ |
0.39 |
|
$ |
0.12 |
|
$ |
0.10 |
|
$ |
(0.02 |
) |
$ |
0.08 |
|
$ |
0.12 |
|
$ |
0.16 |
|
|
Diluted |
|
$ |
(0.59 |
) |
$ |
0.05 |
|
$ |
0.07 |
|
$ |
0.09 |
|
$ |
(0.02 |
) |
$ |
0.08 |
|
$ |
0.11 |
|
$ |
0.15 |
|
We have historically experienced seasonal variations in our revenue as a result of holiday-related factors that are common in our industry. Our revenue is generally highest in the fourth quarter due to consumers’ desire to complete their home installations prior to the Thanksgiving and Christmas holidays. We generally see decreased sales in the first quarter due to the number of installations that were completed in the fourth quarter and the resulting decline in dealer activity in the first quarter.
Our gross margin percentage has improved from 49.0% in the first quarter of 2013 to 50.7% in the fourth quarter of 2014, but has been and will continue to be impacted by a variety of general and in some cases specific factors including the following:
· Negotiated decreases in the price of components purchased from our contract manufacturers resulting in lower product costs.
· The mix of customer type and products sold, including increased sales of third-party products sold through our online distribution platform where revenue is recognized on a net basis.
· Price competition resulting in promotional discounts or volume-incentive rebates.
· Achieving leverage in our fixed manufacturing overhead expense as a percent of revenue.
· Fulfilment related expenses including freights costs and import and export duties. During the first and second quarters of 2013, we received credits for duties paid in previous periods positively impacting our gross margin percentages during those periods.
· In the second and fourth quarters of 2013, we reduced our reserve for the anticipated loss on inventory purchase commitments as our ability to consume common components exceeded our original estimates.
In the near term, we generally expect our gross margin to increase modestly as a result of our continued efforts to work with our contract manufacturers and component vendors to reduce the cost of components we purchase, engineer product design and cost improvements, manage our supply chain and realize economies of scale as we grow our business. From time to time, however, we may experience fluctuations in our gross margin as a result of the factors discussed in the preceding paragraph.
Our operating expenses fluctuate from quarter to quarter based on changes in the number of our employees and associated expenses, the timing and magnitude of product development, the timing of marketing and sales expenditures and large or infrequent transactions such as litigation settlement expenses. Our quarterly operating expenses have generally increased in 2014 compared to 2013 to support the growth in our business, including the transition to being a public company.
Sales and marketing expenses are typically higher in the first and third quarters of each year due to the timing of our primary trade shows.
Liquidity and Capital Resources
Primary Sources of Liquidity
On August 7, 2013, we completed our initial public offering of common stock in which we sold and issued 4,600,000 shares of common stock and received net proceeds of approximately $65.6 million after deducting underwriting discounts and commissions and offering expenses. Our future capital requirements will depend on many factors, including our rate of revenue growth, potential acquisitions of businesses, technologies or other assets, the expansion of our sales and marketing activities, continued investment in research and development, expansion into new territories, the timing of new product introductions, and the continued market acceptance of our products.
As of December 31, 2013, we had $84.5 million in cash and cash equivalents, an increase of $65.9 million from December 31, 2012. The increase in cash is primarily the result of the net proceeds received from our initial public offering
of common stock of approximately $65.6 million offset by settlement obligation payments of $3.0 million.
As of December 31, 2014, we had $97.2 million in unrestricted cash and cash equivalents and net marketable securities, an increase of $12.7 million from December 31, 2013. We typically invest in highly-rated securities, and our investment policy generally limits the amount of credit exposure to any one issuer. The policy requires investments generally to be investment grade, with the primary objective of minimizing the potential risk of principal loss. The maturities of our long-term investments range from one to two years, with the average maturity of our investment portfolio less than one year. Cash equivalents and marketable securities are comprised of money market and other funds, highly liquid debt instruments of the U.S. government and its agencies, debt instruments issued by municipalities in the U.S., corporate securities, and asset-backed securities.
The following table shows selected financial information and statistics as of December 31, 2012, 2013 and 2014 (in thousands):
|
|
|
Years Ended December 31, |
| |||||||
|
|
|
2012 |
|
2013 |
|
2014 |
| |||
|
Cash and cash equivalents |
|
$ |
18,695 |
|
$ |
84,546 |
|
$ |
29,187 |
|
|
Investments, net |
|
— |
|
— |
|
68,032 |
| |||
|
Accounts receivable, net |
|
13,078 |
|
15,064 |
|
20,155 |
| |||
|
Inventories |
|
12,515 |
|
15,312 |
|
14,212 |
| |||
|
Working capital |
|
23,290 |
|
94,778 |
|
97,939 |
| |||
We closely monitor our inventory, our days sales outstanding and our payment terms with our major vendors to maximize our cash flows from operating activities. We turn our inventory approximately 5 times per year. Our days sales outstanding has averaged 39 over the past 12 months. We have 45- and 60-day payment terms with our two major contract manufacturers.
We maintain a revolving credit facility of $13.0 million. Borrowing under the revolving credit facility is subject to certain collateral restrictions relating primarily to our accounts receivable and inventory levels. As of December 31, 2014, our total borrowing capacity was approximately $13.0 million, and no borrowings were outstanding. The revolving credit facility has a maturity date of May 29, 2015.
Our credit facility and term loan agreements contain various restrictive and financial covenants and we were in compliance with each of these covenants as of December 31, 2014.
We believe that our existing cash and cash equivalents will be sufficient to fund our operations for at least the next 12 months. From time to time, we may explore additional financing sources to develop or enhance our product solutions, to fund expansion of our business, to respond to competitive pressures, or to acquire or invest in complementary products, businesses or technologies. We cannot assure you that any additional financing will be available to us on acceptable terms, if at all. If we raise additional funds through the issuance of equity or convertible debt or other equity-linked securities, our existing stockholders could suffer significant dilution, and any new equity securities we issue could have rights, preferences and privileges senior to those of holders of our common stock.
Subsequent to year end, we acquired Nexus Holdings Pty Ltd a manufacturer of HD video matrix switches and other audio/video distribution products under the Leaf brand. The purchase price consisted of $9.0 million in cash, subject to final adjustment for certain working capital calculations. In addition, we paid a commission of $0.5 million to an agent.
Cash Flow Analysis
A summary of our cash flows for the years ended December 31, 2012, 2013 and 2014 is set forth below (in thousands):
|
|
|
Years Ended December 31, |
| |||||||
|
|
|
2012 |
|
2013 |
|
2014 |
| |||
|
Cash and cash equivalents at the beginning of the period |
|
$ |
18,468 |
|
$ |
18,695 |
|
$ |
84,546 |
|
|
Net cash provided by operating activities |
|
991 |
|
3,668 |
|
11,248 |
| |||
|
Net cash used in investing activities |
|
(2,360 |
) |
(3,617 |
) |
(71,905 |
) | |||
|
Net cash provided by financing activities |
|
1,624 |
|
65,809 |
|
5,364 |
| |||
|
Effect of exchange rate changes on cash and cash equivalents |
|
(28 |
) |
(9 |
) |
(66 |
) | |||
|
Net change in cash and cash equivalents |
|
227 |
|
65,851 |
|
(55,359 |
) | |||
|
Cash and cash equivalents at the end of the period |
|
$ |
18,695 |
|
$ |
84,546 |
|
$ |
29,187 |
|
Operating Activities
Cash provided by operating activities is net income adjusted for certain non-cash items and changes in certain assets and liabilities.
The increase in cash flows from operating activities of $2.7 million in 2013 compared to 2012 is due primarily to the increase in net income. The adjustments for non-cash items were lower in 2013 due primarily to the loss on inventory purchase commitments recognized in 2012, partially offset by higher non-cash stock-based compensation expense and warrant liability expense in 2013. Cash used to fund working capital and other operating accounts increased by $4.1 million in 2013 compared to 2012 due primarily to increases in our accounts receivable and inventory balances associated with the growth of our business. In addition, other liabilities decreased as a result of payments totaling $3.0 million related to litigation settlement obligations.
The increase in cash flows from operating activities of $7.6 million in 2014, compared to 2013, was due primarily to the increase in net income, offset by growth in accounts receivables of $5.3 million. The increase in accounts receivable is temporary, resulting from a higher percentage of the sales for the three months ended December 31, 2014, occurring in the month of December. During 2014, we paid $0.9 million as a final payment on a litigation settlement obligation entered into in 2013.
Investing Activities
Cash provided by or used in investing activities primarily consist of purchases, maturities, and sales of marketable securities, businesses acquisitions, net of cash acquired, and purchases of property and equipment.
Cash used in investing activities increased from 2013 to 2014, primarily attributable to net purchases of marketable securities totaling $68.1 million.
During 2014, we finalized two business acquisitions and made combined net cash payments of $1.1 million.
Our capital expenditures during 2014 and 2013 were $2.7 million and $3.5 million, respectively.
Financing Activities
Financing cash flows consist primarily of borrowing against and repayment of long term debt and proceeds from the exercise of options to acquire common stock.
During the years ended December 31, 2014 and 2013, we received proceeds of $6.4 million and $0.4 million, respectively, from the exercise of options to purchase common stock.
Net repayments on our term loan agreements were $1.1 million and $0.2 million for the years ended December 31, 2014 and 2013, respectively.
Off-Balance Sheet Arrangements
During the periods presented, we did not engage in any off-balance sheet activities. We do not have any off-balance interest in variable interest entities, which include special purpose entities and other structured finance entities.
Contractual Obligations
We enter into long-term contractual obligations in the normal course of business, primarily debt obligations and non-cancellable operating leases.
Our contractual cash obligations at December 31, 2014 are as follows:
|
|
|
Total |
|
Less than |
|
1 - 3 years |
|
3 - 5 years |
|
More than |
| |||||
|
|
|
(in thousands) |
| |||||||||||||
|
Long-term debt obligations, including interest(1) |
|
$ |
2,210 |
|
$ |
1,120 |
|
$ |
1,090 |
|
$ |
— |
|
$ |
— |
|
|
Operating lease obligations |
|
6,386 |
|
1,971 |
|
3,541 |
|
874 |
|
— |
| |||||
|
Purchase commitments |
|
27,775 |
|
27,775 |
|
— |
|
— |
|
— |
| |||||
|
Total contractual obligations |
|
$ |
36,371 |
|
$ |
30,866 |
|
$ |
4,631 |
|
$ |
874 |
|
$ |
— |
|
(1) Interest was calculated on outstanding borrowings at the date indicated in the table above and assumes the rate remains constant during the following years. The credit facility has a variable rate of interest of prime or LIBOR plus 2.50%, as selected by us. The variable rate was 3.25% at December 31, 2014. Term borrowings are payable in equal monthly payments of principal plus interest and bear interest at prime plus 0.50%, which was 3.75% at December 31, 2014.
Critical Accounting Estimates and Policies
Our consolidated financial statements are prepared in accordance with GAAP. The preparation of these consolidated financial statements requires us to make estimates and assumptions that affect the reported amounts of assets, liabilities, revenue, expenses and related disclosures. We evaluate our estimates and assumptions on an ongoing basis. Our estimates are based on historical experience and various other assumptions that we believe to be reasonable under the circumstances. Our actual results could differ from these estimates.
We believe that the assumptions and estimates associated with our revenue recognition, inventory valuation reserves, product warranty liability, income taxes and stock-based compensation have the greatest potential impact on our consolidated financial statements. Therefore, we consider these to be our critical accounting policies and estimates. For further information on all of our significant accounting policies, please see Note 1 of the accompanying notes to our consolidated financial statements.
We have chosen to “opt out” of the extended transition period provided in Section 7(a)(2)(B) of the Securities Act for complying with new or revised accounting standards and, as a result, we will comply with new or revised accounting standards on the relevant dates on which adoption of such standards is required for non-emerging growth companies. Section 107 of the JOBS Act provides that our decision to opt out of the extended transition period for complying with new or revised accounting standards is irrevocable.
Revenue Recognition
We sell our products through a network of independent dealers and distributors and not directly to consumers. These dealers and distributors generally sell our products to the consumer as part of a bundled sale, which typically includes other third-party products and related services, project design and installation services and ongoing support.
We record estimated reductions to revenue for dealer, retailer and distributor incentives, primarily comprised of volume rebates, at the time of the initial sale. The estimated reductions to revenue for rebates are based on the sales terms and our historical experience and trend analysis. The most common incentive relates to amounts paid or credited to dealers and distributors for achieving defined volume levels or growth objectives.
Our controllers include embedded software that is essential to the functionality of the controller. Accordingly, the hardware and embedded software components are sold together as one product. In 2013, we began bundling Control4 App software licenses with our new controllers. These software licenses do not include acceptance provisions, rights to updates (e.g., when-and- if-available enhancements or upgrades to the functionality of the software) or post-contract customer support such as technical support. When a software license and controller are sold together, a multiple element arrangement exists and revenue is allocated to each deliverable based on relative selling prices. Typically, delivery of both the product and the software license occurs at the same time. We recognize revenue when persuasive evidence of an arrangement exists, delivery has occurred, the sales price is fixed or determinable, and collection is probable. Product or licensed software is considered delivered once it has been shipped and title and risk of loss have been transferred. For most of our product sales, these criteria are met at the time the product is shipped.
Software license revenue represents fees earned from activating applications that allow consumers to manage and control their automation systems using tablets, smartphones and other third-party devices. Software products such as Composer Home and Media Editions are sold on a limited basis and do not constitute a significant portion of our revenue.
Our perpetual software licenses do not include acceptance provisions, rights to updates or upgrades or post- contract customer support such as technical support. We generally recognize revenue at the time the software license is provided.
We offer a subscription service that allows consumers to control and monitor their homes remotely and allows our dealers to perform remote diagnostic services. Subscription revenue is deferred at the time of payment and recognized on a straight-line basis over the period the service is provided.
We recognize revenue net of cost of revenue for third-party products sold through our online ordering system. While we assume credit risk on sales to our dealers and distributors, we do not determine the product selling price, do not retain associated inventory risks and are not the primary obligor to the dealer or distributor.
Our agreements with dealers and distributors generally do not include rights of return or acceptance provisions. Even though contractual agreements do not provide return privileges, there are circumstances in which we will accept returns. In addition, agreements with certain retail distributors contain price protection and limited rights of return. We maintain a reserve for such returns based on our historical return experience.
Shipping charges billed to dealers and distributors are included in product revenue and related shipping costs are included in cost of revenue.
Inventory Valuation
Inventories consist of hardware and related component parts and are stated at the lower of cost or market using the first-in, first-out method. We periodically assess the recoverability of our inventory and reduce the carrying value of the inventory when items are determined to be obsolete, defective or in excess of forecasted sales requirements. Carrying value adjustments are based on expected demand and market conditions. For example, we may incur inventory write-offs during the introduction of new products that replace existing ones. We make estimates regarding transition inventory and if our estimates of demand for the “end-of—life” products differ substantially, we may be required to record additional inventory carrying value adjustments.
Inventory write-downs for excess, defective and obsolete inventory are recorded as cost of revenue and totaled $1.5 million, $2.3 million and $1.7 million in 2012, 2013 and 2014, respectively.
Product Warranty
We provide our customers a limited product warranty of two years, which requires us, at our option, to repair or replace defective products during the warranty period at no cost to the customer or refund the purchase price. We estimate the costs that may be incurred to replace, repair or issue a refund for defective products and record a reserve at the time revenue is recognized. Factors that affect our warranty liability include the number of installed systems, our historical experience and management’s judgment regarding anticipated rates of product warranty returns, net of refurbished products. We assess the adequacy of our recorded warranty liability each period and make adjustments to the liability as necessary. Our warranty liability was $1.2 million at both December 31, 2013 and 2014.
Income Taxes
We recognize deferred tax assets and liabilities for the future tax consequences attributable to the differences between the financial statement carrying value of existing assets and liabilities and their respective tax bases. Deferred tax assets and liabilities are measured using enacted tax rates in effect for the fiscal year in which those temporary differences are expected to be recovered or settled. Valuation allowances are established when necessary to reduce deferred tax assets to the amount expected to be realized. In evaluating our ability to recover our deferred tax assets, in full or in part, we consider all available positive and negative evidence, including our past operating results, our forecast of future market growth, forecasted earnings, future taxable income, and prudent and feasible tax planning strategies. The assumptions utilized in determining future taxable income require significant judgment and are consistent with the plans and estimates we are using to manage the underlying businesses. Due to the net losses incurred and the uncertainty of realizing the deferred tax assets, for all the periods presented, we have a full valuation allowance against the deferred tax assets of our domestic operations.
We operate in various tax jurisdictions and are subject to audit by various tax authorities. We provide for tax contingencies whenever it is deemed probable that a tax asset has been impaired or a tax liability has been incurred for events such as tax claims or changes in tax laws. Tax contingencies are based upon their technical merits, relative tax law and the
specific facts and circumstances as of each reporting period. Changes in facts and circumstances could result in material changes to the amounts recorded for such tax contingencies.
We recognize uncertain income tax positions taken on income tax returns at the largest amount that is more-likely-than-not to be sustained upon audit by the relevant taxing authority. An uncertain income tax position will not be recognized if it has less than a 50% likelihood of being sustained.
Our policy for recording interest and penalties associated with uncertain tax positions is to record such items as a component of our income tax provision. During the years ended December 31, 2012, 2013 and 2014, we did not record any material interest income, interest expense or penalties related to uncertain tax positions or the settlement of audits for prior periods.
Business Combinations and Impairment of Long-lived and Intangible Assets, Including Goodwill
When we acquire businesses, we allocate the fair value of the consideration transferred to tangible assets and liabilities and identifiable intangible assets acquired. Any residual consideration is recorded as goodwill. The allocation of the consideration transferred requires management to make significant estimates in determining the fair values of assets acquired and liabilities assumed, especially with respect to intangible assets. These estimates are based on the application of valuation models using historical experience and information obtained from the management of the acquired company and our understanding of the future projections. These estimates can include, but are not limited to, the cash flows that an asset is expected to generate in the future, the appropriate weighted-average cost of capital, and the cost savings expected to be derived from acquiring an asset. These estimates are inherently uncertain, unpredictable, and subject to refinement. In addition, unanticipated events and circumstances may occur which may affect the accuracy or validity of such estimates.
Periodically we assess potential impairment of our long-lived assets, which include property, equipment, and acquired intangible assets. We perform an impairment review whenever events or changes in circumstances indicate that the carrying value may not be recoverable. Factors we consider important which could trigger an impairment review include, but are not limited to, significant under-performance relative to historical or projected future operating results, significant changes in the manner of our use of the acquired assets or our overall business strategy, and significant industry or economic trends. When we determine that the carrying value of a long-lived asset may not be recoverable based upon the existence of one or more of the above indicators, we determine the recoverability by comparing the carrying amount of the asset to net future undiscounted cash flows that the asset is expected to generate. We recognize an impairment charge equal to the amount by which the carrying amount exceeds the fair market value of the asset. We amortize intangible assets on a straight-line basis over their estimated useful lives, or if appropriate, using a method that better represents the pattern of usage.
We test goodwill for impairment on an annual basis and in the interim by reporting unit if events and circumstances indicate that goodwill may be impaired. We initially assess qualitative factors to determine whether the existence of events or circumstances leads to a determination that it is more-likely-than-not that the fair value of a reporting unit is less than its carrying amount. If, after assessing the totality of events or circumstances, we determine it is more-likely-than-not that the fair value of a reporting unit is less than its carrying amount, then we perform a first step by comparing the book value of net assets to the fair value of our single reporting unit. If the fair value is determined to be less than the book value, a second step is performed to compute the amount of impairment as the difference between the estimated fair value of goodwill and the carrying value. No impairment of long-lived and intangible assets or goodwill was recorded during the years ended December 31, 2012, 2013, and 2014, respectively.
Stock-Based Compensation
Stock-based compensation is measured at the grant date based on the fair value of the award and is recognized as expense, net of estimated forfeitures, over the requisite service period, which is the vesting period of the respective award.
Determining the fair value of stock-based awards at the grant date requires judgment. We use the Black-Scholes option-pricing model to determine the fair value of stock options. The determination of the grant date fair value of options using an option-pricing model is affected by our estimated common stock fair value as well as assumptions regarding a number of other complex and subjective variables. These variables include the fair value of our common stock, our expected stock price volatility over the expected term of the options, stock option exercise and cancellation behaviors, risk-free interest rates and expected dividends, which are estimated as follows:
· Fair Value of Our Common Stock. Prior to August 2, 2013, the date our common stock began trading on the NASDAQ Global Select Market, the fair value of common stock was determined by our board of directors,
which intended all options granted to be exercisable at a price per share not less than the per share fair value of our common stock underlying those options on the date of grant. The valuations of our common stock were determined in accordance with the guidelines outlined in the American Institute of Certified Public Accountants Practice Aid, Valuation of Privately-Held-Company Equity Securities Issued as Compensation. The assumptions we use in the valuation model were based on future expectations combined with management judgment. In the absence of a public trading market, our board of directors, with input from management, exercised significant judgment and considered numerous objective and subjective factors to determine the fair value of our common stock as of the date of each option grant. Since our IPO, we determine the fair value of our common stock based on the closing price as quoted on the NASDAQ Global Select Market of our common stock.
· Expected Volatility. As we do not have an adequate trading history for our common stock, the expected stock price volatility for our common stock was estimated by taking the average of the historical volatilities of an index fund and industry peers based on daily price observations over a period equivalent to the expected term of the stock option grants. We did not rely on implied volatilities of traded options in our industry peers’ common stock because the volume of activity was relatively low. We intend to continue to consistently apply this process using the same or similar public companies until a sufficient amount of historical information regarding the volatility of our own common stock share price becomes available.
· Risk-Free Interest Rate. The risk-free interest rate is based on the U.S. Treasury yield in effect at the time of the grant for zero-coupon U.S. Treasury notes with remaining terms similar to the expected term of the options.
· Expected Dividend Yield. We have never declared or paid any cash dividends and do not presently plan to pay cash dividends in the foreseeable future. Consequently, we used an expected dividend yield of zero.
· Expected Term. As we do not have an adequate trading history for our common stock, the expected term represents the period that the stock-based awards are expected to be outstanding. For our option grants, we used the simplified method to determine the expected term as provided by the SEC. The simplified method calculates the expected term as the average of the time-to-vesting and the contractual life of the options. We used the simplified method to determine our expected term because of our limited history of stock option exercise activity.
In addition to the assumptions used in the Black-Scholes option-pricing model, we must also estimate a forfeiture rate to calculate the stock-based compensation for our awards. Our forfeiture rate is based on an analysis of our actual forfeitures. We will continue to evaluate the appropriateness of the forfeiture rate based on actual forfeiture experience, analysis of employee turnover and other factors. Quarterly changes in the estimated forfeiture rate can have a significant impact on our stock-based compensation expense as the cumulative effect of adjusting the rate is recognized in the period the forfeiture estimate is changed. If a revised forfeiture rate is higher than the previously estimated forfeiture rate, an adjustment is made that will result in a decrease to the stock-based compensation expense recognized in the financial statements. If a revised forfeiture rate is lower than the previously estimated forfeiture rate, an adjustment is made that will result in an increase to the stock-based compensation expense recognized in the financial statements.
We will continue to use judgment in evaluating the expected volatility, expected terms and forfeiture rates utilized for our stock-based compensation calculations on a prospective basis. As we continue to accumulate additional data related to our common stock, we may have refinements to the estimates of our expected volatility, expected terms and forfeiture rates, which could materially impact our future stock-based compensation expense. If any of the assumptions used in the Black-Scholes model changes significantly, stock-based compensation for future awards may differ materially compared with the awards granted previously.
The following table presents the weighted-average assumptions used to estimate the fair value of options granted during the periods presented:
|
|
|
Years Ended December 31, |
| ||||
|
|
|
2012 |
|
2013 |
|
2014 |
|
|
Expected volatility |
|
59 - 63% |
|
56 - 59% |
|
49 - 60% |
|
|
Expected dividends |
|
0% |
|
0% |
|
0% |
|
|
Expected terms (in years) |
|
5.0 - 6.1 |
|
3.3 - 7.22 |
|
1.0 - 6.1 |
|
|
Risk-free rate |
|
0.7 - 1.0% |
|
0.8 - 1.7% |
|
0.3 - 2.0% |
|
Transactions with Our Significant Stockholders
In January 2011, we entered into an OEM-in hardware (with software) purchase and license agreement with Cisco Systems, Inc. (“Cisco”), which was amended and restated in February 2011 and further amended in June 2012. Our agreement with Cisco expired in February 2014.
Purchase and payment terms with Cisco are consistent with other non-affiliated companies. In connection with our commercial agreements with Cisco, we recognized revenue of approximately $2.6 million, $0.6 million and $0 for the years ended December 31, 2012, 2013 and 2014, respectively.
Recently Issued and Adopted Accounting Pronouncements
For information with respect to recent accounting pronouncements and the impact of these pronouncements on our consolidated financial statements, see Note 1 “Description of Business and Summary of Significant Accounting Policies—Recent Accounting Pronouncements” in the notes to consolidated financial statements. Based on our continuing review of the recent accounting pronouncements, nothing has been identified to cause us to believe that our future trends, financial condition, or results of operations will be impacted.
ITEM 7A. Qualitative and Quantitative Disclosures about Market Risk
We are exposed to market risk in the ordinary course of our business. Market risk represents the risk of loss that may impact our financial position due to adverse changes in financial market prices and rates. Our market risk exposure is primarily a result of fluctuations in interest rates and foreign currency exchange rates. We do not hold or issue financial instruments for trading purposes.
Interest Rate Risk
Changes in U.S. interest rates could affect the interest earned on our cash, cash equivalents and investments as well as the fair value of our investments. Our investment policy and strategy are focused on preservation of capital and supporting our liquidity requirements. A portion of our cash is managed by external managers within the guidelines of our investment policy.
Our exposure to changes in interest rates relates primarily to our investment portfolio. We typically invest in highly-rated securities, and our investment policy generally limits the amount of credit exposure to any one issuer. The policy requires investments generally to be investment grade, with the primary objective of minimizing the potential risk of principal loss.
We performed a sensitivity analysis on the value of our investment portfolio assuming a hypothetical change in rates of 100 basis points. Based on investment positions as of December 31, 2014, a hypothetical 100 basis point increase in interest rates across all maturities would result in a $0.3 million incremental decline in the fair market value of the portfolio. Such losses would only be realized if we sold the investments prior to maturity.
Foreign Currency Exchange Risk
Our results of operations and cash flows are subject to fluctuations due to changes in foreign currency exchange rates, particularly changes in the Canadian dollar, the Euro and the British pound. The volatility of exchange rates depends on many factors that we cannot forecast with reliable accuracy. We believe that our operating activities act as a natural hedge for a substantial portion of our foreign currency exposure because we typically collect revenue and incur costs in the currency in the location in which we provide our solutions. Although we have experienced and will continue to experience fluctuations in our net income (loss) as a result of transaction gains (losses) related to transactions denominated in currencies other than the U.S. dollar, we believe that a 10% change in foreign exchange rates would not have a material impact on our financial condition or results of operations. To date, we have not entered into any foreign currency hedging contracts, but we may consider entering into such contracts in the future. As our international operations grow, we will continue to reassess our approach to managing our risk relating to fluctuations in foreign currency exchange rates.
ITEM 8. Financial Statements and Supplementary Data
INDEX TO CONSOLIDATED FINANCIAL STATEMENTS
|
56 | |
|
57 | |
|
58 | |
|
59 | |
|
Consolidated Statements of Redeemable Convertible Preferred Stock and Stockholders’ Equity (Deficit) |
60 |
|
61 | |
|
62 |
REPORT OF INDEPENDENT REGISTERED PUBLIC ACCOUNTING FIRM
The Board of Directors and Stockholders of
Control4 Corporation
We have audited the accompanying consolidated balance sheets of Control4 Corporation as of December 31, 2014 and 2013, and the related consolidated statements of operations, comprehensive income (loss), redeemable convertible preferred stock and stockholders’ equity (deficit), and cash flows for each of the three years in the period ended December 31, 2014. These financial statements are the responsibility of the Company’s management. Our responsibility is to express an opinion on these financial statements based on our audits.
We conducted our audits in accordance with the standards of the Public Company Accounting Oversight Board (United States). Those standards require that we plan and perform the audit to obtain reasonable assurance about whether the financial statements are free of material misstatement. We were not engaged to perform an audit of the Company’s internal control over financial reporting. Our audits included consideration of internal control over financial reporting as a basis for designing audit procedures that are appropriate in the circumstances, but not for the purpose of expressing an opinion on the effectiveness of the Company’s internal control over financial reporting. Accordingly, we express no such opinion. An audit also includes examining, on a test basis, evidence supporting the amounts and disclosures in the financial statements, assessing the accounting principles used and significant estimates made by management, and evaluating the overall financial statement presentation. We believe that our audits provide a reasonable basis for our opinion.
In our opinion, the financial statements referred to above present fairly, in all material respects, the consolidated financial position of Control4 Corporation as of December 31, 2014 and 2013, and the consolidated results of its operations and its cash flows for each of the three years in the period ended December 31, 2014, in conformity with U.S. generally accepted accounting principles.
|
/s/ Ernst & Young LLP |
|
|
|
|
|
Salt Lake City, Utah |
|
|
February 20, 2015 |
|
CONTROL4 CORPORATION
(in thousands, except share data)
|
|
|
December 31, |
|
December 31, |
| ||
|
Assets |
|
|
|
|
| ||
|
Current assets: |
|
|
|
|
| ||
|
Cash and cash equivalents |
|
$ |
84,546 |
|
$ |
29,187 |
|
|
Restricted cash |
|
— |
|
311 |
| ||
|
Short-term investments |
|
— |
|
53,523 |
| ||
|
Accounts receivable, net |
|
15,064 |
|
20,155 |
| ||
|
Inventories |
|
15,312 |
|
14,212 |
| ||
|
Prepaid expenses and other current assets |
|
1,773 |
|
2,075 |
| ||
|
Total current assets |
|
116,695 |
|
119,463 |
| ||
|
Property and equipment, net |
|
3,943 |
|
5,089 |
| ||
|
Long-term investments |
|
— |
|
14,509 |
| ||
|
Intangible assets, net |
|
928 |
|
1,409 |
| ||
|
Goodwill |
|
— |
|
231 |
| ||
|
Other assets |
|
1,120 |
|
1,329 |
| ||
|
Total assets |
|
$ |
122,686 |
|
$ |
142,030 |
|
|
Liabilities and stockholders’ equity |
|
|
|
|
| ||
|
Current liabilities: |
|
|
|
|
| ||
|
Accounts payable |
|
$ |
13,314 |
|
$ |
15,016 |
|
|
Accrued liabilities |
|
6,821 |
|
4,750 |
| ||
|
Deferred revenue |
|
644 |
|
843 |
| ||
|
Current portion of notes payable |
|
1,138 |
|
915 |
| ||
|
Total current liabilities |
|
21,917 |
|
21,524 |
| ||
|
Notes payable |
|
1,828 |
|
913 |
| ||
|
Other long-term liabilities |
|
467 |
|
1,291 |
| ||
|
Total liabilities |
|
24,212 |
|
23,728 |
| ||
|
Commitments and contingencies |
|
|
|
|
| ||
|
Stockholders’ equity: |
|
|
|
|
| ||
|
Common stock, $0.0001 par value; 500,000,000 shares authorized; 22,785,104 and 24,305,381 shares issued and outstanding at December 31, 2013 and December 31, 2014, respectively |
|
2 |
|
2 |
| ||
|
Additional paid-in capital |
|
200,545 |
|
212,388 |
| ||
|
Accumulated deficit |
|
(102,084 |
) |
(93,928 |
) | ||
|
Accumulated other comprehensive income (loss) |
|
11 |
|
(160 |
) | ||
|
Total stockholders’ equity |
|
98,474 |
|
118,302 |
| ||
|
Total liabilities and stockholders’ equity |
|
$ |
122,686 |
|
$ |
142,030 |
|
See accompanying notes to consolidated financial statements.
CONTROL4 CORPORATION
CONSOLIDATED STATEMENTS OF OPERATIONS
(in thousands, except per share data)
|
|
|
Years Ended December 31, |
| |||||||
|
|
|
2012 |
|
2013 |
|
2014 |
| |||
|
Revenue |
|
$ |
109,512 |
|
$ |
128,511 |
|
$ |
148,800 |
|
|
Cost of revenue |
|
57,225 |
|
64,234 |
|
72,443 |
| |||
|
Cost of revenue—inventory purchase commitment |
|
1,840 |
|
(380 |
) |
— |
| |||
|
Gross margin |
|
50,447 |
|
64,657 |
|
76,357 |
| |||
|
Operating expenses: |
|
|
|
|
|
|
| |||
|
Research and development |
|
20,310 |
|
24,979 |
|
27,365 |
| |||
|
Sales and marketing |
|
20,182 |
|
21,975 |
|
25,887 |
| |||
|
General and administrative |
|
10,150 |
|
12,329 |
|
14,195 |
| |||
|
Litigation settlement |
|
2,869 |
|
440 |
|
47 |
| |||
|
Total operating expenses |
|
53,511 |
|
59,723 |
|
67,494 |
| |||
|
Income (loss) from operations |
|
(3,064 |
) |
4,934 |
|
8,863 |
| |||
|
Other income (expense): |
|
|
|
|
|
|
| |||
|
Interest income |
|
13 |
|
16 |
|
239 |
| |||
|
Interest expense |
|
(277 |
) |
(470 |
) |
(177 |
) | |||
|
Other income (expense) |
|
(254 |
) |
(729 |
) |
(358 |
) | |||
|
Total other income (expense) |
|
(518 |
) |
(1,183 |
) |
(296 |
) | |||
|
Income (loss) before income taxes |
|
(3,582 |
) |
3,751 |
|
8,567 |
| |||
|
Income tax expense |
|
141 |
|
248 |
|
411 |
| |||
|
Net income (loss) |
|
$ |
(3,723 |
) |
$ |
3,503 |
|
$ |
8,156 |
|
|
Net income (loss) per common share: |
|
|
|
|
|
|
| |||
|
Basic |
|
$ |
(1.58 |
) |
$ |
0.33 |
|
$ |
0.34 |
|
|
Diluted |
|
$ |
(1.58 |
) |
$ |
0.16 |
|
$ |
0.32 |
|
|
Weighted-average number of shares: |
|
|
|
|
|
|
| |||
|
Basic |
|
2,360 |
|
10,609 |
|
23,685 |
| |||
|
Diluted |
|
2,360 |
|
22,263 |
|
25,646 |
| |||
See accompanying notes to consolidated financial statements.
CONTROL4 CORPORATION
CONSOLIDATED STATEMENTS OF COMPREHENSIVE INCOME (LOSS)
(in thousands)
|
|
|
Years Ended December 31, |
| |||||||
|
|
|
2012 |
|
2013 |
|
2014 |
| |||
|
Net income (loss) |
|
$ |
(3,723 |
) |
$ |
3,503 |
|
$ |
8,156 |
|
|
Other comprehensive income (loss): |
|
|
|
|
|
|
| |||
|
Foreign currency translation adjustment |
|
(28 |
) |
15 |
|
(124 |
) | |||
|
Net unrealized losses on available-for-sale investments |
|
— |
|
— |
|
(47 |
) | |||
|
Total other comprehensive income (loss) |
|
(28 |
) |
15 |
|
(171 |
) | |||
|
Comprehensive income (loss) |
|
$ |
(3,751 |
) |
$ |
3,518 |
|
$ |
7,985 |
|
See accompanying notes to consolidated financial statements.
CONTROL4 CORPORATION
CONSOLIDATED STATEMENTS OF REDEEMABLE CONVERTIBLE PREFERRED STOCK AND
STOCKHOLDERS’ EQUITY (DEFICIT)
(in thousands, except share data)
|
|
|
|
|
|
|
Stockholders’ Equity (Deficit) |
| ||||||||||||||||
|
|
|
Redeemable |
|
|
|
|
|
|
|
|
|
Accumulated |
|
Total |
| ||||||||
|
|
|
Convertible |
|
Common Stock |
|
Additional |
|
|
|
Other |
|
Stockholders’ |
| ||||||||||
|
|
|
Preferred Stock |
|
Number of |
|
|
|
Paid-In |
|
Accumulated |
|
Comprehensive |
|
Equity |
| ||||||||
|
|
|
Shares |
|
Amount |
|
Shares |
|
Amount |
|
Capital |
|
Deficit |
|
(Loss) Income |
|
(Deficit) |
| ||||||
|
Balance at December 31, 2011 |
|
15,293,960 |
|
$ |
116,313 |
|
2,245,521 |
|
$ |
— |
|
$ |
9,334 |
|
$ |
(101,864 |
) |
$ |
24 |
|
$ |
(92,506 |
) |
|
Net loss |
|
— |
|
— |
|
— |
|
— |
|
— |
|
(3,723 |
) |
— |
|
(3,723 |
) | ||||||
|
Other comprehensive loss |
|
— |
|
— |
|
— |
|
— |
|
— |
|
— |
|
(28 |
) |
(28 |
) | ||||||
|
Stock-based compensation |
|
— |
|
— |
|
— |
|
— |
|
2,869 |
|
— |
|
— |
|
2,869 |
| ||||||
|
Issuance of common stock upon exercise of stock options |
|
— |
|
— |
|
245,349 |
|
— |
|
785 |
|
— |
|
— |
|
785 |
| ||||||
|
Balance at December 31, 2012 |
|
15,293,960 |
|
116,313 |
|
2,490,870 |
|
— |
|
12,988 |
|
(105,587 |
) |
(4 |
) |
(92,603 |
) | ||||||
|
Net income |
|
— |
|
— |
|
— |
|
— |
|
— |
|
3,503 |
|
— |
|
3,503 |
| ||||||
|
Other comprehensive income |
|
— |
|
— |
|
— |
|
— |
|
— |
|
— |
|
15 |
|
15 |
| ||||||
|
Stock-based compensation |
|
— |
|
— |
|
— |
|
— |
|
3,760 |
|
— |
|
— |
|
3,760 |
| ||||||
|
Issuance of common stock options in connection with a business acquisition |
|
— |
|
— |
|
— |
|
— |
|
174 |
|
— |
|
— |
|
174 |
| ||||||
|
Conversion of redeemable convertible preferred stock into common stock |
|
(15,293,960 |
) |
(116,313 |
) |
15,293,960 |
|
2 |
|
116,311 |
|
— |
|
— |
|
116,313 |
| ||||||
|
Issuance of common stock, net of issuance costs |
|
— |
|
— |
|
4,600,000 |
|
— |
|
65,556 |
|
— |
|
— |
|
65,556 |
| ||||||
|
Issuance of common stock upon net exercise of common stock warrants |
|
— |
|
— |
|
293,232 |
|
— |
|
— |
|
— |
|
— |
|
— |
| ||||||
|
Reclassification of redeemable convertible preferred stock warrant liability upon conversion to preferred stock |
|
— |
|
— |
|
— |
|
— |
|
1,310 |
|
— |
|
— |
|
1,310 |
| ||||||
|
Issuance of common stock upon exercise of stock options |
|
— |
|
— |
|
107,042 |
|
— |
|
446 |
|
— |
|
— |
|
446 |
| ||||||
|
Balance at December 31, 2013 |
|
— |
|
— |
|
22,785,104 |
|
2 |
|
200,545 |
|
(102,084 |
) |
11 |
|
98,474 |
| ||||||
|
Net income |
|
— |
|
— |
|
— |
|
— |
|
— |
|
8,156 |
|
— |
|
8,156 |
| ||||||
|
Other comprehensive loss |
|
— |
|
— |
|
— |
|
— |
|
— |
|
— |
|
(171 |
) |
(171 |
) | ||||||
|
Excess tax benefit from exercise of options for common stock |
|
— |
|
— |
|
— |
|
— |
|
91 |
|
— |
|
— |
|
91 |
| ||||||
|
Stock-based compensation |
|
— |
|
— |
|
— |
|
— |
|
5,341 |
|
— |
|
— |
|
5,341 |
| ||||||
|
Issuance of common stock upon net exercise of common stock warrants |
|
— |
|
— |
|
7,763 |
|
— |
|
— |
|
— |
|
— |
|
— |
| ||||||
|
Issuance of common stock upon exercise of stock options |
|
— |
|
— |
|
1,512,514 |
|
— |
|
6,411 |
|
— |
|
— |
|
6,411 |
| ||||||
|
Balance at December 31, 2014 |
|
— |
|
$ |
— |
|
24,305,381 |
|
$ |
2 |
|
$ |
212,388 |
|
$ |
(93,928 |
) |
$ |
(160 |
) |
$ |
118,302 |
|
See accompanying notes to consolidated financial statements.
CONTROL4 CORPORATION
CONSOLIDATED STATEMENTS OF CASH FLOWS
(in thousands)
|
|
|
Years Ended December 31, |
| |||||||
|
|
|
2012 |
|
2013 |
|
2014 |
| |||
|
Operating activities |
|
|
|
|
|
|
| |||
|
Net income (loss) |
|
$ |
(3,723 |
) |
$ |
3,503 |
|
$ |
8,156 |
|
|
Adjustments to reconcile net income (loss) to net cash provided by operating activities: |
|
|
|
|
|
|
| |||
|
Depreciation expense |
|
1,714 |
|
2,201 |
|
2,547 |
| |||
|
Amortization of intangible assets |
|
271 |
|
319 |
|
491 |
| |||
|
Provision for doubtful accounts |
|
184 |
|
159 |
|
229 |
| |||
|
Loss (gain) on inventory purchase commitment |
|
1,840 |
|
(380 |
) |
— |
| |||
|
Loss on disposal of property and equipment |
|
107 |
|
— |
|
— |
| |||
|
Stock-based compensation |
|
2,869 |
|
3,760 |
|
5,341 |
| |||
|
Excess tax benefit from exercise of options for common stock |
|
— |
|
— |
|
(91 |
) | |||
|
Warrant liability expense |
|
254 |
|
709 |
|
— |
| |||
|
Changes in assets and liabilities: |
|
|
|
|
|
|
| |||
|
Accounts receivable |
|
(2,600 |
) |
(2,104 |
) |
(5,331 |
) | |||
|
Inventories |
|
(4,858 |
) |
(2,723 |
) |
1,025 |
| |||
|
Restricted cash |
|
— |
|
— |
|
(330 |
) | |||
|
Prepaid expenses and other current assets |
|
(352 |
) |
111 |
|
(323 |
) | |||
|
Other assets |
|
(823 |
) |
(233 |
) |
(209 |
) | |||
|
Accounts payable |
|
4,622 |
|
(1,221 |
) |
1,698 |
| |||
|
Accrued liabilities |
|
2,117 |
|
620 |
|
(2,110 |
) | |||
|
Deferred revenue |
|
(10 |
) |
102 |
|
199 |
| |||
|
Other long-term liabilities |
|
(621 |
) |
(1,155 |
) |
(44 |
) | |||
|
Net cash provided by operating activities |
|
991 |
|
3,668 |
|
11,248 |
| |||
|
Investing activities |
|
|
|
|
|
|
| |||
|
Purchases of available-for-sale investments |
|
— |
|
— |
|
(89,844 |
) | |||
|
Proceeds from sales of available-for-sale investments |
|
— |
|
— |
|
2,850 |
| |||
|
Proceeds from maturities of available-for-sale investments |
|
— |
|
— |
|
18,915 |
| |||
|
Purchases of property and equipment |
|
(2,360 |
) |
(3,470 |
) |
(2,710 |
) | |||
|
Business acquisitions, net of cash acquired |
|
— |
|
(147 |
) |
(1,116 |
) | |||
|
Net cash used in investing activities |
|
(2,360 |
) |
(3,617 |
) |
(71,905 |
) | |||
|
Financing activities |
|
|
|
|
|
|
| |||
|
Proceeds from issuance of common stock, net of issuance costs |
|
— |
|
65,556 |
|
— |
| |||
|
Proceeds from exercise of options for common stock |
|
785 |
|
446 |
|
6,411 |
| |||
|
Excess tax benefit from exercise of options for common stock |
|
— |
|
— |
|
91 |
| |||
|
Proceeds from notes payable |
|
1,876 |
|
1,145 |
|
— |
| |||
|
Repayment of notes payable |
|
(1,037 |
) |
(1,338 |
) |
(1,138 |
) | |||
|
Net cash provided by financing activities |
|
1,624 |
|
65,809 |
|
5,364 |
| |||
|
Effect of exchange rate changes on cash and cash equivalents |
|
(28 |
) |
(9 |
) |
(66 |
) | |||
|
Net increase (decrease) in cash and cash equivalents |
|
227 |
|
65,851 |
|
(55,359 |
) | |||
|
Cash and cash equivalents at beginning of period |
|
18,468 |
|
18,695 |
|
84,546 |
| |||
|
Cash and cash equivalents at end of period |
|
$ |
18,695 |
|
$ |
84,546 |
|
$ |
29,187 |
|
|
Supplemental disclosure of cash flow information |
|
|
|
|
|
|
| |||
|
Cash paid for interest |
|
$ |
278 |
|
$ |
461 |
|
$ |
188 |
|
|
Cash paid for taxes |
|
26 |
|
153 |
|
246 |
| |||
|
Supplemental schedule of non-cash investing and financing activities |
|
|
|
|
|
|
| |||
|
Options for common stock granted in connection with a business acquisition |
|
— |
|
174 |
|
— |
| |||
|
Elimination of liability upon net exercise of warrants to purchase preferred stock |
|
— |
|
1,310 |
|
— |
| |||
|
Conversion of redeemable convertible preferred stock to common stock |
|
— |
|
116,313 |
|
— |
| |||
|
Landlord paid tenant improvements |
|
— |
|
— |
|
739 |
| |||
|
Purchases of property and equipment financed by accounts payable |
|
— |
|
— |
|
257 |
| |||
|
Net unrealized losses on available-for-sale investments |
|
— |
|
— |
|
(47 |
) | |||
See accompanying notes to consolidated financial statements.
Control4 Corporation
Notes to Consolidated Financial Statements
1. Description of Business and Summary of Significant Accounting Policies
Control4 Corporation (“Control4” or the “Company”) is a leading provider of automation and control solutions for the connected home. The Company unlocks the potential of connected devices, making entertainment systems easier to use, homes more comfortable, appliances more energy efficient, and families more secure. The Company was incorporated in the state of Delaware on March 27, 2003.
Reclassifications
Certain prior-year amounts have been reclassified in order to conform to the current-year presentation. A reclassification was made from general and administrative expenses to other income (expense) related to foreign currency transaction gains (losses). As a result, income from operations is impacted by $0 and $34,000 for the years ended December 31, 2012 and 2013, respectively, but this reclassification did not impact previously reported net income, or related per share amounts. In addition, a reclassification was made related to international hospitality revenue previously disclosed as United States hospitality revenue. The reclassification did not materially impact previous disclosures related to geographic information. Furthermore, this reclassification had no effect on previously reported amounts related to total revenue, income from continuing operations, net income or related per share amounts, and does not impact previous disclosures regarding concentrations of revenue.
Basis of Presentation
The consolidated financial statements include the accounts of the Company and its wholly-owned subsidiaries. All intercompany balances and transactions have been eliminated in the consolidated financial statements.
Segment Reporting
Operating segments are identified as components of an enterprise about which separate discrete financial information is available for evaluation by the chief operating decision-maker, the Chief Executive Officer, in making decisions regarding resource allocation and accessing performance. To date, the Company has viewed its operations and manages its business as one operating segment.
Concentrations of Risk
The Company’s accounts receivable are derived from revenue earned from its worldwide network of independent dealers and distributors. The Company’s sales to dealers and distributors located outside the United States are generally denominated in United States dollars, except for sales to dealers and distributors located in the United Kingdom and the European Union, which are generally denominated in pounds sterling and the euro, respectively. There were no individual account balances greater than 10% of total accounts receivable at December 31, 2013 and December 31, 2014.
No dealer or distributor accounted for more than 10% of total revenue for the years ended December 31, 2012, 2013 and 2014.
The Company relies on a limited number of suppliers for its contract manufacturing. A significant disruption in the operations of these manufacturers would impact the production of the Company’s products for a substantial period of time, which could have a material adverse effect on the Company’s business, financial condition and results of operations.
Geographic Information
The Company’s revenue includes amounts earned through sales to dealers and distributors located outside of the United States. With the exception of Canada, no single foreign country accounted for more than 10% of total revenue for the years ended December 31, 2012, 2013 and 2014. The following table sets forth revenue from the U.S., Canadian and all other international dealers and distributors combined (in thousands):
|
|
|
Years Ended December 31, |
| |||||||
|
|
|
2012 |
|
2013 |
|
2014 |
| |||
|
Revenue-United States |
|
$ |
69,957 |
|
$ |
84,474 |
|
$ |
98,276 |
|
|
Revenue-Canada |
|
12,453 |
|
15,014 |
|
15,320 |
| |||
|
Revenue-all other international sources |
|
27,102 |
|
29,023 |
|
35,204 |
| |||
|
Total revenue |
|
$ |
109,512 |
|
$ |
128,511 |
|
$ |
148,800 |
|
|
International revenue (excluding Canada) as a percent of total revenue |
|
25 |
% |
23 |
% |
24 |
% | |||
Use of Accounting Estimates
The preparation of financial statements in conformity with GAAP requires management to make estimates and assumptions that affect the reported amounts of assets and liabilities as of the date of the financial statements and the reported amounts of revenues and expenses during the reporting period. On an ongoing basis, the Company evaluates its estimates including those related to revenue recognition, sales returns, provisions for doubtful accounts, product warranty, inventory obsolescence, litigation, determination of fair value of stock options, deferred tax asset valuation allowances and income taxes. Actual results may differ from those estimates.
Product Warranty
The Company provides its customers a limited product warranty of two years, which requires the Company, at its option, to repair or replace defective products during the warranty period at no cost to the customer or refund the purchase price. The Company estimates the costs that may be incurred to replace, repair or issue a refund for defective products and records a reserve at the time revenue is recognized. Factors that affect the Company’s warranty liability include the number of installed systems, the Company’s historical experience and management’s judgment regarding anticipated rates of product warranty returns, net of refurbished products. The Company assesses the adequacy of its recorded warranty liability each period and makes adjustments to the liability as necessary. Warranty costs accrued includes amounts accrued for products at the time of shipment, adjustments for changes in estimated costs for warranties on products shipped in the period, and changes in estimated costs for warranties on products shipped in prior periods. It is not practicable for the Company to determine the amounts applicable to each of these components.
The following table presents the changes in the product warranty liability (in thousands):
|
|
|
Years Ended December 31, |
| |||||||
|
|
|
2012 |
|
2013 |
|
2014 |
| |||
|
Balance at the beginning of the period |
|
$ |
1,030 |
|
$ |
1,155 |
|
$ |
1,213 |
|
|
Warranty costs accrued |
|
1,050 |
|
1,025 |
|
1,145 |
| |||
|
Warranty claims |
|
(925 |
) |
(967 |
) |
(1,167 |
) | |||
|
Balance at the end of the period |
|
$ |
1,155 |
|
$ |
1,213 |
|
$ |
1,191 |
|
Net Income (Loss) Per Share
Basic net income (loss) per share is computed using the weighted-average number of common shares outstanding during the period. Diluted net income (loss) per share is computed using the weighted-average number of common shares outstanding and potentially dilutive common shares outstanding during the period that have a dilutive effect on net income per share. Potentially dilutive common shares result from the assumed exercise of outstanding stock options and the assumed conversion of outstanding convertible preferred stock and warrants using the if-converted method. In a net loss position, diluted net loss per share is computed using only the weighted-average number of common shares outstanding during the period, as any additional common shares would be anti-dilutive.
The following table presents the reconciliation of the numerator and denominator used in the calculation of basic and diluted net income (loss) per share (in thousands):
|
|
|
Years Ended December 31, |
| |||||||
|
|
|
2012 |
|
2013 |
|
2014 |
| |||
|
Numerator: |
|
|
|
|
|
|
| |||
|
Net income (loss) |
|
$ |
(3,723 |
) |
$ |
3,503 |
|
$ |
8,156 |
|
|
Denominator: |
|
|
|
|
|
|
| |||
|
Weighted average common stock outstanding for basic net income (loss) per common share |
|
2,360 |
|
10,609 |
|
23,685 |
| |||
|
Effect of dilutive securities—stock options, convertible preferred stock, and warrants to purchase common stock and preferred stock |
|
— |
|
11,654 |
|
1,961 |
| |||
|
Weighted average common shares and dilutive securities outstanding |
|
2,360 |
|
22,263 |
|
25,646 |
| |||
The following weighted-average common stock equivalents were anti-dilutive and therefore were excluded from the calculation of diluted net income (loss) per share (in thousands):
|
|
|
Years Ended December 31, |
| ||||
|
|
|
2012 |
|
2013 |
|
2014 |
|
|
Convertible preferred stock |
|
15,294 |
|
— |
|
— |
|
|
Options to purchase common stock |
|
4,317 |
|
356 |
|
1,041 |
|
|
Warrants to purchase common stock |
|
541 |
|
1 |
|
— |
|
|
Warrants to purchase preferred stock |
|
194 |
|
— |
|
— |
|
|
Total |
|
20,346 |
|
357 |
|
1,041 |
|
Revenue Recognition
The Company sells its products through a network of independent dealers, regional and national retailers and distributors. These dealers, retailers and distributors generally sell the Company’s products to the end consumer as part of a bundled sale, which typically includes other third-party products and related services, project design and installation services and on-going support.
The Company records estimated reductions to revenue for dealer, retailer and distributor incentives, primarily comprised of volume rebates, at the time of the initial sale. The estimated reductions to revenue for rebates are based on the sales terms and the Company’s historical experience and trend analysis. The most common incentive relates to amounts paid or credited to dealers and distributors for achieving defined volume levels or growth objectives.
The Company’s products include embedded software that is essential to the functionality of the hardware. Accordingly, the hardware and embedded software are accounted for as a single deliverable. In 2013, the Company began bundling Control4 App software licenses with its new controllers. These software licenses do not include acceptance provisions, rights to updates (e.g., when-and-if-available enhancements or upgrades to the functionality of the software) or post-contract customer support such as technical support. When a software license and controller are sold together, a multiple element arrangement exists and revenue is allocated to each deliverable based on relative selling prices. Typically, delivery of both the product and the software license occurs at the same time. The Company recognizes revenue when persuasive evidence of an arrangement exists, delivery has occurred, the sales price is fixed or determinable, and collection is reasonably assured. Product or licensed software is considered delivered once it has been shipped and title and risk of loss have been transferred. For most of the Company’s product sales, these criteria are met at the time the product is shipped.
Software license revenue represents fees earned from activating applications which allow end consumers to manage and control their automation systems using tablets, smartphones and other third-party devices. Software products such as Composer Home and Media Editions are sold on a limited basis and do not constitute a significant portion of revenue. The Company’s perpetual software licenses do not include acceptance provisions, rights to updates or upgrades or post-contract customer support such as technical support; the Company generally recognizes revenue at the time the software license is provided.
The Company offers a subscription service that allows consumers to control and monitor their homes remotely and allows the Company’s dealers to perform remote diagnostic services. Subscription revenue is deferred at the time of payment and recognized on a straight-line basis over the period the service is provided. Total revenue for subscription services represents less than 10% of total revenue for all periods presented.
The Company recognizes revenue net of cost of revenue for third-party products sold through the Company’s online ordering system. While the Company assumes credit risk on sales to its dealers and distributors for third-party products, the Company does not determine the product selling price, does not retain associated inventory risks and is not the primary obligor to the end consumer.
The Company’s agreements with dealers and distributors generally do not include rights of return or acceptance provisions. Even though contractual agreements do not provide return privileges, there are circumstances in which the
Company will accept returns. In addition, agreements with certain retail distributors contain price protection and limited rights of return. The Company maintains a reserve for such returns based on the Company’s historical return experience.
Shipping charges billed to dealers and distributors are included in revenue and related shipping costs are included in cost of revenue.
Cost of Revenue
Cost of revenue includes the following: the cost of inventory sold during the period, inventory write-down costs, payroll, purchasing costs, royalty obligations, shipping expenses to dealers and distributors and warehousing costs, which include inbound freight costs from manufacturers, rent and payroll and benefit costs.
Cash and Cash Equivalents
The Company considers all highly liquid short-term investments with original maturities of three months or less at the time of purchase to be cash equivalents. Cash equivalents consist primarily of money market funds.
Restricted Cash
Restricted cash as of December 31, 2014, is composed of a guarantee made by our subsidiary in the United Kingdom to HM Revenue & Customs related to a customs duty deferment account.
Allowance for Doubtful Accounts
The Company extends credit to the majority of its dealers and distributors, which consist primarily of small, local businesses. Issuance of credit is based on ongoing credit evaluations by the Company of dealers’ and distributors’ financial condition and generally requires no collateral. Trade accounts receivable are recorded at the invoiced amount and do not bear interest. The Company maintains an allowance for doubtful accounts to reserve for potential uncollectible receivables. The allowance is based upon the creditworthiness of the Company’s dealers and distributors, the dealers’ and distributors’ historical payment experience, the age of the receivables and current market and economic conditions. Provisions for potentially uncollectible accounts are recorded in sales and marketing expenses. The Company writes off accounts receivable balances to the allowance for doubtful accounts when it becomes likely that they will not be collected.
The following table presents the changes in the allowance for doubtful accounts (in thousands):
|
|
|
Years Ended December 31, |
| |||||||
|
|
|
2012 |
|
2013 |
|
2014 |
| |||
|
Balance at beginning of period |
|
$ |
651 |
|
$ |
643 |
|
$ |
605 |
|
|
Provision |
|
184 |
|
159 |
|
229 |
| |||
|
Deductions |
|
(192 |
) |
(197 |
) |
(129 |
) | |||
|
Balance at end of period |
|
$ |
643 |
|
$ |
605 |
|
$ |
705 |
|
Inventories
Inventories consist of hardware and related component parts and are stated at the lower of cost or market using the first-in, first-out method. The Company periodically assesses the recoverability of its inventory and reduces the carrying value of the inventory when items are determined to be obsolete, defective or in excess of forecasted sales requirements. Inventory write-downs for excess, defective and obsolete inventory are recorded as a cost of revenue and totaled $1.5 million, $2.3 million, and $1.7 million for the years ended December 31, 2012, 2013 and 2014, respectively.
In December 2012, the Company finalized termination of a sales contract and, as a result of the contract termination, recorded a $1.8 million expense associated with an anticipated loss on firm purchase commitments for components that would have been required to meet the Company’s obligations under the terminated contract. The $1.8 million charge has been recorded as Cost of Revenue—Inventory Purchase Commitment in the accompanying consolidated statement of operations during the year ended December 31, 2012.
In 2013, the Company recorded a gain related to inventory purchase commitments of approximately $0.4 million, as the proceeds from liquidating the underlying inventory and the Company’s ability to consume common components exceeded original estimates.
Property and Equipment
Property and equipment are recorded at historical cost, less accumulated depreciation. Depreciation is computed using the straight-line method over the following estimated useful lives:
|
Furniture and fixtures |
|
2 - 5 years |
|
|
Manufacturing tooling and test equipment |
|
2 - 3 years |
|
|
Lab and warehouse equipment |
|
2 - 4 years |
|
|
Computer equipment and software |
|
3 - 4 years |
|
|
Marketing equipment |
|
2 - 3 years |
|
Maintenance and repairs that do not extend the life of or improve the asset are expensed in the year incurred. Leasehold improvements are depreciated over the estimated useful life (usually 3-8 years) or the life of the associated lease, whichever is less. During the year ended December 31, 2014, the Company recorded approximately $0.7 million of leasehold improvement assets that were paid by the landlord, with a corresponding long-term liability as the tenant improvement allowance was determined to be an incentive for renewing the lease.
Intangible Assets
Intangible assets primarily consist of acquired technology. The Company amortizes, to cost of revenue, definite-lived intangible assets on a straight-line basis over the life of the technology.
Impairment of Long-Lived Assets
The carrying value of long-lived assets is reviewed for impairment whenever events or changes in circumstances indicate that the carrying amount of an asset or asset group may not be recoverable. An impairment loss is recognized when the carrying amount of an asset exceeds the estimated undiscounted future cash flows expected to result from the use of the asset and its eventual disposition. The amount of the impairment loss to be recorded is calculated by the excess of the asset’s carrying value over its fair value. Fair value is generally determined using a discounted cash flow analysis.
Foreign Currency Translation
The functional currency of the Company’s subsidiaries in the United Kingdom, China, Hong Kong and India are the Pound Sterling, the Chinese Yuan, the Hong Kong Dollar and the Indian Rupee, respectively. The subsidiary’s assets and liabilities have been translated to U.S. dollars using the exchange rates in effect at the balance sheet dates. Statements of operations amounts have been translated using the average exchange rate for each year. Resulting gains or losses from translating foreign currency financial statements are recorded as other comprehensive income (loss). Foreign currency transaction gains (losses) resulting from exchange rate fluctuations on transactions denominated in a currency other than the local currency are included in other income (expense) and have not been material for the years ended December 31, 2012, 2013 or 2014.
Stock-Based Compensation
The Company recognizes compensation expense for all stock-based awards issued to employees and directors based on estimated grant date fair values. The Company selected the Black-Scholes option-pricing model to determine the estimated fair value at the date of grant for stock options. The Company elected to amortize compensation expense using the straight-line attribution method, under which stock-based compensation expense is recognized on a straight-line basis over the period the employee performs the related services, generally the vesting period of four years, net of estimated forfeitures. The Company has estimated forfeiture rates based on its historical experience and will update the rates, as necessary, in subsequent periods if actual forfeitures differ from initial estimates.
The Black-Scholes option-pricing model requires management assumptions regarding various factors that require extensive use of accounting judgment and financial estimates. The Company estimates the expected term for options using the simplified method, which utilizes the weighted average expected life of each tranche of the stock option, determined based on the sum of each tranche’s vesting period plus one-half of the period from the vesting date of each tranche to the stock option’s expiration, because the Company’s options are considered “plain vanilla.” The Company computed the expected volatility using multiple peer companies for a period approximating the expected term. The risk-free interest rate was determined using the implied yield on U.S. Treasury issues with a remaining term within the expected life of the award.
The Company accounts for stock-based instruments and awards issued to non-employees at fair value using the Black-Scholes option-pricing model. Management believes that the fair value of the stock-based awards is more reliably measured than the fair value of the services received. The fair value of each non-employee award is re-measured each period until a commitment date is reached, which is generally the vesting date.
Income Taxes
The Company recognizes deferred tax assets and liabilities for the future tax consequences attributable to the differences between the financial statement carrying value of existing assets and liabilities and their respective tax bases. Deferred tax assets and liabilities are measured using enacted tax rates in effect for the fiscal year in which those temporary differences are expected to be recovered or settled. Valuation allowances are established when necessary to reduce deferred tax assets to the amount expected to be realized.
The Company operates in various tax jurisdictions and is subject to audit by various tax authorities. The Company provides for tax contingencies whenever it is deemed probable that a tax asset has been impaired or a tax liability has been incurred for events such as tax claims or changes in tax laws. Tax contingencies are based upon their technical merits, relative tax law and the specific facts and circumstances as of each reporting period. Changes in facts and circumstances could result in material changes to the amounts recorded for such tax contingencies.
The Company recognizes uncertain income tax positions taken on income tax returns at the largest amount that is more-likely-than-not to be sustained upon audit by the relevant taxing authority. An uncertain income tax position will not be recognized if it has less than a 50% likelihood of being sustained.
The Company’s policy for recording interest and penalties associated with uncertain tax positions is to record such items as a component of its income tax provision. During the years ended December 31, 2012, 2013 and 2014, we did not record any material interest income, interest expense or penalties related to uncertain tax positions or the settlement of audits for prior periods.
Presentation of Certain Taxes
The Company collects various taxes from dealers and distributors and remits these amounts to the applicable taxing authorities. The Company’s accounting policy is to exclude these taxes from revenue and cost of revenue.
Research and Development
Research and development expenses consist primarily of personnel costs, including incentive compensation, depreciation associated with research and development equipment, contract labor and consulting services, facilities- related costs, and travel-related costs. Research and development costs are expensed as incurred.
Recent Accounting Pronouncements
In July 2013, the FASB issued ASU 2013-11, ‘‘Presentation of an Unrecognized Tax Benefit When a Net Operating Loss Carryforward, a Similar Tax Loss, or a Tax Credit Carryforward Exists.’’ The amended guidance requires an entity to present an unrecognized tax benefit, or a portion of an unrecognized tax benefit, in the financial statements as a reduction to a deferred tax asset for a net operating loss carryforward, a similar tax loss, or a tax credit carryforward, except as follows. To the extent a net operating loss carryforward, a similar tax loss, or a tax credit carryforward is not available at the reporting date under the tax law of the applicable jurisdiction to settle any additional income taxes that would result from the disallowance of a tax position or the tax law of the applicable jurisdiction does not require the entity to use, and the entity does not intend to use, the deferred tax asset for such purpose, the unrecognized tax benefit should be presented in the financial statements as a liability and should not be combined with deferred tax assets. The guidance was effective for the Company beginning January 1, 2014. The adoption of this guidance did not have an impact on the Company’s results of operations, financial position, or cash flows as it relates only to financial statement presentation.
In May 2014, the FASB issued ASU 2004-09, “Revenue from Contracts with Customers (Topic 606),” which amends the guidance in ASC 605, “Revenue Recognition.” The core principle of the guidance is that an entity should recognize revenue to depict the transfer of promised goods or services to customers in an amount that reflects the consideration to which the entity expects to be entitled in exchange for those goods or services. The guidance is effective for annual reporting periods beginning after December 15, 2016, including interim periods within that reporting period. Early application is not permitted. The Company is still evaluating the impact of adopting this guidance as well as whether the Company will apply the amendments retrospectively to each prior reporting period presented or retrospectively with the cumulative effect of applying this update at the date of initial application.
In August 2014, the FASB issued ASU 2014-15, ‘‘Presentation of Financial Statements — Going Concern (Subtopic 205-40).’’ The amended guidance requires an entity to prepare financial statements under the liquidation basis of accounting in accordance with Subtopic 205-30, Presentation of Financial Statements—Liquidation Basis of Accounting, if liquidation of the entity becomes imminent. The guidance is effective for the annual period ending on December 31, 2016, and for annual periods and interim periods thereafter. Early application is permitted. The adoption of this guidance will not have an impact on the Company’s results of operations, financial position, or cash flows.
2. Balance Sheet Components
Inventories consisted of the following (in thousands):
|
|
|
December 31, |
|
December 31, |
| ||
|
Finished goods |
|
$ |
14,061 |
|
$ |
13,324 |
|
|
Component parts |
|
1,251 |
|
888 |
| ||
|
|
|
$ |
15,312 |
|
$ |
14,212 |
|
Property and equipment, net consisted of the following (in thousands):
|
|
|
December 31, |
|
December 31, |
| ||
|
Computer equipment and software |
|
$ |
4,152 |
|
$ |
4,390 |
|
|
Manufacturing tooling and test equipment |
|
2,652 |
|
2,777 |
| ||
|
Furniture and fixtures |
|
2,046 |
|
2,298 |
| ||
|
Lab and warehouse equipment |
|
2,374 |
|
2,652 |
| ||
|
Marketing equipment |
|
604 |
|
662 |
| ||
|
Leasehold improvements |
|
1,450 |
|
2,357 |
| ||
|
|
|
13,278 |
|
15,136 |
| ||
|
Less: accumulated depreciation |
|
(9,335 |
) |
(10,047 |
) | ||
|
|
|
$ |
3,943 |
|
$ |
5,089 |
|
Other assets consisted of the following (in thousands):
|
|
|
December 31, |
|
December 31, |
| ||
|
Prepaid licensing |
|
$ |
716 |
|
$ |
632 |
|
|
Deposits |
|
404 |
|
697 |
| ||
|
|
|
$ |
1,120 |
|
$ |
1,329 |
|
Accrued liabilities consisted of the following (in thousands):
|
|
|
December 31, |
|
December 31, |
| ||
|
Sales returns and warranty accruals |
|
$ |
2,137 |
|
$ |
2,019 |
|
|
Compensation accruals |
|
3,233 |
|
1,614 |
| ||
|
Other accrued liabilities |
|
544 |
|
1,097 |
| ||
|
Current portion of settlement obligations |
|
907 |
|
20 |
| ||
|
|
|
$ |
6,821 |
|
$ |
4,750 |
|
3. Fair Value Measurements
Assets Measured and Recorded at Fair Value on a Recurring Basis
The Company’s financial assets that are measured at fair value on a recurring basis consist of money market funds and available-for-sale investments. The following three levels of inputs are used to measure the fair value of financial instruments:
Level 1: Quoted prices in active markets for identical assets or liabilities.
Level 2: Observable inputs other than quoted prices in active markets for identical assets and liabilities, quoted prices for identical or similar assets or liabilities in inactive markets, or other inputs that are observable or can be corroborated by observable market data for substantially the full term of the assets or liabilities.
Level 3: Unobservable inputs are used when little or no market data is available.
The fair values for substantially all of the Company’s financial assets are based on quoted prices in active markets or observable inputs. For Level 2 securities, the Company uses a third-party pricing service which provides documentation on an ongoing basis that includes, among other things, pricing information with respect to reference data, methodology, inputs summarized by asset class, pricing application and corroborative information.
The Company determines realized gains or losses on the sale of marketable securities on a specific identification method. During the year ended December 31, 2014, the Company did not record significant realized gains or losses on the sales of available-for-sale investments. The following tables show the Company’s cash and available-for-sale investments’ adjusted cost, gross unrealized gains, gross unrealized losses and fair value by significant investment category recorded as cash and cash equivalents or short- or long-term investments as of December 31, 2013 and December 31, 2014 (in thousands):
|
|
|
December 31, 2013 |
| |||||||||||||||||||
|
|
|
Adjusted |
|
Unrealized |
|
Unrealized |
|
Fair Value |
|
Cash and |
|
Short-term |
|
Long-term |
| |||||||
|
|
|
|
|
|
|
|
|
|
|
|
|
|
|
|
| |||||||
|
Cash |
|
$ |
5,533 |
|
$ |
— |
|
$ |
— |
|
$ |
5,533 |
|
$ |
5,533 |
|
$ |
— |
|
$ |
— |
|
|
|
|
|
|
|
|
|
|
|
|
|
|
|
|
|
| |||||||
|
Level 1: |
|
|
|
|
|
|
|
|
|
|
|
|
|
|
| |||||||
|
Money market funds |
|
79,013 |
|
— |
|
— |
|
79,013 |
|
79,013 |
|
— |
|
— |
| |||||||
|
Subtotal |
|
79,013 |
|
— |
|
— |
|
79,013 |
|
79,013 |
|
— |
|
— |
| |||||||
|
|
|
|
|
|
|
|
|
|
|
|
|
|
|
|
| |||||||
|
Total |
|
$ |
84,546 |
|
$ |
— |
|
$ |
— |
|
$ |
84,546 |
|
$ |
84,546 |
|
$ |
— |
|
$ |
— |
|
|
|
|
December 31, 2014 |
| |||||||||||||||||||
|
|
|
Adjusted |
|
Unrealized |
|
Unrealized |
|
Fair Value |
|
Cash and |
|
Short-term |
|
Long-term |
| |||||||
|
|
|
|
|
|
|
|
|
|
|
|
|
|
|
|
| |||||||
|
Cash |
|
$ |
13,077 |
|
$ |
— |
|
$ |
— |
|
$ |
13,077 |
|
$ |
13,077 |
|
$ |
— |
|
$ |
— |
|
|
|
|
|
|
|
|
|
|
|
|
|
|
|
|
|
| |||||||
|
Level 1: |
|
|
|
|
|
|
|
|
|
|
|
|
|
|
| |||||||
|
Money market funds |
|
16,110 |
|
— |
|
— |
|
16,110 |
|
16,110 |
|
— |
|
— |
| |||||||
|
Subtotal |
|
16,110 |
|
— |
|
— |
|
16,110 |
|
16,110 |
|
— |
|
— |
| |||||||
|
|
|
|
|
|
|
|
|
|
|
|
|
|
|
|
| |||||||
|
Level 2: |
|
|
|
|
|
|
|
|
|
|
|
|
|
|
| |||||||
|
Asset-backed securities |
|
4,458 |
|
— |
|
(3 |
) |
4,455 |
|
— |
|
— |
|
4,455 |
| |||||||
|
Corporate bonds |
|
54,321 |
|
2 |
|
(46 |
) |
54,277 |
|
— |
|
46,726 |
|
7,551 |
| |||||||
|
Commercial paper |
|
6,797 |
|
— |
|
— |
|
6,797 |
|
— |
|
6,797 |
|
— |
| |||||||
|
U.S. agency securities |
|
2,503 |
|
— |
|
— |
|
2,503 |
|
— |
|
— |
|
2,503 |
| |||||||
|
Subtotal |
|
68,079 |
|
2 |
|
(49 |
) |
68,032 |
|
— |
|
53,523 |
|
14,509 |
| |||||||
|
|
|
|
|
|
|
|
|
|
|
|
|
|
|
|
| |||||||
|
Total |
|
$ |
97,266 |
|
$ |
2 |
|
$ |
(49 |
) |
$ |
97,219 |
|
$ |
29,187 |
|
$ |
53,523 |
|
$ |
14,509 |
|
As of December 31, 2014, the Company considers the declines in market value of its investment portfolio to be temporary in nature and does not consider any of its investments other-than-temporarily impaired. The Company typically
invests in highly-rated securities, and its investment policy generally limits the amount of credit exposure to any one issuer. The policy requires investments generally to be investment grade, with the primary objective of minimizing the potential risk of principal loss. Fair values were determined for each individual security in the investment portfolio. The maturities of the Company’s long-term investments range from one to two years. When evaluating an investment for other-than-temporary impairment the Company reviews factors such as the length of time and extent to which fair value has been below its cost basis, the financial condition of the issuer and any changes thereto, changes in market interest rates, and the Company’s intent to sell, as well as the fact it is not more likely than not that the Company will be required to sell the investment before recovery of the investment’s cost basis, which may be maturity. During the year ended December 31, 2014, the Company did not recognize any significant impairment charges.
Fair Value of Other Financial Instruments
The carrying amounts reported in the accompanying consolidated financial statements for cash and cash equivalents, restricted cash, accounts payable and accrued liabilities approximate their fair value because of the short term nature of the accounts. The fair value of the notes payable approximates its carrying value based on the variable nature of interest rates and current market rates available to the Company (see Note 4). As a result, the balance of the notes payable is categorized within the Level 2 fair value hierarchy.
4. Long-Term Obligations
Loan and Security Agreement
In June 2013, the Company entered into an Amended and Restated Loan and Security Agreement with Silicon Valley Bank (the “SVB Agreement”), which consists of a revolving credit facility of $13.0 million (subject to certain borrowing base restrictions) and term borrowings to fund purchases of property and equipment. All borrowings under the SVB Agreement are collateralized by the general assets of the Company. The revolving credit facility has a variable rate of interest of prime (as published in the Wall Street Journal) or LIBOR plus 2.50%, as selected by the Company. The rate was 3.25% at December 31, 2014. In addition, the Company pays an annual commitment fee of $20,000 and a quarterly unused line fee of 0.375% based on the difference between the borrowing commitment of $13.0 million and the then-current balance. In addition, the SVB Agreement provided for term borrowings to fund purchases of property and equipment through May 2014. Term borrowings are payable in 42 equal monthly payments of principal plus interest and bear interest at prime plus 0.50%, which was 3.75% at December 31, 2014.
Borrowing under the revolving credit facility is subject to certain collateral restrictions relating primarily to the Company’s accounts receivable and inventory levels. As of December 31, 2014, the total borrowing capacity was approximately $13.0 million, and no borrowings were outstanding. The revolving credit facility has a maturity date of May 29, 2015.
The SVB Agreement contains various restrictive and financial covenants and the Company was in compliance with each of these covenants as of December 31, 2014.
Future principal payments on outstanding term borrowings as of December 31, 2014 are as follows (in thousands):
|
2015 |
|
$ |
915 |
|
|
2016 |
|
727 |
| |
|
2017 |
|
186 |
| |
|
|
|
$ |
1,828 |
|
5. Income Taxes
The domestic and foreign components of net income (loss) before income tax expense consists of the following for the periods shown below (in thousands):
|
|
|
Years Ended December 31, |
| |||||||
|
|
|
2012 |
|
2013 |
|
2014 |
| |||
|
Income (loss) before income taxes: |
|
|
|
|
|
|
| |||
|
Domestic |
|
$ |
(4,055 |
) |
$ |
3,633 |
|
$ |
7,464 |
|
|
Foreign |
|
473 |
|
118 |
|
1,103 |
| |||
|
Total income (loss) before income taxes |
|
$ |
(3,582 |
) |
$ |
3,751 |
|
$ |
8,567 |
|
The provision for income taxes consisted of the following components (in thousands):
|
|
|
Years Ended December 31, |
| |||||||
|
|
|
2012 |
|
2013 |
|
2014 |
| |||
|
Current: |
|
|
|
|
|
|
| |||
|
Domestic |
|
|
|
|
|
|
| |||
|
Federal |
|
$ |
15 |
|
$ |
64 |
|
$ |
76 |
|
|
State |
|
57 |
|
53 |
|
52 |
| |||
|
Foreign |
|
69 |
|
147 |
|
288 |
| |||
|
Total current tax expense |
|
141 |
|
264 |
|
416 |
| |||
|
Deferred: |
|
|
|
|
|
|
| |||
|
Domestic |
|
|
|
|
|
|
| |||
|
Federal |
|
(710 |
) |
1,572 |
|
1,761 |
| |||
|
State |
|
(65 |
) |
44 |
|
30 |
| |||
|
Foreign |
|
88 |
|
(16 |
) |
(5 |
) | |||
|
Valuation allowance |
|
687 |
|
(1,616 |
) |
(1,791 |
) | |||
|
Total deferred tax benefit |
|
— |
|
(16 |
) |
(5 |
) | |||
|
Total income tax expense |
|
$ |
141 |
|
$ |
248 |
|
$ |
411 |
|
A reconciliation from the U.S. statutory federal income tax rate to the effective income tax rate follows:
|
|
|
Years Ended December 31, |
| ||||
|
|
|
2012 |
|
2013 |
|
2014 |
|
|
Federal income tax rate |
|
(34.0 |
)% |
34.0 |
% |
34.0 |
% |
|
State taxes, net of federal benefit |
|
1.1 |
|
1.1 |
|
0.4 |
|
|
Stock-based compensation |
|
15.0 |
|
22.7 |
|
(2.1 |
) |
|
Stock warrant |
|
— |
|
6.4 |
|
— |
|
|
Research and development credits |
|
— |
|
(18.3 |
) |
(8.1 |
) |
|
Change in valuation allowance |
|
17.3 |
|
(42.0 |
) |
(20.6 |
) |
|
Other, net |
|
4.5 |
|
2.7 |
|
1.2 |
|
|
Effective income tax rate |
|
3.9 |
% |
6.6 |
% |
4.8 |
% |
Deferred tax assets and (liabilities) are comprised of the following (in thousands):
|
|
|
December 31, |
| ||||
|
|
|
2013 |
|
2014 |
| ||
|
Deferred Tax Assets: |
|
|
|
|
| ||
|
Reserves and accruals |
|
$ |
2,146 |
|
$ |
1,449 |
|
|
Inventories |
|
1,059 |
|
1,063 |
| ||
|
Net operating loss carryforwards |
|
27,865 |
|
25,007 |
| ||
|
Property, plant and equipment |
|
1,327 |
|
1,831 |
| ||
|
Stock-based compensation |
|
1,233 |
|
1,540 |
| ||
|
Research and development credit carryforwards |
|
4,091 |
|
5,243 |
| ||
|
Other |
|
163 |
|
— |
| ||
|
Total deferred tax assets |
|
37,884 |
|
36,133 |
| ||
|
Valuation allowance |
|
(37,842 |
) |
(36,050 |
) | ||
|
Total deferred tax assets |
|
$ |
42 |
|
$ |
83 |
|
|
Deferred Tax Liabilities: |
|
|
|
|
| ||
|
Undistributed earnings of foreign subsidiaries |
|
$ |
(15 |
) |
$ |
(56 |
) |
|
Intangible assets |
|
— |
|
(116 |
) | ||
|
Property and equipment |
|
(11 |
) |
(16 |
) | ||
|
Total deferred tax liabilities |
|
$ |
(26 |
) |
$ |
(188 |
) |
|
Net deferred tax asset (liability) |
|
$ |
16 |
|
$ |
(105 |
) |
At December 31, 2013 and 2014, the Company had a full valuation allowance against the deferred tax assets of its domestic operations as it believes it is more likely than not that these benefits will not be realized. Significant judgment is required in determining our provision for income taxes, recording valuation allowances against deferred tax assets and evaluating our uncertain tax positions. In evaluating our ability to recover our deferred tax assets, in full or in part, we
consider all available positive and negative evidence, including our past operating results, our forecast of future market growth, forecasted earnings, future taxable income and prudent and feasible tax planning strategies. Due to historical net losses incurred and the uncertainty of realizing the deferred tax assets, for all the periods presented, we have a full valuation allowance against our deferred tax assets. To the extent that we generate positive income and expect, with reasonable certainty, to continue to generate positive domestic income we may release all or a portion of our valuation allowance in a future period. This release would result in the recognition of certain deferred tax assets, a decrease to income tax expense for the period such release is made. In addition, our effective tax rate in subsequent periods would increase, and more closely approximate the federal statutory rate of 34%, after giving consideration to state income taxes, foreign income taxes and the effect of exercising incentive stock options. The net valuation allowance decreased by approximately $1.6 million and $1.8 million during the years ended December 31, 2013 and 2014, respectively.
Net operating loss and tax credit carryforwards as of December 31, 2014 are as follows (in thousands):
|
|
|
Amount |
|
Expiration Years |
| |
|
Net operating losses, federal |
|
$ |
85,577 |
|
2024 – 2034 |
|
|
Net operating losses, state |
|
86,064 |
|
2018 – 2032 |
| |
|
Tax credit carryforwards, federal |
|
3,789 |
|
2023 – 2034 |
| |
|
Tax credit carryforwards, state |
|
2,799 |
|
2018 – 2029 |
| |
|
Net operating losses, foreign |
|
20 |
|
None |
| |
Approximately $18.4 million of the net operating losses reported above represents unrecorded tax benefits for stock-based compensation, which will be recorded in additional paid in capital when realized. Utilization of the net operating loss carryforwards and credits may be subject to a substantial annual limitation due to the ownership change limitations provided by the Internal Revenue Code of 1986, as amended (the “IRC”), and similar state provisions. The Company recently performed a detailed analysis under Section 382 of the IRC to determine whether any ownership changes had occurred. The effect of an ownership change would be the potential imposition of annual limitations on the use of net operating loss carryforwards attributable to periods before the change. The detailed analysis confirmed that Section 382 ownership changes occurred on July 29, 2003 and March 27, 2007, but the Company concluded that the ownership changes do not result in any limitations regarding the utilization of net operating loss carryforwards.
The following is a reconciliation of the changes in the gross balance of unrecognized tax benefits, excluding interest and penalties (in thousands):
|
|
|
Years Ended December 31, |
| |||||||
|
|
|
2012 |
|
2013 |
|
2014 |
| |||
|
Balance at the beginning of the period |
|
$ |
2,318 |
|
$ |
2,318 |
|
$ |
2,943 |
|
|
Current year additions |
|
— |
|
625 |
|
640 |
| |||
|
Balance at the end of the period |
|
$ |
2,318 |
|
$ |
2,943 |
|
$ |
3,583 |
|
The Company does not believe there will be any material changes in its unrecognized tax benefits over the next 12 months. As of December 31, 2014, the amount of unrecognized tax benefits that would, if recognized, impact the Company’s effective income tax rate is approximately $3.6 million.
The Company files income tax returns in the United States, including various state and local jurisdictions. The Company’s subsidiaries file income tax returns in the United Kingdom, Hong Kong, China and India. The Company is subject to examination in the United States, the United Kingdom, Hong Kong, China, and India as well as various state jurisdictions. As of December 31, 2014, the Company was not under examination by any tax authorities. Tax years beginning in 2011 are subject to examination by tax authorities in the United States, although net operating loss and credit carryforwards from all years are subject to examinations and adjustments for at least three years following the year in which the attributes are used. Tax years beginning in 2012 are subject to examination by the taxing authorities in Hong Kong. Tax years beginning in 2013 are subject to examination by the taxing authorities in the United Kingdom, China, and India.
At December 31, 2014, the Company had undistributed foreign earnings of $1.5 million, which the Company intends to permanently reinvest in the foreign subsidiary. Unrecognized deferred tax liabilities of $0.3 million from temporary differences related to the investment in this foreign subsidiary would have been taxable if the Company repatriated the foreign earnings. The Company anticipates that future overseas earnings will also be reinvested indefinitely. In accordance with the indefinite reversal criteria, the foreign currency gains recorded in other comprehensive income related to foreign currency translation have not been tax effected.
6. Equity Compensation
Stock Options
In 2003, the Board of Directors adopted the 2003 Equity Incentive Plan (the “2003 Plan”), which provided for the granting of nonqualified and incentive stock options, stock appreciation rights, stock awards and restricted stock. Under the 2003 Plan, the Company was able to grant nonqualified and incentive stock options to directors, employees and non-employees providing services to the Company. On June 11, 2013, the Company’s Board of Directors adopted the 2013 Stock Option and Incentive Plan (the “2013 Plan”), which was subsequently approved by the Company’s stockholders. The 2013 Plan became effective as of the closing of the Company’s initial public offering. To the extent that any awards outstanding under the 2003 Plan are forfeited or lapse unexercised subsequent to August 1, 2013, the shares of common stock subject to such awards will become available for issuance under the 2013 Plan. The 2013 Plan provides for annual increases in the number of reserved shares of up to 5% of the outstanding number of shares of the Company’s Common Stock as of the preceding December 31. On January 1, 2015, the number of reserved shares was increased by 1,215,269 shares in accordance with the provisions of the 2013 Plan.
A summary of stock option activity for the years ended December 31, 2012, 2013 and 2014 is presented below:
|
|
|
Shares Subject |
|
Weighted |
|
Weighted |
|
Weighted |
| ||
|
Balance at December 31, 2012 |
|
4,649,238 |
|
|
|
$ |
5.56 |
|
|
| |
|
Granted |
|
480,698 |
|
$ |
10.08 |
|
13.20 |
|
|
| |
|
Exercised |
|
(107,042 |
) |
|
|
4.17 |
|
|
| ||
|
Expired |
|
(27,772 |
) |
|
|
5.79 |
|
|
| ||
|
Forfeited |
|
(89,908 |
) |
|
|
7.14 |
|
|
| ||
|
Balance at December 31, 2013 |
|
4,905,214 |
|
|
|
6.31 |
|
|
| ||
|
Granted |
|
1,592,268 |
|
9.99 |
|
18.00 |
|
|
| ||
|
Exercised |
|
(1,512,514 |
) |
|
|
4.24 |
|
|
| ||
|
Expired |
|
(136 |
) |
|
|
7.40 |
|
|
| ||
|
Forfeited |
|
(133,611 |
) |
|
|
13.77 |
|
|
| ||
|
Balance at December 31, 2014 |
|
4,851,221 |
|
|
|
10.57 |
|
|
| ||
|
|
|
|
|
|
|
|
|
|
| ||
|
Exercisable options at December 31, 2013 |
|
3,285,695 |
|
|
|
4.88 |
|
4.9 |
| ||
|
Vested and expected to vest at December 31, 2013 |
|
4,544,942 |
|
|
|
6.15 |
|
5.9 |
| ||
|
Exercisable options at December 31, 2014 |
|
2,494,711 |
|
|
|
6.33 |
|
5.6 |
| ||
|
Vested and expected to vest at December 31, 2014 |
|
4,615,485 |
|
|
|
10.30 |
|
7.0 |
| ||
The following table summarizes information about stock options outstanding and exercisable at December 31, 2014:
|
|
|
Options Outstanding |
|
Options Exercisable |
| |||||||
|
Range of Exercise Prices |
|
Weighted |
|
Number of |
|
Weighted- |
|
Number of |
|
Weighted- |
| |
|
$0.78 - 1.72 |
|
$ |
1.10 |
|
37,399 |
|
0.8 |
|
37,399 |
|
0.8 |
|
|
1.97 - 3.38 |
|
2.57 |
|
248,746 |
|
1.9 |
|
248,746 |
|
1.9 |
| |
|
3.58 - 6.14 |
|
5.64 |
|
1,570,282 |
|
5.7 |
|
1,416,661 |
|
5.6 |
| |
|
6.34 - 9.94 |
|
8.27 |
|
1,007,227 |
|
7.2 |
|
627,128 |
|
7.1 |
| |
|
11.28 - 16.97 |
|
13.94 |
|
1,180,368 |
|
9.0 |
|
143,901 |
|
6.3 |
| |
|
17.66 - 22.92 |
|
21.00 |
|
807,199 |
|
9.1 |
|
20,876 |
|
8.1 |
| |
|
|
|
|
|
4,851,221 |
|
|
|
2,494,711 |
|
|
| |
For the stock option awards vested during the three and twelve months ended December 31, 2014, the total fair value was $0.8 million and $4.0 million, respectively. The following table summarizes the aggregate intrinsic-value of options exercised, outstanding and exercisable (in thousands):
|
|
|
For the Years Ended and as of |
| |||||||
|
|
|
2012 |
|
2013 |
|
2014 |
| |||
|
Options Exercised |
|
$ |
1,310 |
|
$ |
1,315 |
|
$ |
22,668 |
|
|
Options Exercisable |
|
16,800 |
|
42,116 |
|
22,718 |
| |||
|
Options Vested and Expected to Vest |
|
25,773 |
|
55,099 |
|
27,663 |
| |||
The fair value of each option award is estimated on the date of grant using the Black-Scholes option-pricing model with the following assumptions:
|
|
|
Years Ended December 31, |
| ||||
|
|
|
2012 |
|
2013 |
|
2014 |
|
|
Expected volatility |
|
59 - 63% |
|
56 - 59% |
|
49 - 60% |
|
|
Expected dividends |
|
0% |
|
0% |
|
0% |
|
|
Expected terms (in years) |
|
5.0 - 6.1 |
|
3.3 - 7.2 |
|
1.0 - 6.1 |
|
|
Risk-free rate |
|
0.7 - 1.0% |
|
0.8 - 1.7% |
|
0.3 - 2.0% |
|
Total stock-based compensation expense has been classified as follows in the accompanying statements of operations (in thousands):
|
|
|
Years Ended December 31, |
| |||||||
|
|
|
2012 |
|
2013 |
|
2014 |
| |||
|
Cost of revenue |
|
$ |
78 |
|
$ |
63 |
|
$ |
105 |
|
|
Research and development |
|
704 |
|
1,414 |
|
2,235 |
| |||
|
Sales and marketing |
|
580 |
|
743 |
|
1,110 |
| |||
|
General and administrative |
|
1,507 |
|
1,540 |
|
1,891 |
| |||
|
Total stock-based compensation expense |
|
$ |
2,869 |
|
$ |
3,760 |
|
$ |
5,341 |
|
At December 31, 2014, there was $18.6 million of total unrecognized compensation cost related to non-vested stock option awards that will be recognized over a weighted-average period of 3.1 years.
7. Related Party Transactions
The Company has entered into sales agreements with companies affiliated with certain of its investors. The following table sets forth revenue from product sales to these companies (in thousands):
|
|
|
Years Ended December 31, |
| |||||||
|
|
|
2012 |
|
2013 |
|
2014 |
| |||
|
Company 1 |
|
$ |
2,142 |
|
$ |
2,889 |
|
$ |
4,108 |
|
|
Company 2 |
|
1,290 |
|
950 |
|
682 |
| |||
|
Company 3 |
|
791 |
|
426 |
|
19 |
| |||
|
Company 4 |
|
1,807 |
|
129 |
|
— |
| |||
|
|
|
$ |
6,030 |
|
$ |
4,394 |
|
$ |
4.809 |
|
As of December 31, 2013 and 2014, the Company had accounts receivable from these companies totaling $0.6 million and $1.5 million, respectively. Purchase and payment terms with these related parties are consistent with other non-affiliated companies.
8. Commitments and Contingencies
Operating Leases
The Company leases office and warehouse space under operating leases that expire between 2015 and 2018. The terms of the leases include periods of free rent, options for the Company to extend the leases (three to five years) and increasing rental rates over time. The Company recognizes rental expense under these operating leases on a straight line basis over the lives of the leases and has accrued for rental expense recorded but not paid.
Rental expense was approximately $1.1 million, $1.4 million and $1.8 million for the years ended December 31, 2012, 2013 and 2014, respectively.
Future minimum rental payments required under non-cancelable operating leases with initial or remaining terms in excess of one year consist of the following as of December 31, 2014 (in thousands):
|
2015 |
|
$ |
1,971 |
|
|
2016 |
|
1,887 |
| |
|
2017 |
|
1,655 |
| |
|
2018 |
|
873 |
| |
|
|
|
$ |
6,386 |
|
Purchase Commitments
The Company had non-cancellable purchase commitments for the purchase of inventory, which extend through July 2015 totaling approximately $27.8 million at December 31, 2014.
Indemnification
The Company has agreed to indemnify its officers and directors for certain events or occurrences, while the officer or director is or was serving at the Company’s request in such capacity. The maximum amount of potential future indemnification is unlimited; however, the Company has a director and officer insurance policy that provides corporate reimbursement coverage that limits its exposure and enables it to recover a portion of any future amounts paid. The Company is unable to reasonably estimate the maximum amount that could be payable under these arrangements since these obligations are not capped but are conditional to the unique facts and circumstances involved. Accordingly, the Company has no liabilities recorded for these agreements as of December 31, 2014.
Employment Agreements
The Company has signed employment agreements with certain executive officers who are entitled to receive certain benefits if their employment is terminated by the Company, including severance payments, accelerated vesting of stock options and continuation of certain insurance benefits.
Legal Matters
On August 12, 2014 and September 16, 2014, respectively, the Company received letters from Nokia Corporation alleging that the Company manufactures or supplies products that practice IEEE 802.11 Standards related to wireless technology, and that Nokia is the owner of a portfolio of patents essential to that standard. The Company is conducting an investigation of the claims made by Nokia regarding its patent portfolio. Nokia has not initiated litigation against the Company, but the Company believes that Nokia may do so. The Company intends to defend itself vigorously with respect to this and any other claims or litigation. Since no complaint has been filed and the outcome of any potential legal proceedings related to these claims is uncertain at this time, we cannot estimate the amount of liability, if any, that could result from an adverse resolution of this matter.
The Company establishes reserves for specific liabilities in connection with legal actions that it deems to be probable and estimable. In management’s opinion, the Company is not currently involved in any legal proceedings other than specifically identified above, that individually or in the aggregate, could have a material effect on the Company’s financial condition, operations, or cash flows. Currently, a range of loss associated with any individual material legal proceeding cannot be reasonably estimated.
9. Acquisition
On September 10, 2014, Control4 Corporation (“Control4”), through its wholly owned subsidiary, Control4 EMEA, LTD (“Control4 EMEA”), completed the acquisition of Extra Vegetables Limited, a company incorporated in England and Wales (“Extra Vegetables”), pursuant to a Stock Purchase Agreement dated August 28, 2014, by and among Control4 EMEA and all of the shareholders of Extra Vegetables (the “Purchase Agreement”). Extra Vegetables developed integration modules and third-party device drivers for Control4 and other third-party home automation systems.
Pursuant to the terms of the Purchase Agreement, Control4 EMEA purchased all of the issued and outstanding shares of Extra Vegetables from its shareholders (each a “Selling Shareholder,” and together, the “Selling Shareholders”) and Extra Vegetables became a wholly owned subsidiary of Control4 EMEA. Each Selling Shareholder also agreed to become an employee of Control4 EMEA or Control4. The total consideration transferred was $0.9 million in cash, which included a
base purchase price of $0.7 million and $0.2 million as payment for Extra Vegetables’ net working capital.
Total consideration transferred was allocated to tangible and identifiable intangible assets acquired and liabilities assumed based on their fair values at the acquisition date as set forth below. While, from the acquisition date, the Extra Vegetables products will be provided without charge of a separate fee, the Company believes that the acquisition of Extra Vegetables will strengthen the Company’s interoperability development efforts for the connected home, accelerate the development and time-to-market for essential third-party device drivers, offer more comprehensive technical support, deliver better functionality, and provide more integration opportunities, while eliminating complexity for the Company’s dealers and distributors managing multiple vendors, licensing, and permission models. Management estimated the fair values of tangible and intangible asset and liabilities in accordance with the applicable accounting guidance for business combinations.
The Company’s allocation of consideration transferred for Extra Vegetables is as follows (in thousands):
|
|
|
Estimated Fair Value |
| |
|
Cash |
|
$ |
265 |
|
|
Other assets acquired |
|
125 |
| |
|
Intangible assets |
|
596 |
| |
|
Goodwill |
|
211 |
| |
|
Total assets acquired |
|
1,197 |
| |
|
Taxes payable |
|
175 |
| |
|
Deferred income tax liability |
|
132 |
| |
|
Other liabilities assumed |
|
8 |
| |
|
Total net assets acquired |
|
$ |
882 |
|
Identifiable Intangible Assets
The Company acquired intangible assets that consisted of developed technology and non-compete agreements, which had estimated fair values of $574,000 and $22,000, respectively. The assets were measured at fair value reflecting the highest and best use of nonfinancial assets in combination with other assets and liabilities using an income approach that discounts expected future cash flows to present value. The estimated net cash flows were discounted using a discount rate of 22%, which is based on the estimated internal rate of return for the acquisition and represents the rate that market participants might use to value the intangible assets. The projected cash flows were determined using key assumptions such as: estimates of revenues and operating profits; the time and resources needed to recreate integration modules and drivers; the life of the product; and associated risks related to viability and product alternatives. The Company will amortize the intangible assets on a straight-line basis over their estimated useful lives of four years for developed technology and two years for non-competition agreements. These intangible assets are not deductible for income tax purposes.
Goodwill
Goodwill of $211,000 represents the excess of consideration transferred over the fair value of assets acquired and liabilities assumed and is attributable to Extra Vegetables’ assembled workforce as well as the benefits expected from combining the Company’s research and engineering operations with Extra Vegetables’. This goodwill is not deductible for income tax purposes.
Other
From the date of acquisition through December 31, 2014, the Company recorded revenue and net income associated with Extra Vegetables of approximately $17,500 and $21,900, respectively. Additionally, the Company incurred approximately $80,000 in total acquisition-related costs accounted for in general and administrative expenses.
Pro Forma Information
The unaudited pro forma information presented below includes the effects of the Extra Vegetables acquisition as if it had been consummated as of January 1, 2013, with adjustments to give effect to pro forma events that are directly attributable to the acquisition, including adjustments related to the amortization of acquired intangible assets. The unaudited pro forma information does not reflect any operating efficiency or potential cost savings, which may result from the consolidation of Extra Vegetables. Accordingly, the unaudited pro forma information is presented for informational purposes only and is not necessarily indicative of what the actual results of the combined company would have been if the acquisition had occurred at the beginning of the period presented, nor is it indicative of the future results of operations. In fact, the Company plans to
provide the Extra Vegetables products in Control4’s driver database and make them freely available to Control4 dealers through the Company’s installation software; therefore, the Company will not generate any direct, stand-alone product revenue from the Extra Vegetables technology in future periods.
|
|
|
Years Ended |
| ||||
|
|
|
December 31, |
| ||||
|
|
|
2013 |
|
2014 |
| ||
|
|
|
(in thousands) |
| ||||
|
Revenue |
|
$ |
129,794 |
|
$ |
149,898 |
|
|
Income from operations |
|
5,753 |
|
9,576 |
| ||
|
Net income |
|
$ |
4,128 |
|
$ |
8,724 |
|
|
Net income per share, basic |
|
$ |
0.39 |
|
$ |
0.37 |
|
|
Net income per share, diluted |
|
$ |
0.19 |
|
$ |
0.34 |
|
10. Goodwill and Intangible Assets
Goodwill
Changes in the carrying amount of goodwill consisted of the following (in thousands):
|
|
|
Amount |
| |
|
Balance at December 31, 2013 |
|
$ |
— |
|
|
Current period acquisitions |
|
231 |
| |
|
Balance at December 31, 2014 |
|
$ |
231 |
|
For a discussion of the significant changes in goodwill, see Note 9. The Company’s goodwill is not deductible for income tax purposes.
Intangible assets
The Company’s intangible assets and related accumulated amortization consisted of the following as of December 31, 2013 and December 31, 2014 (in thousands):
|
|
|
December 31, 2013 |
| |||||||
|
|
|
Gross Carrying |
|
Accumulated |
|
Net |
| |||
|
Developed technology |
|
$ |
1,647 |
|
$ |
(742 |
) |
$ |
905 |
|
|
Non-competition agreements |
|
31 |
|
(8 |
) |
23 |
| |||
|
Total intangible assets |
|
$ |
1,678 |
|
$ |
(750 |
) |
$ |
928 |
|
|
|
|
December 31, 2014 |
| |||||||
|
|
|
Gross Carrying |
|
Accumulated |
|
Net |
| |||
|
Developed technology |
|
$ |
2,597 |
|
$ |
(1,214 |
) |
$ |
1,383 |
|
|
Non-competition agreements |
|
53 |
|
(27 |
) |
26 |
| |||
|
Total intangible assets |
|
$ |
2,650 |
|
$ |
(1,241 |
) |
$ |
1,409 |
|
For a discussion of the significant changes in intangible assets, see Note 9. The weighted average amortization period is 4.4 years for developed technology, 2.0 years for non-competition agreements, and 4.3 years in total.
The Company recorded amortization expense during the respective periods for these intangible assets as follows: (in thousands):
|
|
|
Years Ended |
| ||||
|
|
|
December 31, |
| ||||
|
|
|
2013 |
|
2014 |
| ||
|
Amortization of intangible assets |
|
$ |
319 |
|
$ |
491 |
|
Amortization of finite lived intangible assets as of December 31, 2014 is as follows for the next four years (in thousands):
|
|
|
Amount |
| |
|
2015 |
|
$ |
612 |
|
|
2016 |
|
418 |
| |
|
2017 |
|
237 |
| |
|
2018 |
|
142 |
| |
|
|
|
$ |
1,409 |
|
11. Subsequent Event
On January 30, 2015, Control4 Corporation (“Control4”), through its wholly owned subsidiary, Control4 Australia Holdings Pty., Ltd (“Control4 Australia”), completed the acquisition of Nexus Technologies Pty., Ltd. (“Nexus”), an Australia-based provider of audio/video distribution products (under the brand of “Leaf”), pursuant to a Share Sale Agreement dated January 30, 2015, by and among Control4 Australia and all of the shareholders of Nexus. Control4 had previously sold select Leaf products to its North American dealer network. Through this acquisition, Control4 is now in a better position to offer the complete array of Leaf products to Control4 distribution partners throughout the world, gain market share in the growing A/V category, and leverage Leaf’s valuable engineering expertise to develop new and innovative A/V entertainment solutions.
Pursuant to the terms of the Share Sale Agreement, Control4 Australia purchased all of the issued and outstanding shares of Nexus from its shareholders and Nexus became a wholly owned subsidiary of Control4 Australia. The total consideration transferred was $9.0 million in cash, subject to final adjustment for certain working capital calculations. In addition, the Company paid a commission of $0.5 million to an agent. The Company determined the Nexus acquisition to be an immaterial transaction under Rule 3-05 of Regulation S-X.
The Company is in the process of determining the fair values of the net assets acquired and will include Nexus’ results of operations in its financial statements with effect from the purchase date. Due to the timing of the acquisition, it is not currently practicable to include any preliminary disclosures of estimated fair values or pro forma information.
ITEM 9. Changes in and Disagreements with Accountants on Accounting and Financial Disclosure
None.
ITEM 9A. Controls and Procedures
Evaluation of Disclosure Controls and Procedures
Our management, with the participation of our Chief Executive Officer and Chief Financial Officer, has evaluated the effectiveness of our disclosure controls and procedures (as defined in Rules 13a-15(e) and 15d-15(e) under the Securities Exchange Act of 1934, as amended (the “Exchange Act”)), as of the end of the period covered by this Form 10-K. Based on such evaluation, our Chief Executive Officer and Chief Financial Officer have concluded that as of such date, our disclosure controls and procedures were effective.
Changes in Internal Control over Financial Reporting
There were no changes in our internal control over financial reporting during our most recent fiscal quarter that have materially affected, or are reasonably likely to materially affect, our internal control over financial reporting.
Inherent Limitations of Internal Controls
Our management, including our Chief Executive Officer and Chief Financial Officer, does not expect that our disclosure controls and procedures or our internal controls will prevent all error and all fraud. A control system, no matter how well conceived and operated, can provide only reasonable, not absolute, assurance that the objectives of the control system are met. Because of the inherent limitations in all control systems, no evaluation of controls can provide absolute assurance that all control issues and instances of fraud, if any, within the Company have been detected. These inherent limitations include the realities that judgments in decision-making can be faulty, and that breakdowns can occur because of a simple error or mistake. Additionally, controls can be circumvented by the individual acts of some persons, by collusion of two or more people, or by management override of the control. The design of any system of controls also is based in part upon certain assumptions about the likelihood of future events, and there can be no assurance that any design will succeed in achieving its stated goals under all potential future conditions. Over time, controls may become inadequate because of changes in conditions, or the degree of compliance with the policies or procedures may deteriorate. Because of the inherent limitations in a cost-effective control system, misstatements due to error or fraud may occur and not be detected.
Management’s Report on Internal Control over Financial Reporting
Our management is responsible for establishing and maintaining adequate internal control over financial reporting (as defined by Rule 13a-15(f) of the Exchange Act). In assessing the effectiveness of our internal control over financial reporting as of December 31, 2014, our management used the criteria set forth by the Committee of Sponsoring Organizations of the Treadway Commission (2013 framework).
Based on this assessment, management has concluded that our internal control over financial reporting was effective as of December 31, 2014, to provide reasonable assurance regarding the reliability of financial reporting and the preparation of consolidated financial statements for external reporting purposes in accordance with U.S. generally accepted accounting principles.
This Annual Report on Form 10-K does not include an attestation report of our independent registered public accounting firm regarding internal control over financial reporting. Management’s report was not subject to attestation by our independent registered public accounting firm pursuant to an exemption under Section 989G of the Dodd-Frank Wall Street Reform and Consumer Protection Act.
None.
We are incorporating by reference the information required by Part III of this Form 10-K from our proxy statement relating to our 2015 annual meeting of stockholders (the “2015 Proxy Statement”), which will be filed with the SEC within 120 days after the end of the fiscal year to which this report relates.
ITEM 10. Directors, Executive Officers and Corporate Governance
The information required by this Item will be contained in the 2015 Proxy Statement and is incorporated herein by reference.
ITEM 11. Executive Compensation
The information required by this Item will be contained in the 2015 Proxy Statement and is incorporated herein by reference.
ITEM 12. Security Ownership of Certain Beneficial Owners and Management and Related Stockholder Matters
The information required by this Item will be contained in the 2015 Proxy Statement and is incorporated herein by reference.
ITEM 13. Certain Relationships and Related Transactions and Director Independence
The information required by this Item will be contained in the 2015 Proxy Statement and is incorporated herein by reference.
ITEM 14. Principal Accountant Fees and Service
The information required by this Item will be contained in the 2015 Proxy Statement and is incorporated herein by reference.
ITEM 15. Exhibits, Consolidated Financial Statements and Financial Statement Schedules
(a) Documents filed as part of this report:
1. Consolidated Financial Statements. We have filed the consolidated financial statements listed in the index to Consolidated Financial Statements, Schedules and Exhibits in Part II, Item 8, of this Annual Report on Form 10-K.
2. Financial Statement Schedules and Other. All financial statement schedules have been omitted because they are not applicable, not material or the required information is shown in the consolidated financial statements or the notes thereto.
3. Exhibits. The exhibits listed below are filed or incorporated by reference as part of this Annual Report on Form 10-K.
(b) Exhibits:
|
Exhibit |
|
Description of Exhibits |
|
Incorporated by |
|
Incorporated by |
|
Date Filed |
|
3.1 |
|
Amended and Restated Certificate of Incorporation of the Registrant. |
|
10-Q |
|
3.1 |
|
August 30, 2013 |
|
3.2 |
|
Amended and Restated Bylaws of the Registrant. |
|
S-1 |
|
3.4 |
|
July 1, 2013 |
|
4.1 |
|
Specimen Common Stock Certificate of the Registrant. |
|
S-1/A |
|
4.1 |
|
July 18, 2013 |
|
4.2 |
|
Eighth Amended and Restated Investors’ Rights Agreement, dated January 21, 2011. |
|
S-1 |
|
4.2 |
|
July 1, 2013 |
|
4.3 |
|
Warrant to Purchase Stock of the Registrant issued to Silicon Valley Bank, dated December 29, 2005. |
|
S-1 |
|
4.4 |
|
July 1, 2013 |
|
4.4 |
|
Warrant to Purchase Stock of the Registrant issued to Silicon Valley Bank, dated June 13, 2007. |
|
S-1 |
|
4.5 |
|
July 1, 2013 |
|
10.1 |
|
Form of Director and Executive Officer Indemnification Agreement. |
|
S-1 |
|
10.1 |
|
July 1, 2013 |
|
10.2 |
|
2003 Equity Incentive Plan and forms of award agreements thereunder. |
|
S-1 |
|
10.2 |
|
July 1, 2013 |
|
10.3 |
|
2013 Stock Option and Incentive Plan and forms of award agreements thereunder. |
|
S-1 |
|
10.3 |
|
July 1, 2013 |
|
10.4 |
|
Offer Letter to Martin Plaehn, dated August 20, 2011. |
|
S-1 |
|
10.4 |
|
July 1, 2013 |
|
10.5 |
|
Employment Agreement, dated July 28, 2003 and as amended on June 17, 2004 and August 3, 2011, between the Registrant and William B. West. |
|
S-1 |
|
10.5 |
|
July 1, 2013 |
|
10.6 |
|
Employment Agreement, dated on or about January 4, 2008, between the Registrant and Dan Strong. |
|
S-1 |
|
10.6 |
|
July 1, 2013 |
|
10.7 |
|
Offer Letter to Jeff Dungan, dated August 1, 2006. |
|
S-1 |
|
10.7 |
|
July 1, 2013 |
|
10.8 |
|
Offer Letter to Eric Anderson, dated June 19, 2012. |
|
S-1 |
|
10.8 |
|
July 1, 2013 |
|
10.9 |
|
Relationship Agreement, dated June 27, 2013, between the Registrant and Sanmina Corporation. |
|
S-1/A |
|
10.9 |
|
July 18, 2013 |
|
10.10 |
|
OEM Supply Agreement: OEM Design, dated December 3, 2010, between the Registrant and Lite-On Electronic Company Ltd. |
|
S-1/A |
|
10.10 |
|
July 18, 2013 |
|
10.11 |
|
Amended and Restated Loan and Security Agreement, dated June 17, 2013, between the Registrant and Silicon Valley Bank. |
|
S-1 |
|
10.11 |
|
July 1, 2013 |
|
Exhibit |
|
Description of Exhibits |
|
Incorporated by |
|
Incorporated by |
|
Date Filed |
|
10.12 |
|
Lease dated June 29, 2004 by and between the Registrant and WDCI, Inc., as amended on May 24, 2006, February 25, 2011 and November 7, 2011. |
|
S-1 |
|
10.12 |
|
July 1, 2013 |
|
10.13 |
|
Advisor Agreement, effective as of February 28, 2013, by and between the registrant and Tom Kuhn. |
|
S-1 |
|
10.13 |
|
July 1, 2013 |
|
10.14 |
|
Severance Agreement by and between William B. West and Control4 Corporation, dated as of December 21, 2013 |
|
8-K |
|
10.1 |
|
December 23, 2013 |
|
21.1 |
|
List of Subsidiaries of the Registrant. |
|
Filed herewith |
|
|
|
|
|
23.1 |
|
Consent of Ernst & Young LLP, Independent Registered Public Accounting Firm. |
|
Filed herewith |
|
|
|
|
|
31.1 |
|
Certification of the Chief Executive Officer pursuant to Section 302 of the Sarbanes-Oxley Act. |
|
Filed herewith |
|
|
|
|
|
31.2 |
|
Certification of the Chief Financial Officer pursuant to Section 302 of the Sarbanes-Oxley Act. |
|
Filed herewith |
|
|
|
|
|
32.1* |
|
Certification of the Chief Executive Officer and the Chief Financial Officer pursuant to Section 906 of the Sarbanes-Oxley Act. |
|
Furnished herewith |
|
|
|
|
|
101.INS |
|
XBRL Instance Document |
|
Filed herewith |
|
|
|
|
|
101.SCH |
|
XBRL Taxonomy Extension Schema Document |
|
Filed herewith |
|
|
|
|
|
101.CAL |
|
XBRL Taxonomy Extension Calculation Linkbase Document |
|
Filed herewith |
|
|
|
|
|
101.DEF |
|
XBRL Taxonomy Extension Definition Linkbase Document |
|
Filed herewith |
|
|
|
|
|
101.LAB |
|
XBRL Taxonomy Extension Label Linkbase Document |
|
Filed herewith |
|
|
|
|
|
101.PRE |
|
XBRL Taxonomy Extension Presentation Linkbase Document |
|
Filed herewith |
|
|
|
|
* The certifications furnished in Exhibit 32.1 hereto are deemed to accompany this Annual Report on Form 10-K and will not be deemed “filed” for purposes of Section 18 of the Securities Exchange Act of 1934, as amended, except to the extent that the Registrant specifically incorporates it by reference.
Pursuant to the requirements of the Section 13 or 15(d) of Securities Exchange Act of 1934, the registrant has duly caused this report to be signed on its behalf by the undersigned thereunto duly authorized.
|
Date: February 20, 2015 |
CONTROL4 CORPORATION | |
|
|
By: |
/s/ DAN STRONG |
|
|
|
Dan Strong |
|
|
|
Chief Financial Officer |
|
|
|
(Principal Financial and Accounting Officer) |
Pursuant to the requirements of the Securities Exchange Act of 1934, this report has been signed below by the following persons on behalf of the Registrant and in the capacities indicated on February 20, 2015.
|
Signature |
|
Title |
|
|
|
|
|
/s/ MARTIN PLAEHN |
|
President, Chairman and Chief Executive Officer (Principal |
|
Martin Plaehn |
|
Executive Officer) |
|
|
|
|
|
/s/ DAN STRONG |
|
Chief Financial Officer (Principal Financial and Accounting |
|
Dan Strong |
|
Officer) |
|
|
|
|
|
/s/ ROB BORN |
|
Director |
|
Rob Born |
| |
|
|
|
|
|
/s/ JAMES CAUDILL |
|
Director |
|
James Caudill |
| |
|
|
|
|
|
/s/ DAVID C. HABIGER |
|
Director |
|
David C. Habiger |
| |
|
|
|
|
|
/s/ JEREMY JAECH |
|
Director |
|
Jeremy Jaech |
| |
|
|
|
|
|
/s/ LEN JORDAN |
|
Director |
|
Len Jordan |
| |
|
|
|
|
|
/s/ CHRISTOPHER B. PAISLEY |
|
Director |
|
Christopher B. Paisley |
| |
|
|
|
|
|
/s/ STEVEN VASSALLO |
|
Director |
|
Steven Vassallo |
|