Attached files
| file | filename |
|---|---|
| EX-32.02 - EXHIBIT 32.02 - Rovi Corp | rovi12311410kex3202.htm |
| EX-31.02 - EXHIBIT 31.02 - Rovi Corp | rovi12311410kex3102.htm |
| EX-23.01 - EXHIBIT 23.01 - Rovi Corp | rovi12311410kex2301.htm |
| EX-33.01 - EXHIBIT 33.01 - Rovi Corp | rovi12311410kex3101.htm |
| EX-21.01 - EXHIBIT 21.01 - Rovi Corp | rovi12311410kex2101.htm |
| EXCEL - IDEA: XBRL DOCUMENT - Rovi Corp | Financial_Report.xls |
| EX-32.01 - EXHIBIT 32.01 - Rovi Corp | rovi12311410kex3201.htm |
UNITED STATES
SECURITIES AND EXCHANGE COMMISSION
Washington, D.C. 20549
_____________________________________________________________
FORM 10-K
(Mark One)
x | ANNUAL REPORT PURSUANT TO SECTION 13 OR 15(d) OF THE SECURITIES EXCHANGE ACT OF 1934 |
For the fiscal year ended December 31, 2014
or
o | TRANSITION REPORT PURSUANT TO SECTION 13 OR 15(d) OF THE SECURITIES EXCHANGE ACT OF 1934 |
For the transition period from to
Commission file number: 000-53413
Rovi Corporation
(Exact name of registrant as specified in its charter)
Delaware | 26-1739297 | |
(State or other jurisdiction of incorporation or organization) | (I.R.S. Employer Identification No.) | |
2830 De La Cruz Boulevard | ||
Santa Clara, CA | ||
95050 | ||
(Address of principal executive offices) | ||
(Zip Code) | ||
Registrant's telephone number, including area code:
(408) 562-8400
Securities registered pursuant to Section 12(b) of the Act:
Title of Each Class | Name of Exchange on Which Registered | |
Common Stock, $0.001 Par Value | The NASDAQ Global Select Market | |
Securities registered pursuant to Section 12(g) of the Act: None
Indicate by check mark if the registrant is a well-known seasoned issuer, as defined in Rule 405 of the Securities Act. Yes o No þ
Indicate by check mark if the registrant is not required to file reports pursuant to Section 13 or Section 15(d) of the Securities Act. Yes o No þ
Indicate by check mark whether the registrant (1) has filed all reports required to be filed by Section 13 or 15(d) of the Securities Exchange Act of 1934 during the preceding 12 months (or for such shorter period that the registrant was required to file such reports), and (2) has been subject to such filing requirements for the past 90 days. Yes ý No ¨
Indicate by check mark whether the registrant has submitted electronically and posted on its corporate Web site, if any, every Interactive Data File required to be submitted and posted pursuant to Rule 405 of Regulation S-T during the preceding 12 months (or for such shorter period that the registrant was required to submit and post such files). Yes ý No ¨
Indicate by check mark if disclosure of delinquent filers pursuant to Item 405 of Regulation S-K is not contained herein, and will not be contained, to the best of the registrant's knowledge, in definitive proxy or information statements incorporated by reference in Part III of this Form 10-K or any amendment to this Form 10-K. þ
Indicate by check mark whether the registrant is a large accelerated filer, an accelerated filer, a non-accelerated filer, or a smaller reporting company. See definitions of “large accelerated filer,” “accelerated filer,” and “smaller reporting company” in Rule 12b-2 of the Exchange Act:
Large accelerated filer þ | Accelerated filer o | Non-accelerated filer o | Smaller reporting company o | |
Indicate by check mark whether the registrant is a shell company (as defined in Rule 12b-2 of the Exchange Act). Yes ¨ No ý
The aggregate market value of voting and non-voting common equity held by non-affiliates of the Registrant was approximately $1.2 billion as of June 30, 2014, based upon the closing price on the NASDAQ Global Select Market reported for such date. This calculation does not reflect a determination that certain persons are affiliates of the Registrant for any other purpose. The number of shares outstanding of the Registrant's Common Stock on February 13, 2015, was 91,939,167 shares.
DOCUMENTS INCORPORATED BY REFERENCE
Portions of the registrant’s definitive Proxy Statement related to the 2015 Annual Meeting of Stockholders, to be filed with the Securities and Exchange Commission within 120 days after December 31, 2014, are incorporated by reference into Part III of this Form 10-K.
INDEX
PART I | ||
ITEM 1. | ||
ITEM 1A. | ||
ITEM 1B. | ||
ITEM 2. | ||
ITEM 3. | ||
ITEM 4. | ||
PART II | ||
ITEM 5. | ||
ITEM 6. | ||
ITEM 7. | ||
ITEM 7A. | ||
ITEM 8. | ||
ITEM 9. | ||
ITEM 9A. | ||
ITEM 9B. | ||
PART III | ||
ITEM 10. | ||
ITEM 11. | ||
ITEM 12. | ||
ITEM 13. | ||
ITEM 14. | ||
PART IV | ||
ITEM 15. | ||
i
Discussions of some of the matters contained in this Annual Report on Form 10-K for Rovi Corporation (the “Company,” “we” or “us”) may constitute forward-looking statements within the meaning of the Section 27A of the Securities Act of 1933, as amended, and Section 21E of the Securities and Exchange Act of 1934, as amended, and as such, may involve risks and uncertainties. Some of these discussions are contained under the captions “Item 1. Business” and “Item 7. Management’s Discussion and Analysis of Financial Condition and Results of Operations.” We have based these forward-looking statements on our current expectations and projections about future events or future financial performance, which include implementing our business strategy, developing and introducing new technologies, obtaining, maintaining and expanding market acceptance of the technologies we offer, and competition in our markets.
In some cases, you can identify these forward-looking statements by terminology such as “may,” “will,” “should,” “expect,” “plan,” “anticipate,” “believe,” “estimate,” “future,” “predict,” “potential,” “intend,” or “continue,” and similar expressions. These statements are based on the beliefs and assumptions of our management and on information currently available to our management. Our actual results, performance and achievements may differ materially from the results, performance and achievements expressed or implied in such forward-looking statements. For a discussion of some of the factors that might cause such a difference, see “Item 1A. – Risk Factors” and elsewhere in this Form 10-K. Except as required by law, we specifically disclaim any obligation to update such forward-looking statements.
PART I
ITEM 1. BUSINESS
Overview
We are focused on powering content discovery and personalization through our technology and intellectual property, using data and analytics to monetize interactions across multiple entertainment platforms. We provide a broad set of integrated solutions that are embedded in our customers' products and services, connecting consumers with entertainment. Content discovery solutions include interactive program guides (“IPGs”), search and recommendations, cloud data services and our extensive database of "Metadata" (i.e. descriptive information, promotional images or other content that describe or relate to television shows, videos, movies, music, books, games or other entertainment content). We also offer advertising and analytics services. Our advertising services are primarily sold in guides we provide or where a service provider allows us to sell advertising. Our analytics services use our proprietary data and data we acquire to offer service providers, networks and advertisers the opportunity to optimize their television advertising and promotional efforts. In addition to offering IPGs developed by us, our customers may also license our patents and deploy their own IPG or a third party IPG. We have patented many aspects of content discovery, Digital Video Recording (“DVR”), Video on Demand (“VOD”), Over-The-Top experiences (“OTT”) and multi-screen functionality, as well as interactive applications and advertising. We have historically licensed this portfolio for use with linear television broadcast. However, there is an emerging industry transition to Internet platform technologies which is enabling new video services for television in homes, as well as on multiple screens such as tablets, computers, game consoles and smartphones. We believe this transition presents new opportunities to license our intellectual property portfolio for different use cases and to different customers, as well as to develop, market and sell products and services which enable such functionality. Building upon this, we are establishing broad industry relationships with the companies leading the next generation of digital entertainment. Our strategy includes developing products and services that complement our intellectual property and address the opportunity presented by this industry transformation. Our solutions are deployed globally in the cable, satellite, consumer electronics, entertainment, media and online distribution markets.
Industry Background
The entertainment media market is continuing its transformation. Content has moved from analog to digital, distribution has continued to shift from physical to online and now access to content and the overall entertainment experience is becoming distributed across many screens such as televisions, computers, tablets and smartphones. This dramatic shift is impacting virtually every area of the entertainment value chain, from content creation and aggregation, to discovery and monetization. The expansion of network bandwidth, explosion of connected devices and increased availability of digital content, along with the increased mobility provided by tablets and smartphones are all helping to accelerate this market shift. As part of this change, consumers are demanding higher-quality content experiences. They want to personalize how they can easily discover and access content (movies, music, photos and programming) and enjoy it when and where they want.
No matter what content consumers are enjoying, we believe video content such as movies and TV shows remain at the center of consumers' entertainment desires. New devices and services are continually being created that bring video content to consumers. Many consumers purchased large high definition televisions (“HDTVs”) to maximize video enjoyment in the home. Additionally, many consumers are investing in new devices such as tablets and smartphones, which is shifting their entertainment experience across devices both inside and outside of the home. These new devices require the ability to provide
3
information identifying what is available to the viewer in broadcast television (TV listings), through VOD or delivered OTT by Internet Protocol. We refer to providing this information as “guidance.” Guidance becomes more complex as more sources of entertainment become available to consumers. Beyond existing Pay-TV options, consumers can now download or stream Internet-based content to their media devices, accessed via subscription, pay-per-view or advertising supported business models. In addition, the current home media device infrastructure can be very complex. Setting up such an environment generally requires integrating numerous devices, a deep understanding of the interoperability of media formats and creation of mechanisms for managing and enjoying content. Simplifying the consumer experience of this new ecosystem will be critical as the evolution of the market progresses.
The introduction of these new capabilities is impacting every part of the entertainment value chain, from content producers, to distribution channels, advertisers and consumption device manufacturers, causing them each to reevaluate their business models, as well as introducing new competitors at each phase of the value chain. Distribution channels, such as cable and satellite operators, web based service providers, retailers, and others are all seeking ways to best obtain or maintain a competitive advantage in a digital entertainment world. They require highly customizable solutions that personalize and simplify the consumer experience, such as additional data about the entertainment content, or additional guidance technology, while still allowing the distribution channel to retain its unique identity. They are also seeking to increase their interaction with the consumer and create new revenue opportunities. This includes having not just a physical and web presence, but also providing media digitally on just about any device the consumer may choose to use. This requires substantial investment in technology infrastructure to augment their current businesses. One area where this is most prevalent is in cable and satellite where a broad drive towards enabling subscribers to enjoy content wherever they are located on whatever device they desire, which we refer to as "TV Everywhere", is resulting in costly moves from legacy distribution technology to Internet Protocol based infrastructure to deliver Pay TV services. Additionally, content producers are exploring new forms of distribution to protect or advance their position in the distribution and windowing chain, which includes experimenting with direct to consumer models and new forms of content licensing, such as exclusive downloads, subscription to a studio's portfolio, or making a streamed or downloaded movie available for purchase simultaneous with the home video distribution window. All of this results in increased competition for distributors, leading to their need to create unique distribution arrangements and to integrate with many other companies to reach consumers.
The markets for consumer electronics (“CE”) manufacturers are also in flux. Global economic trends and increased competition have challenged much of the traditional CE device market, driving lower margins while consumer requirements for features and services have increased. Consumers are demanding capabilities to interact with broad ranges of media, such as over-the-top video, not just viewing content that is broadcast to TV and set-top box devices. Increased functionality requires extensive software to be embedded into these devices and much higher costs to manufacturers to support and maintain devices for years after the initial sale to a consumer. These new requirements may not be a core competency for CE manufacturers adding to the challenge of meeting consumer desires. New types of devices such as tablets are also competing for consumers' spending as consumers become more comfortable with new ways of enjoying their entertainment. CE manufacturers also desire an ongoing revenue relationship with their customers, not just to sell them a new device every few years. This leads to a demand for add-on services and advertising that allow the CE manufacturer to monetize and profit from the ongoing distribution or maintenance of entertainment content over the life of a device.
As traditional media changes, the opportunities for advertisers evolve as well. Currently advertisers spend more heavily on television commercials than any other form of advertising. As television viewership has become more fragmented, advertisers have sought new ways to reach consumers. Advertisers are now experimenting across the many devices and applications consumers use to access digital media. Additionally, the growth of web advertising has increased the criteria advertisers use to evaluate successful advertising, adding metrics such as personalization and guaranteed views. Consumption data, audience measurement and other analytics data that bridge a consumer's entertainment across many devices and services are emerging to drive advertising value outside of traditional television advertising.
Rovi's Markets
We report our operations in two segments: (i) Intellectual Property Licensing and (2) Products. See Note 15 to the Consolidated Financial Statements for information related to our revenue and long-lived assets by geographic areas.
Intellectual Property Licensing
Our Intellectual Property Licensing Segment generated 53%, 55% and 52% of our revenue from continuing operations in 2014, 2013 and 2012, respectively.
Our patent portfolio provides the foundation for our intellectual property licensing business and includes over 5,000 issued patents and pending applications. Through ongoing investment, targeted acquisitions and strategic portfolio
4
management, our patent portfolio has continued to grow in size and relevance. We generate substantially all of our intellectual property licensing revenue from our discovery patent portfolio, which represents approximately 77% of our total patents. Over the last 10 years, our US discovery patent portfolio has more than doubled in size and the quantity of US discovery issued patents has more than tripled in size. The scope and relevance of our discovery patent portfolio has also grown over this period as IPG functionality has increased. An IPG is an interactive listing of television or video program information that enables viewers to navigate through, sort, select and schedule video programming for viewing and recording. We believe that interactive video guidance technology is a necessary tool for television viewers bombarded with an increasing amount of available content and an increasing number of digital cable and satellite television channels, VOD services, and Internet Protocol enabled services. The IPG is evolving from a guide for linear television content, to a guide for all the digital content to which consumers have access to in and out of the home across the multiple devices they use. Our discovery patent portfolio includes important coverage and protection for key features and functionality across guidance, search and recommendations, digital video recorders, VOD, OTT video, second screen offerings and various interactive television applications. Our ongoing innovation efforts are intended to ensure that our patent portfolio continues to provide long-term protection across these key areas of discovery. Our discovery portfolio's patents have expiration dates that range from 2015 to 2033.
Traditional Pay TV service providers generally pay us a monthly per subscriber fee and have historically licensed our discovery patent portfolio for the television use case. As TV Everywhere initiatives are becoming more prevalent with service providers, we are sometimes entering into a second license with our service provider customers to cover the TV Everywhere use case. Service providers in the online and OTT space generally pay us a flat fee to license our patents for a specified time period. Our agreements with our CE licensees generally allow them to incorporate our discovery patents in specified products, in certain territories, provided we receive license fees based on the number of units produced and shipped that utilize our patents. Our agreements with the major CE manufacturers generally allow them to ship an unlimited number of units utilizing our discovery patents, provided they pay us a specified flat fee. We generally do not receive a license fee from CE manufacturers for set-top boxes deployed by a cable or satellite provider where that provider has also licensed our discovery portfolio. Service providers and CE manufacturers who have a patent license from us are not required to provide advertising in their IPG. However, our agreements with domestic service providers generally require the sharing of advertising revenue if IPG advertising is integrated.
Our service provider intellectual property licensees include British Sky Broadcasting Group, Canal+, Comcast Corporation (“Comcast”), Cox Communications, Cablevision, DirecTV, EchoStar Communications, Google, Hulu, Foxtel, Sky Italia, Time Warner Cable, UPC, Verizon, Vudu and others. We also have license agreements with third party IPG providers such as Cisco and others. As of December 31, 2014, approximately 160 million Pay TV subscribers worldwide are estimated to be receiving a licensed IPG, including approximately 59 million internationally. Our CE intellectual property licensees include Apple, LG, Panasonic, Samsung, Sony and other brands.
Products
Our Product Segment generated 47%, 45% and 48% of our revenue from continuing operations in 2014, 2013 and 2012, respectively.
Service Provider IPGs
Our service provider IPGs allow our customers to customize certain elements of the IPGs for their customers and also allow these providers to upgrade, over time, the features and services they can offer to their customers. Our IPGs are compatible with service providers' subscription management, pay-per-view (“PPV”) and VOD services. Our IPGs allow service providers to provide their viewers with current and future program information. We also offer operational support, professional services and data. Our IPGs also have the ability to include advertising. When advertising is provided we typically share a portion of the advertising revenue with the service provider. We currently offer IPGs marketed to service providers under the i-Guide and Passport brands in the in the United States, Canada and Latin America.
Our xD guide is a discovery application that extends the cable video experience from set-top boxes to multiple mobile screens, including tablets and smartphones. Designed for seamless operation with Rovi's i-Guide and Passport, xD makes extensive use of Rovi Cloud Services, such as video and celebrity data, search and recommendations, user profile management, and advertising services. xD has the flexibility to connect to a variety of mobile video content sources, increasing the flexibility for pay TV operators to extend and expand their available services to multiple web and mobile devices. With xD, consumers can also use their devices to set DVR recordings and tune to content.
We also offer the Rovi DTA Guide. As cable operators continue to introduce high definition channels and plan for future services, placing digital terminal adapters (“DTAs”) in cable homes has become an important step to cost effectively enable additional TV services in the home by supporting cable operators' efforts to remove analog channels in order to reclaim bandwidth. The Rovi DTA Guide includes such features as TV listing by time, program information, parental controls and
5
more, but has a less extensive feature set than iGuide or Passport. DTAs also serve as a low cost alternative to traditional set-top boxes, with appeal in low cost markets such as Latin America.
In October 2014, we acquired Fanhattan, Inc., and its cloud-based Fan TV branded products. Fan TV combines live TV, video on demand and streaming services in a unified entertainment discovery experience. With a simple, button-less touch remote, cable subscribers can swipe, tap and explore from their couches as if touching the TV screen. Users can choose movies or shows and instantly see where and when they can watch it - whether on live TV, video on demand or a streaming service. They can also create personalized WatchLists to track programming favorites from multiple devices (mobile, Web or TV) and receive alerts when and where those movies and shows are available to watch - in theaters, across streaming services or on TV. Our Fan TV product is currently available for purchase by Time Warner Cable subscribers, or as a smart phone application.
Service providers generally pay us a monthly per subscriber fee to license our IPGs. Our service provider customers include America Movil, Charter, Cogeco, Cox Communications, Mediacom, Shaw Communications and others. As of December 31, 2014, approximately 11.4 million U.S. Pay TV subscribers and 6.9 million Canadian and Latin American Pay TV subscribers are estimated to be receiving a Rovi-provided IPG.
CE IPGs
We offer multiple IPGs to the CE industry, including those marketed under the G-GUIDE brand in Japan and our HTML Guide in Europe and North America. These IPGs are generally incorporated into mid- to high-end flat panel televisions and Blu-ray or DVR hard drive recorder based products. Our IPGs generally deliver continuously updated multi-day program listings to users. We use a variety of terrestrial, satellite and broadband Internet transmission means to deliver listings data to our IPGs. For our HTML Guide product line we have moved from embedding our software technology into the CE device, to using web standards such as HTML and JavaScript to deliver similar functionality using our Rovi Cloud Services. This shift in technology makes our CE products easier to deploy and more compatible with the application architectures of today's connected televisions.
Our CE IPG licensees include devices distributed under the Panasonic, Samsung, Sony and other brands. Generally, our agreements enable our licensees to incorporate our CE IPG technology in specified products, in certain territories, provided we receive license fees based on the number of units produced and shipped that incorporate our technology or utilize our patents. Our agreements with the major CE manufacturers generally allow them to ship an unlimited number of units incorporating our CE IPG technology, provided they pay us a specified flat fee.
In Japan, Interactive Program Guide Inc. (“IPG JV”), our joint venture with Dentsu Inc. and Tokyo News Service Limited, is the exclusive provider of program listings and advertising for our IPGs marketed under the G-Guide brand. We own 46% of IPG JV and have certain contractual rights with respect to the ongoing management of IPG JV. We also retain the right to license our technology and intellectual property to third parties in Japan who may also receive program listings and advertising from IPG JV, and we retain rights to the revenue from such licenses. We have entered into licensing agreements with CE manufacturers and other third parties for televisions, digital recorders, personal computers and cell phones that are enabled to receive the G-Guide service. We also have a mobile version of G-Guide for iPad, iPhone and Android devices, which can be integrated with G-Guide for an interactive second screen experience. With integrated advertising and program promotions, G-Guide offers a platform for reaching the Japanese consumer audience, which heavily uses mobile devices.
Data Solutions
We offer Metadata pertaining to music, television, movie, book, video games and other entertainment content. In addition, we catalog information on celebrities, awards, sports, and other data necessary to provide a robust set of Metadata. Our database includes unique data on more than 6.5 million programs, including theatrical, DVD and Blu-ray releases, as well as thousands of celebrities. Our database also has information on approximately 3.4 million music albums, 31 million tracks, 10 million books and 79,000 video games. Our data services are operated with systematic processes that are designed for completeness and quality of the data as well as linking the relationships among the data elements. The data services are broken into levels of data: basic data (such as artist, album), navigational data (such as relationships between actor and other movies or television series), and editorial data (such as actor biographies, television, movie or music reviews). We have continued to expand our data to include information from social networks, catalogs of digital providers and other sources.
Additionally, we license the Rovi Cloud Services to customers of our data. They can choose to gain real time access to the data via our Web Services or to incorporate additional functionality such as media search, recommendations (social, editorial, personalized) or enhanced advertising.
We provide resources for various types of media and businesses. Our television and movie data covers over 70 countries including the United States, Latin American countries, Western European countries and Russia among others. We
6
license a number of data and service offerings, including schedules, listings, TV supplements, and Web Services. Our data can be sold stand-alone or as a complement to an IPG.
Customers typically pay us a monthly or quarterly fee for the rights to use the Metadata, receive regular updates and integrate it into their own service. Our Metadata customers include Apple, Best Buy, Barnes and Noble, Comcast, eBay, Facebook, Microsoft, Viacom Media Networks and others.
Rovi Advanced Search and Recommendation Services
Rovi Search Services provides service providers, device manufacturers and developers a way to enable their customers to quickly navigate content with universal, personalized search across video-on-demand, linear, DVR and OTT sources. Powered by our comprehensive, entertainment metadata, our search services allow consumers to query program or movie titles, band or album names, track titles and actor or artist names to find and directly access desired content. Search results can be generated through traditional text entry or through voice recognition and natural language conversation for the ultimate discovery experience.
Rovi Recommendations Services allows service providers, device manufacturers and others a way to offer their customers entertainment choices similar to a chosen program, movie, album, track, musician or band. In addition, with Rovi’s knowledge graph technology, consumers can get personalized recommendations based on their habits and interests. User behavior like social network activity and contextual factors, such as time of day, day of the week and location, can also be used to provide optimal suggestions.
Rovi Search and Recommendations Services are built on the expertise of hundreds of content editors and our Knowledge Graph, which allows us to understand content, users and context and how they work together to enable accurate, personalized discovery.
Rovi Analytics
The Rovi Audience Management Solution is a suite of products combining big data with predictive analytics to provide TV audience insights and advertising campaign management. Those products currently include Ad Optimizer and Promotion Optimizer. With Ad Optimizer, a component of the Rovi Audience Management Solution, TV networks and Pay TV providers can uncover more value from their audiences, increase ad revenue, increase the effectiveness of their ad inventory, and deliver results to help meet advertising campaign goals. Advertising agencies can also use Ad Optimizer to plan effective ad buys. The product combines advanced ad campaign management and media planning functionality into one platform, and features the ability to manage campaigns based on factors such as delivery goals, budget, viewing history and audience demographics. Ad Optimizer is designed to analyze past viewer behaviors and current campaign results to increase the value and performance of ad inventory across linear, VOD and TV Everywhere platforms. The Ad Optimizer can work with programmatic ad scheduling and management systems and is managed through a browser-based dashboard.
Rovi Promotion Optimizer, based on the same platform and predictive analytics capabilities as the Ad Optimizer, provides television networks with advanced campaign management and media planning functionality for building and executing audience-based media plans. By having the capability to use past viewing data from multiple sources, Promotion Optimizer enables television networks to create plans for on-air promotions that are targeted to data driven audience segments.
We also offer applications that provide insight into the habits and preferences of end users, so service providers can advance operational efficiency, improve the customer experience, drive profitability, support carriage and bundling decisions, and help mitigate churn. Using a data warehouse designed to handle TV viewership data, reference data and clickstream events, the analytics engine is able to process raw data from millions of set-top boxes, panels and third-party sources, as well as program, billing and CRM data to further support business goals. Our Operator Insights application enables service providers to unlock the value of their return-path data (RPD). A simple, actionable business intelligence application, Operator Insights transforms raw data into meaningful and useful viewership and usage data that can be explored and analyzed to support marketing, programming and operational initiatives. Our Subscriber Analytics application helps service providers attract and retain customers by identifying which ones are likely to add products and services or churn based on viewing behaviors and subscription information. It uses viewership data and billing records to model and evaluate potential subscriber behaviors, which can help pinpoint cross-sell and up-sell opportunities and focus marketing efforts.
Rovi Advertising Service
In addition to selling advertising on Rovi-provided IPGs, we also work with some service providers to sell or help them market advertising on guides that they have developed which may include packaging their subscriber footprint inventory into the overall inventory that we offer advertisers. Historically, we have primarily sold broadcasters, or their agencies, the opportunity to promote their products via advertisements inserted in IPGs. We offer packages to advertisers to provide them
7
nationwide or targeted advertising on a guide for a period of time. Advertisers place ads through a variety of display formats incorporated into the guide screens. Depending on the IPG deployed, advertisements can display additional text information or video when clicked on via the remote control. Advertisers can target specific audiences by airing advertising at certain times of the day or in specific geographies. We believe conventional advertisers are increasingly aware of the value proposition for advertisements inserted in IPGs and across our overall advertising footprint.
Content Protection
Our analog video content security, commercially known as ACP, has been used to protect billions of videocassettes since 1985 and billions of DVDs since 1997. We license ACP directly to CE manufacturers, and Motion picture studios, as well as semiconductor companies that supply the CE manufacturers.
Motion pictures typically generate significant revenue from the sales of packaged media, primarily DVDs. Any household that owns a DVD-R, personal video recorder (“PVR”), PC, or a media center, is capable of making unauthorized, high-quality digital and analog copies unless that content is properly copy protected against this variety of threats. Our ACP technologies allow consumers to view programming stored on prerecorded videocassettes and DVDs or transmitted as digital pay-per-view or video-on-demand programs via cable or satellite, but deter unauthorized consumer copying of such programming on recordable DVD devices. Motion Picture Association of America (“MPAA”) and independent studios can use our video content security technology to protect movie releases on videocassette or DVD. For the protection to work, ACP must be present on both the media (physical or digital) and the hardware device.
DVD player manufacturers often license our technology for an up-front fee and annual license fee. Digital set-top box and DVR manufacturers license our video content security solutions typically for an up-front fee and a per-unit royalty. Studios generally pay us an annual license fee to use our ACP technology. We have entered into agreements with the majority of the large CE and set-top box manufacturers in which they paid us a one-time fee for a perpetual license to our technology.
Our ACP customers include Scientific Atlanta, Fujitsu Limited, Mitsubishi Electronics, Pace, Panasonic, Pioneer Electronics, Samsung Electronics, Sharp, Sony Electronics, Toshiba, and Paramount Pictures and others.
Rovi's Strategy
We see a changing landscape as content distribution continues to move from a traditional model of a service provider delivering content over their proprietary network to a single class of device (a television), to a multi-device ecosystem where content is delivered over both proprietary networks and the Internet to many types of devices. Through this transition the technologies used for delivering video to consumers is transitioning from the legacy broadcast technologies to Internet Protocol delivery and increasingly will rely largely on web technologies throughout the value chain. We believe opportunities exist in two key areas: Discovery and Monetization. Our strategy is to develop, market and sell technologies, intellectual property, products and services focused on these areas.
Discovery. Finding content remains an important part of the user experience. We believe new discovery experiences that are specific to a person or device, and that integrate live, recorded and online video, second screen experiences and social engagement will be an area of focus and opportunity. We also believe that Metadata, which contains detailed information about programming and other data on consumer’s entertainment interests and media engagement history, will be important in creating highly personalized content discovery experiences.
Monetization. Shifts in the value chain are creating new ways for consumers to gain access to content and new business models are emerging to capture consumer’s spend for entertainment. Monetizing content and experiences across television, Internet and mobile service platforms is becoming more critical as viewership becomes fragmented between many devices such as connected TVs, tablets, mobile phones, computers and game consoles. We are focused on delivering consumer media engagement data and advanced analytics to help service providers reach and retain their subscribers. We are also using this data and insights to enable programmers and advertisers to better target and measure audiences.
Build Upon Key Customer Relationships. We maintain relationships with customers in various industry and market segments, including:
• | Service providers such as the cable, telecommunications and satellite television system and Internet delivered television programming providers. This market segment is our primary strategic focus. |
• | CE manufacturers of digital television, Blu-ray and standard DVD players, CD and DVD drives, PVRs, game consoles, network attached storage devices and digital set-top boxes and other types of devices. |
• | Large online retailers, music services, advertisers and portal websites. |
8
We intend to grow our business by expanding on the technologies that we provide existing customers, and creating new customer relationships as more companies look to address the digital entertainment industry. We continue to expand our patent portfolio and product solutions to address the changing needs of consumer entertainment. We are striving to grow our relationships with existing patent licensees by providing our products and services that can accelerate addressing the emerging needs around discovery and monetization. Furthermore, as more companies look to add media entertainment to their digital lifestyle solutions, we have new opportunities to license the benefits of our patent portfolio.
Introduce New Product Applications and Technologies. We intend to develop additional discovery and monetization products to sell to our extensive customer base. We have committed significant resources to expand our technology base, to enhance our existing products, to introduce additional products, and to participate in industry standard-setting efforts and organizations. We intend to pursue opportunities to improve technologies in our current fields of operations as well as emerging areas we are positioned to address.
Expand and Protect Patent Position. We have built, and continue to add to, a large patent portfolio. The licensing of our portfolio has been a significant part of our business. We believe that our future success partly depends on our ability to continue to introduce proprietary solutions for IPGs, connected devices, data and analytics. We have patented many aspects of these proprietary solutions, such as content discovery, DVR and VOD functionality, multi-screen functionality and interactive applications such as interactive advertising. We also have acquired patents from other industry participants. While historically we have licensed our portfolio for use with linear television broadcasts, the rapid industry transition to internet platform technologies is enabling new video services for television in homes, as well as on mobile devices such as tablets and smartphones. We believe this transition presents new opportunities for us to not only develop, market and sell new products and services to other companies in the digital entertainment industry, but also to license our patent portfolio to them.
Continue to Make Strategic Acquisitions. We plan to continue to expand our technology portfolio and extend our businesses by pursuing licensing arrangements, joint ventures, and strategic acquisitions of companies whose technologies or proprietary rights complement our technologies and strategic goals.
Copyrights, Trademarks, and Tradenames
We own or have rights to various copyrights, trademarks and trade names used in our business. For our continuing business units, these include, but are not limited to, Rovi, FanTV, TV Guide, Passport, RoviGuides, G-GUIDE, iGuide and Gemstar.
Research and Development
Our internal research and development efforts are focused on developing enhancements to existing products and new applications for our current technologies. We have acquired other companies and technologies to supplement our research and development expenditures. Our research and development expenses were $108.7 million for the year ended December 31, 2014 and $111.3 million for the year ended December 31, 2013 and $118.0 million for the year ended December 31, 2012.
Our primary locations for product development are in California (Burbank, Santa Clara and San Mateo), Colorado (Golden), Luxembourg, Massachusetts (Boston), Michigan (Ann Arbor), Pennsylvania (Wayne) and India (Mumbai).
Operations and Technical Support
We have technical support and certification operations to support our products:
• | We provide post-sales training, technical support, and integration services to service provider licensees of our product application software as part of their service offerings. |
• | We operate the internet based services needed to power the Rovi Cloud Services. This includes data delivery, search, recommendations, advertising, device management and media recognition. We occasionally take end-user calls related to these services. |
• | We provide broadcast data delivery of television line-up data and advertising to TVs and set-top boxes enabled with our IPGs in major European markets and Japan. This service provides the data that populates the guides with the listings and advertising necessary to make the IPG useful to a consumer. In addition, we deliver, via the Internet, similar line-up and advertising data in North America. |
• | We support our customers' efforts to help ensure our IPGs operate properly within their devices, by offering porting services. |
• | We provide customer care for IPG customers following deployment of our IPGs. This service deals with issues with data and advertising distribution as well as functional issues for a consumer. |
9
Intellectual Property Rights
We operate in an industry in which innovation, investment in new ideas and protection of our intellectual property rights are critical for success. We protect our innovations and inventions through a variety of means, including but not limited to applying for patent protection domestically and internationally.
As of December 31, 2014, we hold 1,110 U.S. patents and have 714 U.S. patent applications pending. We also have 3,166 foreign patents issued and 912 foreign patent applications pending. Each of our U.S. issued patents will expire at a different time based on the particular filing date of that respective patent, with expiration dates as late as 2033.
Competition
IPGs
There are a number of companies that produce and market IPGs as well as television schedule information in various other formats, that compete or we believe will compete with our IPG products and services. These alternative formats include passive and interactive on-screen electronic guide services and online listings.
In the service provider IPG market we compete against TiVo. Another common competitor we encounter is a customer who chooses to build its own IPG and license our intellectual property. We believe that we provide a strong alternative to “do-it-yourself,” as we have products ready to be implemented with integrated data distribution infrastructure and content as well as third party services (such as VOD services). We intend to build differentiation by continuing to integrate our products into a suite of solutions and services for our customers. We believe our solutions can speed our customers' time to market, be deployed at a lower cost than internally built products, and can be superior to “do-it-yourself” products. For those that choose to do it themselves we have added Rovi Cloud Services to provide them services that can power their self-developed experience with metadata, search and recommendation and embedded advertising.
Many of our competitors and other companies and individuals have obtained, and may be expected to obtain in the future, patents that may directly or indirectly affect the products or services offered or under development by us. We are currently developing a variety of enhancements to our IPGs and other products and services. We cannot assure that any enhancements developed by us would not be found to infringe patents that are currently held or may be issued to others. There can be no assurance that we are or will be aware of all patents containing claims that may pose a risk of infringement by our products and services. In addition, patent applications are generally confidential for a period of 18 months from the filing date, or until a patent is issued in some cases, so we cannot evaluate the extent to which certain products and services may be covered or asserted to be covered by claims contained in pending patent applications prior to their publication. In general, if one or more of our products or services were to infringe patents held by others, we may be required to stop developing or marketing the products or services, to obtain licenses to develop and market the products or services from the holders of the patents or to redesign the products or services in such a way as to avoid infringing the patent claims. This could have an effect on our ability to compete in the IPG or entertainment technology marketplace.
Data Services
In the database and data services area, we compete with other providers of entertainment-related content data such as Gracenote (formerly known as Tribune Media Services), Internet Movie Database (IMDB) and Red Bee Media. While we do not believe that our competitors' data sets are focused on exploration, discovery, and content management in the same way that our data is, they may present competition to our data services business.
Content Security Technology
Our analog video content security solutions are proprietary and have broad U.S. and international patent coverage. We have an analog content security solution that has been widely deployed on commercial products that significantly distorts or inhibits copying by PVRs, including DVD recorders and hard drive recorders with an analog out. With the increase in online content distribution over the Internet, and with the continuing advance of digital content and high-definition formats, our analog video content security solutions that protect standard definition content on optical media and digital PPV/VOD signals are viewed by some of our customers as being less important than the other digital and network content protection solutions. Our content security technology therefore faces the risk of content providers choosing not to copy protect their content or CE manufacturers ceasing to produce PVRs with an analog out.
10
Legislative and Regulatory Actions
A number of government and legislative initiatives have been enacted to encourage development and implementation of technologies that protect the rights and intellectual property of the content owners. For example, the United States and other countries have adopted certain laws, including the Digital Millennium Copyright Act of 1998, or DMCA, and the European Copyright Directive, which are aimed at the prevention of piracy of content and the manufacture and sale of products that circumvent copy protection technologies, such as those covered by our patents.
Compatibility Between Cable Systems and Consumer Electronic Equipment
The FCC has been working for over a decade to implement a congressional mandate that it create a competitive market for cable television set-top boxes and other devices to access video programming on cable systems (“navigation devices”) and give consumers a choice in the device used to access such programming, while still allowing the cable systems to have control over the secured access to their systems.
To meet its statutory obligation without compromising the security of video services, the FCC required cable systems to make available a security element (now known as a CableCARD) separate from the basic navigation device needed to access video program channels. In 2003, the FCC adopted regulations implementing an agreement between cable television system operators and consumer electronics manufacturers to facilitate the retail availability of so-called “plug and play” devices that utilize unidirectional CableCARDs, including digital televisions and other digital devices that enable subscribers to access cable television programming without the need for a set-top box (but without the ability for consumers to use interactive content). Due to certain legislative developments in the U.S., cable subscribers may be able to utilize interactive and other two-way services without the need for a set-top box, meaning that consumers could use an IPG built directly into a TV to access and operate their cable subscriptions and not need to purchase or rent a set-top box from the cable operator. In an effort to ensure that cable operators adequately support CableCARDs, FCC regulations also prohibited multi-channel video service providers (except satellite providers) from deploying navigation devices with combined security and non-security functions acquired after July 1, 2007 (the “integration ban”) until December 4, 2015. Both cable operators and consumer electronics manufacturers are required to use the same security solution. Further developments with respect to these issues could impact the availability and/or demand for “plug and play” devices, particularly bi-directional devices, and set-top boxes, all of which could affect demand for IPGs incorporated in set-top boxes or CE devices.
General Government Regulation
We are subject to a number of foreign and domestic laws and regulations that affect companies that import or export software and technology, including encryption technology, such as the U.S. export control regulations as administered by the U.S. Department of Commerce.
We are also subject to a number of foreign and domestic laws that affect companies conducting business on the Internet. In addition, because of the increasing popularity of the Internet and the growth of online services, laws relating to user privacy, freedom of expression, content, advertising, accessibility, network neutrality, information security and intellectual property rights are being debated and considered for adoption by many countries throughout the world. Each jurisdiction may enact different standards, which could impact our ability to deliver data, services or other solutions on the Internet.
We may be further subject to international laws associated with data protection, privacy and other aspects of our business in Europe and elsewhere and the interpretation and application of data protection laws is still uncertain and in flux. In addition, because our services are accessible worldwide, foreign jurisdictions may claim that we are required to comply with their laws. In addition, the application of existing laws regulating or requiring licenses for certain businesses of our advertisers can be unclear. The resulting regulation, if any, may alter our ability to target advertising or provide data about the end-users and/or customers and their behavior.
In the U.S., online service providers have been subject to claims of defamation, libel, invasion of privacy and other data protection claims, torts, unlawful activity, copyright or trademark infringement, or other theories based on the nature and content of the materials searched and the ads posted or the content generated by users. In addition, several other federal laws could have an impact on our business. For example, the Digital Millennium Copyright Act has provisions that limit, but do not eliminate, our liability for hosting or linking to third-party websites that include materials that infringe copyrights or other rights, so long as we comply with the statutory requirements of this act. The Children's Online Privacy Protection Act restricts the ability of online services to collect information from minors, and the Protection of Children from Sexual Predators Act of 1998 requires online service providers to report evidence of violations of federal child pornography laws under certain circumstances.
11
Employees
As of December 31, 2014, we had approximately 1,200 full-time employees, of which approximately 280 were based outside the United States. None of our employees are covered by a collective bargaining agreement or are represented by a labor union. We have not experienced any organized work stoppages. We believe that our future success will depend in part upon the continued service of our key employees and on our continued ability to hire and retain qualified personnel. We may not be able to retain our key employees and may not be successful in attracting and retaining sufficient numbers of qualified personnel to conduct our business in the future.
Information About Our Executive Officers
The names of our current executive officers, their ages as of February 19, 2015, and their positions are shown below. Biographical summaries of each of our executive officers are included below.
Name | Age | Positions | ||
Thomas Carson | 55 | President and Chief Executive Officer | ||
John Burke | 52 | Executive Vice President and Chief Operating Officer | ||
Peter Halt | 54 | Chief Financial Officer | ||
Pamela Sergeeff | 42 | Executive Vice President, General Counsel and Corporate Secretary | ||
Thomas Carson. Mr. Carson has served as our President and Chief Executive Officer since December 2011. Mr. Carson previously was Executive Vice President, Worldwide Sales & Services since May 2008 when the acquisition of Gemstar-TV Guide International by the Company was completed. From April 2006 to May 2008, Mr. Carson served in various capacities at Gemstar, including President of the North American IPG business and President for North American CE business. From February 2005 to April 2006, Mr. Carson served as Executive Vice President of Operational Efficiency programs at Thomson Multimedia Corporation and from February 2004 to February 2005, he served as Executive Vice President, Global Sales and Services at Thomson. Mr. Carson holds a B.S in business administration and an MBA from Villanova University.
John Burke. Mr. Burke has served as the Company’s Executive Vice President and Chief Operating Officer since his hiring in March 2014. Prior to joining the Company, Mr. Burke served as Senior Vice President, Corporate Development & Strategy, and President, Cloud Solutions Business at ARRIS Group, Inc., a telecommunications equipment manufacturing company, from April 2013 to November 2013. From October 2010 to April 2013 when ARRIS acquired Motorola Mobility’s Home business from Google, he served as Senior Vice President and General Manager of the Converged Solutions business of Motorola. Prior to that, he served in various capacities at Motorola, Inc., including Senior Vice President and General Manager of Motorola’s Broadband Home Solutions from 2007 to 2010. Mr. Burke joined Motorola in 2000 with the acquisition of General Instrument Corp., where he spent 15 years in a variety of leadership positions, including Vice President and General Manager of Data & Voice CPE Solutions. Mr. Burke holds a B.S. in business administration from The Ohio State University and an MBA from Saint Joseph’s University.
Peter Halt. Mr. Halt has served as our Chief Financial Officer since May 2012. Mr. Halt previously was the Company’s Senior Vice President and Chief Accounting Officer since May 2008 when the acquisition of Gemstar-TV Guide International by the Company was completed. Mr. Halt previously served as Senior Vice President, Finance and Chief Accounting Officer at Gemstar from March 2004 to May 2008. Prior to joining Gemstar, Mr. Halt served in various capacities at Sony Pictures Entertainment, including serving as Chief Financial Officer of Sony Pictures Digital Entertainment from November 2000 to November 2003 and Corporate Controller of Sony Pictures Entertainment from July 1997 to November 2000. Mr. Halt holds a B.S. in Business from the University of Southern California.
Pamela Sergeeff. Ms. Sergeeff has served as Executive Vice President, General Counsel and Corporate Secretary of Rovi since December 2013. Ms. Sergeeff joined Rovi (then Macrovision Corporation) in 2003. She served as the Company’s Senior Vice President and Associate General Counsel from March 2011 to December 2013 and as the Company’s Vice President and Associate General Counsel from July 2007 to March 2011. Ms. Sergeeff holds a B.A. in Economics from the University of California, Los Angeles and a J.D. from the University of California, Berkeley School of Law. Ms. Sergeeff is a member of the California State bar.
Available Information
Our Internet website is located at http://www.rovicorp.com. We make available free of charge on our website our Annual Report on Form 10-K, Quarterly Reports on Form 10-Q, Current Reports on Form 8-K and amendments to those
12
reports filed or furnished pursuant to Section 13(a) or 15(d) of the Exchange Act, as soon as reasonably practicable after we electronically file such material with, or otherwise furnish it to, the Securities and Exchange Commission (the “SEC”). Copies will be provided to any stockholder upon request to Rovi Corporation, Attention: Corporate Secretary, 2830 De La Cruz Boulevard, Santa Clara, California 95050. The reference to our Internet website does not constitute incorporation by reference of the information contained on or hyperlinked from our Internet website and should not be considered part of this document.
The public may also read and copy any materials we file with the SEC at the SEC's Public Reference Room at 450 Fifth Street, N.W., Washington, D.C. 20549. The public may obtain information on the operation of the Public Reference Rooms by calling the SEC at 1-800-SEC-0330. The SEC also maintains an Internet website that contains reports, proxy and information statements and other information regarding issuers that file electronically with the SEC. The SEC's Internet website is located at http://www.sec.gov.
ITEM 1A. RISK FACTORS
In addition to the other information contained in this Annual Report on Form 10-K, you should consider carefully the following risks. This list is not exhaustive and you should carefully consider these risks and uncertainties before investing in our common stock. If any of these risks occur, our business, financial condition or operating results could be adversely affected.
If we fail to develop and timely deliver innovative technologies and services in response to changes in the technology and entertainment industries, our business could decline.
The markets for our products, services and technologies are characterized by rapid change and technological evolution. We will need to continue to expend considerable resources on research and development in the future in order to continue to design and deliver enduring, innovative entertainment products, services and technologies. Despite our efforts, we may not be able to develop timely and effectively market new products, technologies and services that adequately or competitively address the needs of the changing marketplace. In addition, we may not correctly identify new or changing market trends at an early enough stage to capitalize on market opportunities. At times, such changes can be dramatic, as were the shift from VHS videocassettes to DVDs for consumer playback of movies in homes and elsewhere and the transition from packaged media to Internet distribution. Our future success depends to a great extent on our ability to develop and timely deliver innovative technologies that are widely adopted in response to changes in the technology and entertainment industries and that are compatible with the technologies, services or products introduced by other entertainment industry participants. Despite our efforts and investments in developing new products, services and technologies:
• | we cannot assure you that the level of funding and significant resources we are committing for investments in new products, services and technologies will be sufficient or result in successful new products, services or technologies; |
• | we cannot assure you that our newly developed products, services or technologies can be successfully protected as proprietary intellectual property rights or will not infringe the intellectual property rights of others; |
• | we cannot assure you that any new products or services that we develop will achieve market acceptance; |
• | our products, services and technologies may become obsolete due to rapid advancements in technology and changes in consumer preferences; |
• | we cannot assure you that revenue from new products, services or technologies will offset any decline in revenue from our products, services and technologies which may become obsolete; and |
• | our competitors and/or potential customers may develop products, services or technologies similar to those developed by us, resulting in a reduction in the potential demand for our newly developed products, services or technologies. |
Our failure to successfully develop new and improved products, services and technologies, including as a result of any of the risks described above, may reduce our future growth and profitability and may adversely affect our business, results and financial condition.
Our competitors may be able to respond more quickly to new or emerging technologies and changes in customer requirements than we do, which could reduce demand for our products or services or render them obsolete and if competition increases or if we are unable to effectively compete with existing or new competitors, the result could be price reductions, fewer customers and loss of market share, any of which could result in less revenue and harm our business.
13
Our IPGs face competition from companies that produce and market program guides as well as television schedule information in a variety of formats, including passive and interactive on-screen electronic guide services, online listings, over the top applications, printed television guides in newspapers and weekly publications, and local cable television guides.
Our IPG products also compete against customers and potential customers who choose to build their own IPG, including both those who do and those who don't elect to license our patents.
We believe that our set-top box digital-to-analog copy protection, DVD digital-to-analog copy protection and videocassette copy protection systems currently have limited competition. It is possible, however, that alternative copy protection technologies could become competitive. Additionally, new competitors or alliances among competitors may emerge and rapidly acquire significant market share in any of these areas. It is also possible that the overall demand for copy protection systems may decline more quickly than anticipated.
The markets for the consumer hardware and software products sold by our customers are competitive and price sensitive. Licensing fees for our technologies, products and services, particularly in the physical media and CE and computer device areas, may decline due to competitive pricing pressures and changing consumer demands. In addition, we may experience pricing pressures in other parts of our business. These trends could make it more difficult for us to increase or maintain our revenue and could adversely affect our operating results. To increase per unit royalties, we must continue to introduce new, highly functional versions of our technologies, products and services for which we can charge higher amounts. Any inability to introduce such technologies, products and services in the future or other declines in the amounts we can charge would also adversely affect our revenues.
Some of our current or future competitors may have significantly greater financial, technical, marketing and other resources than we do, may enjoy greater brand recognition than we do, or may have more experience or advantages than we have in the markets in which they compete. Further, many of the consumer hardware and software products that include our technologies also include technologies developed by our competitors. As a result, we must continue to invest significant resources in product development in order to enhance our technologies and our existing products and services and introduce new high-quality technologies, products and services to meet the wide variety of such competitive pressures. Our ability to generate revenues from our business will suffer if we fail to do so successfully.
Our business may be adversely affected by fluctuations in demand for consumer electronics devices incorporating our technologies.
We derive significant revenues from CE manufacturer license fees for our solutions that are based on the number of units shipped. We do not manufacture hardware, but rather depend on the cooperation of CE manufacturers to incorporate our technologies into their products. Generally, our license agreements do not require manufacturers to include our technology in any specific number or percentage of units, and only some of these agreements guarantee a minimum aggregate licensing fee. Purchases of new CE devices, including television sets, integrated satellite receiver decoders, DVRs, DVD recorders, personal computers and Internet appliances are largely discretionary and may be adversely impacted by increasing market saturation, durability of products in the marketplace, new competing products, alternate consumer entertainment options and general economic trends in the countries or regions in which these products are offered. Economic downturns have in the past, and may in the future, significantly impact demand for such CE devices. As a result, our future operating results may be adversely impacted by fluctuations in sales of CE devices employing our technologies.
The decision by manufacturers to incorporate our solutions into their products is a function of what other technologies, products and services are available. Our future operating results may be adversely impacted as a result of CE manufacturers opting not to incorporate our technology into their devices as a result of other available alternatives.
We generate a significant portion of our revenue from patent license agreements with a small number of major Pay TV Systems under agreements that end in 2015 and 2016, and which would lead to substantial revenue loss and possible litigation if not renewed.
Agreements with four major Pay TV System licensees who generate a substantial portion of our patent licensing revenue expire in the second half of 2015 and the first half of 2016. We cannot assure you that these license agreements will be renewed on terms acceptable to us or at all. If we are unable to replace the revenue associated with these agreements through similar or other business arrangements, our revenues and profit margins would decline and our business would be harmed as a result. Two of these licensees have executed agreements under which they are planning to be acquired by other major Pay TV System operators. These acquisitions, if consummated, could have a negative impact on the timing or nature of licensing discussions and/or revenue. Additionally, we may become involved in litigation with these licensees in connection with attempting to negotiate new agreements. The existence and/or outcome of such litigation could harm our business.
14
Our business may be adversely affected by fluctuations in the number of cable television, telco television, and digital broadcast satellite (“Pay TV System”) subscribers if the availability of over-the-top content services causes consumers to cancel their Pay TV System subscriptions.
For some of our technologies, we are paid a royalty based on the number of subscribers or set top-boxes our Pay TV System customers have. The ability to enjoy digital entertainment content downloaded or streamed over the Internet has enabled some consumers to cancel their Pay TV System subscriptions. If our Pay TV System customers are unable to maintain their subscriber base, the royalties they owe us may decline.
Dependence on the cooperation of Pay TV Systems, television broadcasters, hardware manufacturers, data providers and delivery mechanisms could adversely affect our revenues.
We rely on third party providers to deliver our IPG data to some of the CE devices that include our IPG. Further, our national data network provides customized and localized listings to our IPG service for Pay TV Systems and licensees of our data used in third party IPGs for Pay TV Systems. In addition, we purchase certain Metadata from commercial vendors that we redistribute. The quality, accuracy and timeliness of that Metadata may not continue to meet our standards or be acceptable to consumers. There can be no assurance that these delivery mechanisms will distribute the data without error or that the agreements that govern some of these relationships can be maintained on favorable economic terms. Technological changes may also impede the ability to distribute Metadata. Our inability to renew these existing arrangements on terms that are favorable to us, or enter into alternative arrangements that allow us to effectively transmit our Metadata to CE devices could have a material adverse effect on our CE IPG and IPG data business.
We are exposed to risks associated with our changing technology base through strategic acquisitions, investments and divestitures.
We have expanded our technology base in the past through strategic acquisitions of companies with complementary technologies or intellectual property and intend to do so in the future. Acquisitions hold special challenges in terms of successful integration of technologies, products, services and employees. We are currently in the process of integrating products, services and technologies acquired through our Fan TV and Veveo acquisitions. We may not realize the anticipated benefits of these acquisitions or the benefits of any other acquisitions we have completed or may complete in the future, and we may not be able to incorporate any acquired services, products or technologies with our existing operations, or integrate personnel from the acquired businesses, in which case our business could be harmed.
Acquisitions, divestitures and other strategic investments involve numerous risks, including:
• | problems integrating and divesting the operations, technologies, personnel, services or products over geographically disparate locations; |
• | unanticipated costs, litigation and other contingent liabilities; |
• | continued liability for pre-closing activities of divested businesses or certain post-closing liabilities which we may agree to assume as part of the transaction in which a particular business is divested; |
• | adverse effects on existing business relationships with suppliers and customers; |
• | cannibalization of revenue as customers may seek multi-product discounts; |
• | risks associated with entering into markets in which we have no, or limited, prior experience; |
• | incurrence of significant exit charges if products or technologies acquired in business combinations are unsuccessful; |
• | significant diversion of management's attention from our core business and diversion of key employees' time and resources; |
• | licensing, indemnity or other conflicts between existing businesses and acquired businesses; |
• | inability to retain key customers, distributors, suppliers, vendors and other business relations of the acquired business; and |
• | potential loss of our key employees or the key employees of an acquired organization. |
15
In 2013 we completed the sale of assets related to the Rovi Entertainment Store, and in 2014 the sale of the DivX and MainConcept businesses. Although these sales have been completed, we still are subject to certain third-party liabilities associated with those businesses.
Financing for future acquisitions may not be available on favorable terms, or at all. If we identify an appropriate acquisition candidate for any of our businesses, we may not be able to negotiate the terms of the acquisition successfully, finance the acquisition or integrate the acquired business, products, service offerings, technologies or employees into our existing business and operations. Future acquisitions and divestitures may not be well-received by the investment community, which may cause the value of our stock to fall. We cannot ensure that we will be able to identify or complete any acquisition or divestiture in the future. Further, the terms of our indebtedness constrains our ability to make and finance additional acquisitions or divestitures.
If we acquire businesses, new products, service offerings or technologies in the future, we may incur significant acquisition-related costs. In addition, we may be required to amortize significant amounts of identifiable intangible assets and we may record significant amounts of goodwill that will be subject to annual testing for impairment. We have in the past and may in the future be required to write off all or part of one or more of these investments that could harm our operating results. If we consummate one or more significant future acquisitions in which the consideration consists of stock or other securities, our existing stockholders' ownership could be significantly diluted. If we were to proceed with one or more significant future acquisitions in which the consideration included cash, we could be required to use a substantial portion of our available cash. Acquisitions could also cause operating margins to fall depending upon the financial models of the businesses acquired.
Our strategic investments may involve joint development, joint marketing, or entry into new business ventures, or new technology licensing. Any joint development efforts may not result in the successful introduction of any new products or services by us or a third party, and any joint marketing efforts may not result in increased demand for our products or services. Further, any current or future strategic acquisitions and investments by us may not allow us to enter and compete effectively in new markets or enhance our business in our existing markets and we may have to write off our equity investments in companies as we have done in the past.
Our success is heavily dependent upon our proprietary technologies.
We believe that our future success will depend on our ability to continue to introduce proprietary solutions for digital content and technologies. We rely on a combination of patent, trademark, copyright and trade secret laws, nondisclosure and other contractual provisions, and technical measures to protect our intellectual property rights. Our patents, trademarks or copyrights may be challenged and invalidated or circumvented. Our patents may not be of sufficient scope or strength or be issued in all countries where products or services incorporating our technologies can be sold. We have filed applications to expand our patent claims and for improvement patents to extend the current periods of patent coverage. However, expiration of some of our patents may harm our business. If we are not successful in protecting our intellectual property, our business would be harmed.
Others may develop technologies that are similar or superior to our technologies, duplicate our technologies or design around our patents. Effective intellectual property protection may be unavailable or limited in some foreign countries. Despite efforts to protect our proprietary rights, unauthorized parties may attempt to copy or otherwise use aspects of processes and devices that we regard as proprietary. Policing unauthorized use of our proprietary information is difficult, and the steps we have taken may not prevent misappropriation of our technologies. Such competitive threats could harm our business.
We may make patent assertions, or initiate patent infringement or patent interference actions or other litigation to protect our intellectual property, which could be costly and harm our business.
We are currently engaged in litigation, and litigation may be necessary in the future, to enforce our patents and other intellectual property rights, to protect our trade secrets or to determine the validity and scope of the proprietary rights of others.
We, and many of our current and potential competitors, dedicate substantial resources to protection and enforcement of intellectual property rights. We believe that companies will continue to take steps to protect their technologies, including, but not limited to, seeking patent protection. Companies in the technology and content-related industries have frequently resorted to litigation regarding intellectual property rights. Disputes regarding the ownership of technologies and their associated rights are likely to arise in the future and we may be forced to litigate to determine the validity and scope of other parties' proprietary rights. Any such litigation could be very costly, could distract our management from focusing on operating our business, could delay receipt of revenue until a settlement or decision is ultimately reached, could result in the invalidation or adverse claims construction of patents, and might ultimately be unsuccessful. The existence and/or outcome of such litigation could harm our business.
16
Additionally, the relationships with our customers, suppliers and technology collaborators may be disrupted or terminated as a result of patent assertions that we may make against them, which could harm our business.
Finally, adverse legal rulings could result in the invalidation of our patents, the narrowing of the claims of our patents, or fostering of the perception by licensees or potential licensees that a judicial finding of their infringement is unlikely. Such results or perceptions could decrease the likelihood that licensees or potential licensees may be interested in licensing our patents, or could cause to decrease the amounts of license fees that they are willing to pay, which could harm our business.
We may not be able to join standards bodies, license in technologies or integrate with platforms that are necessary or helpful to our product or services businesses because of the encumbrances that the proposed associated agreements place on our patents.
Standards bodies often require, as a condition of joining such bodies, that potential members license, agree to license, disclose or place other burdens on their patents. Similarly, technology licensors and platform operators often require that licensees cross license, or agree not to assert, their patents. In order to develop, provide or distribute certain products or services, we may find it necessary or helpful to join these standard bodies, license in these technologies or contract with these platform operators. However, in order to do so, we might have to sign agreements under which we would have to license or agree not to assert patents without being able to collect royalties or for fees that we believe are less than those that we could otherwise collect. Similarly, these agreements could require us to disclose invention-related information that we would otherwise prefer to keep confidential. This inability to be part of standards bodies, to license in certain technologies, or to contract with certain platform operators, could harm our business.
We may be subject to intellectual property infringement claims or other litigation, which are costly to defend and could limit our ability to use certain technologies in the future.
From time to time we receive claims and inquiries from third parties alleging that our internally developed technology, technology we have acquired or technology we license from third parties may infringe other third parties' proprietary rights (especially patents). Third parties have also asserted and most likely will continue to assert claims against us alleging infringement of copyrights, trademark rights or other proprietary rights relating to video or music content, or alleging unfair competition or violations of privacy rights. We have faced such claims in the past, we currently face such claims, and we expect to face similar claims in the future. Regardless of the merits of such claims, any disputes with third parties over intellectual property rights could materially and adversely impact our business, including by resulting in the loss of management time and attention to our core business, the significant cost to defend ourselves against such claims or reducing the willingness of licensees to incorporate our technologies into their products or services. Additionally, we have also been asked by content owners to stop the display or hosting of copyrighted materials by our users or ourselves through our service offerings, including notices provided to us pursuant to the Digital Millennium Copyright Act. We have and will promptly respond to legitimate takedown notices or complaints, including but not limited to those submitted pursuant to the Digital Millennium Copyright Act, notifying us that we are providing unauthorized access to copyrighted content by removing such content and/or any links to such content from our services or products. Nevertheless, we cannot guarantee that our prompt removal of content, including removal pursuant to the provisions of the Digital Millennium Copyright Act, will prevent disputes with content owners, that infringing content will not exist on our services, or that we will be able to resolve any disputes that may arise with content providers or users regarding such infringing content. If any of these claims were to prevail, we could be forced to pay damages, comply with injunctions, or stop distributing our products or providing our services while we re-engineer them or seek licenses to necessary technology, which might not be available on reasonable terms or at all. We could also be subject to claims for indemnification resulting from infringement claims made against our customers, other companies with whom we have relationships or the current owners of businesses that we divested, which could increase our defense costs and potential damages. For example, we have received notices and lawsuits from certain customers requesting indemnification in patent-related lawsuits. We evaluate the requests and assess whether we believe we are obligated to provide such indemnification to such customers on a case by case basis. Customers or other companies making such requests could become unwilling or hesitant to do business with us if we decline such requests. An adverse determination with respect to such requests or in any of these events described above could require us to change our business practices and have a material impact on our business and results of operations. Furthermore, these types of disputes can be asserted by our licensees or prospective licensees or by other third parties as part of negotiations with us or in private actions seeking monetary damages or injunctive relief. Any disputes with our licensees or potential licensees or other third parties could harm our reputation and expose us to additional costs and other liabilities.
Litigation could harm our business and result in:
• | Substantial expenditures for legal fees and costs to defend the Company and/or our customers; |
• | substantial settlement, damage awards or related costs, including indemnification of customers; |
17
• | diversion of management and technical resources to help defend the Company, including as part of pre-trial discovery; |
• | either our customers discontinuing to use or ourselves discontinuing to sell infringing products or services; |
• | our expending significant resources to develop and implement non-infringing technology; and |
• | our obtaining, or being required to obtain, licenses to infringed technology, which could be costly or unavailable. |
We are involved in the business of powering the discovery and enjoyment of digital entertainment, including over the Internet. There has been, and we believe that there will continue to be, an increasing level of litigation to determine the applicability of current laws to, and impact of new technologies on, the use and distribution of content over the Internet and through new devices. As we develop products and services that protect, provide or enable the provision of content in such ways, the risk of litigation against us may increase.
Our ability to maintain and enforce our trademark rights has a large impact on our ability to prevent third party infringement of our brand and technologies and if we are unable to maintain and strengthen our brands, our business could be harmed.
Maintaining and strengthening our brands is important to maintaining and expanding our business, as well as to our ability to enter into new markets for our technologies, products and services. If we fail to promote and maintain these brands successfully, our ability to sustain and expand our business and enter into new markets may suffer. Because we engage in relatively little direct brand advertising, the promotion of our brand depends, among other things, upon hardware device manufacturing companies and service providers displaying our trademarks on their products. If these companies choose for any reason not to display our trademarks on their products, or if these companies use our trademarks incorrectly or in an unauthorized manner, the strength of our brand may be diluted or our ability to maintain or increase our brand awareness may be harmed. We generally rely on enforcing our trademark rights to prevent unauthorized use of our brand and technologies. Our ability to prevent unauthorized uses of our brand and technologies would be negatively impacted if our trademark registrations were overturned in the jurisdictions where we do business. We also have trademark applications pending in a number of jurisdictions that may not ultimately be granted, or if granted, may be challenged or invalidated, in which case we would be unable to prevent unauthorized use of our brand and logo in such jurisdiction. We have not filed trademark registrations in all jurisdictions where our brand and logo are used.
We may be subject to legal liability for the provision of third-party products, services, content or advertising.
We periodically enter into arrangements to offer third-party products, services, content or advertising under our brands or in connection with our various products or service offerings. For example, we license or incorporate certain entertainment Metadata into our data offerings. Certain of these arrangements involve enabling the distribution of digital content owned by third parties, which may subject us to third party claims related to such products, services, content or advertising, including defamation, violation of privacy laws, misappropriation of publicity rights and infringement of intellectual property rights. We require users of our services to agree to terms of use that prohibit, among other things, the posting of content that violates third party intellectual property rights, or that is obscene, hateful or defamatory. We have implemented procedures to enforce such terms of use on certain of our services, including taking down content that violates our terms of use for which we have received notification, or that we are aware of, and/or blocking access by, or terminating the accounts of, users determined to be repeat violators of our terms of use. Despite these measures, we cannot guarantee that such unauthorized content will not exist on our services, that these procedures will reduce our liability with respect to such unauthorized third party conduct or content, or that we will be able to resolve any disputes that may arise with content providers or users regarding such conduct or content. Our agreements with these parties may not adequately protect us from these potential liabilities. It is also possible that, if any information provided directly by us contains errors or is otherwise negligently provided to users, third parties could make claims against us, including, for example, claims for intellectual property infringement, publicity rights violations or defamation. Investigating and defending any of these types of claims is expensive, even if the claims do not result in liability. If any of these claims results in liability, we could be required to pay damages or other penalties, which could harm our business and our operating results.
Global economic conditions may impact our business, operating results, financial condition, liquidity or stock price.
Uncertainty about global economic conditions poses a risk as consumers and businesses postpone spending in response to tighter credit, higher unemployment, financial market volatility, government austerity programs, negative financial news and declines in income or asset values. Additionally, sovereign budget crises among members of the European Union and other countries worldwide have caused increased risk of default to holders of sovereign debt, including commercial
18
banks, and an unprecedented risk about the continuing viability of the Euro as a global currency. These conditions have caused an unprecedented level of intervention from the United States federal government, other foreign governments, central banks and quasi-governmental agencies such as the International Monetary Fund, decreased consumer confidence, overall slower economic activity and extreme volatility in credit, equity and fixed income markets. While the ultimate outcome of these events cannot be predicted, these macroeconomic developments could negatively affect our business, operating results, financial condition or liquidity in a number of ways. For example, if the economic downturn in any region makes it difficult for our customers and suppliers to accurately forecast and plan future business activities, they may delay, decrease or cancel purchases of our solutions or reduce production of their products. As many of our solutions are licensed on a per-unit fee basis and the pricing for future flat fee agreements may be predicated on the then most recent unit sales volumes and financial health of our customers, our customers' decision to decrease production of their products or devices, or curtail the offering of their services, may decrease our licensing revenue and adversely impact our operating results.
Furthermore, as our customers face a weak economy in various regions of the world, they may not be able to gain sufficient credit in a timely manner, which could result in an impairment of their ability to place orders with us or to make timely payments to us for previous purchases. If this occurs, our revenue may be reduced, thereby having a negative impact on our results of operations. In addition, we may be forced to increase our allowance for doubtful accounts and our days sales outstanding may increase, which would have a negative impact on our cash position, liquidity and financial condition. We cannot predict the timing or the duration of any economic downturn and we are not immune to the effects of general worldwide economic conditions.
In addition, financial institution failures may cause us to incur increased expenses or make it more difficult either to utilize our existing debt capacity or otherwise obtain financing for our operations, investing activities (including the financing of any future acquisitions), or financing activities (including an increase in our liability to counterparties under interest rate swap contracts and the timing and amount of any repurchases of our common stock or debt we may make in the future). Our investment portfolio, which includes short-term debt securities, is generally subject to general credit, liquidity, counterparty, market and interest rate risks that may be exacerbated by any global financial crisis. If the banking system or the fixed income, credit or equity markets deteriorated or remained volatile, our investment portfolio may be impacted and the values and liquidity of our investments could be adversely affected.
Finally, like other stocks, our stock price can be affected by global economic uncertainties and if investors have concerns that our business, operating results and financial condition will be negatively impacted by a worldwide economic downturn, our stock price could decrease.
We have indebtedness which could adversely affect our financial position.
As of December 31, 2014, we had total debt with a par value of approximately $1.1 billion which includes $291.0 million of borrowings under our 2040 Convertible Notes and $821.5 million under our senior secured term loans. Our term loans are guaranteed by us and certain of our domestic and foreign subsidiaries and are secured by substantially all of our, the subsidiary guarantors and the co-borrowers' assets. Our indebtedness may:
• | limit our ability to borrow additional funds for working capital, capital expenditures, acquisitions or other general business purposes; |
• | limit our ability to use our cash flow or obtain additional financing for future working capital, capital expenditures, acquisitions or other general business purposes; |
• | require us to use a substantial portion of our cash flow from operations to make debt service payments; |
• | limit our flexibility to plan for, or react to, changes in our business and industry; |
• | place us at a competitive disadvantage compared to our less leveraged competitors; and |
• | increase our vulnerability to the impact of adverse economic and industry conditions. |
Our ability to meet our debt service obligations will depend on our future performance, which will be subject to financial, business, and other factors affecting its operations, many of which are beyond our control.
Covenants in our debt agreements restrict our business in many ways and if we do not effectively manage our covenants, our financial condition and results of operations could be adversely affected.
Our senior secured credit facility contains various covenants that limit our ability and/or our restricted subsidiaries' ability to, among other things:
19
• | incur or assume liens or additional debt or provide guarantees in respect of obligations of other persons; |
• | issue redeemable preferred stock; |
• | pay dividends or distributions or redeem or repurchase capital stock; |
• | prepay, redeem or repurchase certain debt; |
• | make loans, investments and capital expenditures; |
• | enter into agreements that restrict distributions from our subsidiaries; |
• | sell assets and capital stock of our subsidiaries; |
• | enter into certain transactions with affiliates; and |
• | consolidate or merge with or into, or sell substantially all of our assets to, another person. |
In addition, our senior secured credit facility contains restrictive covenants and requires us to maintain specified financial ratios. Our ability to meet those financial ratios can be affected by events beyond our control, and we may be unable to meet those ratios. A breach of any of these covenants could result in a default under our senior secured credit facility and/or our other indebtedness, which could in turn result in an acceleration of a substantial portion of our indebtedness. In such event, we may be unable to repay all of the amounts that would become due under our indebtedness. If we were unable to repay those amounts, the lenders under our senior secured credit facility could proceed against the collateral granted to them to secure that indebtedness. In any case, if a significant portion of our debt was accelerated, we might be forced to seek bankruptcy protection.
We may not be able to generate sufficient cash to service our debt obligations.
Our ability to make payments on and to refinance our indebtedness will depend on our financial and operating performance, which is subject to prevailing economic and competitive conditions and to certain financial, business and other factors beyond our control. We may be unable to maintain a level of cash flows from operating activities sufficient to permit us to pay the principal, premium, if any, and interest on our indebtedness.
If our cash flows and capital resources are insufficient to fund our debt service obligations, we may be forced to reduce or delay investments and capital expenditures, or to sell assets, seek additional capital or restructure or refinance our indebtedness. These alternative measures may not be successful and may not permit us to meet our scheduled debt service obligations. In the absence of such operating results and resources, we could face substantial liquidity problems and might be required to dispose of material assets or operations to meet our debt service and other obligations. Our senior secured credit facility restricts our ability to dispose of assets, use the proceeds from any disposition of assets and refinance our indebtedness. We may not be able to consummate those dispositions or to obtain the proceeds that we could realize from them and these proceeds may not be adequate to meet any debt service obligations then due.
In addition, our borrowings under our senior secured credit facility are, and are expected to continue to be, at variable rates of interest and expose us to interest rate risk. If interest rates increase, our debt service obligations on the variable rate indebtedness would increase even though the amount borrowed remained the same, and our net income would decrease.
Repayment of debt is dependent on cash flow generated by our subsidiaries and their respective subsidiaries.
Rovi Corporation's subsidiaries, including Rovi Solutions Corporation and Rovi Guides, Inc., own a significant portion of our assets and conduct substantially all of our operations. Each subsidiary is a distinct legal entity and, under certain circumstances, legal and contractual restrictions may limit our ability to obtain cash from our subsidiaries. In the event that we do not receive distributions from our subsidiaries, we may be unable to make required principal and interest payments on the 2040 Convertible Notes. Accordingly, repayment of our indebtedness depends, to a significant extent, on the generation of cash flow by the subsidiaries, including Rovi Solutions Corporation and Rovi Guides, Inc., the senior secured position of their bank debt, and their ability to make cash available to us, by dividend, debt repayment or otherwise. Because they are not guarantors or a co-issuer of the 2040 Convertible Notes, our subsidiaries do not have any obligation to pay amounts due on those notes or to make funds available for that purpose. Conversely, the ability of Rovi Solutions Corporation and Rovi Guides, Inc. to repay their indebtedness under the senior secured credit facility depends, in part, on the generation of cash flow by their respective subsidiaries. Our subsidiaries may not be able to, or may not be permitted to, make distributions to enable us, Rovi Solutions Corporation or Rovi Guides Inc. to make payments in respect of our indebtedness. Distributions from non-U.S. subsidiaries
20
may be subject to foreign withholding taxes and U.S. corporate tax and further reduce the net cash available for principal and interest payments.
Despite our current level of indebtedness, we may still be able to incur more indebtedness. This could increase the risks associated with our indebtedness.
We and our subsidiaries may incur additional indebtedness in the future. The terms of our indenture do not prohibit us or our subsidiaries from incurring additional indebtedness. If we incur any additional indebtedness that ranks equally with existing indebtedness, the holders of that indebtedness will be entitled to share ratably with the holders of our existing debt obligations in any proceeds distributed in connection with any insolvency, liquidation, reorganization, dissolution or other winding-up of us. If new indebtedness is added to our current debt levels, the related risks that we and our subsidiaries now face could intensify.
Changes in, or interpretations of, tax rules and regulations, may adversely affect our effective tax rates.
We are subject to income taxes in the U.S. and foreign tax jurisdictions. Our future effective tax rates could be unfavorably affected by changes in tax laws or the interpretation of tax laws, by changes in the amount of revenue or earnings that we derive from international sources in countries with high or low statutory tax rates, or by changes in the valuation of our deferred tax assets and liabilities. Unanticipated changes in our tax rates could affect our future results of operations.
In addition, federal, state, and foreign tax jurisdictions may examine our income tax returns, including income tax returns of acquired companies and acquired tax attributes included therein. We regularly assess the likelihood of outcomes resulting from these examinations to determine the adequacy of our provision for income taxes. In making such assessments, we exercise judgment in estimating our provision for income taxes. While we believe our estimates are reasonable, we cannot assure you that the final determination from these examinations will not be materially different from that reflected in our historical income tax provisions and accruals. Any adverse outcome from these examinations may have a material adverse effect on our business and operating results, which could cause the market price of our stock to decline.
We may be subject to market risk and legal liability in connection with data collection.
Many components of our services include interactive components that by their very nature require communication between a client and server to operate. To provide better consumer experiences and to operate effectively, and for our analytics business and other businesses, we collect certain information from users. Collection and use of such information may be subject to United States state and federal privacy and data collection laws and regulations, standards used by credit card companies applicable to merchants processing credit card details, and foreign laws such as the EU Data Protection Directive. It may also be subject to third party privacy policies and permissions, and obligations we owe to third parties, including, for example, those of Pay TV System operators. We post our privacy policies concerning the collection, use and disclosure of user data, including that involved in interactions between client and server. Any failure by us to comply with privacy policies or contractual obligations, any failure to comply with standards set by credit card companies relating to privacy or data collection, any failure to conform the privacy policy to changing aspects of our business or applicable law, or any existing or new legislation regarding privacy issues could impact the market for our online services, technologies and products and subject us to fines, litigation or other liability.
In addition, the Children's Online Privacy Protection Act imposes civil and criminal penalties on persons collecting personal information from children under the age of 13. We do not knowingly distribute harmful materials to minors, direct our websites or services to children under the age of 13, or collect personal information from children under the age of 13. However, we are not able to control the ways in which consumers use our technology, and our technology may be used for purposes that violate this or other similar laws. The manner in which such laws may be interpreted and enforced cannot be fully determined, and future legislation similar to this law could subject us to potential liability if we were deemed to be non-compliant with such rules and regulations.
Improper conduct by users could subject us to claims and compliance costs.
The terms of use and end-user license agreements for our products and services prohibit a broad range of unlawful or undesirable conduct. However, we are unable to block access in all instances to users who are determined to gain access to our products or services for improper motives. Claims may be threatened or brought against us using various legal theories based on the nature and content of information or media that may be created, posted online or generated by our users or the use of our technology. This risk includes actions by our users to copy or distribute third-party content. Investigating and defending any of these types of claims could be expensive, even if the claims do not ultimately result in liability. In addition, we may incur substantial costs to enforce our terms of use or end-user license agreements and to exclude certain users of our services or
21
products who violate such terms of use or end-user license agreements, or who otherwise engage in unlawful or undesirable conduct.
For our business to succeed, we need to attract and retain qualified employees and manage our employee base effectively.
Our success depends on our ability to hire and retain qualified employees and to manage our employee base effectively. Because of the specialized nature of our business, our future success will depend upon our continuing ability to identify, attract, train and retain highly skilled managerial, technical, sales and marketing personnel, particularly as we enter new markets. Competition for people with the skills that we require is intense, particularly in the San Francisco Bay Area, where our headquarters are located, and Southern California where we have significant operations, and the high cost of living in these areas makes our recruiting and compensation costs higher. Moreover, changes in our management or executive leadership team could lead to disruption of our business or distraction of our employees as the organization adapts to such management changes. If we are unable to hire and retain qualified employees, our business and operating results could be adversely affected.
Establishing and maintaining licensing relationships with companies are important to build and support a worldwide entertainment technology licensing ecosystem and to expand our business, and failure to do so could harm our business and prospects.
Our future success will depend upon our ability to establish and maintain licensing relationships with companies in related business fields, including:
• | semiconductor and equipment manufacturers; |
• | operators of entertainment content distributors, including PPV and VOD networks; |
• | consumer electronics, digital PPV/VOD set-top hardware manufacturers, DVD hardware manufacturers and PC manufacturers; |
• | Pay TV Systems; |
• | content right holders; |
• | retailers and advertisers; |
• | DRM suppliers; and |
• | Internet portals and other digital distribution companies. |
Substantially all of our license agreements are non-exclusive, and therefore our licensees are free to enter into similar agreements with third parties, including our competitors. Our licensees may develop or pursue alternative technologies either on their own or in collaboration with others, including our competitors.
Some of our third party license arrangements require that we license others' technologies and/or integrate our solutions with others. In addition, we rely on third parties to report usage and volume information to us. Delays, errors or omissions in this information could harm our business. If these third parties choose not to support integration efforts or delay the integration of our solutions, our business could be harmed.
If we fail to maintain and expand our relationships with a broad range of participants throughout the entertainment industry, including motion picture studios, broadcasters, Pay TV Systems and manufacturers of CE products, our business and prospects could be materially harmed. Relationships have historically played an important role in the entertainment industries that we serve. If we fail to maintain and strengthen these relationships, these industry participants may not purchase and use our technologies, which could materially harm our business and prospects. In addition to directly providing a substantial portion of our revenue, these relationships are also critical to our ability to have our technologies adopted. Moreover, if we fail to maintain our relationships, or if we are not able to develop relationships in new markets in which we intend to compete in the future, including markets for new technologies and expanding geographic markets, our business, operating results and prospects could be materially and adversely affected. In addition, if major industry participants form strategic relationships that exclude us, our business and prospects could be materially adversely affected.
Because many of our technologies, products and services are designed to comply with industry standards, to the extent we cannot distinguish our technologies, products and services from those sold by our competitors, our current
22
distributors and customers may choose alternate technologies, products and services or choose to purchase them from multiple vendors.
We cannot provide any assurance that the industry standards for which we develop new technologies, products and services will allow us to compete effectively with companies possessing greater financial and technological resources than we have to market, promote and exploit sales opportunities as they arise in the future. Technologies, products and services that are designed to comply with standards may also be viewed as interchangeable commodities by certain customers. We may be unable to compete effectively if we cannot produce technologies, products and services more quickly or at lower cost than our competitors. Further, any new technologies, products and services developed may not be introduced in a timely manner or in advance of our competitors' comparable offerings and may not achieve the broad market acceptance necessary to generate significant revenues.
The markets for our advertising platform may not develop and we may fail in our ability to fully exploit these opportunities if these markets do not develop as we anticipate.
The market for interactive television advertising is at an early stage of development and we cannot assure you that we will succeed in our efforts to develop our advertising platform as a medium widely accepted by consumers and advertisers. In addition, Pay TV System providers who have a patent license from us are not required to provide advertising, although some have. Therefore our ability to derive advertising revenues from our patent licensees is also dependent on the implementation of advertising by such licensees.
Limitations on control of our IPG Inc. joint venture may adversely impact our operations in Japan.
We hold a 46% interest in IPG Inc., as a joint venture with nonaffiliated third parties, which hold the remaining interest. As a result of such arrangement, we may be unable to control the operations, strategies and financial decisions of IPG Inc. which could in turn result in limitations on our ability to implement strategies that we may favor, or to cause dividends or distributions to be paid. In addition, our ability to transfer our interests in IPG Inc. may be limited under the joint venture arrangement.
Consolidation of the telecommunications, cable and satellite broadcasting industry could adversely affect existing agreements.
We have entered into agreements with a large number of Pay TV Systems for the licensing or distribution of our technology, products and services. If consolidation of the telecommunications, cable and satellite broadcasting industry continues, some of these agreements may be affected by mergers, acquisitions or system swaps which could result in an adverse effect on the amount of revenue we receive under these types of agreements.
We have limited control over existing and potential customers' and licensees' decisions to include our technology in their product and service offerings.
In general, we are dependent on our customers and licensees to incorporate our technology into their products and services. Although we have license agreements with many of these companies, many of these license agreements do not require any minimum purchase commitments, or are on a non-exclusive basis, or do not require incorporation of our technology in their products and services. If our customers were to determine that the benefits of our technology do not justify the cost of licensing the technology, then demand for our technology would decline. Furthermore, while we may be successful in having one or more industry standards-setting organizations require that our technology be used in order for a product to be compliant with the standards promulgated by such organizations, there is no guarantee that products associated with these standards will be successful in the market. Our licensees and other manufacturers might not utilize our technology in the future. If this were to occur, our business would be harmed.
We are dependent on third parties for Metadata, third party images and content.
We distribute, as a revenue generating activity, Metadata. In the future, we may not be able to obtain this content, or may not be able to obtain it on the same terms. Such a failure to obtain the content, or obtain it on the same terms, could damage the attractiveness of our Metadata offerings to our customers, or could increase the costs associated with providing our Metadata offerings, and could thus cause revenues or margins to decrease.
Qualifying, certifying and supporting our technologies, products and services is time consuming and expensive.
We devote significant time and resources to qualify and support our software products on various PC, CE and mobile platforms, including Microsoft, Apple and Android operating systems. In addition, we maintain high-quality standards for products that incorporate our technologies and products through a quality control certification process. To the extent that any
23
previously qualified, certified and/or supported platform or product is modified or upgraded, or we need to qualify, certify or support a new platform or product, we could be required to expend additional engineering time and resources, which could add significantly to our development expenses and adversely affect our operating results.
The success of certain of our solutions depends on the interoperability of our technologies with consumer hardware devices.
To be successful we design certain of our solutions to interoperate effectively with a variety of consumer hardware devices, including personal computers, DVD players and recorders, Blu-ray players, digital still cameras, digital camcorders, portable media players, digital TVs, home media centers, set-top boxes, video game consoles, MP3 devices, multi-media storage devices and mobile tablets and handsets. We depend on significant cooperation with manufacturers of these devices and the components integrated into these devices, as well as software providers that create the operating systems for such devices, to incorporate certain of our technologies into their product offerings and ensure consistent playback of encoded files. Currently, a limited number of devices are designed to support our technologies. If we are unsuccessful in causing component manufacturers, device manufacturers and software providers to integrate our technologies into their product offerings, our technologies may become less accessible to consumers, which would adversely affect our revenue potential.
Some software we provide may be subject to “open source” licenses, which may restrict how we use or distribute our software or require that we release the source code of certain products subject to those licenses.
Some of the products we support and some of our proprietary technologies incorporate open source software such as open source codecs that may be subject to the Lesser Gnu Public License or other open source licenses. The Lesser Gnu Public License and other open source licenses may require that source code subject to the license be released or made available to the public. Such open source licenses may mandate that software developed based on source code that is subject to the open source license, or combined in specific ways with such open source software, become subject to the open source license. We take steps to ensure that proprietary software we do not wish to disclose is not combined with, or does not incorporate, open source software in ways that would require such proprietary software to be subject to an open source license. However, few courts have interpreted the Lesser Gnu Public License or other open source licenses, and the manner in which these licenses may be interpreted and enforced is therefore subject to some uncertainty. We often take steps to disclose source code for which disclosure is required under an open source license, but it is possible that we have or will make mistakes in doing so, which could negatively impact our brand or our adoption in the community, or could expose us to additional liability. In addition, we rely on multiple software programmers to design our proprietary products and technologies. Although we take steps to ensure that our programmers (both internal and outsourced) do not include open source software in products and technologies we intend to keep proprietary, we cannot be certain that open source software is not incorporated into products and technologies we intend to keep proprietary. In the event that portions of our proprietary technology are determined to be subject to an open source license, or are intentionally released under an open source license, we could be required to publicly release the relevant portions of our source code, which could reduce or eliminate our ability to commercialize our products and technologies. Also, in relying on multiple software programmers to design products and technologies that we intend, or ultimately end up releasing in the open source community, we may discover that one or multiple such programmers have included code or language that would be embarrassing to us, which could negatively impact our brand or our adoption in the community, or could expose us to additional liability.
Our operating results may fluctuate, which may cause us to not be able to sustain our revenue levels or rate of revenue growth on a quarterly or annual basis, which may cause our common stock price to decline.
Our quarterly and annual revenues, expenses and operating results could vary significantly in the future and period-to-period comparisons should not be relied upon as indications of future performance. We may not be able to sustain our revenue levels, or our rate of revenue growth, on a quarterly or annual basis. In addition, we may be required to delay or extend recognition of revenue on more complex licensing arrangements as required under generally accepted accounting principles in the United States. Fluctuations in our operating results have in the past caused, and may in the future cause, the price of our common stock to decline.
Other factors that could affect our operating results include:
• | the acceptance of our technologies by Pay TV System operators and CE manufacturers; |
• | expenses related to, and the financial impact of, possible acquisitions of other businesses and the integration of such businesses; |
• | expenses related to, and the financial impact of, the dispositions of businesses, including post-closing indemnification obligations; |
24
• | the timing and ability of signing high-value licensing agreements during a specific period; |
• | the potential that we may not be in a position to anticipate a decline in revenues in any quarter until (i) late in the quarter due to the closing of sales agreements late in the quarter or (ii) after the quarter ends due to the delay inherent in reporting from certain licensees; |
• | the extent to which new content technologies or formats replace technologies to which our solutions are targeted; |
• | the pace at which our analog and older products sales decline compared to the pace at which our digital and new product revenues grow, and |
• | adverse changes in the level of economic activity in the United States or other major economies in which we do business as a result of the threat of terrorism, military actions taken by the United States or its allies, or generally weak and uncertain economic and industry conditions. |
Our quarterly operating results may also fluctuate depending upon when we receive royalty reports from certain licensees. We recognize a portion of our license revenue only after we receive royalty reports from our licensees regarding the manufacture of their products that incorporate our technologies. As a result, the timing of our revenue is dependent upon the timing of our receipt of those reports, some of which are not delivered until late in the quarter or after the end of the quarter. This may put us in a position of not being able to anticipate a decline in revenues in any given quarter. In addition, it is not uncommon for royalty reports to include corrective or retroactive royalties that cover extended periods of time. Furthermore, there have been times in the past when we have recognized an unusually large amount of licensing revenue from a licensee in a given quarter because not all of our revenue recognition criteria were met in prior periods. This can result in a large amount of licensing revenue from a licensee being recorded in a given quarter that is not necessarily indicative of the amounts of licensing revenue to be received from that licensee in future quarters, thus causing fluctuations in our operating results.
A significant portion of our revenue is derived from international sales. Economic, political, regulatory and other risks associated with our international business or failure to manage our global operations effectively could have an adverse effect on our operating results.
As of December 31, 2014, we had two major locations (defined as a location with more than 50 employees) and employed approximately 280 employees in our continuing operations outside the United States. We face challenges inherent in efficiently managing employees over large geographic distances, including the need to implement appropriate systems, controls, policies, benefits and compliance programs. Our inability to successfully manage our global organization could have a material adverse effect on our business and results of operations.
We expect that international and export sales will continue to represent a substantial portion of our revenues for the foreseeable future. Our future growth will depend to a large extent on worldwide acceptance and deployment of our solutions.
To the extent that foreign governments impose restrictions on importation of programming, technology or components from the United States, the demand for our solutions in these markets could diminish. In addition, the laws of some foreign countries may not protect our intellectual property rights to the same extent as do the laws of the United States, which increases the risk of unauthorized use of our technologies. Such laws also may not be conducive to copyright protection of digital content, which may make our content protection technology less effective and reduce the demand for it.
Because we sell our products and services worldwide, our business is subject to the risks associated with conducting business internationally, including:
• | foreign government regulation; |
• | changes in diplomatic and trade relationships; |
• | changes in, or imposition of, foreign laws and regulatory requirements and the costs of complying with such laws (including consumer and data protection laws); |
• | changes in, or weakening of copyright and intellectual property (patent) laws; |
• | difficulty of effective enforcement of contractual provisions in local jurisdictions or difficulty in obtaining export licenses for certain technology; |
• | import and export restrictions and duties, including tariffs, quotas or taxes and other trade barriers and restrictions; |
25
• | fluctuations in our net effective income tax rate driven by changes in the percentage of revenues that we derive from international sources; |
• | changes in a specific country's or region's political or economic condition, including changes resulting from the threat of terrorism; |
• | difficulty in staffing and managing foreign operations, including compliance with laws governing labor and employment; and |
• | fluctuations in foreign currency exchange rates. |
Our business could be materially adversely affected if foreign markets do not continue to develop, if we do not receive additional orders to supply our technologies, products or services for use by foreign Pay TV System operators, CE manufacturers and PPV/VOD providers or if regulations governing our international businesses change. Any changes to the statutes or the regulations with respect to export of encryption technologies could require us to redesign our products or technologies or prevent us from selling our products and licensing our technologies internationally.
We face risks with respect to conducting business in China due to China's historically limited recognition and enforcement of intellectual property and contractual rights and because of certain political, economic and social uncertainties relating to China.
We have direct license relationships with many consumer hardware device manufacturers located in China and a number of the electronics companies that license our technologies utilize captive or third-party manufacturing facilities located in China. We expect consumer hardware device manufacturing in China to continue to increase due to its lower manufacturing cost structure as compared to other industrialized countries. As a result, we face additional risks in China, in large part due to China's historically limited recognition and enforcement of contractual and intellectual property rights. In particular, we have experienced, and expect to continue to experience, problems with China-based consumer hardware device manufacturers underreporting or failing to report shipments of their products that incorporate our technologies, or incorporating our technologies or trademarks into their products without our authorization or without paying us licensing fees. We may also experience difficulty enforcing our intellectual property rights in China, where intellectual property rights are not as respected as they are in the United States, Japan and Europe. Unauthorized use of our technologies and intellectual property rights by China-based consumer hardware device manufacturers may dilute or undermine the strength of our brands. If we cannot adequately monitor the use of our technologies by China-based consumer hardware device manufacturers, or enforce our intellectual property rights in China, our revenue could be adversely affected.
We have made and expect to make significant investments in infrastructure which, if ineffective, may adversely affect our business results.
We have made and expect to make significant investments in infrastructure, tools, systems, technologies and content, including initiatives relating to digital asset and rights management, cloud-based systems and technologies and data warehouses, aimed to create, assist in the development or operation of, or enhance our ability to deliver innovative products and services across multiple media, digital and emerging platforms. These investments may ultimately cost more than is anticipated, their implementation may take longer than expected and they may not meaningfully contribute to or result in successful new or enhanced products, services or technologies.
Some terms of our agreements with licensees could be interpreted in a manner that could adversely affect licensing revenue payable to us under those agreements.
Some of our license agreements contain “most favored nation” clauses. These clauses typically provide that if we enter into an agreement with another licensee on more favorable terms, we must offer some of those terms to our existing licensees. We have entered into a number of license agreements with terms that differ in some respects from those contained in other agreements. These agreements may obligate us to provide different, more favorable, terms to licensees, which could, if applied, result in lower revenues or otherwise adversely affect our business, financial condition, results of operations or prospects. While we believe that we have appropriately complied with the most favored nation terms included in our license agreements, these contracts are complex and other parties could reach a different conclusion that, if correct, could have an adverse effect on our financial condition or results of operations.
Changes in the nature or level of customer support we provide customers of our technology, product and service offerings could cause us to defer the recognition of revenue, which could adversely impact our short-term operating results.
26
Our technologies, products and services contain advanced features and functionality that may require us to increase the levels of, or revise the nature of, our end user support. Our customers may also require us to provide various benefits over longer service terms. To the extent that we offer a greater degree of customer support and ongoing services, we may be required to defer a greater percentage of revenues into future periods, which could harm short-term operating results.
Our products and services could be susceptible to errors, defects, or unintended performance problems that could result in lost revenues, liability or delayed or limited market acceptance.
We develop and offer complex solutions, which we license and otherwise provide to customers. The performance of these solutions typically involves working with sophisticated software, computing and communications systems. Due to the complexity of these products and services, and despite our quality assurance testing, the products may contain undetected defects or errors that may affect the proper use or application of such products or services by the customer. Because our products and services are embedded in digital content and other software, or rely on stable transmissions, our solutions' performance could unintentionally jeopardize our customers' product performance. Any such defects, errors, or unintended performance problems in existing or new products or services, and any inability to meet customer expectations in a timely manner, could result in loss of revenue or market share, failure to achieve market acceptance, diversion of development resources, injury to our reputation, increased insurance costs and increased service costs, any of which could materially harm our business.
In addition, we rely on customers, third party replicators, bandwidth providers and other distributors to properly use and distribute our products and services and to protect the software and applications to which our technology may be applied. Any improper distribution, use or application of the services or software by customers, bandwidth providers or other distributors, or third party replicators may render our technologies useless and result in losses or claims.
Because customers rely on our products and services as used in their software and applications, defects or errors in our products or services may discourage customers from purchasing our products or services. These defects or errors could also result in product liability, service level agreement claims or warranty claims. Although we attempt to reduce the risk of losses resulting from these claims through warranty disclaimers and limitation of liability clauses in our agreements, these contractual provisions may not be enforceable in every instance. Furthermore, although we maintain errors and omissions insurance, this insurance may not adequately cover these claims. If a court refused to enforce the liability-limiting provisions of our contracts for any reason, or if liabilities arose that were not contractually limited or adequately covered by insurance, our business could be materially harmed.
In protecting copyrights and other intellectual property rights of our customers, our products affect consumer use of our customers' products. Consumers may view this negatively and discontinue or threaten to discontinue purchase or use of our customers' products unless our customers stop using our technologies. This may cause a decline in demand for our products or legal actions against us by our customers or consumers.
Government regulations may adversely affect our business.
The satellite transmission, cable and telecommunications industries are subject to pervasive federal regulation, including FCC licensing and other requirements. These industries are also often subject to extensive regulation by local and state authorities. While these regulations do not apply directly to us, they affect cable television providers and other multi-channel video programming distributors, or MVPDs, which are the primary customers for certain of our products and services. FCC regulations prohibit MVPDs (except DBS providers) from deploying navigation devices (e.g., set-top boxes) with combined security and non-security functions acquired after July 1, 2007 (the “integration ban”) until December 4, 2015. The FCC has granted a number of requests for waiver of the integration ban, and denied several petitions for waivers or deferrals. Petitions for reconsideration of the decisions denying waivers are pending before the FCC. Further developments with respect to these issues or other related FCC action could impact the availability and/or demand for “plug and play” devices, including set-top boxes, all of which could affect demand for IPGs incorporated in set-top boxes or CE devices and correspondingly affect our license fees.
Legislative initiatives seeking to, or judicial or regulatory decisions that, weaken copyright law or patent protection, or new governmental regulation or new interpretation of existing laws that cause resulting legal uncertainties could harm our business.
Consumer rights advocates and other constituencies continuously challenge copyright law, notably the U.S. Digital Millennium Copyright Act of 1998, or DMCA, through both legislative and judicial actions. Legal uncertainties surrounding the application of the DMCA may adversely affect our business. If copyright law is compromised, or devices that can circumvent our technology are permitted by law and become prevalent, this could result in reduced demand for our technologies, and our business would be harmed.
27
Similarly, the standards that courts use to interpret patents are not always applied predictably or uniformly and may evolve, particularly as new technologies develop. For example, the U.S. Supreme Court has recently modified some legal standards applied by the U.S. Patent and Trademark Office in examination of U.S. patent applications, which may decrease the likelihood that we will be able to obtain patents and may increase the likelihood of challenges to patents we obtain or license. Additionally, the Leahy-Smith America Invents Act (the "Leahy-Smith Act") includes a number of significant changes to the U.S. patent laws, such as, among other things, changing from a "first to invent" to a "first inventor to file" system, establishing new procedures for challenging patents and establishing different methods for invalidating patents. The U.S. Patent and Trademark Office is still in the process of implementing regulations relating to these changes, and the courts have yet to address many of the new provisions of the Leahy-Smith Act. Some of these changes or potential changes may not be advantageous to the Company, and it may become more difficult to obtain adequate patent protection or to enforce the Company's patents against third parties. While the Company cannot predict the impact of the Leahy-Smith Act at this time, these changes or potential changes could increase the costs and uncertainties surrounding the prosecution of the Company's patent applications and adversely affect the Company's ability to protect its intellectual property.
Many laws and regulations are pending and may be adopted in the United States, individual states and local jurisdictions and other countries with respect to the Internet. These laws may relate to many areas that impact our business, including copyright and other intellectual property rights, digital rights management, property ownership and taxation. These types of regulations are likely to differ between countries and other political and geographic divisions. Other countries and political organizations are likely to impose or favor more and different regulation than that which has been proposed in the United States, thus furthering the complexity of regulations. In addition, state and local governments may impose regulations in addition to, inconsistent with, or stricter than federal regulations. Changes to or the interpretation of these laws could increase our costs, expose us to increased litigation risk, substantial defense costs and other liabilities or require us or our customers to change business practices. It is not possible to predict whether or when such legislation may be adopted, and the adoption of such laws or regulations, and uncertainties associated with their validity, interpretation, applicability and enforcement, could materially and adversely affect our business.
Business interruptions could adversely affect our future operating results.
The provision of certain of our products and services depends on the continuing operation of communications and transmission systems and mechanisms, including satellite, cable, wire, over the air broadcast communications and transmission systems and mechanisms. These communication and transmission systems and mechanisms are subject to significant risks and any damage to or failure of these systems and mechanisms could result in an interruption of the provision of our products and services.
Several of our major business operations are subject to interruption by earthquake, fire, power shortages, terrorist attacks and other hostile acts, and other events beyond our control. The majority of our research and development activities, our corporate headquarters, our principal information technology systems, and other critical business operations are located near major seismic faults. Our operating results and financial condition could be materially harmed in the event of a major earthquake or other natural or man-made disaster that disrupts our business. The communications and transmission systems and mechanisms that we depend on are not fully redundant, and our disaster recovery planning cannot account for all eventualities.
If we fail to maintain proper and effective internal controls, our ability to produce accurate financial statements could be impaired, which could increase our operating costs and affect our ability to operate our business.
We have a complex business that is international in scope. Ensuring that we have adequate internal financial and accounting controls and procedures in place to help ensure that we can produce accurate financial statements on a timely basis is a costly and time-consuming effort that needs to be re-evaluated frequently. We are continually in the process of documenting, reviewing and, if appropriate, improving our internal controls and procedures in connection with Section 404 of the Sarbanes-Oxley Act of 2002, which requires annual management assessments of the effectiveness of our internal control over financial reporting and a report by our independent registered public accountants on the effectiveness of our internal controls over financial reporting. If we or our independent registered public accountants identify areas for further attention or improvement, implementing any appropriate changes to our internal controls may require specific compliance training of our directors, officers and employees, entail substantial costs in order to modify our existing accounting systems, and take a significant period of time to complete. We have in the past identified, and may in the future identify, significant deficiencies in the design and operation of our internal controls, which have been or will in the future need to be remediated. Furthermore, our independent registered public accountants may interpret the Section 404 requirements and the related rules and regulations differently from how we interpret them, or our independent registered public accountants may not be satisfied with our internal control over financial reporting or with the level at which these controls are documented, operated or reviewed in the future. Finally, in the event we make a significant acquisition, or a series of smaller acquisitions, we may face significant challenges in implementing the required processes and procedures in the acquired operations. As a result, our independent registered public
28
accountants may decline or be unable to report on the effectiveness of our internal controls over financial reporting or may issue a qualified report in the future. This could result in an adverse reaction in the financial markets due to investors' perceptions that our internal controls are inadequate or that we are unable to produce accurate financial statements.
We will incur costs and demands upon management as a result of complying with the laws and regulations affecting public companies, which could affect our operating results.
We have incurred, and will continue to incur, significant legal, accounting and other expenses associated with corporate governance and public company reporting requirements, including requirements under the Sarbanes-Oxley Act of 2002, as well as rules implemented by the SEC and NASDAQ. As long as the SEC requires the current level of compliance for public companies of our size, we expect these rules and regulations to require significant legal and financial compliance costs and to make some activities time-consuming and costly. These rules and regulations may make it more expensive for us to obtain director and officer liability insurance, and we may be required to accept reduced policy limits and coverage or incur substantially higher costs to obtain the same or similar coverage than was previously available. As a result, it may be more difficult for us to attract and retain qualified individuals to serve on our board of directors or as our executive officers.
We may be subject to assessment of sales and other taxes for the sale of our products, license of technology or provision of services.
We generally do not collect sales or other taxes on the sale of our products, license of technology or provision of services in states and countries other than those in which we have offices or employees. Our business would be harmed if one or more states or any foreign country required us to collect sales or other taxes from past sales of products, licenses of technology or provision of services, particularly because we would be unable to go back to customers to collect sales taxes for past sales and would likely have to pay such taxes out of our own funds.
The price of our common stock may be volatile.
The market price of our common stock has been, and in the future could be, significantly affected by factors such as:
• | actual or anticipated fluctuations in operating results; |
• | announcements of technical innovations; |
• | new products, services or contracts; |
• | announcements by competitors or their customers; |
• | announcements by our customers; |
• | governmental regulatory and copyright action; |
• | developments with respect to patents or proprietary rights; |
• | announcements regarding acquisitions or divestitures; |
• | announcements regarding litigation or regulatory matters; |
• | changes in financial estimates or coverage by securities analysts; |
• | changes in interest rates which affect the value of our investment portfolio; |
• | changes in tax law or the interpretation of tax laws; and |
• | general market conditions. |
Announcements by satellite television operators, cable television operators, major content providers or others regarding CE business or Pay TV System combinations, evolving industry standards, consumer rights activists' “wins” in government regulations or the courts, motion picture production or distribution or other developments could cause the market price of our common stock to fluctuate substantially.
There can be no assurance that our historic trading prices, or those of technology companies in general, will be sustained. In the past, following periods of volatility in the market price of a company's securities, some companies have been named in class action suits.
29
Further, the general stock market instability and economic uncertainty may adversely affect the global financial markets, which could cause the market price of our common stock to fluctuate substantially.
Our systems and networks are subject to security and stability risks that could harm our business and reputation and expose us to litigation or liability.
Online business activities depend on the ability to store and transmit confidential information and licensed intellectual property securely on our systems, third party systems and over private and public networks. Any compromise of our ability to store or transmit such information and data securely or reliably, and any costs associated with preventing or eliminating such problems, could harm our business. Storage and online transmissions are subject to a number of security and stability risks, including:
• | our own or licensed encryption and authentication technology, or access or security procedures, may be compromised, breached or otherwise be insufficient to ensure the security of customer information or intellectual property; |
• | we could experience unauthorized access, computer viruses, system interference or destruction, “denial of service” attacks and other disruptive problems, whether intentional or accidental, that may inhibit or prevent access to our websites or use of our products and services, or cause customer information or other sensitive information to be disclosed to a perpetrator, others or the general public; |
• | someone could circumvent our security measures and misappropriate our, our business relations or customers' proprietary information or content or interrupt operations, or jeopardize our licensing arrangements, many of which are contingent on our sustaining appropriate security protections; |
• | our computer systems could fail and lead to service interruptions or downtime for television or other guidance systems, or websites, which may include e-commerce websites; |
• | we could inadvertently disclose customer information; or |
• | we may need to grow, reconfigure or relocate our data centers in response to changing business needs, which may be costly and lead to unplanned disruptions of service. |
The occurrence of any of these or similar events could damage our business, hurt our ability to distribute products and services and collect revenue, threaten the proprietary or confidential nature of our technology, harm our reputation, and expose us to litigation or liability. Because some of our technologies and businesses are intended to inhibit use of or restrict access to our customers' intellectual property, we may become the target of hackers or other persons whose use of or access to our customers' intellectual property is affected by our technologies. Also, hackers may, for financial gain or other motives, seek to infiltrate or damage our systems, or obtain sensitive business information or customer information. We also may be exposed to customer claims, or other liability, in connection with any security breach or inadvertent disclosure. We may be required to expend significant capital or other resources to protect against the threat of security breaches, hacker attacks or system malfunctions or to alleviate problems caused by such breaches, attacks or failures.
Our product and service offerings rely on a variety of systems, networks and databases, many of which are maintained by us at our data centers. We do not have complete redundancy for all of our systems, and we do not maintain real-time back-up of our data, so in the event of significant system disruption, particularly during peak periods, we could experience loss of data processing capabilities, which could cause us to lose customers and could harm our operating results. Notwithstanding our efforts to protect against “down time” for products and services, we do occasionally experience unplanned outages or technical difficulties. In order to provide products and services, we must protect the security of our systems, networks, databases and software.
We utilize non-GAAP reporting in our quarterly earnings press releases.
We publish non-GAAP financial measures in our quarterly earnings press releases along with a reconciliation of non-GAAP financial measures to those measures compiled in accordance with accounting principles generally accepted in the United States (“GAAP”). The reconciling items have adjusted GAAP net income and GAAP earnings per share for certain non-cash, non-operating or non-recurring items and are described in detail in each such quarterly earnings press release. We believe that this presentation may be more meaningful to investors in analyzing the results of operations and income generation as this is how our business is managed. The market price of our stock may fluctuate based on future non-GAAP results if investors base their investment decisions upon such non-GAAP financial measures. If we decide to curtail use of non-GAAP financial measures in our quarterly earnings press releases, the market price of our stock could be affected if investors analyze our performance in a different manner.
30
ITEM 1B. UNRESOLVED STAFF COMMENTS
None.
ITEM 2. PROPERTIES
The following table lists our principal locations and leases.
Location | Approximate Square Footage | Lease Expiration |
Santa Clara, California (Corporate Headquarters) | 87,000 | January 2017 |
Wayne, Pennsylvania | 65,000 | October 2025 |
Burbank, California | 62,000 | June 2019 |
Tulsa, Oklahoma | 46,000 | June 2016 |
Ann Arbor, Michigan | 34,000 | April 2015 |
Bangalore, India | 24,000 | November 2017 |
Luxembourg | 18,000 | February 2021 |
Most U.S. sales, marketing and technical personnel for all product divisions are in these locations. We also lease space for sales, marketing and technical staff in San Mateo and San Diego, California; Golden, Colorado; Boston, Massachusetts; New York, New York; Plano, Texas; London and Maidenhead, United Kingdom; Shanghai, China; Tokyo, Japan and Seoul, South Korea. A small number of individuals operate out of their home offices. We believe that our existing facilities are adequate to meet current requirements and that additional or substitute space will be available as needed to accommodate any expansion of operations.
ITEM 3. LEGAL PROCEEDINGS
The Company is involved in legal proceedings related to intellectual property rights and other matters. The following legal proceedings include those of the Company and its subsidiaries.
Indemnifications. In the normal course of business, the Company provides indemnification of varying scopes and amounts to certain of its licensees against claims made by third parties arising out of the use and/or incorporation of the Company's products, intellectual property, services and/or technologies into the licensee's products and services. In some cases, the Company may receive tenders of defense and indemnity arising out of products, intellectual property, services and/or technologies that are no longer provided by the Company due to having divested certain assets, but which were previously licensed or provided by the Company. The Company's indemnification obligations are typically limited to the cumulative amount paid to the Company by the licensee under the license agreement, however some license agreements, including those with the Company's largest multiple system operators and digital broadcast satellite providers, have larger limits or do not specify a limit on amounts that may be payable under the indemnity arrangements. The Company cannot estimate the possible range of losses that may affect the Company's results of operations or cash flows in a given period or the maximum potential impact of these indemnification provisions on its future results of operations.
Litigation. The Company is party to various legal actions, claims and proceedings as well as other actions, claims and proceedings incidental to its business. The Company has established loss provisions only for matters in which losses are probable and can be reasonably estimated. Some of the matters pending against the Company involve potential compensatory, punitive or treble damage claims, or sanctions, that if granted, could require the Company to pay damages or make other expenditures in amounts that could have a material adverse effect on its financial position or results of operations. At this time, management has not reached a determination that any litigation matters, individually or in the aggregate, are expected to result in liabilities that will have a material adverse effect on the Company's financial position or results of operations or cash flows.
31
ITEM 4. MINE SAFETY DISCLOSURES
Not applicable.
32
PART II
ITEM 5. MARKET FOR REGISTRANT'S COMMON EQUITY, RELATED STOCKHOLDER MATTERS AND ISSUER PURCHASES OF EQUITY SECURITIES
Market Information and Holders
The common stock of Rovi Corporation has been listed on the NASDAQ Global Select Market under the symbol “ROVI” since July 16, 2009. Prior to changing its name to Rovi Corporation on July 15, 2009, the Company was named Macrovision Solutions Corporation and traded under the symbol “MVSN”. The following table sets forth, for the periods indicated, the reported high and low sales prices for the common stock of Rovi Corporation:
High | Low | ||||||
2014 | |||||||
First Quarter | $ | 25.34 | $ | 19.56 | |||
Second Quarter | $ | 25.09 | $ | 19.50 | |||
Third Quarter | $ | 25.12 | $ | 19.55 | |||
Fourth Quarter | $ | 23.38 | $ | 17.52 | |||
2013 | |||||||
First Quarter | $ | 21.62 | $ | 15.62 | |||
Second Quarter | $ | 26.55 | $ | 20.00 | |||
Third Quarter | $ | 23.75 | $ | 17.30 | |||
Fourth Quarter | $ | 20.06 | $ | 16.00 | |||
As of February 13, 2015, the closing price of our common stock as reported on the NASDAQ Global Select Market was $24.21 per share and there were 800 holders of record of our common stock, based upon information furnished by American Stock Transfer & Trust Company, the transfer agent for our securities. The number of beneficial stockholders is substantially greater than the number of holders of record as a large portion of our common stock is held through brokerage firms. As of February 13, 2015, there were 91,939,167 shares of common stock outstanding.
Stock Performance Graph*
The graph below shows a comparison of the cumulative total stockholder return on our common stock with the cumulative total return on the NASDAQ Composite Index (the “NASDAQ”), the S&P 500 Composite Index (the “S&P 500”) and the Russell 2000 Index (“Russell 2000”) from December 31, 2009 through December 31, 2014. The graph assumes an investment of $100 in our common stock and in each of the market indices, and further assumes the reinvestment of all dividends. The comparisons in the graph below are based on historical data and are not intended to forecast the possible future performance of our common stock.
33
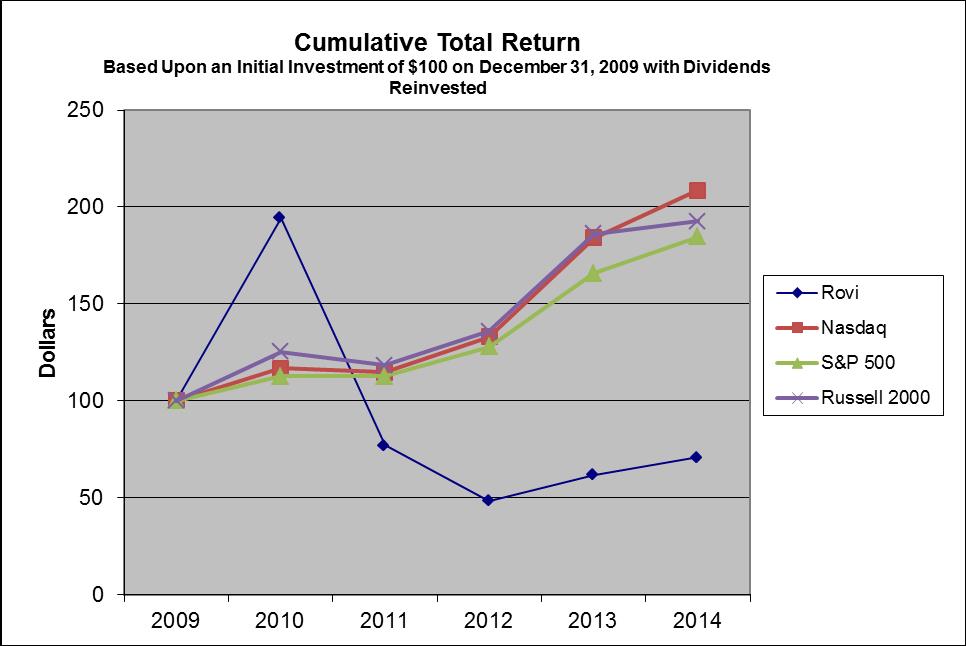
Rovi Corporation | NASDAQ Composite Index | S&P 500 | Russell 2000 Index | ||||||||||||
December 31, 2009 | $ | 100 | $ | 100 | $ | 100 | $ | 100 | |||||||
December 31, 2010 | $ | 195 | $ | 117 | $ | 113 | $ | 125 | |||||||
December 31, 2011 | $ | 77 | $ | 115 | $ | 113 | $ | 118 | |||||||
December 31, 2012 | $ | 48 | $ | 133 | $ | 128 | $ | 136 | |||||||
December 31, 2013 | $ | 62 | $ | 184 | $ | 166 | $ | 186 | |||||||
December 31, 2014 | $ | 71 | $ | 209 | $ | 185 | $ | 193 | |||||||
* The material in this section is not “soliciting material,” is not deemed filed with the SEC and is not to be incorporated by reference in any filing of Rovi Corporation under the Securities Act of 1933, as amended, or the Securities Exchange Act of 1934, as amended, whether made before or after the date hereof and irrespective of any general incorporation language in such filing.
Dividend Policy
We have not paid any cash dividends in the last two years and do not anticipate paying any cash dividends on our common stock in the foreseeable future. At this time, we intend to retain all earnings for use in our business operations and to pay down debt. Our Amended and Restated Credit Agreement contains customary affirmative and negative covenants applicable to the Company and its subsidiaries, including, among other things, restrictions on dividends and other distributions (See Note 7 to the Consolidated Financial Statements).
Issuer Purchases of Equity Securities
The following table provides information about Company purchases of its equity securities during the quarter ended December 31, 2014:
34
Period | Total Number of Shares Purchased | Average Price Paid Per Share | Total Number of Shares Purchased as Part of Publicly Announced Plans or Programs | Approximate Dollar Value of Shares that May Yet Be Purchased Under the Plans or Programs (in millions) (1) | ||||||||||||
October 1, 2014 to October 31, 2014 | — | — | — | $ | 200.0 | |||||||||||
November 1, 2014 to November 30, 2014 | 1,426,266 | $ | 22.12 | 1,426,266 | $ | 168.5 | ||||||||||
December 1, 2014 to December 31, 2014 | 1,901,160 | $ | 22.01 | 1,901,160 | $ | 126.6 | ||||||||||
Total | 3,327,426 | 3,327,426 | ||||||||||||||
(1) In April 2014, the Company's Board of Directors authorized the repurchase of up to $200.0 million of the Company's common stock. This authorization does not have an expiration date.
ITEM 6. SELECTED FINANCIAL DATA
The following table sets forth selected consolidated financial data and other operating information. The financial data does not purport to indicate results of operations as of any future date or for any future period. The financial data is derived from our consolidated financial statements and should be read in conjunction with the consolidated financial statements, related notes and other financial information included herein.
35
Year Ended December 31, | ||||||||||||||||||||
2014 | 2013 | 2012 | 2011 | 2010 | ||||||||||||||||
(in thousands, except per share data) | ||||||||||||||||||||
Consolidated Statements of Operations Data: | ||||||||||||||||||||
Revenues | $ | 542,311 | $ | 537,390 | $ | 526,094 | $ | 584,124 | $ | 541,490 | ||||||||||
Costs and expenses: | ||||||||||||||||||||
Operating expenses, exclusive of items shown below | 352,735 | 355,231 | 362,631 | 370,597 | 337,013 | |||||||||||||||
Depreciation | 17,540 | 16,775 | 19,956 | 18,747 | 18,758 | |||||||||||||||
Amortization of intangible assets | 77,887 | 74,413 | 74,337 | 77,145 | 80,395 | |||||||||||||||
Restructuring and asset impairment charges | 10,939 | 7,638 | 4,737 | 20,462 | — | |||||||||||||||
Gain on sale of patents | (500 | ) | — | — | — | — | ||||||||||||||
Total costs and expenses | 458,601 | 454,057 | 461,661 | 486,951 | 436,166 | |||||||||||||||
Operating income from continuing operations | 83,710 | 83,333 | 64,433 | 97,173 | 105,324 | |||||||||||||||
Interest expense | (54,768 | ) | (62,019 | ) | (61,742 | ) | (53,776 | ) | (42,935 | ) | ||||||||||
Interest income and other, net | 4,069 | 2,775 | 3,203 | 4,856 | 1,770 | |||||||||||||||
Debt modification expense | (3,775 | ) | (1,351 | ) | (4,496 | ) | — | — | ||||||||||||
(Loss) income on interest rate swaps, net | (17,874 | ) | 2,898 | (10,624 | ) | (4,314 | ) | 34,197 | ||||||||||||
Loss on debt redemption | (5,159 | ) | (2,761 | ) | (1,758 | ) | (11,514 | ) | (16,806 | ) | ||||||||||
Gain on sale of strategic investments | — | — | — | — | 5,895 | |||||||||||||||
Income (loss) from continuing operations before income taxes | 6,203 | 22,875 | (10,984 | ) | 32,425 | 87,445 | ||||||||||||||
Income tax expense (benefit) | 19,725 | 1,540 | 9,158 | 24,258 | (139,213 | ) | ||||||||||||||
(Loss) income from continuing operations, net of tax | (13,522 | ) | 21,335 | (20,142 | ) | 8,167 | 226,658 | |||||||||||||
Discontinued operations, net of tax | (56,222 | ) | (193,425 | ) | (14,202 | ) | (49,453 | ) | (13,774 | ) | ||||||||||
Net (loss) income | $ | (69,744 | ) | $ | (172,090 | ) | $ | (34,344 | ) | $ | (41,286 | ) | $ | 212,884 | ||||||
Basic earnings per common share: | ||||||||||||||||||||
Basic (loss) income per share from continuing operations | $ | (0.15 | ) | $ | 0.22 | $ | (0.19 | ) | $ | 0.07 | $ | 2.20 | ||||||||
Basic loss per share from discontinued operations | (0.61 | ) | (1.97 | ) | (0.14 | ) | (0.45 | ) | (0.14 | ) | ||||||||||
Basic net earnings (loss) per share | $ | (0.76 | ) | $ | (1.75 | ) | $ | (0.33 | ) | $ | (0.38 | ) | $ | 2.06 | ||||||
Shares used in computing basic net earnings per common share | 91,654 | 98,371 | 104,623 | 108,923 | 102,658 | |||||||||||||||
Diluted earnings per common share: | ||||||||||||||||||||
Diluted (loss) income per share from continuing operations | $ | (0.15 | ) | $ | 0.22 | $ | (0.19 | ) | $ | 0.07 | $ | 2.07 | ||||||||
Diluted loss per share from discontinued operations | (0.61 | ) | (1.96 | ) | (0.14 | ) | (0.43 | ) | (0.13 | ) | ||||||||||
Diluted net earnings (loss) per share | $ | (0.76 | ) | $ | (1.74 | ) | $ | (0.33 | ) | $ | (0.36 | ) | $ | 1.94 | ||||||
Shares used in computing diluted net earnings per common share | 91,654 | 99,092 | 104,623 | 113,131 | 109,175 | |||||||||||||||
36
December 31, | ||||||||||||||||||||
2014 | 2013 | 2012 | 2011 | 2010 | ||||||||||||||||
(in thousands) | ||||||||||||||||||||
Consolidated Balance Sheet Data: | ||||||||||||||||||||
Cash, cash equivalents, short and long-term investments | $ | 469,020 | $ | 641,121 | $ | 968,233 | $ | 485,480 | $ | 696,167 | ||||||||||
Working capital | 48,578 | 659,080 | 874,164 | 463,051 | 387,935 | |||||||||||||||
Total assets | 2,445,390 | 2,714,593 | 3,294,681 | 2,946,767 | 2,457,283 | |||||||||||||||
Long-term liabilities | 935,144 | 1,291,456 | 1,478,818 | 1,099,573 | 484,186 | |||||||||||||||
Total stockholders’ equity | 1,106,264 | 1,313,216 | 1,587,421 | 1,692,752 | 1,748,333 | |||||||||||||||
ITEM 7. MANAGEMENT’S DISCUSSION AND ANALYSIS OF FINANCIAL CONDITION AND RESULTS OF OPERATIONS
The following commentary should be read in conjunction with the Consolidated Financial Statements and related notes contained elsewhere in this Form 10-K. This discussion contains forward-looking statements based upon current expectations that involve risks and uncertainties. Our actual results may differ materially from those anticipated in these forward-looking statements as a result of various factors, including those set forth under “Risk Factors” included in Part I, Item 1A or in other parts of this report.
Overview
We are focused on powering content discovery and personalization through our technology and intellectual property, using data and analytics to monetize interactions across multiple entertainment platforms. We provide a broad set of integrated solutions that are embedded in our customers' products and services, connecting consumers with entertainment. Content discovery solutions include interactive program guides (“IPGs”), search and recommendations, cloud data services and our extensive database of Metadata. We also offer advertising and analytics services. Our advertising services are primarily sold in guides we provide or where a service provider allows us to sell advertising. Our analytics services utilize our proprietary data, data we acquire and data our customers acquire to offer our customers (including service providers, networks and advertisers) the opportunity to optimize their television advertising and promotional efforts. In addition to offering IPGs developed by us, our customers may also license our patents and deploy their own IPG or a third party IPG. We have patented many aspects of content discovery, DVR and VOD functionality, multi-screen functionality, as well as interactive applications and advertising. We have historically licensed this portfolio for use with linear television broadcast. However, there is an emerging industry transition to Internet platform technologies which is enabling new video services for television in homes as well as on multiple screens such as tablets and smartphones. We believe this transition presents new opportunities to license our intellectual property portfolio for different use cases and to different customers, as well as to develop, market and sell products and services which enable such functionality. Building upon this, we are establishing broad industry relationships with the companies leading the next generation of digital entertainment. Our strategy includes developing products and services that complement our intellectual property and address the opportunity presented by this industry transformation. Our solutions are deployed globally in the cable, satellite, consumer electronics, entertainment, media and online distribution markets.
Our patent portfolio provides the foundation for our intellectual property licensing business and includes over 5,000 issued patents and pending applications. Through ongoing investment, targeted acquisitions and strategic portfolio management, our patent portfolio has continued to grow in size and relevance. We generate substantially all of our intellectual property licensing revenue from our discovery patent portfolio, which represents approximately 77% of our total patents. For the year ended December 31, 2014, 22% of our revenue from continuing operations was related to our contracts with DIRECTV, Comcast and Time Warner Cable. These customers' current contracts expire in the second half of 2015 and first half of 2016.
During the third quarter of 2014, we reorganized our financial reporting into two segments; Intellectual Property Licensing and Products. Within our Intellectual Property Licensing Segment we group our revenue into the following categories (i) service providers and (ii) consumer electronics (“CE”) manufacturers. Service provider includes revenue from licensing our IPG patents to service providers and program guide providers in the multi-channel video service (cable, satellite and IPTV), the online and the over-the-top video businesses. We also include in service provider revenues any IPG patent revenue related to an IPG deployed by a service provider in a subscriber household whether the ultimate payment for that IPG comes from the service provider or from a manufacturer of a set-top box. CE includes the licensing of our IPG patents to consumer electronics manufacturers. Revenue related to an IPG deployed in a set-top box sold at retail is also included in CE manufacturers. Our Product Segment includes the results of our product businesses. Within our Product segment we group our
37
revenue into the following categories - (i) service providers, (ii) CE, and (iii) Other. Service provider revenue includes revenue from licensing our IPGs to service providers, advertising revenue from those IPGs, analytics revenue and revenue from licensing our Metadata to service providers. CE includes license revenue received from consumer electronics companies for our IPG products, Metadata and advertising revenue from our CE IPGs. Other revenue consists primarily of revenue generated from our legacy ACP, VCR Plus+, connected platform and media recognition products.
Costs and Expenses
Cost of revenues consists primarily of service costs, employee compensation and benefits, patent prosecution, patent maintenance and patent litigation costs and an allocation of overhead and facilities. Research and development expenses are comprised primarily of employee compensation and benefits, consulting costs and an allocation of overhead and facilities costs. Selling and marketing expenses are comprised primarily of employee compensation and benefits, travel, advertising and an allocation of overhead and facilities costs. General and administrative expenses are comprised primarily of employee compensation and benefits, travel, accounting, tax and corporate legal fees and an allocation of overhead and facilities costs.
Comparison of Years Ended December 31, 2014 and 2013
The following tables present our 2014 results of operations compared to the prior year (in thousands):
Year Ended December 31, | ||||||||||||||
2014 | 2013 | Change $ | Change % | |||||||||||
Revenues | $ | 542,311 | $ | 537,390 | 4,921 | 1 | % | |||||||
Costs and expenses: | ||||||||||||||
Cost of revenues, exclusive of amortization of intangible assets | 107,253 | 96,361 | 10,892 | 11 | % | |||||||||
Research and development | 108,746 | 111,326 | (2,580 | ) | (2 | )% | ||||||||
Selling, general and administrative | 136,736 | 147,544 | (10,808 | ) | (7 | )% | ||||||||
Depreciation | 17,540 | 16,775 | 765 | 5 | % | |||||||||
Amortization of intangible assets | 77,887 | 74,413 | 3,474 | 5 | % | |||||||||
Restructuring and asset impairment charges | 10,939 | 7,638 | 3,301 | 43 | % | |||||||||
Gain on sale of patents | (500 | ) | — | (500 | ) | NA | ||||||||
Total costs and expenses | 458,601 | 454,057 | 4,544 | 1 | % | |||||||||
Operating income from continuing operations | 83,710 | 83,333 | 377 | — | % | |||||||||
Interest expense | (54,768 | ) | (62,019 | ) | 7,251 | (12 | )% | |||||||
Interest income and other, net | 4,069 | 2,775 | 1,294 | 47 | % | |||||||||
Debt modification expense | (3,775 | ) | (1,351 | ) | (2,424 | ) | 179 | % | ||||||
(Loss) income on interest rate swaps, net | (17,874 | ) | 2,898 | (20,772 | ) | (717 | )% | |||||||
Loss on debt redemption | (5,159 | ) | (2,761 | ) | (2,398 | ) | 87 | % | ||||||
Income from continuing operations before income taxes | 6,203 | 22,875 | (16,672 | ) | (73 | )% | ||||||||
Income tax expense | 19,725 | 1,540 | 18,185 | 1,181 | % | |||||||||
(Loss) income from continuing operations, net of tax | (13,522 | ) | 21,335 | (34,857 | ) | (163 | )% | |||||||
Loss from discontinued operations, net of tax | (56,222 | ) | (193,425 | ) | 137,203 | (71 | )% | |||||||
Net loss | $ | (69,744 | ) | $ | (172,090 | ) | 102,346 | (59 | )% | |||||
Total Revenue
For the year ended December 31, 2014, total revenue increased by 1% compared to the prior year. This was driven by a $13.0 million increase in revenue from our Product segment partially offset by an $8.1 million decrease in revenue from our Intellectual Property Licensing segment. For additional details on the increase in revenue see the discussion of our segment results below.
Cost of Revenues
38
For the year ended December 31, 2014, cost of revenues increased from the prior year primarily due to the international expansion of our Metadata offering and an increase in professional services. These increases were partially offset by a $4.2 million decrease in patent litigation and prosecution costs.
Research and Development
For the year ended December 31, 2014, research and development expenses decreased from the prior year primarily due to a $7.0 million decrease in stock compensation expense, partially offset by a $5.3 million increase in consulting and other employee compensation expense primarily related to the development of our cloud-based platform and advanced search and recommendation services. The decrease in stock compensation expense in 2014 was driven by our actual forfeitures exceeding our forfeiture estimate, primarily due to our restructuring actions, and a decrease in the number of stock options granted in recent years.
Selling, General and Administrative
For the year ended December 31, 2014, selling, general and administrative expenses decreased from the prior year primarily due to a $7.5 million decrease in stock compensation expense, a $2.7 million reduction in our contingent consideration liability related to the Veveo acquisition, a $2.1 million decrease in marketing programs and a $1.0 million decrease in corporate legal expenses, partially offset by a $3.5 million increase in consulting expenses related to planning for the upcoming license renewals with Time Warner Cable and DIRECTV in the second half of 2015 and with Comcast and EchoStar in the first half of 2016 (see also Note 2 to the Consolidated Financial Statements). In 2014, legal expenses benefited from a $0.8 million reimbursement of legal fees related to a previously settled case. The decrease in stock compensation expense in 2014 was driven by our actual forfeitures exceeding our forfeiture estimate, primarily due to our restructuring actions, and a decrease in the number of stock options granted in recent years.
Depreciation
For the year ended December 31, 2014, depreciation increased from the prior year primarily due to an increase in average property and equipment balances.
Amortization of Intangible Assets
For the year ended December 31, 2014, amortization of intangible assets increased from the prior year primarily due to the Veveo acquisition and the acquisition of a patent portfolio for $28.0 million (See Note 4 to the Consolidated Financial Statements).
Restructuring and Asset Impairment Charges
In conjunction with the disposition of the Rovi Entertainment Store and DivX and MainConcept businesses and our narrowed business focus on discovery, we conducted a review of our remaining product development, sales, data operations and general and administrative functions to create cost efficiencies for the Company. As a result of this analysis, we took cost reduction actions that resulted in a restructuring and asset impairment charge of $10.6 million being recorded during 2014. In addition, during the three months ended March 31, 2014, we also recorded $0.3 million in expense related to the present value of lease payments for abandoned office space related to the restructuring action described below.
During 2013, we continued the review of our operations that began in the third quarter of 2012 (see Note 11 to the Consolidated Financial Statements). As a result of this analysis, we took additional cost reduction actions, which resulted in a restructuring charge of $7.6 million.
Gain on Sale of Patents
For the year ended December 31, 2014, we received $0.5 million from the sale of a patent. We anticipate selling additional patents in the future as we continue to look for additional ways to monetize patents we hold that are outside of our core discovery portfolio.
Interest Expense
For the year ended December 31, 2014, interest expense decreased compared to the prior year primarily due to a decrease in average debt outstanding.
Interest Income and Other, Net
39
Interest income and other, net increased compared to the prior year primarily due to the release of a $1.2 million contingent liability which was assumed in a prior acquisition.
(Loss) Income on Interest Rate Swaps, Net
We have not designated any of our interest rate swaps as hedges and therefore record the changes in fair value of these instruments in our Consolidated Statements of Operations (see Note 9 to the Consolidated Financial Statements). We generally utilize interest rate swaps to convert the interest rate on a portion of our floating rate term loans to a fixed rate. As under the terms of these interest rate swaps we receive a floating rate and pay a fixed rate, when there is an increase in expected future LIBOR rates we generally will have a gain when marking our interest rate swaps to fair value. When there is a decrease in expected future LIBOR rates we generally will have a loss when marking our interest rate swaps to fair value.
Loss on Debt Redemption and Debt Modification Expense
On July 2, 2014, we entered into a new Credit Agreement (the “Credit Agreement”). The Credit Agreement provides for (i) a five-year $125 million term loan A facility (the “Term Loan A Facility”), (ii) a seven-year $700 million term loan B facility (the “Term Loan B Facility” and together with the Term Loan A Facility, the “Term Loan Facility”) and (iii) a five-year $175 million revolving credit facility (including a letter of credit sub-facility) (“the Revolving Facility” and together with the Term Loan Facility, the “Senior Secured Credit Facility”). We used the proceeds of the Term Loan Facility, together with cash from our balance sheet, to repay existing loans under our previous credit agreement and to pay expenses related thereto. We accounted for the issuance of the Senior Secured Credit Facility and subsequent repayment of our previous credit facility as a partial debt modification, as a significant number of previous credit facility investors reinvested in the Senior Secured Credit Facility, and the change in the present value of future cash flows was less than 10%. Under debt modification accounting, $1.0 million in unamortized debt issuance costs related to previous credit facility investors who reinvested in Term Loan A Facility are being amortized to Term Loan A Facility interest expense using the effective interest method. In addition, $0.2 million in Term Loan A Facility debt issuance costs, related to new investors in Term Loan A Facility, are being amortized to Term Loan A Facility interest expense using the effective interest method. Under debt modification accounting, $1.7 million in unamortized debt issuance costs related to previous credit facility investors who reinvested in Term Loan B Facility are being amortized to Term Loan B Facility interest expense using the effective interest method. In addition, $3.0 million in Term Loan B Facility debt issuance costs, related to new investors in Term Loan B Facility, are being amortized to Term Loan B Facility interest expense using the effective interest method. Debt issuance costs of $3.8 million relating to the issuance of the Senior Secured Credit Facility to previous credit facility investors, have been recorded as debt modification expenses. In addition, the Company realized a loss on debt redemption of $5.2 million related to writing off the unamortized prior credit facility debt issuance costs related to investors who did not reinvest in the Senior Secured Credit Facility and the unamortized debt discount on the prior credit facility.
We accounted for the issuance of our prior term loan B-3 in April 2013 and subsequent repayment of term loan B-2 as a partial debt modification, as a significant number of term loan B-2 investors reinvested in term loan B-3, and the change in the present value of future cash flows between term loan B-2 and term loan B-3 was less than 10%. Under debt modification accounting, $3.6 million in unamortized debt issuance costs related to term loan B-2 investors who reinvested in term loan B-3 are being amortized to term loan B-3 interest expense using the effective interest method. In addition, $0.1 million in term loan B-3 debt issuance costs, related to new investors in term loan B-3, are being amortized to term loan B-3 interest expense using the effective interest method. Debt issuance costs of $1.0 million relating to the issuance of term loan B-3 to term loan B-2 investors, have been recorded as debt modification expenses for the year ended December 31, 2013. In addition, the Company realized a loss on debt redemption of $2.8 million related to writing off the unamortized term loan B-2 debt issuance costs related to investors who did not reinvest in term loan B-3 and the unamortized debt discount on term loan B-2.
Income Taxes
We recorded income tax expense from continuing operations for the year ended December 31, 2014, of $19.7 million, which primarily consists of $17.2 million of foreign withholding taxes, $0.9 million of foreign income taxes, $1.1 million of state income taxes, and $3.7 million of tax contingency reserves, reduced by $1.2 million of foreign deferred tax asset adjustments and $2.0 million from the net change in our deferred tax asset valuation allowance. Due to the fact that we have a significant net operating loss carryforward and we have recorded a valuation allowance against our deferred tax assets, foreign withholding taxes are the primary driver of our income tax expense.
We recorded an income tax expense from continuing operations for the year ended December 31, 2013, of $1.5 million, which primarily consists of $15.0 million of foreign withholding taxes, $0.2 million of foreign income taxes, and $0.3 million of state income taxes, reduced by $1.0 million from the net change in our deferred tax asset valuation allowance, and $13.0 million from the release of certain tax contingency reserves.
40
Discontinued Operations
Discontinued operations in 2014 includes the DivX and MainConcept business and the Nowtilus business. Loss on discontinued operations for the year ended December 31, 2014, is primarily due to the loss on the sale of the DivX, MainConcept and Nowtilus businesses.
Discontinued operations for the year ended December 31, 2013, includes the DivX and MainConcept business, the Rovi Entertainment Store business, the Consumer Web business, the Nowtilus business, expenses related to settling a patent claim against the Roxio Consumer Software business for the period prior to the business being sold and expenses we recorded for indemnification claims related to another former software business which was disposed of in 2008 (see Note 5 to Consolidated Financial Statements). The loss in discontinued operations for the year ended December 31, 2013, is primarily due to recording a $64.9 million impairment charge to the goodwill and intangible assets of the DivX and MainConcept business, a $73.1 million impairment charge to the assets of the Rovi Entertainment Store business and recording a $6.8 million impairment charge to the goodwill and intangible assets of the Consumer Website business as well the loss on disposal of the Rovi Entertainment Store (see Note 5 to the Consolidated Financial Statements).
Segment Results of Operations
We report segment information in the same way that management internally organizes its business for assessing performance and making decisions regarding the allocation of resources to its business units. Segment information for each of the periods presented below is reconciled to consolidated income (loss) from continuing operations before income taxes in Note 17 of the Consolidated Financial Statements. Discussion relating to Adjusted Operating Expenses and Adjusted EBITDA for our segments uses the definitions in Note 17 of the Consolidated Financial Statements.
Intellectual Property Licensing Segment
(in thousands) | Year Ended December 31, | ||||||||||||
2014 | 2013 | Change $ | Change % | ||||||||||
Intellectual Property Licensing Revenues: | |||||||||||||
Service provider | $ | 200,799 | $ | 194,324 | 6,475 | 3 | % | ||||||
CE | 84,359 | 98,886 | (14,527 | ) | (15 | )% | |||||||
Total revenue | 285,158 | 293,210 | (8,052 | ) | (3 | )% | |||||||
Adjusted Operating Expenses | 59,810 | 57,957 | 1,853 | 3 | % | ||||||||
Adjusted EBITDA | $ | 225,348 | $ | 235,253 | (9,905 | ) | (4 | )% | |||||
For the year ended December 31, 2014, Intellectual Property Licensing revenue decreased by 3%, as compared to the prior year, due to a 15% decrease in licensing revenue from CE manufacturers partially offset by a 3% increase in licensing revenue from service providers. The increase in revenue from service providers was due to continued growth in the number of subscribers for which we receive a patent license fee. This increase was partially off-set by a decline in service provider revenue related to catch-up payments, included in patent license agreements, to make us whole for the pre-license period of use. The decrease in revenue from CE manufacturers was due to a decline in revenue related to catch-up payments, included in patent license agreements, to make us whole for the pre-license period of use and a major CE manufacturer being out of contract in 2014. In 2015 we expect Intellectual Property Licensing revenue to increase due to growth in the number of subscribers for which we receive a patent license fee.
Intellectual Property Licensing segment Adjusted Operating Expenses increased by 3% during the year ended December 31, 2014, as compared to the prior year, primarily due to a $3.5 million increase in consulting expense related to planning for the upcoming major service provider license renewals and a $3.2 million increase in employee compensation. These increases were partially offset by a $4.2 million decrease in patent litigation and prosecution costs and a $0.5 million gain in 2014 from selling a patent.
Product Segment
41
(in thousands) | Year Ended December 31, | ||||||||||||
2014 | 2013 | Change $ | Change % | ||||||||||
Product Segment Revenues: | |||||||||||||
Service provider | $ | 204,877 | $ | 187,065 | 17,812 | 10 | % | ||||||
CE | 22,342 | 27,262 | (4,920 | ) | (18 | )% | |||||||
Other | 29,934 | 29,853 | 81 | — | % | ||||||||
Total revenue | 257,153 | 244,180 | 12,973 | 5 | % | ||||||||
Adjusted Operating Expenses | 197,405 | 186,787 | 10,618 | 6 | % | ||||||||
Adjusted EBITDA | $ | 59,748 | $ | 57,393 | 2,355 | 4 | % | ||||||
For the year ended December 31, 2014, Product segment revenues increased by 5%, as compared to the prior year, due to a 10% increase in revenue from service providers partially offset by a 18% decrease in CE revenue. The increase in service provider revenue was primarily driven by growth in IPG product revenue and IPG advertising revenue. Acceptance of our Passport and xD guide products for deployment in multiple countries with a major Latin American service provider contributed to the IPG product revenue growth. The growth in IPG advertising revenue was partially due to a major Pay TV provider agreeing to report advertising sales to us on a monthly basis instead of a quarterly basis. Due to this change we are now recording advertising revenue related to this Pay TV provider on a one month lag instead of a one quarter lag. This change resulted in $3.0 million in additional IPG advertising revenue being recorded in 2014 for the additional two months of reporting. The decrease in CE revenue was primarily due to a decrease in the number of units shipped that incorporated our CE IPG product. In 2015, we expect Product revenue to decrease slightly as we expect declines in analog content protection revenue to be partially off-set by an increase in revenue from new products such as advanced search and recommendations and analytics.
For the year ended December 31, 2014, Adjusted Operating Expenses increased by 6%, as compared to the prior year, primarily due to an increase in employee and consulting costs related to the international expansion of our Metadata offering, an increase in professional services headcount and an increase in spending on our cloud-based platform.
Corporate
(in thousands) | Year Ended December 31, | ||||||||||||
2014 | 2013 | Change $ | Change % | ||||||||||
Adjusted Operating Expenses | $ | 51,737 | $ | 53,666 | (1,929 | ) | (4 | )% | |||||
For the year ended December 31, 2014, Corporate Adjusted Operating Expenses decreased, as compared to the prior year, primarily due to a decrease in Corporate legal expenses. The decrease in Corporate legal expenses was primarily due to a $0.8 million reimbursement of legal fees related to a previously settled case.
Comparison of Years Ended December 31, 2013 and 2012
The following tables present our 2013 results of operations compared to the prior year (in thousands):
42
Year Ended December 31, | ||||||||||||||
2013 | 2012 | Change $ | Change % | |||||||||||
Revenues: | 537,390 | 526,094 | 11,296 | 2 | % | |||||||||
Costs and expenses: | ||||||||||||||
Cost of revenues, exclusive of amortization of intangible assets | 96,361 | 105,126 | (8,765 | ) | (8 | )% | ||||||||
Research and development | 111,326 | 117,985 | (6,659 | ) | (6 | )% | ||||||||
Selling, general and administrative | 147,544 | 139,520 | 8,024 | 6 | % | |||||||||
Depreciation | 16,775 | 19,956 | (3,181 | ) | (16 | )% | ||||||||
Amortization of intangible assets | 74,413 | 74,337 | 76 | — | % | |||||||||
Restructuring and asset impairment charges | 7,638 | 4,737 | 2,901 | 61 | % | |||||||||
Total cost and expenses | 454,057 | 461,661 | (7,604 | ) | (2 | )% | ||||||||
Operating income from continuing operations | 83,333 | 64,433 | 18,900 | 29 | % | |||||||||
Interest expense | (62,019 | ) | (61,742 | ) | (277 | ) | — | % | ||||||
Interest income and other, net | 2,775 | 3,203 | (428 | ) | (13 | )% | ||||||||
Debt modification expense | (1,351 | ) | (4,496 | ) | 3,145 | (70 | )% | |||||||
Income (loss) on interest rate swaps, net | 2,898 | (10,624 | ) | 13,522 | (127 | )% | ||||||||
Loss on debt redemption | (2,761 | ) | (1,758 | ) | (1,003 | ) | 57 | % | ||||||
Income (loss) from continuing operations before income taxes | 22,875 | (10,984 | ) | 33,859 | (308 | )% | ||||||||
Income tax expense | 1,540 | 9,158 | (7,618 | ) | (83 | )% | ||||||||
Income (loss) from continuing operations, net of tax | 21,335 | (20,142 | ) | 41,477 | (206 | )% | ||||||||
Loss from discontinued operations, net of tax | (193,425 | ) | (14,202 | ) | (179,223 | ) | 1,262 | % | ||||||
Net loss | $ | (172,090 | ) | $ | (34,344 | ) | (137,746 | ) | 401 | % | ||||
Total Revenue
For the year ended December 31, 2013, total revenue increased by 2% compared to the prior year. This was driven by a $17.7 million increase in revenue from our Intellectual Property Licensing segment partially offset by a $6.4 million decrease in revenue from our Product segment. For additional details on the increase in revenue see the discussion of our segment results below.
Cost of Revenues
For the year ended December 31, 2013, cost of revenues decreased from the prior year primarily due to a decrease in patent litigation costs and a decrease in employee related costs due to the restructuring actions we undertook to more efficiently manage our operating expenses (See Note 11 to the Consolidated Financial Statements).
Research and Development
For the year ended December 31, 2013, research and development expenses decreased from the prior year primarily due to a decrease in employee related costs due to the restructuring actions we undertook to more efficiently manage our operating expenses (See Note 11 to the Consolidated Financial Statements).
Selling, General and Administrative
For the year ended December 31, 2013, selling, general and administrative expenses increased from the prior year primarily due to an increase in consulting costs and corporate legal expenses.
Depreciation
For the year ended December 31, 2013, depreciation decreased from the prior year primarily due a decline in average property and equipment balances.
Restructuring and Asset Impairment Charges
43
During 2013, we continued the review of our operations that began in the third quarter of 2012 (see Note 11 to the Consolidated Financial Statements). As a result of this analysis, we have taken additional cost reduction actions, which have resulted in a restructuring charge of $7.6 million.
During the third quarter of 2012, we reviewed our costs in order to reduce and more efficiently manage our operating expenses. As a result of this analysis, we took cost reduction actions, which resulted in a restructuring charge of $3.5 million related to our continuing operations. In addition, in connection with a review of our operations in the first quarter of 2012, we reorganized certain parts of our sales and product development groups. These actions resulted in severance charges of $0.8 million in the first quarter of 2012 (see Note 11 to the Consolidated Financial Statements).
In conjunction with the Sonic acquisition, management acted upon a plan to restructure certain Sonic operations to create cost efficiencies for the combined company. During the first quarter of 2012, we recorded $0.4 million in restructuring charges to our continuing operations related to the Sonic acquisition.
Interest Expense
For the year ended December 31, 2013, interest expense increased slightly compared to the prior year primarily due to an increase in debt discount amortization related to our convertible notes. As our convertible notes may be settled in cash upon conversion, we have separately accounted for the liability and equity components of the convertible notes to reflect our non-convertible debt borrowing rate of 7.75%, at the time the instrument was issued, when interest expense is recognized. The debt discount is being amortized through February 2015, which represents the first date the convertible notes can be called by us or put to us by the note holders (see Note 7 to the Consolidated Financial Statements).
Interest Income and Other, Net
Interest income and other, net decreased compared to the same period in the prior year primarily due to the current year including a loss on foreign currency translation while the prior year had a gain.
Income (Loss) on Interest Rate Swaps, Net
We have not designated any of our interest rate swaps as hedges and therefore record the changes in fair value of these instruments in our Consolidated Statements of Operations (see Note 9 to the Consolidated Financial Statements). We generally utilize interest rate swaps to convert the interest rate on a portion of our floating rate term loans to a fixed rate. As under the terms of these interest rate swaps we receive a floating rate and pay a fixed rate, when there is an increase in expected future LIBOR rates we generally will have a gain when marking our interest rate swaps to fair value. When there is a decrease in expected future LIBOR rates we generally will have a loss when marking our interest rate swaps to fair value.
Loss on Debt Redemption and Debt Modification Expense
In 2013, we refinanced our prior Term Loan B-2 with a new term loan B-3. We accounted for the issuance of term loan B-3 and subsequent repayment of Term Loan B-2 as a partial debt modification, as a significant number of Term loan B-2 investors reinvested in term loan B-3, and the change in the present value of future cash flows between Term Loan B-2 and term loan B-3 was less than 10%. Under debt modification accounting, $3.6 million in unamortized debt issuance costs related to Term Loan B-2 investors who reinvested in term loan B-3, are being amortized to term loan B-3 interest expense using the effective interest method. In addition, $0.1 million in term loan B-3 debt issuance costs, related to new investors in term loan B-3, are being amortized to term loan B-3 interest expense using the effective interest method. Debt issuance costs of $1.0 million relating to the issuance of term loan B-3 to Term Loan B-2 investors, have been recorded as debt modification expenses. In addition, we realized a $2.8 million loss on debt redemption related to writing off the unamortized Term Loan B-2 debt issuance costs related to investors who did not reinvest in term loan B-3 and the unamortized debt discount on Term Loan B-2.
On March 29, 2012, we borrowed $800 million consisting of (i) a 5-year $215 million term loan (“Term Loan A-2”), and (ii) a 7-year $585 million term loan (“Term Loan B-2”). The proceeds of the two new tranches of term loans were partially used to pay off the remaining $297.8 million balance of term loan B-1. We accounted for the issuance of Term Loan B-2 and subsequent repayment of term loan B-1 as a partial debt modification, as a significant number of term loan B-1 investors reinvested in Term Loan B-2, and the change in the present value of future cash flows was less than 10%. Under debt modification accounting, $3.5 million in unamortized debt issuance costs related to term loan B-1 investors who reinvested in Term Loan B-2, are being amortized to Term Loan B-2 interest expense using the effective interest method. In addition, $1.0 million in Term Loan B-2 debt issuance costs, related to new investors in Term Loan B-2, are being amortized to Term Loan B-2 interest expense using the effective interest method. Debt issuance costs of $4.5 million relating to the issuance of Term Loan B-2 to term loan B-1 investors have been recorded as debt modification expenses for the year ended December 31, 2012.
44
In addition, we realized a loss on debt redemption of $1.8 million related to writing off the unamortized term loan B-1 debt issuance costs related to investors who did not reinvest in Term Loan B-2 and the unamortized debt discount on term loan B-1.
Income Taxes
We recorded income tax expense from continuing operations for the year ended December 31, 2013, of $1.5 million, which primarily consists of $15.0 million of foreign withholding taxes, $0.2 million of foreign income taxes, and $0.3 million of state income taxes, reduced by $1.0 million from the net change in our deferred tax asset valuation allowance, and $13.0 million from the release of certain tax contingency reserves.
We recorded an income tax expense from continuing operations for the year ended December 31, 2012, of $9.2 million, which primarily consists of $11.7 million of foreign withholding taxes, $1.3 million of state income taxes, $0.9 million of foreign income taxes, and $2.0 million from the net change in our deferred tax asset valuation allowance, reduced by $3.2 million in foreign tax adjustments, and $3.5 million from the change in tax contingency reserves.
Discontinued Operations
Discontinued operations for the year ended December 31, 2013, includes the DivX and MainConcept business, the Rovi Entertainment Store business, the Consumer Website business, the Nowtilus business, expenses related to settling a patent claim against the Roxio Consumer Software business for the period prior to the business being sold and expenses we recorded for indemnification claims related to another former software business which was disposed of in 2008 (see Note 5 to Consolidated Financial Statements). The loss in discontinued operations for the year ended December 31, 2013, is primarily due to recording a $64.9 million impairment charge to the goodwill and intangible assets of the DivX and MainConcept business, a $73.1 million impairment charge to the assets of the Rovi Entertainment Store business and recording a $6.8 million impairment charge to the goodwill and intangible assets of the Consumer Website business as well as the loss on disposal of the Rovi Entertainment Store (see Note 5 to the Consolidated Financial Statements).
Discontinued operations in 2012 includes the DivX and MainConcept business, the Rovi Entertainment Store business, the Consumer Website business, the Nowtilus business, the Roxio Consumer Software business and expenses we recorded for indemnification claims related to the Company’s previous software business which was disposed of in 2008 (see Note 5 to the Consolidated Financial Statements).
Segment Results of Operations
We report segment information in the same way that management internally organizes its business for assessing performance and making decisions regarding the allocation of resources to its business units. Segment information for each of the periods presented below is reconciled to consolidated income (loss) from continuing operations before income taxes in Note 17 of the Consolidated Financial Statements. Discussion relating to Adjusted Operating Expenses and Adjusted EBITDA for our segments uses the definitions included in Note 17 of the Consolidated Financial Statements.
Intellectual Property Licensing Segment
(in thousands) | Year Ended December 31, | ||||||||||||
2013 | 2012 | Change $ | Change % | ||||||||||
Intellectual Property Licensing Revenues: | |||||||||||||
Service provider | $ | 194,324 | $ | 172,455 | 21,869 | 13 | % | ||||||
CE | 98,886 | 103,028 | (4,142 | ) | (4 | )% | |||||||
Total revenue | 293,210 | 275,483 | 17,727 | 6 | % | ||||||||
Adjusted Operating Expenses | 57,957 | 59,415 | (1,458 | ) | (2 | )% | |||||||
Adjusted EBITDA | $ | 235,253 | $ | 216,068 | 19,185 | 9 | % | ||||||
For the year ended December 31, 2013, Intellectual Property Licensing revenue increased by 6%, compared to the prior year, due to a 13% increase in licensing revenue from service providers partially offset by a 4% decrease in licensing revenue from CE manufacturers. The increase in service provider revenue was primarily due to new IPG patent license agreements that included catch-up payments to make us whole for the pre-license period of use and growth in IPG patent subscribers.
Intellectual Property Licensing segment Adjusted Operating Expenses decreased by 2% during the year ended December 31, 2013, compared to the prior year, primarily due to a decrease in patent litigation costs.
45
Product Segment
(in thousands) | Year Ended December 31, | ||||||||||||
2013 | 2012 | Change $ | Change % | ||||||||||
Product Segment Revenues: | |||||||||||||
Service provider | $ | 187,065 | $ | 173,007 | 14,058 | 8 | % | ||||||
CE | 27,262 | 28,939 | (1,677 | ) | (6 | )% | |||||||
Other | 29,853 | 48,665 | (18,812 | ) | (39 | )% | |||||||
Total revenue | 244,180 | 250,611 | (6,431 | ) | (3 | )% | |||||||
Adjusted Operating Expenses | 186,787 | 194,716 | (7,929 | ) | (4 | )% | |||||||
Adjusted EBITDA | $ | 57,393 | $ | 55,895 | 1,498 | 3 | % | ||||||
For the year ended December 31, 2013, Product segment revenues decreased by 3%, compared to the prior year, due to a 39% decrease in other revenue and a 6% decrease in CE revenue, partially offset by a 8% increase in service provider revenue. The decrease in other revenue was primarily due to the continued decline in content protection revenue and a decline in connected platform revenue. The decrease in CE revenue was primarily due to a decline in CE device shipments that included our IPG technology. The increase in service provider revenue was primarily due to an increase in IPG product revenue driven by an increase in IPG product subscribers.
For the year ended December 31, 2013, Adjusted Operating Expenses decreased by 4%, compared to the prior year, primarily due to a decrease in employee related costs due to the restructuring actions we undertook to more efficiently manage our operating expenses (See Note 11 to the Consolidated Financial Statements).
Corporate
(in thousands) | Year Ended December 31, | ||||||||||||
2013 | 2012 | Change $ | Change % | ||||||||||
Adjusted Operating Expenses | $ | 53,666 | $ | 49,203 | 4,463 | 9 | % | ||||||
For the year ended December 31, 2013, Corporate Adjusted Operating Expenses increased, compared to the prior year, primarily due to an increase in consulting costs and corporate legal expenses.
Critical Accounting Policies and Use of Estimates
The discussion and analysis of our financial condition and results of operations are based upon our Consolidated Financial Statements. These Consolidated Financial Statements have been prepared in accordance with the rules and regulations of the Securities and Exchange Commission. The preparation of these financial statements requires management to make estimates and judgments that affect the reported amounts of assets, liabilities, revenues and expenses, and related disclosure of contingent assets and liabilities. On an ongoing basis, we evaluate our estimates, including those related to revenue recognition, equity-based compensation, goodwill and intangible assets, impairment of long lived assets and income taxes. Our estimates are based on historical experience and on various other assumptions that are believed to be reasonable under the circumstances. Actual results may differ from these estimates.
We have identified the accounting policies below as critical to our continuing business operations and the understanding of our results of operations.
Revenue Recognition
We recognize revenue when persuasive evidence of an arrangement exists, we have delivered the product or performed the service, the fee is fixed or determinable and collectability is reasonably assured. However, determining whether and when some of these criteria have been satisfied often involves assumptions and judgments that can have a significant impact on the timing and amount of revenue we report. For example, for multiple element arrangements, we must: (1) determine whether and when each element has been delivered and whether the delivered element has stand-alone value to the customer and (2) allocate the total consideration among the various elements based on their relative selling price using vendor specific objective evidence (VSOE) of selling price, if it exists; otherwise selling price is determined based on third-party
46
evidence (TPE) of selling price. If neither VSOE nor TPE exist, management must use its best estimate of selling price (BESP) to allocate the arrangement consideration.
We account for cash consideration (such as sales incentives) given to our customers or resellers as a reduction of revenue, rather than as an operating expense unless we receive a benefit that is separate from the customer’s purchase and for which we can reasonably estimate the fair value of the benefit.
Amounts for fees collected relating to arrangements where revenue cannot be recognized are reflected on our balance sheet as deferred revenue and recognized when the applicable revenue recognition criteria are satisfied.
CE and Service Provider Licensing
We license our proprietary IPG technology and ACP technology to CE manufacturers, integrated circuit makers, service providers and others. For agreements where license fees are based on the number of units shipped or number of subscribers, we generally recognize revenue from licensing technology on a per-unit shipped model with CE manufacturers or a per-subscriber model with service providers. The recognition of revenues from per-unit license fees is based on units reported shipped by the manufacturer. CE manufacturers normally report their unit shipments to us in the quarter immediately following that of actual shipment by the manufacturer. We have established significant experience and relationships with certain ACP technology licensing customers to reasonably estimate current period volume for purposes of making a revenue accrual. Accordingly, revenue from these customers is recognized in the period the customer shipped the units. Revenues from per-subscriber fees are recognized in the period the services are provided by a licensee, as reported to the Company by the licensee. Revenues from annual or other license fees are recognized based on the specific terms of the license arrangement. For instance, major CE IPG licensees have entered into agreements for which they have the right to ship an unlimited number of units over a specified term for a flat fee. We record the fees associated with these arrangements on a straight-line basis over the specified term. At times we enter into IPG patent license agreements in which we provide a licensee a release for past infringement as well as the right to ship an unlimited number of units over a future period for a flat fee. In this type of arrangement, we generally would use BESP to allocate the consideration between the release for past infringement and the go-forward patent license. In determining BESP of the past infringement component and the go-forward license agreement, we consider such factors as the number of units shipped in the past and in what territories these units where shipped, the number of units expected to be shipped in the future and in what territories these units are expected to be shipped, as well as the licensing rate we generally receive for units shipped in these territories. As the revenue recognition criteria for the past infringement would generally be satisfied upon the execution of the agreement, the amount of consideration allocated to the past infringement would be recognized in the quarter the agreement is executed and the amount allocated to the go-forward license agreement would be recognized ratably over the term. In addition, we have entered into agreements in which the licensee pays us a one-time fee for a perpetual license to our ACP technology. Provided that collectability is reasonably assured, we record revenue related to these agreements when the agreement is executed as we have no significant continuing obligations and the amounts are fixed and determinable.
We also generate advertising revenue through our IPGs. Advertising revenue is recognized when the related advertisement is provided. All advertising revenue is recorded net of agency commissions and revenue shares with service providers and CE manufacturers.
Metadata Licensing
We license Metadata to service providers, CE manufacturers and online portals among others. We generally receive a monthly or quarterly fee from our licensees for the right to use the Metadata, receive regular updates and integrate it into their own service. We recognize revenue on a straight-line basis over the period the licensee has the right to receive the Metadata service.
Equity-Based Compensation
We determine the fair value of stock options and employee stock purchase plan shares using the Black-Scholes option pricing model which uses a number of complex and subjective variables. These variables include our expected stock price volatility over the term of the awards, actual and projected employee stock option exercise behaviors, risk-free interest rate and expected dividends. We estimate the volatility of our common stock by using a combination of historical volatility and implied volatility in market traded options.
The Black-Scholes option pricing model was developed for use in estimating the fair value of short-lived exchange traded options that have no vesting restrictions and are fully transferable. Existing valuation models, including the Black-Scholes model, may not provide reliable measures of the fair values of our equity-based compensation. Consequently, there is a risk that our estimates of the fair values of our equity-based compensation awards on the grant dates may bear little
47
resemblance to the actual values realized upon the exercise of those equity-based payments in the future. Certain equity-based payments, such as employee stock options, may expire worthless or otherwise result in zero intrinsic value as compared to the fair values originally estimated on the grant date and reported in our financial statements. Alternatively, the intrinsic value realized from these instruments could be significantly higher than the fair values originally estimated on the grant date and reported in our financial statements.
Goodwill and Other Intangible Assets
Goodwill represents the excess of cost over fair value of the net assets of an acquired business. Goodwill is not subject to amortization and is tested annually for impairment, and tested for impairment more frequently if events and circumstances indicate that the assets might be impaired. In connection with our goodwill impairment analysis performed annually in our fourth quarter, we first assess qualitative factors to determine whether events or circumstances indicate that the fair value of our reporting units are less than their carrying value. If, after assessing the totality of events or circumstances, we determine it is more likely than not that the fair value of a reporting unit is less than its carrying amount, then we perform the two-step impairment test. The first step of the two-step impairment analysis is to determine the carrying value of each reporting unit by assigning the assets and liabilities, including the existing goodwill and intangible assets, to those reporting units. We determine the fair value of each reporting unit using the discounted cash flow approach and a market based approach. To the extent the carrying amount of a reporting unit exceeds its fair value, we would be required to perform the second step of the impairment analysis, as this is an indication that the reporting unit goodwill may be impaired. In this step, we compare the implied fair value of the reporting unit goodwill with the carrying amount of the reporting unit goodwill. The implied fair value of goodwill is determined by allocating the fair value of the reporting unit to all of the assets (recognized and unrecognized) and liabilities of the reporting unit. The residual fair value after this allocation is the implied fair value of the reporting unit’s goodwill. To the extent the implied fair value of goodwill of each reporting unit is less than its carrying amount we would be required to recognize an impairment loss. The process of evaluating the potential impairment of goodwill is subjective and requires judgment at many points during the test including future revenue forecasts and discount rates.
Impairment of Long‑Lived Assets
Long‑lived assets, such as property and equipment, and purchased intangibles subject to amortization, are reviewed for impairment whenever events or changes in circumstances indicate that the carrying amount of an asset group may not be recoverable. Recoverability of assets to be held and used is measured by a comparison of the carrying amount of an asset group to estimated undiscounted future cash flows expected to be generated by the asset group. If the carrying amount of an asset group exceeds its estimated future cash flows, an impairment charge is recognized in the amount by which the carrying amount of the asset group exceeds the fair value of the asset group. Assets to be disposed of would be separately presented in the balance sheet and reported at the lower of the carrying amount or fair value less costs to sell, and would no longer be depreciated. The assets and liabilities of a disposal group classified as held for sale would be presented separately in the appropriate asset and liability sections of the balance sheet.
Income Taxes
We account for income taxes using the asset and liability method. Under this method, income tax expense is recognized for the amount of taxes payable or refundable for the current year and for deferred tax liabilities and assets for the future tax consequences of events that have been recognized in an entity’s financial statements or tax returns. From time to time, we enter into transactions in which the tax consequences may be subject to uncertainty. In determining our tax provision for financial reporting purposes, we establish reserves for uncertain tax positions unless such positions are determined to be “more likely than not” of being sustained upon examination, based on their technical merits. We must make significant assumptions, judgments and estimates to determine our current provision for income taxes and also our deferred tax assets and liabilities and any valuation allowance to be recorded against a deferred tax asset. Our judgments, assumptions and estimates relative to the current provision take into account current tax laws, our interpretation of current tax laws and possible outcomes of current and future audits conducted by foreign and domestic tax authorities. Changes in tax law or our interpretation of tax laws and the resolution of current and future tax audits could significantly impact the amount provided for income taxes in our consolidated financial statements.
Liquidity and Capital Resources
We finance our operations primarily from cash generated by operations. Net cash provided by our continuing operating activities decreased to $190.7 million for the year ended December 31, 2014, from $205.0 million in the prior year. Operating cash flow in 2014 benefited from a significant upfront payment in the first quarter of 2014 related to a multi-year licensing deal signed in the fourth quarter of 2013. Our accounts receivable also decreased by $20.5 million from year-end due to us collecting certain large receivable balances relating to deals signed at the end of 2013. However, the operating cash flow
48
benefit from collecting these accounts receivable balances was partially offset by a $17.8 million decrease in accounts payable, accrued expenses and other long-term liabilities and us paying $7.6 million to retire certain interest rate swaps in connection with our 2014 Senior Secured Credit Facility refinancing. The availability of cash generated by our operations in the future could be affected by other business risks including, but not limited to, those factors referenced under the caption “Risk Factors” contained in this Form 10-K.
Net cash provided by investing activities from continuing operations decreased to $93.7 million for the year ended December 31, 2014, as compared to $154.1 million in the prior year. The year ended December 31, 2014, included $165.9 million in net marketable securities sales and $50.3 million in proceeds from the sale of DivX and MainConcept, partially offset by $23.4 million in capital expenditures, $70.3 million in payments made for the Fanhattan and Veveo acquisitions and the acquisition of a $28 million patent portfolio. Included in 2013 investing activities was $190.7 million in net marketable securities sales, $19.1 million in capital expenditures and $10.0 million paid to acquire IntegralReach. We anticipate that capital expenditures to support the growth of our business and strengthen our operations infrastructure will be between $18.0 million and $26.0 million for the full year 2015.
Net cash used in financing activities from continuing operations was $279.8 million for the year ended December 31, 2014, as compared to $475.2 million in the prior year. During the year ended December 31, 2014, we made $105.5 million in net debt principal payments and repurchased $192.2 million of our common stock. These uses of cash were partially offset by us receiving $17.8 million from the exercise of employee stock options and sales of stock through our employee stock purchase plan. During the year ended December 31, 2013, we made $311.6 million in net debt payments and repurchased $182.1 million of our common stock. These uses of cash were partially offset by us receiving $18.6 million from the exercise of employee stock options and sales of stock through our employee stock purchase plan.
On July 2, 2014, the Company, as parent guarantor, and two of our wholly-owned subsidiaries, Rovi Solutions Corporation and Rovi Guides, Inc., as borrowers, and certain of our other subsidiaries, as subsidiary guarantors, entered into a new Credit Agreement (the “Credit Agreement”). The Credit Agreement provides for (i) a five-year $125 million term loan A facility (the “Term Loan A Facility”), (ii) a seven-year $700 million term loan B facility (the “Term Loan B Facility” and together with the Term Loan A Facility, the “Term Loan Facility”) and (iii) a five-year $175 million revolving credit facility (including a letter of credit sub-facility) (“the Revolving Facility” and together with the Term Loan Facility, the “Senior Secured Credit Facility”). We used the proceeds of the Term Loan Facility, together with cash from our balance sheet, to repay existing loans under a prior credit agreement and to pay expenses related thereto. The term loans under the Term Loan A Facility will amortize in annual installments in an aggregate annual amount equal to 5% of the original principal amount thereof, with any remaining balance payable on the final maturity date of the Term Loan A Facility. The term loans under the Term Loan B Facility will amortize in equal quarterly installments in an aggregate annual amount equal to 1% of the original principal amount thereof, with any remaining balance payable on the final maturity date of the Term Loan B Facility. Loans under the Term Loan A Facility bear interest, at our option, at a rate equal to either the LIBOR rate, plus an applicable margin equal to 2.25% per annum, or the prime lending rate, plus an applicable margin equal to 1.25% per annum. Loans under the Term Loan B Facility bear interest, at our option, at a rate equal to either the LIBOR rate, plus an applicable margin equal to 3% per annum (subject to a 0.75% LIBOR floor) or the prime lending rate, plus an applicable margin equal to 2% per annum. Loans under the Revolving Facility will bear interest, at our option, at a rate equal to either the LIBOR rate, plus an applicable margin equal to 2.25% per annum, or the prime lending rate, plus an applicable margin equal to 1.25% per annum, subject to reduction by 0.25% or 0.50% based upon the Company's total secured leverage ratio (as defined in the Credit Agreement).
The Credit Agreement contains customary representations and warranties and customary affirmative and negative covenants applicable to the Company and its subsidiaries, including, among other things, restrictions on indebtedness, liens, investments, mergers, dispositions, prepayment of other indebtedness, and dividends and other distributions. The Term Loan A Facility and Revolving Facility contain financial covenants that require that we maintain a minimum consolidated interest coverage ratio and a maximum total leverage ratio. The Term Loan B Facility does not contain a minimum consolidated interest coverage ratio or a maximum total leverage ratio covenant. Beginning with our fiscal year ending December 31, 2015, we may be required to make an additional payment on the Term Loan Facility each February. This payment is a percentage of the prior year's Excess Cash Flow as defined in the Credit Agreement.
As discussed in Note 7 of the Consolidated Financial Statements, in March 2010, we issued $460.0 million in 2.625% convertible senior notes due in 2040 at par. The 2040 Convertible Notes may be converted, under certain circumstances, based on an initial conversion rate of 21.1149 shares of common stock per $1,000 principal amount of notes (which represents an initial conversion price of approximately $47.36 per share). As of December 31, 2014, $291.0 million par value of the 2040 Convertible Notes remains outstanding. Holders have the right to require us to repurchase the 2040 Convertible Notes on February 20, 2015, 2020, 2025, 2030 and 2035 for cash equal to 100% of the principal amount of the notes to be repurchased, plus accrued interest to, but excluding, the repurchase date (See Note 7 to the Consolidated Financial Statements for additional details). Given the conversion price, we anticipate that holders will require us to repurchase the 2040 Convertible Notes in
49
February 2015. We anticipate funding this repurchase with cash from our balance sheet and by drawing down $100.0 million on our Revolving Facility, which as of December 31, 2014, had not been drawn.
In April 2014, the Company's Board of Directors authorized the repurchase of up to $200.0 million of the Company's common stock. During the year ended December 31, 2014, the Company repurchased 8.3 million shares of its common stock for $196.5 million. As of December 31, 2014, the Company had $126.6 million remaining under its existing stock repurchase program and anticipates repurchasing 5.0 million shares of its common stock in 2015.
As of December 31, 2014, we had $154.6 million in cash and cash equivalents, $183.1 million in short-term investments and $131.4 million in long-term marketable securities. Of these amounts, $223.2 million is held by our foreign subsidiaries. Due to our net operating loss carryforwards, we could repatriate the cash and investments held by our foreign subsidiaries back to the United States with a minimal tax impact.
We believe that our current cash, cash equivalents and marketable securities and our annual cash flow from operations will be sufficient to meet our working capital, capital expenditure, debt and operating requirements for at least the next twelve months.
Contractual Obligations
The following table summarizes our contractual obligations at December 31, 2014 (in thousands):
Payments due by period | ||||||||||||||||||||
Contractual Obligations (3) | Total | Less Than 1 year | 1-3 years | 3-5 years | More Than 5 years | |||||||||||||||
Long-term debt obligations (1) | $ | 1,112,490 | $ | 304,240 | $ | 26,500 | $ | 120,250 | $ | 661,500 | ||||||||||
Interest payments associated with long-term debt obligations | 185,832 | 33,854 | 58,813 | 55,657 | 37,508 | |||||||||||||||
Purchase obligations | 10,300 | 6,955 | 3,317 | 28 | — | |||||||||||||||
Operating lease obligations(2) | 69,441 | 19,696 | 22,398 | 12,591 | 14,756 | |||||||||||||||
$ | 1,378,063 | $ | 364,745 | $ | 111,028 | $ | 188,526 | $ | 713,764 | |||||||||||
(1) | The 2040 Convertible Notes have been included in the above table at the first put / call date which is February 2015. However, the 2040 Convertible Notes may be converted by the note holders prior to their maturity under certain circumstances. See above for additional details. |
(2) | Operating leases in the above table have been included on a gross basis. The Company has agreements to receive approximately $11.2 million under operating subleases from 2015 to 2019. |
(3) | We are unable to reliably estimate the timing of future payments related to uncertain tax positions, therefore, $10.1 million of income taxes payable has been excluded from the table above. |
Recently Issued Accounting Pronouncements
See Note 2 to the Consolidated Financial Statements.
Off Balance Sheet Arrangements
Since our inception, except for operating leases, we have not engaged in any off-balance sheet arrangements, including the use of structured finance, special purpose entities or variable interest entities.
ITEM 7A. QUANTITATIVE AND QUALITATIVE DISCLOSURES ABOUT MARKET RISK
We are exposed to financial market risks, including changes in interest rates, foreign currency exchange rates and security investments. Changes in these factors may cause fluctuations in our earnings and cash flows. We evaluate and manage the exposure to these market risks as follows:
Fixed Income Investments. We have an investment portfolio of money market funds and fixed income securities, including those classified as cash equivalents, short-term investments and long-term marketable investment securities of $405.4 million as of December 31, 2014. Most of these securities are subject to interest rate fluctuations. An increase in interest rates could adversely affect the market value of our fixed income securities while a decrease in interest rates could adversely affect the amount of interest income we receive.
50
Our investment portfolio consists principally of money market mutual funds, U.S. Treasury and agency securities, corporate bonds, commercial paper and auction rate securities. We regularly monitor the credit risk in our investment portfolio and take appropriate measures to manage such risks prudently in accordance with our investment policies.
As a result of adverse conditions in the financial markets, auction rate securities may present risks arising from liquidity and/or credit concerns. At December 31, 2014, the fair value of our auction rate securities portfolio totaled approximately $10.6 million. Our auction rate securities portfolio is comprised solely of AAA rated federally insured student loans, municipal and educational authority bonds. The auction rate securities we hold have failed to trade for over one year due to insufficient bids from buyers. This limits the short-term liquidity of these securities.
We limit our exposure to interest rate and credit risk, however, by establishing and strictly monitoring clear policies and guidelines for our fixed income portfolios. The primary objective of these policies is to preserve principal while at the same time maximizing yields, without significantly increasing risk. A hypothetical 50 basis point increase in interest rates would result in a $1.2 million decrease in the fair value of our fixed income available-for-sale securities as of December 31, 2014.
While we cannot predict future market conditions or market liquidity, we believe that our investment policies provide an appropriate means to manage the risks in our investment portfolio.
Foreign Currency Exchange Rates. Due to our reliance on international and export sales, we are subject to the risks of fluctuations in currency exchange rates. Because a substantial majority of our international and export revenues, as well as expenses, are typically denominated in U.S. dollars, fluctuations in currency exchange rates could cause our products to become relatively more expensive to customers in a particular country, leading to a reduction in sales or profitability in that country. Many of our subsidiaries operate in their local currency, which mitigates a portion of the exposure related to the respective currency collected.
Indebtedness. We have convertible notes with a par value of $291.0 million. We also have a senior secured credit facility with an outstanding principal balance of $821.5 million. Our borrowings under our senior secured credit facility are, and are expected to continue to be, at variable rates of interest and expose us to interest rate risk. If interest rates increase, our debt service obligations on the variable rate indebtedness would increase even though the amount borrowed remained the same. The terms of these debt instruments are more fully described in Note 7 to the Consolidated Financial Statements.
Interest Rate Swaps and Caps. We have entered into a number of interest rate swaps. Under these swaps we have generally agreed to pay interest at a fixed rate and receive a floating rate from the counterparties. The terms of these interest rate swaps are more fully described in Note 9 to the Consolidated Financial Statements.
ITEM 8. FINANCIAL STATEMENTS AND SUPPLEMENTARY DATA
The information required by this item is submitted in a separate section of this report beginning on F-1 of this report.
ITEM 9. CHANGES IN AND DISAGREEMENTS WITH ACCOUNTANTS ON ACCOUNTING AND FINANCIAL DISCLOSURE
None.
ITEM 9A. CONTROLS AND PROCEDURES
Evaluation of Disclosure Controls and Procedures
Under the supervision and with the participation of our management, including our chief executive officer and our chief financial officer, we conducted an evaluation of our disclosure controls and procedures, as such term is defined under Exchange Act Rule 13a-15(e). Based on this evaluation, our chief executive officer and our chief financial officer concluded that our disclosure controls and procedures were effective as of the end of the period covered by this Annual Report.
Management’s Report on Internal Control Over Financial Reporting
Our management is responsible for establishing and maintaining an adequate system of internal control over financial reporting. Our internal control over financial reporting includes those policies and procedures that:
• | pertain to the maintenance of records that, in reasonable detail, accurately and fairly reflect the transactions and dispositions of our assets; |
51
• | provide reasonable assurance that transactions are recorded as necessary to permit preparation of our financial statements in accordance with generally accepted accounting principles in the United States, and that our receipts and expenditures are being made only in accordance with authorizations of our management and directors; and |
• | provide reasonable assurance regarding prevention or timely detection of unauthorized acquisition, use or disposition of our assets that could have a material effect on the financial statements. |
Our management assessed the effectiveness of our system of internal control over financial reporting as of December 31, 2014. In making this assessment, we used the framework in Internal Control—Integrated Framework issued by the Committee of Sponsoring Organizations of the Treadway Commission (2013 Framework) (“COSO”). Based on our assessment and the criteria set forth by COSO, we believe that Rovi maintained effective internal control over financial reporting as of December 31, 2014.
The effectiveness of our internal control over financial reporting as of December 31, 2014 has been audited by Ernst & Young LLP, an independent registered public accounting firm, as stated in their report which is included herein.
Inherent Limitations on Effectiveness of Controls
Our system of internal control over financial reporting was designed to provide reasonable assurance regarding the reliability of financial reporting and the preparation of financial statements for external purposes in accordance with accounting principles generally accepted in the United States.
All internal control systems, no matter how well designed and operated, can provide only reasonable assurance with respect to financial statement preparation and presentation. Our management does not expect that our disclosure controls and procedures will prevent all error and fraud. Further, the design of a control system must reflect the fact that there are resource constraints, and the benefits of controls must be considered relative to their costs. Because of the inherent limitations in all control systems, no evaluation of controls can provide absolute assurance that all control issues within our Company have been detected, even with respect to those systems of internal control that are determined to be effective. These inherent limitations include the realities that judgments in decision-making can be faulty, and that breakdown can occur because of simple error or mistake. The design of any system of controls also is based in part upon certain assumptions about the likelihood of future events, and there can be no assurance that any design will succeed in achieving its stated goals under all potential future conditions. Over time, controls may become inadequate because of changes in conditions, or the degree of compliance with the policies or procedures may deteriorate. Because of these inherent limitations in a cost-effective control system, misstatements due to error or fraud may occur and not be detected. Our system contains self-monitoring mechanisms, and actions are taken to correct deficiencies as they are identified.
Audit Committee Oversight
The Audit Committee of the Board of Directors, which is comprised solely of independent directors, has oversight responsibility for our financial reporting process and the audits of our consolidated financial statements and internal control over financial reporting. The Audit Committee meets regularly with management and with our internal auditors and independent registered public accounting firm (collectively, the "accountants") to review matters related to the quality and integrity of our financial reporting, internal control over financial reporting (including compliance matters related to our Code of Personal and Business Conduct and Ethics), and the nature, extent, and results of internal and external audits. Our accountants have full and free access and report directly to the Audit Committee. The Audit Committee recommended, and the Board of Directors approved, that the audited consolidated financial statements be included in this Annual Report on Form 10-K.
Changes in Internal Control Over Financial Reporting
During the quarter ended December 31, 2014, there have been no changes in our internal controls over financial reporting that have materially affected, or are reasonably likely to materially affect, these controls.
ITEM 9B. OTHER INFORMATION
None
52
Report of Independent Registered Public Accounting Firm
The Board of Directors and Stockholders of Rovi Corporation and subsidiaries
We have audited Rovi Corporation and subsidiaries’ internal control over financial reporting as of December 31, 2014, based on criteria established in Internal Control—Integrated Framework issued by the Committee of Sponsoring Organizations of the Treadway Commission (2013 Framework) (the COSO criteria). Rovi Corporation and subsidiaries’ management is responsible for maintaining effective internal control over financial reporting, and for its assessment of the effectiveness of internal control over financial reporting included in the accompanying Management’s Report on Internal Control Over Financial Reporting appearing under Item 9A. Our responsibility is to express an opinion on the company’s internal control over financial reporting based on our audit.
We conducted our audit in accordance with the standards of the Public Company Accounting Oversight Board (United States). Those standards require that we plan and perform the audit to obtain reasonable assurance about whether effective internal control over financial reporting was maintained in all material respects. Our audit included obtaining an understanding of internal control over financial reporting, assessing the risk that a material weakness exists, testing and evaluating the design and operating effectiveness of internal control based on the assessed risk, and performing such other procedures as we considered necessary in the circumstances. We believe that our audit provides a reasonable basis for our opinion.
A company’s internal control over financial reporting is a process designed to provide reasonable assurance regarding the reliability of financial reporting and the preparation of financial statements for external purposes in accordance with generally accepted accounting principles. A company’s internal control over financial reporting includes those policies and procedures that (1) pertain to the maintenance of records that, in reasonable detail, accurately and fairly reflect the transactions and dispositions of the assets of the company; (2) provide reasonable assurance that transactions are recorded as necessary to permit preparation of financial statements in accordance with generally accepted accounting principles, and that receipts and expenditures of the company are being made only in accordance with authorizations of management and directors of the company; and (3) provide reasonable assurance regarding prevention or timely detection of unauthorized acquisition, use or disposition of the company’s assets that could have a material effect on the financial statements.
Because of its inherent limitations, internal control over financial reporting may not prevent or detect misstatements. Also, projections of any evaluation of effectiveness to future periods are subject to the risk that controls may become inadequate because of changes in conditions, or that the degree of compliance with the policies or procedures may deteriorate.
In our opinion, Rovi Corporation and subsidiaries maintained, in all material respects, effective internal control over financial reporting as of December 31, 2014, based on the COSO criteria.
We also have audited, in accordance with the standards of the Public Company Accounting Oversight Board (United States), the consolidated balance sheets of Rovi Corporation and subsidiaries as of December 31, 2014 and 2013 and the related consolidated statements of operations, comprehensive loss, stockholders’ equity and cash flows for each of the three years in the period ended December 31, 2014 of Rovi Corporation and subsidiaries and our report dated February 19, 2015 expressed an unqualified opinion thereon.
/s/ Ernst & Young LLP
Los Angeles, California
February 19, 2015
53
PART III
ITEM 10. DIRECTORS, EXECUTIVE OFFICERS AND CORPORATE GOVERNANCE
The information regarding directors, the Company’s Audit Committee, Corporate Governance and Nominating Committee, stockholder nominations to our Board, and Section 16(a) beneficial ownership reporting compliance is incorporated herein by reference to our definitive proxy statement to be filed with the Securities and Exchange Commission within 120 days after the close of our fiscal year ended December 31, 2014. The information regarding executive officers appears under the heading “Executive Officers of the Registrant” in Item 1 of this Form 10-K and is also incorporated by reference in this section.
Code of Conduct. In February 2004, we adopted our Code of Personal and Business Conduct and Ethics (the “Code of Conduct”) as required by applicable securities laws, rules of the SEC and the listing standards of Nasdaq. The Code of Conduct applies to all of our directors and employees, including the principal executive officer, principal financial officer and principal accounting officer. A copy of such code of conduct and ethics was filed as an Exhibit to our Annual Report on Form 10-K for the year ended December 31, 2003. If we make any substantive amendments to the code of conduct and ethics or grant any waiver, including implicit waiver, from a provision of the code of conduct and ethics to our principal executive officer, principal financial officer or principal accounting officer, we will disclose the nature of such amendment or waiver on our website at www.rovicorp.com or in a current report on Form 8-K that will be publicly filed.
Corporate Governance Guidelines and Committee Charters. In February 2009, we adopted amended Corporate Governance Guidelines to assist the Board in following corporate practices that serve the best interest of the Company and its stockholders. From time to time, we have further amended such Guidelines as we believe appropriate and in the best interest of the Company and its stockholders. Our currently effective Corporate Governance Guidelines and the charters of each of our audit committee, compensation committee and corporate governance and nominating committee are available at our website at www.rovicorp.com.
ITEM 11. EXECUTIVE COMPENSATION
Information for this item is incorporated herein by reference to our definitive proxy statement to be filed with the Securities and Exchange Commission within 120 days after the close of our fiscal year ended December 31, 2014.
ITEM 12. SECURITY OWNERSHIP OF CERTAIN BENEFICIAL OWNERS AND MANAGEMENT AND RELATED STOCKHOLDER MATTERS
Information for this item is incorporated herein by reference to our definitive proxy statement to be filed with the Securities and Exchange Commission within 120 days after the close of our fiscal year ended December 31, 2014.
ITEM 13. CERTAIN RELATIONSHIPS AND RELATED TRANSACTIONS, AND DIRECTOR INDEPENDENCE
Information for this item is incorporated herein by reference to our definitive proxy statement to be filed with the Securities and Exchange Commission within 120 days after the close of our fiscal year ended December 31, 2014.
ITEM 14. PRINCIPAL ACCOUNTING FEES AND SERVICES
Information for this item is incorporated herein by reference to our definitive proxy statement to be filed with the Securities and Exchange Commission within 120 days after the close of our fiscal year ended December 31, 2014.
54
PART IV
ITEM 15. EXHIBITS, FINANCIAL STATEMENT SCHEDULES
(a) | The following documents are filed as part of this report: |
1. Financial Statements
Page | |||
● | Report of Independent Registered Public Accounting Firm | F-2 | |
● | Consolidated Balance Sheets | F-3 | |
● | Consolidated Statements of Operations | F-4 | |
● | Consolidated Statements of Comprehensive Loss | F-5 | |
● | Consolidated Statements of Stockholders’ Equity | F-6 | |
● | Consolidated Statements of Cash Flows | F-7 | |
● | Notes to Consolidated Financial Statements | F-8 | |
2. | Financial Statement Schedules |
All schedules are either included in the Notes to Consolidated Financial Statements or are omitted because they are not applicable.
3. | Exhibits |
Exhibits
Incorporated by Reference | ||||||||||
Exhibit Number | Exhibit Description | Form | Date | Number | Filed Herewith | |||||
2.01 | Agreement and Plan of Mergers, dated as of December 6, 2007, among Macrovision Corporation, Saturn Holding Corp, Galaxy Merger Sub, Inc., Mars Merger Sub, Inc. and Gemstar-TV Guide International, Inc | 8-K | 5/5/08 | 2.1 | ||||||
2.02 | Agreement and Plan of Merger, dated February 21, 2014, by and among Rovi Corporation, Victory Acquisition Corp., Veveo, Inc., and Paul Ferri, who will serve as the representative of the Veveo, Inc. stockholders and optionholders.* | 8-K | 2/24/14 | 2.1 | ||||||
2.03 | Unit Purchase Agreement dated March 28, 2014 by and among Rovi Corporation, DivX LLC and PCF Number 1, Inc.* | 8-K | 03/31/14 | 2.1 | ||||||
2.04 | Agreement and Plan of Merger dated as of October 30, 2014 by and among Rovi Corporation, Firestone Acquisition Corp., Fanhattan, Inc., and Fortis Advisors LLC as the Stockholders’ Representative* | 8-K | 12/08/14 | 2.1 | ||||||
3.01 | Certificate of Incorporation of Rovi Corporation, as amended, on July 15, 2009 | 10-Q | 8/6/09 | 3.01 | ||||||
3.02 | Amended and restated Bylaws of Rovi Corporation (as amended and restated on February 11, 2014) | 10-K | 2/12/14 | 3.02 | ||||||
4.01 | Form of Common Stock Certificate | S-3 | 7/15/08 | 4.1 | ||||||
4.02 | Indenture, dated as of March 17, 2010, by and between the Company and Bank of New York Mellon Trust Company, N.A. as trustee | 8-K | 3/18/10 | 4.1 | ||||||
55
4.03 | Form of Note representing the Rovi Corporation 2.625% Convertible Senior Notes due 2040 (included in the Indenture referenced in Exhibit 4.03) | 8-K | 3/18/10 | 4.1 | ||||||
4.04 | Credit Agreement, dated as of July 2, 2014, among Rovi Guides, Inc. and Rovi Solutions Corporation, as borrowers, Rovi Corporation, as parent guarantor, the subsidiary guarantors, the lenders from time to time party thereto, Morgan Stanley Senior Funding, Inc., Merrill Lynch, Pierce, Fenner & Smith Incorporated, Fifth Third Bank and SunTrust Robinson Humphrey, Inc., as joint bookrunners and lead arrangers, and Morgan Stanley Senior Funding, Inc., as administrative agent and collateral agent | 8-K | 7/3/14 | 10.1 | ||||||
10.01 | Rovi Corporation 2008 Equity Incentive Plan, as amended** | S-8 | 5/2/14 | 10.1 | ||||||
10.02 | Rovi Corporation 2008 Employee Stock Purchase Plan** | S-8 | 7/23/08 | 10.02 | ||||||
10.03 | Rovi Corporation 2000 Equity Incentive Plan** | DEF14A | 3/16/06 | Annex A | ||||||
10.04 | Sonic Solutions 2004 Equity Compensation Plan, as amended and restated July 2010** | S-8 | 3/17/11 | --- | ||||||
10.05 | Form of Notice of Stock Option Grant/Nonstatutory Stock Option Agreement pursuant to 2000 and 2008 Equity Incentive Plans** | 10-K | 2/23/2012 | 10.05 | ||||||
10.06 | Form of Notice of Stock Option Grant/Nonstatutory Stock Option Agreement (Director grant form) pursuant to 2008 Equity Incentive Plan** | 10-K | 2/23/2012 | 10.06 | ||||||
10.07 | Form of Notice of Restricted Stock Award/Restricted Stock Award Agreement pursuant to 2008 Equity Incentive Plan** | 10-K | 2/23/2012 | 10.07 | ||||||
10.08 | Form of Notice of Restricted Stock Award/Restricted Stock Award Agreement (Director grant form) pursuant to 2008 Equity Incentive Plan** | 10-K | 2/23/2012 | 10.08 | ||||||
10.09 | Form of Notice of Restricted Stock Unit/Restricted Stock Unit Agreement pursuant to 2008 Equity Incentive Plan** | 10-K | 2/23/2012 | 10.09 | ||||||
10.10 | Form of Notice of Stock Option Grant/Nonstatutory Stock Option Agreement pursuant to 2004 Equity Compensation Plan** | 10-K | 2/23/2012 | 10.10 | ||||||
10.11 | Form of Notice of Restricted Stock Award/Restricted Stock Award Agreement pursuant to 2004 Equity Compensation Plan** | 10-K | 2/23/2012 | 10.11 | ||||||
10.12 | Form of Notice of Restricted Stock Unit/Restricted Stock Unit Agreement pursuant to 2004 Equity Compensation Plan** | 10-K | 2/23/2012 | 10.12 | ||||||
10.13 | 2014 Senior Executive Company Incentive Plan** | 8-K | 2/14/14 | 10.1 | ||||||
10.14 | Lease Between WB Airport Technology, L.L.C. (“Landlord”) and Macrovision Corporation (“Tenant”) dated August 2, 2001 | 10-Q | 11/13/01 | 10.39 | ||||||
56
10.15 | First Amendment to Lease between WB Airport Technology, L.L.C. (“Landlord”) and Macrovision Corporation (“Tenant”) dated December 13, 2004 | 10-K | 3/31/05 | 10.09 | ||||||
10.16 | Second Amendment to Lease between WB Airport Technology, L.L.C. (“Landlord”) and Macrovision Corporation (“Tenant”) dated December 13, 2004 | 10-K | 3/31/05 | 10.10 | ||||||
10.17 | Lease between WB Airport Technology, L.L.C. (“Landlord”) and Macrovision Corporation (“Tenant”) dated December 13, 2004 | 10-K | 3/31/05 | 10.11 | ||||||
10.18 | Offer letter to Thomas Carson dated December 14, 2011** | 8-K | 12/16/11 | 10.1 | ||||||
10.19 | Amended and Restated Executive Severance and Arbitration Agreement with Thomas Carson dated December 14, 2011** | 8-K | 12/16/11 | 10.2 | ||||||
10.20 | Offer letter to John Burke dated February 25, 2014** | 8-K | 03/13/14 | 10.1 | ||||||
10.21 | Executive Severance and Arbitration Agreement with John Burke effective March 18, 2014** | 8-K | 03/13/14 | 10.2 | ||||||
10.22 | Executive Succession Planning Agreement dated May 25, 2011 by and between Alfred J. Amoroso and Rovi Corporation** | 8-K | 5/25/11 | 10.1 | ||||||
10.23 | Form of Indemnification Agreement entered into by Rovi Corporation with each of its directors and executive officers | 10-K | 3/2/09 | 10.15 | ||||||
10.24 | Form of Executive Severance and Arbitration Agreement ** | 10-K | 2/12/14 | 10.22 | ||||||
10.25 | Charter of the Audit Committee of the Board of Directors | 10-K | 2/15/11 | 10.20 | ||||||
14.01 | Code of Personal and Business Conduct and Ethics | 10-K | 3/12/04 | 14.01 | ||||||
21.01 | List of subsidiaries | X | ||||||||
23.01 | Consent of Ernst & Young LLP, Independent Registered Public Accounting Firm | X | ||||||||
31.01 | Certification of Chief Executive Officer pursuant to Section 302 of the Sarbanes-Oxley Act of 2002 | X | ||||||||
31.02 | Certification of Chief Financial Officer pursuant to Section 302 of the Sarbanes-Oxley Act of 2002 | X | ||||||||
32.01 | Section 1350 Certification | X | ||||||||
32.02 | Section 1350 Certification | X | ||||||||
101.INS | XBRL Instance Document | X | ||||||||
101.SCH | XBRL Taxonomy Extension Schema Document | X | ||||||||
101.CAL | XBRL Taxonomy Extension Calculation Linkbase Document | X | ||||||||
101.DEF | XBRL Taxonomy Extension Definition Linkbase Document | X | ||||||||
101.LAB | XBRL Taxonomy Extension Label Linkbase Document | X | ||||||||
101.PRE | XBRL Taxonomy Extension Presentation Document | X | ||||||||
57
* Certain schedules and exhibits to this agreement have been omitted in accordance with Item 601(b)(2) of Regulation S-K. A copy of any omitted schedule and/or exhibit will be furnished to the Securities and Exchange Commission upon request.
** | Management contract or compensatory plan or arrangement. |
58
Signatures
Pursuant to the requirements of Section 13 or 15(d) of the Securities Exchange Act of 1934, the registrant caused this report to be signed on its behalf by the undersigned thereunto duly authorized on this 19th day of February, 2015.
ROVI CORPORATION | ||
By: | /s/ Thomas Carson | |
Thomas Carson | ||
President and Chief Executive Officer | ||
Pursuant to the requirements of the Securities Exchange Act of 1934, this report has been signed below by the following persons on behalf of the registrant, and in the capacities and on the date indicated.
Name | Title | Date | ||
Principal Executive Officer: | ||||
/s/ Thomas Carson | President, Chief Executive Officer and Director | February 19, 2015 | ||
Thomas Carson | ||||
Principal Financial and Accounting Officer: | ||||
/s/ Peter C. Halt | Chief Financial Officer | February 19, 2015 | ||
Peter C. Halt | ||||
Additional Directors: | ||||
/s/ Andrew K. Ludwick | Chairman of the Board of Directors | February 19, 2015 | ||
Andrew K. Ludwick | ||||
/s/ Alan L. Earhart | Director | February 19, 2015 | ||
Alan L. Earhart | ||||
/s/ James E. Meyer | Director | February 19, 2015 | ||
James E. Meyer | ||||
/s/ James P. O’Shaughnessy | Director | February 19, 2015 | ||
James P. O’Shaughnessy | ||||
/s/ Ruthann Quindlen | Director | February 19, 2015 | ||
Ruthann Quindlen | ||||
59
ROVI CORPORATION
INDEX TO CONSOLIDATED FINANCIAL STATEMENTS
PAGE | ||||
F-1
Report of Independent Registered Public Accounting Firm
The Board of Directors and Stockholders of Rovi Corporation and subsidiaries
We have audited the accompanying consolidated balance sheets of Rovi Corporation and subsidiaries as of December 31, 2014 and 2013, and the related consolidated statements of operations, comprehensive loss, stockholders’ equity and cash flows for each of the three years in the period ended December 31, 2014. These financial statements are the responsibility of the Company’s management. Our responsibility is to express an opinion on these financial statements based on our audits.
We conducted our audits in accordance with the standards of the Public Company Accounting Oversight Board (United States). Those standards require that we plan and perform the audit to obtain reasonable assurance about whether the financial statements are free of material misstatement. An audit includes examining, on a test basis, evidence supporting the amounts and disclosures in the financial statements. An audit also includes assessing the accounting principles used and significant estimates made by management, as well as evaluating the overall financial statement presentation. We believe that our audits provide a reasonable basis for our opinion.
In our opinion, the financial statements referred to above present fairly, in all material respects, the consolidated financial position of Rovi Corporation and subsidiaries at December 31, 2014 and 2013, and the consolidated results of their operations and their cash flows for each of the three years in the period ended December 31, 2014, in conformity with U.S. generally accepted accounting principles.
We also have audited, in accordance with the standards of the Public Company Accounting Oversight Board (United States), Rovi Corporation and subsidiaries’ internal control over financial reporting as of December 31, 2014, based on criteria established in Internal Control-Integrated Framework issued by the Committee of Sponsoring Organizations of the Treadway Commission (2013 Framework) and our report dated February 19, 2015 expressed an unqualified opinion thereon.
/s/ Ernst & Young LLP
Los Angeles, California
February 19, 2015
F-2
ROVI CORPORATION AND SUBSIDIARIES
CONSOLIDATED BALANCE SHEETS
(In thousands, except share and per share data)
December 31, | |||||||
2014 | 2013 | ||||||
ASSETS | |||||||
Current assets: | |||||||
Cash and cash equivalents | $ | 154,568 | $ | 156,487 | |||
Short-term investments | 183,074 | 365,976 | |||||
Trade accounts receivable, net | 83,514 | 104,386 | |||||
Taxes receivable | 230 | 1,907 | |||||
Deferred tax assets, net | 18,553 | 18,621 | |||||
Prepaid expenses and other current assets | 12,621 | 14,936 | |||||
Assets held for sale | — | 106,688 | |||||
Total current assets | 452,560 | 769,001 | |||||
Long-term marketable investment securities | 131,378 | 118,658 | |||||
Property and equipment, net | 37,227 | 33,350 | |||||
Finite-lived intangible assets, net | 463,348 | 478,229 | |||||
Long-term deferred tax assets | 1,805 | — | |||||
Other assets | 15,420 | 16,907 | |||||
Goodwill | 1,343,652 | 1,298,448 | |||||
Total assets | $ | 2,445,390 | $ | 2,714,593 | |||
LIABILITIES AND STOCKHOLDERS’ EQUITY | |||||||
Current liabilities: | |||||||
Accounts payable and accrued expenses | $ | 83,208 | $ | 94,560 | |||
Deferred revenue | 18,399 | 9,848 | |||||
Current portion of long-term debt | 302,375 | — | |||||
Liabilities held for sale | — | 5,513 | |||||
Total current liabilities | 403,982 | 109,921 | |||||
Taxes payable, less current portion | 10,100 | 44,038 | |||||
Long-term debt, less current portion | 804,557 | 1,186,564 | |||||
Deferred revenue, less current portion | 15,722 | 4,641 | |||||
Long-term deferred tax liabilities, net | 80,751 | 41,379 | |||||
Other non-current liabilities | 24,014 | 14,834 | |||||
Total liabilities | 1,339,126 | 1,401,377 | |||||
Commitments and contingencies (Note 16) | |||||||
Stockholders’ equity: | |||||||
Common stock, $0.001 par value, 250,000,000 shares authorized; 130,626,844 shares issued and 91,729,019 outstanding as of December 31, 2014, and 128,351,405 shares issued and 97,781,006 outstanding as of December 31, 2013 | 131 | 128 | |||||
Treasury stock, 38,897,825 shares at December 31, 2014 and 30,570,399 shares at December 31, 2013, at cost | (1,013,218 | ) | (816,694 | ) | |||
Additional paid-in capital | 2,339,817 | 2,279,196 | |||||
Accumulated other comprehensive loss | (5,307 | ) | (3,999 | ) | |||
Accumulated deficit | (215,159 | ) | (145,415 | ) | |||
Total stockholders’ equity | 1,106,264 | 1,313,216 | |||||
Total liabilities and stockholders’ equity | $ | 2,445,390 | $ | 2,714,593 | |||
See the accompanying notes to consolidated financial statements.
F-3
ROVI CORPORATION AND SUBSIDIARIES
CONSOLIDATED STATEMENTS OF OPERATIONS
(In thousands, except per share data)
Year Ended December 31, | |||||||||||
2014 | 2013 | 2012 | |||||||||
Revenues | $ | 542,311 | $ | 537,390 | $ | 526,094 | |||||
Costs and expenses: | |||||||||||
Cost of revenues, exclusive of amortization of intangible assets | 107,253 | 96,361 | 105,126 | ||||||||
Research and development | 108,746 | 111,326 | 117,985 | ||||||||
Selling, general and administrative | 136,736 | 147,544 | 139,520 | ||||||||
Depreciation | 17,540 | 16,775 | 19,956 | ||||||||
Amortization of intangible assets | 77,887 | 74,413 | 74,337 | ||||||||
Restructuring and asset impairment charges | 10,939 | 7,638 | 4,737 | ||||||||
Gain on sale of patents | (500 | ) | — | — | |||||||
Total costs and expenses | 458,601 | 454,057 | 461,661 | ||||||||
Operating income from continuing operations | 83,710 | 83,333 | 64,433 | ||||||||
Interest expense | (54,768 | ) | (62,019 | ) | (61,742 | ) | |||||
Interest income and other, net | 4,069 | 2,775 | 3,203 | ||||||||
Debt modification expense | (3,775 | ) | (1,351 | ) | (4,496 | ) | |||||
(Loss) income on interest rate swaps, net | (17,874 | ) | 2,898 | (10,624 | ) | ||||||
Loss on debt redemption | (5,159 | ) | (2,761 | ) | (1,758 | ) | |||||
Income (loss) from continuing operations before income taxes | 6,203 | 22,875 | (10,984 | ) | |||||||
Income tax expense | 19,725 | 1,540 | 9,158 | ||||||||
(Loss) income from continuing operations, net of tax | (13,522 | ) | 21,335 | (20,142 | ) | ||||||
Discontinued operations, net of tax | (56,222 | ) | (193,425 | ) | (14,202 | ) | |||||
Net loss | $ | (69,744 | ) | $ | (172,090 | ) | $ | (34,344 | ) | ||
Basic earnings per share: | |||||||||||
Basic (loss) income per share from continuing operations | $ | (0.15 | ) | $ | 0.22 | $ | (0.19 | ) | |||
Basic loss per share from discontinued operations | (0.61 | ) | (1.97 | ) | (0.14 | ) | |||||
Basic net earnings per share | $ | (0.76 | ) | $ | (1.75 | ) | $ | (0.33 | ) | ||
Shares used in computing basic net earnings per share | 91,654 | 98,371 | 104,623 | ||||||||
Diluted earnings per share: | |||||||||||
Diluted (loss) income per share from continuing operations | $ | (0.15 | ) | $ | 0.22 | $ | (0.19 | ) | |||
Diluted loss per share from discontinued operations | (0.61 | ) | (1.96 | ) | (0.14 | ) | |||||
Diluted net earnings per share | $ | (0.76 | ) | $ | (1.74 | ) | $ | (0.33 | ) | ||
Shares used in computing diluted net earnings per share | 91,654 | 99,092 | 104,623 | ||||||||
See the accompanying notes to consolidated financial statements.
F-4
ROVI CORPORATION AND SUBSIDIARIES
CONSOLIDATED STATEMENTS OF COMPREHENSIVE LOSS
(In thousands)
Year Ended December 31, | |||||||||||
2014 | 2013 | 2012 | |||||||||
Net loss | $ | (69,744 | ) | $ | (172,090 | ) | $ | (34,344 | ) | ||
Other comprehensive loss, net of tax: | |||||||||||
Foreign currency translation adjustment | (1,557 | ) | (3,237 | ) | (1,226 | ) | |||||
Unrealized gains on investments, net | 249 | 613 | 164 | ||||||||
Other comprehensive loss | (1,308 | ) | (2,624 | ) | (1,062 | ) | |||||
Comprehensive loss | $ | (71,052 | ) | $ | (174,714 | ) | $ | (35,406 | ) | ||
See the accompanying notes to consolidated financial statements.
F-5
ROVI CORPORATION AND SUBSIDIARIES
CONSOLIDATED STATEMENTS OF STOCKHOLDERS’ EQUITY
(In thousands, except share data)
See the accompanying notes to consolidated financial statements.
Common stock | Treasury stock | Additional paid-in capital | Accumulated other comprehensive loss | Retained earnings (Accumulated deficit) | Total stockholders’ equity | |||||||||||||||||||||||
Shares | Amount | Shares | Amount | |||||||||||||||||||||||||
Balances as of December 31, 2011 | 122,519,604 | $ | 123 | (13,066,233) | $ | (482,479 | ) | $ | 2,114,402 | $ | (313 | ) | $ | 61,019 | $ | 1,692,752 | ||||||||||||
Net (loss) income | (34,344 | ) | (34,344 | ) | ||||||||||||||||||||||||
Other comprehensive (loss) income | (1,062 | ) | (1,062 | ) | ||||||||||||||||||||||||
Issuance of common stock upon exercise of options | 332,623 | 5,280 | 5,280 | |||||||||||||||||||||||||
Issuance of common stock under employee stock purchase plan | 528,755 | 1 | 10,327 | 10,328 | ||||||||||||||||||||||||
Issuance of restricted stock, net | 1,414,694 | 1 | (1 | ) | — | |||||||||||||||||||||||
Equity-based compensation | 65,646 | 65,646 | ||||||||||||||||||||||||||
Excess tax benefit (deficiency) associated with stock plans | 913 | 913 | ||||||||||||||||||||||||||
Stock repurchases | (8,354,780) | (152,092 | ) | (152,092 | ) | |||||||||||||||||||||||
Balances as of December 31, 2012 | 124,795,676 | $ | 125 | (21,421,013) | $ | (634,571 | ) | $ | 2,196,567 | $ | (1,375 | ) | $ | 26,675 | $ | 1,587,421 | ||||||||||||
Net (loss) income | (172,090 | ) | (172,090 | ) | ||||||||||||||||||||||||
Other comprehensive (loss) income | (2,624 | ) | (2,624 | ) | ||||||||||||||||||||||||
Issuance of common stock upon exercise of options | 300,425 | 4,327 | 4,327 | |||||||||||||||||||||||||
Issuance of common stock under employee stock purchase plan | 1,237,344 | 1 | 14,241 | 14,242 | ||||||||||||||||||||||||
Issuance of restricted stock, net | 2,017,960 | 2 | (2 | ) | — | |||||||||||||||||||||||
Equity-based compensation | 64,226 | 64,226 | ||||||||||||||||||||||||||
Excess tax benefit (deficiency) associated with stock plans | (163 | ) | (163 | ) | ||||||||||||||||||||||||
Stock repurchases | (9,149,386) | (182,123 | ) | (182,123 | ) | |||||||||||||||||||||||
Balances as of December 31, 2013 | 128,351,405 | $ | 128 | (30,570,399) | $ | (816,694 | ) | $ | 2,279,196 | $ | (3,999 | ) | $ | (145,415 | ) | $ | 1,313,216 | |||||||||||
Net (loss) income | (69,744 | ) | (69,744 | ) | ||||||||||||||||||||||||
Other comprehensive (loss) income | (1,308 | ) | (1,308 | ) | ||||||||||||||||||||||||
Issuance of common stock upon exercise of options | 320,210 | 1 | 5,218 | 5,219 | ||||||||||||||||||||||||
Issuance of common stock under employee stock purchase plan | 1,042,562 | 1 | 12,573 | 12,574 | ||||||||||||||||||||||||
Issuance of restricted stock, net | 912,667 | 1 | (1 | ) | — | |||||||||||||||||||||||
Equity-based compensation | 42,710 | 42,710 | ||||||||||||||||||||||||||
Excess tax benefit (deficiency) associated with stock plans | 121 | 121 | ||||||||||||||||||||||||||
Stock repurchases | (8,327,426) | (196,524 | ) | (196,524 | ) | |||||||||||||||||||||||
Balances as of December 31, 2014 | 130,626,844 | $ | 131 | (38,897,825) | $ | (1,013,218 | ) | $ | 2,339,817 | $ | (5,307 | ) | $ | (215,159 | ) | $ | 1,106,264 | |||||||||||
F-6
ROVI CORPORATION AND SUBSIDIARIES
CONSOLIDATED STATEMENTS OF CASH FLOWS
(In thousands)
Year Ended December 31, | |||||||||||
2014 | 2013 | 2012 | |||||||||
Cash flows from operating activities: | |||||||||||
Net loss | $ | (69,744 | ) | $ | (172,090 | ) | $ | (34,344 | ) | ||
Adjustments to reconcile net loss to net cash provided by operations: | |||||||||||
Loss from discontinued operations, net of tax | 56,222 | 193,425 | 14,202 | ||||||||
Change in fair value of interest rate swaps | 9,845 | 3,173 | 20,202 | ||||||||
Depreciation | 17,540 | 16,775 | 19,956 | ||||||||
Amortization of intangible assets | 77,887 | 74,413 | 74,337 | ||||||||
Asset impairment charge | 1,213 | 4,391 | 1,292 | ||||||||
Debt modification expense | 3,775 | 1,351 | 4,496 | ||||||||
Amortization of note issuance costs and convertible note discount | 17,330 | 17,931 | 15,911 | ||||||||
Equity-based compensation | 42,017 | 54,661 | 56,554 | ||||||||
Loss on debt redemption | 5,159 | 2,761 | 1,758 | ||||||||
Deferred taxes | (3,042 | ) | (1,051 | ) | 5,992 | ||||||
Other, net | 2,583 | 11,557 | 9,838 | ||||||||
Changes in operating assets and liabilities, net of assets and liabilities acquired: | |||||||||||
Accounts receivable, net | 20,467 | (11,491 | ) | 14,444 | |||||||
Deferred revenue | 19,305 | (1,743 | ) | 2,065 | |||||||
Prepaid expenses, other current assets, and other assets | 2,954 | 12,412 | (14,543 | ) | |||||||
Income taxes | 4,942 | (3,560 | ) | (15,113 | ) | ||||||
Accounts payable, accrued expenses, and other long-term liabilities | (17,752 | ) | 2,075 | (19,560 | ) | ||||||
Net cash provided by operating activities of continuing operations | 190,701 | 204,990 | 157,487 | ||||||||
Net cash (used in) provided by operating activities of discontinued operations | (5,872 | ) | (9,651 | ) | 28,892 | ||||||
Net cash provided by operating activities | 184,829 | 195,339 | 186,379 | ||||||||
Cash flows from investing activities: | |||||||||||
Purchases of long and short-term marketable investments | (303,593 | ) | (664,364 | ) | (781,134 | ) | |||||
Sales or maturities of long and short-term marketable investments | 469,519 | 855,113 | 438,954 | ||||||||
Proceeds from sale of business | 50,298 | 1,000 | 18,458 | ||||||||
Purchase of patents | (28,000 | ) | — | — | |||||||
Payment to Rovi Entertainment Store buyer | — | (8,500 | ) | — | |||||||
Purchases of property and equipment | (23,392 | ) | (19,067 | ) | (15,041 | ) | |||||
Payments for acquisition, net of cash acquired | (70,272 | ) | (10,000 | ) | (19,989 | ) | |||||
Other investing, net | (831 | ) | (105 | ) | (1,374 | ) | |||||
Net cash provided by (used in) investing activities of continuing operations | 93,729 | 154,077 | (360,126 | ) | |||||||
Net cash used in investing activities of discontinued operations | — | (1,374 | ) | (5,614 | ) | ||||||
Net cash provided by (used in) investing activities | 93,729 | 152,703 | (365,740 | ) | |||||||
Cash flows from financing activities: | |||||||||||
Payments under debt obligations | (917,506 | ) | (849,141 | ) | (324,639 | ) | |||||
Purchase of treasury stock | (192,173 | ) | (182,123 | ) | (152,092 | ) | |||||
Proceeds from issuance of debt, net of issuance costs | 812,001 | 537,524 | 788,532 | ||||||||
Excess tax benefits associated with equity plans | 121 | — | 913 | ||||||||
Proceeds from exercise of options and employee stock purchase plan | 17,793 | 18,569 | 15,608 | ||||||||
Net cash (used in) provided by financing activities of continuing operations | (279,764 | ) | (475,171 | ) | 328,322 | ||||||
Net cash used in financing activities of discontinued operations | — | — | — | ||||||||
Net cash (used in) provided by financing activities | (279,764 | ) | (475,171 | ) | 328,322 | ||||||
Effect of exchange rate changes on cash | (713 | ) | (1,736 | ) | (389 | ) | |||||
Net (decrease) increase in cash and cash equivalents | (1,919 | ) | (128,865 | ) | 148,572 | ||||||
Cash and cash equivalents at beginning of period | 156,487 | 285,352 | 136,780 | ||||||||
Cash and cash equivalents at end of period | $ | 154,568 | $ | 156,487 | $ | 285,352 | |||||
Supplemental disclosures: | |||||||||||
Income taxes paid | $ | 20,278 | $ | 23,619 | $ | 27,212 | |||||
Income tax refunds received | $ | 1,280 | $ | 8,900 | $ | 3,547 | |||||
Interest paid | $ | 36,679 | $ | 42,749 | $ | 46,440 | |||||
See the accompanying notes to consolidated financial statements.
ROVI CORPORATION AND SUBSIDIARIES
NOTES TO CONSOLIDATED FINANCIAL STATEMENTS
(1) Basis of Presentation
Description of Business
Rovi Corporation (the “Company”), a Delaware corporation, was formed in 2007. On May 2, 2008, Macrovision Corporation acquired Gemstar-TV Guide International, Inc. (“Gemstar”). Upon consummation of this transaction, the Company assumed ownership of both Gemstar and Macrovision Corporation. The common stock of Macrovision Corporation and Gemstar were de-registered and Macrovision Corporation stockholders were provided one share in Rovi Corporation for each share of Macrovision Corporation common stock owned as of the closing.
The Company is focused on powering the discovery and personalization of digital entertainment. The Company provides a broad set of integrated solutions that are embedded in its customers' products and services, connecting consumers with entertainment. Content discovery solutions include interactive program guides (“IPGs”), search and recommendations, cloud data services and the Company's extensive database of "Metadata" (i.e. descriptive information, promotional images or other content that describe or relate to television shows, videos, movies, music, books, games or other entertainment content). In addition to offering Company developed IPGs, customers may also license the Company's patents and deploy their own IPG or a third party IPG. The Company also offers advertising and analytics services. Rovi's solutions are deployed globally in the cable, satellite, consumer electronics, entertainment, media and online distribution markets.
Basis of Presentation and Principles of Consolidation
The accompanying consolidated financial statements include the accounts of Rovi Corporation and its wholly and majority-owned subsidiaries after elimination of intercompany accounts and transactions.
During the fourth quarter of 2013, the Company made a determination that it would pursue selling its DivX and MainConcept business. On March 31, 2014, the Company sold its DivX and MainConcept business for $52.5 million in cash plus up to $22.5 million in additional payments based on the achievement of certain agreed-upon revenue milestones over the next three years. In March 2014, the Company sold its Nowtilus business. On September 1, 2013, the Company sold its Rovi Entertainment Store business. On August 15, 2013 the Company sold its Consumer Website business, which includes the SideReel.com and allmusic.com sites, among others. On February 1, 2012, the Company sold its Roxio Consumer Software business. The results of operations and cash flows of the DivX, MainConcept, Nowtilus, Rovi Entertainment Store, Consumer Website and the Roxio Consumer Software businesses have been classified as discontinued operations for all periods presented (See Note 5).
In connection with a review of its operations in 2014 (See Note 11), the Company determined certain costs related to the operations of its service provider IPG business and advertising business are more appropriately reflected in cost of revenues. The Company has moved $3.7 million in 2013 costs and $3.6 million in 2012 costs from selling, general and administrative expenses to cost of revenues in its Consolidated Statement of Operations to be consistent with the 2014 presentation. The Company does not consider any of these adjustments to be material.
Use of Estimates
The preparation of consolidated financial statements in conformity with generally accepted accounting principles in the United States requires management to make estimates and assumptions that affect the reported amounts of assets and liabilities and disclosure of contingent assets and liabilities at the date of the financial statements and reported results of operations during the reporting period. On an ongoing basis, the Company evaluates its estimates, including those related to revenue recognition, allowance for doubtful accounts, equity-based compensation, goodwill and other intangible assets, long-lived assets and income taxes. Actual results could differ from those estimates.
(2) Summary of Significant Accounting Policies
Recent Accounting Pronouncements
In May 2014, the Financial Accounting Standards Board ("FASB") issued Accounting Standards Update No. 2014-09, Revenue from Contracts with Customers ("ASU 2014-09") an updated standard on revenue recognition. This ASU will supersede the revenue recognition requirements in Accounting Standards Codification Topic 605, Revenue Recognition, and most industry-specific guidance. ASU 2014-09 provides enhancements to the quality and consistency of how revenue is
F-8
reported while also improving comparability in the financial statements of companies reporting using US GAAP and International Financial Reporting Standards. The core principle of the new standard is for companies to recognize revenue to depict the transfer of goods or services to customers in amounts that reflect the consideration to which the Company expects to be entitled in exchange for those goods or services. In doing so the Company may be required to use more judgment and make more estimates than under current authoritative guidance. ASU 2014-09 will be effective for the Company in the first quarter of fiscal 2017 and may be applied on a full retrospective or modified retrospective approach. The Company is currently evaluating the impact the adoption of this standard will have on its consolidated financial statements.
In April 2014, the FASB issued Accounting Standards Update No. 2014-08, Presentation of Financial Statements (Topic 205) and Property, Plant, and Equipment (Topic 360): Reporting Discontinued Operations and Disclosures of Disposals of Components of an Entity ("ASU 2014-08"). ASU 2014-08 raises the threshold for a disposal to qualify as a discontinued operation and requires new disclosures of both discontinued operations and certain other disposals that do not meet the definition of a discontinued operation. It is effective for annual periods beginning on or after December 15, 2014. Early adoption is permitted but only for disposals that have not been reported in financial statements previously issued. The Company does not expect the impact of the adoption of ASU 2014-08 will have a material impact on its consolidated financial statements.
Cash, Cash Equivalents and Investments
The Company considers investments with original maturities from the date of purchase of three months or less to be cash equivalents. Cash and cash equivalents consist of cash on deposit with banks, money market funds and corporate debt securities. All other liquid investments with maturities over three months and less than 12 months are classified as short-term investments. All marketable securities with maturities over one year or those for which the Company’s intent is to retain them for more than twelve months are classified as long-term marketable investment securities.
Management determines the appropriate classification of investment securities at the time of purchase and re-evaluates such designation as of each balance sheet date. Available-for-sale securities are carried at fair value, with unrealized gains and losses reported in accumulated other comprehensive loss, as a separate component of stockholders’ equity.
Realized gains and losses and declines in value judged to be other-than-temporary for available-for-sale securities are reported in interest income and other, net as incurred. The cost of securities sold is based on the specific identification method. Interest and dividends on securities classified as available-for-sale are included in interest income and other, net.
Allowance for Doubtful Accounts
The Company maintains an allowance for doubtful accounts to reserve for potentially uncollectible trade receivables. The Company reviews its trade receivables by aging category to identify significant customers with collection issues. For accounts not specifically identified, the Company provides reserves based on historical bad debt loss experience.
Property and Equipment
Property and equipment are stated at cost, net of accumulated depreciation and amortization. Depreciation and amortization is computed using the straight-line method over the estimated useful lives of the respective assets. Computer equipment and software are depreciated over three years. Furniture and fixtures are depreciated over five years. Leasehold improvements are amortized on a straight-line basis over the shorter of the assets’ useful lives or lease terms.
Joint Ventures and Other Investments
Investments of 50% or less in entities in which the Company has the ability to exercise significant influence over operations are accounted for using the equity method.
Deferred Revenue
Deferred revenue represents cash amounts received from customers under certain license agreements for which the revenue earnings process has not been completed.
Comprehensive Loss
Comprehensive loss includes net loss, foreign currency translation adjustments and unrealized gains and losses, net of related taxes, on marketable investment securities that have been excluded from the determination of net loss.
F-9
Revenue Recognition
The Company’s revenue from continuing operations primarily consists of license fees for the Company's IPG products and patents, content protection technologies and entertainment Metadata and advertising revenue. The Company recognizes revenue when the following conditions are met: (i) there is persuasive evidence that an arrangement exists, (ii) delivery has occurred or service has been rendered, (iii) the price is fixed or determinable and (iv) collection is reasonably assured.
Revenue arrangements with multiple deliverables are divided into separate units of accounting when the delivered item has value to the customer on a stand-alone basis. The Company allocates the total consideration among the various elements based on their relative selling price using vendor specific objective evidence (VSOE) of selling price, if it exists; otherwise selling price is determined based on third-party evidence (TPE). If neither VSOE nor TPE exist, the Company uses its best estimate of selling price (BESP) to allocate the arrangement consideration. The allocation of value may impact the amount and timing of revenue recorded in the Consolidated Statement of Operations during a given period.
The Company accounts for cash consideration (such as sales incentives) that it gives to its customers or resellers as a reduction of revenue, rather than as an operating expense unless the Company receives a benefit that is separate from the customer’s purchase from the Company and for which it can reasonably estimate the fair value.
Amounts for fees collected relating to arrangements where revenue cannot be recognized are reflected on the Company’s balance sheet as deferred revenue and recognized when the applicable revenue recognition criteria are satisfied.
CE and Service Provider Licensing
The Company licenses its proprietary IPG technology and ACP technology to consumer electronics (“CE”) manufacturers, integrated circuit makers, service providers and others. For agreements where license fees are based on the number of units shipped or the number of subscribers, the Company generally recognizes revenue from licensing technology on a per-unit shipped model with CE manufacturers or a per-subscriber model with service providers. The Company’s recognition of revenues from per-unit license fees is based on units reported shipped by the manufacturer. CE manufacturers normally report their unit shipments to the Company in the quarter immediately following that of actual shipment by the manufacturer. The Company has established significant experience and relationships with certain ACP technology licensing customers to reasonably estimate current period volume for purposes of making an accurate revenue accrual. Accordingly, revenue from these customers is recognized in the period the customer shipped the units. Revenues from per-subscriber fees are recognized in the period the services are provided by a licensee, as reported to the Company by the licensee. Revenues from annual or other license fees are recognized based on the specific terms of the license arrangement. For instance, major CE IPG licensees have entered into agreements for which they have the right to ship an unlimited number of units over a specified term for a flat fee. The Company records the fees associated with these arrangements on a straight-line basis over the specified term. The Company at times enters into IPG patent license agreements in which it provides a licensee a release for past infringement as well as the right to ship an unlimited number of units over a future period for a flat fee. In this type of arrangement, the Company generally would use BESP to allocate the consideration between the release for past infringement and the go-forward patent license. In determining BESP of the past infringement component and the go-forward license agreement, the Company considers such factors as the number of units shipped in the past and in what territories these units where shipped, the number of units expected to be shipped in the future and in what territories these units are expected to be shipped, as well as the licensing rate the Company generally receives for units shipped in these territories. As the revenue recognition criteria for the past infringement would generally be satisfied upon the execution of the agreement, the amount of consideration allocated to the past infringement would be recognized in the quarter the agreement is executed and the amount allocated to the go-forward license agreement would be recognized ratably over the term. In addition, the Company enters into agreements in which the licensee pays the Company a one-time fee for a perpetual license to its ACP technology. Provided that collectability is reasonably assured, the Company records revenue related to these agreements when the agreement is executed as the Company has no significant continuing obligation and the amounts are fixed and determinable.
The Company also generates advertising revenue through its IPGs and other platforms. Advertising revenue is recognized when the related advertisement is provided. All advertising revenue is recorded net of agency commissions and revenue shares with service providers and CE manufacturers.
Metadata Licensing
The Company licenses its Metadata to service providers, CE manufacturers and online portals among others. The Company generally receives a monthly or quarterly fee from its licensees for the right to use the Metadata, receive regular updates and integrate it into their own service. The Company recognizes revenue on a straight-line basis over the period its licensee has the right to receive the Metadata service.
F-10
Discontinued Operations-DivX and MainConcept
The Company generally licensed its DivX and MainConcept codecs for a per unit fee or an annual fee. The Company’s recognition of revenue from per-unit license fees is based on units reported shipped by the manufacturer. CE manufacturers normally reported their unit shipments to the Company in the quarter immediately following that of actual shipment by the manufacturer. Revenues from annual or other license fees were recognized based on the specific terms of the license arrangement. For instance, some of the Company’s large CE licensees entered into agreements for which they had the right to ship an unlimited number of units over a specified term for a flat fee. The Company recorded the fees associated with these arrangements on a straight-line basis over the specified term. In addition, the Company entered into agreements in which the licensee paid the Company a one-time fee for a perpetual license to its DivX technology. Provided that collectability was reasonably assured, the Company recorded revenue related to these agreements when the agreement was executed as the Company had no significant continuing obligation and the amounts were fixed and determinable.
Discontinued Operations-Rovi Entertainment Store Video Delivery Solution
The Company recognized service fees it received from retailers and others for operating their storefronts on a straight-line basis over the period it provided services. The Company recognized transaction revenue from the sale or rental of individual content titles in the period when the content was purchased and delivered. Transaction revenue was recorded on a gross basis when the Company was the principal in the transaction and was recorded net of payments to content owners and others when the Company was acting as an agent. The Company was generally the principal in the transaction when it was the merchant of record and was licensing the content distribution rights.
Discontinued Operations-Roxio Consumer Software Products
Except in the case of consignment arrangements, the Company recognized revenue from the sale of its packaged software products when title transferred to the distributor or retailer. When the Company sold packaged software products to distributors and retailers on a consignment basis, it recognized revenue upon sell-through to an end customer.
The Company’s distributor arrangements often provided distributors with certain product rotation rights. The Company estimated returns based on its historical return experience and other factors such as channel inventory levels and the introduction of new products. These allowances are recorded as a reduction of revenues and as an offset to accounts receivable to the extent the Company had legal right of offset, otherwise they were recorded in accrued expenses and other current liabilities. If future returns patterns differed from past returns patterns, for example due to reduced demand for the Company’s product, the Company would have been required to increase these allowances in the future and may have been required to reduce future revenues.
The Company also licensed its software to OEMs who included it with the PCs they sold. The Company generally received a per-unit royalty and recognized this revenue upon receipt of the customer royalty report.
Cost of Revenues
Cost of revenues consists primarily of data costs, royalty expenses, patent prosecution, patent maintenance and patent litigation costs.
Equity-Based Compensation
Equity-based compensation cost is measured at the grant date based on the fair value of the award. The Company recognizes compensation costs for awards that are expected to vest, on a straight-line basis, over the requisite service period of the award.
Income Taxes
Income taxes are accounted for under the asset and liability method. Deferred tax assets and liabilities are recognized for the future tax consequences attributable to differences between the financial statement carrying amounts of existing assets and liabilities and their respective tax bases and operating loss and tax carry forwards. Deferred tax assets and liabilities are measured using enacted tax rates expected to apply to taxable income in the years in which those temporary differences are expected to be recovered or settled. The effect on deferred tax assets and liabilities of a change in tax rates is recognized in income in the period that includes the enactment date. The measurement of deferred tax assets is reduced, if necessary, by a valuation allowance for any tax benefits of which future realization is not evaluated to be more likely than not.
F-11
From time to time, the Company engages in transactions in which the tax consequences may be subject to uncertainty. Significant judgment is required in assessing and estimating the tax consequences of these transactions. In determining the Company’s tax provision for financial reporting purposes, the Company establishes a reserve for uncertain tax positions unless such positions are determined to be more likely than not of being sustained upon examination, based on their technical merits.
On January 1, 2014, the Company adopted, on a prospective basis, ASU 2013-11, Presentation of an Unrecognized Tax Benefit When a Net Operating Loss Carryforward, a Similar Tax loss, or a Tax Credit Carryforward Exists (ASU 2013-11). This update states that an unrecognized tax benefit should be presented as a reduction of a deferred tax asset for a net operating loss carryforward or other tax credit carryforward when settlement in this manner is available under the tax law. The adoption reduced both the Company's long-term income tax payable and the Company's deferred tax asset for net operating loss carryforwards by $37.0 million.
Taxes Collected from Customers
The Company applies the net basis presentation for taxes collected from customers and remitted to governmental authorities.
Foreign Currency Translation
The translation of the accounts of Company subsidiaries with a functional currency other than the United States Dollar is performed for balance sheet accounts using current exchange rates in effect at the balance sheet date and for revenues and expense accounts using an average exchange rate for the respective periods. Adjustments resulting from such translation are included in comprehensive income. Gains or losses resulting from foreign currency transactions included in the Consolidated Statements of Operations were not material in any of the periods presented.
Business and Concentration of Credit Risk and Fair Value of Financial Instruments
Financial instruments that potentially subject the Company to significant concentrations of credit risk consist principally of cash, cash equivalents, marketable securities, interest rate swaps and caps and trade accounts receivable. The Company places its cash and cash equivalents, marketable securities and money market funds with various high credit quality institutions.
The Company performs ongoing credit evaluations of its customers as necessary. For the years ended December 31, 2014, 2013 and 2012 11%, 11%, and 11% respectively, of the Company's revenue from continuing operations was related to its contract with DIRECTV. Substantially all of the Company's revenue from DIRECTV is recorded in the Intellectual Property Licensing segment. For the years ended December 31, 2014 and 2013, 22% and 21%, respectively, of the Company's revenue from continuing operations was related to its contracts with DIRECTV, Comcast and Time Warner Cable. These customers' current contracts expire in the second half of 2015 and first half of 2016. As of December 31, 2013, a receivable from one customer represented 14% of the Company's accounts receivable. As of December 31, 2014, the Company did not have any customers whose receivable exceeded 10% of its accounts receivable.
On January 1, 2012, the Company adopted FASB Accounting Standards Update No. 2011-04, Fair Value Measurement (Topic 820): Amendments to Achieve Common Fair Value Measurement and Disclosure Requirements in U.S. GAAP and IFRSs ("ASU 2011-04"). The new guidance limits the highest-and-best-use measure to nonfinancial assets, permits certain financial assets and liabilities with offsetting positions in market or counterparty credit risks to be measured at a net basis, and provides guidance on the applicability of premiums and discounts. Additionally, the new guidance expands the disclosures on Level 3 inputs by requiring quantitative disclosure of the unobservable inputs and assumptions, as well as the description of the valuation processes and the sensitivity of the fair value to changes in unobservable inputs. The Company is making an accounting policy election to use the exception in Accounting Standard Codification ("ASC") 820-10-35-18D (commonly referred to as the portfolio exception) with respect to measuring counterparty credit risk for derivative instruments subject to master netting arrangements, consistent with the guidance in ASC 820-10-35-18G. The adoption of ASU 2011-04 did not have a material effect on the Company's results from operations or financial position.
On January 1, 2013, the Company adopted FASB Accounting Standards Update No. 2011-11, Balance Sheet (Topic 210): Disclosures about Offsetting Assets and Liabilities ("ASU 2011-11") and Accounting Standards Update No. 2013-01, Clarifying the Scope of Disclosures about Offsetting Assets and Liabilities. The new guidance requires the disclosure of the gross amounts subject to rights of set off, amounts offset in accordance with the accounting standards followed, and the related net exposure. The new guidance only relates to disclosure requirements and its adoption did not have a material effect on the Company's results from operations or financial position.
F-12
Earnings Per Share
Basic EPS is computed using the weighted average number of common shares outstanding during the period. Diluted EPS is computed using the weighted average number of common and dilutive common equivalent shares outstanding during the period, except for periods of operating loss for which no common share equivalents are included because their effect would be anti-dilutive.
The following is a reconciliation between weighted average number of shares used to calculate Basic EPS and Diluted EPS (in thousands):
December 31, | ||||||||
2014 | 2013 | 2012 | ||||||
Basic EPS - weighted average number of common shares outstanding | 91,654 | 98,371 | 104,623 | |||||
Dilutive effect of employee equity incentive plans | — | 721 | — | |||||
Diluted EPS - weighted average number of common shares and common share equivalents outstanding | 91,654 | 99,092 | 104,623 | |||||
The following weighted average potential common shares were excluded from the computation of diluted net earnings per share as their effect would have been anti-dilutive (in thousands):
December 31, | ||||||||
2014 | 2013 | 2012 | ||||||
Stock options | 4,517 | 4,038 | 5,069 | |||||
Restricted stock | 3,049 | 1,565 | 3,005 | |||||
Convertible notes (1) | 6,141 | 6,141 | 6,144 | |||||
Total weighted average potential common shares excluded from diluted net earnings per share | 13,707 | 11,744 | 14,218 | |||||
(1) | See Note 7 for additional details. |
In addition, for the years ended December 31, 2014, 2013 and 2012, the Company excluded 0.8 million, 0.6 million and 0.2 million weighted average shares of performance based restricted stock awards from the computation of diluted net earnings per share as the performance metric had yet to be achieved or the inclusion of the shares would be anti-dilutive as of December 31, 2014, 2013 and 2012, respectively.
Goodwill and Other Intangibles from Acquisitions
Goodwill is reviewed for impairment annually, or more frequently, if facts and circumstances warrant a review. The provisions require the Company to first assess qualitative factors to determine whether events or circumstances lead to the determination that the fair value of a reporting unit is less than its carrying value. If, after assessing the totality of events or circumstances, the Company determines it is more likely than not that the fair value of a reporting unit is less than its carrying amount, then the Company performs the two-step impairment test. In the first step of the two-step impairment test, the fair value of each reporting unit is compared to its carrying value. If the fair value exceeds the carrying value, goodwill is not impaired and no further testing is performed. The second step is performed if the carrying value exceeds the fair value. The implied fair value of the reporting unit’s goodwill must be determined and compared to the carrying value of the goodwill. If the carrying value of a reporting unit’s goodwill exceeds its implied fair value, an impairment loss equal to the difference will be recorded.
Intangible assets with finite lives are amortized over their estimated useful life, generally two to eighteen years, and reviewed for impairment when events and circumstances indicate that the intangible asset might be impaired.
Impairment of Long-Lived Assets and Long-Lived Assets to Be Disposed of, Excluding Goodwill and Indefinite-Lived Intangible Assets
The Company records impairment losses on long-lived assets, excluding goodwill and indefinite-lived intangible assets, used in operations when events and circumstances indicate that long-lived assets might be impaired and the undiscounted cash flows estimated to be generated by those assets are less than the carrying amounts of those assets. If required, the impairment recognized is the difference between the fair value of the asset and its carrying amount.
F-13
Software Development Costs
Capitalization of software development costs begins upon the establishment of technological feasibility, which is generally the completion of a working prototype that has been certified as having no critical bugs and is a release candidate or when alternative future use exists. To date, software development costs incurred between completion of a working prototype and general availability of the related product have not been material and have not been capitalized.
Research and Development
Expenditures for research and development are expensed as incurred.
Advertising Expenses
The Company expenses all advertising costs as incurred and for its continuing operations classifies these costs under selling, general and administrative expense. Advertising expenses for the years ended December 31, 2014, 2013 and 2012, were $7.6 million, $9.7 million and $11.7 million, respectively.
(3) Financial Statement Details
Property and Equipment, Net (in thousands):
December 31, | ||||||||
2014 | 2013 | |||||||
Computer software and equipment | $ | 136,357 | $ | 125,657 | ||||
Leasehold improvements | 20,447 | 20,973 | ||||||
Furniture and fixtures | 7,223 | 6,500 | ||||||
164,027 | 153,130 | |||||||
Less accumulated depreciation and amortization | (126,800 | ) | (119,780 | ) | ||||
Property and equipment, net | $ | 37,227 | $ | 33,350 | ||||
Depreciation expense for our continuing operations for the years ended December 31, 2014, 2013 and 2012 was $17.5 million, $16.8 million, and $20.0 million, respectively.
Accounts Payable and Accrued Expenses (in thousands):
December 31, | ||||||||
2014 | 2013 | |||||||
Accounts payable | $ | 7,131 | $ | 3,384 | ||||
Accrued compensation | 25,809 | 28,135 | ||||||
Interest payable | 2,921 | 2,924 | ||||||
Other accrued liabilities | 47,347 | 60,117 | ||||||
Accounts payable and accrued expenses | $ | 83,208 | $ | 94,560 | ||||
Interest Income and Other, Net (in thousands):
Year ended December 31, | ||||||||||||
2014 | 2013 | 2012 | ||||||||||
Interest income | $ | 1,596 | $ | 2,269 | $ | 2,898 | ||||||
Foreign currency (losses) gains | (574 | ) | (538 | ) | 63 | |||||||
Other income | 3,047 | 1,044 | 242 | |||||||||
Interest income and other, net | $ | 4,069 | $ | 2,775 | $ | 3,203 | ||||||
Allowance for Doubtful Accounts (in thousands):
F-14
Balance at Beginning of Period | Additions | Deductions | Balance at End of Period | |||||||||||||
2014 | $ | 2,475 | $ | — | $ | 1,340 | $ | 1,135 | ||||||||
2013 | $ | 2,526 | $ | — | $ | 51 | $ | 2,475 | ||||||||
2012 | $ | 2,689 | $ | 81 | $ | 244 | $ | 2,526 | ||||||||
(4) Acquisitions
2014 Acquisitions
Fanhattan Acquisition
On October 31, 2014, the Company acquired Fanhattan, Inc., and its cloud-based Fan TV branded products, for $12.0 million in cash. The Company accounted for the transaction under the acquisition method of accounting in accordance with the provisions of FASB ASC Topic 805 Business Combinations (ASC 805).
Under the acquisition method, the total purchase price of the acquired company is allocated to the assets acquired and the liabilities assumed based on their fair values. The Company has made significant estimates and assumptions in determining the allocation of the purchase price.
The Company’s purchase price allocation is as follows (in thousands, except lives):
Weighted Average Estimated Useful Life (In Years) | |||||||||
Cash and cash equivalents | $ | 235 | |||||||
Property and equipment | 297 | ||||||||
Goodwill | 6,407 | ||||||||
Identifiable intangible assets: | |||||||||
Developed technology | 3 | $ | 3,300 | ||||||
Non-compete agreements | 2 | 1,800 | |||||||
Identifiable intangible assets | 5,100 | ||||||||
Prepaid and other assets | 206 | ||||||||
Accounts payable and other liabilities | (245 | ) | |||||||
Total purchase price | $ | 12,000 | |||||||
Veveo Acquisition
On February 28, 2014, the Company acquired Veveo Inc. ("Veveo") for approximately $67.6 million, plus up to an additional $7.0 million in contingent consideration that will be paid if certain sales and engineering goals are met. Veveo is a provider of intuitive and personalized entertainment discovery solutions. The Company initially recorded the contingent consideration at its estimated Level 3 fair value (see Note 10) of $5.7 million. Based on its most recent analysis, in the fourth quarter of 2014, the Company reduced its estimate of the fair value of the contingent consideration to $3.0 million, which is included in accounts payable and accrued expenses on the Consolidated Balance Sheet. The $2.7 million reduction in the contingent consideration liability was recorded in selling, general and administrative expenses on the Consolidated Statement of Operations.
F-15
The Company’s purchase price allocation is as follows (in thousands, except lives):
Weighted Average Estimated Useful Life (In Years) | |||||||||
Cash and cash equivalents | $ | 6,942 | |||||||
Accounts receivable | 179 | ||||||||
Goodwill | 39,449 | ||||||||
Identifiable intangible assets: | |||||||||
Developed technology | 7 | $ | 26,900 | ||||||
Non-compete agreements | 3 | 2,800 | |||||||
Identifiable intangible assets | 29,700 | ||||||||
Prepaid and other assets | 287 | ||||||||
Deferred tax liabilities | (1,966 | ) | |||||||
Accounts payable and other liabilities | (1,247 | ) | |||||||
Total purchase price | $ | 73,344 | |||||||
Patent Acquisition
On July 7, 2014, the Company purchased a portfolio of patents for $28.0 million. The portfolio includes approximately 500 issued patents and pending application worldwide, with slightly more than half of those being issued U.S. patents. The Company has accounted for the transaction as an asset acquisition and is amortizing the purchase price of the patents over ten years.
2013 Acquisitions
On March 8, 2013, the Company acquired IntegralReach Corporation ("IntegralReach") for approximately $10.0 million, plus an additional $3.0 million in contingent consideration that will be paid if certain customer attainment goals are met. IntegralReach is an analytics technology company with core technology built for analyzing large amounts of data. The contingent consideration has been included in accounts payable and accrued expenses on the Consolidated Balance Sheet at its estimated Level 3 (see Note 10) fair value of $3.0 million.
2012 Acquisitions
On May 21, 2012, the Company acquired Snapstick, Inc. ("Snapstick") for approximately $20.0 million in cash. Snapstick has developed a software platform that allows consumers to use a mobile device or laptop to make content available on a TV monitor.
Unaudited Pro Forma Financial Information
The unaudited pro forma financial information presented below (in thousands, except per share amounts) assumes the acquisition of Fanhattan had occurred on January 1, 2013. The pro forma information presented is for illustrative purposes only and is not necessarily indicative of the results of operations that would have been realized if the acquisition had been completed on the date indicated, nor is it indicative of future operating results. The pro forma financial information does not include any adjustments for operating efficiencies or cost savings.
Year ended December 31, | |||||||
2014 | 2013 | ||||||
Net revenue | $ | 542,327 | $ | 537,547 | |||
Operating income | $ | 71,864 | $ | 67,087 | |||
(Loss) income from continuing operations, net of tax | $ | (25,415 | ) | $ | 5,067 | ||
Basic (loss) earnings per share from continuing operations | $ | (0.28 | ) | $ | 0.05 | ||
Diluted (loss) earnings per share from continuing operations | $ | (0.28 | ) | $ | 0.05 | ||
(5) Discontinued Operations and Assets Held for Sale
DivX and MainConcept
F-16
During the fourth quarter of 2013 the Company made a determination that it would pursue selling its DivX and MainConcept business. On March 31, 2014, the Company sold its DivX and MainConcept business for $52.5 million in cash, plus up to $22.5 million in additional payments based on the achievement of certain agreed-upon revenue milestones over the next three years. The results of operations and cash flows of the DivX and MainConcept business have been recorded as discontinued operations for all periods presented.
Assets and liabilities held for sale included the following as of December 31, 2013 (in thousands):
December 31, 2013 | |||
Trade accounts receivable, net | $ | 5,339 | |
Taxes receivable | 4,641 | ||
Prepaid and other assets | 456 | ||
Property and equipment, net | 1,248 | ||
Intangible assets | 94,619 | ||
Other long-term assets | 385 | ||
Accounts payable and other liabilities | (3,494 | ) | |
Taxes payable, less current portion | (26 | ) | |
Deferred revenue | (1,993 | ) | |
Total net assets held for sale | $ | 101,175 | |
Nowtilus
In March 2014, the Company sold its Nowtilus business. Nowtilus was a provider of video-on-demand solutions in Germany. The Company has recorded the operations and cash flows of the Nowtilus business as discontinued operations for all periods presented.
Consumer Website
On August 15, 2013, the Company sold its Consumer Website business, which includes the SideReel.com and allmusic.com sites, among others, for $1.0 million. The Company has recorded the operations and cash flows of the Consumer Website business as discontinued operations for all periods presented.
Rovi Entertainment Store
On September 1, 2013, the Company sold its Rovi Entertainment Store business. Additionally, the Company agreed to transfer $8.5 million to the buyer and the Company received a $2.0 million unsecured note payable from the buyer. The results of operations and cash flows of the Rovi Entertainment Store business have been recorded as discontinued operations for all periods presented.
Roxio Consumer Software
On February 1, 2012, the Company sold its Roxio Consumer Software business for approximately $17.5 million. The results of operations and cash flows of the Roxio Consumer Software business have been recorded as discontinued operations for all periods presented.
Previous Software Business
In 2014, 2013 and 2012, the Company recorded $0.0 million, $0.6 million and $2.1 million in expenses related to indemnification for IP infringement claims relating to the Company’s previous software business which included FLEXnet, InstallShield and AdminStudio software tools, which was sold in 2008.
All Discontinued Operations
F-17
The results of operations of the Company’s discontinued businesses consist of the following (in thousands):
Year ended December 31, | |||||||||||
2014 | 2013 | 2012 | |||||||||
Net revenue: | |||||||||||
Roxio Consumer Software | $ | — | $ | — | $ | 5,295 | |||||
Rovi Entertainment Store | — | 9,367 | 14,632 | ||||||||
Consumer Website | — | 3,281 | 7,424 | ||||||||
DivX and MainConcept | 14,952 | 73,068 | 117,055 | ||||||||
Nowtilus | 100 | 677 | — | ||||||||
Pre-tax (loss) income from operations: | |||||||||||
Previous Software | $ | — | $ | (626 | ) | $ | (2,133 | ) | |||
Roxio Consumer Software (1) | — | (3,250 | ) | (449 | ) | ||||||
Rovi Entertainment Store (2) | — | (99,507 | ) | (41,129 | ) | ||||||
Consumer Website (3) | — | (10,974 | ) | (4,184 | ) | ||||||
DivX and MainConcept (4) | 1,873 | (63,144 | ) | 46,244 | |||||||
Nowtilus | (562 | ) | (978 | ) | (485 | ) | |||||
Pre-tax (loss) gain on disposal of business units | (55,028 | ) | (9,520 | ) | 573 | ||||||
Income tax expense | (2,505 | ) | (5,426 | ) | (12,639 | ) | |||||
Loss from discontinued operations, net of tax | $ | (56,222 | ) | $ | (193,425 | ) | $ | (14,202 | ) | ||
(1) | The year ended December 31, 2013, includes $3.3 million in expenses related to settling a patent claim against the Roxio Consumer Software business for the period prior to the business being sold. |
(2) | The year ended December 31, 2013, includes $73.1 million in asset impairment charges. |
(3) | The year ended December 31, 2013, includes $6.8 million in goodwill and intangible asset impairment charges. |
(4) | The year ended December 31, 2013, includes $64.9 million in goodwill and intangible asset impairment charges. |
(6) Goodwill and Other Intangible Assets
The Company assesses its goodwill for impairment annually as of October 1, or more frequently if circumstances indicate impairment may have occurred. To accomplish this, the Company estimates the fair value of its reporting units using a discounted cash flow approach and / or a market approach and compares it to the carrying amount of the reporting units at the date of the impairment analysis. An other-than-temporary decline in the value of the Company’s publicly traded equity and / or a significant decrease in the Company’s future business prospects could require the Company to record a goodwill and / or intangible asset impairment charge in the future. The Company did not record any goodwill impairment charges to its continuing operations for any of the periods presented.
Goodwill information is as follows for continuing operations (in thousands):
Balance at Beginning of Period | Goodwill Acquired | Foreign Currency Translation | Reclassified to Assets Held for Sale | Balance at End of Period | ||||||||||||||||
2014 | $ | 1,298,448 | $ | 45,856 | $ | (652 | ) | $ | — | $ | 1,343,652 | |||||||||
2013 | $ | 1,341,035 | $ | 8,149 | $ | (1,141 | ) | $ | (49,595 | ) | $ | 1,298,448 | ||||||||
2012 | $ | 1,364,145 | $ | 14,386 | $ | (555 | ) | $ | (36,941 | ) | $ | 1,341,035 | ||||||||
F-18
As of December 31, 2014, approximately $1.2 billion of the Company's goodwill relates to its Intellectual Property Licensing segment and $159.2 million relates to its Product segment. All of goodwill acquired as part of the Fanhattan acquisition has been recorded to the Product segment.
The following tables summarize the Company’s intangible assets for its continuing operations subject to amortization as of December 31, 2014 and December 31, 2013 (in thousands):
December 31, 2014 | |||||||||||
Gross Costs | Accumulated Amortization | Net | |||||||||
Finite-lived intangibles: | |||||||||||
Developed technology and patents | $ | 875,187 | $ | (443,986 | ) | $ | 431,201 | ||||
Existing contracts and customer relationships | 47,524 | (32,010 | ) | 15,514 | |||||||
Content databases and other | 58,638 | (42,005 | ) | 16,633 | |||||||
Trademarks / Tradenames | 8,300 | (8,300 | ) | — | |||||||
$ | 989,649 | $ | (526,301 | ) | $ | 463,348 | |||||
December 31, 2013 | |||||||||||
Gross Costs | Accumulated Amortization | Net | |||||||||
Finite-lived intangibles: | |||||||||||
Developed technology and patents | $ | 816,988 | $ | (378,059 | ) | $ | 438,929 | ||||
Existing contracts and customer relationships | 44,724 | (27,042 | ) | 17,682 | |||||||
Content databases and other | 56,804 | (35,186 | ) | 21,618 | |||||||
Trademarks / Tradenames | 8,300 | (8,300 | ) | — | |||||||
$ | 926,816 | $ | (448,587 | ) | $ | 478,229 | |||||
The following table summarizes the Company's estimated amortization expense for its continuing operations through the year 2019 and thereafter (in thousands):
Amortization Expense | |||
2015 | $ | 76,957 | |
2016 | 75,287 | ||
2017 | 73,094 | ||
2018 | 69,685 | ||
2019 | 67,859 | ||
Thereafter | 100,466 | ||
Total amortization expense | $ | 463,348 | |
(7) Debt
Convertible Senior Notes Due 2040
In March 2010, the Company issued $460.0 million in 2.625% convertible senior notes (the “2040 Convertible Notes”) due in 2040 at par. The 2040 Convertible Notes may be converted, under the circumstances described below, based on an initial conversion rate of 21.1149 shares of common stock per $1,000 principal amount of notes (which represents an initial conversion price of approximately $47.36 per share).
Prior to November 15, 2039, holders may convert their 2040 Convertible Notes into cash and the Company’s common stock, at the applicable conversion rate, under any of the following circumstances: (i) during any fiscal quarter after the calendar quarter ending June 30, 2010, if the last reported sale price of the Company’s common stock for at least 20 trading days during the 30 consecutive trading days ending on the last trading day of the immediately preceding calendar quarter is greater than or equal to 130% of the applicable conversion price in effect on each applicable trading day; (ii) during the five business-day period after any ten consecutive trading-day period (the “measurement period”) in which the trading price per note for each day of such measurement period was less than 98% of the product of the last reported sale price of the Company’s common stock and the conversion rate on each such day; (iii) upon the occurrence of specified corporate transactions, as described in the indenture, or (iv) if the Company calls any or all of the notes for redemption, at any time prior to the close of business on the third scheduled trading day prior to that redemption date. From November 15, 2039 until the close of business
F-19
on the scheduled trading day immediately preceding the maturity date of February 15, 2040, holders may convert their 2040 Convertible Notes into cash and shares of the Company’s common stock at the applicable conversion rate, at any time, regardless of the foregoing circumstances. After February 20, 2015, the Company has the right to call for redemption all, or a portion, of the 2040 Convertible Notes at 100% of the principal amount of notes to be redeemed, plus accrued interest to, but excluding, the redemption date. Holders have the right to require the Company to repurchase the 2040 Convertible Notes on February 20, 2015, 2020, 2025, 2030 and 2035 for cash equal to 100% of the principal amount of the notes to be repurchased, plus accrued interest to, but excluding, the repurchase date.
Upon conversion, a holder will receive the conversion value of the 2040 Convertible Notes converted based on the conversion rate multiplied by the volume weighted average price of the Company’s common stock over a specified observation period following the conversion date. The conversion value of each 2040 Convertible Note will be paid in cash up to the aggregate principal amount of the 2040 Convertible Notes to be converted and shares of common stock to the extent the conversion value exceeds the principal amount of the converted note. Upon the occurrence of a fundamental change (as defined in the indenture), the holders may require the Company to repurchase for cash all or a portion of their 2040 Convertible Notes at a price equal to 100% of the principal amount of the 2040 Convertible Notes being repurchased plus accrued interest, if any. In addition, following certain corporate events that occur prior to February 20, 2015, the conversion rate will be increased for holders who elect to convert their notes in connection with such a corporate event in certain circumstances.
In accordance with ASC 470, related to accounting for convertible debt instruments that may be settled in cash upon conversion, the Company separately accounted for the liability and equity components of the 2040 Convertible Notes to reflect its non-convertible debt borrowing rate of 7.75%, at the time the instrument was issued, when interest cost is recognized. The debt discount is being amortized through February 2015, which represents the first date the 2040 Convertible notes can be called by the Company or put to the Company by the note holders.
As of December 31, 2014 and December 31, 2013, the principal amount of the Company’s 2040 Convertible Notes was $291.0 million and $291.0 million, respectively. As of December 31, 2014 and December 31, 2013, the unamortized discount on the 2040 Convertible Notes was $1.9 million and $15.8 million, respectively, resulting in a carrying amount of $289.1 million and $275.2 million, respectively. During the years ended December 31, 2014, 2013 and 2012, the Company recorded $13.9 million, $12.9 million and $12.0 million of interest expense, respectively, for the 2040 Convertible Notes related to the amortization of the discount.
Senior Secured Credit Facility
On July 2, 2014, the Company, as parent guarantor, and two of its wholly-owned subsidiaries, Rovi Solutions Corporation and Rovi Guides, Inc., as borrowers, and certain of its other subsidiaries, as subsidiary guarantors, entered into a new Credit Agreement (the “Credit Agreement”). The Credit Agreement provides for (i) a five-year $125 million term loan A facility (the “Term Loan A Facility”), (ii) a seven-year $700 million term loan B facility (the “Term Loan B Facility” and together with the Term Loan A Facility, the “Term Loan Facility”) and (iii) a five-year $175 million revolving credit facility (including a letter of credit sub-facility) (“the Revolving Facility” and together with the Term Loan Facility, the “Senior Secured Credit Facility”). The Company used the proceeds of the Term Loan Facility, together with cash from its balance sheet, to repay existing loans under its previous credit agreement and to pay expenses related thereto. Loans under the Term Loan A Facility bear interest, at the Company's option, at a rate equal to either the LIBOR rate, plus an applicable margin equal to 2.25% per annum, or the prime lending rate, plus an applicable margin equal to 1.25% per annum. Loans under the Term Loan B Facility bear interest, at the Company's option, at a rate equal to either the LIBOR rate, plus an applicable margin equal to 3% per annum (subject to a 0.75% LIBOR floor) or the prime lending rate, plus an applicable margin equal to 2% per annum. Loans under the Revolving Facility will bear interest, at the Company's option, at a rate equal to either the LIBOR rate, plus an applicable margin equal to 2.25% per annum, or the prime lending rate, plus an applicable margin equal to 1.25% per annum, subject to reduction by 0.25% or 0.50% based upon the Company's total secured leverage ratio (as defined in the Credit Agreement).
The Credit Agreement contains customary representations and warranties and customary affirmative and negative covenants applicable to the Company and its subsidiaries, including, among other things, restrictions on indebtedness, liens, investments, mergers, dispositions, prepayment of other indebtedness, and dividends and other distributions. The Term Loan A Facility and the Revolving Facility contain financial covenants that require the Company to maintain a minimum consolidated interest coverage ratio and a maximum total leverage ratio. The Term Loan B Facility does not contain a minimum consolidated interest coverage ratio or a maximum total leverage ratio covenant. Beginning with the Company's fiscal year ending December 31, 2015, the Company may be required to make an additional payment on the Term Loan Facility each February. This payment is a percentage of the prior year's Excess Cash Flow as defined in the Credit Agreement. As of December 31, 2014, the Company had not drawn on the Revolving Facility.
F-20
The Company accounted for the issuance of the Senior Secured Credit Facility and subsequent repayment of its previous credit facility as a partial debt modification, as a significant number of it's previous credit facility investors reinvested in the Senior Secured Credit Facility, and the change in the present value of future cash flows was less than 10%. Under debt modification accounting, $1.0 million in unamortized debt issuance costs related to previous credit facility investors who reinvested in Term Loan A Facility are being amortized to Term Loan A Facility interest expense using the effective interest method. In addition, $0.2 million in Term Loan A Facility debt issuance costs, related to new investors in Term Loan A Facility, are being amortized to Term Loan A Facility interest expense using the effective interest method. Under debt modification accounting, $1.7 million in unamortized debt issuance costs related to previous credit facility investors who reinvested in Term Loan B Facility are being amortized to Term Loan B Facility interest expense using the effective interest method. In addition, $3.0 million in Term Loan B Facility debt issuance costs, related to new investors in Term Loan B Facility, are being amortized to Term Loan B Facility interest expense using the effective interest method. Debt issuance costs of $3.8 million relating to the issuance of the Senior Secured Credit Facility to previous credit facility investors, have been recorded as debt modification expenses on the Company's Consolidated Statement of Operations for the year ended December 31, 2014. In addition, during the year ended December 31, 2014, the Company realized a loss on debt redemption of $5.2 million related to writing off the unamortized prior credit facility debt issuance costs related to investors who did not reinvest in the Senior Secured Credit Facility and the unamortized debt discount on the prior credit facility.
The Company accounted for the issuance of its prior term loan B-3 and subsequent repayment of term loan B-2 as a partial debt modification, as a significant number of term loan B-2 investors reinvested in term loan B-3, and the change in the present value of future cash flows between term loan B-2 and term loan B-3 was less than 10%. Under debt modification accounting, $3.6 million in unamortized debt issuance costs related to term loan B-2 investors who reinvested in term loan B-3 were being amortized to term loan B-3 interest expense using the effective interest method. In addition, $0.1 million in term loan B-3 debt issuance costs, related to new investors in term loan B-3, were being amortized to term loan B-3 interest expense using the effective interest method. Debt issuance costs of $1.0 million relating to the issuance of term loan B-3 to term loan B-2 investors, have been recorded as debt modification expenses on the Company's Consolidated Statement of Operations for the year ended December 31, 2013. In addition, during the year ended December 31, 2013, the Company realized a loss on debt redemption of $2.8 million related to writing off the unamortized term loan B-2 debt issuance costs related to investors who did not reinvest in term loan B-3 and the unamortized debt discount on term loan B-2.
The Company accounted for the issuance of its prior term loan B-2 and subsequent repayment of term loan B-1 as a partial debt modification, as a significant number of term loan B-1 investors reinvested in term loan B-2, and the change in the present value of future cash flows between term loan B-1 and term loan B-2 was less than 10%. Under debt modification accounting, $3.5 million in unamortized debt issuance costs related to term loan B-1 investors who reinvested in term loan B-2, were being amortized to term loan B-2 interest expense using the effective interest method. In addition, $1.0 million in term loan B-2 debt issuance costs, related to new investors in term loan B-2, were being amortized to term loan B-2 interest expense using the effective interest method. Debt issuance costs of $4.5 million relating to the issuance of term loan B-2 to term loan B-1 investors, have been recorded as debt modification expenses on the Company's Consolidated Statement of Operations for the year ended December 31, 2012. In addition, during the year ended December 31, 2012, the Company realized a loss on debt redemption of $1.8 million related to writing off the unamortized term loan B-1 debt discount and the unamortized term loan B-1 debt issuance costs related to investors who did not reinvest in term loan B-2.
Debt Repurchase Program
In October 2013, the Company's Board of Directors authorized the repurchase of up to $250.0 million of debt outstanding. The Company made voluntary debt payments of $200.0 million in November 2013 and $50.0 million in March 2014, to reduce loans outstanding under its previous credit agreement.
In connection with the issuance of previous term loan B-3, the Company's Board of Directors authorized the repurchase of the $540.0 million remaining balance of term loan B-2. In connection with the issuance of previous term loan A-2 and term loan B-2, the Company's Board of Directors authorized the repurchase of the $297.8 million remaining balance of term loan B-1. These repurchase authorizations were in addition to any other authorization that were outstanding at the time.
The following is a summary of the carrying value and par value of the Company's debt (in thousands) as of December 31, 2014:
Carrying Value | Par Value | ||||||
Term Loan A Facility | $ | 124,580 | $ | 125,000 | |||
Term Loan B Facility | 693,227 | 696,500 | |||||
2040 Convertible Notes | 289,125 | 290,990 | |||||
$ | 1,106,932 | $ | 1,112,490 | ||||
F-21
The aggregate amount of debt payments due in each of the next five years and thereafter is as follows (in thousands):
2015 (1) | $ | 304,240 | |
2016 | 13,250 | ||
2017 | 13,250 | ||
2018 | 13,250 | ||
2019 | 107,000 | ||
Thereafter | 661,500 | ||
Total | $ | 1,112,490 | |
(1) | The 2040 Convertible Notes have been included in the above table based on the first put / call date which is February 2015 (see above for additional information). |
(8) Investments
The following is a summary of available-for-sale and other investment securities (in thousands) as of December 31, 2014:
Cost | Unrealized Gains | Unrealized Losses | Fair Value | ||||||||||||
Cash | $ | 63,622 | $ | — | $ | — | $ | 63,622 | |||||||
Cash equivalents - Money markets | 90,946 | — | — | 90,946 | |||||||||||
Total cash and cash equivalents | $ | 154,568 | $ | — | $ | — | $ | 154,568 | |||||||
Available-for-sale investments: | |||||||||||||||
Auction rate securities | $ | 10,800 | $ | — | $ | (162 | ) | $ | 10,638 | ||||||
Corporate debt securities | 98,379 | 13 | (116 | ) | 98,276 | ||||||||||
Foreign government obligations | 10,551 | — | (4 | ) | 10,547 | ||||||||||
U.S. Treasuries/Agencies | 195,077 | 37 | (123 | ) | 194,991 | ||||||||||
Total available-for-sale investments | $ | 314,807 | $ | 50 | $ | (405 | ) | $ | 314,452 | ||||||
Total cash, cash equivalents and investments | $ | 469,020 | |||||||||||||
The following is a summary of available-for-sale and other investment securities (in thousands) as of December 31, 2013:
Cost | Unrealized Gains | Unrealized Losses | Fair Value | ||||||||||||
Cash | $ | 29,764 | $ | — | $ | — | $ | 29,764 | |||||||
Cash equivalents - Money markets | 126,723 | — | — | 126,723 | |||||||||||
Total cash and cash equivalents | $ | 156,487 | $ | — | $ | — | $ | 156,487 | |||||||
Available-for-sale investments: | |||||||||||||||
Auction rate securities | $ | 15,600 | $ | — | $ | (697 | ) | $ | 14,903 | ||||||
Corporate debt securities | 177,474 | 144 | (26 | ) | 177,592 | ||||||||||
Foreign government obligations | 17,992 | — | (20 | ) | 17,972 | ||||||||||
U.S. Treasuries/Agencies | 274,145 | 45 | (23 | ) | 274,167 | ||||||||||
Total available-for-sale investments | $ | 485,211 | $ | 189 | $ | (766 | ) | $ | 484,634 | ||||||
Total cash, cash equivalents and investments | $ | 641,121 | |||||||||||||
As of December 31, 2014, the fair value of available-for-sale debt investments, by contractual maturity, was as follows (in thousands):
Due in 1 year or less | $ | 183,074 | |
Due in 1-2 years | 120,740 | ||
Due in 2-3 years | — | ||
Due in greater than 3 years | 10,638 | ||
Total | $ | 314,452 | |
F-22
The following table summarizes the fair value and gross unrealized losses related to available-for-sale securities, aggregated by investment category and length of time that individual securities have been in a continuous unrealized loss position as of December 31, 2014 and 2013 (in thousands):
December 31, 2014 | ||||||||||||||||||||||||
Less than 12 Months | 12 Months or Longer | Total | ||||||||||||||||||||||
Description of Securities | Fair Value | Unrealized Loss | Fair Value | Unrealized Loss | Fair Value | Unrealized Loss | ||||||||||||||||||
Auction rate securities | $ | — | $ | — | $ | 10,638 | $ | (162 | ) | $ | 10,638 | $ | (162 | ) | ||||||||||
Corporate debt securities | 69,977 | (116 | ) | — | — | 69,977 | (116 | ) | ||||||||||||||||
Foreign government obligations | 10,547 | (4 | ) | — | — | 10,547 | (4 | ) | ||||||||||||||||
U.S. Treasuries / Agencies | 115,359 | (123 | ) | — | — | 115,359 | (123 | ) | ||||||||||||||||
December 31, 2013 | ||||||||||||||||||||||||
Less than 12 Months | 12 Months or Longer | Total | ||||||||||||||||||||||
Description of Securities | Fair Value | Unrealized Loss | Fair Value | Unrealized Loss | Fair Value | Unrealized Loss | ||||||||||||||||||
Auction rate securities | $ | — | $ | — | $ | 14,903 | $ | (697 | ) | $ | 14,903 | $ | (697 | ) | ||||||||||
Corporate debt securities | 54,052 | (26 | ) | — | — | 54,052 | (26 | ) | ||||||||||||||||
Foreign government obligations | 17,972 | (20 | ) | — | — | 17,972 | (20 | ) | ||||||||||||||||
U.S. Treasuries / Agencies | 68,446 | (23 | ) | — | — | 68,446 | (23 | ) | ||||||||||||||||
Fair values were estimated for each individual security in the investment portfolio. The Company attributes the unrealized losses in its auction rate securities portfolio to liquidity issues rather than credit issues. The Company’s available-for-sale auction rate securities portfolio at December 31, 2014, is comprised solely of AAA rated investments in federally insured student loans and municipal and educational authority bonds. The Company continues to earn interest on all of its auction rate security instruments and has the ability and intent to hold these securities until they recover.
(9) Interest Rate Swaps
In March 2010, in connection with the issuance of the 2040 Convertible Notes, the Company entered into interest rate swaps with a notional amount of $460.0 million under which it pays a weighted average floating rate of six month USD – LIBOR minus 0.342%, set in arrears, and receives a fixed rate of 2.625%. These swaps expire in February 2015. In November 2010, after future interest rate expectations decreased, the Company entered into additional swaps with a notional amount of $460.0 million under which it pays a fixed rate which gradually increases from 0.203% for the six-month settlement period ended in February 2011, to 2.619% for the six-month settlement period ending in February 2015 and receives a floating rate of six month USD – LIBOR minus 0.342%, set in arrears. These swaps expire in February 2015. The combination of these swaps has the effect of fixing the interest rate the Company pays on its 2040 Convertible Notes at a fixed rate which gradually increases from 0.203% for the six-month settlement period ended in February 2011, to 2.619% for the six-month settlement period ending in February 2015.
F-23
In May 2012, the Company entered into swaps with a notional amount of $197.0 million. These swaps have an effective date of January 2014, and under these swaps the Company pays a fixed interest rate which gradually increases from 0.58% for the three month settlement period ending June 2014, to 1.65% for the final settlement period ending in January 2016 and receives a floating rate of one month USD-LIBOR. These swaps expire in January 2016. In May 2012, the Company entered into additional swaps with a notional amount of $215.0 million. These swaps have an effective date of April 2014, and under these swaps the Company pays a fixed interest rate which gradually increases from 0.65% for the three month settlement period ending June 2014, to 2.11% for the final settlement period ending in March 2017 and receives a floating rate of one month USD-LIBOR. These swaps expire in March 2017. In June 2013, the Company entered into swaps with a notional amount of $250.0 million. These swaps have an effective date of January 2016, and under these swaps the Company pays a fixed rate of 2.23% and receives a floating rate of one month USD-LIBOR. These swaps expire in March 2019. In September 2014, the Company entered into additional swaps with a notional amount of $125.0 million. These swaps have an effective date of January 2016, and under these swaps the Company pays a fixed interest rate of 2.66% and receives a floating rate of one month USD-LIBOR. These swaps expire in July 2021. In September 2014, the Company entered into swaps with a notional amount of $200.0 million. These swaps have an effective date of March 2017, and under these swaps the Company pays a fixed rate of 2.93% and receives a floating rate of one month USD-LIBOR. These swaps expire in July 2021. The Company entered into these swaps to effectively fix the future interest rate during the applicable periods on a portion of its Senior Secured Credit Facility. In connection with refinancing its credit facility during the third quarter of 2014, the Company paid $7.6 million to terminate interest rate swaps with a notional amount of $300.0 million.
The Company has not designated any of its interest rate swaps as hedges. The Company records interest rate swaps on its balance sheet at fair value with the changes in fair value recorded as (loss) income on interest rate swaps, net, in its Consolidated Statements of Operations. During the years ended December 31, 2014, 2013 and 2012, the Company recorded a loss of $17.9 million, a gain of $2.9 million and a loss of $10.6 million, respectively, for the change in the fair value of its interest rate swaps and the related settlements. For information on the fair value of the Company’s interest rate swaps, see Note 10.
(10) Fair Value
In accordance with ASC 820, the Company uses three levels of inputs to measure fair value:
Level 1. Quoted prices in active markets for identical assets or liabilities.
Level 2. Observable inputs other than Level 1 prices, such as quoted prices for similar assets or liabilities, quoted prices in markets with insufficient volume or infrequent transactions (less active markets), or valuations in which all significant inputs are observable or can be obtained from observable market data.
Level 3. Unobservable inputs to the valuation methodology that are significant to the measurement of the fair value of assets or liabilities.
The Company values its interest rate swaps using widely accepted valuation techniques, including discounted cash flow analysis on the expected cash flows of each interest rate swap. This analysis reflects the contractual terms of the interest rate swaps, including the period to maturity, and uses observable market-based inputs, including interest rate curves and implied volatilities. The fair values of interest rate swaps are determined using the market standard methodology of netting the discounted future fixed cash payments and the discounted expected variable cash receipts. The variable cash receipts are based on an expectation of future interest rates (forward curves) derived from observable market interest rate curves. The Company also incorporates credit valuation adjustments to appropriately reflect both its own nonperformance risk and the respective counterparty’s nonperformance risk in the fair value measurements. In adjusting the fair value of its interest rate swaps for the effect of nonperformance risk, the Company has considered the impact of netting.
The Company’s auction rate securities are valued using a discounted cash flow analysis or other type of valuation model. These analyses are highly judgmental and consider, among other items, the likelihood of redemption, credit quality, duration, insurance wraps and expected future cash flows. These securities were also compared, when possible, to other observable market data with similar characteristics to the securities held by the Company.
The Company determines the fair value of contingent consideration by estimating the amount that will ultimately be paid based on the terms of the underlying purchase agreement.
The Company recognizes transfers between levels of the fair value hierarchy at the end of the reporting period. Assets and liabilities measured and recorded at fair value on a recurring basis consisted of the following types of instruments at December 31, 2014 (in thousands):
F-24
Total | Quoted Prices in Active Markets (Level 1) | Significant Other Observable Inputs (Level 2) | Significant Unobservable Inputs (Level 3) | ||||||||||||
Current Assets | |||||||||||||||
Money market funds (1) | $ | 90,946 | $ | 90,946 | $ | — | $ | — | |||||||
Corporate debt securities (2) | 73,499 | — | 73,499 | — | |||||||||||
Foreign government obligations (2) | 9,534 | — | 9,534 | — | |||||||||||
U.S. Treasuries / Agencies (2) | 100,041 | — | 100,041 | — | |||||||||||
Non-Current Assets | |||||||||||||||
Auction rate securities (3) | 10,638 | — | — | 10,638 | |||||||||||
Corporate debt securities (3) | 24,777 | — | 24,777 | — | |||||||||||
Foreign government obligations (3) | 1,013 | — | 1,013 | — | |||||||||||
U.S. Treasuries / Agencies (3) | 94,950 | — | 94,950 | — | |||||||||||
Total | $ | 405,398 | $ | 90,946 | $ | 303,814 | $ | 10,638 | |||||||
Liabilities | |||||||||||||||
IntegralReach contingent consideration (4) | $ | 3,000 | $ | — | $ | — | $ | 3,000 | |||||||
Veveo contingent consideration (4) | 3,000 | — | — | 3,000 | |||||||||||
Interest rate swaps (5) | 16,788 | — | 16,788 | — | |||||||||||
Total Liabilities | $ | 22,788 | $ | — | $ | 16,788 | $ | 6,000 | |||||||
(1) | Included in cash and cash equivalents on the Consolidated Balance Sheet. |
(2) | Included in short-term investments on the Consolidated Balance Sheet and classified as available-for-sale securities. |
(3) | Included in long-term marketable investment securities on the Consolidated Balance Sheet and classified as available-for-sale securities. |
(4) | Included in accounts payable and accrued expenses on the Consolidated Balance Sheet. |
(5) | Included in other non-current liabilities on the Consolidated Balance Sheet. As of December 31, 2014, the fair value of the Company's interest rate swaps in an asset position was $5.8 million and the fair value in a liability position was $22.6 million. These amounts have been recorded on a net basis on the Consolidated Balance Sheet. |
As of December 31, 2013, assets and liabilities measured and recorded at fair value on a recurring basis, were as follows (in thousands):
Total | Quoted Prices in Active Markets (Level 1) | Significant Other Observable Inputs (Level 2) | Significant Unobservable Inputs (Level 3) | ||||||||||||
Current Assets | |||||||||||||||
Money market funds (1) | $ | 126,723 | $ | 126,723 | $ | — | $ | — | |||||||
Corporate debt securities (2) | 136,133 | — | 136,133 | — | |||||||||||
Foreign government obligations (2) | 8,148 | — | 8,148 | — | |||||||||||
U.S. Treasuries / Agencies (2) | 221,695 | — | 221,695 | — | |||||||||||
Non-Current Assets | |||||||||||||||
Auction rate securities (3) | 14,903 | — | — | 14,903 | |||||||||||
Corporate debt securities (3) | 41,459 | — | 41,459 | — | |||||||||||
Foreign government obligations (3) | 9,824 | — | 9,824 | — | |||||||||||
U.S. Treasuries / Agencies (3) | 52,472 | — | 52,472 | — | |||||||||||
Total | $ | 611,357 | $ | 126,723 | $ | 469,731 | $ | 14,903 | |||||||
Non-Current Liabilities | |||||||||||||||
IntegralReach contingent consideration (4) | $ | 3,000 | $ | — | $ | — | $ | 3,000 | |||||||
Interest rate swaps (5) | 6,942 | — | 6,942 | — | |||||||||||
Total Liabilities | $ | 9,942 | $ | — | $ | 6,942 | $ | 3,000 | |||||||
(1) | Included in cash and cash equivalents on the Consolidated Balance Sheet. |
(2) | Included in short-term investments on the Consolidated Balance Sheet and classified as available-for-sale securities. |
F-25
(3) | Included in long-term marketable investment securities on the Consolidated Balance Sheet and classified as available-for-sale securities. |
(4) | Included in other non-current liabilities on the Consolidated Balance Sheet. |
(5) | Included in other non-current liabilities on the Consolidated Balance Sheet. As of December 31, 2013, the fair value of the Company's interest rate swaps in an asset position was $20.3 million and the fair value in a liability position was $27.2 million. These amounts have been recorded on a net basis on the Consolidated Balance Sheet. |
The following table provides a summary of changes in the Company’s Level 3 auction rate securities ("ARS") as of December 31, 2014, 2013, and 2012 (in thousands):
Year ended December 31, | |||||||||||
2014 | 2013 | 2012 | |||||||||
Balance at beginning of period | $ | 14,903 | $ | 14,287 | $ | 14,314 | |||||
Unrealized gain (loss) included in accumulated other comprehensive income | 535 | 716 | (27 | ) | |||||||
Settlements | (4,800 | ) | (100 | ) | — | ||||||
Balance at end of period | $ | 10,638 | $ | 14,903 | $ | 14,287 | |||||
The fair value of the Company’s outstanding debt at December 31, 2014 is as follows (in thousands):
Carrying Value | Significant Other Observable Inputs (Level 2) | ||||||
Term Loan A Facility | $ | 124,580 | $ | 120,000 | |||
Term Loan B Facility | 693,227 | 679,958 | |||||
2040 Convertible Notes (1) | 289,125 | 291,354 | |||||
$ | 1,106,932 | $ | 1,091,312 | ||||
(1) | The par value of the 2040 Convertible Notes is $291.0 million. See Note 7 for additional details. |
The fair value of the Company’s outstanding debt at December 31, 2013 is as follows (in thousands):
Carrying Value | Significant Other Observable Inputs (Level 2) | ||||||
Prior term loan A-1 | $ | 220,885 | $ | 220,588 | |||
Prior term loan A-2 | 167,368 | 167,353 | |||||
Prior term loan B-3 | 523,140 | 518,462 | |||||
2040 Convertible Notes (1) | 275,171 | 294,220 | |||||
$ | 1,186,564 | $ | 1,200,623 | ||||
(1) | The par value of the 2040 Convertible Notes is $291.0 million. See Note 7 for additional details. |
(11) Restructuring and Asset Impairment Charges
2014 Restructuring Actions
In conjunction with the disposition of the Rovi Entertainment Store and DivX businesses and the Company's narrowed business focus on discovery, the Company conducted a complete review of its remaining product development, sales, data operations and general and administrative functions to create cost efficiencies for the Company. As a result of this analysis, the Company took cost reduction actions that resulted in a restructuring and asset impairment charge of $10.6 million being recorded during 2014. Included in the restructuring charge is $6.7 million of severance charges, $2.5 million to accrue for the present value of lease payments for abandoned office space, $1.2 million in asset impairment charges and $0.2 million in contract termination costs. As of December 31, 2014, $2.9 million of severance and $1.7 million in future lease payments for abandoned office space remain unpaid.
F-26
2013 Restructuring Actions
During 2013, the Company continued the review of its operations that began in the third quarter of 2012 (see below). As a result of this analysis, the Company has taken additional cost reduction actions, which have resulted in a restructuring charge of $7.7 million being recorded during 2013. Included in the restructuring charge is $0.9 million of severance charges, $0.7 million to accrue for the present value of lease payments for abandoned office space, $4.1 million in asset impairment charges and $2.0 million in stock compensation expense due to the contractual acceleration of the vesting of restricted stock of certain employees who are no longer with the Company. Of the total restructuring charge of $7.7 million, $7.6 million related to our continuing operations and $0.1 million related to discontinued operations. During the three months ended March 31, 2014, the Company recorded an additional $0.3 million in expense related to the present value of lease payments for abandoned office space. As of December 31, 2014, $0.3 million in future lease payments for abandoned office space remain unpaid.
Q3 2012 Restructuring Action
During the third quarter of 2012, the Company reviewed its costs in order to reduce and more efficiently manage its operating expenses. As a result of this analysis, the Company took cost reduction actions, which resulted in a restructuring charge of $4.8 million being recorded during 2012. Included in the restructuring charge is $2.9 million of severance charges, $0.9 million to accrue for the present value of lease payments (net of subleases) for abandoned office space and $1.0 million in asset impairment charges. Of the total restructuring charge of $4.8 million, $3.5 million related to continuing operations and $1.3 million related to discontinued operations. As of December 31, 2014, all of these amounts have been paid.
Q1 2012 Restructuring Action
In connection with a review of the Company's operations, the Company reorganized certain parts of its sales and product development groups. These actions resulted in severance charges of $0.8 million in the first quarter of 2012, all of which have been paid as of December 31, 2014.
Sonic Acquisition Restructuring Plan
In conjunction with the Sonic acquisition, management acted upon a plan to restructure certain Sonic operations to create cost efficiencies for the combined company. During the first quarter of 2012, the Company recorded an additional $0.6 million in restructuring charges, which included $0.3 million for employee severance and contract termination costs and $0.3 million to accrue for the present value of lease payments for abandoned office space. Of the total restructuring charge $0.6 million, $0.4 million related to continuing operations and $0.2 million related to discontinued operations. As of December 31, 2014, all of the Sonic restructuring costs have been paid.
(12) Equity-based Compensation
Stock Options Plans
The Company grants stock options and restricted stock awards from the 2008 Equity Incentive Plan (the “2008 Plan”).
As of December 31, 2014, the Company had a total of 23.3 million shares reserved and 9.2 million shares available for issuance under the 2008 Plan.
These equity plans provide for the grant of stock options, restricted stock awards, restricted stock units and similar types of equity awards by the Company to employees, officers, directors and consultants of the Company. Options grants generally have vesting periods of four years where one quarter of the grant vests at the end of the first year, and the remainder vests monthly. Options grants generally have a contractual term of seven years.
Restricted stock award and restricted stock unit grants generally vest annually over four years. Restricted stock awards are considered outstanding at the time of the grant, as the stockholders are entitled to voting rights. As of December 31, 2014, the number of restricted stock awards outstanding and unvested was 3.3 million, which includes 0.9 million shares of performance based restricted stock awards. The vesting of these performance shares is primarily contingent upon meeting defined levels of achievement of financial results. As of December 31, 2014, the number of restricted stock units outstanding and unvested was 0.4 million.
Employee Stock Purchase Plan
The Company’s 2008 Employee Stock Purchase Plan (“ESPP”) allows eligible employee participants to purchase shares of the Company’s common stock at a discount through payroll deductions. The ESPP consists of a twenty-four month offering period with four six-month purchase periods in each offering period. Employees purchase shares in each purchase
F-27
period at 85% of the market value of the Company’s common stock at either the beginning of the offering period or the end of the purchase period, whichever price is lower.
As of December 31, 2014, the Company had reserved, and available for future issuance, 2.5 million shares of common stock under the ESPP.
Valuation and Assumptions
The Company uses the Black-Scholes option pricing model to determine the fair value of stock options and employee stock purchase plan shares. The fair value of equity-based payment awards on the date of grant is determined by an option-pricing model using a number of complex and subjective variables. These variables include expected stock price volatility over the term of the awards, actual and projected employee stock option exercise behaviors, risk-free interest rate and expected dividends. The Company determines the fair value of its restricted stock grants as the difference between the market value on the date of grant less the exercise price.
Estimated volatility of the Company’s common stock for new grants is determined by using a combination of historical volatility and implied volatility in market traded options. When historical data is available and relevant, the expected term of options granted is determined by calculating the average term from historical stock option exercise experience. When there is insufficient historical exercise data to provide a reasonable basis upon which to estimate the expected term due to changes in the terms of option grants, the Company uses the “simplified method” as permitted under Staff Accounting Bulletin No. 110. For options granted after July 15, 2008, the Company changed its standard vesting terms from three to four years and its contractual term from five to seven years. For the period from July 15, 2008 to June 30, 2012, the Company did not have sufficient data for options with four year vesting terms and seven year contractual life and used the simplified method to calculate the expected term. The risk-free interest rate used in the option valuation model is from U.S. Treasury zero-coupon issues with remaining terms similar to the expected term on the options. The Company does not anticipate paying any cash dividends in the foreseeable future and therefore uses an expected dividend yield of zero in the option pricing model. In accordance with ASC Topic 718, Compensation – Stock Compensation, the Company estimates forfeitures at the time of grant and revises those estimates in subsequent periods if actual forfeitures differ from those estimates. The Company uses historical data to estimate pre-vesting forfeitures and records equity-based compensation expense only for those awards that are expected to vest. The assumptions used to value equity-based payments are as follows:
Year ended December 31, | ||||||||
2014 | 2013 | 2012 | ||||||
Option Plans: | ||||||||
Dividends | 0 | % | 0 | % | 0 | % | ||
Expected term | 4.0 years | 4.0 years | 4.4 years | |||||
Risk free interest rate | 1.1 | % | 0.7 | % | 0.6 | % | ||
Volatility rate | 47 | % | 46 | % | 47 | % | ||
ESPP Plan: | ||||||||
Dividends | 0 | % | 0 | % | 0 | % | ||
Expected term | 1.3 years | 1.3 years | 1.3 years | |||||
Risk free interest rate | 0.3 | % | 0.2 | % | 0.3 | % | ||
Volatility rate | 35 | % | 47 | % | 56 | % | ||
The weighted average per share fair value of equity-based awards are as follows:
Year ended December 31, | |||||||||||
2014 | 2013 | 2012 | |||||||||
Weighted average fair value: | |||||||||||
Option grants | $ | 8.69 | $ | 7.35 | $ | 9.92 | |||||
Employee purchase share rights | $ | 6.54 | $ | 6.38 | $ | 4.41 | |||||
Restricted stock award grants | $ | 24.45 | $ | 18.34 | $ | 30.20 | |||||
As of December 31, 2014, there was $57.5 million of unrecognized compensation cost, adjusted for estimated forfeitures, related to unvested equity-based payments granted to employees in continuing operations. Total unrecognized compensation cost will be adjusted for future changes in estimated forfeitures and is expected to be recognized over a weighted average period of 2.5 years.
F-28
Activity under the Company's stock option plans is as follows:
Shares | Weighted-average exercise price | Weighted-average remaining contractual term (years) | Aggregate intrinsic value (in thousands) | |||||||||
Outstanding at December 31, 2011 | 4,787,513 | $ | 36.67 | |||||||||
Granted | 1,819,900 | $ | 25.62 | |||||||||
Canceled | (1,443,379 | ) | $ | 39.62 | ||||||||
Exercised | (332,623 | ) | $ | 15.87 | ||||||||
Outstanding at December 31, 2012 | 4,831,411 | $ | 33.06 | |||||||||
Granted | 949,750 | $ | 20.17 | |||||||||
Canceled | (924,403 | ) | $ | 31.40 | ||||||||
Exercised | (300,425 | ) | $ | 14.40 | ||||||||
Outstanding at December 31, 2013 | 4,556,333 | $ | 31.94 | |||||||||
Granted | 1,199,935 | $ | 23.07 | |||||||||
Canceled | (1,292,517 | ) | $ | 32.82 | ||||||||
Exercised | (320,210 | ) | $ | 16.31 | ||||||||
Outstanding at December 31, 2014 | 4,143,541 | $ | 30.27 | 4.1 | $ | 4,667 | ||||||
Vested and expected to vest at December 31, 2014 | 3,825,701 | $ | 30.90 | 4.0 | $ | 4,240 | ||||||
Exercisable at December 31, 2014 | 2,405,250 | $ | 35.18 | 3.0 | $ | 2,336 | ||||||
The total intrinsic value of options exercised during the years ended December 31, 2014, 2013, and 2012 was $2.2 million, $2.0 million and $3.8 million, respectively. The intrinsic value is calculated as the difference between the market value on the date of exercise and the exercise price of the shares.
Activity related to the Company's restricted awards is as follows:
Shares | Weighted-average Grant-Date Fair Value | Aggregate fair value (1) (in thousands) | |||||||
Outstanding at December 31, 2011 | 2,174,093 | $ | 45.34 | ||||||
Granted | 2,158,282 | $ | 30.20 | ||||||
Vested | (916,479 | ) | $ | 42.96 | 21,905 | ||||
Forfeited | (773,568 | ) | $ | 41.37 | |||||
Outstanding at December 31, 2012 | 2,642,328 | $ | 34.97 | ||||||
Granted | 2,522,698 | $ | 18.34 | ||||||
Vested | (945,110 | ) | $ | 34.61 | 17,974 | ||||
Forfeited | (575,187 | ) | $ | 29.31 | |||||
Outstanding at December 31, 2013 | 3,644,729 | $ | 24.47 | ||||||
Granted | 1,711,706 | $ | 24.45 | ||||||
Vested | (1,182,167 | ) | $ | 25.88 | 28,914 | ||||
Forfeited | (901,619 | ) | $ | 25.74 | |||||
Outstanding at December 31, 2014 | 3,272,649 | $ | 23.60 | ||||||
(1) Represents the fair value of the restricted award on the day the award vested.
The Company recorded $42.0 million, $54.7 million and $56.6 million in stock compensation expense from continuing operations for the years ended December 31, 2014, 2013 and 2012, respectively.
F-29
(13) Stock Repurchase Program
In April 2014, the Company's Board of Directors authorized the repurchase of up to $200.0 million of the Company's common stock. This April 2014 authorization includes any amounts which were outstanding under previously authorized stock repurchase programs. During the year ended December 31, 2014, the Company repurchased 8.3 million shares of its common stock for $196.5 million, of which $123.1 million was purchased under the October 2013 authorization discussed below and $73.4 million was purchased under the April 2014 authorization. As of December 31, 2014, the Company had $126.6 million remaining under its existing stock repurchase program.
In October 2013, the Company's Board of Directors authorized the repurchase of up to $250.0 million of the Company's common stock. This October 2013 $250.0 million authorization includes any amounts which were outstanding under previously authorized stock repurchase programs. In November 2011, the Company’s Board of Directors authorized the repurchase of up to $400 million of the Company’s common stock. During the year ended December 31, 2013, the Company repurchased 9.1 million shares of its common stock for $182.1 million of which $107.1 million was repurchased under the November 2011 authorization and $75.0 million was repurchased under the October 2013 authorization.
During the year ended December 31, 2012, the Company repurchased 8.4 million shares of its common stock, which includes the 5.3 million shares repurchased under the accelerated share repurchase ("ASR"), for $152.1 million. On August 10, 2012, the Company entered into an ASR agreement with UBS AG, London Branch, and UBS Securities LLC, as agent for UBS AG, London Branch, to repurchase an aggregate of $80 million of the Company's common stock. The number of shares to be delivered under the ASR was based on the volume-weighted average price of Company common stock during the repurchase period, less a discount. At inception of the ASR, the Company received 4.3 million shares of its common stock. On September 28, 2012, the Company received an additional 1.0 million shares to complete the ASR program.
(14) Income Taxes
The components of income from continuing operations before income taxes are as follows (in thousands):
Year ended December 31, | ||||||||||||
2014 | 2013 | 2012 | ||||||||||
Domestic income (loss) | $ | 13,957 | $ | 27,553 | $ | (7,882 | ) | |||||
Foreign loss | (7,754 | ) | (4,678 | ) | (3,102 | ) | ||||||
Income (loss) from continuing operations before income taxes | $ | 6,203 | $ | 22,875 | $ | (10,984 | ) | |||||
Income tax expense (benefit) for the years ended December 31, 2014, 2013 and 2012 consisted of the following (in thousands):
Year ended December 31, | |||||||||||
2014 | 2013 | 2012 | |||||||||
Current: | |||||||||||
Federal | $ | — | $ | — | $ | (1,265 | ) | ||||
State | 2,707 | (13,567 | ) | (1,061 | ) | ||||||
Foreign | 20,051 | 16,073 | 14,578 | ||||||||
Total current tax expense | $ | 22,758 | $ | 2,506 | $ | 12,252 | |||||
Deferred: | |||||||||||
Federal | (77 | ) | (1,068 | ) | (1,814 | ) | |||||
State | (1,874 | ) | (1,278 | ) | 973 | ||||||
Foreign | (1,082 | ) | 1,380 | (2,253 | ) | ||||||
Total deferred tax benefit | (3,033 | ) | (966 | ) | (3,094 | ) | |||||
Total tax expense from continuing operations | 19,725 | 1,540 | 9,158 | ||||||||
Total tax expense from discontinued operations | $ | 2,505 | $ | 5,426 | $ | 12,639 | |||||
Income tax expense for the years ended December 31, 2014, 2013, and 2012 differed from the amounts computed by applying the U.S. federal income tax rate of 35% to pretax income from continuing operations as a result of the following (in thousands):
F-30
Year ended December 31, | |||||||||||
2014 | 2013 | 2012 | |||||||||
Federal tax | $ | 2,171 | $ | 8,006 | $ | (3,844 | ) | ||||
State taxes, net of federal benefit | (77 | ) | (1,226 | ) | 2,588 | ||||||
Foreign tax rate differential | 3,654 | 1,951 | 125 | ||||||||
Foreign withholding tax | 2,152 | 988 | 1,852 | ||||||||
Foreign return to provision | (464 | ) | 1,519 | — | |||||||
Deemed repatriation of foreign income | — | 3,204 | 1,595 | ||||||||
Change to contingencies | 3,744 | (6,641 | ) | (3,459 | ) | ||||||
Compensation expense | 813 | 4,851 | 3,356 | ||||||||
Tax settlements | — | (6,280 | ) | (2,527 | ) | ||||||
Change in valuation allowance | 8,865 | (4,892 | ) | 9,472 | |||||||
Others | (1,133 | ) | 60 | — | |||||||
Total tax expense | $ | 19,725 | $ | 1,540 | $ | 9,158 | |||||
Luxembourg has losses which the Company cannot benefit from and is the main contributor to the Company’s foreign tax rate differential.
The tax effects of the temporary differences that give rise to significant portions of the deferred tax assets and liabilities are presented below (in thousands):
December 31, | |||||||
2014 | 2013 | ||||||
Deferred tax assets: | |||||||
Accruals, reserves and others | $ | 15,749 | $ | 15,578 | |||
Impairment losses on investments | 8,634 | 8,526 | |||||
Equity-based compensation | 17,166 | 23,383 | |||||
Deferred revenue | 9,362 | 3,186 | |||||
Credits | 141,580 | 129,091 | |||||
Debt amortization | 8,980 | — | |||||
Others | 8,667 | 6,666 | |||||
State NOL's and credits | 6,356 | 2,845 | |||||
Net operating loss carryforwards | 338,249 | 419,385 | |||||
Gross deferred tax assets | 554,743 | 608,660 | |||||
Valuation allowance | (409,559 | ) | (389,155 | ) | |||
Total deferred tax assets | 145,184 | 219,505 | |||||
Deferred tax liabilities: | |||||||
Intangible assets | (199,378 | ) | (234,815 | ) | |||
Debt amortization | — | (3,547 | ) | ||||
Others | (6,199 | ) | (3,901 | ) | |||
Total deferred tax liabilities | (205,577 | ) | (242,263 | ) | |||
Net deferred tax liabilities | $ | (60,393 | ) | $ | (22,758 | ) | |
During the three months ended March 31, 2010, the Company entered into a closing agreement with the Internal Revenue Service through its Pre-Filing Agreement (PFA) program confirming that the Company recognized an ordinary tax loss of approximately $2.4 billion from the 2008 sale of its TV Guide Magazine business. In connection with the PFA closing agreement the Company established a valuation allowance against its deferred tax assets as a result of determining that it is more likely than not that its deferred tax assets would not be realized. At December 31, 2014, the Company reviewed the determination made at March 31, 2010, that it is more likely than not that its deferred tax assets will not be realized. While the Company believes that its fundamental business model is robust, there has not been a change from the March 31, 2010, determination that it is more likely than not that its deferred tax assets will not be realized and as such has maintained a valuation allowance against deferred tax assets at December 31, 2014.
F-31
As of December 31, 2014, the Company had federal tax loss carryforwards of approximately $1.3 billion, of which $177.6 million related to stock option deductions and are not included in deferred tax assets. The federal loss carryforwards will expire from 2020 through 2030. As of December 31, 2014, the Company has state net operating loss carryforwards in various jurisdictions of approximately $359.7 million, of which $30.5 million related to stock option deductions and are not included in deferred taxes. The state loss carryforwards will expire from 2015 through 2033.
As of December 31, 2014, the Company has federal and state research and development credits available to reduce future income tax expense of approximately $26.9 million and $11.7 million, respectively. The federal research credits will expire from 2016 through 2034. The state research credits can be carried forward indefinitely. The Company had foreign tax credits available to reduce future income tax expense of approximately $115.6 million, which will expire from 2015 through 2024.
Utilization of state and federal net operating loss and credit carryforwards may be subject to limitations due to ownership changes.
The Company recognizes a liability for uncertain tax positions. The gross tax-affected unrecognized tax benefits which, if recognized, would affect the Company's tax rate were $10.1 million and $42.3 million as of December 31, 2014 and 2013. The Company recorded interest related to unrecognized tax benefits of approximately $0.4 million, $0.2 million and $1.2 million for the years ended December 31, 2014, 2013 and 2012, respectively, and released interest and penalties of $0.1 million and $1.9 million for settlements and statute closures for the years ended December 31, 2014 and 2013, respectively. Total accrued interest and penalties was $1.8 million and $1.5 million at December 31, 2014 and 2013. Interest and penalties are classified in income tax expense. A reconciliation of the beginning and ending amount of gross unrecognized tax benefits is (in thousands):
Year ended December 31, | |||||||
2014 | 2013 | ||||||
Balance as of January 1 | $ | 121,851 | $ | 126,535 | |||
Additions from acquired companies | 1,241 | — | |||||
Additions for tax positions related to the current year | 2,998 | 1,051 | |||||
Additions (reductions) for tax provisions of prior years | 9,102 | (4,843 | ) | ||||
Reductions for audit settlements | — | (650 | ) | ||||
Reductions for statute of limitations closures | (230 | ) | (242 | ) | |||
Balance as of December 31 | $ | 134,962 | $ | 121,851 | |||
The Company does not expect a material change in unrecognized tax benefits in the next twelve months.
The Company has not provided U.S. Federal or state taxes on certain of its non-U.S. subsidiaries’ undistributed earnings as such amounts are considered indefinitely reinvested outside the U.S. To the extent that foreign earnings previously treated as indefinitely reinvested are repatriated, the related U.S. tax liability may be reduced by any foreign income taxes paid on these earnings. However, based on the Company’s policy of indefinite reinvestment, it is not practicable to determine the U.S. federal income tax liability, if any, which would be payable if such earnings were not indefinitely reinvested. As of December 31, 2014, the non-U.S. subsidiaries have cumulative unremitted foreign earnings of approximately $213.3 million.
The Company conducts business globally and, as a result, files U.S. federal, state and foreign income tax returns in various jurisdictions. In the normal course of business, the Company is subject to examination by taxing authorities throughout the world. With few exceptions, the Company is no longer subject to income tax examinations for years before 2008.
(15) Geographic Information
Information on Revenue from Continuing Operations by Geographic Areas (in thousands):
Year ended December 31, | ||||||||||||
2014 | 2013 | 2012 | ||||||||||
United States | $ | 333,075 | $ | 316,201 | $ | 313,241 | ||||||
International | 209,236 | 221,189 | 212,853 | |||||||||
Total Revenue | $ | 542,311 | $ | 537,390 | $ | 526,094 | ||||||
F-32
Information on Long Lived Assets by Geographic Areas (in thousands):
December 31, | ||||||||
2014 | 2013 | |||||||
United States | ||||||||
Property and Equipment, net | $ | 35,876 | $ | 31,199 | ||||
Goodwill, net | 1,325,518 | 1,279,662 | ||||||
Intangibles, net | 461,951 | 476,399 | ||||||
Total United States | 1,823,345 | 1,787,260 | ||||||
International | ||||||||
Property and Equipment, net | 1,351 | 2,151 | ||||||
Goodwill, net | 18,134 | 18,786 | ||||||
Intangibles, net | 1,397 | 1,830 | ||||||
Total International | 20,882 | 22,767 | ||||||
Total Long Lived Assets | $ | 1,844,227 | $ | 1,810,027 | ||||
(16) Commitments and Contingencies
Lease Commitments
The Company leases its facilities and certain equipment pursuant to noncancelable operating lease agreements expiring through 2025. The Company records rent expense on a straight-line basis based on the lease terms. Allowances from lessors for tenant improvements have been included in the straight-line rent expense for applicable locations. Tenant improvements are capitalized and depreciated over the lesser of the useful lives of the assets and the remaining life of the applicable lease.
Future minimum lease payments pursuant to these leases as of December 31, 2014 were as follows (in thousands):
Operating Leases | |||
2015 | $ | 19,696 | |
2016 | 13,575 | ||
2017 | 8,823 | ||
2018 | 7,277 | ||
2019 | 5,314 | ||
Thereafter | 14,756 | ||
Total minimum lease payments | $ | 69,441 | |
Less sublease income | (11,246 | ) | |
Net future minimum lease payments | $ | 58,195 | |
Rent expense from continuing operations was $11.6 million, $11.2 million, and $12.5 million, for the years ended December 31, 2014, 2013, and 2012, respectively.
Indemnifications
In the normal course of business, the Company provides indemnification of varying scopes and amounts to certain of its licensees against claims made by third parties arising out of the use and / or incorporation of the Company's products, intellectual property, services and / or technologies into the licensees' products and services. In some cases, the Company may receive tenders of defense and indemnity arising out of products, intellectual property services and / or technologies that are no longer provided by the Company due to having divested certain assets, but which were previously licensed or provided by the Company. The Company's indemnification obligations are typically limited to the cumulative amount paid to the Company by the licensee under the license agreement, however some license agreements, including those with the Company's largest multiple system operators and digital broadcast satellite providers, have larger limits or do not specify a limit on amounts that may be payable under the indemnity arrangements. The Company cannot estimate the possible range of losses that may affect the Company's results of operations or cash flows in a given period or the maximum potential impact of these indemnification provisions on its future results of operations.
F-33
Legal Proceedings
The Company is party to various legal actions, claims and proceedings as well as other actions, claims and proceedings incidental to its business. The Company has established loss provisions only for matters in which losses are probable and can be reasonably estimated. Some of the matters pending against the Company involve potential compensatory, punitive or treble damage claims, or sanctions, that if granted, could require the Company to pay damages or make other expenditures in amounts that could have a material adverse effect on its financial position or results of operations. At this time, management has not reached a determination that any litigation matters, individually or in the aggregate, are expected to result in liabilities that will have a material adverse effect on the Company's financial position or results of operations or cash flows.
F-34
(17) Segments
During the third quarter of 2014, the Company reorganized its internal financial reporting and now reports financial information for its Intellectual Property Licensing business unit and Product business unit to its chief operating decision maker. As this is the way that management internally organizes its business for assessing performance and making decisions regarding the allocation of resources to the business units, the Company will report its segment information in the same manner. In addition, the Company has certain costs which it does not allocate to its business units which it considers Corporate expenses. Segment information for the prior periods has been reclassified to conform to the current presentation.
The Company’s Intellectual Property Licensing segment consists primarily of IPG patent licensing to third party guide developers such as multi-channel video service providers (cable, satellite and IPTV), consumer electronics (“CE”) manufacturers, set-top box manufacturers and interactive television software and program guide providers in the online, over-the-top video and mobile phone businesses.
The Company’s Product segment consists primarily of the licensing of Company-developed IPG products and services provided for multi-channel video service providers and CE manufacturers, in-guide advertising revenue, analytics revenue and revenue from licensing our Metadata. Our Product segment also includes sales of our legacy ACP, VCR Plus+, connected platform and media recognition products.
Corporate primarily includes certain general and administrative costs such as corporate management, finance, legal, human resources and related expenses such as certain corporate litigation and insurance costs.
The Company’s chief operating decision maker uses an adjusted EBITDA (as defined below) measurement to evaluate the performance of, and allocate resources to, the business units. Intersegment revenues and expenses have been eliminated from segment financial information as transactions between reportable segments are excluded from the measure of segment profit and loss when reviewed by the Company’s chief operating decision maker. Balance sheets of the reportable segments are not used by the chief operating decision maker to allocate resources or assess performance of the businesses.
F-35
Year Ended December 31, | |||||||||||
2014 | 2013 | 2012 | |||||||||
Intellectual Property Licensing: | |||||||||||
Revenues | $ | 285,158 | $ | 293,210 | $ | 275,483 | |||||
Adjusted Operating Expenses (1) | 59,810 | 57,957 | 59,415 | ||||||||
Adjusted EBITDA (2) | 225,348 | 235,253 | 216,068 | ||||||||
Product: | |||||||||||
Revenues | 257,153 | 244,180 | 250,611 | ||||||||
Adjusted Operating Expenses (1) | 197,405 | 186,787 | 194,716 | ||||||||
Adjusted EBITDA (2) | 59,748 | 57,393 | 55,895 | ||||||||
Corporate: | |||||||||||
Adjusted Operating Expenses (1) | 51,737 | 53,666 | 49,203 | ||||||||
Adjusted EBITDA (2) | (51,737 | ) | (53,666 | ) | (49,203 | ) | |||||
Consolidated: | |||||||||||
Revenues | 542,311 | 537,390 | 526,094 | ||||||||
Adjusted Operating Expenses (1) | 308,952 | 298,410 | 303,334 | ||||||||
Adjusted EBITDA (2) | 233,359 | 238,980 | 222,760 | ||||||||
Equity-based compensation expense | (42,017 | ) | (54,661 | ) | (56,554 | ) | |||||
Transaction, transition and integration expenses | (3,966 | ) | (2,160 | ) | (2,743 | ) | |||||
Change in contingent consideration | 2,700 | — | — | ||||||||
Restructuring and asset impairment charges | (10,939 | ) | (7,638 | ) | (4,737 | ) | |||||
Depreciation | (17,540 | ) | (16,775 | ) | (19,956 | ) | |||||
Amortization of intangible assets | (77,887 | ) | (74,413 | ) | (74,337 | ) | |||||
Operating income | 83,710 | 83,333 | 64,433 | ||||||||
Interest expense | (54,768 | ) | (62,019 | ) | (61,742 | ) | |||||
Interest income and other, net | 4,069 | 2,775 | 3,203 | ||||||||
Debt modification expense and loss on debt redemption | (8,934 | ) | (4,112 | ) | (6,254 | ) | |||||
(Loss) income on interest rate swaps, net | (17,874 | ) | 2,898 | (10,624 | ) | ||||||
Income (loss) from continuing operations before income taxes | $ | 6,203 | $ | 22,875 | $ | (10,984 | ) | ||||
(1) Adjusted Operating Expenses is defined as operating expenses excluding equity-based compensation expense, transaction, transition and integration expenses, change in contingent consideration related to acquisitions, restructuring and asset impairment charges and depreciation and amortization.
(2) Adjusted EBITDA is defined as operating income excluding equity-based compensation expense, transaction, transition and integration expenses, change in contingent consideration related to acquisitions, restructuring and asset impairment charges and depreciation and amortization.
(18) Quarterly Consolidated Financial Data (Unaudited)
F-36
Quarter | ||||||||||||||||||||
Q1 | Q2 | Q3 | Q4 | Year | ||||||||||||||||
(in thousands, except per share data) | ||||||||||||||||||||
2014 | ||||||||||||||||||||
Revenues | $ | 142,450 | $ | 137,062 | $ | 128,582 | $ | 134,217 | $ | 542,311 | ||||||||||
Income (loss) from continuing operations, net of taxes | $ | 1,683 | $ | (2,714 | ) | $ | (6,615 | ) | $ | (5,876 | ) | $ | (13,522 | ) | ||||||
Discontinued operations, net of tax | $ | (55,948 | ) | $ | 74 | $ | (417 | ) | $ | 69 | $ | (56,222 | ) | |||||||
Net loss | $ | (54,265 | ) | $ | (2,640 | ) | $ | (7,032 | ) | $ | (5,807 | ) | $ | (69,744 | ) | |||||
Basic income (loss) per share from continuing operations | $ | 0.02 | $ | (0.03 | ) | $ | (0.07 | ) | $ | (0.06 | ) | $ | (0.15 | ) | ||||||
Basic loss per share from discontinued operations | (0.60 | ) | 0.00 | (0.01 | ) | 0.00 | (0.61 | ) | ||||||||||||
Basic net earnings (loss) per share | $ | (0.58 | ) | $ | (0.03 | ) | $ | (0.08 | ) | $ | (0.06 | ) | $ | (0.76 | ) | |||||
Diluted income (loss) per share from continuing operations | $ | 0.02 | $ | (0.03 | ) | $ | (0.07 | ) | $ | (0.06 | ) | $ | (0.15 | ) | ||||||
Diluted loss per share from discontinued operations | (0.59 | ) | 0.00 | (0.01 | ) | 0.00 | (0.61 | ) | ||||||||||||
Diluted net earnings (loss) per share | $ | (0.57 | ) | $ | (0.03 | ) | $ | (0.08 | ) | $ | (0.06 | ) | $ | (0.76 | ) | |||||
2013 | ||||||||||||||||||||
Revenues | $ | 132,769 | $ | 129,151 | $ | 123,478 | $ | 151,992 | $ | 537,390 | ||||||||||
(Loss) income from continuing operations, net of taxes | $ | (932 | ) | $ | 5,686 | $ | 6,031 | $ | 10,550 | $ | 21,335 | |||||||||
Discontinued operations, net of tax | $ | (24,801 | ) | $ | (79,760 | ) | $ | (17,505 | ) | $ | (71,359 | ) | $ | (193,425 | ) | |||||
Net loss | $ | (25,733 | ) | $ | (74,074 | ) | $ | (11,474 | ) | $ | (60,809 | ) | $ | (172,090 | ) | |||||
Basic (loss) income per share from continuing operations | $ | (0.01 | ) | $ | 0.06 | $ | 0.06 | $ | 0.11 | $ | 0.22 | |||||||||
Basic loss per share from discontinued operations | (0.25 | ) | (0.81 | ) | (0.18 | ) | (0.74 | ) | (1.97 | ) | ||||||||||
Basic net earnings (loss) per share | $ | (0.26 | ) | $ | (0.75 | ) | $ | (0.12 | ) | $ | (0.63 | ) | $ | (1.75 | ) | |||||
Diluted (loss) income per share from continuing operations | $ | (0.01 | ) | $ | 0.06 | $ | 0.06 | $ | 0.11 | $ | 0.22 | |||||||||
Diluted loss per share from discontinued operations | (0.25 | ) | (0.81 | ) | (0.18 | ) | (0.73 | ) | (1.96 | ) | ||||||||||
Diluted net earnings (loss) per share | $ | (0.26 | ) | $ | (0.75 | ) | $ | (0.12 | ) | $ | (0.62 | ) | $ | (1.74 | ) | |||||
(19) Subsequent Events
In February 2015, the Company drew $100.0 million of its Revolving Facility (See Note 7).
F-37