Attached files
| file | filename |
|---|---|
| 8-K - CAGNY 2015 - PROCTER & GAMBLE Co | cagny2015.htm |

* 2015 CAGNY February 19, 2015 *

SalesGrowth Cash FlowGrowth ProfitGrowth MarginImprovement AssetEfficiency TotalShareholderReturn Operating Total Shareholder Return *
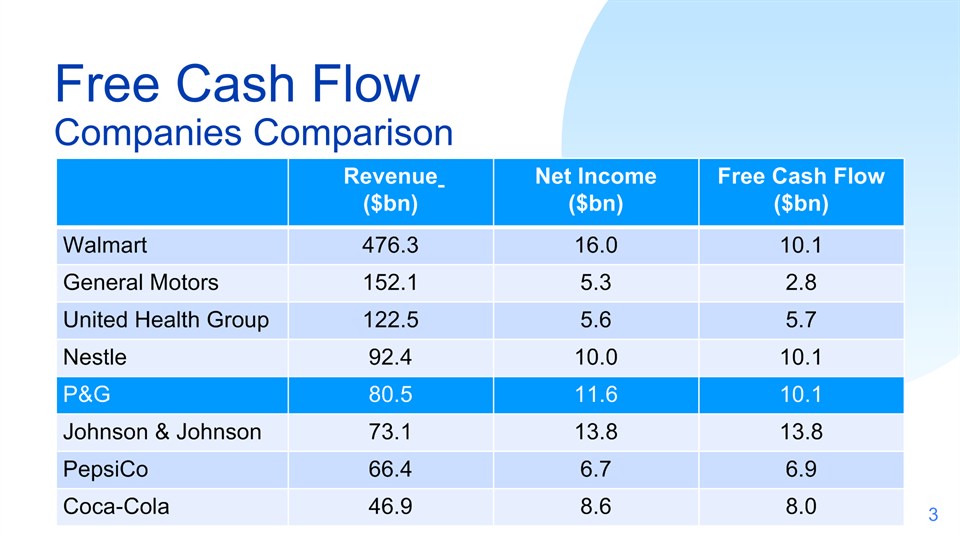
Free Cash FlowCompanies Comparison Revenue ($bn) Net Income($bn) Free Cash Flow ($bn) Walmart 476.3 16.0 10.1 General Motors 152.1 5.3 2.8 United Health Group 122.5 5.6 5.7 Nestle 92.4 10.0 10.1 P&G 80.5 11.6 10.1 Johnson & Johnson 73.1 13.8 13.8 PepsiCo 66.4 6.7 6.9 Coca-Cola 46.9 8.6 8.0 *
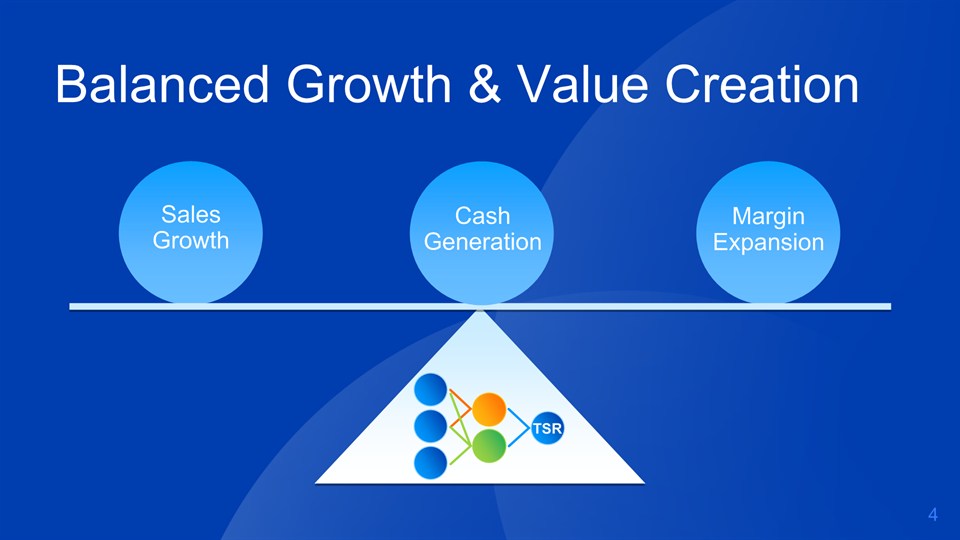
Balanced Growth & Value Creation TSR SalesGrowth MarginExpansion CashGeneration *

Strategic Step Forwardto Accelerate Performance Leading brands, structurally attractive categoriesFaster growing, more profitable portfolio *

*
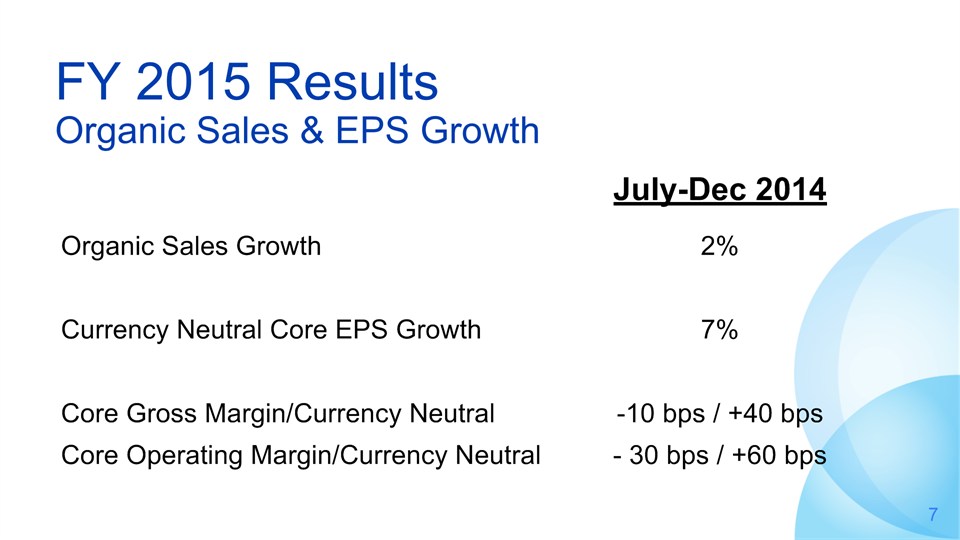
July-Dec 2014 Organic Sales Growth 2% Currency Neutral Core EPS Growth 7% Core Gross Margin/Currency Neutral -10 bps / +40 bps Core Operating Margin/Currency Neutral - 30 bps / +60 bps FY 2015 ResultsOrganic Sales & EPS Growth *
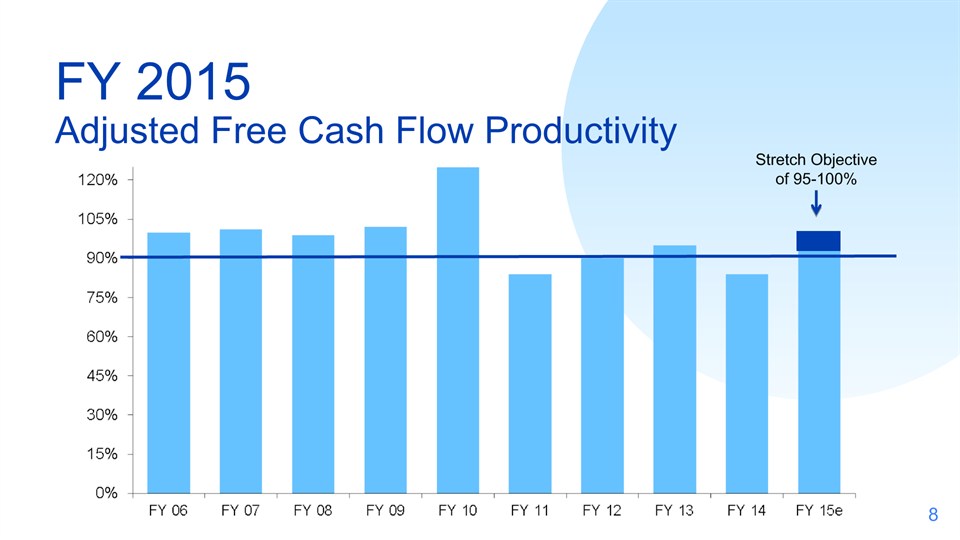
FY 2015 Adjusted Free Cash Flow Productivity Stretch Objectiveof 95-100% *
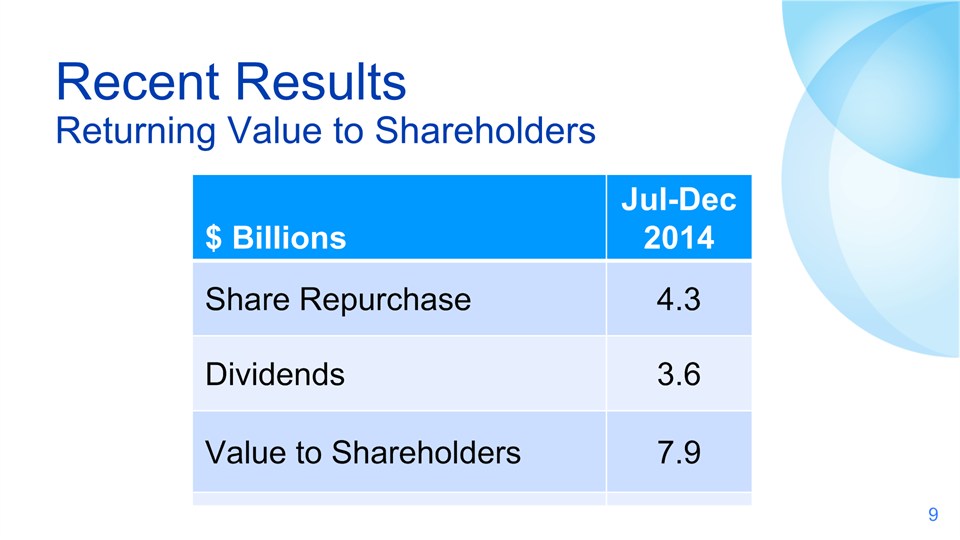
$ Billions Jul-Dec 2014 Share Repurchase 4.3 Dividends 3.6 Value to Shareholders 7.9 Recent ResultsReturning Value to Shareholders *

FY 2015 Organic Sales Growth Low to Mid-Single Digits Currency ~5% All-In Sales Growth -3% to -4% Core Earning Per Share Growth In-line to Down Low Single Digits Currency Neutral Core EPS Growth Double Digit FY 2015 Guidance Organic Sales & EPS Growth *

$ Billions FY 2015 Share Repurchase ~5 Dividends ~7 Value to Shareholders ~12 Yield ~5% FY 2015 GuidanceReturning Value to Shareholders * Assumes market cap of $232 Bn *
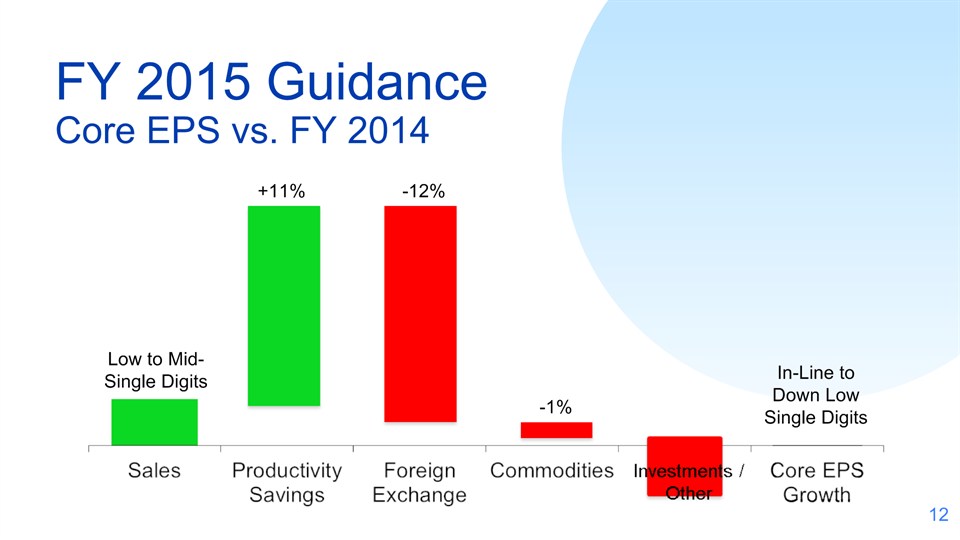
FY 2015 Guidance Core EPS vs. FY 2014 Low to Mid-Single Digits +11% -12% -1% In-Line to Down Low Single Digits *
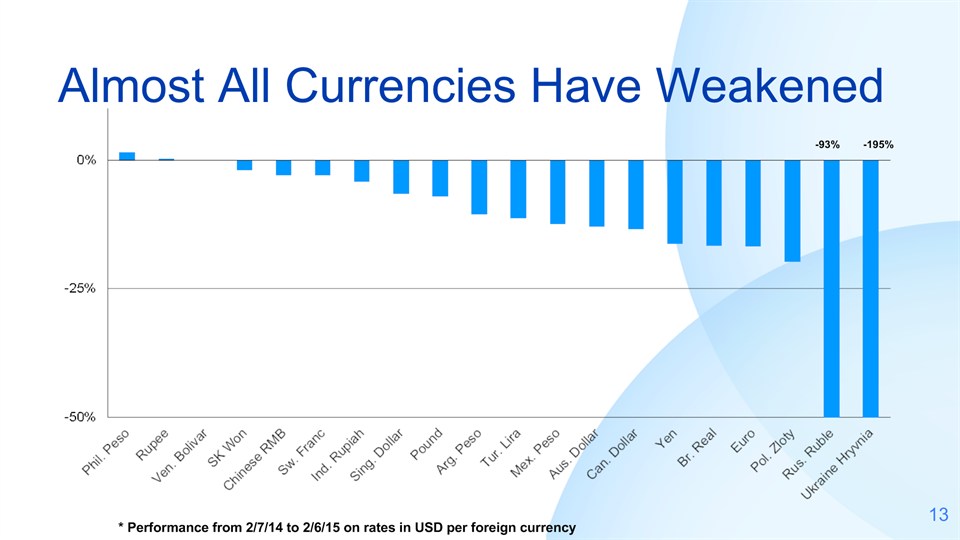
Almost All Currencies Have Weakened -93% -195% * Performance from 2/7/14 to 2/6/15 on rates in USD per foreign currency *
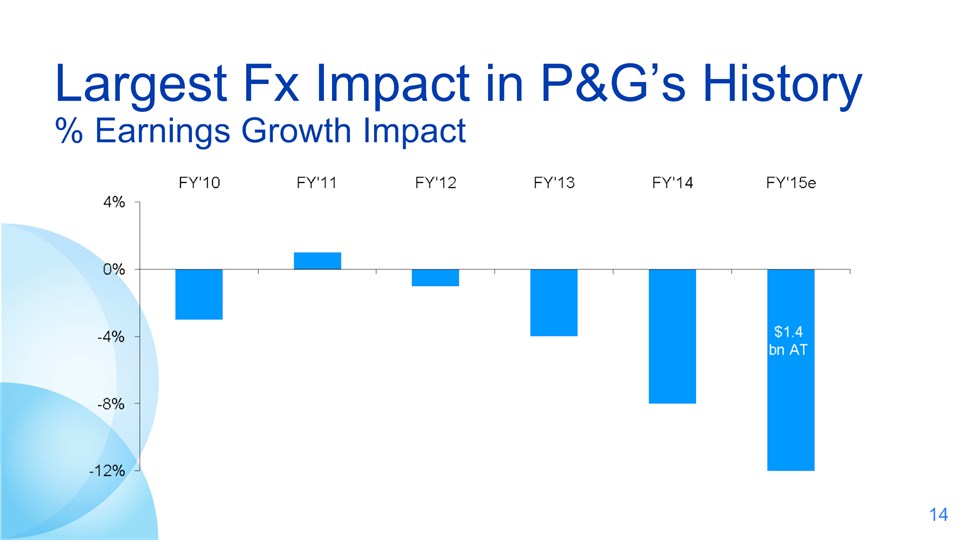
Largest Fx Impact in P&G’s History% Earnings Growth Impact *

Foreign Exchange ImpactP&G vs Competition P&G Exposures P&G sales vs. next competitor Competitor currency Russia ~3.0x Henkel EURO Ukraine ~2.5x Henkel EURO Venezuela ~1.5x Colgate USD Japan ~6.0x Unilever EURO Argentina ~0.7x Unilever EURO *
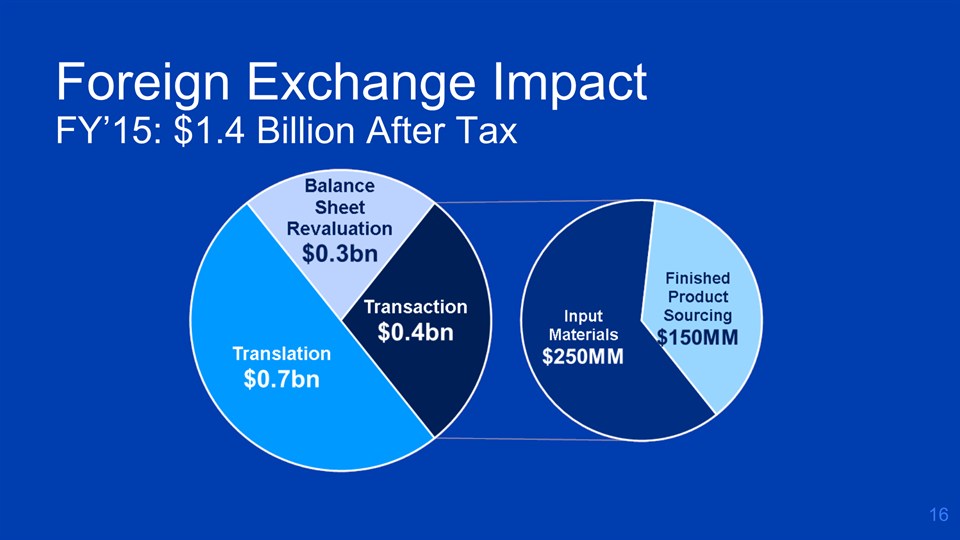
Foreign Exchange Impact FY’15: $1.4 Billion After Tax *

* Localization Efforts New plants/ capacity Developed regions Developingregions FY’09 – FY’13 2 16 FY’14 – FY’17 7 18 TOTAL 9 34 *
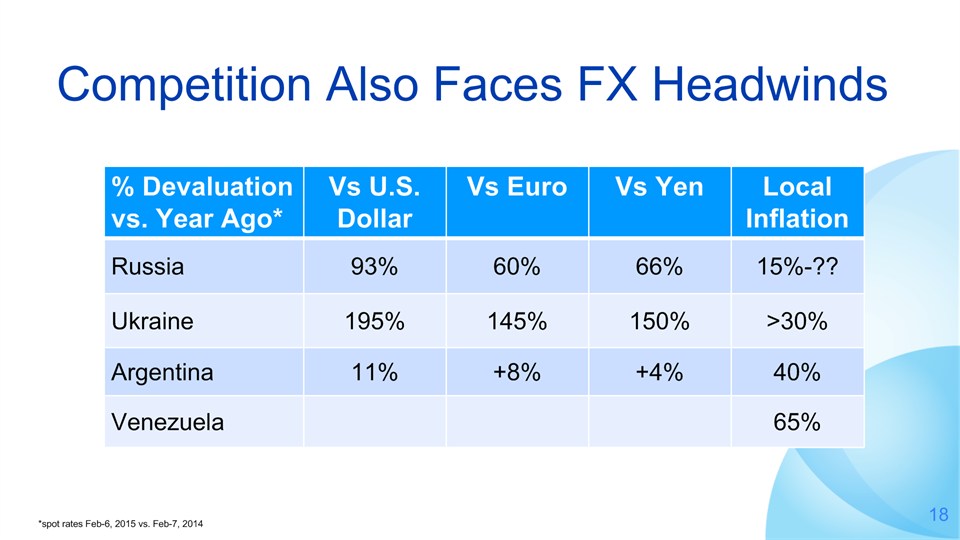
% Devaluationvs. Year Ago* Vs U.S. Dollar Vs Euro Vs Yen LocalInflation Russia 93% 60% 66% 15%-?? Ukraine 195% 145% 150% >30% Argentina 11% +8% +4% 40% Venezuela 65% Competition Also Faces FX Headwinds * Feb 6, 2015 vs. Feb 6, 2014 * *spot rates Feb-6, 2015 vs. Feb-7, 2014

Pricing Preserves Structural Economics Russia Example Sales BT Profit BT Profit Margin (%) Pre Devaluation (35 USD/RUB) base base base Post Devaluation (65 USD/RUB), no pricing -40% -130% -3,200bpts Margin recovery scenarios (vs. no pricing) ~60% pricing; flat market, -20% share decline +22% +105% +3,200bpts ~60% pricing; -20% market, flat share +22% +105% +3,200bpts *
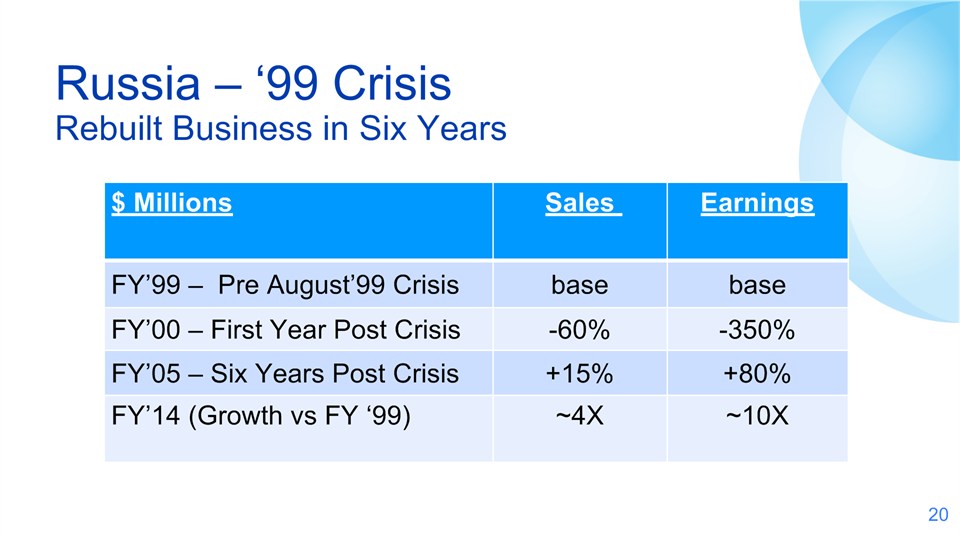
Russia – ‘99 CrisisRebuilt Business in Six Years $ Millions Sales Earnings FY’99 – Pre August’99 Crisis base base FY’00 – First Year Post Crisis -60% -350% FY’05 – Six Years Post Crisis +15% +80% FY’14 (Growth vs FY ‘99) ~4X ~10X *

Mix & Productivity Improvements Cost of Goods SoldOverhead ReductionsMarketing Efficiencies *

* CommoditiesImproving Annualized savings of~$500-700 Million BT *
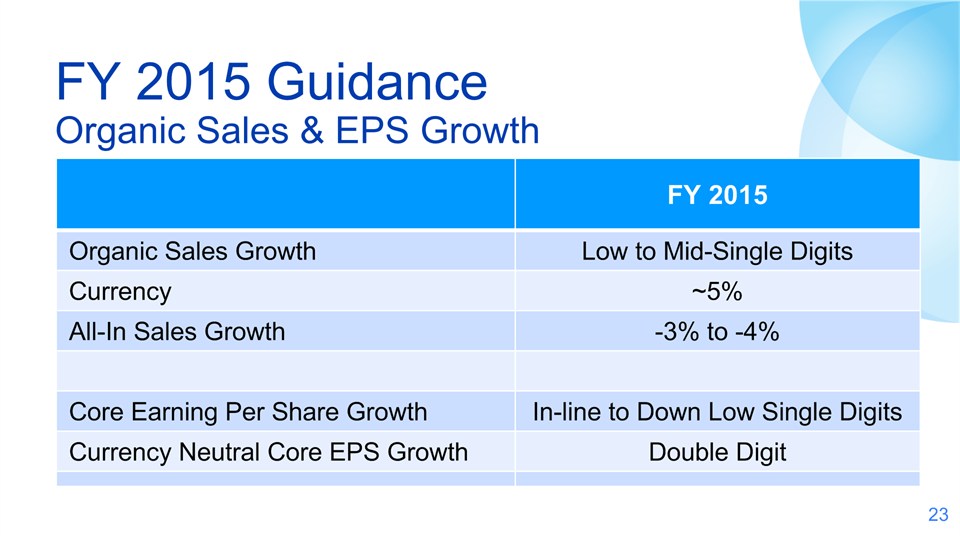
FY 2015 Organic Sales Growth Low to Mid-Single Digits Currency ~5% All-In Sales Growth -3% to -4% Core Earning Per Share Growth In-line to Down Low Single Digits Currency Neutral Core EPS Growth Double Digit FY 2015 Guidance Organic Sales & EPS Growth *
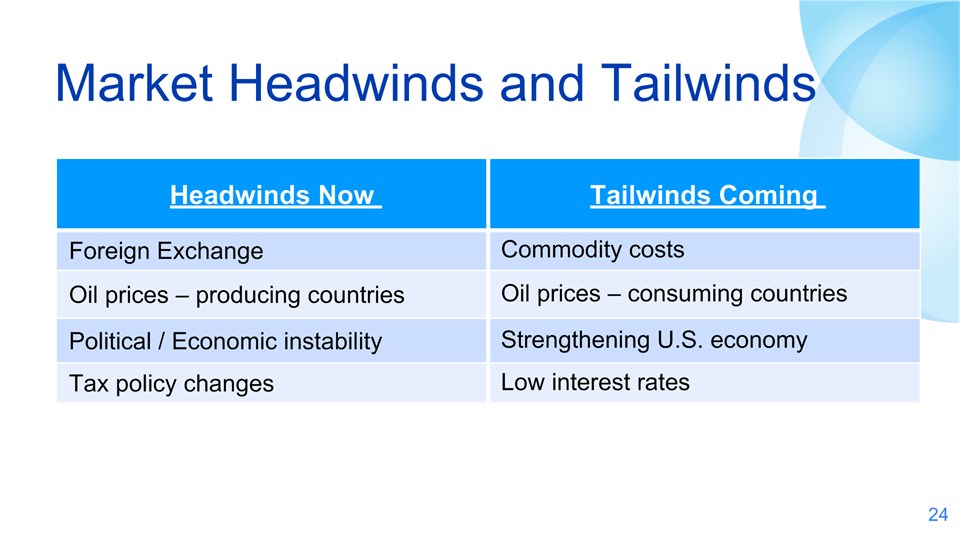
* Market Headwinds and Tailwinds * Headwinds Now Tailwinds Coming Foreign Exchange Commodity costs Oil prices – producing countries Oil prices – consuming countries Political / Economic instability Strengthening U.S. economy Tax policy changes Low interest rates
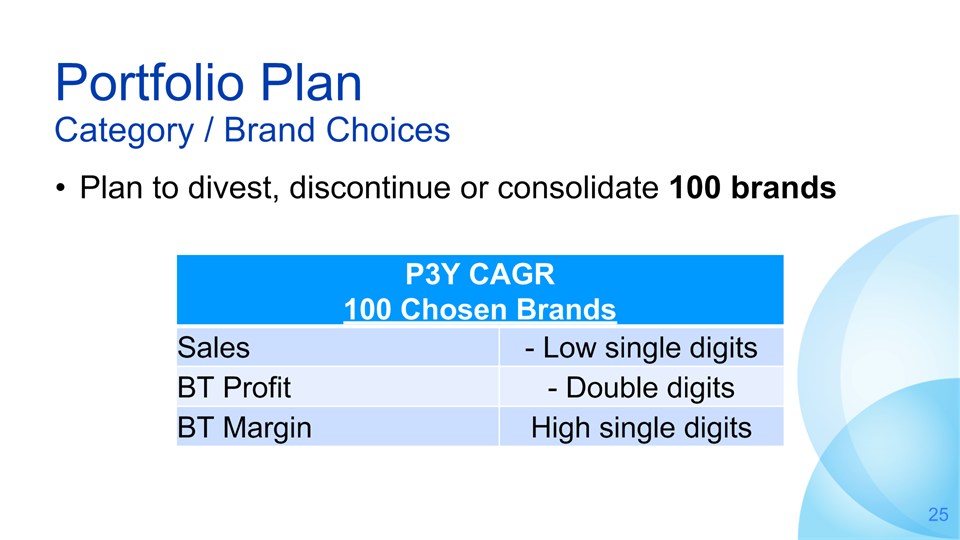
* Portfolio Plan Category / Brand Choices Plan to divest, discontinue or consolidate 100 brands P3Y CAGR100 Chosen Brands P3Y CAGR100 Chosen Brands Sales - Low single digits BT Profit - Double digits BT Margin High single digits *

* Portfolio Plan Update *

Portfolio Progress To date, 35 brands divested, discontinued or plans to consolidate *
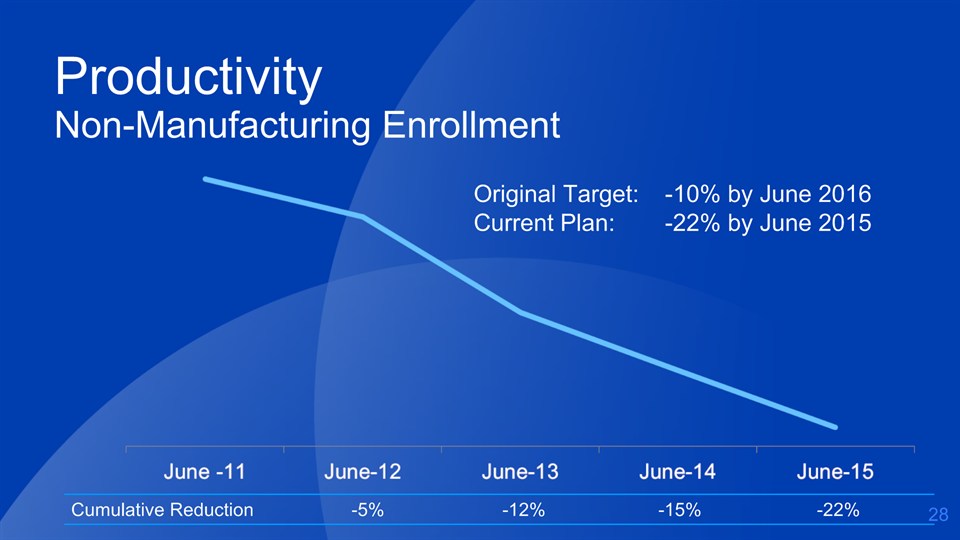
Productivity Non-Manufacturing Enrollment Cumulative Reduction -5% -12% -15% -22% Original Target: -10% by June 2016Current Plan: -22% by June 2015 *
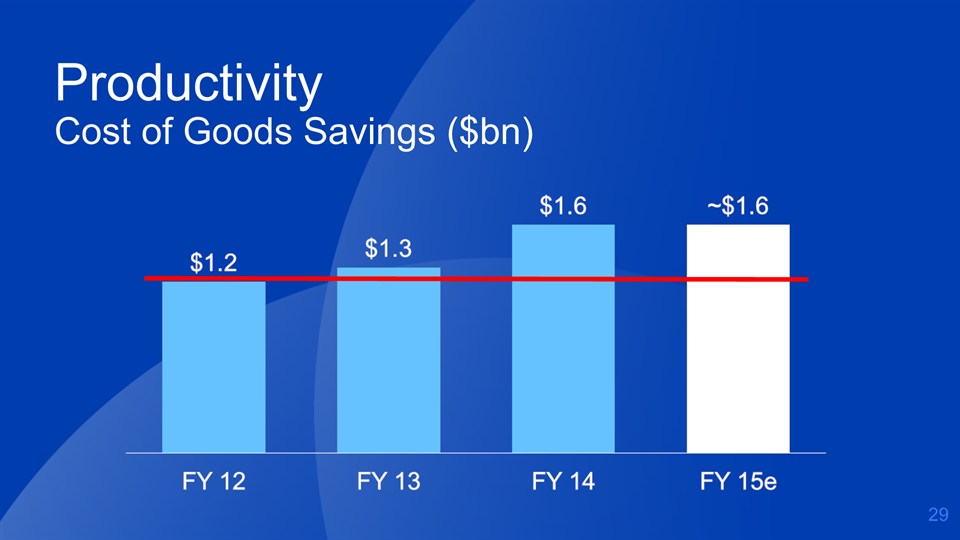
ProductivityCost of Goods Savings ($bn) *
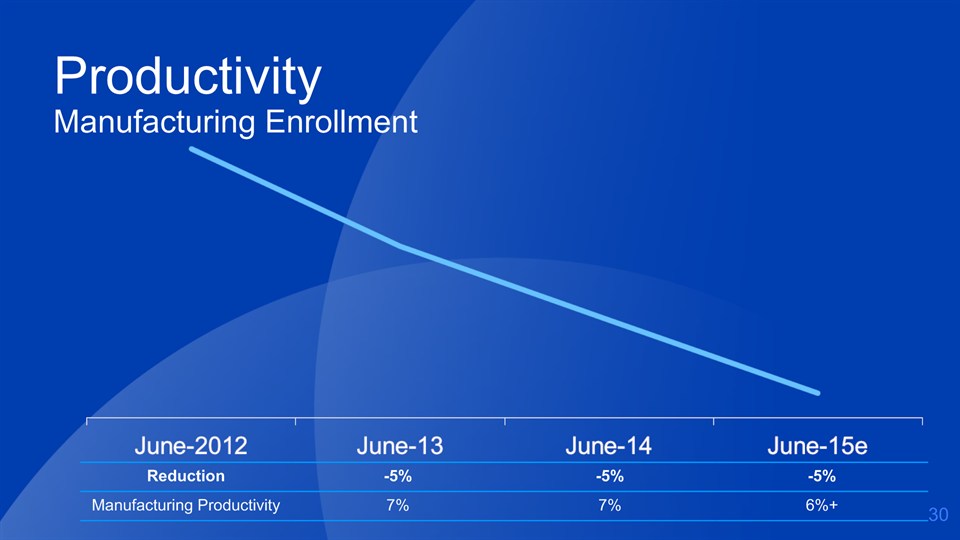
* Reduction -5% -5% -5% Manufacturing Productivity 7% 7% 6%+ Productivity Manufacturing Enrollment *

LocalizationAffordable automationDigitizing supply chainSupplier integration ProductivityCost of Goods Opportunities *
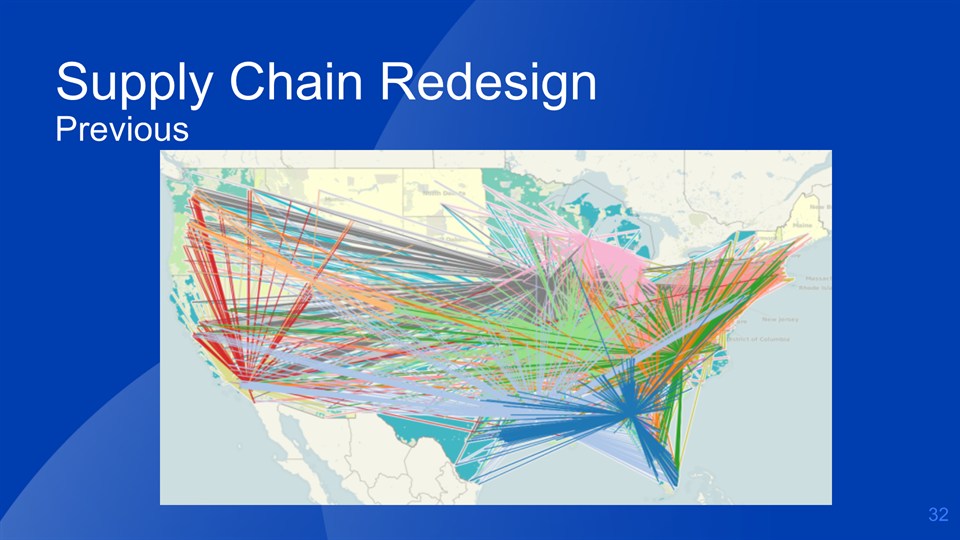
* Supply Chain Redesign Previous *
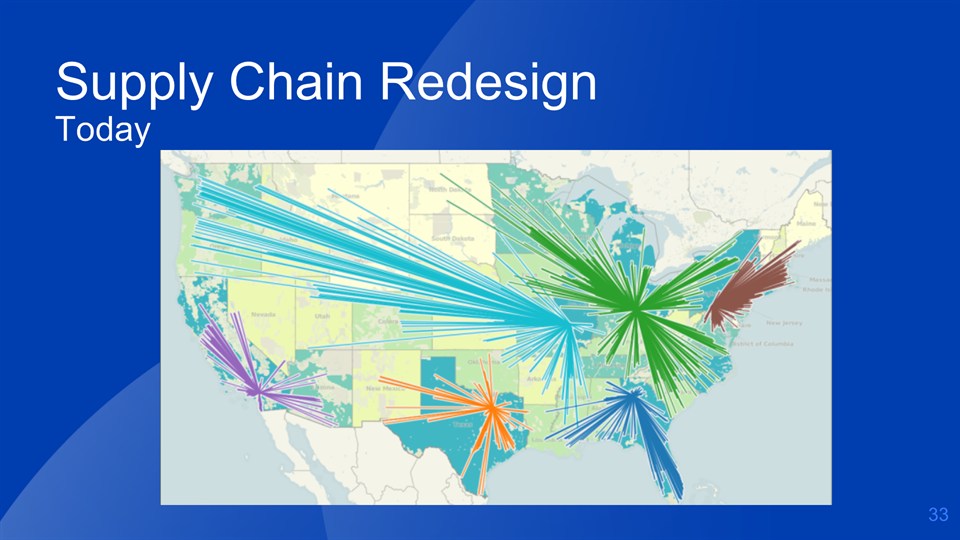
* Supply Chain Redesign Today *

*

*

Productivity Improvements Cost of Goods SoldOverhead ReductionsMarketing Efficiencies *
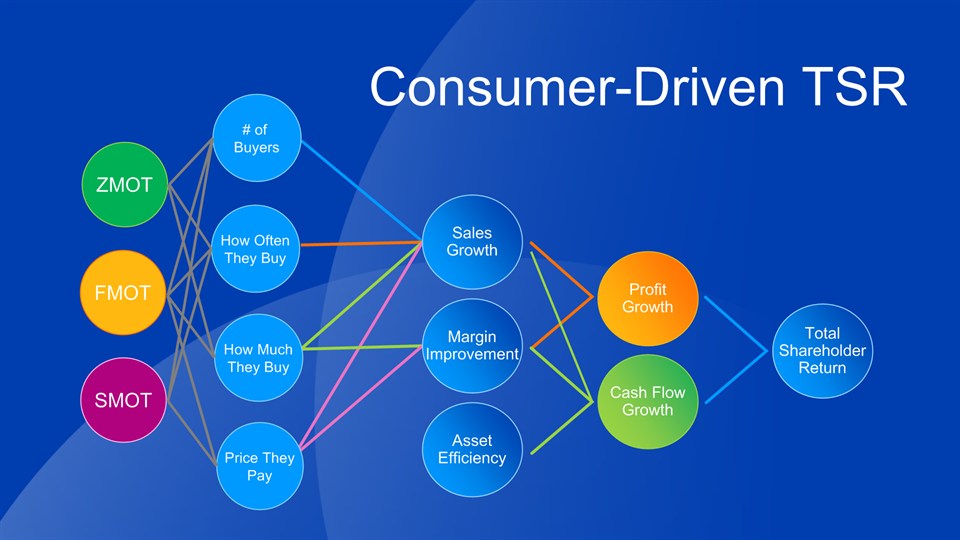
* Consumer-Driven TSR OTSR SalesGrowth Cash FlowGrowth ProfitGrowth MarginImprovement AssetEfficiency TotalShareholderReturn SMOT FMOT ZMOT How OftenThey Buy # of Buyers How MuchThey Buy Price TheyPay

* Build Relationship Create Preference Introduce Brand Pampers: Point of Market Entry *
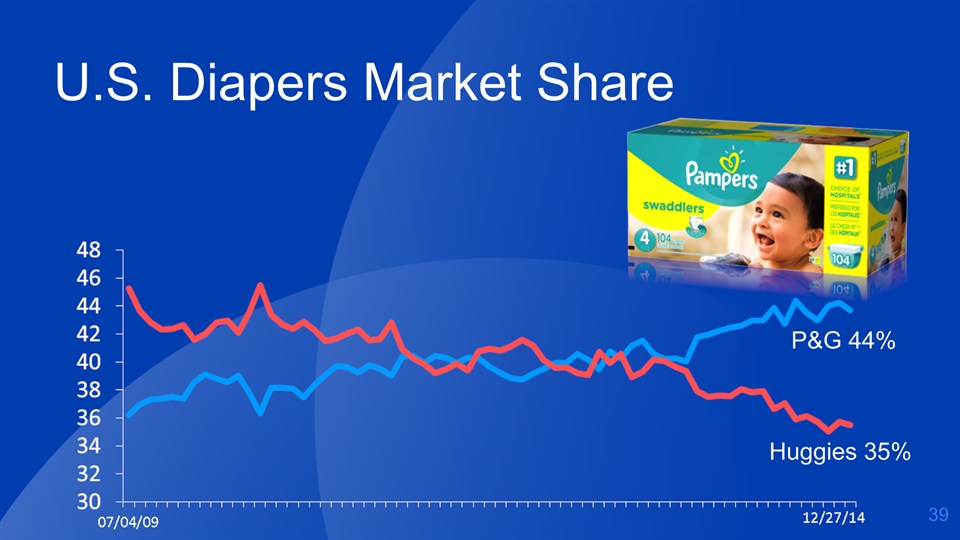
* U.S. Diapers Market Share P&G 44% Huggies 35% *

* Pampers Premium Care Pants *

* U.S. Fabric Care *
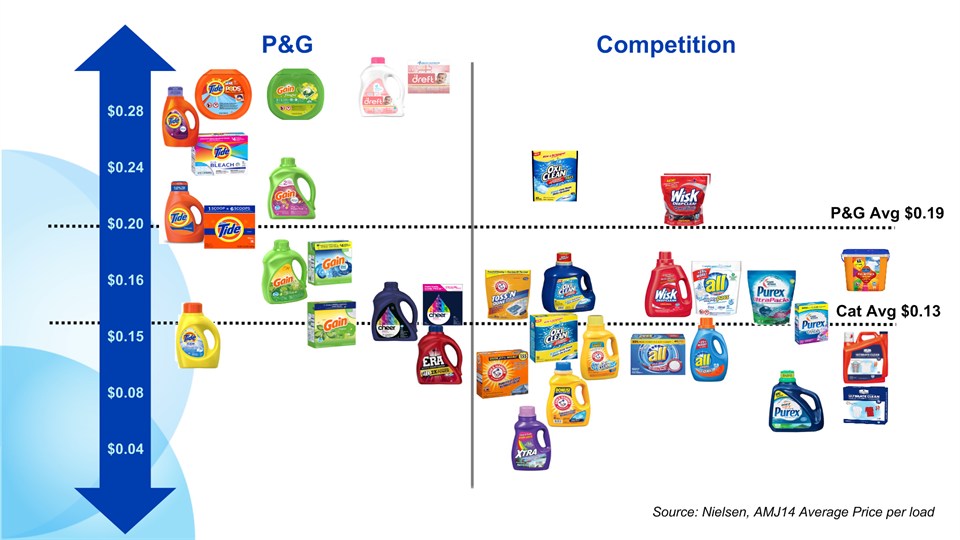
* Cat Avg $0.13 P&G Avg $0.19 P&G Competition $0.28$0.24$0.20$0.16$0.15$0.08$0.04 Source: Nielsen, AMJ14 Average Price per load
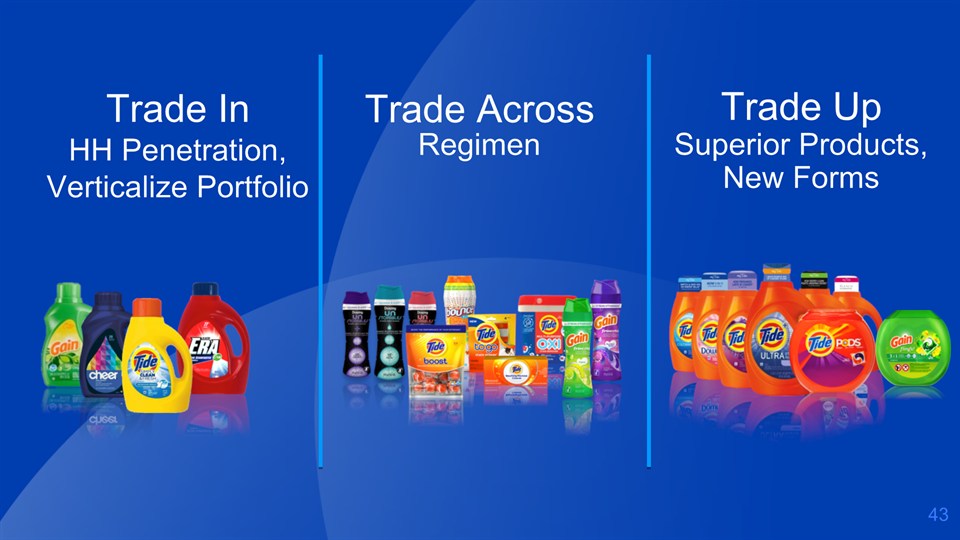
* Trade InHH Penetration, Verticalize Portfolio Trade UpSuperior Products, New Forms Trade AcrossRegimen *

* Note: ‘14 share is FYTD US AOS through Dec 2014 U.S. Laundry Market Share ~60 ~40 *

* U.S. Fabric Enhancers *

* U.S. Fabric Enhancer CategoryMarket Growth *

* *

* Gillette Flexball *

* * Venus Swirl

* Hair Care
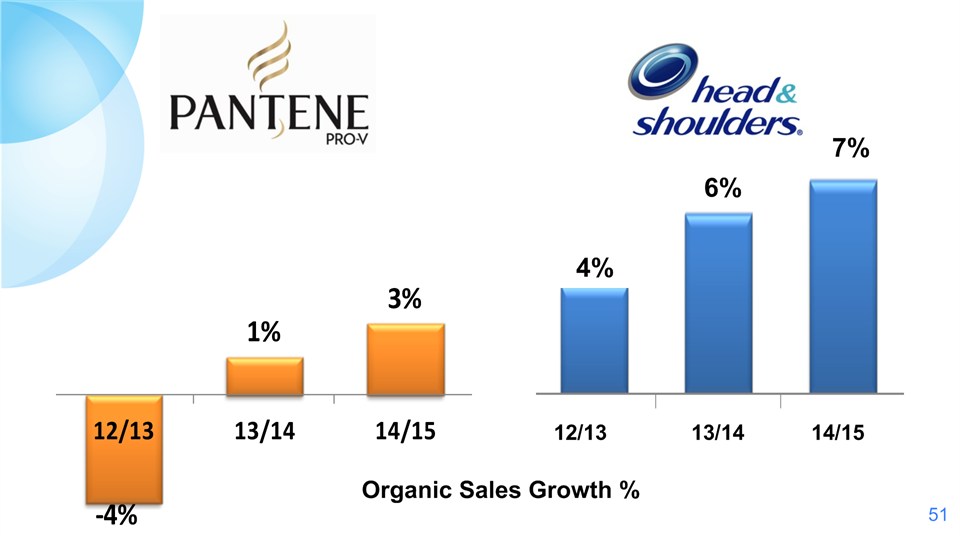
* Organic Sales Growth % 12/13 13/14 14/15 4% 6% 7%

* *

* *

* Personal Care +6% Organic Sales CAGR+21% AT Profit Growth Profit Sales *

*

* Beauty, Hair & Personal Care
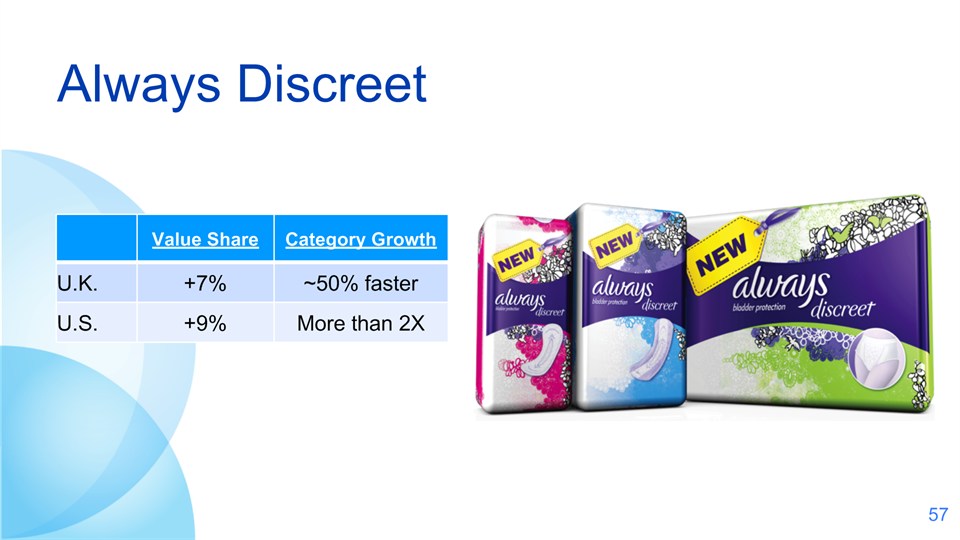
* Always Discreet Value Share Category Growth U.K. +7% ~50% faster U.S. +9% More than 2X *
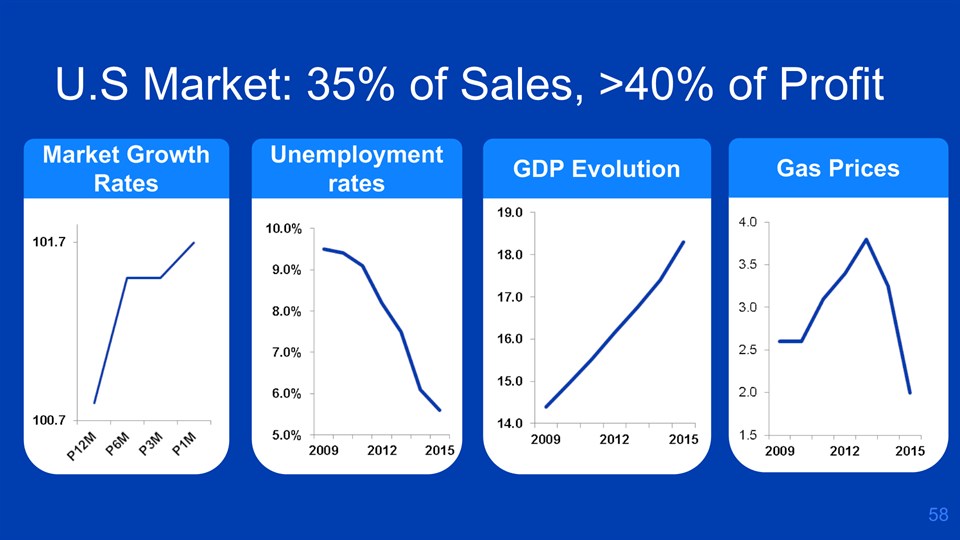
* U.S Market: 35% of Sales, >40% of Profit Market Growth Rates Unemployment rates GDP Evolution Gas Prices

* Forward Looking Statements Certain statements in this release or presentation, other than purely historical information, including estimates, projections, statements relating to our business plans, objectives and expected operating results, and the assumptions upon which those statements are based, are “forward-looking statements” within the meaning of the Private Securities Litigation Reform Act of 1995, Section 27A of the Securities Act of 1933, and Section 21E of the Securities Exchange Act of 1934. These forward-looking statements generally are identified by the words “believe,” “project,” “anticipate,” “estimate,” “expect,” “intend,” “strategy,” “future,” “opportunity,” “plan,” “may,” “should,” “will,” “would,” “will be,” “will continue,” “will likely result,” and similar expressions. Forward-looking statements are based on current expectations and assumptions, which are subject to risks and uncertainties that may cause results to differ materially from those expressed or implied in the forward-looking statements. We undertake no obligation to update or revise publicly any forward-looking statements, whether because of new information, future events or otherwise. Risks and uncertainties to which our forward-looking statements are subject include, without limitation: (1) the ability to successfully manage global financial, operational and manufacturing risks, including, among others, (a) an increasingly volatile economic environment, with potentially significant disruptions and reduced market growth rates, (b) foreign currency fluctuations, (c) significant credit or liquidity issues, (d) debt, currency exposure and repatriation issues in countries with currency exchange, import authorization or pricing controls (such as Venezuela, Argentina, China, India and Egypt), (e) maintaining key manufacturing and supply sources (including sole supplier and sole manufacturing plant arrangements), and (f) managing disruption of business due to factors outside of our control, such as natural disasters and acts of war or terrorism; (2) the ability to successfully manage cost fluctuations and pressures, including commodity prices, raw materials, labor costs, energy costs and pension and health care costs, and achieve cost savings described in our announced productivity plan; (3) the ability to stay on the leading edge of innovation, obtain necessary intellectual property protections and successfully respond to technological advances attained by, and patents granted to, competitors; (4) the ability to compete with our local and global competitors by successfully responding to competitive factors, including prices, promotional incentives and trade terms for products; (5) the ability to manage and maintain key customer relationships; (6) the ability to protect our reputation and brand equity by successfully managing real or perceived issues, including concerns about safety, quality, efficacy or similar matters that may arise; (7) the ability to successfully manage the financial, legal, reputational and operational risk associated with third party relationships, such as our suppliers, contractors and external business partners; (8) the ability to rely on and maintain key information technology systems and networks (including Company and third-party systems and networks) and maintain the security and functionality of such systems and networks and the data contained therein; (9) the ability to successfully manage regulatory, tax and legal requirements and matters (including, without limitation, product liability, intellectual property, price controls, import restrictions, accounting standards and environmental and tax policy) and to resolve pending matters within current estimates; (10) the ability to successfully manage our portfolio optimization strategy, as well as ongoing acquisition, divestiture and joint venture activities, to achieve the Company’s overall business strategy, without impacting the delivery of base business objectives; and (11) the ability to successfully achieve productivity improvements and manage ongoing organizational changes, while successfully identifying, developing and retaining particularly key employees, especially in key growth markets where the availability of skilled or experienced employees may be limited. For additional information concerning factors that could cause actual results to materially differ from those projected herein, please refer to our most recent 10-K, 10-Q and 8-K reports. *

* Regulations FD and G Disclosure For a full reconciliation, please visit:www.pg.com/investors *
The Procter & Gamble Company: Reg G Reconciliation of Non-GAAP measures
In accordance with the SEC's Regulation G, the following provides definitions of the non-GAAP measures used in Procter & Gamble's February 19, 2015 CAGNY Conference presentation and associated slides with the reconciliation to the most closely related GAAP measure. The measures provided are as follows:
|
1.
|
Organic Sales Growth—page 1
|
|
2.
|
Core EPS and Currency-neutral Core EPS—page 2
|
|
3.
|
Core Operating Profit Margin—page 3
|
|
4.
|
Core Gross Margin—page 3
|
|
5.
|
Adjusted Free Cash Flow—page 4
|
|
6.
|
Adjusted Free Cash Flow Productivity—page 4
|
1. Organic Sales Growth:
Organic sales growth is a non-GAAP measure of sales growth excluding the impacts of acquisitions, divestitures and foreign exchange from year-over-year comparisons. We believe this provides investors with a more complete understanding of underlying sales trends by providing sales growth on a consistent basis. Organic sales is also one of the measures used to evaluate senior management and is a factor in determining their at-risk compensation. The reconciliation of reported sales growth to organic sales is as follows:
|
Fiscal-Year-to-Date
December 31, 2014
|
Net Sales Growth
|
Foreign Exchange Impact
|
Acquisition/ Divestiture Impact*
|
Organic Sales Growth
|
|||
|
Total Company
|
(2)%
|
3%
|
1%
|
2%
|
|
Total Company
|
Net Sales Growth
|
Foreign Exchange Impact
|
Acquisition/ Divestiture Impact*
|
Organic Sales Growth
|
||||
|
FY 2015 (Estimate)
|
(3) to (4)%
|
5%
|
1%
|
Low-to-mid single digit
|
||||
*Acquisition/Divestiture Impact includes volume and mix impacts of acquired and divested businesses, as well as rounding impacts necessary to reconcile net sales to organic sales.
2. Core EPS and Currency-Neutral Core EPS: Core EPS is a measure of the Company's diluted net earnings per share from continuing operations excluding current year and prior year charges related to incremental restructuring due to increased focus on productivity and cost savings and current year charges for European legal matters and remeasuring certain Venezuela balance sheet items. We believe the Core EPS measure provides an important perspective of underlying business trends and results and provides a more comparable measure of year-on-year earnings per share growth. Core EPS is also one of the measures used to evaluate senior management and is a factor in determining their at-risk compensation.
Currency-neutral Core EPS is a measure of the Company's Core EPS excluding the impact of foreign exchange. We believe the currency-neutral Core EPS measure provides a more comparable view of year-on-year earnings per share growth.
The table below provides a reconciliation of diluted net earnings per share to Core EPS and Core EPS to Currency-neutral Core EPS:
|
Fiscal-Year-to-Date
December 31, 2014
|
Fiscal-Year-to-Date
December 31, 2013
|
||
|
Diluted Net Earnings Per Share from Continuing Operations
|
$ 2.00
|
$ 2.11
|
|
|
Incremental Restructuring
|
0.05
|
0.04
|
|
|
Charges for European Legal Matters
|
0.01
|
-
|
|
|
Venezuela balance sheet remeasurement
|
0.04
|
-
|
|
|
Rounding
|
-
|
0.01
|
|
|
Core EPS
|
$ 2.10
|
$ 2.16
|
|
|
Percentage change vs. prior period
|
-3%
|
||
|
Currency Impact to Earnings
|
0.22
|
||
|
Currency-Neutral Core EPS
|
$ 2.32
|
||
|
Percentage change vs. prior period
|
7%
|
Note – All reconciling items are presented net of tax. Tax effects are calculated consistent with the nature of the underlying transaction.
|
Total Company
|
Diluted EPS Growth
|
Impact of Incremental
Non-Core Items
|
Core EPS Growth
|
Foreign Exchange Impact
|
Currency-Neutral
Core EPS Growth
|
|||||
|
FY 2015 (Estimate)
|
Down mid-teens
|
Approximately 14%
|
In-line to down low-single digits
|
Approximately 12%
|
Double digit growth
|
3. Core Operating Profit Margin: This is a measure of the Company's Operating Margin adjusted for charges in both years for incremental restructuring due to increased focus on productivity and cost savings and current year charges for European legal matters and remeasuring certain Venezuela balance sheet items:
|
Fiscal-Year-to-Date
December 31, 2014
|
Fiscal-Year-to-Date
December 31, 2013
|
||
|
Operating Profit Margin
|
19.1%
|
20.0%
|
|
|
Incremental Restructuring
|
0.5%
|
0.4%
|
|
|
Charges for European Legal Matters
|
0.1%
|
-
|
|
|
Venezuela balance sheet remeasurement
|
0.3%
|
-
|
|
|
Rounding
|
0.1%
|
-
|
|
|
Core Operating Profit Margin
|
20.1%
|
20.4%
|
|
|
Basis point change
|
-30
|
||
4. Core Gross Margin: This is a measure of the Company's gross margin adjusted for charges in both years for incremental restructuring due to increased focus on productivity and cost savings:
|
Fiscal-Year-to-Date
December 31, 2014
|
Fiscal-Year-to-Date
December 31, 2013
|
||
|
Gross Margin
|
49.7%
|
49.9%
|
|
|
Incremental Restructuring
|
0.4%
|
0.3%
|
|
|
Core Gross Margin
|
50.1%
|
50.2%
|
|
|
Basis point change
|
-10
|
||
5. Adjusted Free Cash Flow: Adjusted free cash flow is defined as operating cash flow less capital spending excluding tax payments for certain significant divestitures. We view adjusted free cash flow as an important measure because it is one factor used in determining the amount of cash available for dividends and discretionary investment. The reconciliation of adjusted free cash flow is provided below:
|
Operating Cash Flow
|
Capital Spending
|
Tax Payment on Divestitures
|
Adjusted
Free Cash Flow
|
|
|
FY 2014
|
13,958
|
(3,848)
|
10,110
|
|
|
FY 2013
|
14,873
|
(4,008)
|
10,865
|
|
|
FY 2012
|
13,284
|
(3,964)
|
519
|
9,839
|
|
FY 2011
|
13,330
|
(3,306)
|
10,024
|
|
|
FY 2010
|
16,131
|
(3,067)
|
980
|
14,044
|
|
FY 2009
|
14,919
|
(3,238)
|
11,681
|
|
|
FY 2008
|
15,008
|
(3,046)
|
11,962
|
|
|
FY 2007
|
13,435
|
(2,945)
|
10,490
|
|
|
FY 2006
|
11,375
|
(2,667)
|
8,708
|
6. Adjusted Free Cash Flow Productivity: Adjusted free cash flow productivity is defined as the ratio of adjusted free cash flow to net earnings excluding impairment charges and certain significant divestiture gains. The Company's long-term target is to generate annual free cash flow at or above 90 percent of net earnings. Adjusted free cash flow productivity is also a measure used to evaluate senior management and is a factor in determining their at-risk compensation. The reconciliation of adjusted free cash flow productivity is provided below:
|
Adjusted Free Cash Flow
|
Net Earnings
|
Divestiture Gain
|
Impairment
|
Net Earnings Excl. Gain and Impairment
|
Adjusted Free Cash Productivity
|
|
|
FY 2014
|
10,110
|
11,785
|
11,785
|
86%
|
||
|
FY 2013
|
10,865
|
11,402
|
11,402
|
95%
|
||
|
FY 2012
|
9,839
|
10,904
|
1,418
|
(1,503)
|
10,989
|
90%
|
|
FY 2011
|
10,024
|
11,927
|
11,927
|
84%
|
||
|
FY 2010
|
14,044
|
12,846
|
1,585
|
11,261
|
125%
|
|
|
FY 2009
|
11,681
|
13,436
|
2,011
|
11,425
|
102%
|
|
|
FY 2008
|
11,962
|
12,075
|
12,075
|
99%
|
||
|
FY 2007
|
10,490
|
10,340
|
10,340
|
101%
|
||
|
FY 2006
|
8,708
|
8,684
|
8,684
|
100%
|