Attached files
| file | filename |
|---|---|
| EX-23.1 - EXHIBIT 23.1 - Kraft Foods Group, Inc. | krft10-k2014exx231.htm |
| EX-32.1 - EXHIBIT 32.1 - Kraft Foods Group, Inc. | krft10-k2014exx321.htm |
| EX-21.1 - EXHIBIT 21.1 - Kraft Foods Group, Inc. | krft10-k2014exx211.htm |
| EX-10.22 - EXHIBIT 10.22 - Kraft Foods Group, Inc. | krft10-k2014exx1022.htm |
| EX-10.21 - EXHIBIT 10.21 - Kraft Foods Group, Inc. | krft10-k2014exx1021.htm |
| EX-31.1 - EXHIBIT 31.1 - Kraft Foods Group, Inc. | krft10-k2014exx311.htm |
| EX-10.20 - EXHIBIT 10.20 - Kraft Foods Group, Inc. | krft10-k2014exx1020.htm |
| EX-10.7 - EXHIBIT 10.7 - Kraft Foods Group, Inc. | krft10-k2014exx107.htm |
| EX-10.4 - EXHIBIT 10.4 - Kraft Foods Group, Inc. | krft10-k2014exx104.htm |
| EX-10.19 - EXHIBIT 10.19 - Kraft Foods Group, Inc. | krft10-k2014exx1019.htm |
| EX-10.10 - EXHIBIT 10.10 - Kraft Foods Group, Inc. | krft10-k2014exx1010.htm |
| EXCEL - IDEA: XBRL DOCUMENT - Kraft Foods Group, Inc. | Financial_Report.xls |
| EX-31.2 - EXHIBIT 31.2 - Kraft Foods Group, Inc. | krft10-k2014exx312.htm |
UNITED STATES
SECURITIES AND EXCHANGE COMMISSION
WASHINGTON, D.C. 20549
FORM 10-K
(Mark One)
ý | ANNUAL REPORT PURSUANT TO SECTION 13 OR 15(d) OF THE SECURITIES EXCHANGE ACT OF 1934 |
For the fiscal year ended December 27, 2014
OR
¨ | TRANSITION REPORT PURSUANT TO SECTION 13 OR 15(d) OF THE SECURITIES EXCHANGE ACT OF 1934 |
For the transition period from to
Commission file number 1-35491

Kraft Foods Group, Inc.
(Exact name of registrant as specified in its charter)
Virginia | 36-3083135 |
(State or other jurisdiction of incorporation or organization) | (I.R.S. Employer Identification No.) |
Three Lakes Drive, Northfield, Illinois | 60093-2753 |
(Address of principal executive offices) | (Zip Code) |
Registrant’s telephone number, including area code: (847) 646-2000
Securities registered pursuant to Section 12(b) of the Act:
Title of each class | Name of each exchange on which registered | |
Common Stock, no par value | The NASDAQ Stock Market LLC | |
Securities registered pursuant to Section 12(g) of the Act: None
Indicate by check mark if the registrant is a well-known seasoned issuer, as defined in Rule 405 of the Securities Act.
Yes ý No ¨
Indicate by check mark if the registrant is not required to file reports pursuant to Section 13 or Section 15(d) of the Act.
Yes ¨ No ý
Note: Checking the box above will not relieve any registrant required to file reports pursuant to Section 13 or 15(d) of the Exchange Act from their obligations under those sections.
Indicate by check mark whether the registrant (1) has filed all reports required to be filed by Section 13 or 15(d) of the Securities Exchange Act of 1934 during the preceding 12 months (or for such shorter period that the registrant was required to file such reports), and (2) has been subject to such filing requirements for the past 90 days. Yes ý No ¨
Indicate by check mark whether the registrant has submitted electronically and posted on its corporate Web site, if any, every Interactive Data File required to be submitted and posted pursuant to Rule 405 of Regulation S-T (§ 232.405 of this chapter) during the preceding 12 months (or for such shorter period that the registrant was required to submit and post such files). Yes ý No ¨
Indicate by check mark if disclosure of delinquent filers pursuant to Item 405 of Regulation S-K (§ 229.405 of this chapter) is not contained herein, and will not be contained, to the best of registrant's knowledge, in definitive proxy or information statements incorporated by reference in Part III of this Form 10-K or any amendment to this Form 10-K. ý
Indicate by check mark whether the registrant is a large accelerated filer, an accelerated filer, a non-accelerated filer, or a smaller reporting company. See the definitions of “large accelerated filer,” “accelerated filer” and “smaller reporting company” in Rule 12b-2 of the Exchange Act. (Check one):
Large accelerated filer ý Accelerated filer ¨ Non-accelerated filer ¨ Smaller reporting company ¨
(Do not check if smaller reporting company)
Indicate by check mark whether the registrant is a shell company (as defined in Rule 12b-2 of the Exchange
Act). Yes ¨ No ý
Act). Yes ¨ No ý
The aggregate market value of the shares of common stock held by non-affiliates of the registrant, computed by reference to the closing price of such stock as of the last business day of the registrant's most recently completed second quarter, was $35 billion. At February 10, 2015, there were 587,988,695 shares of the registrant’s common stock outstanding.
Documents Incorporated by Reference
Portions of the registrant's definitive proxy statement to be filed with the Securities and Exchange Commission in connection with its annual meeting of shareholders expected to be held on May 5, 2015 are incorporated by reference into Part III hereof.
Kraft Foods Group, Inc
Page No. | ||
Part I - | ||
Item 1. | ||
Item 1A. | ||
Item 1B. | ||
Item 2. | ||
Item 3. | ||
Item 4. | ||
Part II - | ||
Item 5. | ||
Item 6. | ||
Item 7. | ||
Item 7A. | ||
Item 8. | ||
Item 9. | ||
Item 9A. | ||
Item 9B. | ||
Part III - | ||
Item 10. | ||
Item 11. | ||
Item 12. | ||
Item 13. | ||
Item 14. | ||
Part IV - | ||
Item 15. | ||
S-1 | ||
In this report, “Kraft Foods Group,” “we,” “us,” and “our” refers to Kraft Foods Group, Inc.
i
Forward-looking Statements
This report contains a number of forward-looking statements. Words such as “anticipate,” “estimate,” “expect,” “plan,” “believe,” “may,” “will,” and variations of such words and similar expressions are intended to identify our forward-looking statements. You are cautioned not to place undue reliance on these forward-looking statements, which speak only as of the date on which they are made. Examples of forward-looking statements include, but are not limited to, statements, beliefs, and expectations regarding our business, customers, consumers, dividends, projected market performance of our common stock related to performance share awards, new accounting pronouncements and accounting changes, commodity costs, cost savings initiatives, hedging activities, legal matters, goodwill and other intangible assets, price volatility and cost environment, liquidity, funding sources, postemployment benefit plans, including expected contributions, obligations, rates of return and costs, capital expenditures and funding, debt, off-balance sheet arrangements and contractual obligations, general views about future operating results, our risk management program, and other events or developments that we expect or anticipate will occur in the future.
These forward-looking statements are not guarantees of future performance and are subject to a number of risks and uncertainties, many of which are beyond our control. We discuss certain factors that affect our business and operations and that may cause our actual results to differ materially from these forward-looking statements under “Risk Factors” below in this Annual Report on Form 10-K. These factors include, but are not limited to, increased competition; our ability to maintain, extend and expand our reputation and brand image; our ability to differentiate our products from other brands; increasing consolidation of retail customers; changes in relationships with our significant customers and suppliers; our ability to predict, identify and interpret changes in consumer preferences and demand; our ability to drive revenue growth in our key product categories, increase our market share, or add products; an impairment of goodwill or other indefinite-lived intangible assets; volatility in commodity, energy and other input costs; changes in our management team or other key personnel; our geographic focus in North America; changes in regulations; legal claims or other regulatory enforcement actions; product recalls or product liability claims; unanticipated business disruptions; our ability to complete or realize the benefits from potential acquisitions, alliances, divestitures or joint ventures; our indebtedness and our ability to pay our indebtedness; disruptions in our information technology networks and systems; our inability to protect our intellectual property rights; weak economic conditions; tax law changes; volatility of market-based impacts to postemployment benefit plans; pricing actions; and other factors. We disclaim and do not undertake any obligation to update or revise any forward-looking statement in this report, except as required by applicable law or regulation.
PART I
Item 1. Business.
General
Kraft Foods Group is one of the largest consumer packaged food and beverage companies in North America and worldwide, with net revenues of $18.2 billion and earnings before income taxes of $1.4 billion in 2014. We manufacture and market food and beverage products, including cheese, meats, refreshment beverages, coffee, packaged dinners, refrigerated meals, snack nuts, dressings, and other grocery products, primarily in the United States and Canada, under a host of iconic brands. Our product categories span breakfast, lunch, and dinner meal occasions. At December 27, 2014, we had assets of $22.9 billion. We are listed on the NASDAQ Stock Market and included in the Standard & Poor’s 500 and the NASDAQ - 100 indices.
Our diverse brand portfolio consists of many of the most popular food brands in North America, including three brands with annual net revenues exceeding $1 billion each—Kraft cheeses, dinners, and dressings; Oscar Mayer meats; and Philadelphia cream cheese—plus over 25 brands with annual net revenues between $100 million and $1 billion each. In the United States, based on dollar share in 2014, we hold the number one branded market share position in 11 of our top 17 product categories and the number two branded market share position in the remaining six product categories. The 11 product categories with the number one branded share position contributed more than 50% of our 2014 U.S. retail net revenues while our top 17 product categories contributed more than 80% of our 2014 U.S. retail net revenues.
We were initially organized as a Delaware corporation in 1980. In March 2012, we redomesticated to Virginia and changed our name from “Kraft Foods Global, Inc.” to “Kraft Foods Group, Inc.” On October 1, 2012, Mondelēz International, Inc. ("Mondelēz International," formerly known as Kraft Foods Inc.) spun-off Kraft Foods Group to Mondelēz International’s shareholders (the “Spin-Off”). We were a wholly-owned subsidiary of Mondelēz
1
International prior to the Spin-Off. To effect the Spin-Off, Mondelēz International distributed all of the shares of Kraft Foods Group common stock owned by Mondelēz International to its shareholders on October 1, 2012. As a result of the Spin-Off, we began operating as an independent, publicly traded company on October 1, 2012.
Reportable Segments
We manage and report our operating results through six reportable segments: Cheese, Refrigerated Meals, Beverages, Meals & Desserts, Enhancers & Snack Nuts, and Canada. Our remaining businesses, including our Foodservice and Exports businesses, are aggregated and disclosed as “Other Businesses”.
Our principal brands and products at December 27, 2014 were:
Cheese | Kraft and Cracker Barrel natural cheeses; Philadelphia cream cheese; Kraft and Deli Deluxe processed cheese slices; Velveeta and Cheez Whiz processed cheeses; Kraft grated and shredded cheeses; Polly-O and Athenos cheeses; and Breakstone’s and Knudsen cottage cheese and sour cream. | |
Refrigerated Meals | Oscar Mayer cold cuts, hot dogs, bacon, and P3 Portable Protein Packs; Lunchables lunch combinations; Claussen pickles; and Boca meat alternatives. | |
Beverages | Maxwell House, Gevalia, and Yuban coffees; Tassimo hot beverage system (under license); Capri Sun (under license) and Kool-Aid packaged juice drinks; Crystal Light, Kool-Aid, and Country Time powdered beverages; and MiO, Crystal Light, and Kool-Aid liquid concentrates. | |
Meals & Desserts | Kraft and Kraft Deluxe macaroni and cheese dinners;Velveeta shells and cheese dinners; JELL-O dry packaged desserts; JELL-O refrigerated gelatin and pudding snacks; Cool Whip whipped topping; Stove Top stuffing mix; Jet-Puffed marshmallows; Velveeta Cheesy Skillets and Taco Bell Home Originals (under license) meal kits; Shake ‘N Bake coatings; and Baker’s chocolate and baking ingredients. | |
Enhancers & Snack Nuts | Planters nuts and trail mixes; Kraft Mayo and Miracle Whip spoonable dressings; Kraft and Good Seasons salad dressings; A.1. sauce; Kraft and Bull’s-Eye barbecue sauces; and Grey Poupon premium mustards. | |
Canada | Canadian brand offerings include Kraft peanut butter and Nabob coffee, as well as a range of products bearing brand names similar to those marketed in the U.S. | |
Other Businesses | Our other businesses, including our Foodservice and Exports businesses, sell primarily branded products including Philadelphia cream cheese, A.1. sauce, and a broad array of Kraft sauces, dressings and cheeses. | |
Net Revenues by Product Category
Product categories that contributed 10% or more to consolidated net revenues for the years ended December 27, 2014, December 28, 2013, or December 29, 2012, were:
For the Years Ended | |||||||||
December 27, 2014 | December 28, 2013 | December 29, 2012 | |||||||
Cheese and dairy | 33 | % | 32 | % | 31 | % | |||
Meat and meat alternatives | 15 | % | 15 | % | 15 | % | |||
Meals | 11 | % | 11 | % | 11 | % | |||
Refreshment beverages | 10 | % | 10 | % | 10 | % | |||
Enhancers | 9 | % | 9 | % | 10 | % | |||
2
See Note 15, Segment Reporting, to the consolidated financial statements for net revenues, earnings before income taxes, and total assets by segment.
Customers
We sell our products primarily to supermarket chains, wholesalers, supercenters, club stores, mass merchandisers, distributors, convenience stores, drug stores, value stores, and other retail food outlets in the United States and Canada.
Our five largest customers accounted for approximately 42% of our net revenues in 2014. One of our customers, Wal-Mart Stores, Inc., accounted for approximately 26% of our net revenues in 2014.
Sales
Our direct customer teams work with the headquarter operations of our customers and manage our relationships. These teams collaborate on developing strategies for new item introduction, category and assortment management, shopper insights, shopper marketing, trade and promotional planning, and retail pricing solutions. We have dedicated headquarter teams covering all of our product lines for many of our largest customers, and we pool resources across our product lines to provide support to regional retailers.
Our breadth of product lines and scale throughout the retail environment are also supported primarily by two third-party sales agencies within our customers’ stores: Acosta Sales & Marketing for our grocery and mass channel customers and CROSSMARK for our convenience store retail partners. Both agencies act as extensions of our direct customer teams and are managed by our sales leadership. Both sales agencies provide in-store support of product placement, distribution, and promotional execution.
We also utilize exporters, distributors, consolidators, or other similar arrangements to sell and distribute our products outside of the United States and Canada.
Raw Materials and Packaging
We purchase and use large quantities of commodities, including dairy products, meat products, coffee beans, nuts, soybean and vegetable oils, sugar and other sweeteners, corn products and wheat to manufacture our products. In addition, we purchase and use significant quantities of resins and cardboard to package our products and natural gas to operate our facilities. For commodities that we use across many of our product categories, such as corrugated paper and energy, we coordinate sourcing requirements and centralize procurement to leverage our scale. In addition, some of our product lines and brands separately source raw materials that are specific to their operations.
We source these commodities from a variety of providers including large, international producers, and smaller, local independent sellers. We have preferred purchaser status and/or have developed strategic partnerships with many of our suppliers, and consequently enjoy favorable pricing and dependable supply for many of our commodities. The prices of raw materials and agricultural materials that we use in our products are affected by external factors, such as global competition for resources, currency fluctuations, severe weather or global climate change, consumer, industrial or investment demand, and changes in governmental regulation and trade, alternative energy, and agricultural programs.
The most significant cost components of our cheese products are dairy commodities, including milk and cheese. We purchase our dairy raw material requirements from independent third parties, such as agricultural cooperatives and independent processors. Market supply and demand, as well as government programs, significantly influence the prices for milk and other dairy products. The most significant cost component of our coffee products is coffee beans, which we purchase on world markets. Quality and availability of supply, currency fluctuations, and consumer demand for coffee products impact coffee bean prices. Significant cost components in our meat business include pork, beef, and poultry, which we primarily purchase from domestic markets. Livestock feed costs and the global supply and demand for U.S. meats influence the prices of these meat products. Additional significant cost components in our grocery products are grains (including wheat), sugar, and soybean oil.
Our risk management group works with our procurement teams to monitor worldwide supply and cost trends so we can obtain ingredients and packaging needed for production at competitive prices. Although the prices of our principal raw materials can be expected to fluctuate, we believe there will be an adequate supply of the raw materials we use and that they are generally available from numerous sources. Our risk management group uses a range of hedging techniques in an effort to limit the impact of price fluctuations on our principal raw materials.
3
However, we do not fully hedge against changes in commodity prices, and our hedging strategies may not protect us from increases in specific raw material costs. We actively monitor any changes to commodity costs so that we can seek to mitigate the effect through pricing and other operational measures.
Manufacturing and Processing
We manufacture our products in our network of manufacturing and processing facilities located throughout North America. As of December 27, 2014, we operated 36 manufacturing and processing facilities, 34 in the United States and two in Canada. We own all 36 of these facilities.
While some of our plants are dedicated to the production of specific products or brands, other plants can accommodate multiple product lines. We manufacture our Cheese products in 12 locations, our Refrigerated Meals products in nine locations, our Beverages products in eight locations, our Meals & Desserts products in 11 locations, and our Enhancers & Snack Nuts products in eight locations. We maintain all of our manufacturing and processing facilities in good condition and believe they are suitable and adequate for our present needs. We also enter into co-manufacturing arrangements with third parties if we determine it is advantageous to outsource the production of any of our products.
Distribution
As of December 27, 2014, we distributed our products through 36 distribution centers, of which 33 are in the United States and three are in Canada. We own four and lease 32 of these distribution centers. In addition, third-party logistics providers perform storage and distribution services for us to support our distribution network.
We rely on common carriers to transport our products from our manufacturing and processing facilities to our distribution facilities and on to our customers. Our distribution facilities generally accommodate all of our product lines and have the capacity to store refrigerated, dry, and frozen goods. We assemble customer orders for multiple products at the distribution facilities and deliver them by common carrier to our customers. We maintain all of our distribution facilities in good condition and believe they have sufficient capacity to meet our expected distribution needs.
Competition
We face competition in all aspects of our business. Competitors include large national and international companies and numerous local and regional companies. We also compete with generic products and retailer brands, wholesalers, and cooperatives. We compete primarily on the basis of product quality and innovation, brand recognition and loyalty, service, the ability to identify and satisfy consumer preferences, the introduction of new products and the effectiveness of our advertising campaigns and marketing programs, and price. Improving our market position or introducing a new product requires substantial advertising and promotional expenditures.
Trademarks and Intellectual Property
Our trademarks are material to our business and are among our most valuable assets. Some of our significant trademarks include A.1., Baker’s, Cheez Whiz, Cool Whip, Country Time, Cracker Barrel, Crystal Light, Grey Poupon, JELL-O, Kool-Aid, Kraft, Lunchables, MiO, Miracle Whip, Oscar Mayer, Planters, Shake ‘N Bake, Stove Top, and Velveeta. We own the rights to these trademarks in the United States, Canada, and many other countries throughout the world. In addition, we own the trademark rights to Philadelphia in the United States and the Caribbean, and to Gevalia and Maxwell House throughout North America and Latin America. We protect our trademarks by registration or otherwise in the United States, Canada, and other markets. From time to time, we grant third parties licenses to use one or more of our trademarks in particular locations. Similarly, as of December 27, 2014, we sell some products under brands we license from third parties, including:
• | Capri Sun packaged drink pouches for sale in the United States; |
• | McCafé ground, whole bean and on-demand single cup coffees; and |
• | Taco Bell Home Originals Mexican-style food products for sale in U.S. grocery stores. |
In connection with the Spin-Off, we granted Mondelēz International licenses to use some of our trademarks in particular locations outside of the United States and Canada and we also may sell some products under brands we license from Mondelēz International.
Additionally, we own numerous patents worldwide. We consider our portfolio of patents, patent applications, patent licenses under patents owned by third parties, proprietary trade secrets, technology, know-how processes, and
4
related intellectual property rights to be material to our operations. While our patent portfolio is material to our business, the loss of one patent or a group of related patents would not have a material adverse effect on our business. We either have been issued patents or have patent applications pending that relate to a number of current and potential products, including products licensed to others. Patents, issued or applied for, cover inventions ranging from basic packaging techniques to processes relating to specific products and to the products themselves.
Our issued patents extend for varying periods according to the date of the patent application filing or grant and the legal term of patents in the various countries where patent protection is obtained. The actual protection afforded by a patent, which can vary from country to country, depends upon the type of patent, the scope of its coverage as determined by the patent office or courts in the country, and the availability of legal remedies in the country. In connection with the Spin-Off, we granted Mondelēz International licenses to use some of our patents, and we also license certain patents from Mondelēz International.
Research and Development
Our research and development focuses on achieving the following four objectives:
• | growth through product improvements and renovations, new products, and line extensions, |
• | uncompromising product safety and quality, |
• | superior customer satisfaction, and |
• | cost reduction. |
Our research and development specialists have historically focused on both major product innovation and more modestly-scaled line extensions, such as the introduction of new flavors, colors, or package designs for established products. We have approximately 600 food scientists, chemists, and engineers, with teams dedicated to particular brands and products.
We maintain three key technology centers, each equipped with pilot plants and state-of-the-art instruments. Research and development expense was approximately $149 million in 2014, $142 million in 2013, and $143 million in 2012. The amounts disclosed in prior periods have been revised to conform with the current year presentation.
Seasonality
Overall sales of our products are fairly balanced throughout the year, although demand for certain products may be influenced by holidays, changes in seasons, or other annual events.
Employees
We have approximately 22,100 employees, of whom approximately 20,100 are located in the United States and approximately 2,000 are located in Canada. Approximately one-third of our hourly employees are represented under contracts primarily with the United Food and Commercial Workers International Union and the International Brotherhood of Teamsters. These contracts expire at various times throughout the next several years. We believe that our relationships with employees and their representative organizations are generally good.
Regulation
Our U.S. food and beverage products and packaging materials are primarily regulated by the U.S. Food and Drug Administration or, for products containing meat and poultry, the U.S. Food Safety and Inspection Service of the U.S. Department of Agriculture. Our Canadian food products and packaging materials are primarily regulated by the Canadian Food Inspection Agency and Health Canada. These agencies enact and enforce regulations relating to the manufacturing, distribution, and labeling of food products.
The U.S. Food Safety Modernization Act and the Safe Food for Canadians Act, both of which became laws in 2011, provide additional food safety authority to the applicable regulatory agency. We do not expect the cost of complying with these laws, and the implementing regulations expected to result from these laws, to be material.
In addition, various U.S. states and Canadian provinces regulate our operations by licensing plants, enforcing standards for selected food products, grading food products, inspecting plants and warehouses, regulating trade practices related to the sale of dairy products, and imposing their own labeling requirements on food products. Many of the food commodities we use in our operations are subject to governmental agricultural programs. These
5
programs have substantial effects on prices and supplies and are subject to periodic governmental and administrative review.
Environmental Regulation
We are subject to various federal, provincial, state, and local laws and regulations in the United States and Canada relating to the protection of the environment, including those governing discharges to air and water, the management and disposal of hazardous materials, and the cleanup of contaminated sites.
These laws and regulations include the Clean Air Act, the Clean Water Act, the Resource Conservation and Recovery Act, and the Comprehensive Environmental Response, Compensation, and Liability Act (“CERCLA”). CERCLA imposes joint and severable liability on each potentially responsible party. As of December 27, 2014, we were involved in 56 active proceedings in the United States under CERCLA (and other similar state actions and legislation) related to our current operations and certain closed, inactive, or divested operations for which we retain liability. We do not currently expect these to have a material effect on our earnings or financial condition.
As of December 27, 2014, we had accrued an amount we deemed appropriate for environmental remediation. Based on information currently available, we believe that the ultimate resolution of existing environmental remediation actions and our compliance in general with environmental laws and regulations will not have a material effect on our earnings or financial condition. However, it is difficult to predict with certainty the potential impact of future compliance efforts and environmental remedial actions and thus future costs associated with such matters may exceed current reserves.
Foreign Operations
We sell our products primarily to consumers in the United States and Canada, but also sell our products to many other countries and territories across the globe. We generated approximately 13% of our 2014 consolidated net revenues and 14% of our 2013 and 2012 consolidated net revenues outside the United States, primarily in Canada. For additional information about our foreign operations, see Note 15, Segment Reporting, to the consolidated financial statements.
Executive Officers of the Registrant
The following are our executive officers as of February 19, 2015:
Name | Age | Title | |||
John T. Cahill | 57 | Chairman and Chief Executive Officer | |||
Georges El-Zoghbi | 48 | Chief Operating Officer | |||
Diane Johnson May | 56 | Executive Vice President, Human Resources | |||
Christopher J. Kempczinski | 46 | Executive Vice President, Growth Initiatives and President of International | |||
Teri L. List-Stoll | 52 | Executive Vice President and Chief Financial Officer(1) | |||
Kim K. W. Rucker | 48 | Executive Vice President, Corporate & Legal Affairs, General Counsel and Corporate Secretary | |||
(1) Ms. List-Stoll will be leaving this role effective February 28, 2015.
Mr. Cahill was appointed as our Chairman and Chief Executive Officer effective December 28, 2014. Mr. Cahill had served as our non-executive Chairman from March 8, 2014 until this appointment. Prior to that, he served as our Executive Chairman since October 1, 2012. He joined Mondelēz International, a food and beverage company and our former parent, on January 2, 2012 as the Executive Chairman, North American Grocery, and served in that capacity until the Spin-Off. Prior to that, he served as an Industrial Partner at Ripplewood Holdings LLC, a private equity firm, from 2008 to 2011. Mr. Cahill spent nine years with The Pepsi Bottling Group, Inc., a beverage manufacturing company, most recently as Chairman and Chief Executive Officer from 2003 to 2006 and Executive Chairman until 2007. Mr. Cahill previously spent nine years with PepsiCo, Inc., a food and beverage company, in a variety of leadership positions. He currently serves as lead director of American Airlines Group and is also a director at Colgate-Palmolive Company.
Mr. El-Zoghbi has served as our Chief Operating Officer since February 10, 2015. He served as our Vice Chairman, Operations, R&D, Sales and Strategy from June 2014 until assuming his current role. He previously served as Executive Vice President and President, Cheese & Dairy and Exports from February 2013 until June 2014. Mr. El-Zoghbi served as Executive Vice President and President, Cheese and Dairy from October 1, 2012 to February
6
2013. Prior to that, he served as Mondelēz International’s President, Cheese and Dairy since October 2009. He also served as Mondelēz International's Vice President and Area Director, Kraft Foods Australia & New Zealand from October 2007 to September 2009.
Ms. Johnson May has served as our Executive Vice President, Human Resources since October 1, 2012. Prior to that, she served as Mondelēz International’s Senior Vice President, Human Resources, Kraft Foods North America since September 2010. She joined Mondelēz International in 1980 and has served in various roles, including Vice President, Human Resources at various Mondelēz International units from December 2006 to September 2010 and Senior Director, Human Resources from 2002 to 2006.
Mr. Kempczinski has served as our Executive Vice President, Growth Initiatives and President of International since February 10, 2015. He served as our Executive Vice President and President, Canada from January 2014 until assuming his current role. He previously served as Kraft Foods Group’s President, Canada from July 2012 until January 2014. From December 2008 until July 2012, he served as Mondelēz International’s Senior Vice President, Meals & Enhancers. Prior to joining Mondelēz International in December 2008, Mr. Kempczinski was Vice President, Non-Carbonated Beverages at PepsiCo, Inc.
Ms. List-Stoll has served as our Executive Vice President and Chief Financial Officer since December 29, 2013. She joined Kraft Foods Group on September 3, 2013 and served as Senior Vice President, Corporate Finance until assuming her current role. Prior to joining Kraft Foods Group, she worked for The Procter & Gamble Company for nearly 20 years, in various finance and accounting leadership positions. She had most recently served as Senior Vice President and Treasurer of Procter & Gamble from 2009 to 2013 and Vice President, Finance, Global Operations from 2007 to 2009. Ms. List-Stoll serves on the Board of Directors of Danaher Corporation and Microsoft Corporation.
Ms. Rucker has served as our Executive Vice President, Corporate & Legal Affairs, General Counsel and Corporate Secretary since October 1, 2012. She joined Mondelēz International as Executive Vice President, Corporate & Legal Affairs, Kraft Foods North America in September 2012. Prior to that, Ms. Rucker served as Senior Vice President, General Counsel and Chief Compliance Officer of Avon Products, Inc., a global manufacturer of beauty and related products, since March 2008 and as Corporate Secretary since February 2009. Ms. Rucker also served as Senior Vice President, Secretary and Chief Governance Officer of Energy Future Holdings Corp. (formerly TXU Corp.), an energy company, from 2004 to 2008.
Available Information
Our Web site address is www.kraftfoodsgroup.com. The information on our Web site is not, and shall not be deemed to be, a part of this Annual Report on Form 10-K or incorporated into any other filings we make with the Securities and Exchange Commission ("SEC"). Our Annual Reports on Form 10-K, Quarterly Reports on Form 10-Q, Current Reports on Form 8-K and amendments to those reports filed or furnished pursuant to Section 13(a) or 15(d) of the Securities Exchange Act of 1934 (the "Exchange Act") are or will be available free of charge on our Web site as soon as possible after we electronically file them with, or furnish them to, the SEC.
You can also read, access and copy any document that we file, including this Annual Report on Form 10-K, at the SEC’s Public Reference Room at 100 F Street, N.E., Washington, D.C. 20549. Call the SEC at 1-800-SEC-0330 for information on the operation of the Public Reference Room. In addition, the SEC maintains a Web site at www.sec.gov that contains reports, proxy and information statements, and other information regarding issuers, including Kraft Foods Group, that are electronically filed with the SEC.
Item 1A. Risk Factors.
You should read the following risk factors carefully in connection with evaluating our business and the forward-looking information contained in this Annual Report on Form 10-K. Any of the following risks could materially and adversely affect our business, financial condition, operating results and the actual outcome of matters described in this Annual Report on Form 10-K. While we believe we have identified and discussed below the key risk factors affecting our business, there may be additional risks and uncertainties that we do not presently know or that we do not currently believe to be significant that may adversely affect our business, financial condition, or operating results in the future.
We operate in a highly competitive industry.
The food and beverage industry is highly competitive across all of our product offerings. We compete based on
7
product innovation, price, product quality, brand recognition and loyalty, effectiveness of marketing and distribution, promotional activity, and the ability to identify and satisfy consumer preferences.
We may need to reduce our prices in response to competitive and customer pressures. These pressures may also restrict our ability to increase prices in response to commodity and other cost increases. We may also need to increase or reallocate spending on marketing, retail trade incentives, advertising, and new product innovation to maintain or increase market share. These expenditures are subject to risks, including uncertainties about trade and consumer acceptance of our efforts. If we are unable to compete effectively, our profitability, financial condition, and operating results may suffer.
Maintaining, extending and expanding our reputation and brand image are essential to our business success.
We have many iconic brands with long-standing consumer recognition. Our success depends on our ability to maintain brand image for our existing products, extend our brands to new platforms, and expand our brand image with new product offerings.
We seek to maintain, extend, and expand our brand image through marketing investments, including advertising and consumer promotions, and product innovation. Increasing attention on the role of food and beverage marketing could adversely affect our brand image. It could also lead to stricter regulations and greater scrutiny of marketing practices. Existing or increased legal or regulatory restrictions on our advertising, consumer promotions and marketing, or our response to those restrictions, could limit our efforts to maintain, extend and expand our brands. Moreover, adverse publicity about regulatory or legal action against us could damage our reputation and brand image, undermine our customers’ confidence and reduce long-term demand for our products, even if the regulatory or legal action is unfounded or not material to our operations.
In addition, our success in maintaining, extending, and expanding our brand image depends on our ability to adapt to a rapidly changing media environment. We increasingly rely on social media and online dissemination of advertising campaigns. The growing use of social and digital media increases the speed and extent that information or misinformation and opinions can be shared. Negative posts or comments about us, our brands or our products on social or digital media, whether or not valid, could seriously damage our brands and reputation. If we do not maintain, extend, and expand our brand image, then our product sales, financial condition and operating results could be materially and adversely affected.
We must leverage our brand value to compete against retailer brands and other economy brands.
In nearly all of our product categories, we compete with well-branded products as well as retailer and other economy brands. Our products must provide higher value and/or quality to our consumers than alternatives, particularly during periods of economic uncertainty. Consumers may not buy our products if relative differences in value and/or quality between our products and retailer or other economy brands change in favor of competitors’ products or if consumers perceive this type of change. If consumers prefer retailer or other economy brands, then we could lose market share or sales volumes or shift our product mix to lower margin offerings, which could materially and adversely affect our product sales, financial condition, and operating results.
The consolidation of retail customers could adversely affect us.
Retail customers, such as supermarkets, warehouse clubs, and food distributors in our major markets, may consolidate, resulting in fewer customers for our business. Consolidation also produces larger retail customers that may seek to leverage their position to improve their profitability by demanding improved efficiency, lower pricing, increased promotional programs, or specifically tailored products. In addition, larger retailers have the scale to develop supply chains that permit them to operate with reduced inventories or to develop and market their own retailer brands. Retail consolidation and increasing retailer power could materially and adversely affect our product sales, financial condition, and operating results.
Retail consolidation also increases the risk that adverse changes in our customers’ business operations or financial performance will have a corresponding material and adverse effect on us. For example, if our customers cannot access sufficient funds or financing, then they may delay, decrease, or cancel purchases of our products, or delay or fail to pay us for previous purchases, which could materially and adversely affect our product sales, financial condition, and operating results.
8
Changes in our relationships with significant customers or suppliers could adversely impact us.
During 2014, our five largest customers accounted for approximately 42% of our net revenues, with our largest customer, Wal-Mart Stores, Inc., accounting for approximately 26% of our net revenues. There can be no assurance that all significant customers will continue to purchase our products in the same mix or quantities or on the same terms as in the past, particularly as increasingly powerful retailers may demand lower pricing and focus on developing their own brands. The loss of a significant customer or a material reduction in sales or a change in the mix of products we sell to a significant customer could materially and adversely affect our product sales, financial condition, and operating results.
Disputes with significant suppliers, including disputes related to pricing or performance, could adversely affect our ability to supply products to our customers and could materially and adversely affect our product sales, financial condition, and operating results.
Our financial success depends on our ability to correctly predict, identify, and interpret changes in consumer preferences and demand, to offer new products to meet those changes, and to respond to competitive innovation.
Consumer preferences for food and beverage products change continually. Our success depends on our ability to predict, identify, and interpret the tastes and dietary habits of consumers and to offer products that appeal to consumer preferences. If we do not offer products that appeal to consumers, our sales and market share will decrease, which could materially and adversely affect our product sales, financial condition, and operating results.
We must distinguish between short-term fads, mid-term trends, and long-term changes in consumer preferences. If we do not accurately predict which shifts in consumer preferences will be long-term, or if we fail to introduce new and improved products to satisfy those preferences, our sales could decline. In addition, because of our varied consumer base, we must offer an array of products that satisfy the broad spectrum of consumer preferences. If we fail to expand our product offerings successfully across product categories, or if we do not rapidly develop products in faster growing and more profitable categories, demand for our products could decrease, which could materially and adversely affect our product sales, financial condition, and operating results.
Prolonged negative perceptions concerning the health implications of certain food products could influence consumer preferences and acceptance of some of our products and marketing programs. We strive to respond to consumer preferences and social expectations, but we may not be successful in our efforts. Continued negative perceptions and failure to satisfy consumer preferences could materially and adversely affect our product sales, financial condition, and operating results.
In addition, achieving growth depends on our successful development, introduction, and marketing of innovative new products and line extensions. Successful innovation depends on our ability to correctly anticipate customer and consumer acceptance, to obtain, protect and maintain necessary intellectual property rights, and to avoid infringing the intellectual property rights of others. We must also be able to respond successfully to technological advances by and intellectual property rights of our competitors, and failure to do so could compromise our competitive position and impact our financial results.
We may be unable to drive revenue growth in our key product categories, increase our market share, or add products that are in faster growing and more profitable categories.
The food and beverage industry’s overall growth is generally linked to population growth. Our future results will depend on our ability to drive revenue growth in our key product categories. Because our operations are concentrated in North America, where growth in the food and beverage industry has been limited, our success also depends in part on our ability to enhance our portfolio by adding innovative new products in faster growing and more profitable categories. Our future results will also depend on our ability to increase market share in our existing product categories. Our failure to drive revenue growth, limit market share decreases in our key product categories or develop innovative products for new and existing categories could materially and adversely affect our product sales, financial condition, and operating results.
An impairment of the carrying value of goodwill or other indefinite-lived intangible assets could negatively affect our consolidated operating results.
Goodwill and indefinite-lived intangible assets are initially recorded at fair value and are not amortized, but we test goodwill and indefinite-lived intangible assets for impairment at least annually in the fourth quarter or when a
9
triggering event occurs. The first step of our goodwill impairment test compares the reporting unit’s estimated fair value with its carrying value. We estimate a reporting unit’s fair value using planned growth rates, market-based discount rates, estimates of residual value, and estimates of market multiples. If the carrying value of a reporting unit’s net assets exceeds its fair value, the second step would be applied to measure the difference between the carrying value and implied fair value of goodwill. We determine fair value of indefinite-lived intangible assets using planned growth rates, market-based discount rates, and estimates of royalty rates. If the carrying values of goodwill or indefinite-lived intangible assets exceed their fair value, the goodwill or indefinite-lived intangible assets would be considered impaired and reduced to their fair value. An impairment of the carrying value of goodwill or other indefinite-lived intangible assets could negatively affect our operating results or net worth. As of December 27, 2014, we had $13.6 billion of goodwill and other indefinite-lived intangible assets, in aggregate, which represented approximately 59% of total assets.
Commodity, energy, and other input prices are volatile and may rise significantly.
We purchase and use large quantities of commodities, including dairy products, meat products, coffee beans, nuts, soybean and vegetable oils, sugar and other sweeteners, corn products and wheat to manufacture our products. In addition, we purchase and use significant quantities of resins and cardboard to package our products and natural gas to operate our facilities. We are also exposed to changes in oil prices, which influence both our packaging and transportation costs. Prices for commodities, other supplies, and energy are volatile and can fluctuate due to conditions that are difficult to predict, including global competition for resources, currency fluctuations, severe weather or global climate change, consumer, industrial or investment demand, and changes in governmental regulation and trade, alternative energy, and agricultural programs. Rising commodity, energy, and other input costs could materially and adversely affect our cost of operations, including the manufacture, transportation, and distribution of our products, which could materially and adversely affect our financial condition and operating results.
Although we monitor our exposure to commodity prices as an integral part of our overall risk management program, and seek to hedge against input price increases to the extent we deem appropriate, we do not fully hedge against changes in commodity prices, and our hedging strategies may not protect us from increases in specific raw materials costs. For example, hedging our costs for one of our key commodities, dairy products, is difficult because dairy futures markets are not as developed as many other commodities futures markets. Continued volatility or sustained increases in the prices of commodities and other supplies we purchase could increase the costs of our products, and our profitability could suffer. Moreover, increases in the prices of our products to cover these increased costs may result in lower sales volumes. If we are not successful in our hedging activities, or if we are unable to price our products to cover increased costs, then commodity and other input price volatility or increases could materially and adversely affect our financial condition and operating results.
We rely on our management team and other key personnel.
We depend on the skills, working relationships, and continued services of key personnel, including our experienced management team. In addition, our ability to achieve our operating goals depends on our ability to identify, hire, train, and retain qualified individuals. We compete with other companies both within and outside of our industry for talented personnel, and we may lose key personnel or fail to attract, train, and retain other talented personnel. Any such loss or failure could adversely affect our product sales, financial condition, and operating results.
Our geographic focus makes us particularly vulnerable to economic and other events and trends in North America.
We operate primarily in North America and, therefore, are particularly susceptible to adverse regulations, economic climate, consumer trends, market fluctuations, including commodity price fluctuations or supply shortages for certain of our key ingredients, and other adverse events that are specific to the United States and Canada. The concentration of our businesses in North America could present challenges and may increase the likelihood that an adverse event in North America would materially and adversely affect our product sales, financial condition, and operating results.
Changes in laws and regulations could increase our costs.
Our activities are highly regulated and subject to government oversight. Various federal, state, provincial, and local laws and regulations govern food and beverage production, storage, distribution, sales, and marketing, as well as licensing, trade, tax, and environmental matters. Governing bodies regularly issue new regulations and changes to existing regulations. Our need to comply with new or revised regulations or their interpretation and application could materially and adversely affect our product sales, financial condition, and operating results.
10
Legal claims or other regulatory enforcement actions could subject us to civil and criminal penalties.
As a large food and beverage company, we operate in a highly regulated environment with constantly evolving legal and regulatory frameworks. Consequently, we are subject to heightened risk of legal claims or other regulatory enforcement actions. Although we have implemented policies and procedures designed to ensure compliance with existing laws and regulations, there can be no assurance that our employees, contractors, or agents will not violate our policies and procedures. Moreover, a failure to maintain effective control processes could lead to violations, unintentional or otherwise, of laws and regulations. Legal claims or regulatory enforcement actions arising out of our failure or alleged failure to comply with applicable laws and regulations could subject us to civil and criminal penalties that could materially and adversely affect our product sales, reputation, financial condition, and operating results.
Product recalls or other product liability claims could materially and adversely affect us.
Selling products for human consumption involves inherent legal and other risks, including product contamination, spoilage, product tampering, allergens, or other adulteration. We could decide to, or be required to, recall products due to suspected or confirmed product contamination, adulteration, misbranding, tampering, or other deficiencies. Product recalls or market withdrawals could result in significant losses due to their costs, the destruction of product inventory, and lost sales due to the unavailability of the product for a period of time. We could be adversely affected if consumers lose confidence in the safety and quality of certain food products or ingredients, or the food safety system generally. Adverse attention about these types of concerns, whether or not valid, may damage our reputation, discourage consumers from buying our products, or cause production and delivery disruptions.
We may also suffer losses if our products or operations violate applicable laws or regulations, or if our products cause injury, illness, or death. In addition, our marketing could face claims of false or deceptive advertising or other criticism. A significant product liability or other legal judgment or a related regulatory enforcement action against us, or a significant product recall, may materially and adversely affect our reputation and profitability. Moreover, even if a product liability or fraud claim is unsuccessful, has no merit, or is not pursued, the negative publicity surrounding assertions against our products or processes could materially and adversely affect our product sales, financial condition, and operating results.
Unanticipated business disruptions could adversely affect our ability to provide our products to our customers.
We have a complex network of suppliers, owned manufacturing locations, co-manufacturing locations, distribution networks, and information systems that support our ability to consistently provide our products to our customers. Factors that are hard to predict or beyond our control, like weather, raw material shortage, natural disasters, fire or explosion, terrorism, generalized labor unrest, or health pandemics, could damage or disrupt our operations or our suppliers’ or co-manufacturers’ operations. These disruptions may require additional resources to restore our supply chain or distribution network. If we cannot respond to disruptions in our operations, whether by finding alternative suppliers or replacing capacity at key manufacturing or distribution locations, or are unable to quickly repair damage to our information, production, or supply systems, we may be late in delivering, or unable to deliver, products to our customers and may also be unable to track orders, inventory, receivables, and payables. If that occurs, our customers’ confidence in us and long-term demand for our products could decline. Any of these events could materially and adversely affect our product sales, financial condition, and operating results.
We may not successfully identify or complete strategic acquisitions, alliances, divestitures or joint ventures.
From time to time, we may evaluate acquisition candidates, alliances or joint ventures that may strategically fit our business objectives or we may consider divesting businesses that do not meet our strategic objectives or growth or profitability targets. These activities may present financial, managerial, and operational risks including, but not limited to, diversion of management’s attention from existing core businesses, difficulties integrating or separating personnel and financial and other systems, inability to effectively and immediately implement control environment processes across a diverse employee population, adverse effects on existing or acquired customer and supplier business relationships, and potential disputes with buyers, sellers or partners. In addition, to the extent we undertake acquisitions, alliances or joint ventures or other developments outside our core geography or in new categories, we may face additional risks related to such developments. For example, risks related to foreign operations include compliance with U.S. laws affecting operations outside of the United States, such as the Foreign Corrupt Practices Act, currency rate fluctuations, compliance with foreign regulations and laws, including tax laws, and exposure to politically and economically volatile developing markets. Any of these factors could materially and
11
adversely affect our product sales, financial condition, and operating results.
Volatility of capital markets or macro-economic factors could adversely affect our business.
Changes in financial and capital markets, including market disruptions, limited liquidity, and interest rate volatility, may increase the cost of financing as well as the risks of refinancing maturing debt. In addition, our borrowing costs can be affected by short and long-term ratings assigned by rating organizations. A decrease in these ratings could limit our access to capital markets and increase our borrowing costs, which could materially and adversely affect our financial condition and operating results.
Adverse changes in the capital markets or interest rates, differences or changes in actuarial assumptions from actual experience, and legislative or other regulatory actions could substantially increase our postemployment obligations and materially and adversely affect our profitability and operating results.
We sponsor a number of benefit plans for employees in the United States and Canada, including defined benefit pension plans, retiree health and welfare, active health care, severance, and other postemployment benefits. As of December 27, 2014, the projected benefit obligation of our defined benefit pension plans was $8.3 billion and these plans had assets of $7.2 billion. The difference between plan obligations and assets, or the funded status of the plans, significantly affects the net periodic benefit costs of our pension plans and the ongoing funding requirements of those plans. Among other factors, changes in interest rates, mortality rates, early retirement rates, investment returns, minimum funding requirements, and the market value of plan assets can affect the level of plan funding, cause volatility in the net periodic pension cost, and consequently volatility in our reported net income, and increase our future funding requirements. Legislative and other governmental regulatory actions may also increase funding requirements for our pension plans’ benefits obligation.
We estimate the 2015 pension contributions will be approximately $195 million. Volatile economic conditions increase the risk that we will be required to make additional cash contributions to the pension plans and recognize further increases in our net pension cost. A significant increase in our pension funding requirements could negatively affect our ability to invest in our business or pay dividends on our common stock.
Volatility in the market value of all or a portion of the derivatives we use to manage exposures to fluctuations in commodity prices may cause volatility in our operating results and net earnings.
We use commodity futures and options to partially hedge the price of certain input costs, including dairy products, coffee beans, meat products, wheat, corn products, soybean oils, sugar, and natural gas. For derivatives not designated as hedging instruments, changes in the values of these derivatives are currently recorded in earnings, resulting in volatility in both gross profits and net earnings. We report these gains and losses in cost of sales in our consolidated statements of earnings to the extent we utilize the underlying input in our manufacturing process. We report these gains and losses in the unallocated corporate items line in our segment operating results until we utilize the underlying input in our manufacturing process, at which time we reclassify the gains and losses to segment operating income. We may experience volatile earnings as a result of these accounting treatments.
We are significantly dependent on information technology.
We rely on information technology networks and systems, including the Internet, to process, transmit, and store electronic and financial information, to manage a variety of business processes and activities, and to comply with regulatory, legal, and tax requirements. We also depend on our information technology infrastructure for digital marketing activities and for electronic communications among our locations, personnel, customers, and suppliers. These information technology systems, some of which are managed by third parties, may be susceptible to damage, disruptions, or shutdowns due to hardware failures, computer viruses, hacker attacks, telecommunication failures, user errors, catastrophic events or other factors. If our information technology systems suffer severe damage, disruption, or shutdown and our business continuity plans do not effectively resolve the issues in a timely manner, we could experience business disruptions, transaction errors, processing inefficiencies, and the loss of customers and sales, causing our product sales, financial condition, and operating results to be adversely affected and the reporting of our financial results to be delayed.
In addition, if we are unable to prevent security breaches or disclosure of non-public information, we may suffer financial and reputational damage, litigation or remediation costs or penalties because of the unauthorized disclosure of confidential information belonging to us or to our partners, customers, consumers, or suppliers.
Our intellectual property rights are valuable, and any inability to protect them could reduce the value of our
12
products and brands.
We consider our intellectual property rights, particularly and most notably our trademarks, but also our patents, trade secrets, copyrights, and licensing agreements, to be a significant and valuable aspect of our business. We attempt to protect our intellectual property rights through a combination of patent, trademark, copyright, and trade secret laws, as well as licensing agreements, third-party nondisclosure and assignment agreements, and policing of third-party misuses of our intellectual property. Our failure to obtain or adequately protect our trademarks, products, new features of our products, or our technology, or any change in law or other changes that serve to lessen or remove the current legal protections of our intellectual property, may diminish our competitiveness and could materially harm our business.
We may be unaware of intellectual property rights of others that may cover some of our technology, brands, or products. Any litigation regarding patents or other intellectual property could be costly and time-consuming and could divert the attention of our management and key personnel from our business operations. Third-party claims of intellectual property infringement might also require us to enter into costly license agreements. We also may be subject to significant damages or injunctions against development and sale of certain products.
Our indebtedness levels could impact our business.
As of December 27, 2014, we had total debt of approximately $10 billion. Our ability to make payments on and to refinance our indebtedness, including any future debt that we may incur, will depend on our ability to generate cash from operations, financings, or asset sales. Our ability to generate cash is subject to general economic, financial, competitive, legislative, regulatory, and other factors that are beyond our control. We may not generate sufficient funds to service our debt and meet our business needs, such as funding working capital or the expansion of our operations. If we are not able to repay or refinance our debt as it becomes due, we may be forced to take disadvantageous actions, including reducing spending on marketing, retail trade incentives, advertising and product innovation, reducing financing in the future for working capital, capital expenditures and general corporate purposes, selling assets, or dedicating an unsustainable level of our cash flow from operations to the payment of principal and interest on our indebtedness. The lenders who hold our debt could also accelerate amounts due in the event that we default, which could potentially trigger a default or acceleration of the maturity of our other debt.
Our indebtedness could also impair our ability to obtain additional financing for working capital, capital expenditures, or general corporate purposes, especially if the ratings assigned to our debt securities by rating organizations were revised downward. In addition, our leverage could put us at a competitive disadvantage compared to less-leveraged competitors that could have greater financial flexibility to pursue strategic acquisitions and secure additional financing for their operations. Our ability to withstand competitive pressures and to react to changes in the food and beverage industry could be impaired, making us more vulnerable in the event of a general downturn in economic conditions, in our industry, or in our business.
Item 1B. Unresolved Staff Comments.
None.
Item 2. Properties.
Our corporate headquarters are located in Northfield, Illinois. Our headquarters are leased and house our executive offices, certain U.S. business units, and our administrative, finance, and human resource functions. We maintain additional owned and leased offices and three technology centers in the United States and Canada.
We have 36 manufacturing and processing facilities, of which 34 are in the United States and two are in Canada. We own all 36 of these facilities. It is our practice to maintain all of our plants and properties in good condition, and we believe they are suitable and adequate for our present needs.
We also have 36 distribution centers, of which 33 are in the United States and three are in Canada. We own four and lease 32 of these distribution centers. These facilities are in good condition, and we believe they have sufficient capacity to meet our present distribution needs.
Item 3. Legal Proceedings.
We are routinely involved in legal proceedings, claims, and governmental inquiries, inspections, or investigations (“Legal Matters”) arising in the ordinary course of our business.
13
We have been advised by the staff of the Commodity Futures Trading Commission (“CFTC”) that they are investigating activities related to the trading of December 2011 wheat futures contracts. These activities arose prior to the Spin-Off and involve the business now owned and operated by Mondelēz International or its affiliates. We are cooperating with the staff in its investigation. In October 2014, the staff advised us that the CFTC intends to commence a formal action. We and Mondelēz International continue to seek resolution of this matter. Our Separation and Distribution Agreement with Mondelēz International dated as of September 27, 2012, governs the allocation between Mondelēz International and us and, accordingly, Mondelēz International will predominantly bear the costs of this matter and any monetary penalties or other payments that the CFTC may impose. We do not expect this matter to have a material adverse effect on our financial condition or results of operations.
While we cannot predict with certainty the results of Legal Matters in which we are currently involved or may in the future be involved, we do not expect that the ultimate costs to resolve any of the Legal Matters that are currently pending will have a material adverse effect on our financial condition or results of operations.
Item 4. Mine Safety Disclosures.
Not applicable.
PART II
Item 5. Market for Registrant’s Common Equity, Related Stockholder Matters and Issuer Purchases of Equity Securities.
Our common stock is listed on the NASDAQ Global Select Market (“NASDAQ”). At February 10, 2015, there were approximately 65,000 holders of record of our common stock.
Information regarding our common stock high and low sales prices as reported on NASDAQ and dividends declared is included in Note 16, Quarterly Financial Data (Unaudited), to the consolidated financial statements.
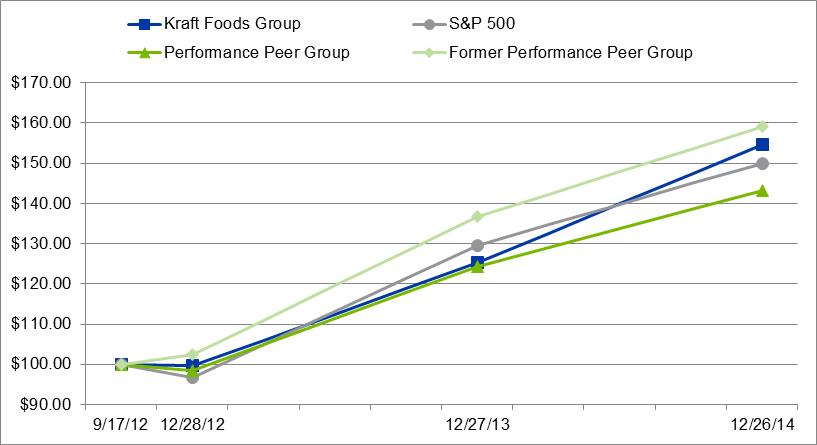
Comparison of Cumulative Total Return
The following graph compares the cumulative total return on our common stock with the cumulative total return of the Standard & Poor’s 500 Index and our performance peer group index. This graph covers the period from September 17, 2012 (the first day our common stock began “when-issued” trading on the NASDAQ) through December 26, 2014 (the last trading day of our 2014 fiscal year). The graph shows total shareholder return assuming $100 was invested on September 17, 2012 and dividends were reinvested.
14
Date | Kraft Foods Group | S&P 500 | Performance Peer Group | Former Performance Peer Group | ||||||||||||
September 17, 2012 | $ | 100.00 | $ | 100.00 | $ | 100.00 | $ | 100.00 | ||||||||
December 28, 2012 | 99.59 | 96.64 | 98.42 | 102.40 | ||||||||||||
December 27, 2013 | 125.20 | 129.60 | 124.25 | 136.73 | ||||||||||||
December 26, 2014 | 154.53 | 150.02 | 143.14 | 159.03 | ||||||||||||
In 2014, we selected a new Performance Peer Group, which is the same as our Compensation Benchmarking Peer Group and includes a broader spectrum of companies within our industry than in our Former Performance Peer Group. Our Performance Peer Group currently consists of the following companies: Altria Group Inc., Campbell Soup Company, Colgate-Palmolive Company, ConAgra Foods, Inc., General Mills, Inc., Hormel Foods Corporation, Kellogg Company, Keurig Green Mountain, Inc., Kimberly-Clark Corporation, McDonald’s Corporation, Mondelēz International, Inc., PepsiCo, Inc., The J.M. Smucker Company, Starbucks Corporation, The Coca-Cola Company, The Hershey Company, The Procter & Gamble Company, and Tyson Foods, Inc. Our Former Performance Peer Group consists of the companies in the Standard & Poor's Packaged Foods & Meats Index, as follows: Campbell Soup Company, ConAgra Foods, Inc., General Mills, Inc., The Hershey Company, Hormel Foods Corporation, Kellogg Company, Keurig Green Mountain, Inc., McCormick and Co. Inc., Mead Johnson Nutrition Company, Mondelēz International, Inc., The J.M. Smucker Company, and Tyson Foods, Inc. Companies included in the Standard & Poor's Packaged Foods & Meats Index change periodically. During 2014, Keurig Green Mountain, Inc. was added to the index and Archer Daniels Midland Company was excluded from the index.
The above performance graph shall not be deemed to be “soliciting material” or to be “filed” with the SEC or subject to Regulation 14A or 14C, or to the liabilities of Section 18 of the Exchange Act.
Issuer Purchases of Equity Securities during the Quarter ended December 27, 2014
Our share repurchase activity for the three months ended December 27, 2014 was:
Total Number of Shares(1) | Average Price Paid Per Share | Total Number of Shares Purchased as Part of Publicly Announced Program(2) | Dollar Value of Shares that May Yet be Purchased Under the Program(2) | |||||||||||
9/28/2014 - 10/25/2014 | 1,812,616 | $ | 55.94 | 1,697,190 | ||||||||||
10/26/2014 - 11/22/2014 | 1,219,402 | 57.63 | 1,207,147 | |||||||||||
11/23/2014 - 12/27/2014 | 966,953 | 60.23 | 954,280 | $ | 2,254,120,747 | |||||||||
For the Quarter Ended December 27, 2014 | 3,998,971 | 57.49 | 3,858,617 | |||||||||||
(1) Includes shares tendered by individuals who used shares to exercise options or to pay the related taxes for grants of restricted stock, restricted stock units, and performance based long-term incentive awards that vested.
(2) On December 17, 2013, our Board of Directors authorized a $3.0 billion share repurchase program with no expiration date. Under the share repurchase program, we are authorized to repurchase shares of our common stock in the open market or in privately negotiated transactions. The timing and amount of share repurchases are subject to management's evaluation of market conditions, applicable legal requirements, and other factors. We are not obligated to repurchase any shares of our common stock and may suspend the program at our discretion. As of December 27, 2014, we have repurchased approximately 13.1 million shares in the aggregate under this program since its inception.
15
Item 6. Selected Financial Data.
Kraft Foods Group, Inc.
Selected Financial Data – Five Year Review
December 27, 2014 | December 28, 2013 | December 29, 2012 (1) | December 31, 2011 (1) | December 31, 2010 (1) | ||||||||||||||||
(in millions of dollars, except per share data) | ||||||||||||||||||||
Year Ended: | ||||||||||||||||||||
Net revenues | $ | 18,205 | $ | 18,218 | $ | 18,271 | $ | 18,576 | $ | 17,739 | ||||||||||
Earnings from continuing operations | 1,043 | 2,715 | 1,642 | 1,775 | 1,890 | |||||||||||||||
Earnings and gain from discontinued operations, net of income taxes | — | — | — | — | 1,644 | |||||||||||||||
Net earnings | $ | 1,043 | $ | 2,715 | $ | 1,642 | $ | 1,775 | $ | 3,534 | ||||||||||
Earnings from continuing operations per share(2): | ||||||||||||||||||||
Basic | $ | 1.75 | $ | 4.55 | $ | 2.77 | $ | 3.00 | $ | 3.20 | ||||||||||
Diluted | $ | 1.74 | $ | 4.51 | $ | 2.75 | $ | 3.00 | $ | 3.20 | ||||||||||
Net cash provided by operating activities | $ | 2,020 | $ | 2,043 | $ | 3,035 | $ | 2,664 | $ | 828 | ||||||||||
Capital expenditures | 535 | 557 | 440 | 401 | 448 | |||||||||||||||
Depreciation and amortization | 385 | 393 | 428 | 364 | 354 | |||||||||||||||
As of: | ||||||||||||||||||||
Total assets | 22,947 | 23,148 | 23,179 | 21,389 | 21,448 | |||||||||||||||
Long-term debt(3) | 8,627 | 9,976 | 9,966 | 27 | 31 | |||||||||||||||
Total equity | 4,365 | 5,187 | 3,572 | 16,588 | 17,037 | |||||||||||||||
Dividends declared per share | $ | 2.15 | $ | 2.05 | $ | 0.50 | $ | — | $ | — | ||||||||||
(1) | Prior to the Spin-Off on October 1, 2012, our financial statements were prepared on a stand-alone basis and were derived from the consolidated financial statements and accounting records of Mondelēz International. Our financial statements for the years ended December 29, 2012, December 31, 2011 and December 31, 2010 included certain expenses of Mondelēz International that were allocated to us. These allocations were not necessarily indicative of the actual expenses we would have incurred as an independent public company or of the costs we will incur in the future, and may differ substantially from the allocations we agreed to in the various separation agreements. |
(2) | On October 1, 2012, Mondelēz International distributed 592 million shares of Kraft Foods Group common stock to Mondelēz International’s shareholders. Basic and diluted earnings per common share and the average number of common shares outstanding were retrospectively restated for the years ended December 31, 2011 and December 31, 2010 for the number of Kraft Foods Group shares outstanding immediately following the Spin-Off. |
(3) | Excludes current portion of long-term debt. |
Item 7. Management’s Discussion and Analysis of Financial Condition and Results of Operations.
The following discussion should be read in conjunction with the other sections of this Annual Report on Form 10-K, including the consolidated financial statements and related notes contained in Item 8.
Description of the Company
We manufacture and market food and beverage products, including cheese, meats, refreshment beverages, coffee, packaged dinners, refrigerated meals, snack nuts, dressings, and other grocery products, primarily in the United States and Canada. Our product categories span breakfast, lunch, and dinner meal occasions.
16
Consolidated Results of Operations
Summary of Results
For the Years Ended | |||||||||||||||||
December 27, 2014 | December 28, 2013 | December 29, 2012 | 2014 v. 2013 | 2013 v. 2012 | |||||||||||||
(in millions, except per share data) | |||||||||||||||||
Net revenues | $ | 18,205 | $ | 18,218 | $ | 18,271 | (0.1 | )% | (0.3 | )% | |||||||
Operating income | $ | 1,890 | $ | 4,591 | $ | 2,670 | (58.8 | )% | 71.9 | % | |||||||
Net earnings | $ | 1,043 | $ | 2,715 | $ | 1,642 | (61.6 | )% | 65.3 | % | |||||||
Diluted earnings per share | $ | 1.74 | $ | 4.51 | $ | 2.75 | (61.4 | )% | 64.0 | % | |||||||
Net Revenues
For the Years Ended | For the Years Ended | ||||||||||||||||||||
December 27, 2014 | December 28, 2013 | % Change | December 28, 2013 | December 29, 2012 | % Change | ||||||||||||||||
(in millions) | (in millions) | ||||||||||||||||||||
Net revenues | $ | 18,205 | $ | 18,218 | (0.1 | )% | $ | 18,218 | $ | 18,271 | (0.3 | )% | |||||||||
Impact of foreign currency | 156 | — | 0.9 | pp | 73 | — | 0.4 | pp | |||||||||||||
Sales to Mondelēz International | (134 | ) | (147 | ) | 0.1 | pp | (147 | ) | (114 | ) | (0.2 | )pp | |||||||||
Organic Net Revenues (1) | $ | 18,227 | $ | 18,071 | 0.9 | % | $ | 18,144 | $ | 18,157 | (0.1 | )% | |||||||||
Net pricing | 1.2 | pp | (0.6 | )pp | |||||||||||||||||
Volume/mix | (0.3 | )pp | 0.5 | pp | |||||||||||||||||
(1) | Organic Net Revenues is a non-GAAP financial measure. See the Non-GAAP Financial Measures section at the end of this item. |
Year Ended December 27, 2014 compared to Year Ended December 28, 2013
Net revenues were essentially flat. Organic Net Revenues increased by 0.9%, despite economic and consumer trends that continue to pressure the North American food and beverage industry. While we realized the benefit of significant pricing actions, our results also reflected the volume loss impact of those pricing actions. Higher net pricing (1.2 pp) was driven by commodity costs (primarily dairy), partially offset by increased promotional activity in Meals & Desserts and Beverages. Unfavorable volume/mix (0.3 pp) was driven by Meals & Desserts, reflecting changing consumer preferences and increased competitive activity, and Cheese, reflecting the volume loss from higher net pricing, mostly offset by favorable volume/mix in all other reportable segments.
Year Ended December 28, 2013 compared to Year Ended December 29, 2012
Net revenues and Organic Net Revenues were essentially flat as lower net pricing was generally offset by favorable volume/mix. Lower net pricing (0.6 pp) was due primarily to increased competitive activity in Beverages and Enhancers & Snack Nuts, partially offset by higher net pricing in Meals & Desserts and Refrigerated Meals. Favorable volume/mix (0.5 pp) was driven primarily by base business growth, despite an unfavorable product line pruning impact of approximately one percentage point.
17
Operating Income
Operating Income | Operating Income | 2014 v. 2013 | 2013 v. 2012 | ||||||||||
(in millions) | (percentage point) | ||||||||||||
Operating Income for the Years Ended December 28, 2013 and December 29, 2012 | $ | 4,591 | $ | 2,670 | |||||||||
Change in volume/mix | (97 | ) | 40 | (2.9 | ) pp | 1.2 | pp | ||||||
Higher / (lower) net pricing | 219 | (109 | ) | 6.6 | pp | (3.4 | ) pp | ||||||
(Higher) / lower product costs | (173 | ) | 72 | (5.2 | ) pp | 2.3 | pp | ||||||
Lower selling, general and administrative expenses | 200 | 131 | 6.1 | pp | 4.1 | pp | |||||||
Lower expenses for cost savings initiatives | 183 | 13 | 6.1 | pp | 0.8 | pp | |||||||
Change in unrealized gains / losses on hedging activities | (100 | ) | 8 | (3.1 | ) pp | 0.2 | pp | ||||||
Change in market-based impacts to postemployment benefit plans | (2,902 | ) | 1,784 | (65.4 | ) pp | 67.2 | pp | ||||||
Change in other | (31 | ) | (18 | ) | (1.0 | ) pp | (0.5 | ) pp | |||||
Operating Income for the Years Ended December 27, 2014 and December 28, 2013 | $ | 1,890 | $ | 4,591 | (58.8 | )% | 71.9 | % | |||||
Year Ended December 27, 2014 compared to Year Ended December 28, 2013
Higher product costs were driven by higher commodity costs (primarily dairy and packaging materials), partially offset by lower manufacturing costs driven by net productivity and favorable retirement-related benefit adjustments primarily resulting from lower-than-expected claims experience in 2014.
Lower selling, general and administrative expenses were driven primarily by lower marketing spending.
Cost savings initiatives expenses were $107 million in 2014 compared to $290 million in 2013. Cost savings initiatives are related to reorganization activities including severance, asset disposals, and other activities that do not qualify for special accounting treatment as exit or disposal activities. Included within cost savings initiatives are activities related to the previously disclosed multi-year restructuring program. For additional information about cost savings initiatives, see Note 5, Cost Savings Initiatives, to the consolidated financial statements.
Unrealized gains / losses on hedging activities, which includes unrealized gains and losses on our derivatives not designated as hedging instruments as well as the ineffective portion of unrealized gains and losses on our derivatives designated as hedging instruments, amounted to losses of $79 million in 2014 compared to gains of $21 million in 2013.
The $2,902 million unfavorable change in market-based impacts to postemployment benefit plans reflects 2014 losses of $1,341 million compared to 2013 gains of $1,561 million. The 2014 losses were due primarily to a 70 basis point weighted average decrease in the discount rate and an unfavorable impact from updated mortality assumptions, partially offset by excess asset returns. The 2013 gains were driven by an 80 basis point weighted average increase in the discount rate and excess asset returns, partially offset by unfavorable changes in actuarial assumptions.
Year Ended December 28, 2013 compared to Year Ended December 29, 2012
Lower product costs reflected lower manufacturing costs driven by net productivity, partially offset by higher commodity costs (primarily dairy and meat products).
Lower selling, general and administrative expenses reflected lower overhead costs driven by cost management efforts, partially offset by higher marketing spending and the costs of operating as an independent public company (which were not part of our cost profile in the first three quarters of 2012).
The $1,784 million favorable change in market-based impacts to postemployment benefit plans was due to 2013 gains of $1,561 million versus 2012 losses of $223 million. The 2013 gains were primarily driven by an 80 basis point weighted average increase in the discount rate and excess asset returns, partially offset by unfavorable changes in actuarial assumptions. The 2012 losses were due to unfavorable changes in actuarial assumptions, partially offset by excess asset returns.
18
Net Earnings and Diluted Earnings per Share
Net earnings decreased 61.6% to $1,043 million in 2014 and increased 65.3% to $2,715 million in 2013.
Diluted EPS | Diluted EPS | ||||||
Diluted EPS for the Years Ended December 28, 2013 and December 29, 2012 | $ | 4.51 | $ | 2.75 | |||
Change in results from operations | 0.16 | 0.14 | |||||
Lower expenses for cost savings initiatives, net of taxes | 0.18 | 0.02 | |||||
Change in unrealized gains / losses on hedging activities | (0.11 | ) | 0.01 | ||||
Change in market-based impacts to postemployment benefit plans, net taxes | (3.08 | ) | 1.90 | ||||
Change in interest and other expense, net | 0.02 | (0.27 | ) | ||||
Change in royalty income from Mondelēz International | — | (0.04 | ) | ||||
Change in taxes | 0.08 | 0.03 | |||||
Change in other | (0.02 | ) | (0.03 | ) | |||
Diluted EPS for the Years Ended December 27, 2014 and December 28, 2013 | $ | 1.74 | $ | 4.51 | |||
The increase in interest and other expense, net in 2013 compared to 2012 was due to the $6.0 billion debt issuance in June 2012, the $3.6 billion debt exchange in July 2012, and the $0.4 billion transfer of debt from Mondelēz International in October 2012. We incurred a full year of interest and other expense, net in 2013 compared to only a partial year in 2012 related to this debt.
Our effective tax rate was 25.8% in 2014, 33.6% in 2013, and 33.1% in 2012. See Note 12, Income Taxes, to the consolidated financial statements for a discussion of tax rates.
Results of Operations by Reportable Segment
We manage and report operating results through six reportable segments: Cheese, Refrigerated Meals, Beverages, Meals & Desserts, Enhancers & Snack Nuts, and Canada. Our remaining businesses, including our Foodservice and Exports businesses, are aggregated and disclosed as “Other Businesses”.
For the Years Ended | |||||||||||
December 27, 2014 | December 28, 2013 | December 29, 2012 | |||||||||
(in millions) | |||||||||||
Net revenues: | |||||||||||
Cheese | $ | 4,066 | $ | 3,925 | $ | 3,829 | |||||
Refrigerated Meals | 3,433 | 3,334 | 3,280 | ||||||||
Beverages | 2,627 | 2,681 | 2,718 | ||||||||
Meals & Desserts | 2,155 | 2,305 | 2,311 | ||||||||
Enhancers & Snack Nuts | 2,062 | 2,101 | 2,220 | ||||||||
Canada | 1,937 | 2,037 | 2,010 | ||||||||
Other Businesses | 1,925 | 1,835 | 1,903 | ||||||||
Net revenues | $ | 18,205 | $ | 18,218 | $ | 18,271 | |||||
19
For the Years Ended | |||||||||||
December 27, 2014 | December 28, 2013 | December 29, 2012 | |||||||||
(in millions) | |||||||||||
Operating income: | |||||||||||
Cheese | $ | 656 | $ | 634 | $ | 618 | |||||
Refrigerated Meals | 378 | 329 | 379 | ||||||||
Beverages | 384 | 349 | 260 | ||||||||
Meals & Desserts | 611 | 665 | 712 | ||||||||
Enhancers & Snack Nuts | 577 | 529 | 592 | ||||||||
Canada | 370 | 373 | 301 | ||||||||
Other Businesses | 263 | 227 | 180 | ||||||||
Market-based impacts to postemployment benefit plans | (1,341 | ) | 1,561 | (223 | ) | ||||||
Certain other postemployment benefit plan income / (expense) | 164 | 61 | (82 | ) | |||||||
Unrealized (losses) / gains on hedging activities | (79 | ) | 21 | 13 | |||||||
General corporate expenses | (93 | ) | (158 | ) | (80 | ) | |||||
Operating income | $ | 1,890 | $ | 4,591 | $ | 2,670 | |||||
Management uses segment operating income to evaluate segment performance and allocate resources. We believe it is appropriate to disclose this measure to help investors analyze segment performance and trends. Segment operating income excludes the following for each of the periods presented:
• | Market-based impacts and certain other components of our postemployment benefit plans (which are a component of cost of sales and selling, general and administrative expenses) because we centrally manage postemployment benefit plan funding decisions and the determination of discount rates, expected rate of return on plan assets, and other actuarial assumptions. |
• | Unrealized gains and losses on hedging activities (which are a component of cost of sales) in order to provide better transparency of our segment operating results. Unrealized gains and losses on hedging activities, which includes unrealized gains and losses on our derivatives not designated as hedging instruments as well as the ineffective portion of unrealized gains and losses on our derivatives designated as hedging instruments, are recorded in Corporate until realized. Once realized, the gains and losses are recorded within the applicable segment operating results. |
• | Certain general corporate expenses (which are a component of selling, general and administrative expenses). |
Cheese
For the Years Ended | For the Years Ended | ||||||||||||||||||||
December 27, 2014 | December 28, 2013 | % Change | December 28, 2013 | December 29, 2012 | % Change | ||||||||||||||||
(in millions) | (in millions) | ||||||||||||||||||||
Net revenues | $ | 4,066 | $ | 3,925 | 3.6 | % | $ | 3,925 | $ | 3,829 | 2.5 | % | |||||||||
Organic Net Revenues(1) | 4,021 | 3,874 | 3.8 | % | 3,874 | 3,817 | 1.5 | % | |||||||||||||
Segment operating income | 656 | 634 | 3.5 | % | 634 | 618 | 2.6 | % | |||||||||||||
(1) | See the Non-GAAP Financial Measures section at the end of this item. |
Year Ended December 27, 2014 compared to Year Ended December 28, 2013
Net revenues increased 3.6%, driven by higher commodity cost-driven pricing (6.4 pp), partially offset by unfavorable volume/mix (2.6 pp). Unfavorable volume/mix reflected volume loss from price increases, particularly in recipe cheese, sandwich cheese, and cream cheese, partially offset by an increase in shipments of snacking cheese following a 2013 recall.
20
Segment operating income increased 3.5% due to higher net pricing and lower spending on both cost savings initiatives and marketing activities. This increase was partially offset by record high dairy costs, unfavorable volume/mix, and higher manufacturing costs.
Year Ended December 28, 2013 compared to Year Ended December 29, 2012
Net revenues increased 2.5%, which included the impact of higher sales to Mondelēz International (1.0 pp). Organic Net Revenues increased 1.5%, driven primarily by favorable volume/mix (1.6 pp) as higher shipments of natural cheese and sandwich cheese were partially offset by lower shipments of snacking cheese, due in part to a voluntary string cheese recall.
Segment operating income increased 2.6% as lower marketing spending, lower overhead costs, favorable volume/mix, and lower manufacturing costs driven by net productivity were partially offset by increased commodity costs.
Refrigerated Meals
For the Years Ended | For the Years Ended | ||||||||||||||||||||
December 27, 2014 | December 28, 2013 | % Change | December 28, 2013 | December 29, 2012 | % Change | ||||||||||||||||
(in millions) | (in millions) | ||||||||||||||||||||
Net revenues | $ | 3,433 | $ | 3,334 | 3.0 | % | $ | 3,334 | $ | 3,280 | 1.6 | % | |||||||||
Organic Net Revenues(1) | 3,433 | 3,334 | 3.0 | % | 3,334 | 3,280 | 1.6 | % | |||||||||||||
Segment operating income | 378 | 329 | 14.9 | % | 329 | 379 | (13.2 | )% | |||||||||||||
(1) | See the Non-GAAP Financial Measures section at the end of this item. |
Year Ended December 27, 2014 compared to Year Ended December 28, 2013
Net revenues increased 3.0%, as the business realized both higher net pricing (1.5 pp) and improved volume/mix (1.5 pp). Higher net pricing reflected commodity cost-driven pricing in both cold cuts and hot dogs, partially offset by lower net pricing in bacon. Favorable volume/mix was driven by higher shipments of bacon and lunch combinations, as well as the introduction of protein snacks, partially offset by unfavorable mix in cold cuts and lower shipments of hot dogs.
Segment operating income increased 14.9%, primarily due to lower manufacturing costs driven by net productivity and higher net pricing, partially offset by higher commodity costs and increased marketing investments primarily in new protein snacks and in lunch combinations.
Year Ended December 28, 2013 compared to Year Ended December 29, 2012
Net revenues increased 1.6%, driven primarily by higher net pricing (1.9 pp), primarily in bacon. Unfavorable volume/mix in cold cuts and meat alternatives driven by lower shipments was partially offset by gains in lunch combinations.
Segment operating income decreased 13.2%, as commodity cost increases and higher marketing spending in lunch combinations and cold cuts were partially offset by higher net pricing, lower manufacturing costs driven by net productivity and lower overhead costs.
Beverages
For the Years Ended | For the Years Ended | ||||||||||||||||||||
December 27, 2014 | December 28, 2013 | % Change | December 28, 2013 | December 29, 2012 | % Change | ||||||||||||||||
(in millions) | (in millions) | ||||||||||||||||||||
Net revenues | $ | 2,627 | $ | 2,681 | (2.0 | )% | $ | 2,681 | $ | 2,718 | (1.4 | )% | |||||||||
Organic Net Revenues(1) | 2,627 | 2,681 | (2.0 | )% | 2,681 | 2,718 | (1.4 | )% | |||||||||||||
Segment operating income | 384 | 349 | 10.0 | % | 349 | 260 | 34.2 | % | |||||||||||||
(1) | See the Non-GAAP Financial Measures section at the end of this item. |
21
Year Ended December 27, 2014 compared to Year Ended December 28, 2013
Net revenues decreased 2.0%, as lower net pricing (3.2 pp) was partially offset by favorable volume/mix (1.2 pp). Lower net pricing reflected increased promotional spending in refreshment beverages and lower net pricing in roast and ground coffee. Favorable volume/mix was driven by growth in on-demand coffee products and ready-to-drink beverages, partially offset by lower shipments of roast and ground coffee, reflecting a shift in consumer preferences, and liquid concentrates, reflecting market share losses.
Segment operating income increased 10.0%, due primarily to lower commodity costs, marketing spending, cost savings initiatives spending, and manufacturing costs driven by net productivity. This increase was partially offset by lower net pricing, reflecting a shift from marketing spending to promotional spending.
Year Ended December 28, 2013 compared to Year Ended December 29, 2012
Net revenues decreased 1.4%, due to lower net pricing (6.1 pp), partially offset by favorable volume/mix (4.7 pp). Lower net pricing was due primarily to lower net pricing in coffee, increased promotions in ready-to-drink beverages, and increased competitive activity in liquid concentrates. Favorable volume/mix was driven primarily by growth in new on-demand coffee and liquid concentrate products as well as higher shipments of ready-to-drink beverages, partially offset by lower shipments of powdered beverages.
Segment operating income increased 34.2%, due primarily to lower commodity costs, lower manufacturing costs driven by net productivity, favorable volume/mix, and lower overhead costs, partially offset by lower net pricing and higher marketing spending on new products.
Meals & Desserts
For the Years Ended | For the Years Ended | ||||||||||||||||||||
December 27, 2014 | December 28, 2013 | % Change | December 28, 2013 | December 29, 2012 | % Change | ||||||||||||||||
(in millions) | (in millions) | ||||||||||||||||||||
Net revenues | $ | 2,155 | $ | 2,305 | (6.5 | )% | $ | 2,305 | $ | 2,311 | (0.3 | )% | |||||||||
Organic Net Revenues(1) | 2,155 | 2,305 | (6.5 | )% | 2,305 | 2,311 | (0.3 | )% | |||||||||||||
Segment operating income | 611 | 665 | (8.1 | )% | 665 | 712 | (6.6 | )% | |||||||||||||
(1) | See the Non-GAAP Financial Measures section at the end of this item. |
Year Ended December 27, 2014 compared to Year Ended December 28, 2013
Net revenues decreased 6.5%, due to unfavorable volume/mix (4.6 pp) and lower net pricing (1.9 pp). Unfavorable volume/mix was due primarily to lower shipments of boxed dinners, refrigerated ready-to-eat desserts, and dry packaged desserts, resulting from changing consumer preferences and increased competitive activity in these categories. Lower net pricing primarily in refrigerated ready-to-eat desserts, dessert toppings, and macaroni and cheese was due to increased promotional activity.
Segment operating income decreased 8.1%, due primarily to lower net pricing, unfavorable volume/mix and higher commodity costs (primarily dairy and packaging materials), partially offset by lower marketing spending.
Year Ended December 28, 2013 compared to Year Ended December 29, 2012
Net revenues decreased 0.3%, due to unfavorable volume/mix (3.2 pp), partially offset by higher net pricing (2.9 pp). Unfavorable volume/mix was due primarily to lower shipments of refrigerated ready-to-eat desserts. Higher net pricing was driven primarily by pricing actions in macaroni and cheese and boxed dinners.
Segment operating income decreased 6.6%, due primarily to higher marketing spending as well as unfavorable volume/mix. This decrease was partially offset by higher net pricing in macaroni and cheese and boxed dinners and lower overhead costs.
22
Enhancers & Snack Nuts
For the Years Ended | For the Years Ended | ||||||||||||||||||||
December 27, 2014 | December 28, 2013 | % Change | December 28, 2013 | December 29, 2012 | % Change | ||||||||||||||||
(in millions) | (in millions) | ||||||||||||||||||||
Net revenues | $ | 2,062 | $ | 2,101 | (1.9 | )% | $ | 2,101 | $ | 2,220 | (5.4 | )% | |||||||||
Organic Net Revenues(1) | 2,062 | 2,093 | (1.5 | )% | 2,093 | 2,217 | (5.6 | )% | |||||||||||||
Segment operating income | 577 | 529 | 9.1 | % | 529 | 592 | (10.6 | )% | |||||||||||||
(1) | See the Non-GAAP Financial Measures section at the end of this item. |
Year Ended December 27, 2014 compared to Year Ended December 28, 2013
Net revenues decreased 1.9%, including the impact of lower sales to Mondelēz International (0.4 pp). Organic Net Revenues decreased 1.5%, due primarily to lower net pricing (2.0 pp), partially offset by favorable volume/mix (0.5 pp). Lower net pricing was due primarily to increased promotional activity across the enhancers categories. Favorable volume/mix was driven by growth in snack nuts, partially offset by lower shipments of peanut butter.
Segment operating income increased 9.1%, due primarily to lower manufacturing costs driven by net productivity and lower spending on both marketing and cost savings initiatives, partially offset by lower net pricing.
Year Ended December 28, 2013 compared to Year Ended December 29, 2012
Net revenues decreased 5.4% due to lower net pricing (3.3 pp) and unfavorable volume/mix (2.3 pp). Lower net pricing was due primarily to increased competitive activity in spoonable and pourable dressings and commodity cost-driven pricing in snack nuts. Unfavorable volume/mix was due primarily to lower shipments of pourable and spoonable dressings, partially offset by higher shipments of snack nuts.
Segment operating income decreased 10.6%, due to lower net pricing and higher marketing spending across spoonable and pourable salad dressings and snack nuts, and unfavorable volume/mix. This decrease was partially offset by lower overhead costs and lower manufacturing costs driven by net productivity.
Canada
For the Years Ended | For the Years Ended | ||||||||||||||||||||
December 27, 2014 | December 28, 2013 | % Change | December 28, 2013 | December 29, 2012 | % Change | ||||||||||||||||
(in millions) | (in millions) | ||||||||||||||||||||
Net revenues | $ | 1,937 | $ | 2,037 | (4.9 | )% | $ | 2,037 | $ | 2,010 | 1.3 | % | |||||||||
Organic Net Revenues(1) | 2,060 | 2,021 | 1.9 | % | 2,086 | 2,006 | 4.0 | % | |||||||||||||
Segment operating income | 370 | 373 | (0.8 | )% | 373 | 301 | 23.9 | % | |||||||||||||
(1) | See the Non-GAAP Financial Measures section at the end of this item. |
Year Ended December 27, 2014 compared to Year Ended December 28, 2013
Net revenues decreased 4.9%, which included the unfavorable impact of foreign currency (6.8 pp). Organic Net Revenues increased 1.9%, as the business realized higher net pricing (1.2 pp) and favorable volume/mix (0.7 pp). Higher net pricing in cheese and coffee was partially offset by lower net pricing in refreshment beverages. Favorable volume/mix was driven by higher shipments of natural cheese and the launch of McCafé coffee, partially offset by lower shipments of processed cheese.
Segment operating income decreased 0.8%, due to higher commodity costs and an unfavorable impact of foreign currency, partially offset by lower marketing spending, higher net pricing and lower manufacturing costs driven by net productivity.
23
Year Ended December 28, 2013 compared to Year Ended December 29, 2012
Net revenues increased 1.3%, which included the unfavorable impacts of foreign currency (3.3 pp) and higher sales to Mondelēz International (0.6 pp). Organic Net Revenues increased 4.0%, driven by favorable volume/mix (5.3 pp), partially offset by lower net pricing (1.3 pp), primarily in peanut butter. Favorable volume/mix was driven by higher shipments of peanut butter and natural cheese as well as favorable mix from coffee.
Segment operating income increased 23.9%, driven primarily by favorable volume/mix, lower overhead costs, and lower commodity costs, partially offset by lower net pricing and higher investments in marketing driving volume/mix growth.
Other Businesses
For the Years Ended | For the Years Ended | ||||||||||||||||||||
December 27, 2014 | December 28, 2013 | % Change | December 28, 2013 | December 29, 2012 | % Change | ||||||||||||||||
(in millions) | (in millions) | ||||||||||||||||||||
Net revenues | $ | 1,925 | $ | 1,835 | 4.9 | % | $ | 1,835 | $ | 1,903 | (3.6 | )% | |||||||||
Organic Net Revenues(1) | 1,869 | 1,763 | 6.0 | % | 1,771 | 1,808 | (2.0 | )% | |||||||||||||
Segment operating income | 263 | 227 | 15.9 | % | 227 | 180 | 26.1 | % | |||||||||||||
(1) | See the Non-GAAP Financial Measures section at the end of this item. |
Year Ended December 27, 2014 compared to Year Ended December 28, 2013
Net revenues increased 4.9%, despite the impact of unfavorable foreign currency (0.9 pp). Organic Net Revenues increased 6.0%, driven by higher net pricing (3.9 pp) and favorable volume/mix (2.1 pp). Higher net pricing realized in our Foodservice business and higher shipments in our Exports business were partially offset by the unfavorable impact of planned Foodservice product line exits.
Segment operating income increased 15.9%, as higher net pricing, lower manufacturing costs driven by net productivity, and lower spending on cost savings initiatives were partially offset by increased commodity costs.
Year Ended December 28, 2013 compared to Year Ended December 29, 2012
Net revenues decreased 3.6%, which included the impacts of lower sales to Mondelēz International (1.1 pp) and unfavorable foreign currency (0.5 pp). Organic Net Revenues decreased 2.0%, due to unfavorable volume/mix (3.5 pp), partially offset by higher net pricing (1.5 pp), primarily in our Foodservice business. Unfavorable volume/mix was due primarily to Foodservice product line pruning, partially offset by higher shipments in our Exports business.
Segment operating income increased 26.1%, driven primarily by higher net pricing, lower manufacturing costs driven by net productivity, lower marketing spending, and favorable volume/mix due to growth in our Exports business. This increase was partially offset by higher commodity costs.
Critical Accounting Policies
Note 1, Summary of Significant Accounting Policies, to the consolidated financial statements includes a summary of the significant accounting policies we used to prepare our consolidated financial statements. The following is a review of the more significant assumptions and estimates, as well as the accounting policies we used to prepare our consolidated financial statements.
Principles of Consolidation:
The consolidated financial statements include Kraft Foods Group, as well as our wholly-owned subsidiaries. All intercompany transactions are eliminated. Our period end date for financial reporting purposes is the last Saturday of the fiscal year, which aligns with the financial close dates of our operating segments.
Prior to the Spin-Off on October 1, 2012, our financial statements were prepared on a stand-alone basis and were derived from the consolidated financial statements and accounting records of Mondelēz International. Our financial statements included certain expenses of Mondelēz International that were allocated to us for certain functions,
24
including general corporate expenses related to finance, legal, information technology, human resources, compliance, shared services, insurance, employee benefits and incentives, and stock-based compensation. These expenses were allocated in our historical results of operations on the basis of direct usage when identifiable, with the remainder allocated on the basis of revenue, operating income, or headcount. We consider the expense allocation methodology and results to be reasonable for all periods presented. However, these allocations were not necessarily indicative of the actual expenses we would have incurred as an independent public company or of the costs we will incur in the future, and may differ substantially from the allocations we agreed to in the various separation agreements.
Revenue Recognition:
We recognize revenues when title and risk of loss pass to our customers. We record revenues net of consumer incentives and trade promotions and include all shipping and handling charges billed to customers. We also record provisions for estimated product returns and customer allowances as reductions to revenues within the same period that the revenue is recognized. We base these estimates principally on historical and current period experience, however, it is reasonably likely that actual experience will vary from the estimates we have made.
Marketing and Research and Development:
We promote our products with advertising and consumer promotions, consumer incentives, and trade promotions. Consumer incentives and trade promotions include, but are not limited to, discounts, coupons, rebates, in-store display incentives, and volume-based incentives. Consumer incentive and trade promotion activities are recorded as a reduction to revenues based on amounts estimated as being due to customers and consumers at the end of a period. We base these estimates principally on historical utilization and redemption rates.
For interim reporting purposes, we charge advertising and consumer promotion expenses to operations as a percentage of volume, based on estimated volume and related expense for the full year. We review and adjust these estimates each quarter based on actual experience and other information. Advertising expense was $652 million in 2014, $747 million in 2013, and $640 million in 2012. We record marketing expense in selling, general and administrative expense, except for consumer incentives and trade promotions, which are recorded in net revenues.
We expense costs as incurred for product research and development within selling, general and administrative expenses. Research and development expense was $149 million in 2014, $142 million in 2013, and $143 million in 2012. The amounts disclosed in prior periods have been revised to conform with the current year presentation.
Income Taxes:
We recognize income taxes based on amounts refundable or payable for the current year and record deferred tax assets or liabilities for any difference between accounting principles generally accepted in the United States of America (“U.S. GAAP”) and tax reporting. We also recognize deferred tax assets for temporary differences, operating loss carryforwards, and tax credit carryforwards. Inherent in determining our annual tax rate are judgments regarding business plans, planning opportunities, and expectations about future outcomes. Realization of certain deferred tax assets, primarily net operating loss and other carryforwards, is dependent upon generating sufficient taxable income in the appropriate jurisdiction prior to the expiration of the carryforward periods. See Note 12, Income Taxes, to the consolidated financial statements for additional information.
We apply a more-likely-than-not threshold to the recognition and derecognition of uncertain tax positions. Accordingly, we recognize the amount of tax benefit that has a greater than 50 percent likelihood of being ultimately realized upon settlement. Future changes in judgment related to the expected ultimate resolution of uncertain tax positions will affect earnings in the quarter of such change.
Goodwill and Intangible Assets:
We test goodwill and indefinite-lived intangible assets for impairment at least annually in the fourth quarter or when a triggering event occurs. The first step of the goodwill impairment test compares the reporting unit’s estimated fair value with its carrying value. We estimate a reporting unit’s fair value using planned growth rates, market-based discount rates, estimates of residual value, and estimates of market multiples. If the carrying value of a reporting unit’s net assets exceeds its fair value, the second step would be applied to measure the difference between the carrying value and implied fair value of goodwill. If the carrying value of goodwill exceeds its implied fair value, the goodwill would be considered impaired and reduced to its implied fair value.
25
We test indefinite-lived intangible assets for impairment by comparing the fair value of each intangible asset with its carrying value. We determine fair value of non-amortizing intangible assets using planned growth rates, market-based discount rates, and estimates of royalty rates. If the carrying value exceeds fair value, the intangible asset would be considered impaired and would be reduced to fair value.
There were no impairments of goodwill or intangible assets in 2014, 2013, or 2012. During our annual 2014 indefinite-lived intangible asset impairment test, we noted that a $958 million trademark and a $261 million trademark within our Enhancers business had excess fair values over their carrying values of less than 20%. While these trademarks passed the 2014 impairment test, if our projections of future operating income were to decline, or if valuation factors outside of our control, such as discount rates, change unfavorably, the estimated fair value of one or both of these trademarks could be adversely affected, leading to a potential impairment in the future.
Estimating the fair value of individual reporting units or intangible assets requires us to make assumptions and estimates regarding our future plans, as well as industry and economic conditions. These assumptions and estimates include projected revenues and income, interest rates, cost of capital, royalty rates, and tax rates. Many of the factors used in assessing fair value are outside the control of management and it is reasonably likely that assumptions and estimates will change in future periods. These changes could result in future impairments.
Postemployment Benefit Plans:
We provide a range of benefits to our employees and retirees. These include pension benefits, postretirement health care benefits, and other postemployment benefits, consisting primarily of severance. We recognize net actuarial gains or losses and changes in the fair value of plan assets immediately upon remeasurement, which is at least annually. The calculations of the amounts recorded require the use of various actuarial assumptions, such as discount rates, assumed rates of return on plan assets, compensation increases, and turnover rates. We review our actuarial assumptions on an annual basis and make modifications to the assumptions based on current rates and trends when appropriate. We believe that the assumptions used in recording our pension, postretirement, and other postemployment benefit plan obligations are reasonable based on our experience and advice from our actuaries. See Note 9, Postemployment Benefit Plans, to the consolidated financial statements for a discussion of the assumptions used.
For our postretirement plans, our 2015 health care cost trend rate assumption will be 6.91%. We established this rate based upon our most recent experience as well as our expectation for health care trend rates going forward. We anticipate that our health care cost trend rate assumption will be 5.00% by 2023. Assumed health care cost trend rates have a significant effect on the amounts reported for the health care plans. A one-percentage-point change in assumed health care cost trend rates would have the following effects as of December 27, 2014:
One-Percentage-Point | ||||||||
Increase | Decrease | |||||||
(in millions) | ||||||||
Effect on annual service and interest cost | $ | 25 | $ | (20 | ) | |||
Effect on postretirement benefit obligation | 433 | (355 | ) | |||||
Our 2015 discount rate assumption is 4.08% for our postretirement plans. Our 2015 discount rate assumption is 4.17% for our U.S. pension plans and 3.87% for our non-U.S. pension plans. We model these discount rates using a portfolio of high quality, fixed-income debt instruments with durations that match the expected future cash flows of the benefit obligations. Changes in our discount rates were primarily the result of changes in bond yields year-over-year.
Our 2015 expected rate of return on plan assets is 5.75% for our U.S. pension plans and 5.00% for our non-U.S. pension plans. We determine our expected rate of return on plan assets from the plan assets’ historical long-term investment performance, current and future asset allocation, and estimates of future long-term returns by asset class. We attempt to maintain our target asset allocation by rebalancing between asset classes as we make contributions and monthly benefit payments.
26
While we do not anticipate further changes in the 2015 assumptions for our U.S. and non-U.S. pension and postretirement health care plans, as a sensitivity measure, a fifty-basis point change in our discount rate or a fifty-basis point change in the actual rate of return on plan assets would have the following effects, increase / (decrease) in cost, as of December 27, 2014:
U.S. Plans | Non-US. Plans | ||||||||||||||
Fifty-Basis-Point | Fifty-Basis-Point | ||||||||||||||
Increase | Decrease | Increase | Decrease | ||||||||||||
(in millions) | |||||||||||||||
Effect of change in discount rate on pension costs | $ | (499 | ) | $ | 562 | $ | (99 | ) | $ | 111 | |||||
Effect of change in actual rate of return on plan assets on pension costs | (29 | ) | 29 | (7 | ) | 7 | |||||||||
Effect of change in discount rate on postretirement health care costs | (205 | ) | 229 | (13 | ) | 15 | |||||||||
Prior to the Spin-Off, Mondelēz International provided defined benefit pension, postretirement health care, defined contribution, and multiemployer pension and medical benefits to our eligible employees and retirees. Our consolidated statements of earnings for the year ended December 29, 2012 included expense allocations for these benefits of $491 million through September 30, 2012, which were determined based on a review of personnel by business unit and based on allocations of corporate or other shared functional personnel. We consider the expense allocation methodology and results to be reasonable for all periods presented. These costs are reflected in cost of sales and selling, general and administrative expenses. These costs were funded through intercompany transactions with Mondelēz International and were reflected within the parent company investment equity balance.
New Accounting Pronouncements
See Note 1, Summary of Significant Accounting Policies, to the consolidated financial statements for a discussion of new accounting pronouncements.
Contingencies
See Note 11, Commitments and Contingencies, to the consolidated financial statements for a discussion of contingencies.
Commodity Trends
We purchase and use large quantities of commodities, including dairy products, meat products, coffee beans, nuts, soybean and vegetable oils, sugar and other sweeteners, corn products and wheat to manufacture our products. In addition, we purchase and use significant quantities of resins and cardboard to package our products and natural gas to operate our facilities. We continuously monitor worldwide supply and cost trends of these commodities.
During 2014, our aggregate commodity costs increased over the prior year, primarily as a result of record high dairy costs as well as increases in packaging materials, nuts and meat product costs, partially offset by lower costs of coffee beans, soybean and vegetable oils, sugar and flour and grain costs. Our commodity costs increased approximately $430 million in 2014 and approximately $120 million in 2013 compared to the prior year. We expect commodity cost volatility to continue in 2015. We manage commodity cost volatility primarily through pricing and risk management strategies. As a result of these risk management strategies, our commodity cost experience may not immediately correlate with market price trends.
Liquidity and Capital Resources
We believe that cash generated from our operating activities and our $3.0 billion revolving credit facility with our commercial paper program will provide sufficient liquidity to meet our working capital needs, expected cost savings initiatives expenditures, planned capital expenditures and contributions to our postemployment benefit plans, purchases under our discretionary share repurchase program, future contractual obligations, and payment of our anticipated quarterly dividends. We will use our cash on hand and our commercial paper program for daily funding requirements. Overall, we do not expect any negative effects on our funding sources that would have a material effect on our short-term or long-term liquidity.
27
Net Cash Provided by Operating Activities:
Operating activities provided net cash of $2.0 billion in 2014, $2.0 billion in 2013, and $3.0 billion in 2012. Net earnings in 2014 included significant unfavorable non-cash market-based impacts to postemployment benefit plans and the related deferred tax effects. Operating cash flows in 2014 also reflected lower pension contributions. Net earnings in 2013 included significant favorable non-cash market-based impacts and the related deferred tax effects. Operating cash flows in 2013 also reflected pension contributions of $611 million and working capital improvements.
Net Cash Used in Investing Activities:
Net cash used in investing activities was $535 million in 2014, $426 million in 2013, and $422 million in 2012, comprised mainly of capital expenditures. Our cash used in investing activities in 2013 also included the receipt of proceeds of $101 million from the sale-leaseback of our headquarters facilities. We expect 2015 capital expenditures to be approximately $550 million to $600 million, including capital expenditures required for our ongoing cost savings initiatives. We expect to fund these expenditures with cash from operations.
Net Cash Used in Financing Activities:
Net cash used in financing activities was $1.9 billion in 2014, $1.2 billion in 2013, and $1.4 billion in 2012. Net cash used in 2014 and 2013 was comprised mainly of dividend payments. In addition, in 2014 we spent $740 million to repurchase shares of our common stock under our share repurchase program, which was authorized by our Board of Directors in December 2013. The net cash used in 2012 primarily related to $7.2 billion of net transfers to Mondelēz International partially offset by the net proceeds we received from our $6.0 billion debt issuance.
Total Debt:
Our total debt was $10.0 billion at December 27, 2014 and December 28, 2013. The weighted average remaining term of our debt was 12.2 years at December 27, 2014. We have $1.4 billion of long-term debt maturing in the next 12 months that is classified as current. Our long-term debt contains customary representations, covenants, and events of default. We were in compliance with all covenants at December 27, 2014. We believe that cash on hand, cash flows from operations, and available short- and long-term debt financing will be adequate to meet our contractual obligations.
On May 29, 2014, we entered into a new $3.0 billion five-year senior unsecured revolving credit facility that expires on May 29, 2019 unless extended. The credit facility enables us to borrow up to $3.0 billion, which may be increased by up to $1.0 billion in the aggregate with the agreement of the lenders providing any increased commitments. All committed borrowings under the facility bear interest at a variable annual rate based on the London Inter-Bank Offered Rate or a defined base rate, at our election, plus an applicable margin based on the ratings of our long-term senior unsecured indebtedness. The credit facility requires us to maintain a minimum total shareholders’ equity (excluding accumulated other comprehensive income or losses and any income or losses recognized in connection with “mark-to-market” accounting in respect of pension and other retirement plans) of at least $2.4 billion and also contains customary representations, covenants, and events of default. At December 27, 2014 and for the year ended December 27, 2014, no amounts were drawn on this credit facility. The credit facility replaced our $3.0 billion five-year credit agreement dated as of May 18, 2012. We expect to use the credit facility for general corporate purposes, including for working capital purposes and to support our commercial paper issuances.
Off-Balance Sheet Arrangements and Aggregate Contractual Obligations
We have no material off-balance sheet arrangements other than the guarantees and contractual obligations that are discussed below.
As discussed in Note 11, Commitments and Contingencies, to the consolidated financial statements, we have third-party guarantees primarily covering long-term obligations related to leased properties. The carrying amount of our third-party guarantees was $22 million at December 27, 2014 and $24 million at December 28, 2013. The maximum potential payment under these guarantees was $42 million at December 27, 2014 and $53 million at December 28, 2013. Substantially all of these guarantees expire at various times through 2027.
In addition, we were contingently liable for guarantees related to our own performance totaling $87 million at December 27, 2014 and $86 million at December 28, 2013. These primarily include letters of credit related to dairy commodity purchases and other letters of credit.
28
Guarantees have not had, and we do not expect them to have, a material effect on our liquidity.
Aggregate Contractual Obligations:
The following table summarizes our contractual obligations at December 27, 2014.
Payments Due | ||||||||||||||||||||
Total | 2015 | 2016-17 | 2018-19 | 2020 and Thereafter | ||||||||||||||||
(in millions) | ||||||||||||||||||||
Long-term debt (1) | $ | 10,046 | $ | 1,401 | $ | 1,002 | $ | 1,037 | $ | 6,606 | ||||||||||
Interest expense (2) | 6,683 | 441 | 824 | 727 | 4,691 | |||||||||||||||
Capital leases (3) | 38 | 7 | 12 | 7 | 12 | |||||||||||||||
Operating leases (4) | 427 | 106 | 147 | 90 | 84 | |||||||||||||||
Purchase obligations: (5) | ||||||||||||||||||||
Inventory and production costs | 2,242 | 1,578 | 664 | — | — | |||||||||||||||
Other | 735 | 313 | 287 | 98 | 37 | |||||||||||||||
2,977 | 1,891 | 951 | 98 | 37 | ||||||||||||||||
Pension contributions (6) | 995 | 195 | 400 | 400 | — | |||||||||||||||
Other long-term liabilities (7) | 2,045 | 198 | 425 | 401 | 1,021 | |||||||||||||||
Total | $ | 23,211 | $ | 4,239 | $ | 3,761 | $ | 2,760 | $ | 12,451 | ||||||||||
(1) | Amounts represent the expected cash payments of our long-term debt and do not include unamortized bond premiums or discounts. |
(2) | Amounts represent the expected cash payments of our interest expense on our long-term debt. |
(3) | Amounts represent the expected cash payments of our capital leases, including the expected cash payments of interest expense of approximately $8 million on our capital leases. |
(4) | Operating leases represent the minimum rental commitments under non-cancelable operating leases. |
(5) | Purchase obligations for inventory and production costs (such as raw materials, indirect materials and supplies, packaging, co-manufacturing arrangements, storage, and distribution) are commitments for projected needs to be utilized in the normal course of business. Other purchase obligations include commitments for marketing, advertising, capital expenditures, information technology, and professional services. Arrangements are considered purchase obligations if a contract specifies all significant terms, including fixed or minimum quantities to be purchased, a pricing structure, and approximate timing of the transaction. Any amounts reflected on the consolidated balance sheet as accounts payable and accrued liabilities are excluded from the table above. |
(6) | We estimate that 2015 pension contributions would be approximately $195 million and approximately $200 million annually for the next four years thereafter. We cannot reasonably estimate our contributions to our pension plans beyond 2019. |
(7) | Other long-term liabilities primarily consist of estimated future benefit payments for our postretirement health care plans through 2024 of approximately $2.0 billion. We are unable to reliably estimate the timing of the payments beyond 2024; as such, they are excluded from the above table. In addition, the following long-term liabilities included on the consolidated balance sheet are excluded from the table above: income taxes, insurance accruals, and other accruals. We are unable to reliably estimate the timing of the payments for these items. As of December 27, 2014, our total net liability for income taxes, including uncertain tax positions and associated accrued interest and penalties, was $279 million. We currently estimate paying up to approximately $187 million in the next 12 months related to our income tax obligations as of December 27, 2014. |
Equity and Dividends
On December 17, 2013, our Board of Directors authorized a $3.0 billion share repurchase program with no expiration date. Under the share repurchase program, we are authorized to repurchase shares of our common stock in the open market or in privately negotiated transactions. The timing and amount of share repurchases are subject to management's evaluation of market conditions, applicable legal requirements, and other factors. We are not obligated to repurchase any shares of our common stock and may suspend the program at our discretion. As of December 27, 2014, we have repurchased approximately 13.1 million shares in the aggregate for approximately $746 million under this program since its inception.
See Note 8, Stock Plans, to the consolidated financial statements for a discussion of our share-based equity programs.
29
Dividends:
We paid dividends of $1,266 million in 2014 and $1,207 million in 2013. No dividends were paid in 2012. On December 16, 2014, our Board of Directors declared a cash dividend of $0.55 per share of common stock, which was paid on January 16, 2015 to shareholders of record on December 26, 2014. In connection with this dividend, we recorded $324 million of dividends payable as of December 27, 2014. The present annualized dividend rate is $2.20 per share of common stock. The declaration of dividends is subject to the discretion of our Board of Directors and depends on various factors, including our net earnings, financial condition, cash requirements, future prospects, and other factors that our Board of Directors deems relevant to its analysis and decision making.
Non-GAAP Financial Measures
To supplement our financial statements presented in accordance with U.S. GAAP, we present Organic Net Revenues, which is considered a non-GAAP financial measure. We define Organic Net Revenues as net revenues excluding the impact of transactions with Mondelēz International, acquisitions, divestitures (including the termination of a full line of business due to the loss of a licensing or distribution arrangement, and the complete exit of business out of a foreign country), currency and the 53rd week of shipments when it occurs. We calculate the impact of currency on net revenues by holding exchange rates constant at the previous year's exchange rate. We believe that presenting Organic Net Revenues is useful because it (1) provides both management and investors meaningful supplemental information regarding financial performance by excluding certain items, (2) permits investors to view our performance using the same tools that management uses to budget, make operating and strategic decisions, and evaluate our historical performance, and (3) otherwise provides supplemental information that may be useful to investors in evaluating us.
We believe that the presentation of Organic Net Revenues, when considered together with the corresponding U.S. GAAP financial measure and the reconciliation to that measure, provides investors with additional understanding of the factors and trends affecting our business than could be obtained absent these disclosures. Non-GAAP financial measures should be viewed in addition to, and not as an alternative for, our results prepared in accordance with U.S. GAAP. In addition, the non-GAAP measures we use may differ from non-GAAP measures used by other companies, and other companies may not define the non-GAAP measures we use in the same way. A reconciliation of Organic Net Revenues to net revenues is set forth below.
2014 Compared to 2013 | |||||||||||||||
Net Revenues | Impact of Currency | Sales to Mondelēz International | Organic Net Revenues | ||||||||||||
(in millions) | |||||||||||||||
Year Ended December 27, 2014 | |||||||||||||||
Cheese | $ | 4,066 | $ | — | $ | (45 | ) | $ | 4,021 | ||||||
Refrigerated Meals | 3,433 | — | — | 3,433 | |||||||||||
Beverages | 2,627 | — | — | 2,627 | |||||||||||
Meals & Desserts | 2,155 | — | — | 2,155 | |||||||||||
Enhancers & Snack Nuts | 2,062 | — | — | 2,062 | |||||||||||
Canada | 1,937 | 139 | (16 | ) | 2,060 | ||||||||||
Other Businesses | 1,925 | 17 | (73 | ) | 1,869 | ||||||||||
Total | $ | 18,205 | $ | 156 | $ | (134 | ) | $ | 18,227 | ||||||
Year Ended December 28, 2013 | |||||||||||||||
Cheese | $ | 3,925 | $ | — | $ | (51 | ) | $ | 3,874 | ||||||
Refrigerated Meals | 3,334 | — | — | 3,334 | |||||||||||
Beverages | 2,681 | — | — | 2,681 | |||||||||||
Meals & Desserts | 2,305 | — | — | 2,305 | |||||||||||
Enhancers & Snack Nuts | 2,101 | — | (8 | ) | 2,093 | ||||||||||
Canada | 2,037 | — | (16 | ) | 2,021 | ||||||||||
Other Businesses | 1,835 | — | (72 | ) | 1,763 | ||||||||||
Total | $ | 18,218 | $ | — | $ | (147 | ) | $ | 18,071 | ||||||
30
2013 Compared to 2012 | |||||||||||||||
Net Revenues | Impact of Currency | Sales to Mondelēz International | Organic Net Revenues | ||||||||||||
(in millions) | |||||||||||||||
Year Ended December 28, 2013 | |||||||||||||||
Cheese | $ | 3,925 | $ | — | $ | (51 | ) | $ | 3,874 | ||||||
Refrigerated Meals | 3,334 | — | — | 3,334 | |||||||||||
Beverages | 2,681 | — | — | 2,681 | |||||||||||
Meals & Desserts | 2,305 | — | — | 2,305 | |||||||||||
Enhancers & Snack Nuts | 2,101 | — | (8 | ) | 2,093 | ||||||||||
Canada | 2,037 | 65 | (16 | ) | 2,086 | ||||||||||
Other Businesses | 1,835 | 8 | (72 | ) | 1,771 | ||||||||||
Total | $ | 18,218 | $ | 73 | $ | (147 | ) | $ | 18,144 | ||||||
Year Ended December 29, 2012 | |||||||||||||||
Cheese | $ | 3,829 | $ | — | $ | (12 | ) | $ | 3,817 | ||||||
Refrigerated Meals | 3,280 | — | — | 3,280 | |||||||||||
Beverages | 2,718 | — | — | 2,718 | |||||||||||
Meals & Desserts | 2,311 | — | — | 2,311 | |||||||||||
Enhancers & Snack Nuts | 2,220 | — | (3 | ) | 2,217 | ||||||||||
Canada | 2,010 | — | (4 | ) | 2,006 | ||||||||||
Other Businesses | 1,903 | — | (95 | ) | 1,808 | ||||||||||
Total | $ | 18,271 | $ | — | $ | (114 | ) | $ | 18,157 | ||||||
Item 7A. Quantitative and Qualitative Disclosures about Market Risk.
As we operate primarily in North America but source our commodities from global markets and periodically enter into financing or other arrangements abroad, we use financial instruments to manage our primary market risk exposures, which are commodity price, foreign currency exchange rate, and interest rate risks. We monitor and manage these exposures as part of our overall risk management program. Our risk management program focuses on the unpredictability of financial markets and seeks to reduce the potentially adverse effects that the volatility of these markets may have on our operating results. We maintain commodity price, foreign currency, and interest rate risk management policies that principally use derivative instruments to reduce significant, unanticipated earnings fluctuations that may arise from volatility in commodity prices, foreign currency exchange rates, and interest rates. We also sell commodity futures to unprice future purchase commitments, and we occasionally use related futures to cross-hedge a commodity exposure. We are not a party to leveraged derivatives and, by policy, do not use financial instruments for speculative purposes. Refer to Note 1, Summary of Significant Accounting Policies, and Note 10, Financial Instruments, to the consolidated financial statements for further details of our commodity price, foreign currency, and interest rate risk management policies and the types of derivative instruments we use to hedge those exposures.
Value at Risk:
We use a value at risk (“VAR”) computation to estimate: (1) the potential one-day loss in pre-tax earnings of our commodity price and foreign currency-sensitive derivative financial instruments; and (2) the potential one-day loss in the fair value of our interest rate-sensitive financial instruments. We included our debt, commodity futures, forwards and options, foreign currency forwards, and interest rate swaps in our VAR computation. Excluded from the computation were anticipated transactions and foreign currency trade payables and receivables which the financial instruments are intended to hedge.
We made the VAR estimates assuming normal market conditions, using a 95% confidence interval. We used a “variance / co-variance” model to determine the observed interrelationships between movements in interest rates and various currencies. These interrelationships were determined by observing interest rate and forward currency
31
rate movements over the prior quarter for the calculation of VAR amounts at December 27, 2014, and December 28, 2013, and over each of the four prior quarters for the calculation of average VAR amounts during each year. The values of commodity options do not change on a one-to-one basis with the underlying currency or commodity, and were valued accordingly in the VAR computation.
As of December 27, 2014 and December 28, 2013, the estimated potential one-day loss in pre-tax earnings from our commodity and foreign currency instruments and the estimated potential one-day loss in fair value of our interest rate-sensitive instruments, as calculated in the VAR model, were (in millions):
Pre-Tax Earnings Impact | Fair Value Impact | |||||||||||||||||||||||||||||||
At 12/27/14 | Average | High | Low | At 12/27/14 | Average | High | Low | |||||||||||||||||||||||||
Instruments sensitive to: | ||||||||||||||||||||||||||||||||
Foreign currency rates | $ | 1 | $ | 2 | $ | 2 | $ | 1 | ||||||||||||||||||||||||
Commodity prices | 9 | 13 | 18 | 9 | ||||||||||||||||||||||||||||
Interest rates | $ | 49 | $ | 35 | $ | 49 | $ | 27 | ||||||||||||||||||||||||
Pre-Tax Earnings Impact | Fair Value Impact | |||||||||||||||||||||||||||||||
At 12/28/13 | Average | High | Low | At 12/28/13 | Average | High | Low | |||||||||||||||||||||||||
Instruments sensitive to: | ||||||||||||||||||||||||||||||||
Foreign currency rates | $ | 2 | $ | 2 | $ | 2 | $ | 2 | ||||||||||||||||||||||||
Commodity prices | 7 | 7 | 8 | 7 | ||||||||||||||||||||||||||||
Interest rates | $ | 32 | $ | 46 | $ | 71 | $ | 32 | ||||||||||||||||||||||||
This VAR computation is a risk analysis tool designed to statistically estimate the maximum probable daily loss from adverse movements in commodity prices, foreign currency rates, and interest rates under normal market conditions. The computation does not represent actual losses in fair value or earnings to be incurred by us, nor does it consider the effect of favorable changes in market rates. We cannot predict actual future movements in such market rates and do not present these VAR results to be indicative of future movements in such market rates or to be representative of any actual impact that future changes in market rates may have on our future financial results.
32
Item 8. Financial Statements and Supplementary Data.
Report of Independent Registered Public Accounting Firm
To the Board of Directors and Shareholders of Kraft Foods Group, Inc.:
In our opinion, the consolidated financial statements listed in the index appearing under Item 15(a) present fairly, in all material respects, the financial position of Kraft Foods Group, Inc. and its subsidiaries at December 27, 2014 and December 28, 2013, and the results of their operations and their cash flows for each of the three years in the period ended December 27, 2014 in conformity with accounting principles generally accepted in the United States of America. In addition, in our opinion, the financial statement schedule listed in the index appearing under Item 15(a) presents fairly, in all material respects, the information set forth therein when read in conjunction with the related consolidated financial statements. Also in our opinion, the Company maintained, in all material respects, effective internal control over financial reporting as of December 27, 2014, based on criteria established in Internal Control - Integrated Framework (2013) issued by the Committee of Sponsoring Organizations of the Treadway Commission (COSO). The Company's management is responsible for these financial statements and financial statement schedule, for maintaining effective internal control over financial reporting and for its assessment of the effectiveness of internal control over financial reporting, included in the Report of Management on Internal Control over Financial Reporting appearing under Item 9A. Our responsibility is to express opinions on these financial statements, on the financial statement schedule, and on the Company's internal control over financial reporting based on our integrated audits. We conducted our audits in accordance with the standards of the Public Company Accounting Oversight Board (United States). Those standards require that we plan and perform the audits to obtain reasonable assurance about whether the financial statements are free of material misstatement and whether effective internal control over financial reporting was maintained in all material respects. Our audits of the financial statements included examining, on a test basis, evidence supporting the amounts and disclosures in the financial statements, assessing the accounting principles used and significant estimates made by management, and evaluating the overall financial statement presentation. Our audit of internal control over financial reporting included obtaining an understanding of internal control over financial reporting, assessing the risk that a material weakness exists, and testing and evaluating the design and operating effectiveness of internal control based on the assessed risk. Our audits also included performing such other procedures as we considered necessary in the circumstances. We believe that our audits provide a reasonable basis for our opinions.
A company’s internal control over financial reporting is a process designed to provide reasonable assurance regarding the reliability of financial reporting and the preparation of financial statements for external purposes in accordance with generally accepted accounting principles. A company’s internal control over financial reporting includes those policies and procedures that (i) pertain to the maintenance of records that, in reasonable detail, accurately and fairly reflect the transactions and dispositions of the assets of the company; (ii) provide reasonable assurance that transactions are recorded as necessary to permit preparation of financial statements in accordance with generally accepted accounting principles, and that receipts and expenditures of the company are being made only in accordance with authorizations of management and directors of the company; and (iii) provide reasonable assurance regarding prevention or timely detection of unauthorized acquisition, use, or disposition of the company’s assets that could have a material effect on the financial statements.
Because of its inherent limitations, internal control over financial reporting may not prevent or detect misstatements. Also, projections of any evaluation of effectiveness to future periods are subject to the risk that controls may become inadequate because of changes in conditions, or that the degree of compliance with the policies or procedures may deteriorate.
/s/ PRICEWATERHOUSECOOPERS LLP
Chicago, Illinois
February 19, 2015
33
Kraft Foods Group, Inc.
Consolidated Statements of Earnings
(in millions of U.S. dollars, except per share data)
For the Years Ended | |||||||||||
December 27, 2014 | December 28, 2013 | December 29, 2012 | |||||||||
Net revenues | $ | 18,205 | $ | 18,218 | $ | 18,271 | |||||
Cost of sales | 13,360 | 11,395 | 12,499 | ||||||||
Gross profit | 4,845 | 6,823 | 5,772 | ||||||||
Selling, general and administrative expenses | 2,956 | 2,124 | 2,961 | ||||||||
Asset impairment and exit costs | (1 | ) | 108 | 141 | |||||||
Operating income | 1,890 | 4,591 | 2,670 | ||||||||
Interest and other expense, net | (484 | ) | (501 | ) | (258 | ) | |||||
Royalty income from Mondelēz International | — | — | 41 | ||||||||
Earnings before income taxes | 1,406 | 4,090 | 2,453 | ||||||||
Provision for income taxes | 363 | 1,375 | 811 | ||||||||
Net earnings | $ | 1,043 | $ | 2,715 | $ | 1,642 | |||||
Per share data: | |||||||||||
Basic earnings per share | $ | 1.75 | $ | 4.55 | $ | 2.77 | |||||
Diluted earnings per share | $ | 1.74 | $ | 4.51 | $ | 2.75 | |||||
Dividends declared | $ | 2.15 | $ | 2.05 | $ | 0.50 | |||||
See accompanying notes to the consolidated financial statements.
34
Kraft Foods Group, Inc.
Consolidated Statements of Comprehensive Earnings
(in millions of U.S. dollars)
For the Years Ended | |||||||||||
December 27, 2014 | December 28, 2013 | December 29, 2012 | |||||||||
Net earnings | $ | 1,043 | $ | 2,715 | $ | 1,642 | |||||
Other comprehensive (losses) / earnings: | |||||||||||
Currency translation adjustment | (91 | ) | (68 | ) | 36 | ||||||
Postemployment benefits: | |||||||||||
Prior service credits arising during the period | 58 | 31 | — | ||||||||
Amortization of prior service credits and other amounts reclassified from accumulated other comprehensive losses | (20 | ) | (22 | ) | (6 | ) | |||||
Tax (expense) / benefit | (14 | ) | (3 | ) | 2 | ||||||
Derivatives accounted for as hedges: | |||||||||||
Net derivative gains / (losses) | 90 | 33 | (322 | ) | |||||||
Amounts reclassified from accumulated other comprehensive losses | (84 | ) | 4 | 112 | |||||||
Tax (expense) / benefit | (2 | ) | (14 | ) | 80 | ||||||
Total other comprehensive losses | (63 | ) | (39 | ) | (98 | ) | |||||
Comprehensive earnings | $ | 980 | $ | 2,676 | $ | 1,544 | |||||
See accompanying notes to the consolidated financial statements.
35
Kraft Foods Group, Inc.
Consolidated Balance Sheets
(in millions of U.S. dollars)
December 27, 2014 | December 28, 2013 | ||||||
ASSETS | |||||||
Cash and cash equivalents | $ | 1,293 | $ | 1,686 | |||
Receivables (net of allowances of $21 in 2014 and $26 in 2013) | 1,080 | 1,048 | |||||
Inventories | 1,775 | 1,616 | |||||
Deferred income taxes | 384 | 360 | |||||
Other current assets | 259 | 198 | |||||
Total current assets | 4,791 | 4,908 | |||||
Property, plant and equipment, net | 4,192 | 4,115 | |||||
Goodwill | 11,404 | 11,505 | |||||
Intangible assets, net | 2,234 | 2,229 | |||||
Other assets | 326 | 391 | |||||
TOTAL ASSETS | $ | 22,947 | $ | 23,148 | |||
LIABILITIES | |||||||
Current portion of long-term debt | $ | 1,405 | $ | 4 | |||
Accounts payable | 1,537 | 1,548 | |||||
Accrued marketing | 511 | 685 | |||||
Accrued employment costs | 163 | 184 | |||||
Dividends payable | 324 | 313 | |||||
Accrued postretirement health care costs | 192 | 197 | |||||
Other current liabilities | 641 | 479 | |||||
Total current liabilities | 4,773 | 3,410 | |||||
Long-term debt | 8,627 | 9,976 | |||||
Deferred income taxes | 340 | 662 | |||||
Accrued pension costs | 1,105 | 405 | |||||
Accrued postretirement health care costs | 3,399 | 3,080 | |||||
Other liabilities | 338 | 428 | |||||
TOTAL LIABILITIES | 18,582 | 17,961 | |||||
Commitments and Contingencies (Note 11) | |||||||
EQUITY | |||||||
Common stock, no par value (5,000,000,000 shares authorized; 601,402,816 shares issued at December 27, 2014 and 596,843,449 at December 28, 2013) | — | — | |||||
Additional paid-in capital | 4,678 | 4,434 | |||||
Retained earnings | 1,045 | 1,281 | |||||
Accumulated other comprehensive losses | (562 | ) | (499 | ) | |||
Treasury stock, at cost | (796 | ) | (29 | ) | |||
TOTAL EQUITY | 4,365 | 5,187 | |||||
TOTAL LIABILITIES AND EQUITY | $ | 22,947 | $ | 23,148 | |||
See accompanying notes to the consolidated financial statements.
36
Kraft Foods Group, Inc.
Consolidated Statements of Equity
(in millions of U.S. dollars, except per share data)
Common Stock | Additional Paid-in Capital | Parent Company Investment | Retained Earnings / (Deficit) | Accumulated Other Comprehensive Losses | Treasury Stock | Total Equity | |||||||||||||||||||||
Balance at December 31, 2011 | $ | — | $ | — | $ | 16,713 | $ | — | $ | (125 | ) | $ | — | $ | 16,588 | ||||||||||||
Comprehensive earnings / (losses): | |||||||||||||||||||||||||||
Net earnings | — | — | 1,552 | 90 | — | — | 1,642 | ||||||||||||||||||||
Other comprehensive losses, net of income taxes | — | — | — | — | (98 | ) | — | (98 | ) | ||||||||||||||||||
Consummation of spin-off transaction on October 1, 2012 | — | 4,208 | (7,670 | ) | — | (233 | ) | — | (3,695 | ) | |||||||||||||||||
Net transfers to / from Mondelēz International | — | — | (10,595 | ) | — | (4 | ) | — | (10,599 | ) | |||||||||||||||||
Exercise of stock options, issuance of other stock awards, and other | — | 32 | — | — | — | (2 | ) | 30 | |||||||||||||||||||
Dividends declared ($0.50 per share) | — | — | — | (296 | ) | — | — | (296 | ) | ||||||||||||||||||
Balance at December 29, 2012 | $ | — | $ | 4,240 | $ | — | $ | (206 | ) | $ | (460 | ) | $ | (2 | ) | $ | 3,572 | ||||||||||
Comprehensive earnings / (losses): | |||||||||||||||||||||||||||
Net earnings | — | — | — | 2,715 | — | — | 2,715 | ||||||||||||||||||||
Other comprehensive losses, net of income taxes | — | — | — | — | (39 | ) | — | (39 | ) | ||||||||||||||||||
Exercise of stock options, issuance of other stock awards, and other | — | 194 | — | — | — | (27 | ) | 167 | |||||||||||||||||||
Dividends declared ($2.05 per share) | — | — | — | (1,228 | ) | — | — | (1,228 | ) | ||||||||||||||||||
Balance at December 28, 2013 | $ | — | $ | 4,434 | $ | — | $ | 1,281 | $ | (499 | ) | $ | (29 | ) | $ | 5,187 | |||||||||||
Comprehensive earnings / (losses): | |||||||||||||||||||||||||||
Net earnings | — | — | — | 1,043 | — | — | 1,043 | ||||||||||||||||||||
Other comprehensive losses, net of income taxes | — | — | — | — | (63 | ) | — | (63 | ) | ||||||||||||||||||
Exercise of stock options, issuance of other stock awards, and other | — | 244 | — | — | — | (21 | ) | 223 | |||||||||||||||||||
Repurchase of common stock under share repurchase program | — | — | — | — | — | (746 | ) | (746 | ) | ||||||||||||||||||
Dividends declared ($2.15 per share) | — | — | — | (1,279 | ) | — | — | (1,279 | ) | ||||||||||||||||||
Balance at December 27, 2014 | $ | — | $ | 4,678 | $ | — | $ | 1,045 | $ | (562 | ) | $ | (796 | ) | $ | 4,365 | |||||||||||
See accompanying notes to the consolidated financial statements.
37
Kraft Foods Group, Inc.
Consolidated Statements of Cash Flows
(in millions of U.S. dollars)
For the Years Ended | |||||||||||
December 27, 2014 | December 28, 2013 | December 29, 2012 | |||||||||
CASH PROVIDED BY / (USED IN) OPERATING ACTIVITIES | |||||||||||
Net earnings | $ | 1,043 | $ | 2,715 | $ | 1,642 | |||||
Adjustments to reconcile net earnings to operating cash flows: | |||||||||||
Depreciation and amortization | 385 | 393 | 428 | ||||||||
Stock-based compensation expense | 95 | 65 | 54 | ||||||||
Deferred income tax provision | (361 | ) | 708 | 470 | |||||||
Asset impairments | — | 28 | 28 | ||||||||
Market-based impacts to postemployment benefit plans | 1,341 | (1,561 | ) | 223 | |||||||
Other non-cash expense, net | 67 | 138 | 159 | ||||||||
Change in assets and liabilities: | |||||||||||
Receivables, net | (22 | ) | 35 | 220 | |||||||
Inventories | (53 | ) | 235 | 21 | |||||||
Accounts payable | 45 | 45 | (241 | ) | |||||||
Other current assets | (41 | ) | (9 | ) | (61 | ) | |||||
Other current liabilities | (164 | ) | (217 | ) | 205 | ||||||
Change in pension and postretirement assets and liabilities, net | (315 | ) | (532 | ) | (113 | ) | |||||
Net cash provided by operating activities | 2,020 | 2,043 | 3,035 | ||||||||
CASH (USED IN) / PROVIDED BY INVESTING ACTIVITIES | |||||||||||
Capital expenditures | (535 | ) | (557 | ) | (440 | ) | |||||
Proceeds from sale of property, plant and equipment | 2 | 131 | 18 | ||||||||
Other investing activities | (2 | ) | — | — | |||||||
Net cash used in investing activities | (535 | ) | (426 | ) | (422 | ) | |||||
CASH (USED IN) / PROVIDED BY FINANCING ACTIVITIES | |||||||||||
Dividends paid | (1,266 | ) | (1,207 | ) | — | ||||||
Repurchase of common stock under share repurchase program | (740 | ) | — | — | |||||||
Proceeds from stock option exercises | 115 | 96 | 14 | ||||||||
Long-term debt proceeds | — | — | 5,963 | ||||||||
Net transfers to Mondelēz International | — | — | (7,210 | ) | |||||||
Other financing activities | 25 | (60 | ) | (125 | ) | ||||||
Net cash used in financing activities | (1,866 | ) | (1,171 | ) | (1,358 | ) | |||||
Effect of exchange rate changes on cash and cash equivalents | (12 | ) | (15 | ) | — | ||||||
Cash and cash equivalents: | |||||||||||
(Decrease) / increase | (393 | ) | 431 | 1,255 | |||||||
Balance at beginning of period | 1,686 | 1,255 | — | ||||||||
Balance at end of period | $ | 1,293 | $ | 1,686 | $ | 1,255 | |||||
Cash paid: | |||||||||||
Interest | $ | 487 | $ | 481 | $ | 152 | |||||
Income taxes | $ | 745 | $ | 799 | $ | 236 | |||||
See accompanying notes to the consolidated financial statements.
38
Kraft Foods Group, Inc.
Notes to Consolidated Financial Statements
Note 1. Summary of Significant Accounting Policies
Description of Business:
Kraft Foods Group, Inc. (“Kraft Foods Group,” “we,” “us,” and “our”) manufactures and markets food and beverage products, including cheese, meats, refreshment beverages, coffee, packaged dinners, refrigerated meals, snack nuts, dressings, and other grocery products, primarily in the United States and Canada. Our product categories span breakfast, lunch, and dinner meal occasions.
On October 1, 2012, Mondelēz International, Inc. (“Mondelēz International,” formerly known as Kraft Foods Inc.) created us as an independent public company through a spin-off of its North American grocery business to Mondelēz International’s shareholders (the “Spin-Off”). Mondelēz International distributed 592 million shares of Kraft Foods Group common stock to Mondelēz International’s shareholders. Holders of Mondelēz International common stock received one share of Kraft Foods Group common stock for every three shares of Mondelēz International common stock held on September 19, 2012.
Principles of Consolidation:
The consolidated financial statements include Kraft Foods Group, as well as our wholly-owned subsidiaries. All intercompany transactions are eliminated. Our period end date for financial reporting purposes is the last Saturday of the fiscal year, which aligns with the financial close dates of our operating segments.
Prior to the Spin-Off on October 1, 2012, our financial statements were prepared on a stand-alone basis and were derived from the consolidated financial statements and accounting records of Mondelēz International. Our financial statements included certain expenses of Mondelēz International that were allocated to us for certain functions, including general corporate expenses related to finance, legal, information technology, human resources, compliance, shared services, insurance, employee benefits and incentives, and stock-based compensation. These expenses were allocated in our historical results of operations on the basis of direct usage when identifiable, with the remainder allocated on the basis of revenue, operating income, or headcount. We consider the expense allocation methodology and results to be reasonable for all periods presented. However, these allocations were not necessarily indicative of the actual expenses we would have incurred as an independent public company or of the costs we will incur in the future, and may differ substantially from the allocations we agreed to in the various separation agreements.
Use of Estimates:
We prepare our consolidated financial statements in accordance with U.S. GAAP, which requires us to make accounting policy elections, estimates, and assumptions that affect a number of amounts in our consolidated financial statements. We base our estimates on historical experience and other assumptions that we believe are reasonable. If actual amounts differ from estimates, we include the revisions in our consolidated results of operations in the period the actual amounts become known. Historically, the aggregate differences, if any, between our estimates and actual amounts in any year have not had a material effect on our consolidated financial statements.
Cash and Cash Equivalents:
Cash equivalents include demand deposits with banks and all highly liquid investments with original maturities of three months or less.
Inventories:
Inventories are stated at the lower of cost or market. We value all our inventories using the average cost method.
Long-Lived Assets:
Property, plant and equipment are stated at historical cost and depreciated by the straight-line method over the estimated useful lives of the assets. Machinery and equipment are depreciated over periods ranging from 3 to 20 years and buildings and improvements over periods up to 40 years. Capitalized software costs are included in property, plant and equipment and amortized on a straight-line basis over the estimated useful lives of the software, which do not exceed seven years.
We review long-lived assets for impairment when conditions exist that indicate the carrying amount of the assets may not be fully recoverable. Such conditions include significant adverse changes in the business climate, current-period operating or cash flow losses, significant declines in forecasted operations, or a current expectation that an
39
asset group will be disposed of before the end of its useful life. We perform undiscounted operating cash flow analyses to determine if an impairment exists. When testing for impairment of assets held for use, we group assets and liabilities at the lowest level for which cash flows are separately identifiable. If an impairment is determined to exist, the loss is calculated based on estimated fair value. Impairment losses on assets to be disposed of, if any, are based on the estimated proceeds to be received, less costs of disposal.
Goodwill and Intangible Assets:
We test goodwill and indefinite-lived intangible assets for impairment at least annually in the fourth quarter or when a triggering event occurs. The first step of the goodwill impairment test compares the reporting unit’s estimated fair value with its carrying value. We estimate a reporting unit’s fair value using planned growth rates, market-based discount rates, estimates of residual value, and estimates of market multiples. If the carrying value of a reporting unit’s net assets exceeds its fair value, the second step would be applied to measure the difference between the carrying value and implied fair value of goodwill. If the carrying value of goodwill exceeds its implied fair value, the goodwill would be considered impaired and would be reduced to its implied fair value.
We test indefinite-lived intangible assets for impairment by comparing the fair value of each intangible asset with its carrying value. Fair value of indefinite-lived intangible assets is determined using planned growth rates, market-based discount rates, and estimates of royalty rates. If the carrying value exceeds fair value, the intangible asset would be considered impaired and would be reduced to fair value.
Estimating the fair value of individual reporting units or intangible assets requires us to make assumptions and estimates regarding our future plans, as well as industry and economic conditions. These assumptions and estimates include projected revenues and income, interest rates, cost of capital, royalty rate, and tax rates.
Insurance and Self-Insurance:
We use a combination of insurance and self-insurance for a number of risks, including workers' compensation, general liability, automobile liability, product liability, and our obligation for employee health care benefits. We estimate the liabilities associated with these risks by considering historical claims experience and other actuarial assumptions.
Revenue Recognition:
We recognize revenues when title and risk of loss pass to our customers. We record revenues net of consumer incentives and trade promotions and include all shipping and handling charges billed to customers. We also record provisions for estimated product returns and customer allowances as reductions to revenues within the same period that the revenue is recognized. We base these estimates principally on historical and current period experience, however, it is reasonably likely that actual experiences will vary from the estimates we make.
Marketing and Research and Development:
We promote our products with advertising and consumer promotions, consumer incentives, and trade promotions. Consumer incentives and trade promotions include, but are not limited to, discounts, coupons, rebates, in-store display incentives, and volume-based incentives. Consumer incentive and trade promotion activities are recorded as a reduction to revenues based on amounts estimated as being due to customers and consumers at the end of a period. We base these estimates principally on historical utilization and redemption rates.
For interim reporting purposes, we charge advertising and consumer promotion expenses to operations as a percentage of volume, based on estimated volume and related expense for the full year. We review and adjust these estimates each quarter based on actual experience and other information. Advertising expense was $652 million in 2014, $747 million in 2013, and $640 million in 2012. We record marketing expense in selling, general and administrative expense, except for consumer incentives and trade promotions, which are recorded in net revenues.
We expense costs as incurred for product research and development within selling, general and administrative expenses. Research and development expense was $149 million in 2014, $142 million in 2013, and $143 million in 2012. The amounts disclosed in prior periods have been revised to exclude market-based impacts to postemployment benefit plans and certain other costs that are not directly associated with our research and development activities. The impacts of these revisions to the disclosure were not material to any prior period.
40
Environmental Costs:
We are subject to various laws and regulations in the United States and Canada relating to the protection of the environment. We accrue for environmental remediation obligations on an undiscounted basis when amounts are probable and can be reasonably estimated. The accruals are adjusted based on new information or as circumstances change. We record recoveries of environmental remediation costs from third parties as assets when we believe these amounts are receivable. As of December 27, 2014, we were involved in 56 active proceedings in the United States under the Comprehensive Environmental Response, Compensation and Liability Act (and other similar state actions and legislation) related to our current operations and certain closed, inactive or divested operations for which we retain liability.
As of December 27, 2014, we had accrued an amount we deemed appropriate for environmental remediation. Based on information currently available, we believe that the ultimate resolution of existing environmental remediation actions and our compliance in general with environmental laws and regulations will not have a material effect on our financial condition or results from operations. However, we cannot quantify with certainty the potential impact of future compliance efforts and environmental remediation actions.
Postemployment Benefit Plans:
We provide a range of benefits to our eligible employees and retirees. These include defined benefit pension, postretirement health care, defined contribution, and multiemployer pension and medical benefits. Our pension, postretirement, and other postemployment (collectively, “postemployment”) benefit plans cover most salaried and certain hourly employees. The cost of these plans is charged to expense over the working life of the covered employees.
We account for defined benefit costs using a mark-to-market policy. Under this accounting method, we recognize net actuarial gains or losses and changes in the fair value of plan assets in cost of sales and selling, general and administrative expenses immediately upon remeasurement, which is at least annually.
Financial Instruments:
As we operate primarily in North America but source our commodities on global markets and periodically enter into financing or other arrangements abroad, we use a variety of risk management strategies and financial instruments to manage commodity price, foreign currency exchange rate, and interest rate risks. Our risk management program focuses on the unpredictability of financial markets and seeks to reduce the potentially adverse effects that the volatility of these markets may have on our operating results. One way we do this is through actively hedging our risks through the use of derivative instruments. As a matter of policy, we do not use highly leveraged derivative instruments, nor do we use financial instruments for speculative purposes.
Derivatives are recorded on our consolidated balance sheets at fair value, which fluctuates based on changing market conditions.
Certain derivatives are designated as cash flow hedges and qualify for hedge accounting treatment, while others do not qualify and are marked to market through earnings. For cash flow hedges, changes in fair value are deferred in accumulated other comprehensive earnings / (losses) within equity until the underlying hedged items are recognized in net earnings. Accordingly, we record deferred cash flow hedge gains or losses in cost of sales when the related inventory is sold and in interest and other expense, net, when the related debt interest expense is recorded. Cash flows from derivative instruments are also classified in the same manner as the underlying hedged items in the consolidated statement of cash flows. For additional information on derivative activity within our operating results, see Note 10, Financial Instruments.
To qualify for hedge accounting, a specified level of hedging effectiveness between the hedging instrument and the item being hedged must be achieved at inception and maintained throughout the hedged period. Any hedging ineffectiveness is recognized in net earnings when the change in the value of the hedge does not offset the change in the value of the underlying hedged item. We formally document our risk management objectives, strategies for undertaking the various hedge transactions, the nature of and relationships between the hedging instruments and hedged items, and method for assessing hedge effectiveness. Additionally, for qualified hedges of forecasted transactions, we specifically identify the significant characteristics and expected terms of the forecasted transactions. If it becomes probable that a forecasted transaction will not occur, the hedge will no longer be effective and all of the derivative gains or losses would be recognized in earnings in the current period.
Unrealized gains and losses on our derivatives not designated as hedging instruments as well as the ineffective portion of unrealized gains and losses on our derivatives designated as hedging instruments, are recorded in
41
Corporate until realized. Once realized, the gains and losses are recorded within the applicable segment operating results.
When we use financial instruments, we are exposed to credit risk that a counterparty might fail to fulfill its performance obligations under the terms of our agreement. We minimize our credit risk by entering into transactions with counterparties with investment grade credit ratings, limiting the amount of exposure we have with each counterparty, and monitoring the financial condition of our counterparties. We also maintain a policy of requiring that all significant, non-exchange traded derivative contracts with a duration of greater than one year be governed by an International Swaps and Derivatives Association master agreement. We are also exposed to market risk as the value of our financial instruments might be adversely affected by a change in foreign currency exchange rates, commodity prices, or interest rates. We manage market risk by incorporating monitoring parameters within our risk management strategy that limit the types of derivative instruments and derivative strategies we use and the degree of market risk that we hedge with derivative instruments.
Commodity cash flow hedges – We are exposed to price risk related to forecasted purchases of certain commodities that we primarily use as raw materials. We enter into commodity forward contracts primarily for coffee beans, meat products, sugar, wheat, and dairy products. Commodity forward contracts generally are not subject to the accounting requirements for derivative instruments and hedging activities under the normal purchases exception. We also use commodity futures and options to hedge the price of certain commodity costs, including dairy products, coffee beans, meat products, wheat, corn products, soybean oils, sugar, and natural gas. Some of these derivative instruments are highly effective and qualify for hedge accounting treatment. We also sell commodity futures to unprice future purchase commitments, and we occasionally use related futures to cross-hedge a commodity exposure.
Foreign currency cash flow hedges – We use various financial instruments to mitigate our exposure to changes in exchange rates from third-party and intercompany actual and forecasted transactions. These instruments may include forward foreign exchange contracts and foreign currency options. We primarily use these instruments to hedge our exposure to the Canadian dollar. Substantially all of these derivative instruments are highly effective and qualify for hedge accounting treatment.
Interest rate cash flow hedges – We use derivative instruments, including interest rate swaps, as part of our interest rate risk management strategy. We primarily use interest rate swaps to hedge the variability of interest payment cash flows on a portion of our future debt obligations. Substantially all of these derivative instruments are highly effective and qualify for hedge accounting treatment.
Income Taxes:
We recognize income taxes based on amounts refundable or payable for the current year and record deferred tax assets or liabilities for any difference between U.S. GAAP accounting and tax reporting. We also recognize deferred tax assets for temporary differences, operating loss carryforwards, and tax credit carryforwards. Inherent in determining our annual tax rate are judgments regarding business plans, planning opportunities, and expectations about future outcomes. Realization of certain deferred tax assets, primarily net operating loss and other carryforwards, is dependent upon generating sufficient taxable income in the appropriate jurisdiction prior to the expiration of the carryforward periods. See Note 12, Income Taxes, for additional information.
We apply a more-likely-than-not threshold to the recognition and derecognition of uncertain tax positions. Accordingly, we recognize the amount of tax benefit that has a greater than 50 percent likelihood of being ultimately realized upon settlement. Future changes in judgment related to the expected ultimate resolution of uncertain tax positions will affect earnings in the quarter of such change.
New Accounting Pronouncements:
In April 2014, the Financial Accounting Standards Board (the "FASB") issued an accounting standard update ("ASU") that modified the criteria for reporting the disposal of a component of an entity as discontinued operations. In addition, the ASU requires additional disclosures about discontinued operations. The ASU will be effective for all disposals of components of an entity that occur during our fiscal year 2015 and thereafter. We do not expect the adoption of this guidance to have a material impact on our financial statements and related disclosures.
In May 2014, the FASB issued an ASU that supersedes existing revenue recognition guidance. Under the new ASU, an entity will apply a principles-based five step model to recognize revenue upon the transfer of promised goods or services to customers and in an amount that reflects the consideration for which the entity expects to be entitled in exchange for those goods or services. The ASU will be effective beginning in the first quarter of our fiscal year
42
2017. Early adoption is not permitted. We are currently evaluating the impact that this ASU will have on our financial statements and related disclosures.
Note 2. Inventories
Inventories at December 27, 2014 and December 28, 2013 were:
December 27, 2014 | December 28, 2013 | ||||||
(in millions) | |||||||
Raw materials | $ | 481 | $ | 453 | |||
Work in process | 296 | 294 | |||||
Finished product | 998 | 869 | |||||
Inventories | $ | 1,775 | $ | 1,616 | |||
Note 3. Property, Plant and Equipment
Property, plant and equipment at December 27, 2014 and December 28, 2013 were:
December 27, 2014 | December 28, 2013 | ||||||
(in millions) | |||||||
Land | $ | 79 | $ | 72 | |||
Buildings and improvements | 1,881 | 1,806 | |||||
Machinery and equipment | 5,619 | 5,584 | |||||
Construction in progress | 464 | 360 | |||||
8,043 | 7,822 | ||||||
Accumulated depreciation | (3,851 | ) | (3,707 | ) | |||
Property, plant and equipment, net | $ | 4,192 | $ | 4,115 | |||
In 2013, we sold and leased back two of our headquarters facilities for a loss of approximately $36 million. We received net proceeds of $101 million in connection with the sales.
Note 4. Goodwill and Intangible Assets
Goodwill by reportable segment at December 27, 2014 and December 28, 2013 was:
December 27, 2014 | December 28, 2013 | ||||||
(in millions) | |||||||
Cheese | $ | 3,000 | $ | 3,000 | |||
Refrigerated Meals | 985 | 985 | |||||
Beverages | 1,290 | 1,290 | |||||
Meals & Desserts | 1,572 | 1,572 | |||||
Enhancers & Snack Nuts | 2,644 | 2,644 | |||||
Canada | 1,051 | 1,141 | |||||
Other Businesses | 862 | 873 | |||||
Goodwill | $ | 11,404 | $ | 11,505 | |||
The change in Goodwill during 2014 of $101 million reflects the impact of foreign currency.
Intangible assets consist primarily of indefinite-lived trademarks. Amortizing intangible assets were insignificant in both periods presented.
We test goodwill and indefinite-lived intangible assets for impairment at least annually in the fourth quarter or when a triggering event occurs. There were no impairments of goodwill or intangible assets in 2014, 2013, or 2012. During our annual 2014 indefinite-lived intangible asset impairment test, we noted that a $958 million trademark and
43
a $261 million trademark within our Enhancers business had excess fair values over their carrying values of less than 20%. While these trademarks passed the 2014 impairment test, if our projections of future operating income were to decline, or if valuation factors outside of our control, such as discount rates, change unfavorably, the estimated fair value of one or both of these trademarks could be adversely affected, leading to a potential impairment in the future.
Note 5. Cost Savings Initiatives
Cost savings initiatives are related to reorganization activities including severance, asset disposals, and other activities. Included within cost savings initiatives are activities related to the previously disclosed multi-year restructuring program (the "Restructuring Program"), which we completed as of December 27, 2014.
Total Cost Savings Initiatives Expenses:
We recorded expenses related to our cost savings initiatives in the consolidated financial statements as follows:
For the Years Ended | |||||||||||
December 27, 2014 | December 28, 2013 | December 29, 2012 | |||||||||
(in millions) | |||||||||||
Restructuring costs - Asset impairment and exit costs | $ | (1 | ) | $ | 108 | $ | 141 | ||||
Implementation costs - Cost of sales | 12 | 77 | 97 | ||||||||
Implementation costs - Selling, general and administrative expenses | — | 65 | 34 | ||||||||
Spin-Off transition costs - Selling, general and administrative expenses | 4 | 32 | 31 | ||||||||
Other cost savings initiatives expenses - Cost of sales | 49 | — | — | ||||||||
Other cost savings initiatives expenses - Selling, general and administrative expenses | 43 | 8 | — | ||||||||
$ | 107 | $ | 290 | $ | 303 | ||||||
Cost Savings Initiatives Expenses by Segment:
During 2014, 2013, and 2012, we recorded cost savings initiatives expenses within segment operating income as follows:
For the Year Ended December 27, 2014 | |||||||||||||||||||
Restructuring Program | |||||||||||||||||||
Restructuring Costs | Implementation Costs | Spin-Off Transition Costs | Other Cost Savings Initiatives Expenses | Total | |||||||||||||||
(in millions) | |||||||||||||||||||
Cheese | $ | 1 | $ | 6 | $ | — | $ | 12 | $ | 19 | |||||||||
Refrigerated Meals | — | 2 | — | 29 | 31 | ||||||||||||||
Beverages | (2 | ) | 1 | — | 9 | 8 | |||||||||||||
Meals & Desserts | — | 2 | — | 28 | 30 | ||||||||||||||
Enhancers & Snack Nuts | — | — | — | 8 | 8 | ||||||||||||||
Canada | — | 1 | — | 2 | 3 | ||||||||||||||
Other Businesses | — | — | — | 3 | 3 | ||||||||||||||
Corporate expenses | — | — | 4 | 1 | 5 | ||||||||||||||
Total | $ | (1 | ) | $ | 12 | $ | 4 | $ | 92 | $ | 107 | ||||||||
44
For the Year Ended December 28, 2013 | |||||||||||||||||||
Restructuring Program | |||||||||||||||||||
Restructuring Costs | Implementation Costs | Spin-Off Transition Costs | Other Cost Savings Initiatives Expenses | Total | |||||||||||||||
(in millions) | |||||||||||||||||||
Cheese | $ | 26 | $ | 62 | $ | — | $ | — | $ | 88 | |||||||||
Refrigerated Meals | 18 | 17 | — | — | 35 | ||||||||||||||
Beverages | 19 | 22 | — | — | 41 | ||||||||||||||
Meals & Desserts | 14 | 12 | — | — | 26 | ||||||||||||||
Enhancers & Snack Nuts | 12 | 12 | — | — | 24 | ||||||||||||||
Canada | 10 | 7 | — | — | 17 | ||||||||||||||
Other Businesses | 9 | 10 | — | — | 19 | ||||||||||||||
Corporate expenses | — | — | 32 | 8 | 40 | ||||||||||||||
Total | $ | 108 | $ | 142 | $ | 32 | $ | 8 | $ | 290 | |||||||||
For the Year Ended December 29, 2012 | |||||||||||||||||||
Restructuring Program | |||||||||||||||||||
Restructuring Costs | Implementation Costs | Spin-Off Transition Costs | Other Cost Savings Initiatives Expenses | Total | |||||||||||||||
(in millions) | |||||||||||||||||||
Cheese | $ | 26 | $ | 72 | $ | — | $ | — | $ | 98 | |||||||||
Refrigerated Meals | 19 | 11 | — | — | 30 | ||||||||||||||
Beverages | 44 | 19 | — | — | 63 | ||||||||||||||
Meals & Desserts | 15 | 9 | — | — | 24 | ||||||||||||||
Enhancers & Snack Nuts | 17 | 8 | — | — | 25 | ||||||||||||||
Canada | 9 | 5 | — | — | 14 | ||||||||||||||
Other Businesses | 11 | 7 | — | — | 18 | ||||||||||||||
Corporate expenses | — | — | 31 | — | 31 | ||||||||||||||
Total | $ | 141 | $ | 131 | $ | 31 | $ | — | $ | 303 | |||||||||
Restructuring Program:
Our Restructuring Program included the following:
• | Restructuring costs that qualified for special accounting treatment as exit or disposal activities. |
• | Implementation costs that were directly attributable to the Restructuring Program, but did not qualify for special accounting treatment as exit or disposal activities. These costs primarily related to reorganization costs associated with our sales function, our information systems infrastructure, and accelerated depreciation on assets. |
• | Transition costs related to the Spin-Off. The Spin-Off transition costs were not allocated to the segments because they consisted mostly of professional service fees within our finance, legal, and information systems functions. |
At December 27, 2014, we incurred Restructuring Program costs of $600 million since the inception of the Restructuring Program. We spent $291 million in cash. We spent cash related to our Restructuring Program of $30 million in 2014, $150 million in 2013, and $111 million in 2012. We did not incur any non-cash costs in 2014. We incurred non-cash costs of $157 million in 2013 and $151 million in 2012.
45
Restructuring Costs Liability:
At December 27, 2014, the restructuring costs liability balance within other current liabilities was as follows:
Severance and Related Costs | |||
(in millions) | |||
Liability balance, December 28, 2013 | $ | 19 | |
Restructuring costs | (1 | ) | |
Cash spent on restructuring costs | (12 | ) | |
Foreign exchange | (1 | ) | |
Liability balance, December 27, 2014 | $ | 5 | |
Note 6. Debt
Borrowing Arrangements:
On May 29, 2014, we entered into a new $3.0 billion five-year senior unsecured revolving credit facility that expires on May 29, 2019 unless extended. The credit facility enables us to borrow up to $3.0 billion, which may be increased by up to $1.0 billion in the aggregate with the agreement of the lenders providing any increased commitments. All committed borrowings under the facility bear interest at a variable annual rate based on the London Inter-Bank Offered Rate or a defined base rate, at our election, plus an applicable margin based on the ratings of our long-term senior unsecured indebtedness. The credit facility requires us to maintain a minimum total shareholders’ equity (excluding accumulated other comprehensive income or losses and any income or losses recognized in connection with “mark-to-market” accounting in respect of pension and other retirement plans) of at least $2.4 billion and also contains customary representations, covenants, and events of default. At December 27, 2014 and for the year ended December 27, 2014, no amounts were drawn on this credit facility. The credit facility replaced our $3.0 billion five-year credit agreement dated as of May 18, 2012.
Long-Term Debt:
Our long-term debt consists of the following at December 27, 2014 and December 28, 2013:
December 27, 2014 | December 28, 2013 | Maturity Date | Fixed Interest Rate | Payment Period | |||||||||||
(in millions) | |||||||||||||||
Senior unsecured notes | $ | 1,000 | $ | 1,000 | June 4, 2015 | 1.625 | % | Semiannually | |||||||
Senior unsecured notes | 400 | 400 | June 15, 2015 | 7.550 | % | Semiannually | |||||||||
Senior unsecured notes | 1,000 | 1,000 | June 5, 2017 | 2.250 | % | Semiannually | |||||||||
Senior unsecured notes | 1,035 | 1,035 | August 23, 2018 | 6.125 | % | Semiannually | |||||||||
Senior unsecured notes | 900 | 900 | February 10, 2020 | 5.375 | % | Semiannually | |||||||||
Senior unsecured notes | 2,000 | 2,000 | June 6, 2022 | 3.500 | % | Semiannually | |||||||||
Senior unsecured notes | 878 | 878 | January 26, 2039 | 6.875 | % | Semiannually | |||||||||
Senior unsecured notes | 787 | 787 | February 9, 2040 | 6.500 | % | Semiannually | |||||||||
Senior unsecured notes | 2,000 | 2,000 | June 4, 2042 | 5.000 | % | Semiannually | |||||||||
Capital lease obligations | 30 | 31 | |||||||||||||
Other | 2 | (51 | ) | ||||||||||||
Total debt | 10,032 | 9,980 | |||||||||||||
Current portion of long-term debt | (1,405 | ) | (4 | ) | |||||||||||
Total long-term debt | $ | 8,627 | $ | 9,976 | |||||||||||
46
At December 27, 2014, aggregate maturities of our long-term debt were (in millions):
2015 | $ | 1,406 | |
2016 | 6 | ||
2017 | 1,006 | ||
2018 | 1,039 | ||
2019 | 3 | ||
Thereafter | 6,616 | ||
Our long-term debt contains customary representations, covenants, and events of default. We were in compliance with all covenants at December 27, 2014.
Fair Value of Our Debt:
At December 27, 2014, the aggregate fair value of our total debt was $11.0 billion as compared with the carrying value of $10.0 billion. We determined the fair value of our long-term debt using Level 1 quoted prices in active markets for the publicly traded debt obligations.
Interest and Other Expense, Net:
Interest and other expense, net was $484 million in 2014, $501 million in 2013, and $258 million in 2012. Other expense within interest and other expense, net was insignificant for all periods presented.
Note 7. Capital Stock
Our Amended and Restated Articles of Incorporation authorize the issuance of up to 5.0 billion shares of common stock and 500 million shares of preferred stock.
Shares of common stock issued, in treasury and outstanding were:
Shares Issued | Treasury Shares | Shares Outstanding | ||||||
Consummation of Spin-Off on October 1, 2012 | 592,257,298 | — | 592,257,298 | |||||
Exercise of stock options, issuance of other stock awards and other | 526,398 | (19,988 | ) | 506,410 | ||||
Balance at December 29, 2012 | 592,783,696 | (19,988 | ) | 592,763,708 | ||||
Exercise of stock options, issuance of other stock awards and other | 4,059,753 | (589,011 | ) | 3,470,742 | ||||
Balance at December 28, 2013 | 596,843,449 | (608,999 | ) | 596,234,450 | ||||
Shares of common stock repurchased | — | (13,073,863 | ) | (13,073,863 | ) | |||
Exercise of stock options, issuance of other stock awards and other | 4,559,367 | (388,010 | ) | 4,171,357 | ||||
Balance at December 27, 2014 | 601,402,816 | (14,070,872 | ) | 587,331,944 | ||||
At December 27, 2014, we had approximately 0.3 million shares of restricted stock outstanding that were issued to current and former employees. There were no preferred shares issued or outstanding at December 27, 2014, December 28, 2013 or December 29, 2012.
On December 17, 2013, our Board of Directors authorized a $3.0 billion share repurchase program with no expiration date. Under the share repurchase program, we are authorized to repurchase shares of our common stock in the open market or in privately negotiated transactions. The timing and amount of share repurchases are subject to management's evaluation of market conditions, applicable legal requirements, and other factors. We are not obligated to repurchase any shares of our common stock and may suspend the program at our discretion. In 2014, we repurchased approximately 13.1 million shares in the aggregate for approximately $746 million under this program. Approximately $6 million of the $746 million was accrued at December 27, 2014 and settled in the subsequent month. No shares were repurchased under this program in 2013.
47
Note 8. Stock Plans
Under the Kraft Foods Group, Inc. 2012 Performance Incentive Plan (the "2012 Plan"), we may grant eligible employees awards of stock options, stock appreciation rights, restricted stock, and restricted stock units (“RSUs”) as well as performance based long-term incentive awards (“Performance Shares”). In addition, we may grant shares of our common stock to members of the Board of Directors who are not our full-time employees under the 2012 Plan. We are authorized to issue a maximum of 72.0 million shares of our common stock under the 2012 Plan. Stock options and stock appreciation rights granted under the plan reduce the authorized shares available for issue at a ratio of one share per award granted. All other awards granted, such as restricted stock, RSUs, and Performance Shares, reduce the authorized shares available for issue at a ratio of three shares per award granted. At December 27, 2014, there were 32,293,456 shares available to be granted under the 2012 Plan. All stock awards are issued to employees from authorized shares of common stock.
Stock Options:
Stock options are granted with an exercise price equal to the market value of the underlying stock on the grant date, generally become exercisable in three annual installments beginning on the first anniversary of the grant date, and have a maximum term of ten years.
We account for our employee stock options under the fair value method of accounting using a modified Black-Scholes methodology to measure stock option expense at the grant date. The grant date fair value is amortized to expense over the vesting period. We recorded compensation expense related to stock options of $18 million in 2014, $18 million in 2013, and $5 million in 2012 subsequent to the Spin-Off. The deferred tax benefit recorded related to this compensation expense was $6 million in 2014, $6 million in 2013, and $2 million in 2012. The unamortized compensation expense related to our outstanding stock options was $15 million at December 27, 2014 and is expected to be recognized over a weighted average period of two years. Our weighted average Black-Scholes fair value assumptions were as follows:
Risk-Free Interest Rate | Expected Life | Expected Volatility | Expected Dividend Yield | Grant Date Fair Value | |||||||||||
Kraft Foods Group grants | |||||||||||||||
2014 | 1.84 | % | 6 years | 19.33 | % | 3.57 | % | $ | 6.16 | ||||||
2013 | 1.04 | % | 6 years | 19.40 | % | 4.26 | % | $ | 4.41 | ||||||
Mondelēz International grants | |||||||||||||||
2012 | 1.16 | % | 6 years | 20.13 | % | 3.08 | % | $ | 4.78 | ||||||
The risk-free interest rate represents the constant maturity U.S. government treasuries rate with a remaining term equal to the expected life of the options. The expected life is the period over which our employees are expected to hold their options. Due to the lack of historical data, we use the Safe Harbor method which uses the weighted average vesting period and the contractual term of the options to calculate the expected life. Volatility reflects a blended approach which uses historical movements in our stock price and in our peer group for a period commensurate with the expected life of the options. Dividend yield is estimated over the expected life of the options based on our stated dividend policy.
The stock option awards granted in 2012 were prior to the Spin-Off. Therefore, we estimated the value of those awards based on Mondelēz International’s share price and assumptions.
A summary of stock option activity related to our shares for both our and Mondelēz International employees for the year ended December 27, 2014 is presented below. Stock option activity for the year ended December 27, 2014 was:
Options Outstanding | Weighted Average Exercise Price | Average Remaining Contractual Term | Aggregate Intrinsic Value | ||||||||||
Balance at December 28, 2013 | 16,320,655 | $ | 35.26 | ||||||||||
Options granted | 2,601,423 | 55.26 | |||||||||||
Options exercised | (3,610,773 | ) | 32.08 | ||||||||||
Options canceled | (441,139 | ) | 44.39 | ||||||||||
Balance at December 27, 2014 | 14,870,166 | 39.26 | 7 years | $ | 367 | million | |||||||
Exercisable at December 27, 2014 | 9,666,165 | 34.02 | 6 years | $ | 289 | million | |||||||
48
All awards granted prior to the Spin-Off have been adjusted to reflect the conversion as of the Spin-Off. With respect to the Mondelēz International stock options granted prior to the Spin-Off, the converted options retained the vesting schedule and expiration date of the original stock options.
The total intrinsic value of our stock options exercised was $93 million in 2014, $69 million in 2013, and $8 million in 2012 subsequent to the Spin-Off. Cash received from options exercised was $115 million in 2014, $96 million in 2013, and $15 million in 2012. The incremental tax benefit realized for the tax deductions from the option exercises totaled $22 million in 2014, $20 million in 2013, and $1 million in 2012.
Restricted Stock, RSUs, and Performance Shares:
We may grant shares of restricted stock or RSUs to eligible employees and directors, giving them, in most instances, all of the rights of shareholders, except that they may not sell, assign, pledge, or otherwise encumber the shares. Shares of restricted stock and RSUs granted to employees are subject to forfeiture if certain employment conditions are not met. Restricted stock and RSUs generally vest on the third anniversary of the grant date.
Performance Shares vest based on varying performance, market, and service conditions. Our Performance Shares pay accrued dividends at the time of vesting. Shares granted in connection with Mondelēz International’s long-term incentive plan prior to the Spin-Off do not pay dividends. The unvested shares have no voting rights.
The grant date fair value of the restricted stock, RSUs, and Performance Shares is amortized to earnings over the restriction period. We recorded compensation expense related to restricted stock, RSUs, and Performance Shares of $77 million in 2014, $47 million in 2013, and $11 million in 2012 subsequent to the Spin-Off. The deferred tax benefit recorded related to this compensation expense was $28 million in 2014, $17 million in 2013, and $4 million in 2012. The unamortized compensation expense related to our restricted stock, RSUs, and Performance Shares was $97 million at December 27, 2014 and is expected to be recognized over a weighted average period of two years.
Our restricted stock, RSU, and Performance Share activity for the year ended December 27, 2014 was:
Number of Shares | Weighted Average Grant Date Fair Value Per Share | ||||||
Balance at December 28, 2013 | 4,149,797 | $ | 44.99 | ||||
Granted | 1,697,965 | 57.49 | |||||
Vested | (1,424,627 | ) | 36.49 | ||||
Forfeited | (365,483 | ) | 51.52 | ||||
Balance at December 27, 2014 | 4,057,652 | 52.62 | |||||
In February 2014, as part of our equity compensation program:
• | We granted 0.5 million RSUs with a grant date fair value of $55.17 per share. |
• | We granted 0.8 million Performance Shares with a grant date fair value of $59.97 per share. These awards measure performance over a multi-year period, during which the employee may earn shares based on internal financial metrics and the performance of our stock relative to a defined peer group. We measured the grant date fair value using the Monte Carlo simulation model, which assists in estimating the probability of achieving the market conditions stipulated in the award grant. |
• | We granted 0.1 million additional Performance Shares with a weighted average grant date fair value of $34.37 per share (based on the original 2011 award date), which vested immediately. We granted these shares based on the final business performance rating for the 2011-2013 award cycle. These shares were adjusted and converted into new equity awards using a formula designed to preserve the value of the awards immediately prior to the Spin-Off. |
Also during 2014, we granted 0.3 million off-cycle RSUs and Performance Shares with a weighted average grant date fair value per share of $56.80.
During 2014, 1.4 million shares of restricted stock, RSUs, and Performance Shares vested with an aggregate fair value of $79 million.
Prior to the Spin-Off, our employees participated in various Mondelēz International stock-based compensation plans. As such, we were allocated stock-based compensation expense of $39 million in 2012 associated with these
49
plans. In connection with the Spin-Off, we were required to reimburse Mondelēz International for their stock awards that were granted to our employees, and Mondelēz International was required to reimburse us for our stock awards that were granted to their employees. We settled the net amount we owed for this reimbursement of $55 million in March 2013.
Note 9. Postemployment Benefit Plans
We provide a range of benefits to our employees and retirees. These include pension benefits, postretirement health care benefits, and other postemployment benefits, as follows:
• | Pension benefits – We provide pension coverage to certain U.S. and non-U.S. employees through separate plans. Local statutory requirements govern many of these plans. Salaried and non-union hourly employees hired prior to 2009 in the U.S. and 2011 in Canada are eligible to participate in our pension plans. We will freeze U.S. pension plans for U.S. salaried and non-union hourly employees who are currently earning pension benefits as of December 31, 2019 and non-U.S. pension plans for non-U.S. salaried and non-union hourly employees who are currently earning pension benefits as of December 31, 2023. We will calculate the pension benefits using the continuing pay and service through December 31, 2019 for the U.S. plans and December 31, 2023 for the non-U.S. plans. The pension benefits of our unionized workers are in accordance with the applicable collective bargaining agreement covering their employment. |
• | Postretirement benefits – Our U.S. and Canadian subsidiaries provide health care and other postretirement benefits to most retirees. U.S. salaried and non-union hourly employees hired prior to 2004 and non-U.S. salaried and non-union hourly employees hired prior to 2007 are eligible to participate in our U.S. postretirement benefit plans. The postretirement benefits of our unionized workers are in accordance with the applicable collective bargaining agreement covering their employment. |
• | Other postemployment benefits – Our other postemployment benefits consist primarily of severance. These plans cover most salaried and certain hourly employees, and their cost is charged to expense over the working life of the covered employees. |
50
Pension Plans
Obligations and Funded Status:
The projected benefit obligations, plan assets, and funded status of our pension plans at December 27, 2014 and December 28, 2013 were:
U.S. Plans | Non-U.S. Plans | ||||||||||||||
December 27, 2014 | December 28, 2013 | December 27, 2014 | December 28, 2013 | ||||||||||||
(in millions) | |||||||||||||||
Benefit obligation at beginning of year | $ | 5,978 | $ | 7,130 | $ | 1,267 | $ | 1,418 | |||||||
Service cost | 84 | 100 | 14 | 21 | |||||||||||
Interest cost | 287 | 287 | 55 | 55 | |||||||||||
Benefits paid | (518 | ) | (316 | ) | (80 | ) | (79 | ) | |||||||
Actuarial losses / (gains) | 1,160 | (778 | ) | 153 | (47 | ) | |||||||||
Plan amendments | 16 | 9 | — | — | |||||||||||
Currency | — | — | (101 | ) | (98 | ) | |||||||||
Settlements | (13 | ) | (512 | ) | — | — | |||||||||
Curtailments | — | (3 | ) | — | (9 | ) | |||||||||
Special termination benefits | — | 61 | — | 1 | |||||||||||
Other | — | — | 4 | 5 | |||||||||||
Benefit obligation at end of year | 6,994 | 5,978 | 1,312 | 1,267 | |||||||||||
Fair value of plan assets at beginning of year | 5,721 | 5,460 | 1,253 | 1,089 | |||||||||||
Actual return on plan assets | 629 | 654 | 194 | 144 | |||||||||||
Contributions | 145 | 435 | 16 | 181 | |||||||||||
Benefits paid | (518 | ) | (316 | ) | (80 | ) | (79 | ) | |||||||
Currency | — | — | (101 | ) | (82 | ) | |||||||||
Settlements | (13 | ) | (512 | ) | — | — | |||||||||
Fair value of plan assets at end of year | 5,964 | 5,721 | 1,282 | 1,253 | |||||||||||
Net pension liability recognized at end of year | $ | (1,030 | ) | $ | (257 | ) | $ | (30 | ) | $ | (14 | ) | |||
The accumulated benefit obligation, which represents benefits earned to the measurement date, was $6,777 million at December 27, 2014 and $5,781 million at December 28, 2013 for the U.S. pension plans. The accumulated benefit obligation for the non-U.S. pension plans was $1,231 million at December 27, 2014 and $1,191 million at December 28, 2013.
The combined U.S. and non-U.S. pension plans resulted in a net pension liability of $1,060 million at December 27, 2014 and $271 million at December 28, 2013. We recognized these amounts in our consolidated balance sheets at December 27, 2014 and December 28, 2013 as follows:
December 27, 2014 | December 28, 2013 | ||||||
(in millions) | |||||||
Other assets | $ | 64 | $ | 162 | |||
Other current liabilities | (19 | ) | (28 | ) | |||
Accrued pension costs | (1,105 | ) | (405 | ) | |||
$ | (1,060 | ) | $ | (271 | ) | ||
51
Certain of our U.S. and non-U.S. plans are underfunded based on accumulated benefit obligations in excess of plan assets. For these plans, the projected benefit obligations, accumulated benefit obligations, and the fair value of plan assets at December 27, 2014 and December 28, 2013 were:
U.S. Plans | Non-U.S. Plans | ||||||||||||||
December 27, 2014 | December 28, 2013 | December 27, 2014 | December 28, 2013 | ||||||||||||
(in millions) | |||||||||||||||
Projected benefit obligation | $ | 6,994 | $ | 203 | $ | 55 | $ | 52 | |||||||
Accumulated benefit obligation | 6,777 | 186 | 50 | 44 | |||||||||||
Fair value of plan assets | 5,964 | 17 | — | — | |||||||||||
We used the following weighted average assumptions to determine our benefit obligations under the pension plans at December 27, 2014 and December 28, 2013:
U.S. Plans | Non-U.S. Plans | ||||||||||
December 27, 2014 | December 28, 2013 | December 27, 2014 | December 28, 2013 | ||||||||
Discount rate | 4.17 | % | 4.94 | % | 3.87 | % | 4.56 | % | |||
Rate of compensation increase | 4.00 | % | 4.00 | % | 3.00 | % | 3.00 | % | |||
Components of Net Pension Cost / (Benefit):
Net pension cost / (benefit) consisted of the following for the years ended December 27, 2014, December 28, 2013, and December 29, 2012:
U.S. Plans | Non-U.S. Plans | ||||||||||||||||||||||
For the Years Ended | For the Years Ended | ||||||||||||||||||||||
December 27, 2014 | December 28, 2013 | December 29, 2012 | December 27, 2014 | December 28, 2013 | December 29, 2012 | ||||||||||||||||||
(in millions) | |||||||||||||||||||||||
Service cost | $ | 84 | $ | 100 | $ | 32 | $ | 14 | $ | 21 | $ | 12 | |||||||||||
Interest cost | 287 | 287 | 70 | 55 | 55 | 32 | |||||||||||||||||
Expected return on plan assets | (325 | ) | (315 | ) | (105 | ) | (60 | ) | (57 | ) | (43 | ) | |||||||||||
Actuarial losses / (gains) | 783 | (1,154 | ) | (41 | ) | 12 | (128 | ) | 28 | ||||||||||||||
Amortization of prior service costs | 5 | 4 | 1 | — | — | — | |||||||||||||||||
Settlements | 2 | 69 | — | — | — | — | |||||||||||||||||
Curtailments | 3 | (3 | ) | — | — | (9 | ) | — | |||||||||||||||
Special termination benefits | — | 61 | — | — | 1 | — | |||||||||||||||||
Net pension cost / (benefit) | $ | 839 | $ | (951 | ) | $ | (43 | ) | $ | 21 | $ | (117 | ) | $ | 29 | ||||||||
We remeasure all of our postemployment benefit plans at least annually at the end of our fiscal year. We define the costs or benefits resulting from the change in discount rates, the difference between our estimated and actual return on plan assets, and other assumption changes driven by changes in the law or other external factors as market-based impacts from postemployment benefit plans. Market-based impacts are included in actuarial losses / (gains) and in settlements in the table above. We disclose market-based impacts separately in order to provide additional transparency of our operating results.
The remeasurement as of December 27, 2014, resulted in an aggregate expense from market-based impacts of $784 million primarily driven by a 75 basis point weighted average decrease in the discount rate and a $429 million impact from the adoption of the new Society of Actuaries RP-2014 mortality tables, partially offset by excess asset returns. We recorded $477 million of the expense from market-based impacts in cost of sales and $307 million in selling, general and administrative expenses in accordance with our policy for allocating employee costs.
The remeasurement as of December 28, 2013, resulted in an aggregate benefit from market-based impacts of $1,268 million primarily driven by an 80 basis point weighted average increase in the discount rate and excess asset returns. We recorded $707 million of the benefit from market-based impacts in cost of sales and $561 million
52
in selling, general and administrative expenses. The annual remeasurement resulted in a benefit from market-based impacts of $29 million as of December 29, 2012.
In addition, as a result of the December 28, 2013 remeasurement, we capitalized an aggregate benefit of $34 million from market-based impacts related to our pension plans into inventory consistent with our capitalization policy. During 2014, the entire benefit previously capitalized was recognized in cost of sales. At December 27, 2014, we capitalized an aggregate expense of $41 million from market-based impacts into inventory.
Net pension costs included settlement losses of $69 million in 2013 related to retiring employees who elected lump-sum payments. Net pension costs also included special termination benefits associated with our voluntary early retirement program of $62 million in 2013, which were included in our Restructuring Program.
As of December 27, 2014, we expected to amortize an estimated $7 million of prior service costs from accumulated other comprehensive earnings / (losses) into net periodic pension cost for the combined U.S. and non-U.S. pension plans during 2015.
We used the following weighted average assumptions to determine our net pension cost for the years ended December 27, 2014, December 28, 2013, and December 29, 2012:
U.S. Plans | Non-U.S. Plans | ||||||||||||||||
December 27, 2014 | December 28, 2013 | December 29, 2012 | December 27, 2014 | December 28, 2013 | December 29, 2012 | ||||||||||||
Discount rate | 4.86 | % | 4.34 | % | 3.85 | % | 4.56 | % | 4.00 | % | 4.03 | % | |||||
Expected rate of return on plan assets | 5.75 | % | 5.75 | % | 8.00 | % | 5.00 | % | 5.00 | % | 7.04 | % | |||||
Rate of compensation increase | 4.00 | % | 4.00 | % | 4.00 | % | 3.00 | % | 3.00 | % | 3.00 | % | |||||
Year-end discount rates for our U.S. and non-U.S. plans were developed from a model portfolio of high quality, fixed-income debt instruments with durations that match the expected future cash flows of the benefit obligations. We determine our expected rate of return on plan assets from the plan assets’ historical long-term investment performance, current and future asset allocation, and estimates of future long-term returns by asset class.
Plan Assets:
The fair value of pension plan assets at December 27, 2014 was determined using the following fair value measurements:
Asset Category | Total Fair Value | Quoted Prices in Active Markets for Identical Assets (Level 1) | Significant Other Observable Inputs (Level 2) | Significant Unobservable Inputs (Level 3) | |||||||||||
(in millions) | |||||||||||||||
Non-U.S. equity securities | $ | 544 | $ | 526 | $ | 18 | $ | — | |||||||
Pooled funds equity securities | 2,694 | 6 | 2,688 | — | |||||||||||
Total equity securities | 3,238 | 532 | 2,706 | — | |||||||||||
Government bonds | 776 | 625 | 151 | — | |||||||||||
Pooled funds fixed-income securities | 876 | — | 876 | — | |||||||||||
Corporate bonds and other fixed-income securities | 2,061 | — | 2,061 | — | |||||||||||
Total fixed-income securities | 3,713 | 625 | 3,088 | — | |||||||||||
Real estate | 235 | — | — | 235 | |||||||||||
Certain insurance contracts | 53 | — | — | 53 | |||||||||||
Other | 7 | 7 | — | — | |||||||||||
Total | $ | 7,246 | $ | 1,164 | $ | 5,794 | $ | 288 | |||||||
53
The fair value of pension plan assets at December 28, 2013 was determined using the following fair value measurements:
Asset Category | Total Fair Value | Quoted Prices in Active Markets for Identical Assets (Level 1) | Significant Other Observable Inputs (Level 2) | Significant Unobservable Inputs (Level 3) | |||||||||||
(in millions) | |||||||||||||||
Non-U.S. equity securities | $ | 645 | $ | 645 | $ | — | $ | — | |||||||
Pooled funds equity securities | 3,123 | 6 | 3,117 | — | |||||||||||
Total equity securities | 3,768 | 651 | 3,117 | — | |||||||||||
Government bonds | 719 | 621 | 98 | — | |||||||||||
Pooled funds fixed-income securities | 642 | — | 642 | — | |||||||||||
Corporate bonds and other fixed-income securities | 1,566 | 1 | 1,565 | — | |||||||||||
Total fixed-income securities | 2,927 | 622 | 2,305 | — | |||||||||||
Real estate | 214 | — | — | 214 | |||||||||||
Certain insurance contracts | 57 | — | — | 57 | |||||||||||
Other | 8 | 8 | — | — | |||||||||||
Total | $ | 6,974 | $ | 1,281 | $ | 5,422 | $ | 271 | |||||||
Fair value measurements:
• | Level 1 – includes primarily non-U.S. equity securities and certain government bonds valued using quoted prices in active markets. |
• | Level 2 – includes primarily pooled funds valued using net asset values of participation units held in common collective trusts, as reported by the managers of the trusts and as supported by the unit prices of actual purchase and sale transactions. Level 2 plan assets also include corporate bonds and other fixed-income securities, valued using independent observable market inputs, such as matrix pricing, yield curves, and indices. |
• | Level 3 – includes primarily real estate and certain insurance contracts valued using unobservable inputs that reflect the plans’ assumptions that market participants would use in pricing the assets, based on the best information available. Fair value estimates for real estate investments are calculated using the present value of future cash flows expected to be received from the investments, based on valuation methodologies such as appraisals, local market conditions, and current and projected operating performance. Fair value estimates for certain insurance contracts are reported at contract value. |
Changes in our Level 3 plan assets, which are recorded in operations, for the year ended December 27, 2014 included:
Asset Category | December 28, 2013 Balance | Net Realized and Unrealized Gains/(Losses) | Net Purchases, Issuances and Settlements | Net Transfers Into/(Out of) Level 3 | December 27, 2014 Balance | ||||||||||||||
(in millions) | |||||||||||||||||||
Real estate | $ | 214 | $ | 22 | $ | (1 | ) | $ | — | $ | 235 | ||||||||
Certain insurance contracts | 57 | 1 | (5 | ) | — | 53 | |||||||||||||
Total Level 3 investments | $ | 271 | $ | 23 | $ | (6 | ) | $ | — | $ | 288 | ||||||||
54
Changes in our Level 3 plan assets, which are recorded in operations, for the year ended December 28, 2013 included:
Asset Category | December 29, 2012 Balance | Net Realized and Unrealized Gains/(Losses) | Net Purchases, Issuances and Settlements | Net Transfers Into/(Out of) Level 3 | December 28, 2013 Balance | ||||||||||||||
(in millions) | |||||||||||||||||||
Corporate bonds and other fixed-income securities | $ | 7 | $ | — | $ | (2 | ) | $ | (5 | ) | $ | — | |||||||
Real estate | 186 | 27 | 1 | — | 214 | ||||||||||||||
Certain insurance contracts | 66 | 4 | (13 | ) | — | 57 | |||||||||||||
Total Level 3 investments | $ | 259 | $ | 31 | $ | (14 | ) | $ | (5 | ) | $ | 271 | |||||||
The percentage of fair value of pension plan assets at December 27, 2014 and December 28, 2013 was:
U.S. Plans | Non-U.S. Plans | ||||||||||
Asset Category | December 27, 2014 | December 28, 2013 | December 27, 2014 | December 28, 2013 | |||||||
Equity securities | 44 | % | 52 | % | 48 | % | 61 | % | |||
Fixed-income securities | 51 | % | 43 | % | 51 | % | 38 | % | |||
Real estate | 4 | % | 4 | % | — | % | — | % | |||
Certain insurance contracts and other | 1 | % | 1 | % | 1 | % | 1 | % | |||
Total | 100 | % | 100 | % | 100 | % | 100 | % | |||
During 2013, we began a new liability-driven investment strategy for pension assets. This strategy, which will be phased in over time, better aligns our pension assets with the projected benefit obligation to reduce volatility by targeting an investment of approximately 80% of our U.S. plan assets in fixed-income securities and approximately 20% in equity securities. The strategy uses actively managed and indexed U.S. investment grade fixed-income securities (which constitute 97% or more of fixed-income securities) with lesser allocations to high yield fixed-income securities, indexed U.S. equity securities, and actively managed and indexed international equity securities.
For pension plans outside the U.S., the investment strategy is subject to local regulations and the asset / liability profiles of the plans in each individual country. In aggregate, the long-term asset allocation targets of our non-U.S. plans are broadly characterized as a mix of 70% fixed-income securities and 30% equity securities.
We attempt to maintain our target asset allocation by rebalancing between asset classes as we make contributions and monthly benefit payments.
Employer Contributions:
We estimate that 2015 pension contributions will be approximately $170 million to our U.S. plans and approximately $25 million to our non-U.S. plans. Our actual contributions may differ due to many factors, including changes in tax, employee benefit, or other laws, tax deductibility, significant differences between expected and actual pension asset performance or interest rates, or other factors. In 2014, we contributed $145 million to our U.S. pension plans and $12 million to our non-U.S. pension plans. In addition, employees contributed $4 million in 2014 to our non-U.S. plans and $5 million in 2013.
Future Benefit Payments:
The estimated future benefit payments from our pension plans at December 27, 2014 were:
U.S. Plans | Non-U.S. Plans | ||||||
(in millions) | |||||||
2015 | $ | 401 | $ | 66 | |||
2016 | 407 | 66 | |||||
2017 | 418 | 66 | |||||
2018 | 426 | 66 | |||||
2019 | 434 | 67 | |||||
2020-2024 | 2,268 | 355 | |||||
55
Other Costs:
We sponsor and contribute to employee savings plans that cover eligible salaried, non-union, and union employees. Our contributions and costs are determined by the matching of employee contributions, as defined by the plans. Amounts charged to expense for defined contribution plans totaled $70 million in 2014, $61 million in 2013, and $12 million in 2012 subsequent to the Spin-Off.
Postretirement Benefit Plans
Obligations:
Our postretirement health care plans are not funded. The changes in and the amount of the accrued benefit obligations at December 27, 2014 and December 28, 2013 were:
December 27, 2014 | December 28, 2013 | ||||||
(in millions) | |||||||
Accrued benefit obligations at beginning of year | $ | 3,277 | $ | 3,738 | |||
Service cost | 26 | 35 | |||||
Interest cost | 148 | 143 | |||||
Benefits paid | (190 | ) | (188 | ) | |||
Actuarial losses / (gains) | 418 | (403 | ) | ||||
Plan amendments | (75 | ) | (40 | ) | |||
Currency | (14 | ) | (14 | ) | |||
Special termination benefits | — | 6 | |||||
Other | 1 | — | |||||
Accrued benefit obligations at end of year | $ | 3,591 | $ | 3,277 | |||
We used the following weighted average assumptions to determine our postretirement benefit obligations at December 27, 2014 and December 28, 2013:
December 27, 2014 | December 28, 2013 | ||||
Discount rate | 4.08 | % | 4.69 | % | |
Health care cost trend rate assumed for next year | 6.91 | % | 7.28 | % | |
Ultimate trend rate | 5.00 | % | 5.03 | % | |
Year that the rate reaches the ultimate trend rate | 2023 | 2023 | |||
Year-end discount rates for our U.S. and non-U.S. plans were developed from a model portfolio of high-quality, fixed-income debt instruments with durations that match the expected future cash flows of the benefit obligations. Our expected health care cost trend rate is based on historical costs.
Assumed health care cost trend rates have a significant impact on the amounts reported for the health care plans. A one-percentage-point change in assumed health care cost trend rates would have the following effects as of December 27, 2014:
One-Percentage-Point | |||||||
Increase | Decrease | ||||||
(in millions) | |||||||
Effect on annual service and interest cost | $ | 25 | $ | (20 | ) | ||
Effect on postretirement benefit obligation | 433 | (355 | ) | ||||
56
Components of Net Postretirement Health Care Cost / (Benefit):
Net postretirement health care cost / (benefit) consisted of the following for the years ended December 27, 2014, December 28, 2013, and December 29, 2012:
For the Years Ended | |||||||||||
December 27, 2014 | December 28, 2013 | December 29, 2012 | |||||||||
(in millions) | |||||||||||
Service cost | $ | 26 | $ | 35 | $ | 8 | |||||
Interest cost | 148 | 143 | 32 | ||||||||
Actuarial losses / (gains) | 370 | (376 | ) | 188 | |||||||
Amortization of prior service credits | (28 | ) | (26 | ) | (7 | ) | |||||
Special termination benefits | — | 5 | — | ||||||||
Net postretirement health care cost / (benefit) | $ | 516 | $ | (219 | ) | $ | 221 | ||||
As a result of the 2014 annual remeasurement of our postretirement health care plans, we recorded an expense from market-based impacts of $556 million as of December 27, 2014, primarily driven by a 60 basis point weighted average decrease in the discount rate and a $328 million impact from the adoption of the new Society of Actuaries RP-2014 mortality tables. We recorded $424 million of the expense from market-based impacts in cost of sales and $132 million in selling, general and administrative expenses in accordance with our policy for allocating employee costs. Market-based impacts are included in actuarial losses / (gains) in the table above.
As a result of the 2013 annual remeasurement of our postretirement health care plans, we recorded a benefit from market-based impacts of $292 million as of December 28, 2013, primarily driven by an 80 basis point weighted average increase in the discount rate. We recorded expense from market-based impacts of $250 million as of December 29, 2012.
In addition, as a result of the 2013 annual remeasurement, we recorded a benefit from market-based impacts of $15 million into inventory as of December 28, 2013 consistent with our capitalization policy. During 2014, the entire benefit previously capitalized was recognized in cost of sales. At December 27, 2014, we capitalized an aggregate expense of $36 million from market-based impacts into inventory.
The special termination benefits were associated with our voluntary early retirement program in 2013.
As of December 27, 2014, we expected to amortize an estimated $33 million of prior service credits from accumulated other comprehensive earnings / (losses) into net postretirement health care costs during 2015.
We used the following weighted average assumptions to determine our net postretirement health care cost for the years ended December 27, 2014, December 28, 2013, and December 29, 2012:
December 27, 2014 | December 28, 2013 | December 29, 2012 | ||||||
Discount rate | 4.69 | % | 3.89 | % | 3.61 | % | ||
Health care cost trend rate | 7.28 | % | 7.53 | % | 7.06 | % | ||
Future Benefit Payments:
Our estimated future benefit payments for our postretirement health care plans at December 27, 2014 were:
(in millions) | |||
2015 | $ | 196 | |
2016 | 196 | ||
2017 | 198 | ||
2018 | 199 | ||
2019 | 201 | ||
2020-2024 | 1,019 | ||
57
Other Postemployment Benefit Plans
Obligations:
Our other postemployment plans are generally not funded. The changes in and the amount of the accrued benefit obligation at December 27, 2014 and December 28, 2013 were:
December 27, 2014 | December 28, 2013 | ||||||
(in millions) | |||||||
Accrued benefit obligation at beginning of year | $ | 55 | $ | 63 | |||
Service cost | 2 | 2 | |||||
Interest cost | 2 | 2 | |||||
Benefits paid | (10 | ) | (6 | ) | |||
Actuarial losses / (gains) | 19 | (2 | ) | ||||
Other | (4 | ) | (4 | ) | |||
Accrued benefit obligation at end of year | $ | 64 | $ | 55 | |||
We used the following weighted average assumptions to determine our other postemployment benefit obligations at December 27, 2014 and December 28, 2013:
December 27, 2014 | December 28, 2013 | ||||
Discount rate | 2.86 | % | 3.10 | % | |
Assumed ultimate annual turnover rate | 0.50 | % | 0.50 | % | |
Rate of compensation increase | 4.00 | % | 4.00 | % | |
Other postemployment costs arising from actions that offer employees benefits in excess of those specified in the respective plans are charged to expense when incurred.
Components of Net Other Postemployment Cost:
Net other postemployment cost consisted of the following for the years ended December 27, 2014, December 28, 2013, and December 29, 2012:
For the Years Ended | |||||||||||
December 27, 2014 | December 28, 2013 | December 29, 2012 | |||||||||
Service cost | $ | 2 | $ | 2 | $ | 4 | |||||
Interest cost | 2 | 2 | 2 | ||||||||
Actuarial losses / (gains) | 14 | (2 | ) | 1 | |||||||
Other | 5 | (1 | ) | — | |||||||
Net other postemployment cost | $ | 23 | $ | 1 | $ | 7 | |||||
As of December 27, 2014, we did not expect to amortize any prior service costs / (credits) for the other postemployment benefit plans from accumulated other comprehensive earnings / (losses) into net postemployment costs during 2015.
Our Participation in Mondelēz International’s Pension and Other Postemployment Benefit Plans and the Spin-Off Impact
Prior to the Spin-off, Mondelēz International provided defined benefit pension, postretirement health care, defined contribution, and multiemployer pension and medical benefits to our eligible employees and retirees. As such, we applied the multiemployer plan accounting approach and these liabilities were not reflected in our consolidated balance sheets. We provided pension coverage for certain employees of our Canadian operations through separate plans and certain pension and postemployment benefits of our Canadian operations, which were included in our financial statements prior to the Spin-Off. As part of the Spin-Off, the plans were split and we assumed the obligations previously provided by Mondelēz International. Accordingly, Mondelēz International transferred to us the plan assets and liabilities associated with our active, retired, and other former employees, including liabilities for
58
most of the retired North American Mondelēz International employees. We assumed net benefit plan liabilities of $5.5 billion from Mondelēz International, which was in addition to the $0.1 billion of net benefit plan liabilities we had previously reported in our historical financial statements, for a total liability of $5.6 billion on October 1, 2012.
Total Mondelēz International benefit plan costs allocated to us were $491 million in the first nine months of 2012 prior to the Spin-Off. The expense allocations for these benefits were determined based on a review of personnel by business unit and based on allocations of corporate or other shared functional personnel. These allocated costs are reflected in our cost of sales and selling, general and administrative expenses. These costs were funded through intercompany transactions with Mondelēz International and were reflected within the parent company investment equity balance. Our allocated expenses in connection with the pension plans were $283 million in 2012. Our allocated expenses in connection with the postretirement plans were $142 million in 2012.
Note 10. Financial Instruments
Fair Value of Derivative Instruments:
The fair values and the levels within the fair value hierarchy of derivative instruments recorded on the consolidated balance sheets at December 27, 2014 and December 28, 2013 were:
December 27, 2014 | ||||||||||||||||||||||||||||||||
Quoted Prices in Active Markets for Identical Assets (Level 1) | Significant Other Observable Inputs (Level 2) | Significant Unobservable Inputs (Level 3) | Total Fair Value | |||||||||||||||||||||||||||||
Assets | Liabilities | Assets | Liabilities | Assets | Liabilities | Assets | Liabilities | |||||||||||||||||||||||||
Derivatives designated as hedging instruments: | ||||||||||||||||||||||||||||||||
Commodity contracts | $ | 2 | $ | 5 | $ | — | $ | — | $ | — | $ | — | $ | 2 | $ | 5 | ||||||||||||||||
Foreign exchange contracts | — | — | 80 | — | — | — | 80 | — | ||||||||||||||||||||||||
Derivatives not designated as hedging instruments: | ||||||||||||||||||||||||||||||||
Commodity contracts | 46 | 99 | — | 4 | — | — | 46 | 103 | ||||||||||||||||||||||||
Total fair value | $ | 48 | $ | 104 | $ | 80 | $ | 4 | $ | — | $ | — | $ | 128 | $ | 108 | ||||||||||||||||
December 28, 2013 | ||||||||||||||||||||||||||||||||
Quoted Prices in Active Markets for Identical Assets (Level 1) | Significant Other Observable Inputs (Level 2) | Significant Unobservable Inputs (Level 3) | Total Fair Value | |||||||||||||||||||||||||||||
Assets | Liabilities | Assets | Liabilities | Assets | Liabilities | Assets | Liabilities | |||||||||||||||||||||||||
Derivatives designated as hedging instruments: | ||||||||||||||||||||||||||||||||
Commodity contracts | $ | 5 | $ | 4 | $ | — | $ | — | $ | — | $ | — | $ | 5 | $ | 4 | ||||||||||||||||
Foreign exchange contracts | — | — | 48 | — | — | — | 48 | — | ||||||||||||||||||||||||
Derivatives not designated as hedging instruments: | ||||||||||||||||||||||||||||||||
Commodity contracts | 39 | 20 | 1 | 1 | — | — | 40 | 21 | ||||||||||||||||||||||||
Total fair value | $ | 44 | $ | 24 | $ | 49 | $ | 1 | $ | — | $ | — | $ | 93 | $ | 25 | ||||||||||||||||
The fair values of our asset derivatives are recorded within other current assets and other assets. The fair values of our liability derivatives are recorded within other current liabilities.
Level 1 financial assets and liabilities consist of commodity futures and options contracts and are valued using quoted prices in active markets for identical assets and liabilities.
59
Level 2 financial assets and liabilities consist of commodity forwards and foreign exchange forwards. Commodity forwards are valued using an income approach based on the observable market commodity index prices less the contract rate multiplied by the notional amount. Foreign exchange forwards are valued using an income approach based on observable market forward rates less the contract rate multiplied by the notional amount. Our calculation of the fair value of financial instruments takes into consideration the risk of nonperformance, including counterparty credit risk.
Derivative Volume:
The net notional values of our derivative instruments at December 27, 2014 and December 28, 2013 were:
Notional Amount | |||||||
December 27, 2014 | December 28, 2013 | ||||||
(in millions) | |||||||
Commodity contracts | $ | 1,543 | $ | 1,349 | |||
Foreign exchange contracts | 1,074 | 901 | |||||
Cash Flow Hedges:
Cash flow hedge activity, net of income taxes, within accumulated other comprehensive losses included:
For the Years Ended | |||||||||||
December 27, 2014 | December 28, 2013 | December 29, 2012 | |||||||||
(in millions) | |||||||||||
Accumulated other comprehensive losses at beginning of period | $ | (129 | ) | $ | (152 | ) | $ | (18 | ) | ||
Unrealized gains / (losses): | |||||||||||
Commodity contracts | 18 | (16 | ) | (57 | ) | ||||||
Foreign exchange contracts | 38 | 36 | (5 | ) | |||||||
Interest rate contracts | — | — | (137 | ) | |||||||
56 | 20 | (199 | ) | ||||||||
Transfer of realized (gains) / losses to earnings: | |||||||||||
Commodity contracts | (18 | ) | 26 | 49 | |||||||
Foreign exchange contracts | (41 | ) | (31 | ) | 1 | ||||||
Interest rate contracts | 7 | 8 | 19 | ||||||||
(52 | ) | 3 | 69 | ||||||||
Transfer of realized losses from Mondelēz International | — | — | (4 | ) | |||||||
Accumulated other comprehensive losses at end of period | $ | (125 | ) | $ | (129 | ) | $ | (152 | ) | ||
The gains / (losses) on ineffectiveness recognized in pre-tax earnings were:
For the Years Ended | |||||||||||
December 27, 2014 | December 28, 2013 | December 29, 2012 | |||||||||
(in millions) | |||||||||||
Commodity contracts | $ | 1 | $ | — | $ | (4 | ) | ||||
Interest rate contracts | — | — | (23 | ) | |||||||
Total | $ | 1 | $ | — | $ | (27 | ) | ||||
We record the pre-tax gain or loss reclassified from accumulated other comprehensive losses and the gain or loss on ineffectiveness in:
• | cost of sales for commodity contracts; |
• | cost of sales for foreign exchange contracts related to forecasted transactions; and |
• | interest and other expense, net for foreign exchange contracts related to intercompany loans and interest rate contracts. |
60
Based on our valuation at December 27, 2014, we would expect to transfer unrealized losses of $4 million (net of taxes) for commodity cash flow hedges, unrealized gains of $17 million (net of taxes) for foreign currency cash flow hedges, and unrealized losses of $8 million (net of taxes) for interest rate cash flow hedges to earnings during the next 12 months.
Hedge Coverage:
At December 27, 2014, we had hedged forecasted transactions for the following durations:
• | commodity transactions for periods not exceeding the next two years; |
• | foreign currency transactions for periods not exceeding the next four years; and |
• | interest rate transactions for periods not exceeding the next 28 years. |
Economic Hedges:
Gains recorded in pre-tax earnings for economic hedges that are not designated as hedging instruments included:
For the Years Ended | Location of (Losses) / Gains Recognized Earnings | ||||||||||||
December 27, 2014 | December 28, 2013 | December 29, 2012 | |||||||||||
(in millions) | |||||||||||||
Commodity contracts | $ | 26 | $ | 14 | $ | 36 | Cost of sales | ||||||
Foreign exchange contracts | 2 | — | — | Selling, general and administrative expenses | |||||||||
$ | 28 | $ | 14 | $ | 36 | ||||||||
Note 11. Commitments and Contingencies
Legal Proceedings:
We are routinely involved in legal proceedings, claims, and governmental inquiries, inspections or investigations (“Legal Matters”) arising in the ordinary course of our business.
We have been advised by the staff of the Commodity Futures Trading Commission (“CFTC”) that they are investigating activities related to the trading of December 2011 wheat futures contracts. These activities arose prior to the Spin-Off and involve the business now owned and operated by Mondelēz International or its affiliates. We are cooperating with the staff in its investigation. In October 2014, the staff advised us that the CFTC intends to commence a formal action. We and Mondelēz International continue to seek resolution of this matter. Our Separation and Distribution Agreement with Mondelēz International dated as of September 27, 2012, governs the allocation between Mondelēz International and us and, accordingly, Mondelēz International will predominantly bear the costs of this matter and any monetary penalties or other payments that the CFTC may impose. We do not expect this matter to have a material adverse effect on our financial condition or results of operations.
While we cannot predict with certainty the results of Legal Matters in which we are currently involved or may in the future be involved, we do not expect that the ultimate costs to resolve any of the Legal Matters that are currently pending will have a material adverse effect on our financial condition or results of operations.
Third-Party Guarantees:
We have third-party guarantees primarily covering long-term obligations related to leased properties. The carrying amounts of our third-party guarantees was $22 million at December 27, 2014 and $24 million at December 28, 2013. The maximum potential payment under these guarantees was $42 million at December 27, 2014 and $53 million at December 28, 2013. Substantially all of these guarantees expire at various times through 2027.
61
Leases:
Rental expenses were $148 million in 2014, $176 million in 2013, and $150 million in 2012. As of December 27, 2014, minimum rental commitments under non-cancelable operating leases in effect at year-end were (in millions):
2015 | $ | 106 | |
2016 | 85 | ||
2017 | 62 | ||
2018 | 49 | ||
2019 | 41 | ||
Thereafter | 84 | ||
Total | $ | 427 | |
Note 12. Income Taxes
Earnings before income taxes and the provision for income taxes consisted of the following:
For the Years Ended | ||||||||||||
December 27, 2014 | December 28, 2013 | December 29, 2012 | ||||||||||
(in millions) | ||||||||||||
Earnings before income taxes: | ||||||||||||
United States | $ | 1,117 | $ | 3,596 | $ | 2,156 | ||||||
Outside United States | 289 | 494 | 297 | |||||||||
Total | $ | 1,406 | $ | 4,090 | $ | 2,453 | ||||||
Provision for income taxes: | ||||||||||||
United States federal: | ||||||||||||
Current | $ | 678 | $ | 591 | $ | 209 | ||||||
Deferred | (336 | ) | 566 | 424 | ||||||||
342 | 1,157 | 633 | ||||||||||
State and local: | ||||||||||||
Current | (34 | ) | 34 | 54 | ||||||||
Deferred | (26 | ) | 61 | 43 | ||||||||
(60 | ) | 95 | 97 | |||||||||
Total United States | 282 | 1,252 | 730 | |||||||||
Outside United States: | ||||||||||||
Current | 80 | 42 | 78 | |||||||||
Deferred | 1 | 81 | 3 | |||||||||
Total outside United States | 81 | 123 | 81 | |||||||||
Total provision for income taxes | $ | 363 | $ | 1,375 | $ | 811 | ||||||
62
The effective income tax rate on pre-tax earnings differed from the U.S. federal statutory rate for the following reasons :
For the Years Ended | |||||||||
December 27, 2014 | December 28, 2013 | December 29, 2012 | |||||||
U.S. federal statutory rate | 35.0 | % | 35.0 | % | 35.0 | % | |||
Increase / (decrease) resulting from: | |||||||||
U.S. state and local income taxes, net of federal tax benefit | 0.2 | % | 1.7 | % | 2.3 | % | |||
Domestic manufacturing deduction | (4.6 | )% | (1.2 | )% | (2.7 | )% | |||
Foreign rate differences | (2.2 | )% | (1.1 | )% | (1.1 | )% | |||
Changes in uncertain tax positions | (0.9 | )% | 0.2 | % | (0.8 | )% | |||
Other | (1.7 | )% | (1.0 | )% | 0.4 | % | |||
Effective tax rate | 25.8 | % | 33.6 | % | 33.1 | % | |||
Our 2014 effective tax rate was favorably impacted by $64 million of domestic manufacturing deductions, favorable tax rates in foreign jurisdictions, most significantly Canada, changes in uncertain tax positions and the net impact of other discrete tax items.
Our 2013 effective tax rate was favorably impacted by $49 million of domestic manufacturing deductions, favorable tax rates in foreign jurisdictions, most significantly Canada, and the net impact of other discrete tax items. This favorability was partially offset by $68 million of state and local taxes.
Our 2012 effective tax rate was favorably impacted by $66 million of domestic manufacturing deductions, favorable tax rates in foreign jurisdictions, most significantly Canada, and changes in uncertain tax positions. This favorability was partially offset by $56 million of state and local taxes.
The calculation of the percentage point impact of domestic manufacturing deductions, uncertain tax positions and other discrete items on the effective tax rate was affected by earnings before income taxes. Fluctuations in earnings could impact comparability of reconciling items between periods.
Our unrecognized tax benefits of $256 million at December 27, 2014 are included in other current liabilities and other liabilities. If we had recognized all of these benefits, the net impact on our income tax provision would have been $167 million. Of the net unrecognized tax benefits, approximately $100 million to $140 million are expected to be resolved within the next 12 months.
The changes in our unrecognized tax benefits were:
For the Years Ended | ||||||||||||
December 27, 2014 | December 28, 2013 | December 29, 2012 | ||||||||||
(in millions) | ||||||||||||
Beginning of year | $ | 259 | $ | 258 | $ | 371 | ||||||
Increases from prior period tax positions | 26 | 2 | 11 | |||||||||
Decreases from prior period tax positions | (74 | ) | (5 | ) | (90 | ) | ||||||
Decreases from statute of limitations expirations | (14 | ) | (28 | ) | — | |||||||
Increases from current period tax positions | 67 | 39 | 16 | |||||||||
Net transfers to Mondelēz International | — | — | (9 | ) | ||||||||
Decreases relating to settlements with taxing authorities | (3 | ) | (3 | ) | (33 | ) | ||||||
Currency and other | (5 | ) | (4 | ) | (8 | ) | ||||||
End of year | $ | 256 | $ | 259 | $ | 258 | ||||||
We include accrued interest and penalties related to uncertain tax positions in our tax provision. Our provision for income taxes included a benefit of $30 million in 2014, expense of $13 million in 2013, and expense of $18 million in 2012 for interest and penalties. Accrued interest and penalties were $41 million as of December 27, 2014, and $74 million as of December 28, 2013.
63
We have entered into a tax sharing agreement with Mondelēz International, which provides that for periods prior to October 1, 2012, Mondelēz International is liable for and will indemnify us against all U.S. federal income taxes and substantially all foreign income taxes, excluding Canadian income taxes; and that we are liable for and will indemnify Mondelēz International against U.S. state income taxes and Canadian federal and provincial income taxes.
Our U.S. operations were included in Mondelēz International’s U.S. federal consolidated income tax returns for tax periods through October 1, 2012. In August 2014, Mondelēz International reached a final resolution on a U.S. federal income tax audit of the 2007-2009 tax years. The U.S. federal statute of limitations remains open for tax year 2010 and forward, and federal income tax returns for 2010-2012 are currently under examination. As noted above we are indemnified for U.S. federal income taxes related to these periods.
We are regularly examined by federal, state and foreign authorities. We are currently under income tax examinations by the IRS for the post Spin-Off period 2012-2014. Our income tax filings are also currently under examination by tax authorities in various U.S. state and foreign jurisdictions. U.S. state and local and foreign jurisdictions have statutes of limitations generally ranging from three to five years unless we agree to an extension. In Canada, our only significant foreign jurisdiction, the earliest open tax year is 2007.
At December 27, 2014, we had outside tax basis in excess of book basis in certain foreign subsidiaries in which earnings are indefinitely reinvested. As of that date, applicable U.S. federal income taxes and foreign withholding taxes had not been provided on approximately $578 million of unremitted earnings of such foreign subsidiaries. If such earnings were to be remitted, our incremental tax cost would be approximately $118 million.
The tax effects of temporary differences that gave rise to deferred income tax assets and liabilities consisted of the following at December 27, 2014 and December 28, 2013:
December 27, 2014 | December 28, 2013 | |||||||
(in millions) | ||||||||
Deferred income tax assets: | ||||||||
Pension benefits | $ | 407 | $ | 104 | ||||
Postretirement benefits | 1,355 | 1,238 | ||||||
Other employee benefits | 113 | 122 | ||||||
Other | 471 | 497 | ||||||
Total deferred income tax assets | 2,346 | 1,961 | ||||||
Valuation allowance | (20 | ) | (3 | ) | ||||
Net deferred income tax assets | $ | 2,326 | $ | 1,958 | ||||
Deferred income tax liabilities: | ||||||||
Trade names | $ | (828 | ) | $ | (828 | ) | ||
Property, plant and equipment | (979 | ) | (949 | ) | ||||
Debt exchange | (350 | ) | (384 | ) | ||||
Other | (66 | ) | (65 | ) | ||||
Total deferred income tax liabilities | (2,223 | ) | (2,226 | ) | ||||
Net deferred income tax assets / (liabilities) | $ | 103 | $ | (268 | ) | |||
Note 13. Accumulated Other Comprehensive Losses
Total accumulated other comprehensive losses consists of net earnings / (losses) and other changes in business equity from sources other than shareholders. It includes foreign currency translation gains and losses, postemployment benefit plan adjustments, and unrealized gains and losses from derivative instruments designated as cash flow hedges.
64
The components of, and changes in, accumulated other comprehensive losses were as follows (net of tax):
Foreign Currency Adjustments | Postemployment Benefit Plan Adjustments | Derivative Hedging Adjustments | Total Accumulated Other Comprehensive Losses | ||||||||||||
(in millions) | |||||||||||||||
Balance at December 29, 2012 | $ | (359 | ) | $ | 51 | $ | (152 | ) | $ | (460 | ) | ||||
Other comprehensive (losses) / gains before reclassifications | (68 | ) | 19 | 20 | (29 | ) | |||||||||
Amounts reclassified from accumulated other comprehensive losses | — | (13 | ) | 3 | (10 | ) | |||||||||
Net current-period other comprehensive (losses) / earnings | (68 | ) | 6 | 23 | (39 | ) | |||||||||
Balance at December 28, 2013 | $ | (427 | ) | $ | 57 | $ | (129 | ) | $ | (499 | ) | ||||
Other comprehensive (losses) / gains before reclassifications | (91 | ) | 36 | 56 | 1 | ||||||||||
Amounts reclassified from accumulated other comprehensive losses | — | (12 | ) | (52 | ) | (64 | ) | ||||||||
Net current-period other comprehensive (losses) / earnings | (91 | ) | 24 | 4 | (63 | ) | |||||||||
Balance at December 27, 2014 | $ | (518 | ) | $ | 81 | $ | (125 | ) | $ | (562 | ) | ||||
Amounts reclassified from accumulated other comprehensive losses in the years ended December 27, 2014 and December 28, 2013 were as follows:
Amount Reclassified from Accumulated Other Comprehensive Losses | |||||||||
For the Years Ended | |||||||||
Details about Accumulated Other Comprehensive Losses Components | December 27, 2014 | December 28, 2013 | Affected Line Item in the Statement Where Net Income is Presented | ||||||
(in millions) | |||||||||
Derivative hedging (gains) / losses | |||||||||
Commodity contracts | $ | (30 | ) | $ | 42 | Cost of sales | |||
Foreign exchange contracts | (17 | ) | (11 | ) | Cost of sales | ||||
Foreign exchange contracts | (50 | ) | (39 | ) | Interest and other expense, net | ||||
Interest rate contracts | 13 | 12 | Interest and other expense, net | ||||||
Total before tax | (84 | ) | 4 | Earnings before income taxes | |||||
Tax benefit / (expense) | 32 | (1 | ) | Provision for income taxes | |||||
Net of tax | $ | (52 | ) | $ | 3 | Net earnings | |||
Postemployment benefit plan adjustments | |||||||||
Amortization of prior service credits | $ | (23 | ) | $ | (22 | ) | (1) | ||
Curtailments | 3 | — | (1) | ||||||
Total before tax | (20 | ) | (22 | ) | Earnings before income taxes | ||||
Tax benefit | 8 | 9 | Provision for income taxes | ||||||
Net of tax | $ | (12 | ) | $ | (13 | ) | Net earnings | ||
(1) | These accumulated other comprehensive losses components are included in the computation of net periodic pension and postretirement health care costs. See Note 9, Postemployment Benefit Plans, for additional information. |
65
Note 14. Earnings Per Share (“EPS”)
We grant shares of restricted stock and RSUs that are considered to be participating securities. Due to the presence of participating securities, we have calculated our EPS using the two-class method.
For the Years Ended | |||||||||||
December 27, 2014 | December 28, 2013 | December 29, 2012 | |||||||||
(in millions, except per share data) | |||||||||||
Basic EPS: | |||||||||||
Net earnings | $ | 1,043 | $ | 2,715 | $ | 1,642 | |||||
Earnings allocated to participating securities | 5 | 12 | 5 | ||||||||
Earnings available to common shareholders - basic | $ | 1,038 | $ | 2,703 | $ | 1,637 | |||||
Weighted average shares of common stock outstanding | 593 | 594 | 591 | ||||||||
Net earnings per share | $ | 1.75 | $ | 4.55 | $ | 2.77 | |||||
Diluted EPS: | |||||||||||
Net earnings | $ | 1,043 | $ | 2,715 | $ | 1,642 | |||||
Earnings allocated to participating securities | 5 | 12 | 5 | ||||||||
Earnings available to common shareholders - diluted | $ | 1,038 | $ | 2,703 | $ | 1,637 | |||||
Weighted average shares of common stock outstanding | 593 | 594 | 591 | ||||||||
Effect of dilutive securities | 5 | 5 | 5 | ||||||||
Weighted average shares of common stock, including dilutive effect | 598 | 599 | 596 | ||||||||
Net earnings per share | $ | 1.74 | $ | 4.51 | $ | 2.75 | |||||
We excluded antidilutive stock options and Performance Shares from our calculation of weighted average shares of common stock outstanding for diluted EPS of 2.0 million for the year ended December 27, 2014 and 0.3 million for the year ended December 28, 2013. Antidilutive stock options and Performance Shares were zero for the year ended December 29, 2012.
Note 15. Segment Reporting
We manufacture and market food and beverage products, including cheese, meats, refreshment beverages, coffee, packaged dinners, refrigerated meals, snack nuts, dressings, and other grocery products, primarily in the United States and Canada. We manage and report our operating results through six reportable segments: Cheese, Refrigerated Meals, Beverages, Meals & Desserts, Enhancers & Snack Nuts, and Canada. Our remaining businesses, including our Foodservice and Exports businesses, are aggregated and disclosed as “Other Businesses”.
Management uses segment operating income to evaluate segment performance and allocate resources. We believe it is appropriate to disclose this measure to help investors analyze segment performance and trends. Segment operating income excludes the following items for each of the periods presented:
• | Market-based impacts and certain other components of our postemployment benefit plans (which are components of cost of sales and selling, general and administrative expenses) because we centrally manage postemployment benefit plan funding decisions and the determination of discount rates, expected rate of return on plan assets, and other actuarial assumptions. |
• | Unrealized gains and losses on hedging activities (which are a component of cost of sales) in order to provide better transparency of our segment operating results. Unrealized gains and losses on hedging activities, which includes unrealized gains and losses on our derivatives not designated as hedging instruments as well as the ineffective portion of unrealized gains and losses on our derivatives designated as hedging instruments, are recorded in Corporate until realized. Once realized, the gains and losses are recorded within the applicable segment operating results. |
• | Certain general corporate expenses (which are a component of selling, general and administrative expenses). |
66
Furthermore, we centrally manage interest and other expense, net. Accordingly, we do not present these items by segment because they are excluded from the segment profitability measures that management reviews.
Our segment net revenues and earnings consisted of:
For the Years Ended | |||||||||||
December 27, 2014 | December 28, 2013 | December 29, 2012 | |||||||||
(in millions) | |||||||||||
Net revenues: | |||||||||||
Cheese | $ | 4,066 | $ | 3,925 | $ | 3,829 | |||||
Refrigerated Meals | 3,433 | 3,334 | 3,280 | ||||||||
Beverages | 2,627 | 2,681 | 2,718 | ||||||||
Meals & Desserts | 2,155 | 2,305 | 2,311 | ||||||||
Enhancers & Snack Nuts | 2,062 | 2,101 | 2,220 | ||||||||
Canada | 1,937 | 2,037 | 2,010 | ||||||||
Other Businesses | 1,925 | 1,835 | 1,903 | ||||||||
Net revenues | $ | 18,205 | $ | 18,218 | $ | 18,271 | |||||
For the Years Ended | |||||||||||
December 27, 2014 | December 28, 2013 | December 29, 2012 | |||||||||
(in millions) | |||||||||||
Earnings before income taxes: | |||||||||||
Operating income: | |||||||||||
Cheese | $ | 656 | $ | 634 | $ | 618 | |||||
Refrigerated Meals | 378 | 329 | 379 | ||||||||
Beverages | 384 | 349 | 260 | ||||||||
Meals & Desserts | 611 | 665 | 712 | ||||||||
Enhancers & Snack Nuts | 577 | 529 | 592 | ||||||||
Canada | 370 | 373 | 301 | ||||||||
Other Businesses | 263 | 227 | 180 | ||||||||
Market-based impacts to postemployment benefit plans | (1,341 | ) | 1,561 | (223 | ) | ||||||
Certain other postemployment benefit plan income / (expense) | 164 | 61 | (82 | ) | |||||||
Unrealized (losses) / gains on hedging activities | (79 | ) | 21 | 13 | |||||||
General corporate expenses | (93 | ) | (158 | ) | (80 | ) | |||||
Operating income | 1,890 | 4,591 | 2,670 | ||||||||
Interest and other expense, net | (484 | ) | (501 | ) | (258 | ) | |||||
Royalty income from Mondelēz International | — | — | 41 | ||||||||
Earnings before income taxes | $ | 1,406 | $ | 4,090 | $ | 2,453 | |||||
67
Total assets, depreciation expense, and capital expenditures by segment were:
December 27, 2014 | December 28, 2013 | ||||||
(in millions) | |||||||
Total Assets: | |||||||
Cheese | $ | 4,528 | $ | 4,400 | |||
Refrigerated Meals | 2,328 | 2,294 | |||||
Beverages | 2,632 | 2,593 | |||||
Meals & Desserts | 2,398 | 2,389 | |||||
Enhancers & Snack Nuts | 5,487 | 5,458 | |||||
Canada | 1,979 | 2,016 | |||||
Other Businesses | 1,626 | 1,597 | |||||
Unallocated assets (1) | 1,969 | 2,401 | |||||
Total assets | $ | 22,947 | $ | 23,148 | |||
(1) Unallocated assets consist primarily of cash and cash equivalents, deferred income taxes, prepaid pension assets, and derivative financial instrument balances.
For the Years Ended | |||||||||||
December 27, 2014 | December 28, 2013 | December 29, 2012 | |||||||||
(in millions) | |||||||||||
Depreciation Expense: | |||||||||||
Cheese | $ | 57 | $ | 92 | $ | 119 | |||||
Refrigerated Meals | 87 | 84 | 76 | ||||||||
Beverages | 72 | 69 | 72 | ||||||||
Meals & Desserts | 69 | 49 | 70 | ||||||||
Enhancers & Snack Nuts | 29 | 28 | 24 | ||||||||
Canada | 36 | 38 | 31 | ||||||||
Other Businesses | 34 | 33 | 36 | ||||||||
Total depreciation expense | $ | 384 | $ | 393 | $ | 428 | |||||
For the Years Ended | |||||||||||
December 27, 2014 | December 28, 2013 | December 29, 2012 | |||||||||
(in millions) | |||||||||||
Capital expenditures: | |||||||||||
Cheese | $ | 152 | $ | 150 | $ | 84 | |||||
Refrigerated Meals | 110 | 80 | 83 | ||||||||
Beverages | 115 | 146 | 129 | ||||||||
Meals & Desserts | 50 | 68 | 63 | ||||||||
Enhancers & Snack Nuts | 37 | 33 | 37 | ||||||||
Canada | 53 | 60 | 33 | ||||||||
Other Businesses | 18 | 20 | 11 | ||||||||
Total capital expenditures | $ | 535 | $ | 557 | $ | 440 | |||||
Concentration of risk:
Our largest customer, Wal-Mart Stores, Inc., accounted for approximately 26% of net revenues in 2014 and in 2013, and 25% in 2012.
68
Geographic data for net revenues and long-lived assets were:
For the Years Ended | |||||||||||
December 27, 2014 | December 28, 2013 | December 29, 2012 | |||||||||
(in millions) | |||||||||||
Net revenues: | |||||||||||
United States | $ | 15,753 | $ | 15,676 | $ | 15,752 | |||||
Canada | 2,177 | 2,302 | 2,306 | ||||||||
Exports | 275 | 240 | 213 | ||||||||
Total net revenues | $ | 18,205 | $ | 18,218 | $ | 18,271 | |||||
December 27, 2014 | December 28, 2013 | ||||||
(in millions) | |||||||
Long-lived assets: | |||||||
United States | $ | 16,536 | $ | 16,516 | |||
Canada | 1,620 | 1,724 | |||||
Total long-lived assets | $ | 18,156 | $ | 18,240 | |||
Net revenues by product categories were:
For the Years Ended | |||||||||||
December 27, 2014 | December 28, 2013 | December 29, 2012 | |||||||||
(in millions) | |||||||||||
Cheese and dairy | $ | 5,954 | $ | 5,744 | $ | 5,591 | |||||
Meat and meat alternatives | 2,691 | 2,643 | 2,659 | ||||||||
Meals | 2,033 | 2,047 | 1,973 | ||||||||
Refreshment beverages | 1,762 | 1,817 | 1,863 | ||||||||
Enhancers | 1,601 | 1,705 | 1,868 | ||||||||
Coffee | 1,456 | 1,460 | 1,450 | ||||||||
Desserts, toppings and baking | 1,042 | 1,142 | 1,213 | ||||||||
Nuts and salted snacks | 1,036 | 997 | 986 | ||||||||
Other | 630 | 663 | 668 | ||||||||
Total net revenues | $ | 18,205 | $ | 18,218 | $ | 18,271 | |||||
Note 16. Quarterly Financial Data (Unaudited)
2014 Quarters | ||||||||||||||||
First | Second | Third | Fourth | |||||||||||||
(in millions, except per share data) | ||||||||||||||||
Net revenues | $ | 4,362 | $ | 4,747 | $ | 4,400 | $ | 4,696 | ||||||||
Gross profit | $ | 1,560 | $ | 1,521 | $ | 1,292 | $ | 472 | ||||||||
Net earnings / (loss) | $ | 513 | $ | 482 | $ | 446 | $ | (398 | ) | |||||||
Per share data: | ||||||||||||||||
Basic earnings / (loss) per share | $ | 0.86 | $ | 0.81 | $ | 0.75 | $ | (0.68 | ) | |||||||
Diluted earnings / (loss) per share | $ | 0.85 | $ | 0.80 | $ | 0.74 | $ | (0.68 | ) | |||||||
Dividends declared | $ | 0.525 | $ | 0.525 | $ | — | $ | 1.10 | ||||||||
Market price – high | $ | 56.56 | $ | 60.60 | $ | 61.10 | $ | 64.47 | ||||||||
– low | $ | 50.54 | $ | 55.47 | $ | 53.33 | $ | 53.63 | ||||||||
69
2013 Quarters | ||||||||||||||||
First | Second | Third | Fourth | |||||||||||||
(in millions, except per share data) | ||||||||||||||||
Net revenues | $ | 4,513 | $ | 4,716 | $ | 4,394 | $ | 4,595 | ||||||||
Gross profit | $ | 1,470 | $ | 1,936 | $ | 1,486 | $ | 1,932 | ||||||||
Net earnings | $ | 456 | $ | 829 | $ | 500 | $ | 931 | ||||||||
Per share data: | ||||||||||||||||
Basic earnings per share | $ | 0.77 | $ | 1.39 | $ | 0.84 | $ | 1.56 | ||||||||
Diluted earnings per share | $ | 0.76 | $ | 1.38 | $ | 0.83 | $ | 1.54 | ||||||||
Dividends declared | $ | 0.50 | $ | 0.50 | $ | — | $ | 1.05 | ||||||||
Market price – high | $ | 52.29 | $ | 57.84 | $ | 58.76 | $ | 55.93 | ||||||||
– low | $ | 44.16 | $ | 49.79 | $ | 51.20 | $ | 51.72 | ||||||||
Basic and diluted EPS are computed independently for each of the periods presented. Accordingly, the sum of the quarterly EPS amounts may not equal the total for the year.
Item 9. Changes in and Disagreements with Accountants on Accounting and Financial Disclosure.
None.
Item 9A. Controls and Procedures.
Evaluation of Disclosure Controls and Procedures
Our CEO and CFO, with other members of management, evaluated the effectiveness of our disclosure controls and procedures (as defined in Exchange Act Rule 13a-15(e)) as of the end of the period covered by this report. Based upon that evaluation, our CEO and CFO concluded that our disclosure controls and procedures were effective as of December 27, 2014.
Internal Control Over Financial Reporting and Changes in Internal Control Over Financial Reporting
Management’s annual report on internal control over financial reporting (as defined in Rules 13a-15(f) and 15(d)-15(f) of the Exchange Act) is set forth below. The related report of our independent registered public accounting firm is contained in Part II, Item 8 of this report and is incorporated herein by reference.
Our CEO and CFO, with other members of management, evaluated the changes in our internal control over financial reporting during the quarter ended December 27, 2014. We determined that there were no changes in our internal control over financial reporting during the quarter ended December 27, 2014, that have materially affected, or are reasonably likely to materially affect, our internal control over financial reporting.
Report of Management on Internal Control Over Financial Reporting
Management is responsible for establishing and maintaining adequate internal control over financial reporting as defined in Rules 13a-15(f) under the Exchange Act. Our internal control over financial reporting is a process designed to provide reasonable assurance regarding the reliability of financial reporting and the preparation of financial statements for external purposes in accordance with generally accepted accounting principles. Our internal control over financial reporting includes those written policies and procedures that:
• | pertain to the maintenance of records that, in reasonable detail, accurately and fairly reflect the transactions and dispositions of assets; |
• | provide reasonable assurance that transactions are recorded as necessary to permit preparation of financial statements in accordance with generally accepted accounting principles; |
• | provide reasonable assurance that receipts and expenditures are being made only in accordance with management and director authorization; and |
• | provide reasonable assurance regarding prevention or timely detection of unauthorized acquisition, use or disposition of assets that could have a material effect on the consolidated financial statements. |
Because of its inherent limitations, internal control over financial reporting may not prevent or detect misstatements. Also, projections of any evaluation of effectiveness to future periods are subject to the risk that controls may
70
become inadequate because of changes in conditions, or that the degree of compliance with the policies or procedures may deteriorate.
Management assessed the effectiveness of our internal control over financial reporting as of December 27, 2014. Management based this assessment on criteria described in Internal Control – Integrated Framework (2013) issued by the Committee of Sponsoring Organizations of the Treadway Commission (COSO).
Based on this assessment, management determined that, as of December 27, 2014, we maintained effective internal control over financial reporting.
PricewaterhouseCoopers LLP, an independent registered public accounting firm, who audited the consolidated financial statements included in this Annual Report on Form 10-K, has also audited the effectiveness of our internal control over financial reporting as of December 27, 2014, as stated in their report which appears herein under Item 8.
February 19, 2015
Item 9B. Other Information.
None.
PART III
Item 10. Directors, Executive Officers and Corporate Governance.
We have a written code of conduct that applies to all of our employees, including our principal executive officer, principal financial officer, principal accounting officer or controller, and persons performing similar functions. Our code of conduct is available free of charge on our Web site at www.kraftfoodsgroup.com and will be provided free of charge to any shareholder submitting a written request to: Corporate Secretary, Kraft Foods Group, Inc., Three Lakes Drive, Northfield, IL 60093. Any amendment to our code of conduct and any waiver applicable to our executive officers or senior financial officers will be posted on our Web site within the time period required by the SEC and applicable NASDAQ rules. The information on our Web site is not, and shall not be deemed to be, a part of this Annual Report on Form 10-K or incorporated into any other filings we make with the SEC.
Additional information required by this Item 10 is included under the headings “Company Proposals - Proposal 1. Election of Directors,” “Corporate Governance and Board Matters – Section 16(a) Beneficial Ownership Reporting Compliance,” “Corporate Governance and Board Matters – Governance Guidelines and Codes of Conduct,” and “Board Committees and Membership – Audit Committee” in our definitive Proxy Statement for our Annual Meeting of Shareholders scheduled to be held on May 5, 2015 (“2015 Proxy Statement”). This information is incorporated by reference into this Annual Report on Form 10-K.
Item 11. Executive Compensation.
Information required by this Item 11 is included under the headings “Board Committees and Membership – Compensation Committee,” “Compensation of Non-Employee Directors,” “Compensation Discussion and Analysis," and "Executive Compensation Tables,” in our 2015 Proxy Statement. This information is incorporated by reference into this Annual Report on Form 10-K.
71
Item 12. Security Ownership of Certain Beneficial Owners and Management and Related Stockholder Matters.
The number of shares to be issued upon exercise or vesting of awards issued under, and the number of shares remaining available for future issuance under, our equity compensation plans at December 27, 2014, were:
Equity Compensation Plan Information
Number of securities to be issued upon exercise of outstanding options, warrants and rights (2) | Weighted average exercise price of outstanding options, warrants and rights | Number of securities remaining available for future issuance under equity compensation plans (excluding securities reflected in column (a)) | |||||||||
Plan Category | (a) | (b) | (c) | ||||||||
Equity compensation plans approved by security holders | 18,583,720 | $ | 39.26 | 43,343,318 | (3) | ||||||
Equity compensation plans not approved by security holders (1) | 97,438 | — | 4,893,543 | ||||||||
Total | 18,681,158 | $ | 39.26 | 48,236,861 | |||||||
(1) | Consists of shares available for issuance under our Management Stock Purchase Plan pursuant to which certain employees may defer up to 50% of their annual bonus into Kraft Foods Group stock-based deferred compensation units (“DCUs”) and receive a company match of 25% of the deferred amount in Kraft Foods Group RSUs that vest after three years. The matching RSUs are granted from the 2012 Plan. |
(2) | Includes vesting of RSUs and Performance Shares. |
(3) | Includes 11,049,862 shares available for issuance under our Employee Stock Purchase Plan (the “ESPP”). The ESPP allows employees to purchase shares of Kraft Foods Group common stock at a discount of up to 15% of the market price of Kraft Foods Group common stock on the date of purchase. |
Information related to the security ownership of certain beneficial owners and management is included in our 2015 Proxy Statement under the heading “Ownership of Equity Securities” and is incorporated by reference into this Annual Report on Form 10-K.
Item 13. Certain Relationships and Related Transactions, and Director Independence.
Information required by this Item 13 is included under the heading “Corporate Governance and Board Matters - Independence and Related Person Transactions” in our 2015 Proxy Statement. This information is incorporated by reference into this Annual Report on Form 10-K.
Item 14. Principal Accountant Fees and Services.
Information required by this Item 14 is included under the heading “Board Committees and Membership – Audit Committee” in our 2015 Proxy Statement. This information is incorporated by reference into this Annual Report on Form 10-K.
72
PART IV
Item 15. Exhibits and Financial Statement Schedules.
(a) | Index to Consolidated Financial Statements and Schedules |
Page | ||
Report of Independent Registered Public Accounting Firm | ||
Consolidated Statements of Earnings for the Years Ended December 27, 2014, December 28, 2013, and December 29, 2012 | ||
Consolidated Statements of Comprehensive Earnings for the Years Ended December 27, 2014, December 28, 2013, and December 29, 2012 | ||
Consolidated Balance Sheets at December 27, 2014 and December 28, 2013 | ||
Consolidated Statements of Equity for the Years Ended December 27, 2014, December 28, 2013, and December 29, 2012 | ||
Consolidated Statements of Cash Flows for the Years Ended December 27, 2014, December 28, 2013, and December 29, 2012 | ||
Notes to Consolidated Financial Statements | ||
Financial Statement Schedule-Valuation and Qualifying Accounts | S-1 | |
Schedules other than those listed above have been omitted either because such schedules are not required or are not applicable.
(b) | The following exhibits are filed as part of, or incorporated by reference into, this Annual Report: |
2.1 | Separation and Distribution Agreement between Mondelēz International, Inc. (formerly known as Kraft Foods Inc.) and Kraft Foods Group, Inc., dated as of September 27, 2012 (incorporated by reference to Exhibit 2.1 to Amendment No. 1 to our Registration Statement on Form S-4 filed with the SEC on October 26, 2012 (File No. 333-184314)). | ||
2.2 | Canadian Asset Transfer Agreement between Mondelēz Canada Inc. and Kraft Canada Inc., dated as of September 29, 2012 (incorporated by reference to Exhibit 2.2 to Amendment No. 2 to our Registration Statement on Form S-4 filed with the SEC on December 4, 2012 (File No. 333-184314)). | ||
2.3 | Master Ownership and License Agreement Regarding Patents, Trade Secrets and Related Intellectual Property between Kraft Foods Global Brands LLC, Kraft Foods Group Brands LLC, Kraft Foods UK Ltd. and Kraft Foods R&D Inc., dated as of October 1, 2012 (incorporated by reference to Exhibit 2.3 to Amendment No. 2 to our Registration Statement on Form S-4 filed with the SEC on December 4, 2012 (File No. 333-184314)). | ||
2.4 | Master Ownership and License Agreement Regarding Trademarks and Related Intellectual Property between Kraft Foods Global Brands LLC and Kraft Foods Group Brands LLC., dated as of September 27, 2012 (incorporated by reference to Exhibit 2.4 to Amendment No. 2 to our Registration Statement on Form S-4 filed with the SEC on December 4, 2012 (File No. 333-184314)). | ||
3.1 | Amended and Restated Articles of Incorporation of Kraft Foods Group, Inc. (incorporated by reference to Exhibit 3.1 to our Registration Statement on Form 10 filed with the SEC on July 17, 2012 (File No. 001-35491)). | ||
3.2 | Amended and Restated Bylaws of Kraft Foods Group, Inc., effective March 8, 2014 (incorporated by reference to Exhibit 3.1 to our Current Report on Form 8-K filed with the SEC on February 13, 2014 (File No. 001-35491)). | ||
4.1 | Indenture by and between Kraft Foods Group, Inc. and Deutsche Bank Trust Company Americas, as trustee, dated as of June 4, 2012 (incorporated by reference to Exhibit 10.4 to our Registration Statement on Form 10 filed with the SEC on June 21, 2012 (File No. 001-35491)). | ||
73
4.2 | Supplemental Indenture No. 1 by and between Kraft Foods Group, Inc., Mondelēz International, Inc. (formerly known as Kraft Foods Inc.), as guarantor, and Deutsche Bank Trust Company Americas, as trustee, dated as of June 4, 2012 (incorporated by reference to Exhibit 10.5 to our Registration Statement on Form 10 filed with the SEC on June 21, 2012 (File No. 001-35491)). | ||
4.3 | Supplemental Indenture No. 2 by and between Kraft Foods Group, Inc., Mondelēz International, Inc. (formerly known as Kraft Foods Inc.), as guarantor, and Deutsche Bank Trust Company Americas, as trustee, dated as of July 18, 2012 (incorporated by reference to Exhibit 10.27 to our Registration Statement on Form 10 filed with the SEC on August 6, 2012 (File No. 001-35491)). | ||
4.4 | Indenture by and between Nabisco, Inc. (which was acquired by Mondelēz International, Inc in 2000) and Citibank, N.A., as trustee, dated as of June 5, 1995 (incorporated by reference to Exhibit 4.1 to Mondelēz International, Inc.’s Quarterly Report on Form 10-Q filed with the SEC on May 9, 2007 (File No. 001-16483)). | ||
Other instruments defining the rights of holders of long-term debt securities of Kraft Foods Group, Inc. and its subsidiaries are omitted pursuant to Section(b)(4)(iii)(A) of Item 601 of Regulation S-K. We hereby agree to furnish copies of these instruments to the SEC upon request. | |||
10.1 | $3,000,000,000 Five-Year Revolving Credit Agreement, by and among Kraft Foods Group, Inc., the initial lenders named therein, JPMorgan Chase Bank, N.A. and Barclays Bank PLC, as administrative agents, and J.P. Morgan Securities LLC, Barclays Bank PLC, Citigroup Global Markets Inc., and RBS Securities Inc., as joint lead arrangers and joint bookrunners, dated as of May 29, 2014 (incorporated by reference to Exhibit 10.1 to our Quarterly Report on Form 10-Q filed with the SEC on July 31, 2014 (File No. 333-35491)). | ||
10.2 | Tax Sharing and Indemnity Agreement by and between Mondelēz International, Inc. (formerly known as Kraft Foods Inc.) and Kraft Foods Group, Inc., dated as of September 27, 2012 (incorporated by reference to Exhibit 10.3 to Amendment No. 1 to our Registration Statement on Form S-4 filed with the SEC on October 26, 2012 (File No. 333-184314)). | ||
10.3 | Employee Matters Agreement between Mondelēz International, Inc. (formerly known as Kraft Foods Inc.) and Kraft Foods Group, Inc., dated as of September 27, 2012 (incorporated by reference to Exhibit 10.4 to Amendment No. 1 to our Registration Statement on Form S-4 filed with the SEC on October 26, 2012 (File No. 333-184314)). | ||
10.4 | Kraft Foods Group, Inc. Change in Control Plan for Key Executives.+ | ||
10.5 | Kraft Foods Group, Inc. Deferred Compensation Plan for Non-Management Directors (incorporated by reference to Exhibit 4.3 to our Registration Statement on Form S-8 filed with the SEC on September 12, 2012 (File No. 333-183867)).+ | ||
10.6 | Kraft Foods Group, Inc. 2012 Performance Incentive Plan (incorporated by reference to Exhibit 4.3 to our Registration Statement on Form S-8 filed with the SEC on September 12, 2012 (File No. 333-183868)).+ | ||
10.7 | Kraft Foods Group, Inc. Management Stock Purchase Plan.+ | ||
10.8 | Form of Indemnity Agreement between Kraft Foods Group, Inc. and Non-Management Directors (incorporated by reference to Exhibit 10.24 to our Registration Statement on Form 10 filed with the SEC on July 17, 2012 (File No. 001-35491)).+ | ||
10.9 | Form of Indemnity Agreement between Kraft Foods Group, Inc. and Directors and Officers (incorporated by reference to Exhibit 10.25 to our Registration Statement on Form 10 filed with the SEC on July 17, 2012 (File No. 001-35491)).+ | ||
10.10 | Offer of Employment Letter between Kraft Foods Group, Inc. and John T. Cahill, dated December 17, 2014.+ | ||
10.11 | Offer of Employment Letter between Mondelēz International, Inc. (formerly known as Kraft Foods Inc.) and Kim K. W. Rucker, dated July 16, 2012 (incorporated by reference to Exhibit 10.25 to Amendment No. 2 to our Registration Statement on Form S-4 filed with the SEC on December 4, 2012 (File No. 333-184314)).+ | ||
74
10.12 | Offer of Employment Letter between Kraft Foods Group, Inc. and Teri List-Stoll dated July 17, 2013 (incorporated by reference to Exhibit 10.1 to our Quarterly Report on Form 10-Q filed with the SEC on October 31, 2013 (File No. 333-35491)).+ | ||
10.13 | Form of 2012-13 Global Restricted Stock Unit Agreement (incorporated by reference to Exhibit 10.16 to our Annual Report on Form 10-K filed with the SEC on March 21, 2013 (File No. 333-35491)).+ | ||
10.14 | Form of 2012-13 Global Stock Option Award Agreement (incorporated by reference to Exhibit 10.17 to our Annual Report on Form 10-K filed with the SEC on March 21, 2013 (File No. 333-35491)).+ | ||
10.15 | Form of 2012-13 Performance Share Plan Award Agreement (incorporated by reference to Exhibit 10.1 to our Quarterly Report on Form 10-Q filed with the SEC on August 2, 2013 (File No. 333-35491)).+ | ||
10.16 | Form of 2014 Global Stock Option Award Agreement (incorporated by reference to Exhibit 10.1 to our Quarterly Report on Form 10-Q filed with the SEC on May 2, 2014 (File No. 333-35491)).+ | ||
10.17 | Form of 2014 Performance Share Plan Award Agreement (incorporated by reference to Exhibit 10.2 to our Quarterly Report on Form 10-Q filed with the SEC on May 2, 2014 (File No. 333-35491)).+ | ||
10.18 | Form of 2014 Global Restricted Stock Unit Agreement (incorporated by reference to Exhibit 10.3 to our Quarterly Report on Form 10-Q filed with the SEC on May 2, 2014 (File No. 333-35491)).+ | ||
10.19 | Form of 2015 Global Stock Option Award Agreement.+ | ||
10.20 | Form of 2015 Performance Share Plan Award Agreement.+ | ||
10.21 | Form of 2015 Global Restricted Stock Unit Agreement.+ | ||
10.22 | Retirement Agreement and General Release between Kraft Foods Group, Inc. and W. Anthony Vernon, dated as of December 18, 2014.+ | ||
21.1 | List of subsidiaries of Kraft Foods Group, Inc. | ||
23.1 | Consent of PricewaterhouseCoopers LLP, Independent Registered Public Accounting Firm. | ||
31.1 | Certification of Chief Executive Officer pursuant to Rule 13a 14(a)/15d 14(a) of the Securities Exchange Act of 1934. | ||
31.2 | Certification of Chief Financial Officer pursuant to Rule 13a 14(a)/15d 14(a) of the Securities Exchange Act of 1934. | ||
32.1 | Certifications of Chief Executive Officer and Chief Financial Officer pursuant to 18 U.S.C. 1350, as adopted pursuant to Section 906 of the Sarbanes-Oxley Act of 2002. | ||
101.1 | The following materials from Kraft Foods Group’s Annual Report on Form 10-K for the year ended December 27, 2014 formatted in XBRL (eXtensible Business Reporting Language): (i) the Consolidated Statements of Earnings, (ii) the Consolidated Statements of Comprehensive Earnings, (iii) the Consolidated Statements of Equity, (iv) the Consolidated Balance Sheets, (v) the Consolidated Statements of Cash Flows, (vi) Notes to Consolidated Financial Statements, and (vii) document and entity information. | ||
+ | Indicates a management contract or compensatory plan or arrangement. | ||
75
Signatures
Pursuant to the requirements of Section 13 or 15(d) of the Securities Exchange Act of 1934, the registrant has duly caused this report to be signed on its behalf by the undersigned, thereunto duly authorized.
KRAFT FOODS GROUP, INC.
/s/ Teri List-Stoll
Teri List-Stoll
Executive Vice President and
Chief Financial Officer
Date: February 19, 2015
Pursuant to the requirements of the Securities Exchange Act of 1934, this report has been signed below by the following persons on behalf of the registrant and in the capacities and on the date indicated:
Signature | Title | Date | ||
/S/ JOHN T. CAHILL John T. Cahill | Director, Chairman and Chief Executive Officer | February 19, 2015 | ||
/S/ TERI LIST-STOLL Teri List-Stoll | Executive Vice President and Chief Financial Officer | February 19, 2015 | ||
/S/ MELINDA D. WHITTINGTON Melinda D. Whittington | Senior Vice President, Corporate Controller (Principal Accounting Officer) | February 19, 2015 | ||
/S/ ABELARDO E. BRU Abelardo E. Bru | Director | February 19, 2015 | ||
/S/ L. KEVIN COX L. Kevin Cox | Director | February 19, 2015 | ||
/S/ MYRA M. HART Myra M. Hart | Director | February 19, 2015 | ||
/S/ PETER B. HENRY Peter B. Henry | Director | February 19, 2015 | ||
/S/ JEANNE P. JACKSON Jeanne P. Jackson | Director | February 19, 2015 | ||
/S/ TERRY J. LUNDGREN Terry J. Lundgren | Director | February 19, 2015 | ||
/S/ MACKEY J. MCDONALD Mackey J. McDonald | Director | February 19, 2015 | ||
/S/ JOHN C. POPE John C. Pope | Director | February 19, 2015 | ||
/S/ E. FOLLIN SMITH E. Follin Smith | Director | February 19, 2015 | ||
/S/ W. ANTHONY VERNON W. Anthony Vernon | Director | February 19, 2015 | ||
76
Kraft Foods Group, Inc.
Valuation and Qualifying Accounts
For the Years Ended December 27, 2014, December 28, 2013, and December 29, 2012
(in millions)
Col. A | Col. B | Col. C | Col. D | Col. E | ||||||||||||||||
Additions | ||||||||||||||||||||
Description | Balance at Beginning of Period | Charged to Costs and Expenses | Charged to Other Accounts | Deductions | Balance at End of Period | |||||||||||||||
(a) | (b) | |||||||||||||||||||
2014: | ||||||||||||||||||||
Allowances related to accounts receivable | $ | 26 | $ | (2 | ) | $ | — | $ | 3 | $ | 21 | |||||||||
Allowance for deferred taxes | 3 | 20 | — | 3 | 20 | |||||||||||||||
$ | 29 | $ | 18 | $ | — | $ | 6 | $ | 41 | |||||||||||
2013: | ||||||||||||||||||||
Allowances related to accounts receivable | $ | 28 | $ | 1 | $ | — | $ | 3 | $ | 26 | ||||||||||
Allowance for deferred taxes | 26 | — | — | 23 | 3 | |||||||||||||||
$ | 54 | $ | 1 | $ | — | $ | 26 | $ | 29 | |||||||||||
2012: | ||||||||||||||||||||
Allowances related to accounts receivable | $ | 23 | $ | 9 | $ | — | $ | 4 | $ | 28 | ||||||||||
Allowance for deferred taxes | 34 | (4 | ) | — | 4 | 26 | ||||||||||||||
$ | 57 | $ | 5 | $ | — | $ | 8 | $ | 54 | |||||||||||
Notes:
(a) | Primarily related to divestitures and currency translation. |
(b) | Represents charges for which allowances were created. |
S-1