Attached files
| file | filename |
|---|---|
| 8-K - FORM 8-K - HUNTINGTON INGALLS INDUSTRIES, INC. | q42014earningsrelease8-k.htm |
| EX-99.1 - EXHIBIT 99.1 - HUNTINGTON INGALLS INDUSTRIES, INC. | hii2014q4earningsrelease.htm |
Q4 2014 Earnings Presentation February 19, 2015 Mike Petters President and Chief Executive Officer Barb Niland Corporate Vice President, Business Management & Chief Financial Officer Exhibit 99.2
Safe Harbor 2 Statements in this presentation, other than statements of historical fact, constitute "forward-looking statements" within the meaning of the Private Securities Litigation Reform Act of 1995. Forward-looking statements involve risks and uncertainties that could cause our actual results to differ materially from those expressed in these statements. Factors that may cause such differences include: changes in government and customer priorities and requirements (including government budgetary constraints, shifts in defense spending, and changes in customer short-range and long-range plans); our ability to obtain new contracts, estimate our future contract costs and perform our contracts effectively; changes in government regulations and procurement processes and our ability to comply with such requirements; our ability to realize the expected benefits from consolidation of our Ingalls facilities; natural disasters; adverse economic conditions in the United States and globally; risks related to our indebtedness and leverage; and other risk factors discussed in our filings with the U.S. Securities and Exchange Commission. There may be other risks and uncertainties that we are unable to predict at this time or that we currently do not expect to have a material adverse effect on our business, and we undertake no obligation to update any forward-looking statements. You should not place undue reliance on any forward-looking statements that we may make. This presentation also contains non-GAAP financial measures and includes a GAAP reconciliation of these financial measures. Non-GAAP financial measures should not be construed as being more important than comparable GAAP measures.
Highlights from Q4 and FY 2014 3 Revenues were $1.93 billion for the quarter and $6.96 billion for the year Diluted EPS was $1.05 for the quarter and $6.86 for the year Adjusted Diluted EPS* was $2.19 for the quarter and $7.14 for the year Strong segment operating performance: Ingalls operating margin** was 11.8% for the quarter and 10.0% for the year Newport News operating margin** was 9.2% for the quarter and 9.1% for the year Delivered LHA-6 America, the last of the underperforming ship contracts Strong cash flow generation: Cash from operations was $402 million for Q4 and $716 million for the year Free cash flow*** was $328 million for Q4 and $551 million for the year $10.1 billion of new contract awards in FY 2014 bringing total backlog at the end of the year to $21.4 billion * Non-GAAP metric that excludes the tax-effected impacts of hurricane insurance recoveries and the Gulfport closure in 2013 and the net effect of the non-cash goodwill impairment charge and the tax-effected expense for early extinguishment of debt in 2014 and the tax-effected FAS/CAS Adjustment. See appendix for reconciliation. ** Non-GAAP metrics that exclude non-segment factors affecting operating income. See appendix for reconciliation. *** Non-GAAP metric. See appendix for reconciliation.
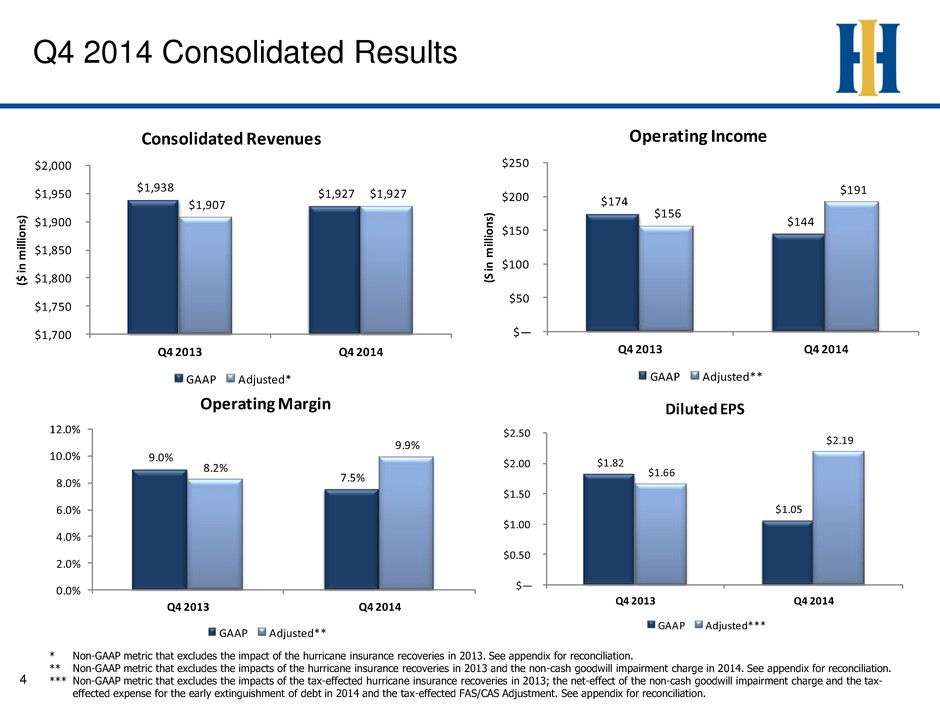
Q4 2014 Consolidated Results 4 * Non-GAAP metric that excludes the impact of the hurricane insurance recoveries in 2013. See appendix for reconciliation. ** Non-GAAP metric that excludes the impacts of the hurricane insurance recoveries in 2013 and the non-cash goodwill impairment charge in 2014. See appendix for reconciliation. *** Non-GAAP metric that excludes the impacts of the tax-effected hurricane insurance recoveries in 2013; the net-effect of the non-cash goodwill impairment charge and the tax- effected expense for the early extinguishment of debt in 2014 and the tax-effected FAS/CAS Adjustment. See appendix for reconciliation. $1,938 $1,927 $1,907 $1,927 $1,700 $1,750 $1,800 $1,850 $1,900 $1,950 $2,000 Q4 2013 Q4 2014 ($ in m illi on s) Consolidated Revenues GAAP Adjusted* 9.0% 7.5% 8.2% 9.9% 0.0% 2.0% 4.0% 6.0% 8.0% 10.0% 12.0% Q4 2013 Q4 2014 Operating Margin GAAP Adjusted** $174 $144 $156 $191 $— $50 $100 $150 $200 $250 Q4 2013 Q4 2014 (S in m illi on s) Op rating Income GAAP Adjusted** $1.82 $1.05 $1.66 $2.19 $— $0.50 $1.00 $1.50 $2.00 $2.50 Q4 2013 Q4 2014 Diluted EPS GAAP Adjusted***
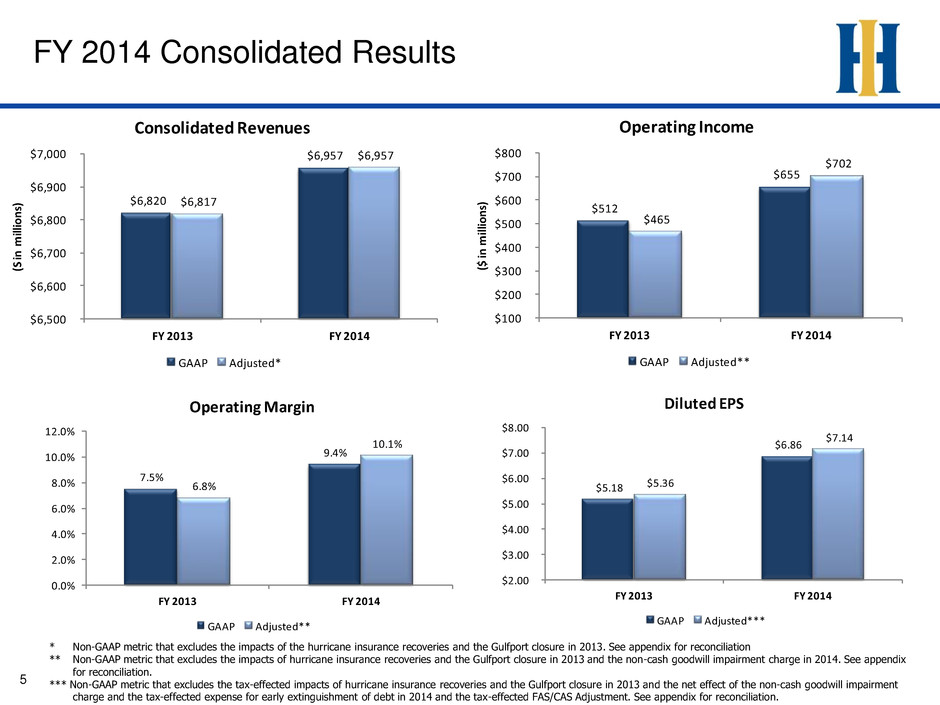
FY 2014 Consolidated Results 5 $6,820 $6,957 $6,817 $6,957 $6,500 $6,600 $6,700 $6,800 $6,900 $7,000 FY 2013 FY 2014 (S in m illi on s) Consolidated Revenues GAAP Adjusted* 7.5% 9.4% 6.8% 10.1% 0.0% 2.0% 4.0% 6.0% 8.0% 10.0% 12.0% FY 2013 FY 2014 Operating Margin GAAP Adjusted** $512 $655 $465 $702 $100 $200 $300 $400 $500 $600 $700 $800 FY 2013 FY 2014 ($ in m illi on s) Operating Income GAAP Adjusted** * Non-GAAP metric that excludes the impacts of the hurricane insurance recoveries and the Gulfport closure in 2013. See appendix for reconciliation ** Non-GAAP metric that excludes the impacts of hurricane insurance recoveries and the Gulfport closure in 2013 and the non-cash goodwill impairment charge in 2014. See appendix for reconciliation. *** Non-GAAP metric that excludes the tax-effected impacts of hurricane insurance recoveries and the Gulfport closure in 2013 and the net effect of the non-cash goodwill impairment charge and the tax-effected expense for early extinguishment of debt in 2014 and the tax-effected FAS/CAS Adjustment. See appendix for reconciliation. $5.18 $6.86 $5.36 $7.14 $2.00 $3.00 $4.00 $5.00 $6.00 $7.00 $8.00 FY 2013 FY 2014 Diluted EPS GAAP Adjusted***
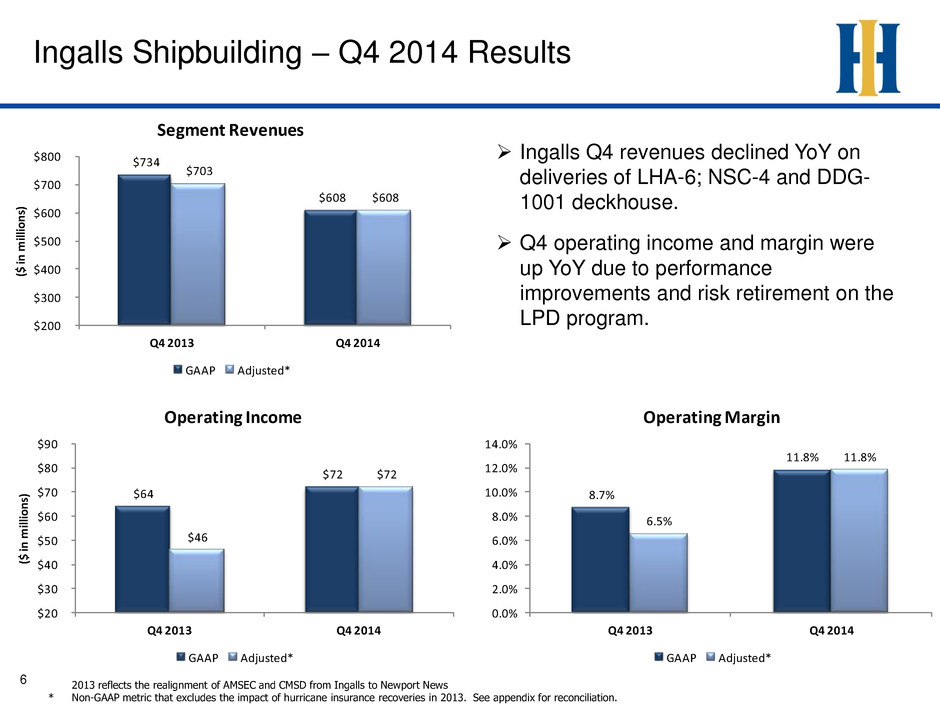
2013 reflects the realignment of AMSEC and CMSD from Ingalls to Newport News * Non-GAAP metric that excludes the impact of hurricane insurance recoveries in 2013. See appendix for reconciliation. Ingalls Shipbuilding – Q4 2014 Results 6 Ingalls Q4 revenues declined YoY on deliveries of LHA-6; NSC-4 and DDG- 1001 deckhouse. Q4 operating income and margin were up YoY due to performance improvements and risk retirement on the LPD program. $734 $608 $703 $608 $200 $300 $400 $500 $600 $700 $800 Q4 2013 Q4 2014 ($ in m illi on s) Segment Revenues GAAP Adjusted* $64 $72 $46 $72 $20 $30 $40 $50 6 7 $80 $90 Q4 2013 Q4 2014 ($ in m illi on s) Operating Income GAAP Adjusted* 8.7% 11.8% 6.5% 11.8% 0.0% 2.0% 4.0% 6.0% 8.0% 10.0% 12.0% 14.0% Q4 2013 Q4 2014 Operating Margin GAAP Adjusted*
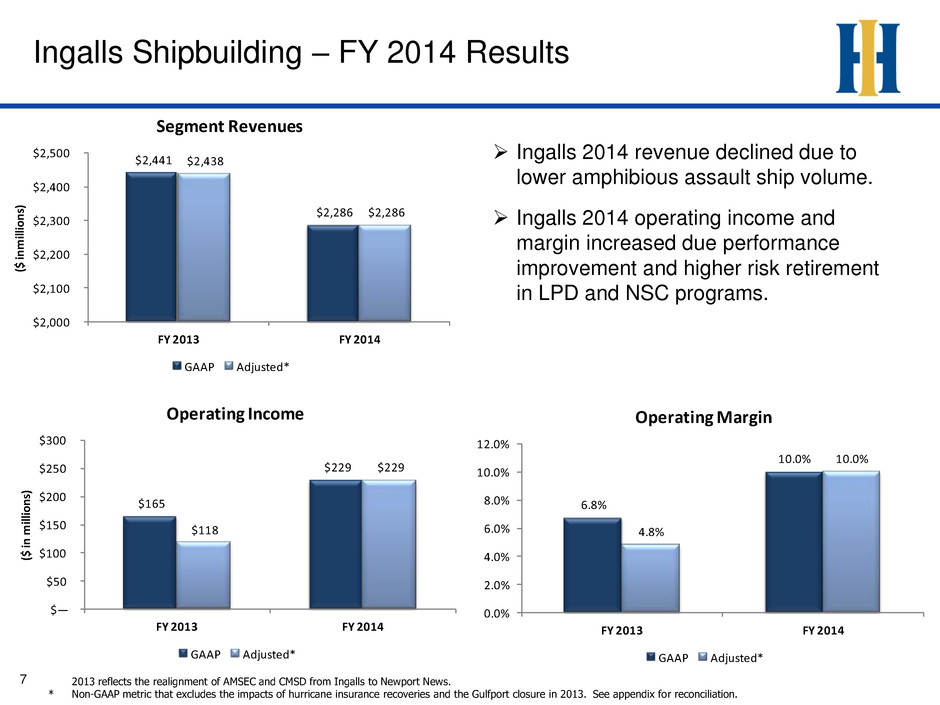
2013 reflects the realignment of AMSEC and CMSD from Ingalls to Newport News. * Non-GAAP metric that excludes the impacts of hurricane insurance recoveries and the Gulfport closure in 2013. See appendix for reconciliation. Ingalls Shipbuilding – FY 2014 Results 7 Ingalls 2014 revenue declined due to lower amphibious assault ship volume. Ingalls 2014 operating income and margin increased due performance improvement and higher risk retirement in LPD and NSC programs. $2,441 $2,286 $2,438 $2,286 $2,000 $2,100 $2,200 $2,300 $2,400 $2,500 FY 2013 FY 2014 ($ in m illi on s) Segment Revenues GAAP Adjusted* $165 $229 $118 $229 $— $50 $100 $150 $200 $250 $300 FY 2013 FY 2014 ($ in m illi on s) Operating Income GAAP Adjusted* 6.8% 10.0% 4.8% 10.0% 0.0% 2.0% 4.0% 6.0% 8.0% 10.0% 12.0% FY 2013 FY 2014 Operating Margin GAAP Adjusted*
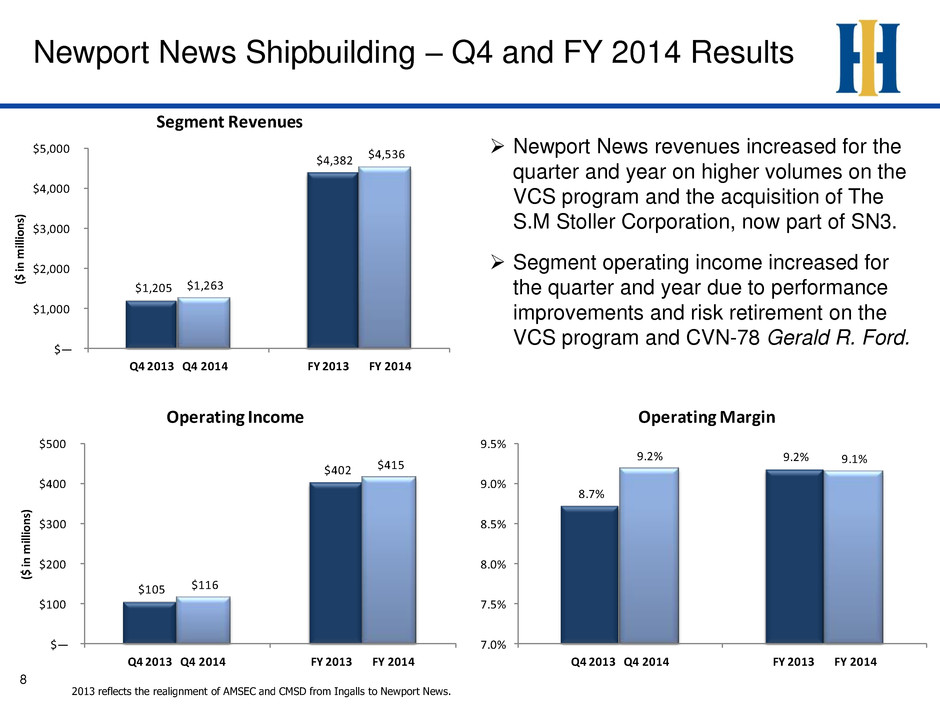
Newport News Shipbuilding – Q4 and FY 2014 Results 8 Newport News revenues increased for the quarter and year on higher volumes on the VCS program and the acquisition of The S.M Stoller Corporation, now part of SN3. Segment operating income increased for the quarter and year due to performance improvements and risk retirement on the VCS program and CVN-78 Gerald R. Ford. $1,205 $4,382 $1,263 $4,536 $— $1,000 $2,000 $3,000 $4,000 $5,000 Q4 2013 Q4 2014 FY 2013 FY 2014 ($ in m illi on s) Segment Revenues $105 $402 $116 $415 $— $100 $200 $300 $400 $500 Q4 2013 Q4 2014 FY 2013 FY 2014 ($ in m illi on s) Operating Income 8.7% 9.2%9.2% 9.1% 7.0% 7.5% 8.0% 8.5% 9.0% 9.5% Q4 2013 Q4 2014 FY 2013 FY 2014 Operating Margin 2013 reflects the realignment of AMSEC and CMSD from Ingalls to Newport News.
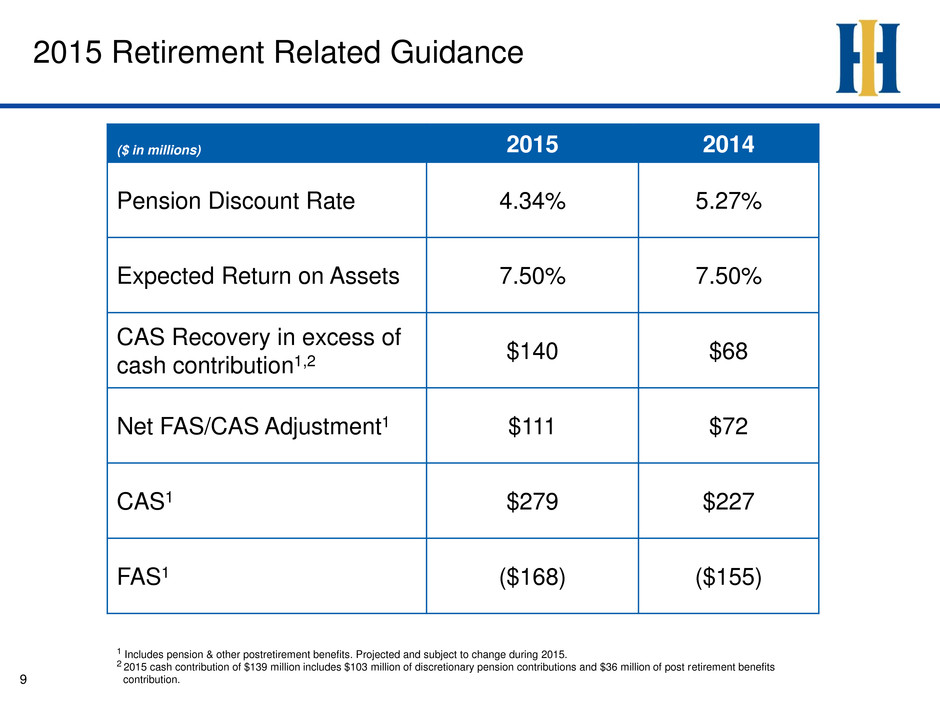
2015 Retirement Related Guidance 9 ($ in millions) 2015 2014 Pension Discount Rate 4.34% 5.27% Expected Return on Assets 7.50% 7.50% CAS Recovery in excess of cash contribution1,2 $140 $68 Net FAS/CAS Adjustment1 $111 $72 CAS1 $279 $227 FAS1 ($168) ($155) 1 Includes pension & other postretirement benefits. Projected and subject to change during 2015. 2 2015 cash contribution of $139 million includes $103 million of discretionary pension contributions and $36 million of post retirement benefits contribution.
U n sa ve d Docum e n t / 1 2 /2 9 /1 0 / 1 0 :0 2 Appendix
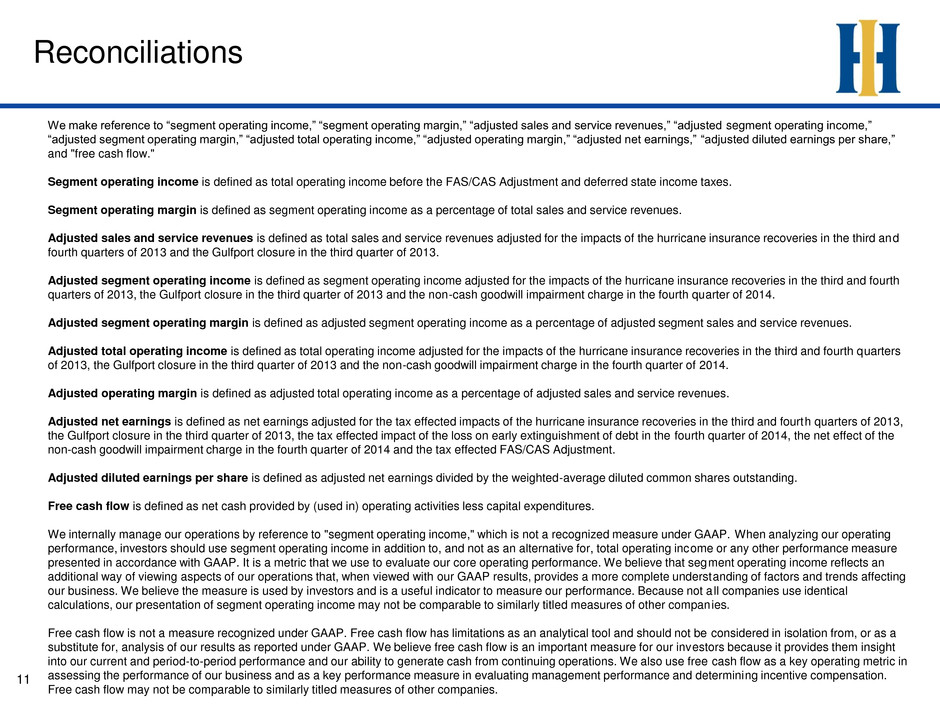
Reconciliations 11 We make reference to “segment operating income,” “segment operating margin,” “adjusted sales and service revenues,” “adjusted segment operating income,” “adjusted segment operating margin,” “adjusted total operating income,” “adjusted operating margin,” “adjusted net earnings,” “adjusted diluted earnings per share,” and "free cash flow." Segment operating income is defined as total operating income before the FAS/CAS Adjustment and deferred state income taxes. Segment operating margin is defined as segment operating income as a percentage of total sales and service revenues. Adjusted sales and service revenues is defined as total sales and service revenues adjusted for the impacts of the hurricane insurance recoveries in the third and fourth quarters of 2013 and the Gulfport closure in the third quarter of 2013. Adjusted segment operating income is defined as segment operating income adjusted for the impacts of the hurricane insurance recoveries in the third and fourth quarters of 2013, the Gulfport closure in the third quarter of 2013 and the non-cash goodwill impairment charge in the fourth quarter of 2014. Adjusted segment operating margin is defined as adjusted segment operating income as a percentage of adjusted segment sales and service revenues. Adjusted total operating income is defined as total operating income adjusted for the impacts of the hurricane insurance recoveries in the third and fourth quarters of 2013, the Gulfport closure in the third quarter of 2013 and the non-cash goodwill impairment charge in the fourth quarter of 2014. Adjusted operating margin is defined as adjusted total operating income as a percentage of adjusted sales and service revenues. Adjusted net earnings is defined as net earnings adjusted for the tax effected impacts of the hurricane insurance recoveries in the third and fourth quarters of 2013, the Gulfport closure in the third quarter of 2013, the tax effected impact of the loss on early extinguishment of debt in the fourth quarter of 2014, the net effect of the non-cash goodwill impairment charge in the fourth quarter of 2014 and the tax effected FAS/CAS Adjustment. Adjusted diluted earnings per share is defined as adjusted net earnings divided by the weighted-average diluted common shares outstanding. Free cash flow is defined as net cash provided by (used in) operating activities less capital expenditures. We internally manage our operations by reference to "segment operating income," which is not a recognized measure under GAAP. When analyzing our operating performance, investors should use segment operating income in addition to, and not as an alternative for, total operating income or any other performance measure presented in accordance with GAAP. It is a metric that we use to evaluate our core operating performance. We believe that segment operating income reflects an additional way of viewing aspects of our operations that, when viewed with our GAAP results, provides a more complete understanding of factors and trends affecting our business. We believe the measure is used by investors and is a useful indicator to measure our performance. Because not all companies use identical calculations, our presentation of segment operating income may not be comparable to similarly titled measures of other companies. Free cash flow is not a measure recognized under GAAP. Free cash flow has limitations as an analytical tool and should not be considered in isolation from, or as a substitute for, analysis of our results as reported under GAAP. We believe free cash flow is an important measure for our investors because it provides them insight into our current and period-to-period performance and our ability to generate cash from continuing operations. We also use free cash flow as a key operating metric in assessing the performance of our business and as a key performance measure in evaluating management performance and determining incentive compensation. Free cash flow may not be comparable to similarly titled measures of other companies.
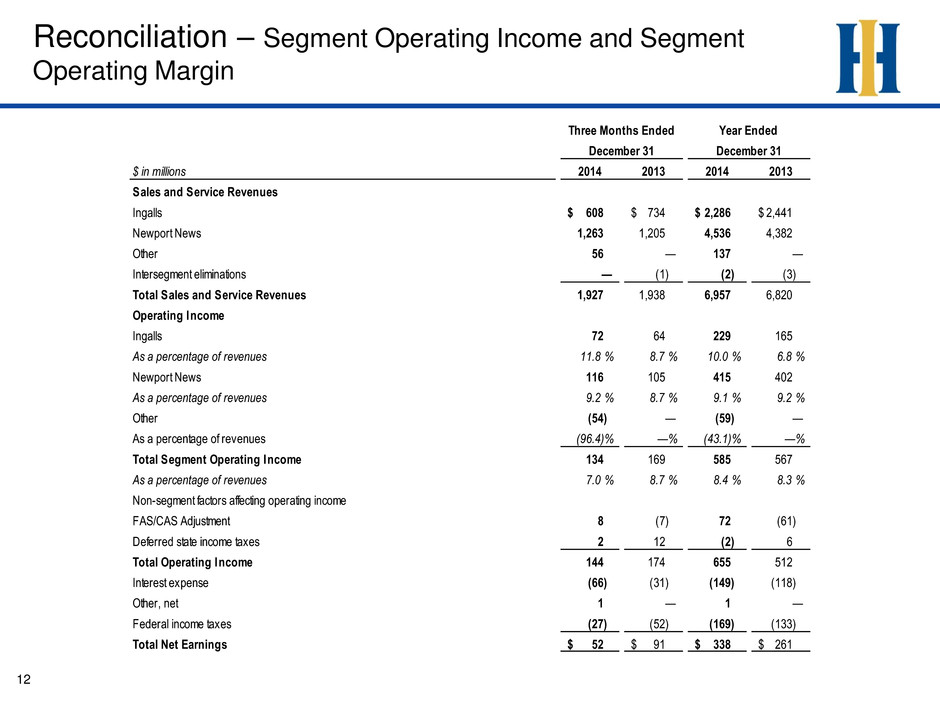
Reconciliation – Segment Operating Income and Segment Operating Margin 12 $ in millions 2014 2013 2014 2013 Sales and Service Revenues Ingalls 608$ 734$ 2,286$ 2,441$ Newport News 1,263 1,205 4,536 4,382 Other 56 — 137 — Intersegment eliminations — (1) (2) (3) Total Sales and Service Revenues 1,927 1,938 6,957 6,820 Operating Income Ingalls 72 64 229 165 As a percentage of revenues 11.8 % 8.7 % 10.0 % 6.8 % Newport News 116 105 415 402 As a percentage of revenues 9.2 % 8.7 % 9.1 % 9.2 % Other (54) — (59) — As a percentage of revenues (96.4)% —% (43.1)% —% Total Segment Operating Income 134 169 585 567 As a percentage of revenues 7.0 % 8.7 % 8.4 % 8.3 % Non-segment factors affecting operating income FAS/CAS Adjustment 8 (7) 72 (61) Deferred state income taxes 2 12 (2) 6 Total Operating Income 144 174 655 512 Interest expense (66) (31) (149) (118) Other, net 1 — 1 — Federal income taxes (27) (52) (169) (133) Total Net Earnings 52$ 91$ 338$ 261$ Three Months Ended Year Ended December 31 December 31
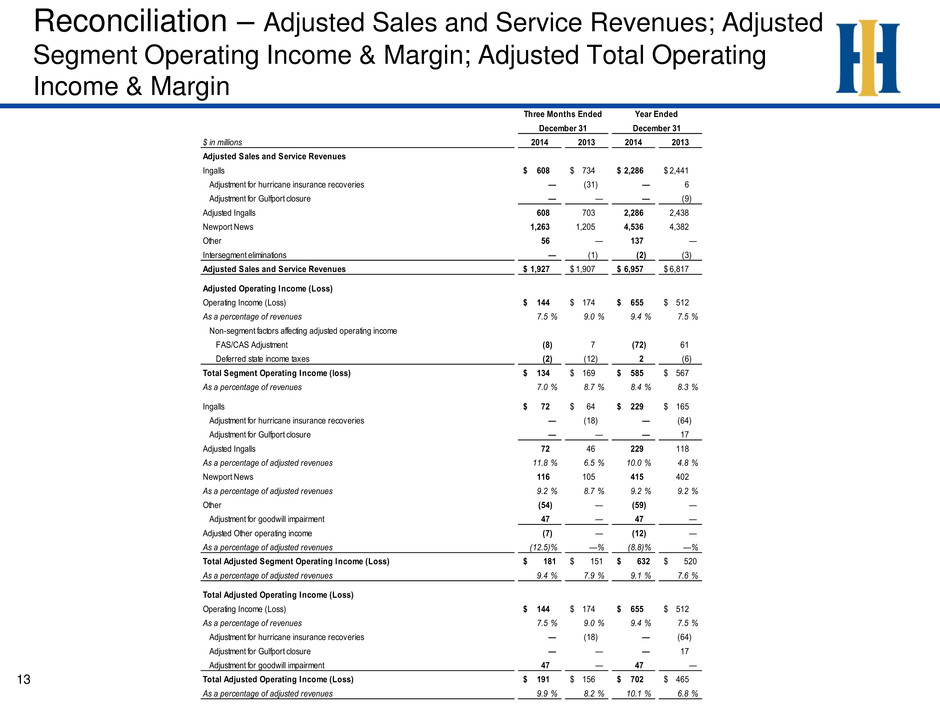
Reconciliation – Adjusted Sales and Service Revenues; Adjusted Segment Operating Income & Margin; Adjusted Total Operating Income & Margin 13 $ in millions 2014 2013 2014 2013 Adjusted Sales and Service Revenues Ingalls 608$ 734$ 2,286$ 2,441$ Adjustment for hurricane insurance recoveries — (31) — 6 Adjustment for Gulfport closure — — — (9) Adjusted Ingalls 608 703 2,286 2,438 Newport News 1,263 1,205 4,536 4,382 Other 56 — 137 — Intersegment eliminations — (1) (2) (3) Adjusted Sales and Service Revenues 1,927$ 1,907$ 6,957$ 6,817$ Adjusted Operating Income (Loss) Operating Income (Loss) 144$ 174$ 655$ 512$ As a percentage of revenues 7.5 % 9.0 % 9.4 % 7.5 % Non-segment factors affecting adjusted operating income FAS/CAS Adjustment (8) 7 (72) 61 Deferred state income taxes (2) (12) 2 (6) Total Segment Operating Income (loss) 134$ 169$ 585$ 567$ As a percentage of revenues 7.0 % 8.7 % 8.4 % 8.3 % Ingalls 72$ 64$ 229$ 165$ Adjustment for hurricane insurance recoveries — (18) — (64) Adjustment for Gulfport closure — — — 17 Adjusted Ingalls 72 46 229 118 As a percentage of adjusted revenues 11.8 % 6.5 % 10.0 % 4.8 % Newport News 116 105 415 402 As a percentage of adjusted revenues 9.2 % 8.7 % 9.2 % 9.2 % Other (54) — (59) — Adjustment for goodwill impairment 47 — 47 — Adjusted Other operating income (7) — (12) — As a percentage of adjusted revenues (12.5)% —% (8.8)% —% Total Adjusted Segment Operating Income (Loss) 181$ 151$ 632$ 520$ As a percentage of adjusted revenues 9.4 % 7.9 % 9.1 % 7.6 % Total Adjusted Operating Income (Loss) Operating Income (Loss) 144$ 174$ 655$ 512$ As a percentage of revenues 7.5 % 9.0 % 9.4 % 7.5 % Adjustment for hurricane insurance recoveries — (18) — (64) Adjustment for Gulfport closure — — — 17 Adjustment for goodwill impairment 47 — 47 — Total Adjusted Operating Income (Loss) 191$ 156$ 702$ 465$ As a percentage of adjusted revenues 9.9 % 8.2 % 10.1 % 6.8 % Three Months Ended Year Ended December 31 December 31
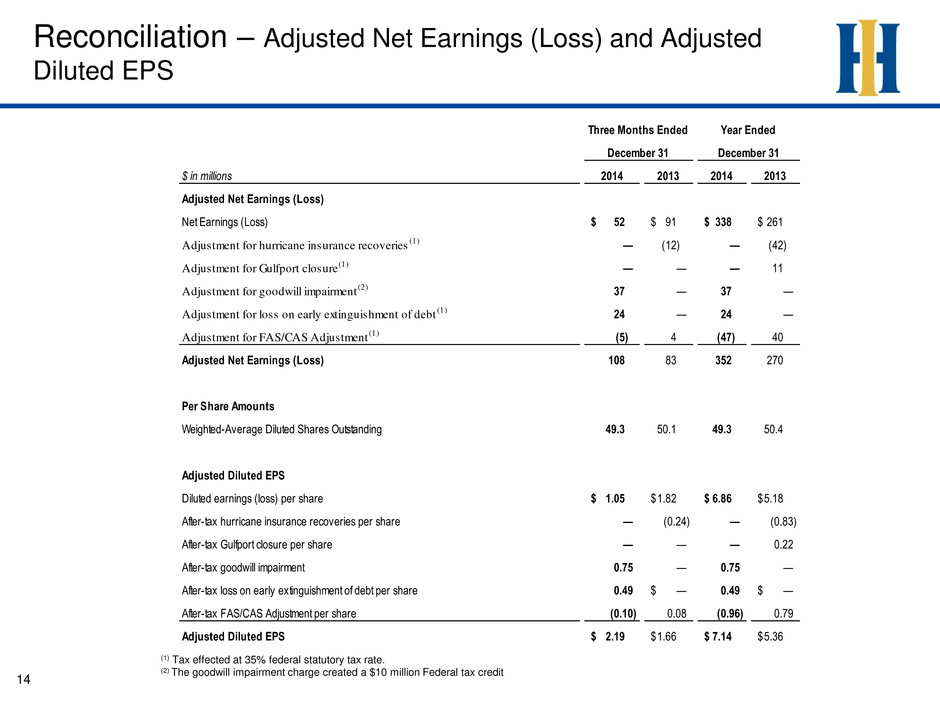
Reconciliation – Adjusted Net Earnings (Loss) and Adjusted Diluted EPS 14 (1) Tax effected at 35% federal statutory tax rate. (2) The goodwill impairment charge created a $10 million Federal tax credit $ in millions 2014 2013 2014 2013 Adjusted Net Earnings (Loss) Net Earnings (Loss) 52$ 91$ 338$ 261$ Adjustment for hurricane insurance recoveries (1) — (12) — (42) Adjustment for Gulfport closure(1) — — — 11 Adjustment for goodwill impairment (2) 37 — 37 — Adjustment for loss on early extinguishment of debt (1) 24 — 24 — Adjustment for FAS/CAS Adjustment (1) (5) 4 (47) 40 Adjusted Net Earnings (Loss) 108 83 352 270 Per Share Amounts Weighted-Average Diluted Shares Outstanding 49.3 50.1 49.3 50.4 Adjusted Diluted EPS Diluted earnings (loss) per share 1.05$ 1.82$ 6.86$ 5.18$ After-tax hurricane insurance recoveries per share — (0.24) — (0.83) After-tax Gulfport closure per share — — — 0.22 After-tax goodwill impairment 0.75 — 0.75 — After-tax loss on early extinguishment of debt per share 0.49 —$ 0.49 —$ After-tax FAS/CAS Adjustment per share (0.10) 0.08 (0.96) 0.79 Adjusted Diluted EPS 2.19$ 1.66$ 7.14$ 5.36$ Three Months Ended Year Ended December 31 December 31
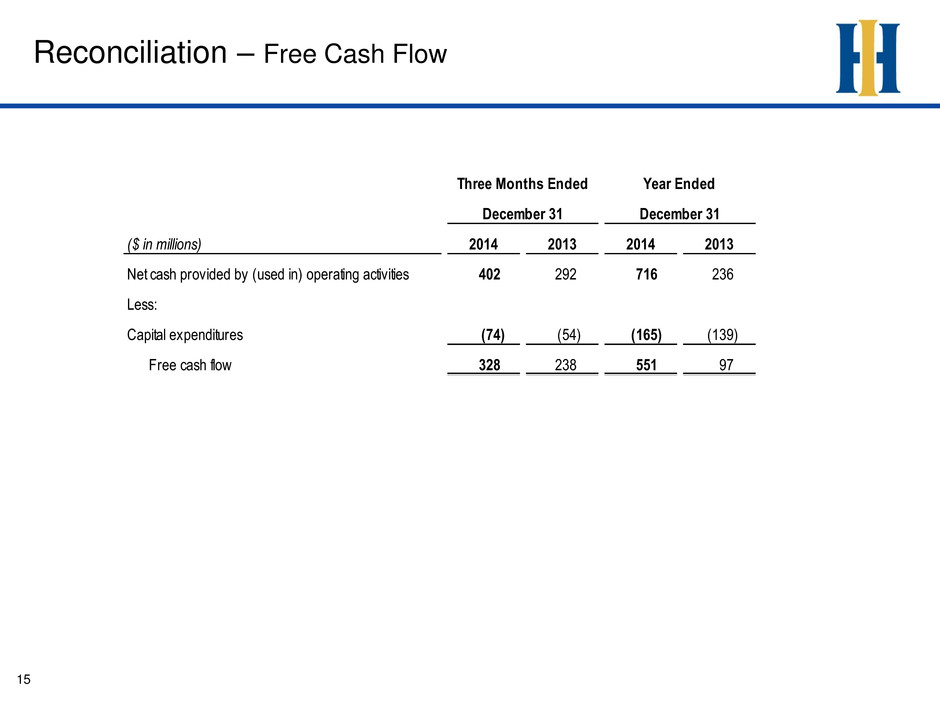
Reconciliation – Free Cash Flow 15 ($ in millions) 2014 2013 2014 2013 Net cash provided by (used in) operating activities 402 292 716 236 Less: Capital expenditures (74) (54) (165) (139) Free cash flow 328 238 551 97 Three Months Ended Year Ended December 31 December 31
