Attached files
| file | filename |
|---|---|
| 8-K - FORM 8-K - Apollo Residential Mortgage, Inc. | d875208d8k.htm |
| EX-99.1 - EX-99.1 - Apollo Residential Mortgage, Inc. | d875208dex991.htm |
 February 19, 2015
Supplemental Financial Information Presentation
Q4 2014
Information is as of December 31, 2014 except as otherwise noted.
It should not be assumed that investments made in the future will
be profitable or will equal the performance of investments in this document.
Exhibit 99.2 |
 2
APOLLO RESIDENTIAL MORTGAGE, INC. (“AMTG”)
Apollo Residential Mortgage, Inc.
Fourth Quarter 2014 Earnings Call
February 19, 2015
Michael A. Commaroto
Chief Executive Officer
Teresa D. Covello
Chief Financial Officer
Keith Rosenbloom
Agency Portfolio Manager
Paul Mangione
Non-Agency Portfolio Manager
Hilary Ginsberg
Investor Relations Manager |
 3
APOLLO RESIDENTIAL MORTGAGE, INC. (“AMTG”)
Forward Looking Statements
Certain statements contained in this presentation may constitute
forward-looking statements within the meaning of Section 27A of the Securities Act of 1933, as amended, and Section 21E of the
Securities Exchange Act of 1934, as amended, and we claim the
protections of the safe harbor for forward looking statements contained in such sections. Forward-looking statements are subject to
substantial risks and uncertainties, many of which are difficult to
predict and are generally beyond management’s control. These forward-looking statements include information about possible or
assumed future results of Apollo Residential Mortgage, Inc.’s
(“AMTG” or the “Company”) business, financial condition, liquidity, results of operations, plans and objectives. When used in this
presentation, the words "believe," "expect,"
"anticipate," "estimate," "plan," "continue," "intend," "should," "may", or similar expressions are intended to identify forward-looking statements. Statements
regarding the following subjects, among others, may be
forward-looking: market trends in the Company’s industry, interest rates, real estate values, the debt securities markets, the U.S. housing market
or the general economy or the demand for residential mortgage loans;
the Company’s business and investment strategy; the Company’s operating results and potential asset performance; availability of
opportunities to acquire Agency RMBS, non-Agency RMBS, residential
mortgage loans and other residential mortgage assets or other real estate related assets; changes in the prepayment rates on the
mortgage loans securing the Company’s RMBS; management’s
assumptions regarding default rates on the mortgage loans securing the Company’s non-Agency RMBS; the Company’s ability to borrow
to finance its assets and the terms, including the cost, maturity and
other terms, of any such borrowing; the Company’s estimates regarding taxable income, the actual amount of which is dependent on a
number of factors, including, but not limited to, changes in the amount
of interest income and financing costs, the method elected by the Company to accrete the market discount on non-Agency RMBS,
realized losses and changes in the composition of the Company’s
Agency RMBS and non-Agency RMBS portfolios that may occur during the applicable tax period, including gain or loss on any RMBS
disposals; expected leverage; general volatility of the securities
markets in which the Company participates; the Company’s expected portfolio and scope of the Company’s target assets; the Company’s
expected investment and underwriting process; interest rate mismatches
between the Company’s target assets and any borrowings used to fund such assets; changes in interest rates and the market value
of the Company’s target assets; rates of default or decreased
recovery rates on the Company’s assets; the degree to which the Company’s hedging strategies may or may not protect the Company from
interest rate volatility and the effects of hedging instruments on the
Company’s assets; the impact of and changes in governmental regulations, tax law and rates, accounting guidance and similar matters
affecting the Company’s business; the timing and amount of
distributions to stockholders, which are declared and paid at the discretion of the Company’s board of directors and will depend on, among
other things, the Company’s taxable income, the Company’s
financial results and overall financial condition and liquidity; maintenance of the Company’s qualification as a real estate investment trust
for U.S. Federal income tax purposes and such other factors as the
Company’s board of directors deems relevant; the Company’s ability to maintain its exclusion from registration as an investment
company under the Investment Company Act of 1940, as amended;
availability of qualified personnel through ARM Manager, LLC; and the Company’s understanding of its competition.
The forward-looking statements are based on management’s
beliefs, assumptions and expectations of AMTG’s future performance, taking into account all information currently available to
management. Forward-looking statements are not predictions of
future events. These beliefs, assumptions and expectations can change as a result of many possible events or factors, not all of which are
known to AMTG. Some of these factors are described in the Company's
Annual Report on Form 10-K for the year ended December 31, 2013 and the Company’s other filings with the Securities and
Exchange Commission (“SEC”). These and other risks,
uncertainties and factors, including those described in the Company’s annual, quarterly and current reports filed with the SEC , could cause the
Company’s actual results to differ materially from those included
in any forward-looking statements we make. All forward-looking statements speak only as of the date on which they are made. New
risks and uncertainties arise over time, and it is not possible for
management to predict those events or how they may affect AMTG. Except as required by law, AMTG is not obligated to, and does not
intend to, update or revise any forward-looking statements, whether
as a result of new information, future events or otherwise.
This presentation contains information regarding the Company’s
financial results that is calculated and presented on the basis of methodologies other than in accordance with accounting principles
generally accepted in the United States (“GAAP”), including
Operating Earnings and Operating Earnings per share. Please refer to page 4 for a definition of “Operating Earnings” and the reconciliation
of “Operating Earnings” to the applicable GAAP financial
measure set forth on pages 17 and 18. This presentation may contain statistics and other data that in some
cases has been obtained from or compiled from information made available by third-party service providers. AMTG makes no
representation or warranty, expressed or implied, with respect to the
accuracy, reasonableness or completeness of such information. Past performance is not indicative nor a guarantee of future
returns. Index performance and yield data are shown for illustrative purposes
only and have limitations when used for comparison or for other purposes due to, among other matters, volatility, credit or other
factors (such as number and types of securities). Indices are
unmanaged, do not charge any fees or expenses, assume reinvestment of income and do not employ special investment techniques such as
leveraging or short selling. No such index is indicative of the
future results of any investment by AMTG. |
 4
APOLLO RESIDENTIAL MORTGAGE, INC. (“AMTG”)
Fourth Quarter and Full Year 2014 Summary Highlights
Reported Operating Earnings of $16.9 million, or $0.53 per
share
of
common
stock
for
the
fourth
quarter
of
2014
(1)
Quarter-end leverage multiple of 4.4x at December 31, 2014
Declared a $0.45 per share of common stock quarterly
dividend for stockholders of record as of December 31, 2014
Book value per share of common stock of $19.12 at
December 31, 2014
Residential Mortgage Backed Securities (“RMBS”) portfolio
totaled $3.8 billion at December 31, 2014
RMBS, securitized mortgage loan portfolio and other credit
investments had a 2.6% effective net interest spread and a
15.3%
effective
levered
asset
yield
at
December
31,
2014
(2)
Fourth Quarter 2014 Highlights
Full Year 2014 Highlights
Reported Operating Earnings of $66.8 million, or $2.09 per
share
of
common
stock
for
year
ended
December
31,
2014
(1)
Increased quarterly dividend per share of common stock for
three consecutive quarters, resulting in a 12.5% total increase
Estimated taxable income of $1.66 per share of common stock
Continued rotation of investment portfolio into credit-related
investments; At December 31, 2014, 60% of AMTG’s
portfolio was allocated to non-Agency RMBS, securitized
mortgage loans and other credit investments
Had $28.6 million of advances outstanding on a warehouse line
receivable, held $9.6 million of legal title to real estate subject
to bond-for-title contracts (“BFT Contracts”)
and $2.3 million of mortgage loans under the newly launched
Seller Financing Program
(3)
at December 31, 2014
Purchased $40 million of other credit-focused assets, including
a pool of residential mortgage loans and small-balance
commercial mortgage-backed securities
(1) Operating Earnings and Operating Earnings per share of common stock
are non-GAAP financial measures. Operating Earnings and Operating Earnings per share of common stock presented exclude, as applicable: (i) certain realized and unrealized gains and losses recognized through earnings; (ii) non-cash
equity compensation; (iii) one-time events pursuant to
changes in GAAP; and (iv) certain other non-cash charges. Please see pages 17 and 18 for a reconciliation of Operating Earnings and Operating Earnings per share of common stock to GAAP net income allocable to common stockholders and GAAP net
income allocable to common stockholders per share of common
stock. Operating Earnings represents the earnings, as adjusted, allocable to common stock.
(2) Effective net interest spread and effective levered asset yield are
non-GAAP financial measures, which include the cost of the Company’s Swaps as a component of its interest expense. Please see page 8.
(3) The “Seller Financing Program” refers to the
initiative whereby the Company provides funding through a warehouse line to a third-party to finance the acquisition and improvement of single-family homes. Once the homes are improved, they are marketed for sale, with the seller
providing financing to the buyer in the form of a mortgage loan or
a BFT Contract. The mortgage loans and BFT Contracts may be purchased by the Company or by an unrelated third party from the counterparty, at which time the associated balance on the warehouse line is repaid.
|
 5
APOLLO RESIDENTIAL MORTGAGE, INC. (“AMTG”)
Financial Summary
($ amounts in thousands except per share data)
December 31,
2014
September 30,
2014
December 31,
2013
December 31,
2014
December 31,
2013
Interest Income
$39,314
$38,542
$40,721
$154,177
$154,713
Interest Expense
(7,900)
(7,708)
(7,359)
(30,386)
(27,602)
Net Interest Income
$31,414
$30,834
$33,362
$123,791
$127,111
Operating Earnings
(1)
$16,858
$16,372
$19,540
$66,854
$68,915
Weighted
Average
Shares
of
Common
Stock
Outstanding
-
Basic
32,040
32,035
32,007
32,028
30,444
Operating Earnings per Share of Common Stock
(1)
$0.53
$0.51
$0.61
$2.09
$2.26
Leverage Multiple (Debt / Equity)
4.4x
3.9x
4.1x
4.4x
4.1x
Annualized Return on Average Assets
(2)
2.2%
2.2%
2.6%
2.2%
2.0%
Annualized Return on Average Equity
(3)
10.2%
9.9%
11.9%
10.2%
10.5%
Three Months Ended
Twelve Months Ended
(1)
Operating Earnings and Operating Earnings per share of common stock are
non-GAAP financial measures. Operating Earnings and Operating Earnings per share of common stock presented exclude, as applicable: (i) certain realized and
unrealized gains and losses recognized through earnings; (ii)
non-cash equity compensation; (iii) one-time events pursuant to changes in GAAP; and (iv) certain other non-cash charges. Please see pages 17 and 18 for a reconciliation of
Operating Earnings and Operating Earnings per share of common stock to
GAAP net income allocable to common stockholders and GAAP net income allocable to common stockholders per share of common stock. Operating Earnings
represents the earnings, as adjusted, allocable to common stock.
(2)
Annualized Return on Average Assets is calculated as annualized
Operating Earning plus preferred dividend requirement for the period, as a percentage of average interest earning assets, excluding cash.
(3)
Annualized Return on Average Equity is calculated as annualized
Operating Earnings plus preferred dividend requirement for the period, as a percentage of average equity over the period.
|
 6
APOLLO RESIDENTIAL MORTGAGE, INC. (“AMTG”)
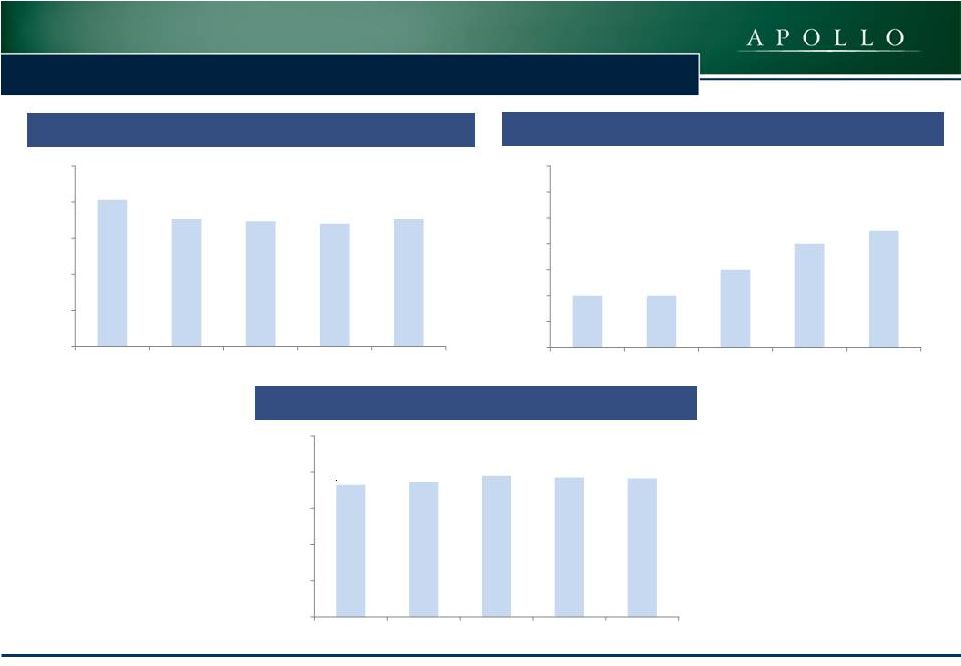
Financial Summary
Operating
Earnings
per
Share
of
Common
Stock
(1)
Book Value per Share of Common Stock
Dividends per Share of Common Stock
$0.61
$0.53
$0.52
$0.51
$0.53
$0.00
$0.15
$0.30
$0.45
$0.60
$0.75
Q4 2013
Q1 2014
Q2 2014
Q3 2014
Q4 2014
$18.26
$18.64
$19.49
$19.27
$19.12
$0.00
$5.00
$10.00
$15.00
$20.00
$25.00
Q4 2013
Q1 2014
Q2 2014
Q3 2014
Q4 2014
$0.40
$0.40
$0.42
$0.44
$0.45
$0.36
$0.38
$0.40
$0.42
$0.44
$0.46
$0.48
$0.50
Q4 2013
Q1 2014
Q2 2014
Q3 2014
Q4 2014
(1)
Operating Earnings and Operating Earnings per share of common stock are
non-GAAP financial measures. Operating Earnings and Operating Earnings per share of common stock presented exclude, as applicable: (i) certain realized and unrealized gains and losses
recognized through earnings; (ii) non-cash equity compensation;
(iii) one-time events pursuant to changes in GAAP; and (iv) certain other non-cash charges. Please see pages 17 and 18 for a reconciliation of Operating Earnings and Operating Earnings per share of common
stock to GAAP net income allocable to common stockholders and GAAP net
income allocable to common stockholders per share of common stock. Operating Earnings represents the earnings, as adjusted, allocable to common stock. |
 7
APOLLO RESIDENTIAL MORTGAGE, INC. (“AMTG”)
Book Value Roll-Forward
(1)
TBA Contract refers to a to-be-announced contract to purchase or
sell certain Agency RMBS on a forward basis. Book Value
- September 30, 2014
19.27
$
Common stock dividend declared
(0.45)
Operating Earnings, net of preferred dividend
0.53
Non-Operating Items Impacting Net Income:
Changes in unrealized gain/(loss) on Agency RMBS, net
0.70
Changes in unrealized gain/(loss) on non-Agency RMBS, net
(0.51)
Changes in unrealized gain/(loss) on securitized mortgage loans,
net (0.02)
Changes in unrealized gain/(loss) on derivatives, net
(0.58)
Realized
gain
on
TBA
Contract
(1)
termination, net
0.02
Realized gain on sales of non-Agency RMBS, net
0.23
Realized loss on expirations of Swaptions
(0.06)
Other, net
(0.01)
Book Value -
December 31, 2014
19.12
$ |
 8
APOLLO RESIDENTIAL MORTGAGE, INC. (“AMTG”)
Portfolio Summary and Net Interest Spread
(1)
Percentages
reflect
amount
of
equity
allocated
to
Agency
RMBS,
non-Agency
RMBS
and
other
credit
investments
and
securitized
mortgage
loans,
net
of
associated
assets
and
liabilities,
including
the
fair
value
of
interest
rate
derivatives.
Cash
and
other
net,
represents
cash
and
other
assets
and
liabilities
not
specifically
allocable
to
Agency
RMBS,
non-Agency
RMBS
and
other
credit
investments
or
securitized
mortgage
loans.
(2)
Effective net interest spread and effective levered asset yield are
non-GAAP financial measures, which include the cost of the Company’s Swaps as a component of its interest expense, as presented.
(3)
Debt/Equity multiples for each asset class are adjusted to reflect cash
held to meet margin calls and certain other assets and liabilities specifically allocable to Agency RMBS, non-Agency RMBS and other credit investments or securitized mortgage loans.
(4)
Reflects legal title to real estate subject to BFT Contracts at December
31, 2014, which had an aggregate principal balance of $9,655 with a weighted average interest rate of 8.9%.
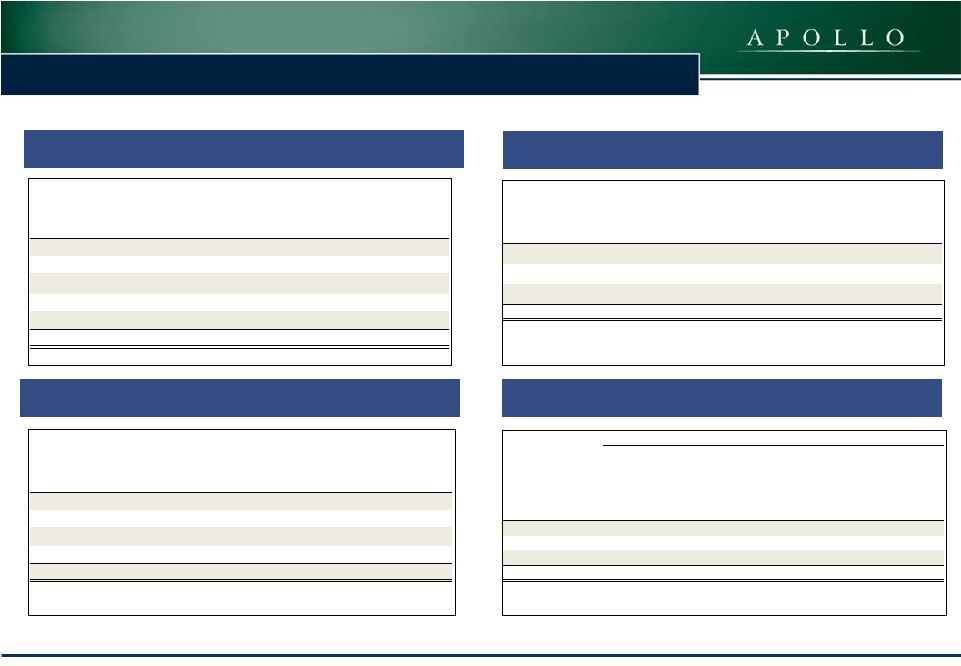
Other Investments at December 31, 2014
Agency
RMBS
Non-Agency
RMBS and
Other
Credit
Investments
Securitized
Mortgage
Loans
Weighted
Average
Asset Yield
2.9%
5.7%
8.0%
4.1%
Interest Expense
(0.3%)
(1.9%)
(3.1%)
(0.9%)
Cost of Swaps
(0.9%)
-
(1.6%)
(0.6%)
Effective Net Interest Spread
1.7%
3.8%
3.3%
2.6%
Debt / Equity
(3)
9.5x
2.7x
1.8x
4.4x
18.6%
16.1%
13.9%
15.3%
Securitized
Mortgage Loans
5%
Agency RMBS
29%
Cash and Other,
net
11%
Non-Agency
RMBS and
Other Credit
Investments
55%
($ in thousands)
Amortized Cost
Warehouse line receivable
28,639
$
Legal
title to real estate subject to BFT Contracts (4)
9,616
Mortgage loans purchased through Seller Financing Program
2,306
Total Other Investments
40,561
$
Allocation of Portfolio Equity
at December 31, 2014 (1)
Effective Levered Asset Yield
(2)
Effective Net Interest Spread at December 31, 2014
(2)
|
 APOLLO RESIDENTIAL MORTGAGE, INC. (“AMTG”)
9
Agency RMBS Portfolio at December 31, 2014
(1)
Other includes Agency interest only securities (“Agency IO”),
Agency inverse IO securities (“Agency Inverse IO”) and Agency Inverse Floaters.
3.7%
5.2%
5.8%
7.0%
7.1%
6.7%
4.9%
4.9%
6.7%
8.0%
6.8%
0.0%
1.0%
2.0%
3.0%
4.0%
5.0%
6.0%
7.0%
8.0%
9.0%
Q2
2012
Q3
2012
Q4
2012
Q1
2013
Q2
2013
Q3
2013
Q4
2013
Q1
2014
Q2
2014
Q3
2014
Q4
2014
Total Agency Portfolio average one month CPR
Agency Portfolio Overview
Constant Prepayment Rates (“CPR”)
($ in thousands)
Estimated Fair
Value
Q4 2014 CPR
Agency Pass-Throughs
2,243,946
$
6.7
%
Agency Inverse Floaters, Agency IO and Agency Inverse IO
43,577
12.5
Total
2,287,523
$
6.8
%
Short Reset ARMs
5%
Loan Balance 30
Year Pass-Throughs
60%
New Production 30
-
Year Pass
-Throughs
1%
Low Credit 30
-Year
Pass-Throughs
15%
Other(1)
2%
HARP / MHA /
Pass-Throughs
17%
High LTV 30 Year |
 10
APOLLO RESIDENTIAL MORTGAGE, INC. (“AMTG”)
Agency RMBS Portfolio at December 31, 2014
Agency RMBS Portfolio Composition Summary
($ in thousands)
Principal Balance
Unamortized
Premium
Amortized Cost
(1)
Estimated Fair
Value
Weighted
Average
Coupon
Estimated
Weighted
Average
Yield
(2)
Agency pass-through RMBS
30-Year Mortgages
ARM-RMBS
98,079
$
7,196
$
105,275
$
105,122
$
2.36
%
1.14
%
3.5% coupon
495,214
20,245
515,459
515,628
3.50
%
2.87
%
4.0% coupon
1,173,972
82,353
1,256,325
1,256,724
4.00
%
2.86
%
4.5% coupon
336,353
25,863
362,216
366,472
4.50
%
2.83
%
2,103,618
135,657
2,239,275
2,243,946
3.89
%
2.78
%
Agency Inverse Floaters
(3)
1,359
3,590
4,949
5,094
81.76
%
11.82
%
Agency IO
(4)
-
-
11,948
11,941
2.24
%
7.24
%
Agency Inverse IO
(4)
-
-
26,489
26,542
6.30
%
8.69
%
Total Agency RMBS
2,104,977
$
139,247
$
2,282,661
$
2,287,523
$
3.93
%
2.87
%
(1)
Amortized cost is reduced by unrealized losses that are classified as
other-than-temporary impairments. (2)
Estimated
weighted
average
yield
at
the
date
presented
incorporates
prepayment
assumptions
and
forward
interest
rate
assumptions
on
Agency
RMBS.
(3)
Agency inverse floaters are comprised of securities that have a floating
interest rate with coupons that reset periodically based on an index and which coupon varies inversely with changes in the index, which index is typically one-month London Interbank
Offer Rate, or LIBOR.
(4)
Agency
IO
and
Agency
Inverse
IO
are
interest
only
and
inverseIO
securities,
respectively,
that
receive
some
or
all
of
the
interest
payments,
but
no
principal
payments,
made
on
a
related
series
of
Agency
RMBS,
based
on
a
notional
principal
balance.
The
notional
principal
balance
is
used
solely
to determine interest distributions on interest-only classes of
securities. At December 31, 2014, the Company’s Agency IOs had a notional balance of $133,924 and the Company’s Agency Inverse IOs had a
notional balance of $138,293. |
 11
APOLLO RESIDENTIAL MORTGAGE, INC. (“AMTG”)
Non-Agency RMBS Portfolio Overview
(1)
Non-Agency RMBS Portfolio at December 31, 2014
Non-Agency RMBS Portfolio Vintage
(1)
Non-Agency RMBS Cash-Flow Profile
(1)
(1)
Includes $23,833 of small balance commercial mortgage backed
securities. 1998-2002
4%
2003
7%
2004
27%
2005
28%
2006
17%
2007
7%
2013
1%
2014
9%
Subprime
75%
Prime
1%
Pay
-
Option
ARM
11%
Small-Balance
Commercial
1%
Alt-A
12%
Current-Pay
64%
Locked-Out
36% |
 12
APOLLO RESIDENTIAL MORTGAGE, INC. (“AMTG”)
Non-Agency RMBS Portfolio at December 31, 2014
(1)
Credit
enhancement
is
expressed
as
a
percentage
of
all
outstanding
mortgage
loan
collateral.
The
Company's
non-Agency
RMBS
may
incur
losses
if
credit
enhancement
is
reduced
to
zero.
(2) CRR represents conditional repayment rate. Information
is based on loans for individual groups owned by the Company. Amounts presented reflect the weighted average monthly performance for the three months ended December 31, 2014.
December 31, 2014
Portfolio Characteristics
Estimated Fair Value ($ in thousands)
$1,468,109
Amortized Cost to Par Value
82.8%
Net Weighted Average Security Coupon
1.5%
Collateral Attributes
Weighted Average Loan Age (months)
117
Weighted Average Original Loan-to-Value
81.7%
Weighted Average Original FICO Credit Score
624
Current Performance
60+ Day Delinquencies
31.7%
Average Credit Enhancement
(1)
33.1%
3 Month CRR
(2)
4.5% |
 13
APOLLO RESIDENTIAL MORTGAGE, INC. (“AMTG”)
Financing and Derivative Instruments Overview
(1)
Includes $33,153 of repurchase borrowings collateralized by
non-Agency RMBS of $47,786 that were eliminated from the Company’s consolidated balance sheet in consolidation with the variable interest entity associated with our securitization transaction.
(2)
Reflects TBA Contracts for which the Company is required to buy certain
Agency RMBS on a forward basis. The Company’s one Long TBA Contract settled on January 14, 2015, resulting in a realized gain of approximately $1.5 million.
Borrowings at December 31, 2014
Derivative Instruments at December 31, 2014
Swaps Overview at December 31, 2014
Swaptions Overview at December 31, 2014
($ in thousands)
Balance
Weighted
Average
Borrowing Rate
Weighted
Average
Remaining
Maturity (days)
Securities Financed:
Agency RMBS
2,205,082
$
0.34%
16
Non-Agency RMBS
(1)
1,159,698
1.95%
160
Other investment securities
28,805
1.74%
13
Mortgage loans
8,742
2.79%
120
Total Borrowings
3,402,327
$
0.91%
65
($ in
thousands)
Notional
Amount
Estimated Fair
Value
Swaps -
assets
957,000
$
9,543
$
Swaptions -
assets
1,250,000
1,555
Swaps -
(liabilities)
730,000
(8,949)
Long TBA Contracts -
assets
(2)
100,000
544
Total Derivative Instruments
3,037,000
$
2,693
$
($ in thousands)
Term to Maturity
Notional
Amount
Average
Fixed Pay
Rate
Average
Maturity
(Years)
More than one year up to and including three years
920,000
$
1.07%
2.4
More than three years up to and including five years
189,000
1.02%
3.2
Greater than 5 years
578,000
2.13%
7.9
Total
1,687,000
$
1.43%
4.4
($ in thousands)
Weighted
Average
Weighted
Months Until
Average
Fixed Pay Rate for
Option
Notional
Swap Terms
Fixed-Pay
Underlying Swap
Fair Value
Expiration
Amount
(Years)
Rate
2.50 -
3.00%
139
$
5
160,000
$
5.0
2.77%
3.00 -
3.50%
1,347
10
265,000
10.0
3.31%
3.50 -
4.00%
69
3
825,000
10.0
3.75%
1,555
$
5
1,250,000
$
9.4
3.53%
Option
Underlying Swap |
 14
APOLLO RESIDENTIAL MORTGAGE, INC. (“AMTG”)
Financials |
  15
APOLLO RESIDENTIAL MORTGAGE, INC. (“AMTG”)
Balance Sheet
(in thousands—except share and per share data)
December 31, 2014
December 31, 2013
Assets:
Cash and cash equivalents
114,443
$
127,959
$
Restricted cash
69,006
67,458
RMBS, at fair
value ($3,583,853 and $3,317,060 pledged as collateral, respectively)
3,755,632
3,503,326
Securitized mortgage loans (transferred
to a consolidated VIE), at fair value 104,438
110,984
Other investment
securities, at fair value ($34,228 and $11,515 pledged as collateral, respectively)
34,228
11,515
Other
investments 40,561
-
Mortgage loans, at fair value ($13,602 and $0 pledged as collateral,
respectively) 14,120
-
Investment related receivable ($168,705 and $21,959 pledged as
collateral, respectively) 191,455
24,887
Interest
receivable 10,455
10,396
Deferred
financing costs, net 652
882
Derivative instruments, at fair value
11,642
53,315
Other
assets 1,421
854
Total Assets
4,348,053
$
3,911,576
$
Liabilities and Stockholders' Equity
Liabilities:
Borrowings under repurchase agreements
3,402,327
$
3,034,058
$
Non-recourse securitized debt, at fair
value 34,176
43,354
Investment
related payable 76,105
-
Obligation to return cash held as collateral
2,546
38,654
Accrued
interest payable 13,026
8,708
Derivative instruments, at fair value
8,949
4,610
Payable to related party
4,968
5,444
Dividends payable
18,305
16,812
Accounts
payable, accrued expenses and other liabilities 1,699
2,335
Total Liabilities
3,562,101
$
3,153,975
$
Stockholders' Equity:
Preferred stock, $0.01 par value, 50,000,000 shares authorized,
6,900,000 shares issued and outstanding ($172,500 aggregate
liquidation preference) 69
$
69
$
Common stock, $0.01 par value, 450,000,000 shares authorized,
32,088,045 and 32,038,970 shares issued and
outstanding, respectively
321
320
Additional paid-in-capital
793,274
792,010
Accumulated deficit
(7,712)
(34,798)
Total Stockholders'
Equity 785,952
$
757,601
$
Total Liabilities and
Stockholders' Equity 4,348,053
$
3,911,576
$
|
 16
APOLLO RESIDENTIAL MORTGAGE, INC. (“AMTG”)
Income Statement
(in thousands—except per share data)
2014
2013
2014
2013
Interest Income:
RMBS
36,436
$
38,304
$
144,529
$
146,263
$
Securitized mortgage loans
1,856
2,313
7,900
8,267
Other
1,022
104
1,748
183
Total Interest Income
39,314
40,721
154,177
154,713
Interest Expense:
Repurchase agreements
(7,532)
(6,873)
(28,746)
(25,808)
Securitized debt
(368)
(486)
(1,640)
(1,794)
Total Interest Expense
(7,900)
(7,359)
(30,386)
(27,602)
Net Interest Income
31,414
$
33,362
$
123,791
$
127,111
$
Other Income/(Loss):
Realized gain/(loss) on sale of RMBS, net
7,480
$
(18,541)
$
(8,821)
$
(66,850)
$
Unrealized gain/(loss) on RMBS, net
6,024
(7,648)
91,290
(147,375)
Unrealized gain/(loss) on securitized debt
163
(541)
(124)
(954)
Unrealized gain/(loss) on securitized mortgage loans
(763)
4,038
1,683
3,950
Unrealized (loss) on mortgage loans
(9)
-
(9)
-
Unrealized gain/(loss) on other investment securities
(280)
219
(205)
335
Gain/(loss) on derivative instruments, net (includes ($18,628),
($174), ($39,379) and $50,373 of unrealized gains/(losses),
respectively)
(25,005)
3,692
(88,527)
59,576
Other, net
74
4
82
76
Other Income/(Loss), net
(12,316)
$
(18,777)
$
(4,631)
$
(151,242)
$
Operating Expenses:
General and administrative (includes ($254), ($295), ($1,265) and
($1,047) of non-cash stock based compensation,
respectively) (2,964)
$
(3,127)
$
(11,905)
$
(11,501)
$
Management
fee
-
related
party
(2,840)
(2,928)
(11,200)
(11,579)
Total Operating Expenses
(5,804)
$
(6,055)
$
(23,105)
$
(23,080)
$
Net Income/(Loss)
13,294
$
8,530
$
96,055
$
(47,211)
$
Preferred Stock Dividends Declared
(3,450)
(3,450)
(13,800)
(13,800)
Net Income/(Loss) Allocable to Common Stock and
Participating Securities
9,844
$
5,080
$
82,255
$
(61,011)
$
Earnings/(Loss)
per
Share
of
Common
Stock
-
Basic
and
Diluted
0.30
$
0.16
$
2.55
$
(2.02)
$
Dividends Declared per Share of Common
Stock 0.45
$
0.40
$
1.71
$
2.20
$
Three Months Ended
December 31,
Twelve Months Ended
December 31, |
 17
APOLLO RESIDENTIAL MORTGAGE, INC. (“AMTG”)
Reconciliation
of
Operating
Earnings
(1)
(1)
Operating Earnings and Operating Earnings per share of common stock are
non-GAAP financial measures. Operating Earnings and Operating Earnings per hare of common stock presented exclude, as applicable: (i) certain realized and unrealized gains and losses recognized through earnings; (ii) non-cash
equity compensation; (iii) one-time events pursuant to changes in
GAAP; and (iv) certain other non-cash charges. Operating Earnings represents the earnings, as adjusted, allocable to common stock.
(2)
Reflects per share amount for each component presented.
(in thousands—except share and per share data)
December 31, 2014
Per Share
Amount
(2)
December 31, 2013
Per Share
Amount
(2)
Operating Earnings:
Net income allocable to common stockholders
9,689
$
0.30
$
5,027
$
0.16
$
Adjustments:
Realized (gain)/loss on sale of RMBS, net
(7,480)
(0.23)
18,541
0.58
Unrealized (gain)/loss on RMBS, net
(6,024)
(0.19)
7,648
0.24
Unrealized loss on derivative instruments, net
18,627
0.58
174
-
Realized (gain)/loss on Swap and Swaption terminations, net
1,885
0.06
(8,429)
(0.26)
Realized (gain) on TBA Contracts
(622)
(0.02)
-
-
Tax amortization of (loss) on Swaption terminations and
expirations, net
(360)
(0.01)
-
-
Other unrealized (gain)/loss, net
889
0.03
(3,716)
(0.12)
Non-cash stock-based compensation expense
254
0.01
295
0.01
Total adjustments to arrive at operating earnings:
7,169
0.23
14,513
0.45
Operating Earnings
16,858
$
0.53
$
19,540
$
0.61
$
Weighted average shares of common stock
32,040
32,007
Three Months Ended
Three Months Ended |
 18
APOLLO RESIDENTIAL MORTGAGE, INC. (“AMTG”)
(1)
(2)
Reconciliation
of
Operating
Earnings
(1)
(in thousands—except share and per share data)
December 31, 2014
Per Share
Amount
(2)
December 31, 2013
Per Share
Amount
(2)
Operating Earnings:
Net income/(loss) allocable to common stockholders
81,690
$
2.55
$
(61,416)
$
(2.02)
$
Adjustments:
Realized loss on sale of RMBS, net
8,821
0.28
66,850
2.20
Unrealized (gain)/loss on RMBS, net
(91,290)
(2.85)
147,375
4.84
Unrealized (gain)/loss on derivative instruments, net
39,379
1.23
(50,373)
(1.65)
Realized (gain)/loss on Swap and Swaption terminations, net
22,502
0.70
(30,956)
(1.02)
Realized (gain)/loss on TBA Contracts
6,534
0.20
(281)
(0.01)
Tax amortization of (loss) on Swaption terminations and
expirations, net
(702)
(0.02)
-
-
Other unrealized (gain), net
(1,345)
(0.04)
(3,331)
(0.11)
Non-cash stock-based compensation expense
1,265
0.04
1,047
0.03
Total adjustments to arrive at operating earnings:
(14,836)
(0.46)
130,331
4.28
Operating Earnings
66,854
$
2.09
$
68,915
$
2.26
$
Weighted average shares of common stock
32,028
30,444
Twelve Months Ended
Twelve Months Ended
Operating Earnings and Operating Earnings per common share are
non-GAAP financial measures. Operating Earnings and Operating Earnings per common share presented exclude, as applicable: (i) certain realized and unrealized gains and losses recognized
through earnings; (ii) non-cash equity
compensation; (iii) one time events pursuant to changes in GAAP; and (iv) certain other non-cash charges. Operating Earnings represents the earnings, as adjusted, allocable to common stock.
Reflects per share amount for each component presented.
|
 19
APOLLO RESIDENTIAL MORTGAGE, INC. (“AMTG”)
Contact Information
Hilary Ginsberg
Investor Relations Manager
212-822-0767 |