Attached files
| file | filename |
|---|---|
| 8-K - 8-K - SOLARCITY CORP | scty-8k_20150218.htm |
Exhibit 99.1

SolarCity Fourth Quarter 2014 Shareholder Letter
Residential MW Deployed Up 110% Y/Y
Total MW Deployed of 176 and 206 MW Booked in Q4
Nominal Contracted Payments Remaining Up 149% Y/Y to $5.0 Billion
Retained Value of $2.4 Billion
Cost per Watt Decreased by (9%) Y/Y
February 18, 2015
Dear Fellow Shareholders:
On December 31, we concluded the best quarter and year in our history. We created more long-term value for shareholders in 2014 than we had in all prior years combined and we are on pace to set new records this year. Further, we extended our lead as the No. 1 solar service provider in the nation in terms of customers, and we continue to ramp our sales, operational, and finance capacity towards our goal to outpace the industry once again and deploy as much as 1 GW of solar installations in 2015 and ultimately reach one million customers by mid-2018.
As of the end of 2014, we had 190k customers, $2.8 billion of solar energy systems assets capitalized on our balance sheet, and Estimated Nominal Contracted Payments Remaining of $5.0 billion. Our forecast of Retained Value for our PPAs/leases was up to $2.4 billion (and MyPower would have added an additional estimated $166 million in unlevered Retained Value).
After eight years of investment, execution, and growth, we have built a formidable base of distributed solar energy systems across the country. Since installing our first rooftop solar system in 2006, we have deployed 1.1 GW of solar—one of the original goalposts for the company and a significant milestone for us and the industry as a whole. In aggregate, our portfolio of solar energy systems exited 2014 producing clean energy at a run rate of approximately 1,500,000 Megawatt-hours [MWh] per year, and we plan to double that in 2015. With end-market demand healthy and growing, our installation capacity steadily ramping, and a majority of our financing needs secured for the year, we remain confident in achieving our guidance to deploy 920 – 1,000 MW in 2015.

Solid Q4 Growth Tops Off Record 2014
|
· |
MW Booked: 206 MW; an increase of 103% Y/Y |
|
· |
MW Deployed: 176 MW total (up 70% Y/Y) |
|
o |
Residential: 147 MW (Up 110% Y/Y) |
|
o |
Commercial impacted Q4 |
|
· |
New Customers: 21,318 |
|
· |
Average Cost: $2.86 per watt down (9%) Y/Y with installation costs of $2.09 per watt |
Sales and installation growth continued to power our development engine forward. Demand grew 103% year over year with 206 MW Booked in the fourth quarter, more than doubling year-over-year for the fourth consecutive period. We booked a net total of 790 MW for the year. Q4 and Q1 tend to have lower MW Booked as a percentage of the year largely because of seasonality, as the holiday season and bad weather led to fewer selling days in the quarter. Over the past 30 days, we have booked more MW than ever before and we could be on pace for one of the best bookings quarters in our history—a great start to 2015.
We added 21,318 new customers in the fourth quarter and 96,659 in all of 2014. MW Booked per new customer in the quarter was higher than we typically report because of a higher mix of commercial as well as new SolarStrong contracts for multi-unit military housing that required larger system sizes. Energy contracts (which exclude system sales) rose by 21,406 in the fourth quarter, and our Estimated Nominal Contracted Payments Remaining—an approximation of the revenue these new contracts are expected to generate—increased by a net $837 million since the end of the third quarter of 2014. We view the increase in Estimated Nominal Contracted Payments Remaining as a better measure of our new sales activity than reported revenue, which is recognized as customer payments are received over the 20-30 year lives of our lease, PPA, and loan contracts.
MyPower, our new solar loan product, is off to a fantastic start since its October launch. Confirming our belief that it is the best solar loan product in the U.S., MyPower accounted for nearly 30% of our residential bookings in the fourth quarter and in the months following its launch made us one of the nation’s leading solar loan providers. In light of this early success, we have raised the loan’s interest rates for new customers in most of California from 4.5-5.0% to 5.0-5.5%.
|
Our operational throughput scaled to new heights with 176 MW Deployed in the fourth quarter of 2014, a solid result but lower than what we had originally expected. Up 70% year-over-year, we deployed more solar systems last quarter than we did for all of 2012. Deployments not only grew but broadened geographically. California remained our largest market, and the new growth states of Connecticut, Maryland, Massachusetts, Nevada and New York accounted for more than 30% of new deployments for the first time last quarter. For the year, we deployed a total of 502 MW, or more solar than the entire U.S. installed in 2009—including utility-scale. |
|

We initially had been on pace to deploy ~192 MW in the fourth quarter, but a few large commercial projects in our pipeline were not completed by year-end as expected due to engineering, contract and/or business decisions. For the quarter, commercial MW Deployed declined (15%) year-over-year to 28 MW and initially had been forecast at ~44 MW. One 3 MW commercial project slipped beyond our anticipated deployment date as a result of weather and the holidays, and was installed in early January 2015. Another 11 MW of commercial projects were delayed and are now expected to be completed in the first half of the year. Roughly 2 MW were cancelled as the economics proved less favorable following design and engineering specifications. We are selective on our commercial projects and will avoid projects that pose undue risk and economic terms that are unfavorable to our business model. This combined with some forecast challenges accounted for the commercial shortfall. We are not happy with missing our forecast but we made the right long term business decisions to ensure we only enter into long-term contracts that are attractive for our shareholders. Going forward we will only include in our quarterly forecast jobs that have commenced construction and are fully expected to be completed in the quarter. Despite the difficulty we experienced in forecasting commercial systems deployments in Q4, our technology differentiation in our ZS Peak and DemandLogic products are driving great bookings momentum and we expect good growth in commercial in 2015.
On the other spectrum, residential deployments in the fourth quarter continued to grow at a rapid and consistent pace, up 110% year-over-year to 147 MW. This is a phenomenal achievement and our operations team deserves a great deal of credit. According to GTM Research data, we accounted for 39% of total U.S. residential solar installations—more than the next 70 installers combined—in the most recent data available for Q3 2014. Most importantly, we have driven this record throughput without sacrificing quality—we experienced an all-time low in safety incidents, while we continue to achieve top ratings in our customer satisfactions scores.
Greater economies of scale and increased operational efficiencies drove our costs to new lows in the fourth quarter. Total cost declined (9%) year-over year and (1%) vs. the third quarter to $2.86 per watt excluding the impact of amortization of intangibles. Including amortization of intangibles, cost per watt was $2.87 per watt in the fourth quarter versus $2.90 per watt in the third quarter; we plan on excluding amortization of intangibles from our cost per watt calculation going forward. Installation cost declined (16%) year-over-year and (4%) vs. the third quarter to $2.09 per watt even as module prices essentially held steady. Sales costs increased to $0.57 per watt due to a planned uptick in investment to expand our sales headcount and infrastructure ahead of our 2015 ramp as well as seasonal softness in bookings. Large increases in
|
sales investment often do not yield payoff in the same quarter and may temporarily lead to higher costs per unit in the period incurred. G&A costs declined (19%) year-over-year and (8%) vs. Q3 2014 to $0.19 per watt. We are confident in achieving our total cost goal of $2.50 per watt by 2017 and this continues to be one of our primary areas of focus. At this cost level, we expect to continue to deliver distributed solar energy to a broad section of the country while still generating attractive returns after the current scheduled reduction in the ITC in 2017. Reconciliation of our cost per watt to our GAAP financial statements is available on the investor relations section of our website (at investors.solarcity.com). |
|

With 25 new openings last year, we ended the year with 65 operations centers across the country. More than 20 of our operations centers are installing at a run rate of over 1 MW per month. We plan to both expand our operations centers by over 50% this year and raise utilization across our entire portfolio in our ramp to achieve our 2015 guidance of 920 - 1,000 MW Deployed, while continuing to lower our cost per watt.
Not only have we built the largest and broadest platform to install residential solar across the country, but we have been widening the gap quickly. Though our continued growth may have made it look simple, it has taken hundreds of thousands of labor hours, superb execution, a relentless focus on the customer, and tremendous pools of capital to get us where we are today. Installing a few hundred systems per month is a challenge in its own right, but handling ten thousand per month requires a world-class organization. It means thousands upon thousands of installers and trucks, a network of operations centers, incredible logistics management, and billions of dollars of capital. After eight years of investment into our platform, we have a uniquely differentiated product in the market that provides exceptional value for the homeowner. Doubling in 2015 will not be easy, but we have built a strong operational foundation upon which we entered the year and expect to continue our progress to achieve our goals.
Technology and Manufacturing Development
We are now within roughly two years of having integrated manufacturing capacity of 1 GW of high efficiency modules with what we expect to be the best cost/efficiency ratio in the world. Construction of our inaugural giga-scale facility is underway—the piles are almost complete, the foundation has been poured and erection of the steel structure is expected to begin over the next few weeks. More than 20” of snowfall in Buffalo in January has certainly slowed progress, but the area’s renowned winter weather has been incorporated into our construction schedule. We remain on target to begin installing some equipment in early 2016 and reaching full annualized capacity of 1 GW in early 2017.

2014 was also a great year for technology advancements in balance of system hardware, cell development, grid control systems, and software applications. Below are some highlights:
|
· |
Balance of system hardware: |
|
o |
Released ZS Peak, a commercial mounting hardware system that provides greater power density and is significantly easier to install (http://zepsolar.com/index.php/products/zs-peak) |
|
o |
Developed several improvements to our patented rail-less residential mounting hardware that further enhanced aesthetics and ease of installation |
|
· |
Solar cell development: |
|
o |
Completed the transition from a 5 inch to a 6 inch high-efficiency cell in our Hangzhou manufacturing facility – a critical milestone in realizing low cost production |
|
o |
Further improved cell efficiency, which will be applied to our production modules coming out of Buffalo |
|
· |
Grid-control systems: |
|
o |
Demand Logic battery control system moved from beta to full production. Learn more at http://www.solarcity.com/commercial/demandlogic |
|
o |
Addressed the primary operational concern of high penetration of rooftop solar. Learn more at http://www.solarcity.com/newsroom/press/solarcity-nrel-and-hawaiian-electric-complete-inverter-study |
|
o |
Enhanced our advanced metering infrastructure platform to include real-time data collection as well as real-time solar savings estimates |
|
o |
PowerGuide home energy usage monitoring now included with all qualified residential customers |
|
· |
Software applications: |
|
o |
Completed major enhancements to our financing software systems to launch our in-house financing platform with Solar Bonds, as well as the billing and management of consumer loans with MyPower. We now have a platform to build on that will give us the ability to further vertically integrate. |
|
o |
Released the next version of our customer app, MySolarCity, which both enhances the customer experience and lowers our customer care and acquisition costs. |
|
§ |
Added the ability for customers to self-schedule their site visits and our time-of-arrival feature takes the guess work out of arrival windows and makes it even simpler to switch to SolarCity |
|
§ |
See more on MySolarCity at http://www.solarcity.com/residential/mysolarcity |
Over the past year we have also built out a strong competency in technology for the electrical distribution system. Our view has always been that rooftop solar, especially when bundled with smart inverters and storage, is a substantial benefit to grid operations, and we are engaged in several pilots with utilities and other organizations to precisely quantify these benefits. As a result of this work we are starting to see many utilities transition their thinking about distributed generation solar from being a problem that they are forced to deal with into a solution that they can utilize to enhance their services. Many complicated issues remain before utilities may fully embrace distributed energy resources and we recently published a blog post that provided an overview of the problem and presented a possible solution (http://blog.solarcity.com/a-possible-solution-to-the-revenue-shift).
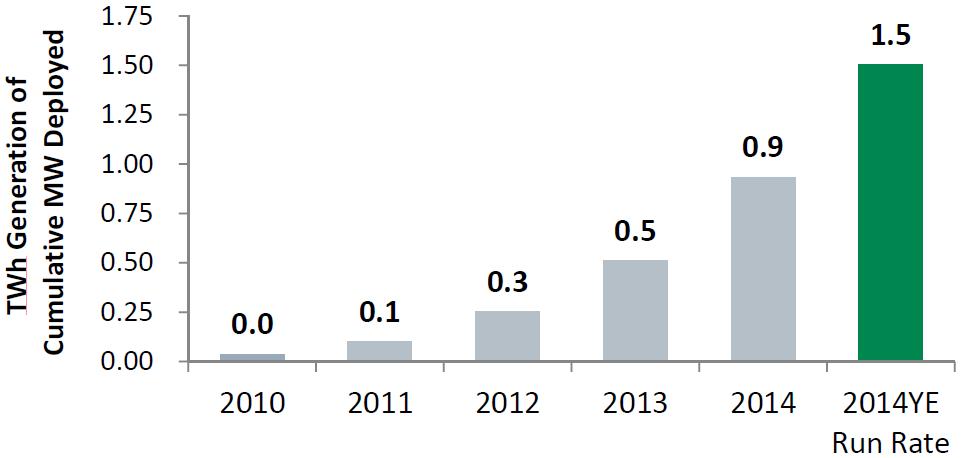
Energy Production Approaching 1 Terawatt-Hour in 2014 Drives Long-Term Value
|
· |
Cumulative MW Deployed: 1,069 MW at the end of 2014 |
|
· |
Cumulative Customers: 189,657 |
|
· |
Estimated Nominal Contracted Payments Remaining: $4,951 million |
|
· |
Retained Value Forecast: $2,423 million |
We entered 2015 as the largest solar service provider in the country by a wide margin with close to 190,000 customers. Unlike most traditional utilities in the country, we are growing our power-producing base of customers at a healthy pace every year and the solar systems we have deployed have begun to produce a significant amount of energy. In 2011, the total energy production of the solar systems we had deployed was ~100,000 MWh. Three years later, our deployed solar systems produced ten times that amount of energy at over 930,000 MWh in 2014, or close to one terawatt-hour [TWh].
At our one million customer goal by mid-2018, we would have cumulatively deployed enough systems to produce in aggregate more than 8,000,000 MWh of clean, distributed solar energy per year (assuming our current median of ~1,400 kWh/kW). This would be sufficient to displace a few mid-sized coal plants burning in total more than 4.3 million tons of coal per year. That’s the equivalent of 12.4 million tons of CO2 saved every year accomplished with private investment that is not socialized across the utility ratepayer base, while lowering our customers’ energy costs and creating long-term value for our shareholders.
Our Estimated Nominal Contracted Payments Remaining represents the sum of cash payments expected over the contracted lifetime of our lease, PPA, and loan customers. These payments are akin to a customer’s utility bill contracted for multiple decades. As of the end of the year, we had $5.0 billion of Estimated Nominal Contracted Payments that provide visibility into our revenue over the next 20-30 years. Relative to our cumulative Energy Contracts signed of 177,455, our blended average lifetime value remaining under contract exceeds $27,900 per customer.
If Nominal Contracted Payments Remaining approximates the aggregate revenue we have under contract over the next 20 years (for leases and PPAs) and 30 years (for MyPower), then Retained Value is essentially our proxy for the unlevered present value of the net cash we forecast from those Energy Contracts. It is (1) the estimated cash flow remaining over the full 30-year life of the system (including contract renewals for leases and PPAs with original terms of 20 years or less) less both (2) estimated costs for annual operations and maintenance expenses and inverter replacement every 10 years and (3) all estimated distributions remaining in our tax equity (or similar) financing structures, which is then (4) discounted to present value at a 6% discount rate.

In sum, Retained Value is an enterprise value measure of the discounted net cash generation estimated from all Energy Contracts booked to date before debt incurred. First and foremost, it demonstrates the net cash generation estimated from our contracted systems taking into account the time value of money across the entire 30-year expected life of the asset in a way that our GAAP financial statements do not. It also highlights our net cash after distributions to our tax equity financing partners. However, retained value is based solely on unlevered cash forecasts and does not reflect any additional project debt such as securitization or aggregation facilities we use (or plan to use) as back leverage. As we continue to pursue financing from debt securitization (and higher penetration of MyPower, which is only financed through debt), we believe it is becoming increasingly important to not only disclose the enterprise value measure of Retained Value but to take it one step further and disclose an equity value measure based on our forecast of net cash after debt. As such, we plan to introduce “Levered Retained Value” in our 2015 reporting.
As of the end of 2014, Retained Value of all our contracted leases/PPAs was $2.4 billion. Relative to our Retained Value forecast at the end of 2013, our total forecasted enterprise value creation increased by $1.4 billion in 2014. Net of an increase in net debt (including convertible debt) of approximately $0.8 billion, this suggests we increased total net present value creation for equity shareholders by approximately $600 million in 2014. Applying our Retained Value methodology to our new loan product, MyPower would have added an additional $166 million, though it is critical to note that we plan to finance MyPower with as much as twice as much debt as we currently plan for our leases and PPAs. By next quarter, we aim to use Levered Retained Value to better capture the integrated value creation of our leases and PPAs as well as our new MyPower loan.
Project Financing and GAAP Cash Flow
|
· |
Undeployed Tax Equity Financing Capacity: 592 MW (as of February 17, 2015) |
|
· |
New MyPower Facility: $200 million |
Every time we sign a new customer, we fund the cost to install a new system. Essentially, we must fund the cash cost per watt to create a MW Booked and turn it into a MW Deployed. Our strategy is to cover our investment in the development of new MW with both net cash generated from customer payments and financing cash flows. Based on our current cost structure, we target positive cash generation in year one from each new deployment through the use of both tax equity partner investment and supplemental project financing such as non-recourse asset-backed debt securities and aggregation facilities.
Across the spectrum, the capital markets are more fluid than they’ve ever been for us, and we now have most of our 2015 financing needs in place. The capital markets are embracing distributed solar and in particular SolarCity as the clear leader and innovator in the market. We continue to significantly increase financing capacity with strong interest from both new investors attracted to the growth and stable returns of the category and existing investors eager to replicate the success of their funds that we’ve fully allocated to date. The last three months have been the biggest period of project financing in our history with undeployed tax equity capacity up to 592 MW as of February 17, 2015, as well as a new revolving facility to fund up to $200 million of our new MyPower loan product.
We continue to lead the industry in financing innovation. As the pioneer of—and currently the only company with access to—the asset-backed securitization [ABS] market for distributed solar, we issued $272 million in solar asset-backed debt in 2014 and plan to continue to access the ABS market this year. In addition, our innovative MyPower facility not only marks our lowest cost of capital to date but it is the first that funds our business without a tax-equity like structure.
As of December 31, 2014, cash, cash equivalents, and short-term investments totaled $642.7 million, growing 11% year over year. Excluding proceeds from equity and convertible notes issuances, our cash usage for the fiscal year was ($441.9 million) due to both significant upfront sales investment to support our targets for 2015 as well as a working capital increase in inventories in preparation for deployments in the first half of 2015.

Q4 2014 GAAP Operating Results
GAAP operating lease and solar energy systems incentive revenue was $49.2 million in the fourth quarter of 2014. As our operating lease revenue is driven in part by the amount of solar energy production in a period, the fourth (and first) quarters are our seasonally softest quarters of the year. Thus, operating lease revenue dipped by (6%) vs. 3Q14 but grew 120% vs. the year ago quarter driven largely by 89% growth in cumulative MW Deployed at year’s end.
Solar energy system sales and components revenue was $22.6 million and now includes system sales financed by MyPower. Revenue from our new solar loan product is recognized as customer payments are received over the life of the 30-year contract but were de minimis in the quarter. Total GAAP revenue was $71.8 million and increased 52% vs. the year ago quarter.
Operating lease and solar energy incentive gross margin was 38% including the impact of $4.7 million in amortization of intangibles. Solar energy system sales and components gross margin was (17%) due in part to the impact of upfront losses on projects recognized under the percentage of completion method, larger low margin commercial projects, one-time Silevo product sales from legacy contracts as well as other one-time costs. When solar energy system sale volumes are low enough, the allocation of indirect overhead (such as warehouse and fleet) costs will yield negative GAAP gross margins even though we target positive cash margins for all of our system sales.
Total GAAP operating expenses were $134.9 million with sales and marketing expenses of $79.5 million (including $3.0 million of amortization of intangibles and $5.5 million in stock compensation), G&A expenses of $45.4 million (including $11.0 million in stock compensation), and R&D expenses of $10.0 million (including $3.0 million in stock compensation). Total operating expenses included $7.1 million in sales and marketing costs that were expensed but that we had initially expected to be capitalized. Excluding the impact of this $7.1 million in costs, operating expenses would have been within our guidance range.
In addition, we incurred $6.3 million in Other Expenses that had not originally been included in our forecast, including $2.6 million in non-cash losses from debt extinguishment, $1.9 million in non-cash accretion on deferred contingent consideration related to our Silevo acquisition, and $1.8 million for other one-time charges. Excluding the impact of this $6.3 million in Other Expenses and the $7.1 million in Operating Expenses that were expensed rather than capitalized, non-GAAP EPS would have been ($1.33). Please see below for an explanation and reconciliation of non-GAAP EPS and adjusted non-GAAP EPS.

Looking Ahead
Following strong growth in 2014, we entered 2015 with high visibility into our full year guidance for 920 - 1,000 MW Deployed. After booking almost 300 MW more than we deployed in 2014, we began the year with a backlog big enough to cover much of our expected first half installations. Ending the year with residential deployments at an annualized run rate of ~600 MW, we have significantly ramped up our installation capacity and plan to scale this beyond 1 GW by year-end even before considering commercial. Lastly, we have secured a majority of the financing commitments required to fund all of our 2015 needs.
Similar to years past, we expect to scale steadily through each quarter to reach our full-year goal. As we all have seen by now, commercial installs—especially the larger, more complex deals—are difficult to predict and are often impacted by factors outside our control. Going forward, we plan to offer guidance using the precise MW target rather than a range we expect to achieve in a given period. In addition, while we maintain our annual guidance for MW Deployed, we will begin offering quarterly guidance on MW Installed, which is a true reflection of our capabilities before the unpredictability around the timing of inspections in between installation and deployment, which can vary wildly by utility and be impacted by their workload and availability of personnel. In future quarters, we will report both MW Installed and MW Deployed, and our full year guidance remains on MW Deployed. For the first quarter of 2015, we are targeting MW Installed of 145 MW. This reflects the typical commercial softness in 1Q and growing seasonality in our residential deployments in light of a higher mix of demand in Northeast states like NY, MA, and CT where snow on rooftops can and is causing delays in some installs. At our target, residential MW Installed would continue to grow more than 100% year-over-year with total MW Installed expected to grow 77%.
With regard to Q1 2015 GAAP guidance, we expect Operating Lease and Solar Energy Systems Incentive Revenue of $47 million - $52 million with solar electricity production remaining lower in the winter months at the start of the year and a higher mix of deployments in the more wintry Northeast states leading to greater seasonality than we have experienced historically. Solar Energy System and Component Sale Revenue is expected to range between $6 million and $8 million.
Operating Lease and Solar Energy Systems Incentive Gross Margin is expected to range between 28%-32% (or 37%-42% excluding the impact of approximately $5 million in amortization of intangibles). Driven largely by an increase in sales investment, we expect Operating Expenses of $148 million - $156 million (including between $30 million and $35 million in non-cash amortization of intangibles and stock compensation expense). In turn, Non-GAAP Loss Per Share (before Income (Loss) Attributable to Noncontrolling Interests and Redeemable Noncontrolling Interests)* is expected to range between ($1.65) – ($1.75).
At the high end of our 2015 guidance, we would achieve our overarching goal to maintain our historical pace of roughly doubling MW every year. This would imply cumulative MW Deployed at the end of the year generating an annualized run rate of between 2.5 and 3.0 TWh of clean solar energy per year. While this would represent significant growth from ~0.25 TWh generated in 2012, our solar systems would still represent a small fraction of less than 0.1% of total U.S. electricity consumption of ~4,000 TWh per year.
We thank all of our customers, employees, advocates and shareholders for helping us get where we are today, and we look forward to joining forces to broaden access to distributed solar in the decades ahead. We have taken a big step forward this year, but the journey has just begun.
|
|
|
|
|
|
|
|
|
Lyndon Rive, CEO |
|
Brad Buss, CFO |


* Non-GAAP Earnings per Share [EPS] Before Noncontrolling Interests
While GAAP EPS is based upon net income (loss) attributable to common stockholders, we also report non-GAAP EPS based upon net income (loss). The only difference between GAAP EPS and non-GAAP EPS is the sole line item net income (loss) attributable to non-controlling interests and redeemable noncontrolling interests.
Under GAAP accounting, we report net income (loss) attributable to noncontrolling interests and redeemable noncontrolling interests to reflect generally our joint venture fund investors’ allocable share in the results of these joint venture financing funds. Income (loss) attributable to noncontrolling interests and redeemable noncontrolling interests is calculated based generally on the hypothetical liquidation at book value, or HLBV method, which assumes that the joint venture funds are liquidated at the reporting date, even though liquidation may or may not ever occur. Additionally the returns that will be allocated to the investors over the expected terms of the funds may differ significantly from the amounts calculated under the HLBV method. Accordingly, we also report non-GAAP EPS based on earnings before net income (loss) attributable to noncontrolling interests and redeemable noncontrolling interests per share, which we view as a better measure of our operating performance.
According to this definition, non-GAAP earnings before noncontrolling interests and redeemable noncontrolling interests per share was ($1.47).
See below for a reconciliation of GAAP EPS to non-GAAP EPS.
Earnings Conference Call
We will hold a conference call today at 5:00 pm Eastern to discuss our fourth quarter and full year 2014 financial results and outlook for first quarter 2015 and beyond. A live webcast of the call may be accessed over the Internet at the “Events and Presentations” link of the Investor Relations section of our website at http://investors.solarcity.com/events.cfm.
Participants should follow the instructions provided on the website to download and install the necessary audio applications in advance of the call. In addition, the earnings presentation slides will be available on our Investor Relations site by 5:00 pm Eastern. The conference call can be accessed live over the phone by dialing 1-877-407-0784, or for international callers, 1-201-689-8560. A replay will be available two hours after the call and can be accessed by dialing 1-877-870-5176, or for international callers, 1-858-384-5517. The passcode is 13599624. The replay will be available until February 25, 2015.
About SolarCity
SolarCity® (Nasdaq:SCTY) provides clean energy. We are disrupting the century-old energy industry by providing renewable electricity directly to homeowners, businesses and government organizations for less than they spend on utility bills. SolarCity gives customers control of their energy costs to protect them from rising rates. The company makes solar energy easy by taking care of everything from design and permitting to monitoring and maintenance. SolarCity currently serves 15 states and signs up a new customer every minute of the work day. Visit the company online at www.solarcity.com and follow the company on Facebook & Twitter.
Forward Looking Statements
This shareholder letter contains forward-looking statements that involve risks and uncertainties, including statements regarding SolarCity’s customer and market growth opportunities; SolarCity’s operational growth and expansion; financial strategies for cash generation and increasing shareholder value; the deployment of megawatts including estimated Q1 2015 and full-year 2015 megawatt deployment; the installation of megawatts including estimated Q1 2015 megawatt installations; future bookings; the completion of commercial projects in development; GAAP revenue, gross margin, operating expenses and non-GAAP EPS for Q1 2015; estimated nominal contracted payments remaining; forecasted retained value of energy contracts; cost goals by 2017; manufacturing facility construction schedule; forecasted access to capital; the amount of megawatts that can be deployed based on committed available financing; the potential introduction of new metrics; expected future GAAP and non-GAAP operating results; and assumptions relating to the foregoing.
Forward-looking statements should not be read as a guarantee of future performance or results, and will not necessarily be accurate indications of the times at, or by, which such performance or results will be achieved, if at all. Forward-looking statements are subject to risks and uncertainties that could cause actual performance or results to differ materially from those expressed in or suggested by the forward-looking statements. As of the date hereof, we have bookings for only a portion of the orders needed to achieve our megawatt projections and therefore expect the megawatts we need to deploy and/or install to meet our projections to be sourced substantially from new deployments of solar systems not currently under contract. In order to meet our projections, we will need to expand our workforce, increase our installation efficiency and exceed our existing bookings rate relative to what we have achieved to date. Additional key risks and uncertainties include the level of demand for our solar energy systems, the availability of a sufficient, timely, and cost-effective supply of solar panels and balance of system components, our ability to successfully integrate Silevo, Inc.’s business, operations and personnel and achieve manufacturing economies of scale and associated cost reductions, our expectations regarding the Riverbend agreement and the development and construction of the Riverbend facility, including expected capital and operating expenses and the performance of our manufacturing operations; the effects of future tariffs and other trade barriers, changes in federal tax treatment, the effect of electric utility industry regulations, net metering and related policies, the availability and amount of rebates, tax credits and other financial incentives, the availability and amount of financing from fund investors, the retail price of utility-generated electricity or the availability of alternative energy sources, risks associated with SolarCity’s rapid growth, the success of our product development efforts and customer preferences, risks that consumers who have executed energy contracts included in reported nominal contracted payments remaining and backlog may seek to cancel those contracts, assumptions as to retained value under energy contracts and contract renewal rates and terms, assumptions as to leveraged retained value and MyPower retained value, including applicable net present values, performance-based incentives, and other rebates, credits and expenses, SolarCity’s limited operating history, particularly as a new public company, changes in strategic planning decisions by management or reallocation of internal resources, completion of preparation of financial statements and general market, political, economic and business conditions. You should read the section entitled “Risk Factors” in our most recent Quarterly Report on Form 10-Q and subsequent Current Reports on Form 8-K, which have been filed with the Securities and Exchange Commission, which identify certain of these and additional risks and uncertainties. We do not undertake any obligation to publicly update or revise any forward-looking statement, whether as a result of new information, future developments or otherwise, except as otherwise required by law.
SolarCity Corporation
Condensed Consolidated Statements of Operations
(In Thousands, Except Per Share Amounts)
|
|
|
Three Months Ended |
|
|
Twelve Months Ended |
|
||||||||||
|
|
|
December 31, 2013 |
|
|
December 31, 2014 |
|
|
December 31, 2013 |
|
|
December 31, 2014 |
|
||||
|
Revenue: |
|
|
|
|
|
|
|
|
|
|
|
|
|
|
|
|
|
Operating leases and solar energy systems incentives |
|
$ |
22,363 |
|
|
$ |
49,205 |
|
|
$ |
82,856 |
|
|
$ |
173,636 |
|
|
Solar energy systems and components sales |
|
|
24,937 |
|
|
|
22,603 |
|
|
|
80,981 |
|
|
|
81,395 |
|
|
Total revenue |
|
|
47,300 |
|
|
|
71,808 |
|
|
|
163,837 |
|
|
|
255,031 |
|
|
Cost of revenue: |
|
|
|
|
|
|
|
|
|
|
|
|
|
|
|
|
|
Operating leases and solar energy systems incentives |
|
|
11,580 |
|
|
|
30,387 |
|
|
|
32,745 |
|
|
|
92,920 |
|
|
Solar energy systems and components sales |
|
|
25,874 |
|
|
|
26,455 |
|
|
|
91,723 |
|
|
|
83,512 |
|
|
Total cost of revenue |
|
|
37,454 |
|
|
|
56,842 |
|
|
|
124,468 |
|
|
|
176,432 |
|
|
Gross profit |
|
|
9,846 |
|
|
|
14,966 |
|
|
|
39,369 |
|
|
|
78,599 |
|
|
Operating expenses: |
|
|
|
|
|
|
|
|
|
|
|
|
|
|
|
|
|
Sales and marketing |
|
|
33,893 |
|
|
|
79,515 |
|
|
|
97,426 |
|
|
|
238,608 |
|
|
General and administrative |
|
|
30,711 |
|
|
|
45,420 |
|
|
|
89,801 |
|
|
|
156,426 |
|
|
Research and development |
|
|
547 |
|
|
|
10,004 |
|
|
|
1,520 |
|
|
|
19,162 |
|
|
Total operating expenses |
|
|
65,151 |
|
|
|
134,939 |
|
|
|
188,747 |
|
|
|
414,196 |
|
|
Loss from operations |
|
|
(55,305 |
) |
|
|
(119,973 |
) |
|
|
(149,378 |
) |
|
|
(335,597 |
) |
|
Interest expense - net |
|
|
8,217 |
|
|
|
18,566 |
|
|
|
25,738 |
|
|
|
55,758 |
|
|
Other expense - net |
|
|
1,016 |
|
|
|
6,318 |
|
|
|
1,441 |
|
|
|
10,611 |
|
|
Loss before income taxes |
|
|
(64,538 |
) |
|
|
(144,857 |
) |
|
|
(176,557 |
) |
|
|
(401,966 |
) |
|
Income tax benefit |
|
|
24,742 |
|
|
|
3,421 |
|
|
|
24,799 |
|
|
|
26,736 |
|
|
Net loss |
|
|
(39,796 |
) |
|
|
(141,436 |
) |
|
|
(151,758 |
) |
|
|
(375,230 |
) |
|
Net loss attributable to noncontrolling interests and redeemable noncontrolling interests |
|
|
(66,489 |
) |
|
|
(137,881 |
) |
|
|
(95,968 |
) |
|
|
(319,196 |
) |
|
Net income (loss) attributable to stockholders |
|
$ |
26,693 |
|
|
$ |
(3,555 |
) |
|
$ |
(55,790 |
) |
|
$ |
(56,034 |
) |
|
Net income (loss) attributable to common stockholders |
|
|
|
|
|
|
|
|
|
|
|
|
|
|
|
|
|
Basic |
|
$ |
26,693 |
|
|
$ |
(3,555 |
) |
|
$ |
(55,790 |
) |
|
$ |
(56,034 |
) |
|
Diluted |
|
$ |
26,693 |
|
|
$ |
(3,555 |
) |
|
$ |
(55,790 |
) |
|
$ |
(56,034 |
) |
|
Net income (loss) per share attributable to common stockholders |
|
|
|
|
|
|
|
|
|
|
|
|
|
|
|
|
|
Basic |
|
$ |
0.31 |
|
|
$ |
(0.04 |
) |
|
$ |
(0.70 |
) |
|
$ |
(0.60 |
) |
|
Diluted |
|
$ |
0.28 |
|
|
$ |
(0.04 |
) |
|
$ |
(0.70 |
) |
|
$ |
(0.60 |
) |
|
Weighted average shares used to compute net income (loss) per share attributable to common stockholders |
|
|
|
|
|
|
|
|
|
|
|
|
|
|
|
|
|
Basic |
|
|
87,359 |
|
|
|
96,296 |
|
|
|
79,782 |
|
|
|
93,334 |
|
|
Diluted |
|
|
95,157 |
|
|
|
96,296 |
|
|
|
79,782 |
|
|
|
93,334 |
|
SolarCity Corporation
Condensed Consolidated Balance Sheets
(In Thousands)
|
|
|
December 31, |
|
|
December 31, |
|
||
|
|
|
2013 |
|
|
2014 |
|
||
|
|
|
|
|
|
|
|
|
|
|
Assets |
|
|
|
|
|
|
|
|
|
Current assets: |
|
|
|
|
|
|
|
|
|
Cash and cash equivalents |
|
$ |
577,080 |
|
|
$ |
504,383 |
|
|
Short-term investments |
|
|
— |
|
|
|
138,311 |
|
|
Restricted cash |
|
|
19,182 |
|
|
|
20,875 |
|
|
Accounts receivable - net |
|
|
23,011 |
|
|
|
22,708 |
|
|
Rebates receivable - net |
|
|
20,131 |
|
|
|
30,021 |
|
|
Inventories |
|
|
111,394 |
|
|
|
217,223 |
|
|
Deferred income tax asset |
|
|
9,845 |
|
|
|
13,149 |
|
|
Prepaid expenses and other current assets |
|
|
27,020 |
|
|
|
55,729 |
|
|
Total current assets |
|
|
787,663 |
|
|
|
1,002,399 |
|
|
Solar energy systems, leased and to be leased - net |
|
|
1,682,521 |
|
|
|
2,796,796 |
|
|
Property, plant and equipment - net |
|
|
22,407 |
|
|
|
101,914 |
|
|
Goodwill and intangible assets - net |
|
|
278,169 |
|
|
|
539,557 |
|
|
Customer notes receivable, net of current portion |
|
|
— |
|
|
|
34,544 |
|
|
Other assets |
|
|
38,774 |
|
|
|
111,001 |
|
|
Total assets |
|
$ |
2,809,534 |
|
|
$ |
4,586,211 |
|
|
Liabilities and equity |
|
|
|
|
|
|
|
|
|
Current liabilities: |
|
|
|
|
|
|
|
|
|
Accounts payable |
|
$ |
121,556 |
|
|
$ |
237,809 |
|
|
Distributions payable to noncontrolling interests and redeemable noncontrolling interests |
|
|
20,390 |
|
|
|
8,552 |
|
|
Current portion of deferred U.S. Treasury grant income |
|
|
15,340 |
|
|
|
15,330 |
|
|
Accrued and other current liabilities |
|
|
72,157 |
|
|
|
152,408 |
|
|
Customer deposits |
|
|
8,828 |
|
|
|
10,560 |
|
|
Current portion of deferred revenue |
|
|
59,899 |
|
|
|
86,238 |
|
|
Current portion of long-term debt |
|
|
7,422 |
|
|
|
12,931 |
|
|
Current portion of solar asset-backed notes |
|
|
3,155 |
|
|
|
13,574 |
|
|
Current portion of lease pass-through financing obligation |
|
|
29,041 |
|
|
|
29,241 |
|
|
Current portion of sale-leaseback financing obligation |
|
|
418 |
|
|
|
448 |
|
|
Total current liabilities |
|
|
338,206 |
|
|
|
567,091 |
|
|
Deferred revenue, net of current portion |
|
|
410,161 |
|
|
|
557,408 |
|
|
Long-term debt, net of current portion |
|
|
238,612 |
|
|
|
290,414 |
|
|
Convertible senior notes |
|
|
230,000 |
|
|
|
796,000 |
|
|
Solar asset-backed notes, net of current portion |
|
|
49,780 |
|
|
|
304,393 |
|
|
Long-term deferred tax liability |
|
|
9,238 |
|
|
|
13,194 |
|
|
Lease pass-through financing obligation, net of current portion |
|
|
64,167 |
|
|
|
59,490 |
|
|
Sale-leaseback financing obligation, net of current portion |
|
|
14,338 |
|
|
|
13,889 |
|
|
Deferred U.S. Treasury grant income, net of current portion |
|
|
412,469 |
|
|
|
397,486 |
|
|
Other liabilities and deferred credits |
|
|
193,439 |
|
|
|
244,474 |
|
|
Total liabilities |
|
|
1,960,410 |
|
|
|
3,243,839 |
|
|
|
|
|
|
|
|
|
|
|
|
Redeemable noncontrolling interests in subsidiaries |
|
|
44,709 |
|
|
|
186,788 |
|
|
Stockholders' equity: |
|
|
|
|
|
|
|
|
|
Common stock |
|
|
10 |
|
|
|
10 |
|
|
Additional paid-in capital |
|
|
819,914 |
|
|
|
1,003,992 |
|
|
Accumulated deficit |
|
|
(202,326 |
) |
|
|
(258,360 |
) |
|
Total stockholders' equity |
|
|
617,598 |
|
|
|
745,642 |
|
|
Noncontrolling interests in subsidiaries |
|
|
186,817 |
|
|
|
409,942 |
|
|
Total equity |
|
|
804,415 |
|
|
|
1,155,584 |
|
|
Total liabilities and equity |
|
$ |
2,809,534 |
|
|
$ |
4,586,211 |
|
SolarCity Corporation
Condensed Consolidated Statements of Cash Flows
(In Thousands)
|
|
Year Ended December 31, |
|
|||||
|
|
2013 |
|
|
2014 |
|
||
|
Operating activities: |
|
|
|
|
|
|
|
|
Net loss |
$ |
(151,758 |
) |
|
$ |
(375,230 |
) |
|
Adjustments to reconcile net loss to net cash provided by (used in) operating activities: |
|
|
|
|
|
|
|
|
Loss on disposal of property, plant and equipment and construction in progress |
|
60 |
|
|
|
1,404 |
|
|
Depreciation and amortization net of amortization of deferred U.S. Treasury grant income |
|
41,448 |
|
|
|
97,880 |
|
|
Non cash interest and other expense |
|
13,438 |
|
|
|
13,631 |
|
|
Stock-based compensation, net of amounts capitalized |
|
21,262 |
|
|
|
65,562 |
|
|
Loss on extinguishment of long-term debt |
|
306 |
|
|
|
4,533 |
|
|
Deferred income taxes |
|
(25,424 |
) |
|
|
(26,680 |
) |
|
Reduction in lease pass-through financing obligation |
|
(35,675 |
) |
|
|
(48,837 |
) |
|
Changes in operating assets and liabilities: |
|
|
|
|
|
|
|
|
Restricted cash |
|
(13,059 |
) |
|
|
(17,699 |
) |
|
Accounts receivable |
|
2,911 |
|
|
|
945 |
|
|
Rebates receivable |
|
(2,630 |
) |
|
|
(9,890 |
) |
|
Inventories |
|
(19,954 |
) |
|
|
(97,347 |
) |
|
Prepaid expenses and other current assets |
|
(19,276 |
) |
|
|
(23,579 |
) |
|
Other assets |
|
(6,882 |
) |
|
|
(32,019 |
) |
|
Accounts payable |
|
50,750 |
|
|
|
112,480 |
|
|
Accrued and other liabilities |
|
84,444 |
|
|
|
(22,676 |
) |
|
Customer deposits |
|
919 |
|
|
|
1,732 |
|
|
Deferred revenue |
|
233,635 |
|
|
|
137,941 |
|
|
Net cash provided by (used in) operating activities |
|
174,515 |
|
|
|
(217,849 |
) |
|
Investing activities: |
|
|
|
|
|
|
|
|
Payments for the cost of solar energy systems, leased and to be leased |
|
(716,947 |
) |
|
|
(1,162,963 |
) |
|
Purchase of property, plant and equipment |
|
(9,126 |
) |
|
|
(22,892 |
) |
|
Investment in promissory notes receivable and other investments |
|
— |
|
|
|
(21,750 |
) |
|
Purchases of short-term investments |
|
— |
|
|
|
(167,397 |
) |
|
Proceeds from sales and maturities of short-term investments |
|
— |
|
|
|
28,764 |
|
|
Acquisition of business, net of cash acquired |
|
(3,826 |
) |
|
|
1,874 |
|
|
Payments to acquire redeemable noncontrolling interest in a subsidiary |
|
— |
|
|
|
(450 |
) |
|
Net cash used in investing activities |
|
(729,899 |
) |
|
|
(1,344,814 |
) |
SolarCity Corporation
Condensed Consolidated Statements of Cash Flows
(In Thousands)
|
|
Year Ended December 31, |
|
|||||
|
|
2013 |
|
|
2014 |
|
||
|
Financing activities: |
|
|
|
|
|
|
|
|
Investment fund financings, bank and other borrowings: |
|
|
|
|
|
|
|
|
Borrowings under long-term debt |
|
203,228 |
|
|
|
373,453 |
|
|
Repayments of long-term debt |
|
(65,328 |
) |
|
|
(336,557 |
) |
|
Proceeds from issuance of solar asset-backed notes |
|
51,334 |
|
|
|
262,880 |
|
|
Repayments of borrowings under solar asset-backed notes |
|
(1,461 |
) |
|
|
(5,932 |
) |
|
Payment of deferred purchase consideration |
|
(3,382 |
) |
|
|
(2,206 |
) |
|
Repayments of sale-leaseback financing obligation |
|
(388 |
) |
|
|
(419 |
) |
|
Proceeds from lease pass-through financing obligation |
|
57,780 |
|
|
|
44,563 |
|
|
Repayments of lease pass-through financing obligation |
|
(41,148 |
) |
|
|
(12,041 |
) |
|
Repayment of capital lease obligations |
|
(1,594 |
) |
|
|
(2,772 |
) |
|
Proceeds from investment by noncontrolling interests and redeemable noncontrolling interests in subsidiaries |
|
362,692 |
|
|
|
777,963 |
|
|
Distributions paid to noncontrolling interests and redeemable noncontrolling interests in subsidiaries |
|
(137,005 |
) |
|
|
(117,125 |
) |
|
Proceeds from U.S. Treasury grants |
|
127,476 |
|
|
|
342 |
|
|
Net cash provided by financing activities before equity and convertible notes issuances |
|
552,204 |
|
|
|
982,149 |
|
|
Equity and convertible notes issuances: |
|
|
|
|
|
|
|
|
Proceeds from issuance of common stock |
|
174,083 |
|
|
|
— |
|
|
Proceeds from issuance of convertible senior notes |
|
222,518 |
|
|
|
552,765 |
|
|
Purchase of capped call options |
|
— |
|
|
|
(65,203 |
) |
|
Proceeds from exercise of stock options |
|
15,545 |
|
|
|
20,255 |
|
|
Proceeds from exercise of common stock warrants |
|
8,034 |
|
|
|
— |
|
|
Net cash provided by equity and convertible notes issuances |
|
420,180 |
|
|
|
507,817 |
|
|
Net cash provided by financing activities |
|
972,384 |
|
|
|
1,489,966 |
|
|
Net increase (decrease) in cash and cash equivalents |
|
417,000 |
|
|
|
(72,697 |
) |
|
Cash and cash equivalents, beginning of period |
|
160,080 |
|
|
|
577,080 |
|
|
Cash and cash equivalents, end of period |
$ |
577,080 |
|
|
$ |
504,383 |
|
Operating Activity Metrics:
|
|
|
|
|
|
|
|
|
|
|
Increase |
|
|
|
|
|
|
|
|
|
|
|
Cumulative |
|
||
|
|
|
2013 |
|
|
2014 |
|
|
Q4 2013 |
|
|
Q3 2014 |
|
|
Q4 2014 |
|
|
|
as of 12/31/14 |
|
||||||
|
MW Deployed |
|
|
280 |
|
|
|
502 |
|
|
|
103 |
|
|
137 |
|
|
|
176 |
|
|
|
|
1,069 |
|
|
|
Customers |
|
|
44,579 |
|
|
|
96,659 |
|
|
|
10,763 |
|
|
|
27,305 |
|
|
|
21,318 |
|
|
|
|
189,657 |
|
|
Energy Contracts |
|
|
42,580 |
|
|
|
94,190 |
|
|
|
10,759 |
|
|
|
27,116 |
|
|
|
21,406 |
|
|
|
|
177,455 |
|
|
Estimated Nominal Contracted Payments Remaining ($M) |
|
$ |
881 |
|
|
$ |
2,961 |
|
|
$ |
253 |
|
|
$ |
803 |
|
|
$ |
837 |
|
|
|
$ |
4,951 |
|
Stock-Based Compensation Expense:
|
|
|
Three Months Ended December 31, |
|
|
Twelve Months Ended December 31, |
|
||||||||||
|
in thousands |
|
2013 |
|
|
2014 |
|
|
2013 |
|
|
2014 |
|
||||
|
Cost of revenue |
|
$ |
157 |
|
|
$ |
442 |
|
|
$ |
741 |
|
|
$ |
2,251 |
|
|
Sales and marketing |
|
$ |
1,425 |
|
|
$ |
5,462 |
|
|
$ |
4,003 |
|
|
$ |
16,391 |
|
|
General and administrative |
|
$ |
6,101 |
|
|
$ |
10,978 |
|
|
$ |
15,914 |
|
|
$ |
40,897 |
|
|
Research and development |
|
$ |
86 |
|
|
$ |
2,976 |
|
|
$ |
269 |
|
|
$ |
6,023 |
|
Reconciliation from GAAP Operating Expenses to Non-GAAP Operating Expenses in Q4 2014:
|
in thousands |
|
|
GAAP Operating Expenses |
$ 134,939 |
|
- Sales & Marketing Costs Expensed Rather than Capitalized |
(7,132) |
|
= Non-GAAP Operating Expenses |
$ 127,807 |
Reconciliation from GAAP EPS to Non-GAAP EPS in Q4 2014:
|
|
|
|
|
|
GAAP Net Loss |
|
|
|
|
|
|
|
|
GAAP Net Loss |
|
|
Attributable to Noncontrolling |
|
|
|
|
|
||
|
|
Attributable to |
|
|
Interests and Redeemable |
|
|
Non-GAAP |
|
|||
|
in thousands except per share |
Stockholders |
|
|
Noncontrolling Interests |
|
|
Net Loss |
|
|||
|
Net loss |
$ |
(3,555 |
) |
|
$ |
(137,881 |
) |
|
$ |
(141,436 |
) |
|
/ Weighted Average Common Shares Outstanding |
|
96,296 |
|
|
|
96,296 |
|
|
|
96,296 |
|
|
= Net Loss Per Share |
$ |
(0.04 |
) |
|
$ |
(1.43 |
) |
|
$ |
(1.47 |
) |
Reconciliation from Non-GAAP EPS to Adjusted Non-GAAP EPS in Q4 2014:
|
|
|
|
|
|
Sales & Marketing |
|
|
|
|
|
|
Adjusted |
|
||
|
|
Non-GAAP |
|
|
Costs Expensed Rather |
|
|
Other |
|
|
Non-GAAP |
|
||||
|
in thousands except per share |
Net Loss |
|
|
than Capitalized |
|
|
Expense |
|
|
Net Loss |
|
||||
|
Net loss |
$ |
(141,436 |
) |
|
$ |
7,132 |
|
|
$ |
6,318 |
|
|
$ |
(127,986 |
) |
|
/ Weighted Average Common Shares Outstanding |
|
96,296 |
|
|
|
96,296 |
|
|
|
96,296 |
|
|
|
96,296 |
|
|
= Net Loss Per Share |
$ |
(1.47 |
) |
|
$ |
0.07 |
|
|
$ |
0.07 |
|
|
$ |
(1.33 |
) |
Retained Value Sensitivities:
The following tables provide quantitative sensitivity analyses of our estimates of Retained Value Under Energy Contract, Retained Value Renewal, Retained Value, and Retained Value per Watt as of December 31, 2014 on our and alternate assumptions.
|
|
|
Retained Value Forecast ($M) |
|
|
|
Retained Value Forecast ($/Watt) |
||||||||
|
|
|
|
|
|
|
|
|
|
|
|
|
|
|
|
|
|
|
|
Discount Rate |
|
|
|
|
Discount Rate |
||||||
|
|
|
|
4% |
6% |
8% |
|
|
|
|
|
4% |
6% |
8% |
|
|
|
70% |
|
2,760 |
2,179 |
1,768 |
|
|
|
70% |
|
1.92 |
1.52 |
1.23 |
|
|
Renewal |
80% |
|
2,947 |
2,300 |
1,848 |
|
|
Renewal |
80% |
|
2.05 |
1.60 |
1.29 |
|
|
Rate |
90% |
|
3,134 |
2,423 |
1,928 |
|
|
Rate |
90% |
|
2.18 |
1.69 |
1.34 |
|
|
|
100% |
|
3,321 |
2,543 |
2,008 |
|
|
|
100% |
|
2.31 |
1.77 |
1.40 |
|
|
|
|
|
|
|
|
|
|
|
|
|
|
|
|
|
|
|
|
|
|
|
|
|
|
|
|
|
|
|
|
|
|
|
|
Retained Value Under Contract ($M) |
|
|
|
Retained Value of Renewal ($M) |
||||||||
|
|
|
|
|
|
|
|
|
|
|
|
|
|
|
|
|
|
|
|
Discount Rate |
|
|
|
|
Discount Rate |
||||||
|
|
|
|
4% |
6% |
8% |
|
|
|
|
|
4% |
6% |
8% |
|
|
|
70% |
|
2,004 |
1,685 |
1,437 |
|
|
|
70% |
|
755 |
494 |
330 |
|
|
Renewal |
80% |
|
2,004 |
1,685 |
1,437 |
|
|
Renewal |
80% |
|
942 |
615 |
411 |
|
|
Rate |
90% |
|
2,004 |
1,685 |
1,437 |
|
|
Rate |
90% |
|
1,129 |
738 |
491 |
|
|
|
100% |
|
2,004 |
1,685 |
1,437 |
|
|
|
100% |
|
1,317 |
858 |
571 |
|
Figures may not calculate exactly due to rounding
Definitions:
“MW” or “megawatts” represents the DC nameplate megawatt production capacity
“Backlog” represents the aggregate megawatt capacity of solar energy systems not yet deployed as of the date specified pursuant to Energy Contracts and contracts for solar energy system direct sales executed as of such date.
“Customers” includes all residential, commercial and government buildings where we have installed or contracted to install a solar energy system, or performed or contracted to perform an energy efficiency evaluation or other energy efficiency services.
“Energy Contracts” includes all residential, commercial and government leases and power purchase agreements and consumer loan agreements pursuant to which consumers use or will use energy generated by a solar energy system that we have installed or contracted to install. For landlord-tenant structures in which we contract with the landlord or development company, we include each residence as an individual contract. For commercial customers with multiple locations, each location is deemed a contract if we maintain a separate contract for that location.
“MW Booked” represents the aggregate megawatt production capacity of solar energy systems pursuant to customer contracts signed (with no contingencies remaining) during the applicable period net of cancellations during the applicable period. This metric includes solar energy systems booked under Energy Contracts as well as solar energy system direct sales.
“MW Deployed” represents the megawatt production capacity of solar energy systems that have had all required building department inspections completed during the applicable period. This metric includes solar energy systems deployed under Energy Contracts as well as for solar energy system direct sales.
"MW Installed" represents the megawatt production capacity of (a) residential solar energy systems, for which (i) all solar panels, inverters, mounting and racking hardware, and system wiring have been installed, (ii) the system inverter is connected and a successful DC string test has been completed confirming the production capacity of the system, and (iii) interconnection wiring has been completed and the system is capable of being grid connected, each completed during the applicable period; and (b) for non-residential solar energy systems, for which (i) all solar panels, inverters, mounting and racking hardware, and system wiring have been installed, (ii) the system inverter is connected and a successful DC string test has been completed confirming the production capacity of the system, and (iii) the system is capable of being grid connected, each completed during the applicable period. This metric includes solar energy systems deployed under Energy Contracts as well as for solar energy system direct sales. In each case in-period completion of the above criteria may be demonstrated by written verification by each of the Chief Financial Officer and the Chief Operating Officer (which may include written sub-certifications).
“Levered Retained Value” forecast represents our forecast for both “Retained Value” and “MyPower Retained Value” less additional cash flow required to service all project-level debt forecast for all of our “Energy Contracts.” Project-level debt includes both solar asset-backed loans as well as any related aggregation facilities.
“MyPower Retained Value” forecast represents our estimate of the forecasted net present value at a discount rate of 6% of Nominal Contracted Payments Remaining for all MyPower consumer loan agreements and contracted solar renewable energy certificates allocated to us pursuant to MyPower consumer loan agreements, net of estimated operations and maintenance, insurance, administrative and inverter replacement costs, based on contractually agreed amounts as well as historic expenses. This metric includes MyPower consumer loan agreements for solar energy systems deployed and in Backlog.
“Nominal Contracted Payments Remaining” represents our estimate of the sum of cash payments that are customers are obligated to pay us under our Energy Contracts over the remaining term of such contracts. This metric includes Energy Contracts for solar energy systems deployed and in Backlog. As an example, if a customer is 2 years into her 20 year contract, then 18 years of contract payments remain. As an additional example, if a customer chose to pre-pay her Energy Contract, then it is included in estimated Nominal Contracted Payments Remaining only while it is in Backlog as the pre-payment has not been received. Payments for direct sales are not included.
“Retained Value” forecast represents the sum of both “Retained Value under Energy Contract” and “Retained Value Renewal.” Retained Value under Energy Contract represents our estimate of the forecasted net present value at a discount rate of 6% of Nominal Contracted Payments Remaining for all lease and PPA Energy Contracts (excluding consumer loan energy contracts) and estimated performance-based incentives and contracted solar renewable energy certificates allocated to us, net of amounts we are obligated to distribute to our fund investors, upfront rebates, depreciation, renewable energy certificates, solar renewable energy certificates and estimated operations and maintenance, insurance, administrative and inverter replacement costs, based on contractually agreed amounts as well as historic expenses. This metric includes all lease and PPA Energy Contracts for solar energy systems deployed and in
Backlog. Retained Value Renewal represents our estimate of the forecasted net present value at a discount rate of 6% of the payments we would receive upon renewal of all lease and PPA Energy Contracts (excluding consumer loan agreements) through a total term of 30 years at a rate equal to 90% of the contractual rate in effect at expiration of the initial term, net of estimated operations and maintenance, insurance, administrative and inverter replacement costs, based on contractually agreed amounts as well as historic expenses. This metric includes all lease and PPA Energy Contracts for solar energy systems deployed and in Backlog. We assume renewal due to both (1) a higher life expectancy of the equipment used in our solar energy systems (typically 30 years or more) vs. a contract term (typically 20 years) and (2) our assumption utility retail rates continue to increase at their historic pace and our expectation that the price of our energy contracts will continue to represent an economic incentive for our customers to renew their contracts.
“Retained Value per Watt” is computed by dividing cumulative retained value as of such date by the sum of total MWs deployed under Energy Contracts as of such date plus MWs booked under Energy Contracts as of such date but not yet deployed.
“Undeployed Tax Equity Financing Capacity” represents a forecast of the amount of MW that can be deployed based on committed available tax equity financing for Energy Contracts.
|
Investor Contact |
|
Aaron Chew investors@solarcity.com 650-963-5920 |