Attached files
| file | filename |
|---|---|
| 8-K - 8-K - LATTICE SEMICONDUCTOR CORP | d876913d8k.htm |
Exhibit 99.1
Lattice Semiconductor Corporation (“Lattice” or the “Company”) is a leader in low power, small form factor, low cost programmable logic devices serving primarily the consumer, industrial and communications end markets. For the 2014 fiscal year ended (“FYE”) Lattice generated Revenue and Adjusted EBITDA of $366.1 million and $77.3 million, respectively. As of February 17, 2015, Lattice had a market capitalization of $732.6 million. Adjusted EBITDA is defined and reconciled in Section 8.
Silicon Image, Inc. (“Silicon Image”) is a leading provider of multimedia connectivity solutions and services for mobile, consumer electronics and PC markets. For FYE December 31, 2014, Silicon Image generated Revenue and Adjusted EBITDA of $258.1 million and $34.9 million, respectively.
Transaction Overview
On January 27, 2015, Lattice signed a definitive agreement to acquire Silicon Image for approximately $600 million. Acquisition of Silicon Image will allow Lattice to increase scale, capture increased lifetime revenues, diversify end markets and customer base, broaden market opportunities and realize significant synergies. The combined company generated 2014 Pro Forma (“PF”) FYE Revenue of $624.2 million and Adjusted EBITDA of $148.8 million (inclusive of approximately $36.6 million of estimated pro forma synergies).
To finance the acquisition, Jefferies Finance LLC, along with HSBC Securities (USA) Inc., committed $350 million of financing to arrange and syndicate a $350 million Senior Secured Term Loan (the “Term Loan”). The remainder of the sources of funds will come from existing balance sheet cash from Lattice and Silicon Image. Pro forma for the Transaction, Total and Net Debt to 2014 FYE December 31, 2014 Pro Forma Adjusted EBITDA of $148.8 million will be approximately 2.4x and 1.4x, respectively.
Sources & Uses of Funds, Pro Forma Capitalization and Credit Statistics [table conformed]
| (1) | Silicon Image Equity Purchase Price based on a per share purchase price of $7.30 and 82.6 million fully diluted shares outstanding. |
| (2) | As of February 17, 2015; based on a per share price of $6.03 and 121.5 million fully diluted shares outstanding. |

21
[Redacted]
4.10 Litigation
In December 2014, Pabst Licensing GmbH& Co. KG, a non-practicing entity and as successor in interest to Rambus, Inc., commenced a civil action against the Company in the U.S. District Court for the District of Delaware, alleging that certain of the simulator or simulation products sold by the Company may infringe one or more of the patents held by Pabst. The complaint in this matter has not yet served on the Company and no discovery has been conducted with respect to the matter. At this stage of the proceedings, Lattice does not have an estimate of the likelihood or the amount of any potential exposure to the Company. The Company believes that it possesses defenses to these claims and intends to vigorously defend this litigation. It is reasonably possible that the actual losses may exceed the accrued liabilities, however, and the Company currently cannot estimate such amount.
53
6.1 Investment Highlights For The Combined Companies
| Complementary Acquisition |
• Acquisition provides Lattice with unique opportunity to become a global leader in low power connectivity solutions
• Complementary and additive FPGA and ASSP product offerings with robust IP portfolios
• Longer revenue cycles from formalizing IP standards to early product adoption to long-tail product maturity phase
• Quicker time to market driven by early engagements with OEMs and development of plug-and-play modular technologies
• Significant run-rate synergies of approximately $36.6 million from gaining R&D efficiencies and streamlining sales organization | |
| Differentiated IP and Product Portfolio with Higher Lifetime Revenue Opportunity |
• Leader in setting industry standards such as HDMI®, MHL® and WirelessHDTM
• More than 1,192 patents provide a defensible market position in both mature and emerging markets
• Strong pipeline of new products and IP: HDMI 2.0, USB 3.1, MHL 3.0, super MHL, Millimeter-Wave wireless connectivity
• Forefront of Millimeter-Wave wireless connectivity through Snap, WiGig and backhaul | |
| Diversified Revenues |
• Broad end-market exposure across consumer (44%), industrial (22%), communications (24%) and licensing (10%)
• Geographic revenue diversity: 47.2% in Asia (excluding Korea and Japan), 20.8% in Korea, 11.4% in Japan, 11.1% in Europe, and 8.0% in Americas, and 1.6% in the rest of the world (based on ship-to location)
• More than 54 different products sold to over 8,000 global customers
• Top 5 customers contribute approximately 46% of revenues | |
| Strong Tier 1 Customer Relationships |
• Blue chip customer base includes multiple large and well-respected OEMs
• Long-standing customer relationships | |
| Attractive Industry Fundamentals with Significant Barriers to Entry |
• Product portfolio is focused on stable and growing end-markets
• Smartphone, tablets and wearables are expected by IDC to grow 11%, 5% and 78% CAGR 2013-2018, respectively
• Overall semiconductor industry is expected to grow ~4% while FPGA is expected to grow ~7% and consumer FPGA is expected to grow ~9%
• ~25% of high-end smartphones and ~40% of DTVs shipped in 2014 have MHL
• New products aligned with industry trends of moving to wireless connectivity
• Barriers to entry include existing relationships, evolving technology, and complex software requirements | |
| Low Leverage with High Free Cash Flow Generation |
• Strong cash flow driven by high-margin (56%-60% gross margin), limited capital expenditures due to fabless model and modest working capital requirements
• High variable cost model allows significant financial flexibility
• Attractive liquidity profile driven by large cash balance of $139 million at close and strong free cash flow generation
• Realization of significant synergies for a target EBITDA margin of over 25% by 2017
• Total leverage of 2.4x and net leverage at close of 1.4x with the ability to de-lever rapidly | |
| Significant Operational Synergies |
• $36.6 million run-rate synergies expected to be realized by first year
• Approximately $4.3 million from S&M, $27.9 million from R&D, and $4.4 million from G&A
• Reduced wafer costs due to higher volume as well as reduced assembly & test costs | |
| Multiple Growth Vectors |
• Combined company has multiple growth vectors that will drive revenue and cash flow growth | |
74
6.2 Complementary Acquisition
Two trends dominate in driving the market demand for low-power, small-footprint, and low-cost connectivity solutions: the rapid increase in the number and types of Internet-connected devices and electronics OEMs striving to differentiate their products in terms of size, form factor, and energy efficiency. In addition, rapid technological development and short OEM product launch cycles contributes to the value proposition of a leading provider of connectivity solutions with the breadth in product offerings to address the entire lifecycle of OEM products. Lattice’s acquisition of Silicon Image will be the first to bring FPGA and ASSP capabilities under a single company, creating a global leader in low-power, small-footprint, and low-cost connectivity solutions with a superior value proposition to customers.
The combined company will be able to achieve significant scale, with revenues and adjusted EBITDA over $600 million and $140 million, respectively. Due to the complementary product offerings of FPGAs and ASSPs allowing the company to offer advantages of both programmable and industry-accepted optimized solutions, the combined company will also be able to draw revenues from a greater portion of an OEM product’s lifecycle. Furthermore, as Lattice and Silicon Image share overlaps in end-markets and customers, the combined company will be able to realize significant synergies and further drive EBITDA expansion.
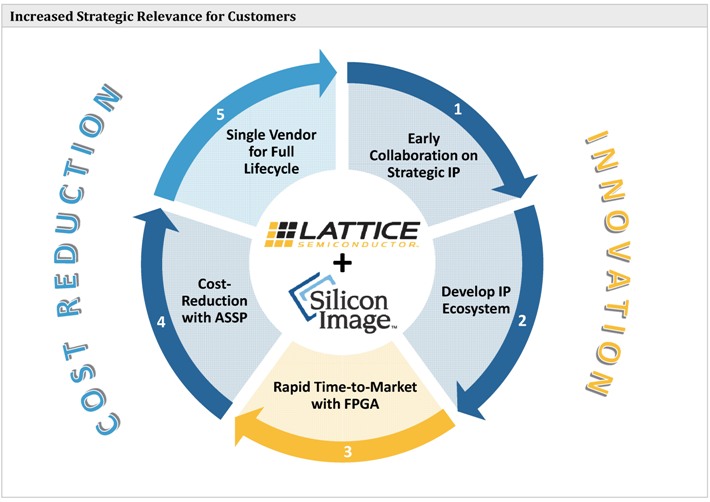
Increased Strategic Relevance for Customers
COST
REDUCTION
INNOVATION
1 Early Collaboration on Strategic IP
2 Develop IP Ecosystem
3 Rapid Time-to-Market with FPGA
4 Cost-reduction with ASSP
5 Single Vendor for Full Lifecycle
LATTICE SEMICONDUCTOR
+ Silicon ImageTM
75
6.3 Differentiated IP and Product Portfolio with Higher Lifetime Revenue Opportunity
Silicon Image has a substantial IP portfolio of media connectivity solutions that has gained industry-wide recognition. HDMI and MHL are examples of key IP products that have proliferated as the industry standard for video and audio connectivity, with 4 billion and 750 million products shipped to date for HDMI and MHL, respectively. Continued upgrades of the current industry-leading standards, such as HDMI 2.0, USB 3.1, MHL 3.0 and superMHL, will sustain the revenue opportunities of the current IP portfolio. In addition, the combined company will invest in the emerging 60GHz wireless market, including formats such as WireslessHD, WiGig and Snap.
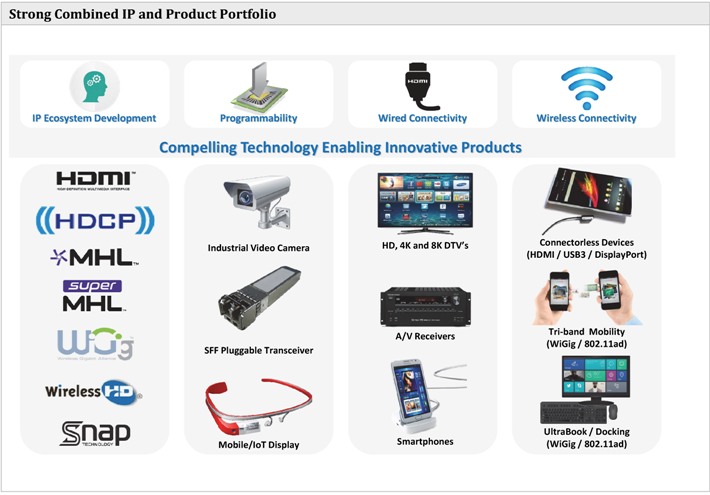
In addition to a more comprehensive IP portfolio, the combined company will be able to deliver connectivity solutions that are relevant over a wide range of applications and a longer period of an OEM product’s lifecycle. Given their programmability, FPGAs that arrive off-the-shelf can be customized by an OEM manufacturer for any logic function, resulting in easy implementation and modification of functions and a rapid time-to-market. By contrast, ASSPs, which must be specifically engineered for products and applications, are slower to reach the market but offer advantages in cost, scale, and performance. By combining the benefits of FPGAs and ASSPs, the combined company will be able to bring solutions to market more quickly and hold onto those design wins throughout the products life cycle.
Strong Combined IP and Product Portfolio IP Ecosystem Development
Programmability Wired Connectivity
Wireless Connectivity Compelling Technology Enabling Innovative Products
HDMI ((HDCP))
MHLTM superMHL
WiGig WirelessHD
Snap TECHNOLOGY Industrial Video Camera
SFF Pluggable Transceiver Mobile/IoT Display
HD, 4K and 8K DTV’s A/V Receivers
Smartphones Connectorless Devices
(HDMI/ USB3/ DisplayPort)
Tri-band Mobility (WiGig/ 802.11ad) UltraBook/ Docking (WiGig/ 802.11ad)
76
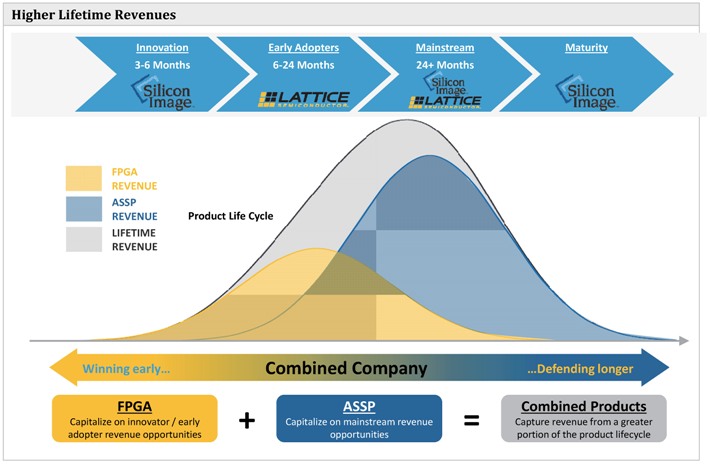
Higher Lifetime Revenues
Innovation
3-6 Months
Silicon ImageTM
Early Adopters
6-24 Months
LATTICE
SEMICONDUCTOR
Mainstream
24+ Months
Silicon ImageTM
LATTICE
SEMICONDUCTOR
Maturity
Silicon ImageTM
FPGA REVENUE
ASSP REVENUE
LIFETIME REVENUE
Product Life Cycle
Winning early… Combined Company …Defending longer
FPGA
Capitalize on innovator / early adopter revenue opportunities
+
ASSP
Capitalize on mainstream revenue opportunities
=
Combined Products
Capture revenue from a greater portion of the product lifecycle
77
6.4 Diversified Revenues
Lattice serves a range of end-markets, limiting idiosyncratic risk factors. However, over time, Lattice has been increasing its emphasis on the consumer market, which is the most rapidly growing end-market for semiconductor devices. The acquisition of a primarily consumer-focused Silicon Image accelerates Lattice’s growth in the consumer segment, while maintaining a balanced exposure to revenue streams from various end-markets and boosting licensing revenues.
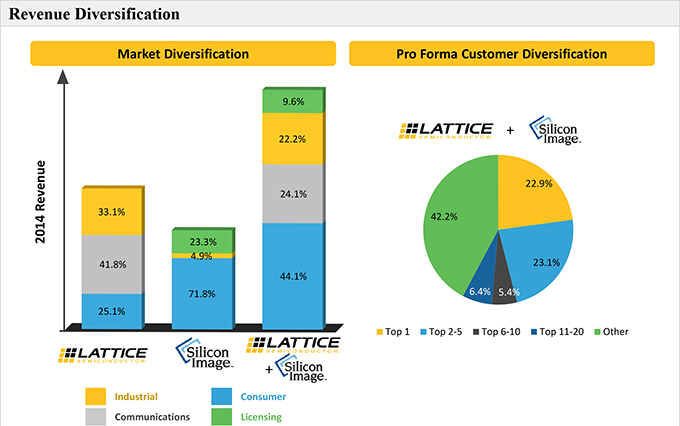
Revenue Diversification
Market Diversification
2014 Revenue
33.1% 41.8% 25.1% 23.3% 4.9% 71.8% 9.6% 22.2% 24.1% 44.1%
LATTICE
SEMICONDUCTOR
Silicon ImageTM
LATTICE
SEMICONDUCTOR
+ Silicon ImageTM
Industrial
Communications
Consumer
Licensing
Pro Forma Customer Diversification
LATTICE
SEMICONDUCTOR
+ Silicon ImageTM
42.2% 22.9% 23.1% 5.4% 6.4%
Top 1
Top 2-5
Top 6-10
Top 11-20
Other
78
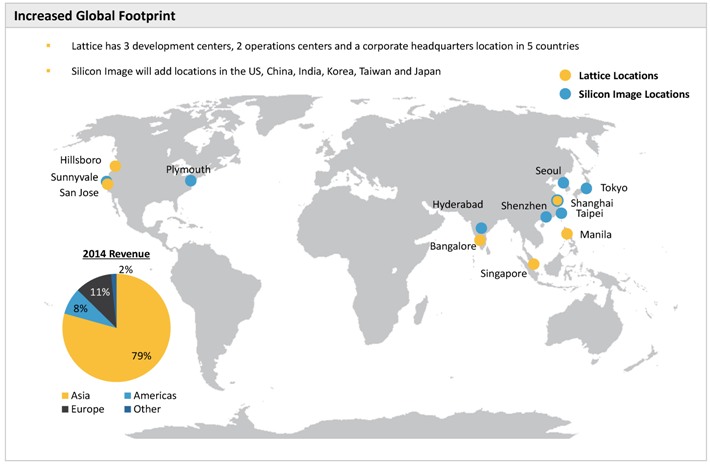
The combined company’s broad global reach extends from the United States and throughout Asia. Silicon Image has several locations globally, including in the United States, China, India, Korea, Taiwan and Japan.
Increased Global Footprint
Lattice has 3 development centers, 2 operations centers and a corporate headquarters location in 5 countries
Silicon Image will add locations in the US, China India Korea Taiwan and Japan
Lattice
Locations
Silicon Image Locations
Hillsboro
Sunnyvale
San Jose
Plymouth
Hyderabad Bangalore
Seoul
Shenzhen
Singapore
Tokyo
Shanghai
Taipei
Manila
2014 Revenue
2% 11% 8% 79%
Asia
Europe
Americas
Other
79
6.5 Strong Tier 1 Customer Relationships
The combined company’s customer base includes multiple large and well-respected OEMs across the consumer, industrial and communications end-markets. Lattice’s leadership in low-power connectivity solutions and Silicon Image’s widely-accepted IP standards have resulted in long-standing relationships with top OEMs. In addition, the combined company has a significantly more diversified customer base, driving substantially reduced customer concentration.
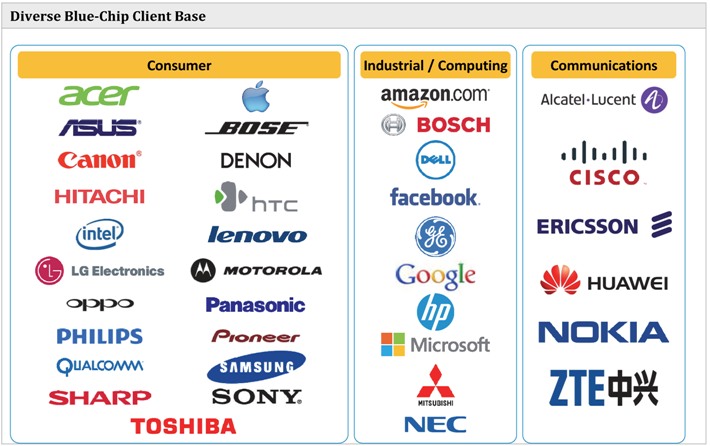
Divers Blue-Chip Client Base
Consumer acer ASUS
Canon HITACHI intel LG Electronics oppo PHILIPS QUALCOMM SHARP TOSHIBA BOSE DENON hTC lenovo M MOTOROLA Panasonic Pioneer SAMSUNG SONY
Industrial / Computing
amazon.com BOSCH DELL facebook ge Google hp Microsoft MITSUBISHI NEC
Communications Alcatel-Lucent CISCO ERICSSON HUAWEI NOKIA ZTE
80
6.6 Attractive Industry Fundamentals with Significant Barriers to Entry
The combined company is exposed to a number of favorable trends in the end-markets that it serves. Its serviceable addressable markets in the communications and industrial verticals are forecasted by IHS to grow at a CAGR of 29.7% and 12.1%, respectively, from 2014 to 2017. The combined company’s consumer segment is expected to continue to benefit from exposure to the tailwinds of the smartphone, tablet, and wearables markets which are expected by IDC to grow at 11%, 5%, and 78%, respectively, from 2013 to 2018. The combined company is well-positioned in its IP and product portfolio to capture the growth in wireless Internet-enabled devices.
The time and expertise required to develop an IP ecosystem and a relevant product offering is a key barrier to entry that separates the combined company’s market position versus those of competitors. As IP and ASSP products require industry standardization, the value proposition of the combined company increases with its scale and leadership, making the emergence of new competitors particularly difficult. The history of relationships with existing customers, many of whom have used Lattice and Silicon Image solutions for numerous previous generations of their products, further strengthens the combined company’s market position.
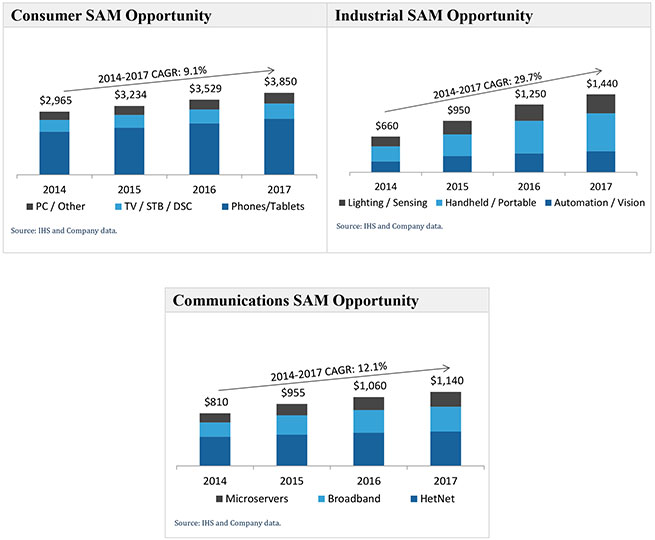
Consumer SAM Opportunity Industrial SAM Opportunity
2014-2017 CAGR: 9.1% 2014-2017 CAGR: 29.7%
$2,965 $3,234 $3,529 $3,850 $660
$950 $1,250 $1,440
2014 2015 2016 2017 2014 2015 2016 2017
PC / Other TV /
STB / DSC Phones/Tablets Lighting / Sensing Handheld / Portable Automation / Vision
Source: IHS and Company data. Source: IHS and Company data.
Communications SAM Opportunity
2014-2017 CAGR: 12.1%
$810 $955 $1,060 $1,140
2014 2015 2016 2017
Microservers Broadband HetNet
Source: IHS and Company data.
81
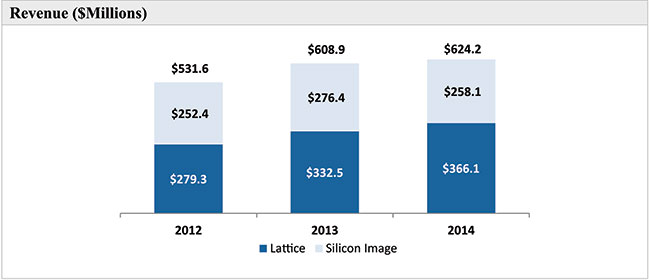
6.7 Low Leverage with High Free Cash Flow Generation
Revenue Performance
Combined Revenue has increased at an 8.4% CAGR from $531.6 million in FY2012 to $624.2 million in FY2014.
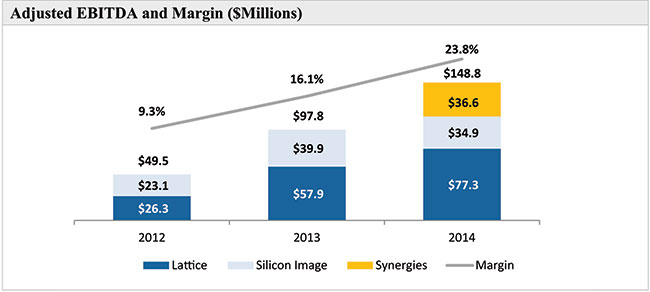
Adjusted EBITDA and Adjusted EBITDA Margin
Both Lattice and Silicon Image have announced various restructuring programs since 2012 to keep the margin structure efficient. This steadfast focus on cost management has led to a boost in Pro Forma Adjusted EBITDA margins, from 9.3% to 23.8% over the 2012 – 2014 timeframe. Adjusted EBITDA also grew at a CAGR of 50.6% from 2012 to 2014, exclusive of pro forma synergies.
Revenue ($Millions)
$531.6 $608.9 $624.2
$252.4 $276.4 $258.1
$279.3 $332.5 $366.1
2012 2013 2014
Lattice Silicon Image
Adjusted EBITDA and Margin ($Millions)
9.3% 16.1% 23.8% $148.8
$49.5 $97.8 $36.6
$23.1 $39.9 $34.9
$26.3 $57.9 $77.3
2012 2013 2014
Lattice Silicon Image Synergies Margin
82
Free Cash Flow and Capital Expenditure
Free cash flow for the combined company has grown from $27.0 million to $130.8 million from 2012 – 2014, representing a 120.1% CAGR. This cash generating profile has been generated through historically low capex requirements at approximately $20 million per year due to the fabless manufacturing models of both Lattice and Silicon Image.
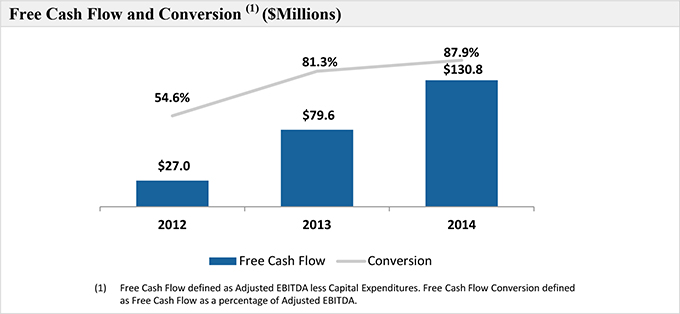
Free Cash Flow and Conversion (1) ($Millions)
54.6% 81.3% 87.9%
$27.0 $79.6 $130.8
2012 2013 2014
Free Cash Flow Conversion
(1) Free Cash Flow defined as Adjusted EBITDA less Capital Expenditures. Free Cash Flow Conversion defined as Free Cash Flow as a percentage of Adjusted EBITDA.
83
6.8 Significant Operational Synergies
Economies of scale for the combined entity drive meaningful synergies across multiple cost centers aggregating to approximately $36.6 million. Lattice expects to begin to achieve these synergies in the first year and be on a $36.6 million run-rate by the end of the first year. Management expects Sales & Marketing expenses to be reduced by approximately $4.3 million through greater visibility into customer requirements, increased relevance to distribution partners and customers, and various organizational synergies. Management expects Research & Development costs to benefit approximately $27.9 million from design reuse, centers of excellence, as well as various organizational synergies. In addition, Management expects General & Administrative costs to be reduced by approximately $4.4 million through improved business processes and organizational synergies. Finally, Management sees additional potential cost synergies due to higher volumes reducing average wafer costs, as well as reduced assembly and test costs.
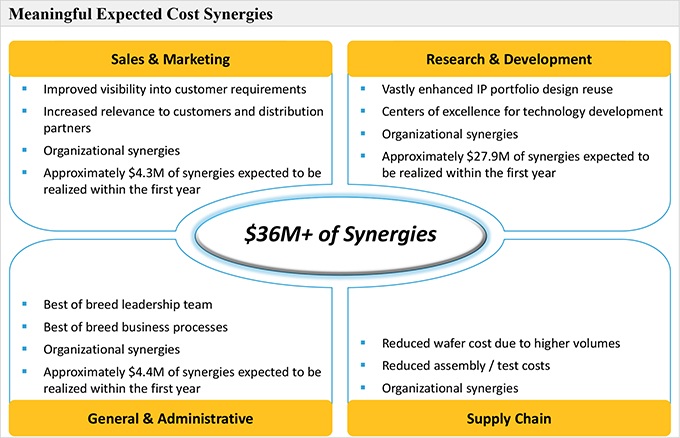
Meaningful Expected Cost Synergies
Sales &
Marketing
Improved visibility into customer requirements
Increased relevance
to customers and distribution partners
Organizational synergies
Approximately
$4.3M of synergies expected to be realized within the first year
Research & Development
Vastly enhances IP portfolio design reuse
Centers of excellence for technology development
Organizational synergies
Approximately $27.9M of synergies expected to be
realized within the first year
$36M+ of Synergies
Best of breed leadership
team
Best of breed business processes
Organizational synergies
Approximately $4.4M of synergies expected to be realized within the first year
General &
Administrative
Reduced water cost due to higher volumes
Reduces assembly /
test costs
Organizational synergies
Supply Chain
84
6.9 Multiple Growth Vectors
The combined company has multiple growth vectors that will drive revenue, earnings and cash flow growth, including:
| • | Driving existing products, IP and software solutions across the combined customer base. A complementary FPGA and ASSP product portfolio enables the combined company to serve customers’ full product lifecycle where each company, on a standalone basis, could not |
| • | Upgrading the current product portfolio to next-generation standards |
| • | Favorable secular trends with increasing demand for wireless connectivity solutions. The combined company operates as the forefront of Millimeter-Wave wireless connectivity through Snap, WiGig and backhaul products and technologies |
| • | Increasing demand for smartphones, tablets and wearables driving significant revenue expansion |
| • | Leveraging existing products into adjacent markets such as Internet of Things, medical and industrials |
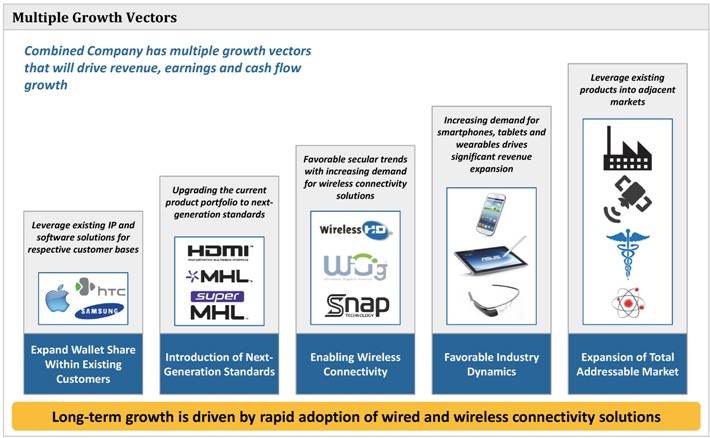
Multiple Growth Vectors
Combined Company has
multiple growth vectors that will drive revenue, earnings and cash flow growth
Leverage existing IP and software solutions for respective customers bases hTC
SAMSUNG
Expand Wallet Share Within Existing Customers
Upgrading the current
product portfolio to next-generation standards HDMI MHL super MHL
Introduction of Next-Generation Standards
Favorable secular trends with increasing demand for wireless connectivity solutions Wireless HD WiGig Snap TECHNOLOGY
Enabling Wireless Connectivity
Increasing demand for smartphones, tablets and wearables drives
significant revenue expansion
Favorable Industry Dynamics
Leverage existing
products into adjacent markets
Expansion of Total Addressable Market
Long-term growth is driven by rapid adoption of wired and wireless connectivity solutions
85
8.1 Lattice Historical Financial Summary
| ($ in millions) | 2010 | 2011 | 2012 | 2013 | 2014 | |||||||||||||||
| Total revenue |
$ | 297.8 | $ | 318.4 | $ | 279.3 | $ | 332.5 | $ | 366.1 | ||||||||||
| Costs and expenses |
||||||||||||||||||||
| Cost of products sold |
117.9 | 129.8 | 128.5 | 154.3 | 159.9 | |||||||||||||||
| Research and development |
60.3 | 71.9 | 77.6 | 81.0 | 88.1 | |||||||||||||||
| Selling, general and administrative |
64.4 | 68.8 | 72.3 | 67.1 | 73.5 | |||||||||||||||
| Amortization of intangible assets |
— | 0.5 | 4.2 | 3.0 | 2.9 | |||||||||||||||
| Restructuring expense |
0.0 | 6.1 | 6.0 | 0.4 | 0.0 | |||||||||||||||
|
|
|
|
|
|
|
|
|
|
|
|||||||||||
| Total costs and expenses |
242.6 | 277.1 | 288.6 | 305.7 | 324.5 | |||||||||||||||
|
|
|
|
|
|
|
|
|
|
|
|||||||||||
| Income from operations |
$ | 55.1 | $ | 41.3 | ($ | 9.4 | ) | $ | 26.8 | $ | 41.6 | |||||||||
| Other income (loss), net |
2.5 | 1.4 | 0.5 | (0.3 | ) | 1.3 | ||||||||||||||
|
|
|
|
|
|
|
|
|
|
|
|||||||||||
| Income before taxes |
$ | 57.6 | $ | 42.7 | ($ | 8.9 | ) | $ | 26.5 | $ | 42.9 | |||||||||
| Income tax expense (benefit) |
0.5 | (35.5 | ) | 20.7 | 4.2 | (5.6 | ) | |||||||||||||
|
|
|
|
|
|
|
|
|
|
|
|||||||||||
| Net income (loss) |
$ | 57.1 | $ | 78.2 | ($ | 29.6 | ) | $ | 22.3 | $ | 48.6 | |||||||||
8.2 Silicon Image Historical Financial Summary
| ($ in millions) | 2010 | 2011 | 2012 | 2013 | 2014 | |||||||||||||||
| Total revenue |
$ | 191.3 | $ | 221.0 | $ | 252.4 | $ | 276.4 | $ | 258.1 | ||||||||||
| Cost of revenue and operating expenses |
||||||||||||||||||||
| Cost of product revenue |
77.5 | 90.0 | 109.8 | 112.9 | 100.5 | |||||||||||||||
| Cost of licensing revenue |
0.3 | 0.8 | 0.6 | 0.9 | 0.0 | |||||||||||||||
| Research and development |
55.3 | 66.5 | 77.4 | 77.0 | 72.0 | |||||||||||||||
| Selling, general and administrative |
46.7 | 55.3 | 57.4 | 64.7 | 63.7 | |||||||||||||||
| Restructuring expense |
3.3 | 2.3 | 0.1 | 1.8 | 3.5 | |||||||||||||||
| Amortization and impairment of acq.-related intangible assets |
0.1 | 10.1 | 0.6 | 1.1 | 2.5 | |||||||||||||||
|
|
|
|
|
|
|
|
|
|
|
|||||||||||
| Total cost of revenue and operating expenses |
183.2 | 225.0 | 246.0 | 258.5 | 242.1 | |||||||||||||||
|
|
|
|
|
|
|
|
|
|
|
|||||||||||
| Income from operations |
$ | 8.2 | ($ | 4.0 | ) | $ | 6.4 | $ | 18.0 | $ | 15.9 | |||||||||
| Gain from sale of a privately held company investment |
— | — | — | — | 4.1 | |||||||||||||||
| Proceeds from legal settlement |
— | — | — | 1.3 | — | |||||||||||||||
| Other than temporary impair. of a privately-held company invest. |
— | — | (7.5 | ) | (1.5 | ) | — | |||||||||||||
| Interest income and other, net |
3.6 | 1.9 | 1.7 | 1.2 | 1.2 | |||||||||||||||
|
|
|
|
|
|
|
|
|
|
|
|||||||||||
| Income before taxes and equity in net loss of an unconsol. affil. |
$ | 11.8 | ($ | 2.1 | ) | $ | 0.6 | $ | 18.9 | $ | 21.2 | |||||||||
| Income tax expense (benefit) |
3.6 | 8.6 | 10.0 | 7.0 | (21.0 | ) | ||||||||||||||
| Equity in net loss of an unconsolidated affiliate |
— | 1.0 | 1.8 | 0.5 | 0.2 | |||||||||||||||
|
|
|
|
|
|
|
|
|
|
|
|||||||||||
| Net income (loss) |
$ | 8.2 | ($ | 11.6 | ) | ($ | 11.2 | ) | $ | 11.5 | $ | 42.1 | ||||||||
| Less: Net income (loss) attributable to noncontrolling interest |
— | — | — | — | (0.1 | ) | ||||||||||||||
| Net income (loss) attributable to common stockholders |
$ | 8.2 | ($ | 11.6 | ) | ($ | 11.2 | ) | $ | 11.5 | $ | 42.1 | ||||||||
90
8.3 Pro Forma Adjusted EBITDA Reconciliation
($ in millions)
| 2012 | 2013 | 2014 | ||||||||||||||||||||||||||||||||||
| Lattice | Silicon Image |
Combined | Lattice | Silicon Image |
Combined | Lattice | Silicon Image |
Combined | ||||||||||||||||||||||||||||
| Net Income |
($ | 29.6 | ) | ($ | 11.2 | ) | ($ | 40.8 | ) | $ | 22.3 | $ | 11.5 | $ | 33.8 | $ | 48.6 | $ | 42.1 | $ | 90.6 | |||||||||||||||
| Equity in net loss of an unconsolidated affiliate |
— | 1.8 | 1.8 | — | 0.5 | 0.5 | — | 0.2 | 0.2 | |||||||||||||||||||||||||||
| Income tax expense (benefit) |
20.7 | 10.0 | 30.7 | 4.2 | 7.0 | 11.1 | (5.6 | ) | (21.0 | ) | (26.6 | ) | ||||||||||||||||||||||||
| Interest and other expense (income) |
(0.5 | ) | (1.7 | ) | (2.2 | ) | 0.3 | (1.2 | ) | (0.9 | ) | (1.3 | ) | (1.2 | ) | (2.6 | ) | |||||||||||||||||||
| Other than temporary impairment of a privately-held company investment |
— | 7.5 | 7.5 | — | 1.5 | 1.5 | ||||||||||||||||||||||||||||||
| Proceeds from legal settlement |
— | — | — | — | (1.3 | ) | (1.3 | ) | ||||||||||||||||||||||||||||
| Gain from sale (A) |
— | — | — | — | — | — | — | (4.1 | ) | (4.1 | ) | |||||||||||||||||||||||||
|
|
|
|
|
|
|
|
|
|
|
|
|
|
|
|
|
|
|
|||||||||||||||||||
| Income from operations |
($ | 9.4 | ) | $ | 6.4 | ($ | 3.0 | ) | $ | 26.8 | $ | 18.0 | $ | 44.7 | $ | 41.6 | $ | 15.9 | $ | 57.5 | ||||||||||||||||
| Depreciation and amortization |
22.1 | 7.4 | 29.6 | 20.8 | 9.4 | 30.2 | 22.2 | 11.6 | 33.8 | |||||||||||||||||||||||||||
| Stock-based compensation (B) |
7.5 | 9.2 | 16.7 | 9.5 | 10.5 | 20.0 | 12.8 | 10.0 | 22.8 | |||||||||||||||||||||||||||
| Restructuring and severance expenses (C) |
6.0 | 0.1 | 6.1 | 0.8 | 2.1 | 2.9 | 0.6 | 3.8 | 4.5 | |||||||||||||||||||||||||||
| Restructuring estimate if implemented in Q1 2014 (D) |
— | — | — | — | — | — | — | 5.8 | 5.8 | |||||||||||||||||||||||||||
| Sales of infringement suit rights for non-core IP (E) |
— | — | — | — | — | — | — | (7.0 | ) | (7.0 | ) | |||||||||||||||||||||||||
| Royalty buyout (F) |
— | — | — | — | — | — | — | (4.5 | ) | (4.5 | ) | |||||||||||||||||||||||||
| Other adjustments |
— | — | — | — | — | — | — | (0.7 | ) | (0.7 | ) | |||||||||||||||||||||||||
| Adjusted EBITDA |
$ | 26.3 | $ | 23.1 | $ | 49.5 | $ | 57.9 | $ | 39.9 | $ | 97.8 | $ | 77.3 | $ | 34.9 | $ | 112.2 | ||||||||||||||||||
| Synergies (G) |
||||||||||||||||||||||||||||||||||||
| R&D |
27.9 | |||||||||||||||||||||||||||||||||||
| Operations / Sales |
4.3 | |||||||||||||||||||||||||||||||||||
| Administrative |
0.6 | |||||||||||||||||||||||||||||||||||
| Legal |
0.9 | |||||||||||||||||||||||||||||||||||
| Leases |
3.0 | |||||||||||||||||||||||||||||||||||
|
|
|
|||||||||||||||||||||||||||||||||||
| Total Synergies |
$ | 36.6 | ||||||||||||||||||||||||||||||||||
| Pro Forma Adjusted EBITDA |
$ | 26.3 | $ | 23.1 | $ | 49.5 | $ | 57.9 | $ | 39.9 | $ | 97.8 | $ | 77.3 | $ | 34.9 | $ | 148.8 | ||||||||||||||||||
| Capital Expenditures |
13.6 | 8.9 | 22.5 | 12.5 | 5.8 | 18.3 | 10.3 | 7.7 | 18.0 | |||||||||||||||||||||||||||
| Free Cash Flow(1) |
$ | 12.7 | $ | 14.3 | $ | 27.0 | $ | 45.4 | $ | 34.2 | $ | 79.6 | $ | 67.0 | 27.1 | $ | 130.8 | |||||||||||||||||||
| % of Pro Forma Adjusted EBITDA |
48.3 | % | 61.6 | % | 54.6 | % | 78.4 | % | 85.6 | % | 81.3 | % | 86.7 | % | 77.8 | % | 87.9 | % | ||||||||||||||||||
| (1) | Free Cash Flow defined as Adjusted EBITDA less Capital Expenditures. |
| A. | Gain from sale: Gain on Silicon Image’s minority interest shares in company acquired by a third party in July 2014 |
| B. | Stock-based compensation: Non-cash item |
| C. | Restructuring and severance expenses: One-time restructuring and severance expenses in period |
| D. | Restructuring estimate if implemented in Q1 2014: Expected cost savings due to restructuring announced in late 2014 based upon Lattice estimates; actual cost savings may vary |
| E. | Sales of infringement suit rights for non-Core IP: Silicon Image entered into agreements with a third-party patent aggregator to sell the rights to defend certain non-core patents owned by Silicon Image |
| F. | Royalty buyout: In September 2014, Silicon Image entered into a royalty prepayment and settlement agreement whereby a third party bought out certain royalty streams |
| G. | Synergies: |
[Redacted]
91