Attached files
| file | filename |
|---|---|
| EXCEL - IDEA: XBRL DOCUMENT - CONVERGYS CORP | Financial_Report.xls |
| EX-4.5 - EXHIBIT 4.5 - CONVERGYS CORP | cvg123114ex45.htm |
| EX-21 - EXHIBIT 21 - CONVERGYS CORP | cvg123114ex21.htm |
| EX-31.1 - EXHIBIT 31.1 - CONVERGYS CORP | cvg123114ex311.htm |
| EX-32.1 - EXHIBIT 32.1 - CONVERGYS CORP | cvg123114ex321.htm |
| EX-31.2 - EXHIBIT 31.2 - CONVERGYS CORP | cvg123114ex312.htm |
| EX-32.2 - EXHIBIT 32.2 - CONVERGYS CORP | cvg123114ex322.htm |
| EX-10.22 - EXHIBIT 10.22 - CONVERGYS CORP | cvg123114ex1022.htm |
| EX-23 - EXHIBIT 23 - CONVERGYS CORP | cvg12312014ex23.htm |
| EX-10.24 - EXHIBIT 10.24 - CONVERGYS CORP | cvg123114ex1024.htm |
| EX-24 - EXHIBIT 24 - CONVERGYS CORP | cvg12312014ex24.htm |
| EX-12 - EXHIBIT 12 - CONVERGYS CORP | cvg123114ex12.htm |
UNITED STATES
SECURITIES AND EXCHANGE COMMISSION
Washington, D.C. 20549
________________________________________________________________________
FORM 10-K
________________________________________________________________________
ANNUAL REPORT PURSUANT TO SECTION 13 OR 15(d) OF THE
SECURITIES EXCHANGE ACT OF 1934
For the fiscal year ended December 31, 2014
Commissions file number 1-14379
CONVERGYS CORPORATION
An Ohio | I.R.S. Employer |
Corporation | No. 31-1598292 |
201 East Fourth Street, Cincinnati, Ohio 45202
Telephone Number (513) 723-7000
__________________________________________________________________
Securities registered pursuant to Section 12(b) of the Act:
Title of each class | Name of each exchange on which registered | |
Common Shares (no par value) | New York Stock Exchange | |
Securities registered pursuant to Section 12(g) of the Act: None
_____________________________________________________________________
Indicate by check mark if the registrant is a well-known seasoned issuer, as defined in Rule 405 of the Securities Act. Yes X No
Indicate by check mark if the registrant is not required to file reports pursuant to Section 13 or Section 15(d) of the Act.
Yes No X
Indicate by check mark whether the registrant (1) has filed all reports required to be filed by Section 13 or 15(d) of the Securities Exchange Act of 1934 during the preceding 12 months (or for such shorter period that the registrant was required to file such reports), and (2) has been subject to such filing requirements for the past 90 days. Yes X No
Indicate by check mark whether the registrant has submitted electronically and posted on its corporate Website, if any, every Interactive Data File required to be submitted and posted pursuant to Rule 405 of Regulation S-T (Section 232.405 of this chapter) during the preceding 12 months (or for such shorter period that the registrant was required to submit and post such files). Yes X No
Indicate by check mark if disclosure of delinquent filers pursuant to Item 405 of Regulation S-K (Section 229.405 of this chapter) is not contained herein, and will not be contained, to the best of registrant’s knowledge, in definitive proxy or information statements incorporated by reference in Part III of this Form 10-K or any amendment to this Form 10-K. X
Indicate by check mark whether the registrant is a large accelerated filer, an accelerated filer, a non-accelerated filer or a smaller reporting company. See definitions of “large accelerated filer,” “accelerated filer” and “smaller reporting company” in Rule 12b-2 of the Exchange Act.
Large accelerated filer X Accelerated filer Non-accelerated filer Smaller reporting company
Indicate by check mark whether the registrant is a shell company (as defined in Rule 12b-2 of the Exchange Act).
Yes No X
The aggregate market value of the voting shares held by non-affiliates of the registrant was $2,167,660,455, computed by reference to the closing sale price of the stock on the New York Stock Exchange on June 30, 2014, the last business day of the registrant’s most recently completed second fiscal quarter.
At January 31, 2015, there were 99,043,853 common shares outstanding, excluding amounts held in treasury of 90,750,790.
DOCUMENTS INCORPORATED BY REFERENCE
Portions of the registrant’s definitive proxy statement for the 2014 Annual Meeting of Shareholders to be held on April 22, 2015 are incorporated by reference into Part III of this report.
TABLE OF CONTENTS
PART I | Page | |
Item 1. | ||
Item 1A. | ||
Item 1B. | ||
Item 2. | ||
Item 3. | ||
Item 4. | ||
Item 4A. | ||
PART II | ||
Item 5. | ||
Item 6. | ||
Item 7. | ||
Item 7A. | ||
Item 8. | ||
Item 9. | ||
Item 9A. | ||
Item 9B. | ||
PART III | ||
Item 10. | ||
Item 11. | ||
Item 12. | ||
Item 13. | ||
Item 14. | ||
PART IV | ||
Item 15. | ||
Convergys Corporation 2014 Annual Report 1
SAFE HARBOR STATEMENT AND PART I, ITEM 1. BUSINESS
Private Securities
Litigation Reform Act of 1995
Safe Harbor Cautionary Statement
This report and the documents incorporated by reference contain “forward-looking” statements, as defined in the Private Securities Litigation Reform Act of 1995, that are based on current expectations, estimates and projections. Statements that are not historical facts, including statements about the beliefs and expectations of Convergys Corporation (the Company or Convergys), are forward-looking statements and will contain words such as “believes,” “expects,” “intends,” “could,” “should,” “will,” “plans,” “anticipates” and other similar words. These statements discuss projections and expectations; and, therefore, actual results may differ materially. You are cautioned not to place undue reliance on these forward-looking statements, which speak only as of the date on which they were made. The Company has no current intention to update any forward-looking statements, whether as a result of new information, future events or otherwise.
Important factors that may affect these forward-looking statements include, but are not limited to: the behavior of financial markets including fluctuations in interest or exchange rates; continued volatility and deterioration of the capital markets; the impact of regulation and regulatory, investigative, and legal actions; strategic actions, including acquisitions and dispositions; future integration of acquired businesses; future financial performance of major industries which we serve, including global communications, technology and financial services industries; the loss of a significant client or significant business from a client; difficulties in completing a contract or implementing its provisions; the effects of natural events, such as floods and earthquakes; and numerous other matters of national, regional, and global scale including those of the political, economic, business, and competitive nature. These uncertainties may cause our actual future results to be materially different than those expressed in our forward-looking statements. The “Risk Factors” set forth in Part I, Item 1A of this report could also cause actual results to differ materially from the forward-looking statements.
PART I
ITEM 1. BUSINESS
OVERVIEW
Convergys Corporation (we, the Company or Convergys) is a global leader in customer management, focused on bringing value to clients through every customer interaction. As the second-largest global provider in its industry, Convergys has a history of commitment and dedication to excellence in serving many of the world's largest brands. The Company's business model allows us to deliver consistent, quality service, at the scale and in the geographies that meet our clients' business needs. The Company leverages its geographic footprint and comprehensive capabilities to help leading companies create quality customer experiences across multiple interaction channels, such as agent, chat, email and interactive voice response, while increasing revenue and reducing their cost to serve. Convergys is positioned as a leader in our market and is able to invest in the services, technology, and analytics that matter to our clients and their customers.
Acquisition of Stream
On March 3, 2014, Convergys completed its acquisition of SGS Holdings, Inc. (Stream), a global leader in customer management, providing technical support, customer care and sales, for Fortune 1000 companies. This acquisition expanded the Company's geographic footprint and capabilities, adding approximately 40,000 employees in 22 countries. Combined, Convergys now has 125,000 employees working out of more than 150 locations in 31 countries, interacting with our clients' customers in 47 languages. Stream's complementary client portfolio also diversified Convergys' client base through the addition of leading technology, communications and other clients. The acquired Stream operations contributed revenue of $834.8 during 2014. Our acquisition of Stream is more fully described in Note 3 of the Notes to Consolidated Financial Statements.
OUR BUSINESS
Convergys is a global leader in customer management. Our talented and dedicated teams serve leading brands in industries such as communications and media, technology, financial services, retail and healthcare. Convergys strives to deliver world-class customer service each and every day. We understand that our clients have individual business needs and that customer service in an increasingly multi-channel environment can be complicated. Our role is to solve the complexities and deliver unparalleled customer experiences on behalf of our clients.
Convergys Corporation 2014 Annual Report 2
Our clients benefit from our worldwide workforce located in key geographies throughout the world, including the United States, Canada, the Philippines, Malaysia, India, China, Indonesia, Costa Rica, Colombia, Dominican Republic, El Salvador, Nicaragua, Honduras, Australia, the U.K., France, Tunisia, Egypt, Bulgaria and other various countries throughout the EMEA (Europe, the Middle East and Africa) region. The Stream acquisition expanded the Company's presence in North America, Latin America, and the Philippines. Most notably, the acquisition increased Convergys' presence in EMEA by adding Stream's sites across Eastern and Western Europe, as well as multiple sites in North Africa. As a result of this combination, Convergys has a more diversified client base and an enhanced ability to offer a wider range of customer transactions in a more cost effective manner from multiple geographies, at scale.
Our 30+ years of experience and unique mix of agents, analytics and technology allow us to expertly guide our clients as they balance their priorities to grow revenue, improve customer satisfaction, and reduce costs. Our agents provide a full range of contact center services delivered via phone, email and chat. We provide solutions across the customer lifecycle, including:
• | Revenue Generation |
• | Customer Service |
• | Technical Support |
• | Customer Retention |
• | Collections |
Our innovative omni-channel contact center technology solutions include:
• | Multichannel Interaction Solutions (Intelligent Self-Service, Voice, Chat, Email, and Knowledge Management) |
• | Cross-Channel Integration Framework |
• | Real-Time Decisioning Engine |
• | Intelligent Notifications |
• | Campaign Management |
• | Personalized Care |
• | Personalized Selling |
• | Agent Productivity |
• | Retention |
We have a dedicated team of professionals to deliver data-driven insights to improve the customer experience through analytics and consulting solutions, including:
• | Post-Contact Surveys |
• | Relational Loyalty Research |
• | Segmentation and Profiling |
• | Repeat Call Analysis |
• | Agent Path Analysis |
• | Customer Interaction Assessment |
• | Chat Optimization |
• | Integrated Contact Center Analytics |
The geographic information included in Item 8, Note 17 of the Notes to Consolidated Financial Statements, is incorporated by reference in partial response to this Item 1.
STRATEGY
Convergys' strategy is to build on our leading position in a large global market by investing in what matters most to our clients and leveraging a strong financial position to drive sustainable growth and value creation.
Build on a Leading Market Position to Grow With Loyal and Expanding Client Base
Convergys is a leader in the global customer management market. The addition of Stream's complementary client base, geographic footprint and service capabilities made Convergys the second-largest customer management service provider in the world. The Company's primary focus is on growth with multinational corporations and other large companies in the communications and media, financial services, technology, healthcare and other vertical markets. Convergys will continue to compete for additional
Convergys Corporation 2014 Annual Report 3
market share in the global customer management market by expanding with existing clients and further penetrating under-served verticals through pursuit of new clients.
Capitalize on Industry Trends by Investing in Quality, Capability and Clients
Several trends play to what we believe to be our strengths, including increasing call complexity, full life-cycle services, vendor consolidation and global delivery. To capitalize on these trends, the Company invests in a combination of global quality delivery, comprehensive solutions, and close client engagement.
Increasing Call Complexity
As technology becomes more pervasive, customer calls to troubleshoot this technology become increasingly complex. Convergys invests in its global operating model to ensure the right talent is trained and supported by the right tools to handle these complex calls in a quality manner, at scale, regardless of location.
Full Lifecycle Services
Client strategies for customer service change rapidly. Increasingly clients want to work with partners that offer a breadth and depth of capabilities and the flexibility to make rapid adjustments to the services they provide to their customers. To meet these changing client needs, Convergys invests in solutions consisting of services, technology and analytics that support the full life-cycle of contact types including customer acquisition, service, sales, retention and collections.
Vendor Consolidation
Increasingly, clients seek to drive efficiencies and a consistent customer experience by concentrating outsourced operations with a smaller number of strategic partners. Convergys invests in account management to ensure close client engagement in order to better understand unique client needs, consistently deliver the right mix of solutions and quickly ramp programs when consolidating volume from other vendors.
Global Delivery
Clients demand contact center services from multiple geographies. Convergys invests in global capacity to provide the right services, including language support to better serve customers around the world. This means offering the right services in the right geographies to ultimately drive the quality delivery and value our clients demand.
Leverage Financial Strength to Invest in Strategic Growth, Return Capital to Investors
Convergys historically has demonstrated an ability to generate strong operating cash flow, which allows it to both invest in strategic growth and return capital to investors. The Company has followed and expects to continue to follow a disciplined capital deployment strategy through selective pursuit of acquisitions, focusing on diversity of clients, capabilities and countries and the return of capital to investors through share repurchases and a quarterly dividend.
Additional Company Information
Convergys was formed as an Ohio corporation in 1998. The Company maintains an internet website at www.convergys.com. Information about the Company is available on the website, free of charge, including the annual report filed on Form 10-K, quarterly reports on Form 10-Q, current reports on Form 8-K, and amendments to those reports filed or furnished pursuant to Section 13(a) or 15(d) of the Securities Exchange Act of 1934, as soon as reasonably practicable after we electronically file such material with, or furnish it to, the Securities and Exchange Commission (SEC). The Company’s website and the information contained therein are not considered as being incorporated into this Annual Report. You may read and copy any materials the Company files with the SEC at the SEC’s public reference room at 100 F Street NE, Washington, DC 20549. The public may obtain information about the operation of the public reference room by calling the SEC at 1-800-SEC-0330. The SEC also maintains an internet site that contains reports, proxy and information statements, and other information regarding issuers that file electronically with the SEC. The SEC's website is www.sec.gov.
The Company has a Code of Business Conduct that applies to all employees as well as our Board of Directors; a Financial Code of Ethics that applies to our principal executive officer, principal financial officer, principal accounting officer and certain other management and senior employees; and Governance Principles for our Board of Directors.
Convergys Corporation 2014 Annual Report 4
The Code of Business Conduct, Financial Code of Ethics and Governance Principles, as well as the charters for the Audit Committee, Compensation and Benefits Committee and Governance and Nominating Committee of our Board of Directors, are posted on our website at www.convergys.com. The Company will post on our website any amendments to, or waivers of, the Code of Business Conduct and Financial Code of Ethics. Copies of these documents also will be provided free of charge upon written request directed to Investor Relations, Convergys Corporation, 201 East Fourth Street, Cincinnati, Ohio 45202.
CLIENTS
We derive significant revenues from AT&T Inc. (AT&T), our largest client. Revenues from AT&T were 15.3%, 20.9% and 23.1% of our consolidated revenues for 2014, 2013 and 2012, respectively. Revenues from DIRECTV Group, Inc. (DIRECTV) and Comcast Corporation (Comcast) each accounted for less than 10% of revenue during 2014. Revenues from DIRECTV were 12.5% and 12.3% of our consolidated revenues for 2013 and 2012, respectively, while revenues from Comcast were 12.4% for both 2013 and 2012.
We focus on developing long-term, strategic relationships with large companies in customer-intensive industries. We focus on these types of clients because of the complexity of services required, the anticipated growth of their market segments and their increasing need for more cost-effective customer management services.
OPERATIONS
We operate over 150 contact centers averaging approximately 65,000 square feet per center. We have approximately 89,900 production workstations and provide service 24 hours a day, 365 days a year. Our workforce is located in various parts of the world including the United States, Canada, the Philippines, Malaysia, India, China, Indonesia, Costa Rica, Colombia, Dominican Republic, El Salvador, Nicaragua, Honduras, Australia, the U.K., France, Tunisia, Egypt, Bulgaria and other various countries throughout the EMEA region. Our global operating model seeks to deliver a consistent customer experience regardless of where the service is provided. New contact centers are established to accommodate anticipated growth in business or in response to a specific customer need.
Our contact centers employ a broad range of technology including digital switching, intelligent call routing and tracking, proprietary workforce management systems, case management tools, proprietary software systems, computer telephony integration, interactive voice response, advanced speech recognition, web-based tools and relational database management systems. This technology enables us to improve our call, web and e-mail handling and personnel scheduling, thereby increasing our efficiency and enhancing the quality of the services we deliver to our clients and their customers. With this technology, we are able to respond to changes in client call volumes and move call volume traffic based on agent availability. Additionally, we use this technology to collect information concerning the contacts, including number, response time, duration and results of the contact. This information is reported to the client on a periodic basis for purposes of monitoring quality of service and accuracy of the related billing.
We operate two primary data centers, one in Orlando, Florida, and the other in Cincinnati, Ohio, comprising, in total, approximately 150,000 square feet of space. Our technologically advanced data centers provide 24 hours a day, 365 days a year availability (with redundant power and communication feeds and emergency power back-up) and are designed to withstand most natural disasters.
The capacity of our data center and contact center operations, coupled with the scalability of our customer management solutions, enable us to meet initial and ongoing needs of large-scale and rapidly growing companies and government entities. By employing the scale and efficiencies of common application platforms, we are able to provide client-specific enhancements and modifications without incurring many of the costs of a full custom application. This allows us to be in a position to be a value-added provider of customer support products and services.
TECHNOLOGY, RESEARCH AND DEVELOPMENT
We will continue to emphasize the design, development and deployment of scalable customer management solutions. Our success depends, in part, on our advanced technology used in the delivery of services to clients. As a result, we continue to invest in the enhancement and development of our contact center technology.
Our intellectual property consists primarily of business methods and software systems. To protect our proprietary rights, we rely primarily on a combination of U.S. and foreign copyright, trade secret and trademark laws; confidentiality agreements with employees and third parties and protective contractual provisions such as those contained in licenses and other agreements with consultants, suppliers, strategic partners and clients.
Convergys Corporation 2014 Annual Report 5
We own 162 patents which protect certain technology and business methods that we use both to manage our internal systems and processes effectively and give us competitive advantages in developing innovative technologies to provide customer management services to our clients. The first of these patents was issued in October 1996, while the most recent patent was granted December 23, 2014. These patents generally have a life of 20 years. Additional applications for U.S. patents currently are pending.
Our name and logo are protected by their historic use and by trademarks and service marks that are registered or pending in the U.S. Patent and Trademark Office and under the laws of more than 72 foreign countries.
EMPLOYEES
As of December 31, 2014, we employed approximately 125,000 employees in over 150 locations across the globe and in our work-at-home environment. Our clients benefit from our worldwide workforce located in the United States, Australia, Brazil, Bulgaria, Canada, China, Colombia, Costa Rica, Dominican Republic, Egypt, El Salvador, France, Germany, Honduras, India, Indonesia, Ireland, Italy, Malaysia, the Netherlands, Nicaragua, the Philippines, Poland, Singapore, Spain, South Africa, Sweden, Tunisia, the United Arab Emirates and the United Kingdom.
COMPETITION
The market in which we operate is competitive. Our competitors include other customer management companies, such as Atento (ATTO), SITEL Corp., Sykes Enterprises Inc. (SYKE), Teleperformance (RCF) and TeleTech Holdings Inc. (TTEC). In addition, niche providers or new entrants can enter the market by developing new systems or services that could impact our business.
ITEM 1A. RISK FACTORS
General economic and market conditions may adversely affect our business, results of operations and financial condition.
Our results of operations are affected directly by the level of business activity of our clients, which in turn is affected by the level of economic activity in the industries and markets that they serve. Future economic slowdowns in some markets, particularly in the United States, may cause reductions in spending by our clients, which may result in reductions in the growth of new business as well as reductions in existing business. There can be no assurance that the effects of such slowdowns will not adversely impact our results of operations and financial condition.
If our clients are not successful, or the trend towards outsourcing does not continue, the amount of business that our clients outsource and the prices that they are willing to pay for such services may diminish and could adversely affect our business.
Our revenues depend on the success of our clients. If our clients or their specific programs are not successful, the amount of business that they outsource may be diminished. There can be no assurance that the level of revenues generated by such contracts will meet expectations. A reduction in the amount of business we receive from our clients could result in stranded capacity and costs. In addition, we may face pricing pressure from clients, which could negatively affect our operating results.
Growth of our revenues depends, in large part, on the trend toward outsourcing. Outsourcing involves companies contracting with a third party, such as Convergys, to provide customer management services rather than performing such services in-house. There can be no assurance that this trend will continue, as organizations may elect to perform such services in-house. A significant change in this trend could have a material adverse effect on our financial condition and results of operations.
A large portion of our revenue is generated from a limited number of clients, and the loss of significant work from one or more of our clients could adversely affect our business.
Our three largest clients, as discussed under the section above titled “Clients,” collectively represented 31.4% of our revenues for 2014. These clients are all in the communications and media industries, which are experiencing consolidation. While we typically have multiple work orders and/or contracts with our largest customers which would not all terminate at the same time, the loss of one or more of the larger work orders or contracts with one of our largest clients could adversely affect our business, results of operations and financial condition if the lost revenues were not replaced with profitable revenues from that client or other clients.
Our business is substantially dependent on the condition of the global communications industry.
Convergys Corporation 2014 Annual Report 6
Approximately 55% of our revenue in 2014 was received from customers operating in the global communications industry. The global communications industry in the past has experienced significant fluctuations in growth rates and capital investment, and the ability to predict future performance in this industry is challenging. Our revenues and earnings could be adversely affected by general weakness or a slowdown in the communications industry.
Our failure to successfully acquire and integrate businesses could cause our business to suffer.
We have made, and in the future may make, acquisitions of or investments in companies, technologies or products in existing, related or new markets. For example, our 2014 acquisition of Stream was significant due to the size and complexity of Stream's business. Business combinations, acquisitions and investments , such as the Stream acquisition, involve numerous risks that vary depending on their scale and nature, including risks associated with:
• | diversion of management's attention from other operational matters; |
• | the failure of acquired businesses to meet or exceed expected returns; |
• | ineffective or underestimated costs related to, integration of operations, systems, technologies, or employees, which can affect the ability to realize anticipated synergies or other benefits and/or result in business interruptions and deterioration in our employee and customer relationships; |
• | failure to attract, retain and motivate key employees; |
• | the potential impact of the announcement or consummation of a proposed transaction on relationships with third parties; |
• | potential changes in our credit rating, which could adversely impact the Company's access to and cost of capital; |
• | reductions in cash balances and/or increase in debt obligations to finance activities associated with a transaction, thereby reducing the availability of cash flow for general corporate or other purposes; |
• | exposure to new operational risks, rules, regulations, worker expectations, customs and practices to the extent acquired businesses are located in regions where we have not historically conducted business; |
• | challenges associated with managing new, more diverse and more widespread operations, projects and people, and providing services to new industries; |
• | inadequacy or ineffectiveness of an acquired company's internal financial controls, disclosure controls and procedures, anti-corruption, human resource, or other policies or practices; |
• | unknown, underestimated and/or undisclosed commitments or liabilities; |
• | inappropriate scale of acquired entities' critical resources or facilities for business needs; and |
• | inability to realize anticipated growth opportunities, including but not limited to, the potential effects of reductions in volume from any clients determining that they have too much vendor exposure to the Company following the acquisition. |
The occurrence of any of these risks could have a material adverse effect on our business, results of operations, financial condition or cash flows, particularly in the case of a larger acquisition, such as the Stream acquisition, or several concurrent acquisitions.
Cyber-attacks as well as improper disclosure or control of personal information could result in liability and harm our reputation, which could adversely affect our business.
Our business is heavily dependent upon information technology networks and systems. Internal or external attacks on any of those could disrupt the normal operations of our call centers and impede our ability to provide critical services to our clients, thereby subjecting us to liability under our contracts. Additionally, our business involves the use, storage and transmission of information about our employees, our clients and customers of our clients. If any person, including any of our employees, negligently disregards or intentionally breaches our established controls with respect to such data or otherwise mismanages or misappropriates that data, we could be subject to monetary damages, fines and/or criminal prosecution. Unauthorized disclosure of sensitive or confidential client or customer data, whether through system failure, employee negligence, fraud or misappropriation, along with unauthorized access to or through our information systems or those we develop for clients, whether by our employees or third parties, could result in negative publicity, loss of clients, legal liability and damage to our reputation, business, results of operations and financial condition. While we take measures to protect the security of, and unauthorized access to our systems, as well as the privacy of personal and proprietary information, it is possible that our security controls over our systems, as well as other security practices we follow, may not prevent the improper access to or disclosure of personally identifiable or proprietary information. Further, data privacy is subject to frequently changing rules and regulations, which sometimes conflict among the various jurisdictions and countries in which we provide services. Our failure to adhere to or successfully implement processes in response to changing regulatory requirements in this area could result in legal liability or impairment to our reputation in the marketplace, which could have a material adverse effect on our business, financial condition and results of operations.
The markets in which we operate include a large number of service providers and are highly competitive.
Convergys Corporation 2014 Annual Report 7
Many of our competitors are expanding the services they offer in an attempt to gain additional business. In addition, new competitors, alliances among competitors or mergers could result in significant market share gain by our competitors. Some of our competitors may adopt more aggressive pricing policies or provide services that gain greater market acceptance than the services that we offer or develop. Large and well-capitalized competitors may be able to better respond to the need for technological changes faster, price their services more aggressively, compete for skilled professionals, finance acquisitions, fund internal growth and compete for market share. Our customers routinely negotiate for better pricing, and in order to respond to increased competition and pricing pressure, we may be required to lower our pricing, which would have an adverse effect on our revenues and profit margin.
Interruption of our data centers and contact centers could have a materially adverse effect on our business.
In the event that we experience a temporary or permanent interruption at one or more of our data or contact centers, through natural disaster, casualty, operating malfunction, cyber attack, sabotage or other causes, we may be unable to provide the data services we are contractually obligated to deliver. This could result in us being required to pay contractual damages to some clients or to allow some clients to terminate or renegotiate their contracts. Notwithstanding disaster recovery and business continuity plans and precautions instituted to protect our clients and us from events that could interrupt delivery of services, there is no guarantee that such interruptions would not result in a prolonged interruption in our ability to provide support services to our clients or that such precautions would adequately compensate us for any losses we may incur as a result of such interruptions.
Natural events, war, terrorist attacks, other civil disturbances and epidemics could disrupt our operations or lead to economic weakness in the countries in which we operate, resulting in a decrease of our revenues, earnings and cash flow.
Natural events (such as floods and earthquakes), war, terrorist attacks and epidemics of contagious illness could disrupt our operations in the U.S. and abroad and could lead to economic weakness in the countries in which they occur. We have substantial operations in countries, most notably the Philippines, that have been subject to severe natural events, such as earthquakes and floods, in the recent past. Such disruptions could cause service interruptions or reduce the quality level of the services that we provide, resulting in a reduction of our revenues, earnings and cash flow and the payment of contractual penalties to our customers. These events may also cause our clients to reconsider their use of our services.
Our ability to deliver our services is at risk if the technology and network equipment that we rely upon is not maintained or upgraded in a timely manner.
Technology is a critical foundation in our service delivery. We utilize and deploy internally developed and third party software solutions across various hardware environments. We operate an extensive internal voice and data network that links our global sites together in a multi-hub model that enables the rerouting of voice and data across the network. Also, we rely on multiple public communication channels for connectivity to our clients. Our clients are highly dependent upon the high availability and uncompromised security of our systems. These systems are subject to the risk of an extended interruption or outage due to many factors, such as system failures, acts of nature and attacks from third parties. Accordingly, maintenance of and investment in these foundational components are critical to our success. If the reliability of our technology or network operations falls below required service levels, or a systemic fault affects the organization broadly, we may be obligated to pay performance penalties to our customers, and our business from existing and potential clients may be jeopardized and cause our revenue and cash flow to decrease.
Our revenue and earnings are affected by foreign currency exchange rate fluctuations.
While most of our contracts are priced in U.S. Dollars, we recognize a substantial amount of revenue under contracts that are denominated in Australian Dollars, British Pounds and Euros. A significant increase in the value of the U.S. Dollar relative to these currencies may have a material adverse impact on the value of those revenues when translated to U.S. Dollars.
Additionally, our business serves an increasing number of its U.S.-based clients using contact center capacity outside of the U.S., most notably in the Philippines, India, Latin America, Canada and other countries within the EMEA region. Although the contracts with U.S.-based clients are typically priced in U.S. Dollars, a substantial portion of the costs incurred by Convergys to provide services under these contracts are denominated in Philippine Pesos, Indian Rupees, Canadian Dollars, Colombian Pesos, Egyptian Pounds, Costa Rican Colon, Honduran Lempira, Nicaraguan Cordoba and Dominican Pesos, which represents a foreign exchange exposure to the Company. We enter into forward exchange contracts in certain currencies to limit potential foreign currency exposure. A significant decrease in the value of the U.S. Dollar relative to these currencies may have a material adverse impact on the operating expenses of these contact centers when translated into U.S. Dollars. It is intended that an increase in operating expenses will be partially offset by gains realized through the settlement of the hedged instruments. As the derivative instruments that limit our potential foreign currency exposures are entered into over a period of several years, the overall impact to earnings will be determined by both the timing of the derivative instruments and the movement of the U.S. Dollar relative to other currencies.
Convergys Corporation 2014 Annual Report 8
The cash we hold and our external foreign exchange contracts may be subject to counterparty credit risk.
While we monitor the creditworthiness of the institutions holding our cash, a global economic crisis or credit crisis could weaken the creditworthiness of financial institutions. If one or more of the institutions holding our cash were to experience cash flow problems or were to become subject to insolvency proceedings, we may not be able to recover some or all of our deposited cash. In addition, the counterparties to our hedge transactions are financial institutions or affiliates of financial institutions, and we are subject to risks that these counterparties become insolvent and fail to perform their financial obligations under these hedge transactions. Our hedging exposure to counterparty credit risk is not secured by any collateral.
We may not be able to repatriate to the U.S. cash held in foreign accounts without paying taxes.
As of December 31, 2014, approximately 64% of our cash and short term investments balance of $211.9 was held in accounts outside of the United States, most of which would be subject to additional taxes if repatriated to the United States or could be subject to tax if certain changes are made to tax laws in the United States.
We may not be able to predict our future tax liabilities. If we become subject to increased levels of taxation or if tax contingencies are resolved adversely, our results of operations and financial condition could be adversely affected.
Due to the international nature of our operations, we are subject to the complex and varying tax laws and rules of several foreign jurisdictions. We may not be able to predict the amount of future tax liabilities to which we may become subject due to some of these complexities if our positions are challenged by local tax authorities. Any increase in the amount of taxation incurred as a result of challenges to our tax filing positions or due to legislative or regulatory changes could result in a material adverse effect on our business, results of operations and financial condition. We are subject to tax audits, including issues related to transfer pricing, in the United States and other jurisdictions. We have material tax-related contingent liabilities that are difficult to predict or quantify. While we believe that our current tax provisions are reasonable and appropriate, we cannot be assured that these items will be settled for the amounts accrued or that additional exposures will not be identified in the future or that additional tax reserves will not be provided for any such exposures.
Our results of operations could be adversely affected by litigation and other commitments and contingencies.
The Company faces risks arising from various unasserted and asserted litigation matters, including, but not limited to, commercial, tax and patent infringement claims. Unfavorable outcomes in pending litigation, or in future litigation, could negatively affect us.
In the ordinary course of business, we may make certain commitments, including representations, warranties and indemnities relating to current and past operations and divested businesses, and issue guarantees of third party obligations. The amounts of such commitments can only be estimated, and the actual amounts may differ materially from our estimates.
If we were required to make payments as a result of any of these matters and they exceed the amounts accrued, this could adversely affect our business, results of operations and financial condition.
We are susceptible to business and political risks from international operations that could result in reduced revenues or earnings.
We operate a global business and have facilities located throughout North and South America, EMEA and the Asia-Pacific region, including China. In addition, as North American companies require additional off-shore customer management outsourcing capacity, we expect to continue international expansion through start-up operations and acquisitions. Expansion of our existing international operations and entry into additional countries will require management attention and financial resources. There are certain risks inherent in conducting business internationally including: exposure to currency fluctuations, longer payment cycles, greater difficulties in accounts receivable collection, difficulties in complying with a variety of laws in these jurisdictions, changes in legal or regulatory requirements, difficulties in staffing and managing foreign operations, inflation, political instability, compliance with anti-bribery and anti-corruption legislation and potentially adverse tax consequences. To the extent that we are adversely affected by these risks, our business could be adversely affected and our revenues and/or earnings could be reduced.
Our business is subject to many regulatory requirements, and current or future regulation could significantly increase our cost of doing business.
Our business is subject to many laws and regulatory requirements in the United States and the foreign countries in which we operate, covering such matters as labor relations, health care requirements, trade restrictions, tariffs, taxation, sanctions, data
Convergys Corporation 2014 Annual Report 9
privacy, consumer protection, internal and disclosure control obligations, governmental affairs and immigration. In the U.S., as well as several of the other countries in which we operate, some of our services must comply with various laws and regulations regarding the method and timing of placing outbound telephone calls and the recording or monitoring of telephone calls. Many of these regulations, including those related to data privacy, are frequently changing and sometimes conflict among the various jurisdictions and countries in which we provide services. Violations of these laws and regulations could result in liability for damages, fines, criminal prosecution, unfavorable publicity and restrictions on our ability to operate. Our failure to adhere to or successfully implement processes in response to changing regulatory requirements in this area could result in legal liability or impairment to our reputation in the marketplace, which could have a material adverse effect on our business, results of operations and financial condition.
Because a substantial portion of our operating costs consist of labor costs, changes in governmental regulations (particularly in the foreign jurisdictions in which we operate) relating to wages, healthcare and healthcare reform and other benefits or employment taxes could have a material adverse effect on our business, results of operations or financial condition.
In addition, there has been political discussion and debate related to worldwide competitive sourcing, labor-related legislation and information-flow restrictions, particularly from the United States to off-shore locations. Federal and state legislation has been proposed that, if enacted, could restrict or discourage U.S. companies from outsourcing services outside of the U.S. Future legislation, if enacted, could have an adverse effect on our business, results of operations and financial condition.
Our business performance and growth plans may be negatively affected if we are unable to effectively manage changes in the application and use of technology.
The utilization of technology in our industry has and will continue to increase rapidly. Our future success depends, in part, upon our ability to develop and implement technology solutions that anticipate and keep pace with continuing changes in technology, industry standards and client preferences. We may not be successful in anticipating or responding to these developments on a timely and cost-effective basis, and our ideas may not be accepted in the marketplace. Additionally, the effort to gain technological expertise and develop new technologies in our business requires us to incur significant expenses. If we cannot offer new technologies as quickly as our competitors, or if our competitors develop more cost-effective technologies, it could have a material adverse effect on our ability to obtain and complete customer engagements. Also, if customer preferences for technology disproportionately outpace other interaction preferences, it could have a material adverse impact on our revenue profile and growth plans.
Defects or errors within our software could adversely affect our business.
Design defects or software errors may delay software introductions or reduce the satisfaction level of clients and may have a materially adverse effect on our business and results of operations. Our software is highly complex and may, from time to time, contain design defects or software errors that may be difficult to detect and/or correct. Because both our clients and we use our software to perform critical business functions, design defects, software errors or other potential problems within or outside of our control may arise from the use of our software. It may also result in financial or other damages to our clients, for which we may be held responsible. Although our license agreements with our clients may often contain provisions designed to limit our exposure to potential claims and liabilities arising from client problems, these provisions may not effectively protect us against such claims in all cases and in all jurisdictions. Claims and liabilities arising from client problems could result in monetary damages to us and could cause damage to our reputation, adversely affecting our business, results of operations and financial condition.
If we do not effectively manage our capacity, our results of operations could be adversely affected.
Our ability to profit from the global trend toward outsourcing depends largely on how effectively we manage our contact center capacity. In order to create the additional capacity necessary to accommodate new or expanded outsourcing projects, we may need to open new contact centers. The opening or expansion of a contact center may result, at least in the short-term, in idle capacity until we fully implement the new or expanded program. We periodically assess the expected long-term capacity utilization of our contact centers. As a result, we may, if deemed necessary, consolidate, close or partially close under-performing contact centers to maintain or improve targeted utilization and margins. There can be no guarantee that we will be able to achieve or maintain optimal utilization of our contact center capacity.
We also may experience short-term and/or longer-term fluctuations in client demand for services performed in one or more of our contact centers. Short-term downward fluctuations may result in less than optimal site utilization for a period of time. Longer-term downward fluctuations may result in site closures. As a result, we may not achieve or maintain targeted site utilization levels, or site utilization levels may decrease over certain periods, and our profitability may suffer as a result.
Convergys Corporation 2014 Annual Report 10
A large portion of our accounts receivable is payable by a limited number of clients and the inability of any of these clients to pay its accounts receivable could adversely affect our business.
Because a large portion of our revenue is generated from a limited number of clients, we often carry significant accounts receivable balances from those clients. While we closely monitor these balances, if a significant client were financially unable or unwilling, for any reason, to pay our accounts receivable, our income and cash flow would decrease. We also have several important clients that are in industries that could be impacted by a global economic slowdown. In addition, our income could be materially impacted by a number of small clients declaring bankruptcy within a short period of time.
Changes in tax laws and regulations or other factors could cause our income tax rate to increase, potentially reducing net income and adversely affecting cash flows.
We are subject to taxation in various jurisdictions around the world. In preparing financial statements, we calculate our respective effective income tax rate based on current tax laws and regulations and the estimated taxable income within each of these jurisdictions. Officials in some of the jurisdictions in which we do business, including the United States, have proposed or announced that they are considering tax increases and other revenue raising laws and regulations. Any resulting changes in tax laws or regulations could increase our effective tax rate or impose new restrictions, costs or prohibitions on our current practices and reduce our net income and adversely affect our cash flows.
We may incur material restructuring charges in the future.
In the past, we have recorded restructuring charges related to involuntary employee terminations, various facility closures, and various other restructuring activities. We continually evaluate ways to reduce our operating expenses through new restructuring opportunities, including more effective utilization of our assets, workforce, and operating facilities. In addition, changing industry and market conditions may dictate strategic decisions to restructure some business units and discontinue others. As a result, there is a risk, which is increased during economic downturns and with expanded global operations, that we may incur material restructuring charges in the future.
We may incur additional non-cash goodwill impairment charges in the future.
As a result of past acquisitions, the Company carries a significant goodwill balance on its balance sheet. We test goodwill for impairment annually as of October 1 and at other times if events have occurred or circumstances exist that indicates the carrying value of goodwill may no longer be recoverable. There can be no assurances that we will not incur impairment charges in the future, particularly in the event of a prolonged economic slowdown. See Note 6 of the Notes to Consolidated Financial Statements for additional details.
Our controls and procedures may not prevent or detect all errors or acts of fraud.
Any disclosure controls and procedures or internal controls and procedures, no matter how well conceived and operated, can provide only reasonable, not absolute, assurance that the objectives of the control system are met. In addition, the design of controls must consider the benefits of controls relative to their costs. Controls cannot assure that no judgments in decision-making will be faulty or that breakdowns will not occur because of simple error or mistake. Additionally, controls can be circumvented by the individual acts of some persons or by collusion of two or more people or by an unauthorized override of the controls. While controls are designed with the intent of providing reasonable assurance of the effectiveness of the controls, such design is also based in part upon certain assumptions about the likelihood of future events, and such assumptions, while reasonable, may not take into account all potential future conditions. Accordingly, because of the inherent limitations in a cost effective control system, misstatements due to error or fraud may occur and may not be prevented or detected, and we could lose investor confidence in the accuracy and completeness of our financial reports and other disclosures, which could have an adverse effect on our stock price.
Client consolidations could result in a loss of clients and adversely affect our business.
We serve clients in industries that have experienced a significant level of consolidation. We cannot assure that additional consolidations will not occur in which our clients acquire additional businesses or are acquired themselves. Such consolidations may result in the termination of an existing client contract, which could have an adverse effect on our business, results of operations and financial condition.
Our success is subject to the terms of our client contracts.
Convergys Corporation 2014 Annual Report 11
Most of our client contracts do not have minimum volume requirements, and the profitability of each client contract or work order may fluctuate, sometimes significantly, throughout various stages of the program. Certain contracts have performance-related bonus and/or penalty provisions which provide that the client may be required to pay us a bonus, or we may be required to issue the client a credit, based upon our meeting, or failing to meet, agreed-upon service levels and performance metrics. Our objective is to sign multi-year contracts with our clients; however, our contracts generally allow our client to terminate the contract for convenience or to reduce the amount of our services. We cannot be assured that our clients will not terminate their contracts before their scheduled expiration date, that the volume of services for these programs will not be reduced or that we will be able to avoid penalties or earn performance bonuses. In addition, we cannot be assured that each client contract will be profitable for us or that we will be able to terminate unprofitable contracts without incurring significant liabilities.
If we are unable to hire or retain qualified personnel in certain areas of our business, our ability to execute our business plans in those areas could be impaired and revenues could decrease.
We employ approximately 125,000 employees worldwide. At times, we have experienced difficulties in hiring personnel with the desired levels of training or experience. Additionally, quality service depends on our ability to retain employees and control personnel turnover. Any increase in the employee turnover rate could increase recruiting and training costs and could decrease operating effectiveness and productivity. We may not be able to continue to hire, train and retain a sufficient number of qualified personnel to adequately staff new client projects.
The volatility of our stock price may result in loss of investment.
The trading price of our common shares has been and may continue to be subject to substantial fluctuations over short and long periods of time. We believe that market prices of outsourced customer contact management services stocks in general have experienced volatility, which could affect the market price of our common shares regardless of our financial results or performance. We further believe that various factors such as general economic conditions, changes or volatility in the financial markets, changing market conditions in the outsourced customer contact management services industry, quarterly variations in our financial results, the announcement of acquisitions or divestitures, strategic partnerships or new product offerings, and changes in financial estimates and recommendations by securities analysts could cause the market price of our common shares to fluctuate substantially in the future.
ITEM 1B. UNRESOLVED STAFF COMMENTS
None.
ITEM 2. PROPERTIES
Our principal executive offices are located at 201 East Fourth Street, Cincinnati, Ohio 45202, and the telephone number at that address is (513) 723-7000. We own office facilities in Jacksonville, Florida, Pueblo, Colorado, Ogden, Utah and Orlando, Florida.
We lease space for our corporate headquarters, offices, data centers and contact centers. Domestic facilities are located in Arizona, Colorado, Florida, Georgia, Idaho, Iowa, Kansas, Kentucky, Massachusetts, Minnesota, Missouri, Nebraska, New Mexico, New York, North Carolina, Ohio, Oklahoma, Oregon, Tennessee, Texas, Utah, Virginia and Wisconsin. International facilities are located in Brazil, Bulgaria, Canada, China, Colombia, Costa Rica, Dominican Republic, Egypt, El Salvador, France, Germany, Honduras, India, Indonesia, Ireland, Italy, Malaysia, the Netherlands, Nicaragua, the Philippines, Poland, Singapore, Spain, South Africa, Sweden, Tunisia, the United Arab Emirates, and the United Kingdom. Upon the expiration or termination of any such leases, we believe we could obtain comparable office space.
We also lease some of the computer hardware, computer software and office equipment necessary to conduct our business. In addition, we own computer hardware, communications equipment, software and leasehold improvements. We depreciate these assets using the straight-line method over the estimated useful lives of the assets. Leasehold improvements are depreciated over the shorter of their estimated useful life or the term of the associated lease.
We believe that our facilities and equipment are adequate and have sufficient productive capacity to meet our current needs.
ITEM 3. LEGAL PROCEEDINGS
The information required by Item 3 is included in Note 11 of the Notes to Consolidated Financial Statements of this Form 10-K.
Convergys Corporation 2014 Annual Report 12
ITEM 4. MINE SAFETY DISCLOSURES
Not applicable.
Convergys Corporation 2014 Annual Report 13
ITEM 4A. EXECUTIVE OFFICERS OF THE REGISTRANT
The following information responds in part to the provisions of Part III, Item 10.
As of February 18, 2015, our Executive Officers were:
Name | Age | Title |
Andrea J. Ayers (a) | 51 | President and Chief Executive Officer |
Andre S. Valentine | 51 | Chief Financial Officer |
Claudia L. Cline | 61 | Executive Vice President and General Counsel |
Marjorie M. Connelly | 53 | Chief Operating Officer |
Michael L. Wooden | 50 | Chief Commercial Officer |
(a) Member of the Board of Directors | ||
Officers are appointed annually, but are removable at the discretion of the Board of Directors.
ANDREA J. AYERS, President and Chief Executive Officer since November 2012; President and Chief Operating Officer, Customer Management since November 2010; President, Customer Management since April 2008; President, Relationship Technology Management, 2007-2008; President, Government and New Markets, 2005-2007.
ANDRE S. VALENTINE, Chief Financial Officer since August 2012; Senior Vice President of Finance, Customer Management, 2010-2012 and 2002-2009; Senior Vice President, Controller, 2009-2010; Vice President, Controller, 1998-2002.
CLAUDIA L. CLINE, Executive Vice President and General Counsel since September 2012; Customer Management General Counsel, 2011 - 2012; Senior Vice President Workforce Management and Development, 2008 - 2011.
MARJORIE M. CONNELLY, Chief Operating Officer since November 2014; Interim President, Longwood College, 2012-2013; Global Chief Operating Officer, Barclaycard, 2009-2011; Chief Operating Officer, Wachovia Securities 2006-2008.
MICHAEL L. WOODEN, Chief Commercial Officer since March 2014; Senior Vice President and Account Management, 2012-2014; Senior Vice President Sales, Marketing and Strategy, Xerox, 2009-2012; Vice President, Communications and Consumer Goods, ASC, Inc. 2007-2009.
PART II
ITEM 5. MARKET FOR THE REGISTRANT'S COMMON EQUITY, RELATED STOCKHOLDER MATTERS AND ISSUER PURCHASES OF EQUITY SECURITIES
Convergys Corporation’s common shares, no par value, are listed on the New York Stock Exchange under the symbol “CVG.” As of January 31, 2015, there were 7,466 holders of record of the 99,043,853 common shares of Convergys, excluding amounts held in Treasury (189,794,643 outstanding common shares of Convergys, of which 90,750,790 were held in Treasury).
The high, low and closing prices of our common shares for each quarter in 2014 and 2013 are listed below:
Quarter | 1st | 2nd | 3rd | 4th | |||||||||||
2014 | |||||||||||||||
High | $ | 24.43 | $ | 24.26 | $ | 21.96 | $ | 21.51 | |||||||
Low | 18.83 | 20.56 | 17.69 | 17.36 | |||||||||||
Close | 21.91 | 21.44 | 17.82 | 20.37 | |||||||||||
2013 | |||||||||||||||
High | $ | 17.05 | $ | 18.66 | $ | 19.91 | $ | 21.40 | |||||||
Low | 15.05 | 15.56 | 17.16 | 18.12 | |||||||||||
Close | 17.03 | 17.43 | 18.75 | 21.05 | |||||||||||
Convergys Corporation 2014 Annual Report 14
During 2013 and 2014, the Company's Board of Directors approved, and the Company paid, the following dividends per common share:
Announcement Date | Record Date | Dividend Amount | Payment Date |
February 7, 2013 | March 22, 2013 | $0.06 | April 5, 2013 |
April 30, 2013 | June 21, 2013 | $0.06 | July 5, 2013 |
July 30, 2013 | September 20, 2013 | $0.06 | October 4, 2013 |
November 6, 2013 | December 27, 2013 | $0.06 | January 10, 2014 |
February 5, 2014 | March 21, 2014 | $0.06 | April 4, 2014 |
May 12, 2014 | June 19, 2014 | $0.07 | July 3, 2014 |
August 11, 2014 | September 19, 2014 | $0.07 | October 3, 2014 |
November 5, 2014 | December 26, 2014 | $0.07 | January 9, 2015 |
On February 18, 2015, the Company announced that its Board of Directors declared a quarterly cash dividend of $0.07 per common share to be paid on April 3, 2015 to shareholders of record as of March 20, 2015.
The Board expects that future cash dividends will be paid on a quarterly basis. However, any decision to pay future cash dividends will be subject to Board approval, and will depend on the Company's future earnings, cash flow, financial condition, financial covenants and other relevant factors.
We repurchased 2.3 million of our common shares for $46.3 million during 2014, as summarized in the following table:
Shares repurchased | Average price per share | |||||
January 2014 | 3,419 | $ | 21.66 | |||
February 2014 | 255 | 20.11 | ||||
March 2014 | 22 | 20.77 | ||||
April 2014 | 21 | 21.00 | ||||
May 2014 | 165,202 | 21.98 | ||||
June 2014 | 338,153 | 21.48 | ||||
July 2014 | 165,113 | 20.76 | ||||
August 2014 | 245,555 | 18.94 | ||||
September 2014 | 390,806 | 18.53 | ||||
October 2014 | 338,754 | 18.26 | ||||
November 2014 | 243,726 | 20.95 | ||||
December 2014 | 423,871 | 20.53 | ||||
Total | 2,314,897 | $ | 20.00 | |||
In February 2013, our Board of Directors approved an increase in the remaining authorized share repurchases to $250.0 million in the aggregate. At December 31, 2014, the Company had the authority to repurchase up to an incremental $87.1 million of outstanding common shares. The timing and terms of any future transactions depend on a number of considerations including market conditions and our liquidity and limits that may be applicable under the covenants in our credit agreement.
Performance Graph
The following Performance Graph compares, for the period from December 31, 2009 through December 31, 2014, the percentage change of the cumulative total shareholder return on the Company’s common shares with the cumulative total return of the S&P 500 Stock Index, an Old Peer Group and a New Peer Group. The Old Peer Group and New Peer Group consist of our peer group companies listed below.
Convergys Corporation 2014 Annual Report 15
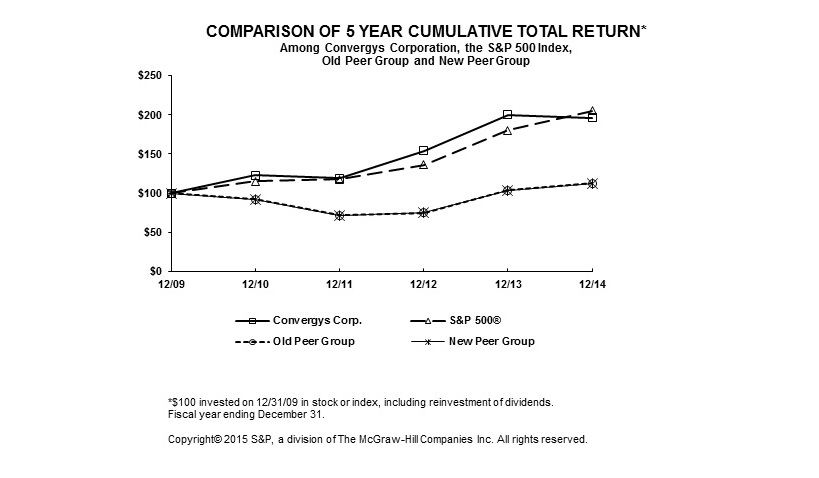
Dec-09 | Dec-10 | Dec-11 | Dec-12 | Dec-13 | Dec-14 | |||||||||||||
Convergys Corporation | $ | 100 | $ | 123 | $ | 119 | $ | 154 | $ | 200 | $ | 196 | ||||||
S&P 500 | $ | 100 | $ | 115 | $ | 117 | $ | 136 | $ | 180 | $ | 205 | ||||||
Old Peer Group | $ | 100 | $ | 92 | $ | 72 | $ | 75 | $ | 104 | $ | 113 | ||||||
New Peer Group | $ | 100 | $ | 92 | $ | 72 | $ | 75 | $ | 104 | $ | 113 | ||||||
The Old Peer Group consists of Sykes Enterprises Inc., Teleperformance and Teletech Holdings Inc.
The New Peer Group consists of Atento SA, Sykes Enterprises Inc., Teleperformance and Teletech Holdings Inc. Changes in the peer group from prior year resulted from Atento SA completing its initial public offering during 2014.
Copyright© 2015 Standard & Poor's, a division of The McGraw-Hill Companies Inc. All rights reserved. (www.researchdatagroup.com/S&P.htm)
Convergys Corporation 2014 Annual Report 16
ITEM 6. SELECTED FINANCIAL DATA
(Amounts in millions except per share amounts) | 2014 | 2013 | 2012 | 2011 | 2010 | ||||||||||
RESULTS OF OPERATIONS | |||||||||||||||
Revenues | $ | 2,855.5 | $ | 2,046.1 | $ | 2,005.0 | $ | 1,933.2 | $ | 1,863.3 | |||||
Costs and Expenses (1) (2) | 2,704.7 | 1,908.7 | 1,966.4 | 1,823.1 | 2,017.2 | ||||||||||
Operating Income (loss) | 150.8 | 137.4 | 38.6 | 110.1 | (153.9 | ) | |||||||||
Earnings and gain from Cellular Partnerships, net | — | — | — | 285.2 | 47.2 | ||||||||||
Other (expense) income, net | (2.2 | ) | 5.1 | 4.3 | 9.8 | 8.9 | |||||||||
Interest expense | (19.3 | ) | (11.5 | ) | (13.6 | ) | (16.1 | ) | (19.5 | ) | |||||
Income (loss) before Income Taxes | 129.3 | 131.0 | 29.3 | 389.0 | (117.3 | ) | |||||||||
Income tax expense (benefit) (3) | 12.8 | 72.5 | 1.1 | 106.5 | (7.5 | ) | |||||||||
Income (loss) from Continuing Operations, net of tax | 116.5 | 58.5 | 28.2 | 282.5 | (109.8 | ) | |||||||||
Income from discontinued operations (4) | 3.5 | 2.4 | 72.4 | 52.3 | 56.6 | ||||||||||
Net Income (Loss) | $ | 120.0 | $ | 60.9 | $ | 100.6 | $ | 334.8 | $ | (53.2 | ) | ||||
Basic Earnings (Loss) Per Common Share: | |||||||||||||||
Continuing Operations | $ | 1.16 | $ | 0.57 | $ | 0.25 | $ | 2.35 | $ | (0.89 | ) | ||||
Discontinued Operations | 0.03 | 0.02 | 0.65 | 0.44 | 0.46 | ||||||||||
Basic Earnings (Loss) Per Common Share | $ | 1.19 | $ | 0.59 | $ | 0.90 | $ | 2.79 | $ | (0.43 | ) | ||||
Diluted Earnings (Loss) Per Common Share: | |||||||||||||||
Continuing Operations | $ | 1.10 | $ | 0.54 | $ | 0.24 | $ | 2.30 | $ | (0.89 | ) | ||||
Discontinued Operations | 0.03 | 0.02 | 0.62 | 0.42 | 0.46 | ||||||||||
Net Diluted Earnings (Loss) Per Common Share | $ | 1.13 | $ | 0.56 | $ | 0.86 | $ | 2.72 | $ | (0.43 | ) | ||||
Weighted Average Common Shares Outstanding: | |||||||||||||||
Basic | 100.7 | 103.3 | 112.2 | 120.2 | 123.1 | ||||||||||
Diluted | 106.2 | 109.2 | 117.1 | 122.9 | 123.1 | ||||||||||
FINANCIAL POSITION | |||||||||||||||
Total Assets | $ | 2,516.5 | $ | 1,956.7 | $ | 2,037.9 | $ | 2,330.8 | $ | 2,125.3 | |||||
Total debt and capital lease obligations | 375.9 | 61.1 | 60.6 | 127.1 | 210.2 | ||||||||||
Shareholders’ Equity | 1,227.2 | 1,224.1 | 1,371.9 | 1,411.5 | 1,184.1 | ||||||||||
OTHER DATA | |||||||||||||||
Net cash flows provided by operating activities | |||||||||||||||
Operating activities of continuing operations | $ | 265.2 | $ | 208.4 | $ | 103.9 | $ | 161.4 | $ | 179.2 | |||||
Operating activities of discontinued operations | — | 1.6 | 9.1 | 35.2 | 15.0 | ||||||||||
$ | 265.2 | $ | 210.0 | $ | 113.0 | $ | 196.6 | $ | 194.2 | ||||||
Net cash flows (used in) provided by investing activities | |||||||||||||||
Investing activities of continuing operations | $ | (850.5 | ) | $ | (36.6 | ) | $ | (162.7 | ) | $ | 235.6 | $ | (63.0 | ) | |
Investing activities of discontinued operations | — | 1.0 | 425.3 | (13.5 | ) | 63.7 | |||||||||
$ | (850.5 | ) | $ | (35.6 | ) | $ | 262.6 | $ | 222.1 | $ | 0.7 | ||||
Net cash flows used in financing activities | |||||||||||||||
Financing activities of continuing operations | $ | (203.4 | ) | $ | (148.3 | ) | $ | (242.6 | ) | $ | (183.0 | ) | $ | (336.9 | ) |
Financing activities of discontinued operations | — | — | (0.1 | ) | — | (3.6 | ) | ||||||||
$ | (203.4 | ) | $ | (148.3 | ) | $ | (242.7 | ) | $ | (183.0 | ) | $ | (340.5 | ) | |
Free cash flow (5) | $ | 148.5 | $ | 146.2 | $ | 8.4 | $ | 108.3 | $ | 127.9 | |||||
EBITDA (6) | $ | 316.2 | $ | 233.3 | $ | 131.6 | $ | 488.8 | $ | (2.5 | ) | ||||
Convergys Corporation 2014 Annual Report 17
(1) | Costs and expenses include restructuring charges of $1.7, $5.4, $11.6, $1.2 and $28.7 in 2014, 2013, 2012, 2011 and 2010, respectively; gain on sale of real estate of $1.6 in 2014; asset impairment loss of $1.5, $88.6 and $181.1 in 2013, 2012 and 2010, respectively; net pension and other post employment benefit plan charges of $4.6, $13.1 and $4.1 in 2014, 2013 and 2012, respectively; and transaction and integration expenses of $37.7 in 2014. |
(2) | Costs and expenses also include $8.8, $23.6 and $28.4 in 2012, 2011 and 2010, respectively, of certain costs previously allocated to the Information Management segment, and $9.1 in 2010 of certain costs previously allocated to the HR Management segment, that do not qualify as discontinued operations and are reported as costs from continuing operations. The Company took actions to reduce these costs and earned transition service revenues, resulting from services being provided to the buyers subsequent to completion of the sale of Information Management and HR Management, to offset these costs. |
(3) | Income tax expense in 2013 includes $46.4 of expense to record the deferred tax liability associated with a change in classification for a portion of undistributed earnings of the Company's foreign subsidiaries. Income tax expense in 2014 includes a benefit of $6.0 related to the difference between the $46.4 previously accrued in 2013 and the current estimate as of December 31, 2014. |
(4) | Discontinued operations includes the historical financial results of the Information Management business and the HR Management line of business, excluding certain costs referred to in note 2, above, that did not meet the criteria for such presentation. |
(5) | Free cash flow is not defined under accounting principles generally accepted in United States (U.S. GAAP) and is calculated as cash flows from operations less capital expenditures (net of proceeds from disposal). The Company uses free cash flow to assess the financial performance of the Company. Convergys’ Management believes that free cash flow is useful to investors because it relates the operating cash flow of the Company to the capital that is spent to continue and improve business operations, such as investment in the Company’s existing businesses. Further, free cash flow facilitates Management’s ability to strengthen the Company’s balance sheet, to repay the Company’s debt obligations and to repurchase the Company’s common shares. Limitations associated with the use of free cash flow include that it does not represent the residual cash flow available for discretionary expenditures as it does not incorporate certain cash payments including payments made on capital lease obligations or cash payments for business acquisitions. Management compensates for these limitations by using both the non-GAAP measure, free cash flow, and the GAAP measure, cash from operating activities, in its evaluation of performance. There are no material purposes for which we use this non-GAAP measure beyond the purposes described above. For more detail and a reconciliation of cash flows from operations to free cash flows, see the “Financial Condition, Liquidity and Capital Resources” section in Part II, Item 7 of this report. |
(6) | EBITDA is not defined under U.S. GAAP and is calculated as income from continuing operations plus tax expense, interest expense, depreciation and amortization. The Company uses EBITDA to monitor and evaluate the performance of the business and believes the presentation of this measure will enhance the investors’ ability to analyze trends in the business and evaluate the Company’s underlying performance relative to other companies in the industry. The Company also utilizes EBITDA in the calculations for certain employee incentive compensation plans. EBITDA should not be considered in isolation or as a substitute for income from continuing operations, net of tax or other income statement data prepared in accordance with U.S. GAAP and our presentation of EBITDA may not be comparable to similarly-titled measures used by other companies. Management uses the non-GAAP measure, EBITDA, and the U.S. GAAP measure, income from continuing operations, net of tax, in evaluation of its underlying performance. There are no material purposes for which we use the non-GAAP measure beyond the purposes described above. The non-GAAP measure should be considered supplemental in nature and should not be considered in isolation or be construed as being more important than comparable GAAP measures. For more detail and reconciliation of income from continuing operations, net of tax, to EBITDA, see the “Financial Condition, Liquidity and Capital Resources” section in Part II, Item 7 of this report. |
Convergys Corporation 2014 Annual Report 18
ITEM 7. MANAGEMENT’S DISCUSSION AND ANALYSIS
OF FINANCIAL CONDITION AND RESULTS OF OPERATIONS
(Amounts in millions except per share amounts)
BACKGROUND
Convergys Corporation (we, the Company or Convergys) is a global leader in customer management, focused on bringing value to our clients through every customer interaction. As a global provider in the industry, Convergys has a history of commitment and dedication to excellence in serving many of the world's largest brands. Our business model allows us to deliver consistent, quality service, at the scale and in the geographies that meet our clients' business needs and pro-actively partner to solve client business challenges through our account management model. We leverage our geographic footprint and comprehensive capabilities to help leading companies create quality customer experiences across multiple interaction channels while increasing revenue and reducing their cost to serve. We are uniquely positioned as a well-capitalized leader in our market and are able to invest in the services, technology, and analytics that matter to our client and their customers.
Operations and Structure
On March 3, 2014, Convergys completed its acquisition of SGS Holdings, Inc. (Stream), a global customer management leader, providing technical support, customer care and sales, for Fortune 1000 companies. This acquisition expanded the Company's geographic footprint and capabilities, adding approximately 40,000 employees in 22 countries. Combined, Convergys now has 125,000 employees working out of more than 150 locations in 31 countries, interacting with our clients' customers in 47 languages. Stream's complementary client portfolio also diversified Convergys' client base through the addition of leading technology, communications and other clients. The acquired Stream operations contributed revenue of $834.8 during 2014.
On April 30, 2013, we acquired New Zealand-based Datacom's contact center operations with facilities in Kuala Lumpur, Malaysia and Manila, Philippines. The acquisition added 15 Asian languages to Convergys' language capabilities and approximately 1,000 employees, working in three Southeast Asia contact centers, to Convergys' global operations.
We believe our clients benefit from our worldwide workforce located in key geographies throughout the world, including the United States, Canada, the Philippines, India, China, Indonesia, Malaysia, Costa Rica, Colombia, Dominican Republic, El Salvador, Nicaragua, Honduras, Australia, the U.K., France, Tunisia, Egypt, Bulgaria and other various countries throughout the EMEA region. The Stream acquisition noted above, expanded the Company's presence in North America, Latin America, and the Philippines. Most notably, the acquisition increased Convergys' presence in EMEA by adding Stream's sites across Eastern and Western Europe, as well as multiple sites in North Africa. As a result of this combination, Convergys has a more diversified client base and an enhanced ability to offer a wider range of customer transactions in a more cost effective manner from multiple geographies, at scale.
Agent-related revenues, which account for approximately 94% of revenues for 2014, are typically recognized as services are performed based on staffing hours or the number of contacts handled by service agents using contractual rates. Remaining revenues are derived from the sale of premise-based and hosted automated self-care and technology solutions and provision of professional services. Revenues from the sale of these solutions and provision of services are typically recognized as services are provided over the duration of the contract using contractual rates.
RESULTS OF OPERATIONS
Revenues
2014 | 2013 | % Change 14 vs. 13 | 2012 | % Change 13 vs. 12 | ||||||||
Revenues: | ||||||||||||
Communications | $ | 1,582.1 | $ | 1,218.0 | 30 | $ | 1,205.4 | 1 | ||||
Technology | 525.2 | 198.6 | NM | 172.7 | 15 | |||||||
Financial Services | 202.8 | 179.9 | 13 | 203.3 | (12 | ) | ||||||
Other | 545.4 | 449.6 | 21 | 423.6 | 6 | |||||||
Total Revenues | $ | 2,855.5 | $ | 2,046.1 | 40 | $ | 2,005.0 | 2 | ||||
Convergys Corporation 2014 Annual Report 19
2014 vs. 2013
Consolidated revenues for 2014 were $2,855.5, a 40% increase from $2,046.1 in 2013. Revenue related to the acquired Stream operations contributed $834.8 in revenue during 2014, primarily within the communications and technology verticals. Revenues from communications clients increased 30% from 2013, reflecting contributions from the Stream operations , offset by volume decreases with several existing clients. Revenues from technology clients increased significantly from prior year, reflecting contributions from the Stream operations, volume increases and new programs with existing clients. Revenues from financial services clients increased 13% from the prior year, due to volume increases and new clients, partially offset by program completions. Other revenues, which are comprised of clients outside the Company's three largest industries, increased 21% from the prior year. This increase is attributable to contributions from the Stream operations, volume increases, new clients and new programs with existing clients, partially offset by a program completion with one client.
2013 vs. 2012
Consolidated revenues for 2013 were $2,046.1, a 2% increase from $2,005.0 in 2012. Revenue related to the acquired Datacom operations contributed less than half of the growth in 2013. Revenues from communications clients increased 1% from 2012, reflecting volume increases and new programs with several existing clients, partially offset by a volume decrease with our largest client. Revenues from technology clients increased 15% from 2012 primarily due to volume increases, new programs with existing clients and contributions from the Datacom operations. Revenues from financial services clients decreased 12% from 2012, primarily reflecting program completion with one client. Other revenues, which are comprised of clients outside the Company's three largest industries, increased 6% from 2012 due to volume increases, new programs with existing and new clients, partially offset by a program completion with one client. Other revenues for 2013 and 2012 also include $17.1 and $13.8, respectively, of transition services revenues earned under agreements with NEC Corporation related to the sale of the Information Management business. All transaction services agreements expired by mid-2014 and the Company has substantially eliminated the related costs.
Operating Costs and Expenses
2014 | 2013 | % Change 14 vs. 13 | 2012 | % Change 13 vs. 12 | |||||||||
Operating Costs: | |||||||||||||
Cost of providing services and products sold | $ | 1,814.5 | $ | 1,335.1 | 36 | $ | 1,289.5 | 4 | |||||
Selling, general and administrative | 677.1 | 465.0 | 46 | 477.2 | (3 | ) | |||||||
Research and development costs | 7.7 | 8.2 | (6 | ) | 10.8 | (24 | ) | ||||||
Depreciation | 142.9 | 85.5 | 67 | 82.4 | 4 | ||||||||
Amortization | 24.7 | 5.3 | NM | 6.3 | (16 | ) | |||||||
Restructuring | 1.7 | 5.4 | (69 | ) | 11.6 | (53 | ) | ||||||
Asset impairments and other | (1.6 | ) | 1.5 | NM | 88.6 | NM | |||||||
Transaction and integration costs | 37.7 | 2.7 | NM | — | NM | ||||||||
Total costs and expenses | $ | 2,704.7 | $ | 1,908.7 | 42 | $ | 1,966.4 | (3 | ) | ||||
2014 vs. 2013
Consolidated total operating costs and expenses for 2014 of $2,704.7 increased 42% from $1,908.7 in the prior year. Operating costs and expenses associated with the acquired Stream operations resulted in $819.6 of increased expense during the year. Total operating costs and expenses for 2014 also included $14.7 and $23.0 for transaction and integration related expenses, respectively, associated with the acquisition of Stream. These items are included in the Transaction and integration costs caption. Operating costs in 2014 also included a $1.6 gain resulting from the settlement of a contingency related to a prior period real-estate sale and severance costs of $1.7, while the prior year included severance costs of $5.4 and an asset impairment charge of $1.5.
Cost of providing services and products sold increased 36% from $1,335.1 in 2013 to $1,814.5 in 2014. As a percentage of revenues, the cost of providing services and products sold was 63.5% in 2014 compared to 65.3% in the prior year. This decrease was primarily due to the timing of certain program implementations, as well as changes in the mix of geographies where services are provided. Selling, general and administrative expenses of $677.1 increased 46.0% from the prior year. As a percentage of revenues, selling, general and administrative expense was 23.7% in 2014 compared to 22.7% in 2013, reflecting costs associated with the acquired Stream operations, partially offset by higher pension settlement charges in the prior year. Research and development costs of $7.7 remained relatively consistent with prior year. Depreciation expense of $142.9 increased $57.4 from
Convergys Corporation 2014 Annual Report 20
the prior year, while amortization expense of $24.7 increased $19.4. These increases primarily resulted from the acquired property and equipment and intangible assets from the Stream acquisition, which were recorded at fair value as of the acquisition date.
2013 vs. 2012
Consolidated total operating costs and expenses for 2013 of $1,908.7 decreased 3% from $1,966.4, primarily due to the $88.6 non-cash impairment charge during 2012 consisting of $46.0 for goodwill of the Customer Interaction Technology reporting unit and $42.6 for the impairment of certain facilities classified as held for sale. The Company recorded an additional impairment charge of $1.5 during 2013 to reduce the carrying value of certain facilities to estimated fair value less cost to sell.
Costs of providing services and products sold increased 4% from $1,289.5 in 2012 to $1,335.1 in 2013. As a percentage of revenues, the cost of providing services and products sold was 65.3% in 2013 compared to 64.3% in the prior year. This increase was primarily due to the timing of certain program ramp-ups in 2013. Selling, general and administrative expenses of $465.0 decreased 3% from the prior year. As a percentage of revenues, selling, general and administrative cost was 22.7% in 2013 compared to 23.8% in 2012. Expense for 2013 includes the $13.1 net pension and other post employment benefit plan charges, restructuring charges of $5.4 and $2.7 of transaction expenses associated with the anticipated acquisition of Stream. Expense in 2012 included $11.6 in restructuring charges, $4.1 of pension and other post employment benefit plan charges and $8.8 of certain legacy costs associated with the Information Management business that did not qualify for discontinued operations treatment. Excluding these items in both years, the decrease in selling, general and administrative expense was primarily due to cost reductions previously taken along with continued efforts to control costs. Research and development costs of $8.2 decreased $2.6 from 2012 due to reductions in headcount. Depreciation expense of $85.5 increased $3.1 from the prior year reflecting the increase in capital expenditures throughout 2012 to support increased capacity. Amortization expense of $5.3 decreased $1.0 due to completion of the amortization of certain definite lived intangible assets.
Operating Income and Adjusted Operating Income (a non-GAAP measure)
In order to assess the underlying operational performance of the continuing operations of the business and to have a basis to compare underlying results to prior and future periods, we provide the non-GAAP measures, Adjusted Operating Income and Adjusted Operating Margin (Adjusted Operating Income divided by Total Revenues), in the table below. For the years ended December 31, 2014, 2013 and 2012 Adjusted Operating Income and Adjusted Operating Margin exclude the following:
1. | Depreciation of $19.0 in 2014, resulting from the fair value write-up of property and equipment acquired from Stream; |
2. | Transaction expenses of $14.7 and $2.7 in 2014 and 2013, respectively, associated with Convergys' acquisition of Stream. These expenses related to fees paid for third-party consulting services; |
3. | Integration expenses of $23.0 in 2014 associated with Convergys' integration of the acquired Stream operations. These expenses primarily related to severance expense and fees for third-party consulting services; |
4. | Amortization of acquired intangible assets of $24.7, $5.3 and $6.3 for the years ended 2014, 2013 and 2012, respectively; |
5. | Gain of $1.6 in 2014 resulting from the settlement of a contingency related to a previous real estate sale; |
6. | Net pension and other post employment benefit charges as discussed in Note 9 of the Notes to Consolidated Financial Statements consisting of 2014 and 2013 non-cash pension settlement charges of $4.6 and $13.1, respectively, as well as a net charge of $4.1 in 2012, resulting from $4.1 of curtailment credits from pension and other post employment benefit plans, $1.4 of post-retirement benefit costs related to the changes in the executive management team, and a $6.8 pension settlement charge due to increased lump-sum payouts as a result of the sale of the Information Management business; |
7. | Restructuring charges of $6.4 in 2012 resulting from the sale of the Information Management business as discussed in Note 8 of the Notes to Consolidated Financial Statements; |
8. | Net impairment charge of $1.5 in 2013 related to the adjustment of two facilities held for sale to their fair values less costs to sell as discussed in Note 6 of the Notes to Consolidated Financial Statement, as well as asset impairment charges of $88.6 in 2012, including $46.0 for impairment of goodwill of the CIT reporting unit and $42.6 for impairment of facilities classified as held for sale, and; |
9. | Certain costs previously allocated to the Information Management business that are now included in continuing operations as discussed below and in more detail in Note 4 of the Notes to Consolidated Financial Statements (these costs were $8.8 in 2012). |
Adjustments for these items are relevant in evaluating the overall performance of the business. Limitations associated with the use of these non-GAAP measures include that these measures do not present all of the amounts associated with our results as determined in accordance with GAAP. Management compensates for this limitation by using both the non-GAAP measures and the GAAP measures in its evaluation of performance. There are no material purposes for which we use these non-GAAP measures
Convergys Corporation 2014 Annual Report 21
beyond those described above. These non-GAAP measures should be considered supplemental in nature and should not be construed as being more important than comparable GAAP measures.
2014 | 2013 | % Change 14 vs. 13 | 2012 | % Change 13 vs. 12 | |||||||||
Operating Income | $ | 150.8 | $ | 137.4 | 10 | $ | 38.6 | NM | |||||
Operating Margin | 5.3 | % | 6.7 | % | 1.9 | % | |||||||
Depreciation of property & equipment write-up | 19.0 | — | NM | — | — | ||||||||
Transaction related expenses | 14.7 | 2.7 | NM | — | NM | ||||||||
Integration related expenses | 23.0 | — | NM | — | — | ||||||||
Amortization of acquired intangible assets | 24.7 | 5.3 | NM | 6.3 | (16 | ) | |||||||
Restructuring | — | — | — | 6.4 | NM | ||||||||
Asset impairments and other | (1.6 | ) | 1.5 | NM | 88.6 | (98 | ) | ||||||
Net pension and other post employment benefit plan charges | 4.6 | 13.1 | (65 | ) | 4.1 | NM | |||||||
Information Management costs not qualifying as Discontinued Operations | — | — | NM | 8.8 | NM | ||||||||
Adjusted Operating Income (a non-GAAP measure) | $ | 235.2 | $ | 160.0 | 47 | $ | 152.8 | 5 | |||||
Adjusted Operating Margin | 8.2 | % | 7.8 | % | 7.6 | % | |||||||
2014 vs. 2013
Consolidated operating income was $150.8 in 2014 compared to operating income of $137.4 in 2013. Excluding the impacts of the items discussed above, consolidated adjusted operating income for 2014 was $235.2 compared to $160.0 in 2013. The increase from prior year is primarily due to the inclusion of Stream's operating results during 2014, as well as synergies realized from the integration of Stream.
2013 vs. 2012
Consolidated operating income was $137.4 in 2013 compared to operating income of $38.6 in 2012. Excluding the impacts of items discussed above, consolidated adjusted operating income for 2013 was $160.0 compared to $152.8 in 2012.
Non-Operating Items
2014 | 2013 | % Change 14 vs. 13 | 2012 | % Change 13 vs. 12 | |||||||||
Operating Income | $ | 150.8 | $ | 137.4 | 10 | $ | 38.6 | NM | |||||
Other (expense) income, net | (2.2 | ) | 5.1 | NM | 4.3 | 19 | |||||||
Interest expense | (19.3 | ) | (11.5 | ) | 68 | (13.6 | ) | (15 | ) | ||||
Income before Income Taxes | $ | 129.3 | $ | 131.0 | (1 | ) | $ | 29.3 | NM | ||||
2014 vs. 2013
Other expense was $2.2 in 2014 compared to other income of $5.1 in 2013. The change was primarily due to $5.0 lower interest income resulting from a decrease in short-term investments held during 2014. Interest expense increased by $7.8 compared to the prior year primarily due to additional expense related to the additional debt incurred in connection with the Stream acquisition.
2013 vs. 2012
Other income of $5.1 in 2013 increased from $4.3 in 2012 primarily due to an increase in interest income. Interest expense of $11.5 improved from $13.6 in the prior year reflecting a lower level of average debt outstanding during 2013 as well as the incremental interest expense of $1.1 related to the purchase of the Orlando facility during 2012.
Income Taxes
Convergys Corporation 2014 Annual Report 22
2014 | 2013 | % Change 14 vs. 13 | 2012 | % Change 13 vs. 12 | ||||||||
Income before Income Taxes | $ | 129.3 | $ | 131.0 | (1 | ) | $ | 29.3 | NM | |||
Income tax expense | 12.8 | 72.5 | (82 | ) | 1.1 | NM | ||||||
Income from Continuing Operations, net of tax | $ | 116.5 | $ | 58.5 | 99 | $ | 28.2 | NM | ||||
2014 vs. 2013
Our effective tax rate on net income from continuing operations was 9.9% in 2014 compared to 55.3% in 2013. The lower effective tax rate in the current year is primarily due to a shift in the geographic mix of worldwide income, as well as a $6.0 benefit resulting from an adjustment to the deferred tax liability previously accrued on an anticipated repatriation of foreign earnings. This adjustment was recorded based on the revised estimate as of December 31, 2014 as we undertook various taxable transactions to repatriate certain foreign earnings. The higher tax rate in 2013 is primarily due to additional tax expense of $46.4 to record the deferred tax liability associated with a change in classification for a portion of undistributed earnings of the Company’s foreign subsidiaries, reflecting management’s plans to repatriate undistributed earnings of the Company’s foreign subsidiaries to contribute funding to our announced acquisition of Stream.
2013 vs. 2012
Our effective tax rate on net income from continuing operations was 55.3% in 2013 compared to 3.8% in 2012. The higher effective tax rate in 2013 was primarily due to the $46.4 tax expense discussed above. The higher income tax rate in 2013 was also impacted by a shift in the geographical mix of worldwide income. The lower effective tax rate in 2012 was primarily due to geographical mix of worldwide income and the impact of internal restructurings.
Net Income from Continuing Operations; Earnings per Diluted Share from Continuing Operations; Adjusted Net Income from Continuing Operations; Adjusted Earnings per Diluted Share from Continuing Operations (non-GAAP measures)
In order to assess the underlying operational performance of the continuing operations of the business, we provide non-GAAP measures in the tables below that exclude, in addition to the operating charges discussed above, the following:
1. | Tax expense of $0.4 for 2014, resulting from the changes in the Company's state rate applicable to deferred tax assets and liabilities. This change in rate resulted from the combination of the Convergys and Stream operations. |
2. | Tax benefit of $6.0 in 2014 and expense of $46.4 in 2013 to record the deferred tax liability associated with a change in classification for a portion of undistributed earnings of the Company's foreign subsidiaries; |
3. | Net tax benefits from international transactions, including certain discrete items, of $6.7 in 2012 and; |
4. | Incremental interest expense of $1.1 in 2012 related to the purchase of the Orlando facility |
We use income from continuing operations, net of tax and earnings per share data excluding the above items to assess the underlying operational performance of the continuing operations of the business for the year and to have a basis to compare underlying results to prior and future periods. Adjustments for these items are relevant in evaluating the overall performance of the business. Limitations associated with the use of these non-GAAP measures include that these measures do not present all of the amounts associated with our results as determined in accordance with GAAP. Management compensates for these limitations by using the non-GAAP measures, income from continuing operations, net of tax and diluted earnings per share excluding these items, and the GAAP measures, income from continuing operations, net of tax and diluted earnings per share, in its evaluation of performance. There are no material purposes for which we use these non-GAAP measures beyond those described above.
Convergys Corporation 2014 Annual Report 23
2014 | 2013 | % Change 14 vs. 13 | 2012 | % Change 13 vs. 12 | ||||||||
Income from Continuing Operations, net of tax | $ | 116.5 | $ | 58.5 | 99 | $ | 28.2 | NM | ||||
Total operating charges from above, net of tax | 58.4 | 15.1 | NM | 88.9 | (83 | ) | ||||||
Tax (benefit) provision related to unremitted foreign earnings | (6.0 | ) | 46.4 | NM | — | NM | ||||||
Adjustment for state tax rate changes | 0.4 | — | NM | — | — | |||||||
Debt reduction costs of $1.1, net of tax | — | — | NM | 0.7 | NM | |||||||
Adjustment of tax to normalized rate | — | — | NM | (6.7 | ) | NM | ||||||
Adjusted income from Continuing Operations, net of tax (a non-GAAP measure) | $ | 169.3 | $ | 120.0 | 41 | $ | 111.1 | 8 | ||||
2014 | 2013 | % Change 14 vs. 13 | 2012 | % Change 13 vs. 12 | |||||||||
Diluted Earnings per Common Share: | |||||||||||||
Continuing Operations | $ | 1.10 | $ | 0.54 | NM | $ | 0.24 | NM | |||||
Impact of net charges above included in Continuing Operations, net of tax | 0.50 | 0.56 | (11 | ) | 0.71 | (21 | ) | ||||||
Adjusted diluted earnings per common share from Continuing Operations (a non-GAAP measure) | $ | 1.60 | $ | 1.10 | 45 | $ | 0.95 | 16 | |||||
2014 vs. 2013
Income from continuing operations, net of tax for 2014 was $116.5 compared to $58.5 in 2013, while income from continuing operations per diluted share for 2014 was $1.10 compared to $0.54 in 2013. Excluding the items discussed above, adjusted income from continuing operations, net of tax for 2014 was $169.3, or $1.60 per diluted share, compared to $120.0, or $1.10 per diluted share for 2013.
2013 vs. 2012
Income from continuing operations, net of tax for 2013 was $58.5 compared to $28.2 in 2012, while income from continuing operations per diluted share for 2013 was $0.54 compared to $0.24 in 2012. Excluding the items discussed above, adjusted income from continuing operations, net of tax for 2013 was $120.0, or $1.10 per diluted share, compared to $111.1, or $0.95 per diluted share for 2012.
Results of Discontinued Operations, Results of Discontinued Operations per Diluted Share, Net Income and Net Income per Diluted Share
2014 | 2013 | % Change 14 vs. 13 | 2012 | % Change 13 vs. 12 | ||||||||
Income from Continuing Operations, net of tax | $ | 116.5 | $ | 58.5 | 99 | $ | 28.2 | NM | ||||
Income from Discontinued Operations, net of tax (benefit) expense of ($3.2), ($8.8) and $51.1 | 3.5 | 2.4 | 46 | 72.4 | (97 | ) | ||||||
Net Income | $ | 120.0 | $ | 60.9 | 97 | $ | 100.6 | (39 | ) | |||
Diluted Earnings Per Common Share: | ||||||||||||
Continuing Operations | $ | 1.10 | $ | 0.54 | NM | $ | 0.24 | NM | ||||
Discontinued Operations | 0.03 | 0.02 | 50 | 0.62 | (97 | ) | ||||||
Net Diluted Earnings Per Common Share | $ | 1.13 | $ | 0.56 | NM | $ | 0.86 | (35 | ) | |||
2014 vs. 2013
Full year 2014 results from discontinued operations include a gain of $3.5 income from discontinued operations, net of tax, compared to a gain of $2.4, net of tax, in the prior year. Activity in both periods related to the settlement or adjustment of certain contingencies and tax positions related to the sale of the Information Management business. Diluted income from discontinued
Convergys Corporation 2014 Annual Report 24
operations, net of tax, per share for the twelve months ended December 31, 2014 and December 31, 2013 was $0.03 and $0.02, respectively.
Including the results of discontinued operations, 2014 net income and diluted earnings per share were $120.0 and $1.13, respectively, compared to $60.9 and $0.56, respectively, in 2013.
2013 vs. 2012
The $2.4 income from discontinued operations, net of tax, recognized in 2013 reflects the additional gain on sale of the Information Management business as certain contingencies and tax positions were settled or adjusted. The $72.4 income from discontinued operations, net of tax, recognized in 2012 reflects income before tax of $23.7 from operating activities of the Information Management business prior to the sale, net tax benefits from operations of divested benefits of $32.5, and a $16.2 gain, net of $83.6 of tax, on the sale of the Information Management business. Income from discontinued operations, net of tax, per diluted share for 2013 and 2012 was $0.02 and $0.62, respectively.
Including the results of discontinued operations, 2013 net income and diluted earnings per share were $60.9 and $0.56 , respectively, compared to $100.6 and $0.86, respectively, in 2012.
EBITDA and Adjusted EBITDA (non-GAAP measures)
Management uses EBITDA, EBITDA margin (EBITDA divided by Total Revenues), Adjusted EBITDA, Adjusted EBITDA margin (Adjusted EBITDA divided by Total Revenues) and the GAAP measure, income from continuing operations, net of tax, to monitor and evaluate the underlying performance of the business and believes the presentation of these measures will enhance investors’ ability to analyze trends in the business and evaluate our underlying performance relative to other companies in the industry. EBITDA and Adjusted EBITDA should not be considered in isolation or as a substitute for income from continuing operations, net of tax, or other income statement data prepared in accordance with GAAP and our presentation of EBITDA and adjusted EBITDA may not be comparable to similarly-titled measures used by other companies. There are no material purposes for which we use these non-GAAP measures beyond the purposes described above. These non-GAAP measures should be considered supplemental in nature and should not be construed as being more important than comparable GAAP measures.
2014 | 2013 | 2012 | |||||||
Income from Continuing Operations, net of tax | $ | 116.5 | $ | 58.5 | $ | 28.2 | |||
Depreciation and Amortization | 167.6 | 90.8 | 88.7 | ||||||
Interest expense | 19.3 | 11.5 | 13.6 | ||||||
Income tax expense | 12.8 | 72.5 | 1.1 | ||||||
EBITDA (a non-GAAP measure) | 316.2 | 233.3 | 131.6 | ||||||
Asset impairments and other | (1.6 | ) | 1.5 | 88.6 | |||||
Transaction related expenses | 14.7 | 2.7 | — | ||||||
Integration related expenses | 23.0 | — | — | ||||||
Restructuring | — | — | 6.4 | ||||||
Information Management related costs not qualifying as Discontinued Operations | — | — | 8.8 | ||||||
Net pension and other post employment benefit plan charges | 4.6 | 13.1 | 4.1 | ||||||
Adjusted EBITDA (a non-GAAP measure) | $ | 356.9 | $ | 250.6 | $ | 239.5 | |||
EBITDA Margin | 11.1 | % | 11.4 | % | 6.6 | % | |||
Adjusted EBITDA Margin | 12.5 | % | 12.2 | % | 11.9 | % | |||
RESTRUCTURING CHARGES
As discussed in Note 8 of the Notes to Consolidated Financial Statements, we recorded the following restructuring charges:
Convergys Corporation 2014 Annual Report 25
2014 Restructuring
During 2014, the Company recorded severance expense of $11.0 related to the elimination of certain redundant executive and non-executive positions as a result of the Company's integration of the Stream business. These amounts are included within Transaction and integration costs on the Consolidated Statements of Income and are expected to be substantially paid in cash by June 30, 2015. The total remaining liability under these severance-related actions, which is included within Payables and other current liabilities on the Company's Consolidated Balance Sheets, was $2.6 as of December 31, 2014.
During 2014, the Company also recorded a severance charge of $1.7 related to restructuring actions impacting approximately 400 employees. These actions were initiated to continue the Company's efforts to refine its operating model and reduce costs. The severance charges are included within Restructuring charges on the Consolidated Statement of Income and are expected to be substantially paid in cash by June 30, 2015. The total remaining liability under this severance-related restructuring plan, which is included within Payables and other current liabilities on the Company's Consolidated Balance Sheets, was $1.3 as of December 31, 2014.
2013 Restructuring
During 2013, the Company recorded a severance charge of $4.3, related to restructuring actions impacting approximately 800 employees. These actions were initiated to continue the Company's efforts to refine its operating model and reduce costs. The Company also recorded other restructuring expense of $1.1 during 2013. These amounts were fully settled as of December 31, 2014.
2012 Restructuring
During 2012, the Company recorded restructuring charges of $11.6, consisting of $11.4 of severance-related charges and $0.2 of facility-related charges. The $11.4 of severance-related charges related to restructuring actions impacting approximately 100 professional employees and reflect the change in the Company's executive management team and realignment of Corporate overhead as a result of the sale of the Information Management business. These amounts were fully settled as of December 31, 2013.
Savings from Restructuring Plans
The 2014 and 2013 severance actions resulted in cost reductions of approximately $20 and $16, respectively, on an annualized basis. The impact of these benefits is spread across our operating expenses, primarily in the selling, general and administrative expense caption of our Consolidated Statements of Income. The severance actions also resulted in cash savings of approximately $17 and $16, respectively, on an annualized basis. The impact on liquidity was not material for any of our restructuring plans.
CLIENT CONCENTRATION
During 2014, our three largest clients accounted for 31.4% of our consolidated revenues, compared to 45.8% and 47.8% in 2013 and 2012, respectively. AT&T, our largest client, accounted for 15.3% of our consolidated revenues in 2014 compared to 20.9% and 23.1% in 2013 and 2012, respectively. Revenues from DIRECTV were less than 10% of our consolidated revenues in 2014 compared to 12.5% and 12.3% in 2013 and 2012, respectively. Revenues from Comcast were less than 10% of our consolidated revenues in 2014 compared to 12.4% in both 2013 and 2012. This improvement in client concentration is principally the result of the broader revenue base resulting from the Stream acquisition. Volumes under certain of our long-term arrangements are earned under multiple contracts with these clients and are subject to variation based on, among other things, general economic conditions, client outsourcing trends and seasonal patterns in our clients' businesses.
BUSINESS OUTLOOK
Convergys expectations for 2015 improvement in revenue, EBITDA and EPS include:
• | Revenue of $2.970 billion to $3.050 billion, including approximately $0.045 billion negative impact of current foreign exchange rates compared with 2014 rates, increasing from prior year $2.856 billion; |
• | Adjusted EBITDA of $375 million to $395 million, increasing from prior year $357 million; |
• | Adjusted effective tax rate to approximate 23 percent; |
• | Diluted shares outstanding to approximate 106 million; |
• | Adjusted Earnings per Diluted Common Share of $1.65 to $1.75, increasing from prior year $1.60. |
Convergys Corporation 2014 Annual Report 26
The Company expects normal seasonal impacts on revenue, EBITDA and EPS in the first quarter and second quarter of 2015 with sequential improvement in quarterly results beginning in the third quarter.
Not included in this outlook are acquisition-related impacts such as integration costs, intangible amortization and depreciation related to the fair value write-up of acquired property and equipment, and tax expense associated with cash repatriation. Also not included are impacts from non-cash pension settlement charges or any future share repurchase activities.
FINANCIAL CONDITION, LIQUIDITY AND CAPTIAL RESOURCES
Liquidity and Cash Flows
We believe that we have adequate liquidity from existing cash and expected future cash flows to fund operations, invest in the business, make required debt payments and pay dividends at the discretion of the Board of Directors for the next twelve months. We also believe available borrowings under existing credit facilities will provide additional ability to invest in the business. As of December 31, 2014, 64% of our cash and short term investments balance of $211.9 was held in accounts outside of the United States, most of which would be subject to additional taxes if repatriated to the United States.
Cash flows from operating activities generally provide us with a significant source of funding for our investing and financing activities. Cash flows for 2014, 2013, and 2012 were as follows:
2014 | 2013 | 2012 | |||||||
Net cash flows from operating activities | |||||||||
Operating activities of continuing operations | $ | 261.0 | $ | 208.4 | $ | 103.9 | |||
Operating activities of discontinued operations | — | 1.6 | 9.1 | ||||||
$ | 261.0 | $ | 210.0 | $ | 113.0 | ||||
Net cash flows (used in) provided by investing activities | |||||||||
Investing activities of continuing operations | $ | (850.5 | ) | $ | (36.6 | ) | $ | (162.7 | ) |
Investing activities of discontinued operations | — | 1.0 | 425.3 | ||||||
$ | (850.5 | ) | $ | (35.6 | ) | $ | 262.6 | ||
Net cash flows provided by (used in) financing activities | |||||||||
Financing activities of continuing operations | $ | 207.6 | $ | (148.3 | ) | $ | (242.6 | ) | |
Financing activities of discontinued operations | — | — | (0.1 | ) | |||||
$ | 207.6 | $ | (148.3 | ) | $ | (242.7 | ) | ||
Cash flows from operating activities totaled $261.0 in 2014, compared to $210.0 in 2013, and $113.0 in 2012. Cash flows provided by continuing operations for 2014 was $261.0 compared to $208.4 and $103.9 in 2013 and 2012, respectively. The current year was negatively impacted by $27.4 of tax payments related to the repatriation of cash from certain non-U.S. subsidiaries to the U.S. and $36.4 of payments for transaction and integration related expenses. The net increase in the current year is principally due to higher operating income from continuing operations, largely attributable to the contribution from Stream's operations. The increase in 2013 compared to 2012 was primarily the result of higher operating income from continuing operations, combined with cash payments for income taxes during 2012 of $40 related to the completion of the sale of the Information Management business, $35 of cash payments made in 2012 to reduce long-term liabilities and approximately $20 of tax payments made in 2012 related to prior year internal restructurings. There were no cash flows provided by discontinued operations for 2014 compared to $1.6 and $9.1 in 2013 and 2012, respectively.
Cash flows used in investing activities were $850.5 during 2014, which included cash outflows of $802.6 (net of cash acquired) for the purchase of Stream's operations, $116.7 of capital expenditures and $7.2 for the purchase of short-term investments, partially offset by $75.9 in proceeds from the maturity of short-term investments and $0.1 in proceeds from disposition of assets. Cash flows used in investing activities were $35.6 during 2013, which included $1.0 provided by discontinued operations, $63.8 of capital expenditures and $175.3 of purchases of short-term investments and $16.4 used for acquisitions, partially offset by $48.0 of proceeds from the disposition of assets and $170.9 in proceeds from the maturity of short-term investments. Cash flows provided by investing activities were $262.6 in 2012, which included $425.3 provided by discontinued operations as a result of the sale of
Convergys Corporation 2014 Annual Report 27
the Information Management business, partially offset by $98.4 of capital expenditures and $64.3 of purchases of short-term investments, net of maturity of short-term investments.
Cash flows provided by financing activities were $207.6 during 2014, compared to cash flows used in financing activities of $148.3 and $242.7 during 2013 and 2012, respectively. Activity in the current year included $344.9 of net proceeds from the issuance of other long-term debt related to the new Credit Agreement entered into in connection with the acquisition of Stream and repayments of other long-term debt of $107.1. Additionally, we had net proceeds from the Asset Securitization Facility of $40.0, repurchased 2.3 of the Company's common shares for $45.4, paid $26.2 in cash dividends and paid $2.0 of debt issuance costs. We also received $1.9 of excess tax benefits from share-based payment arrangements and $1.5 from the exercise of stock options. The impact of shares repurchased on our cash flows used in financing activities does not include approximately $0.9 of the Company's common stock settled in cash subsequent to year-end. During 2013, we repurchased 7.0 shares of the Company's common stock for 122.6, paid $23.8 in cash dividends and repaid $5.9 on outstanding borrowings. These items were partially offset by $2.8 received from exercise of stock options and $1.2 from excess tax benefits from share-based compensation arrangements. The impact of share repurchases in 2013 includes approximately 0.3 shares of the Company's common stock settled for $3.6 in cash that were purchased in 2012 and settled in 2013. During 2012, we repurchased 12.0 shares of the Company's common stock for $180.8, repaid $66.5 on our outstanding borrowings, and paid $11.2 in cash dividends, partially offset by $10.9 received from exercise of stock options and $5.0 from excess tax benefits from share-based compensation arrangements. The impact of shared repurchased on our cash flows used in financing activities in 2012 does not include approximately 0.3 in shares of the Company's common stock settled for $3.6 in cash subsequent to year end.
As of December 31, 2014, our credit ratings and outlook were as follows:
Long-Term Debt | Outlook | |
Moody’s | Ba1 | Stable |
Standard and Poor’s | BB+ | Stable |
Our credit ratings and outlook could impact our ability to raise capital in the future as well as increase borrowing costs.
Free Cash Flow and Adjusted Free Cash Flow (non-GAAP measures)
We use free cash flow and adjusted free cash flow, non-GAAP measures, to assess the financial performance of the Company. We define free cash flow as cash flows from operating activities less capital expenditures. A reconciliation of the GAAP measure, net cash provided by operating activities, to the non-GAAP measures, free cash flow and adjusted free cash flow, is as follows:
2014 | 2013 | 2012 | |||||||
Net cash flow provided by operating activities under U.S. GAAP | $ | 261.0 | $ | 210.0 | $ | 113.0 | |||
Capital expenditures, net of proceeds from disposal of assets | (116.7 | ) | (63.8 | ) | (104.6 | ) | |||
Free cash flows (a non-GAAP measure) | $ | 144.3 | $ | 146.2 | $ | 8.4 | |||
Stream acquisition - cash paid for transaction and integration related expenses (A) | 36.4 | — | — | ||||||
Cash paid for taxes related to repatriation of non-U.S. cash to partially fund the Stream acquisition (A) | 27.4 | — | — | ||||||
Adjusted free cash flow (a non-GAAP measure) | $ | 208.1 | $ | 146.2 | $ | 8.4 | |||
(A) | Since these payments were associated with investment activity, we have excluded these amounts from our adjusted free cash flow calculation. |
Adjusted free cash flow was $208.1 for 2014, compared to $146.2 and $8.4 for 2013 and 2012, respectively. The increase of $61.9 from prior year was due to improved cash flows, including the acquired Stream operations and excluding the acquisition related items above. The increase in adjusted free cash flow of $137.8 from 2013 to 2012 was due to higher cash generated from operating activities, explained above, and decreased capital expenditures during 2013.
We believe that free cash flow and adjusted free cash flow are useful to investors because they relate the operating cash flow of the Company to the capital that is spent to continue and improve business operations, such as investment in the Company’s existing businesses. Further, free cash flow and adjusted free cash flow facilitate management’s ability to strengthen the Company’s balance sheet, to repay the Company’s debt obligations and to repurchase the Company’s common shares. We also believe the presentation
Convergys Corporation 2014 Annual Report 28
of these measures will enhance the investors' ability to analyze trends in the business and evaluate the Company's underlying performance relative to other companies in the industry. Limitations associated with the use of free cash flow and adjusted free cash flow include that they do not represent the residual cash flow available for discretionary expenditures as they do not incorporate certain cash payments including payments made on capital lease obligations or cash payments for business acquisitions. Management compensates for these limitations by utilizing the non-GAAP measures, free cash flow and adjusted free cash flow, and the GAAP measure, cash flows from operating activities, in its evaluation of performance. There are no material purposes for which we use these non-GAAP measures beyond the purposes described above.
Capital Resources, Off-Balance Sheet Arrangements and Contractual Commitments
At December 31, 2014, total capitalization was $1,667.4, consisting of $375.9 of short-term and long-term debt and capital lease obligations, $1,227.2 of equity and $64.3 of temporary equity associated with the convertible debentures conversion feature. At December 31, 2013, total capitalization was $1,350.7, consisting of $61.1 of short-term and long-term debt and capital lease obligations, $1,224.1 of equity and $65.5 of temporary equity associated with the convertible debentures conversion feature. The total debt-to-capital ratio at December 31, 2014 was 22.5%, which compares to 4.5% at December 31, 2013. This increase primarily resulted from an increase in total debt related to the Company's new $350.0 Term Loan, as well as $40.0 in outstanding borrowings under the Company's Asset Securitization Facility at December 31, 2014.
On February 28, 2014, the Company entered into a Credit Agreement establishing an unsecured credit facility in the aggregate amount of $650.0 (Credit Agreement). In connection with entering into the Credit Agreement, Convergys terminated the $300.0 Four-Year Competitive Advance and Revolving Credit Facility Agreement dated March 11, 2011 (the 2011 Credit Facility). The Credit Agreement consists of term loans (the Term Loan) in the aggregate amount of $350.0 and a revolving credit facility (the Revolving Credit Facility) in the amount of $300.0. The Company recorded the initial carrying amount of the Term Loan at $344.9, reflecting a discount of $5.1 resulting from fees paid directly to the lenders at issuance. The discount will be amortized over the life of the Term Loan using the effective interest rate method, and is included in interest expense in the Consolidated Statements of Income. The conditions for the funding of the Term Loan and the Revolving Credit Facility were satisfied on March 3, 2014. Both mature on March 3, 2019, unless extended pursuant to the terms of the Credit Agreement. Outstanding amounts bear interest at one of the rates described in the Credit Agreement. During 2014, $85.0 of voluntary Term Loan principal payments were made by the Company. The next required principal payment is not due until September 30, 2017. While amounts borrowed and repaid under the Revolving Credit Facility may be re-borrowed, amounts repaid under the Term Loan may not be borrowed again under the Credit Agreement. Total borrowing capacity available under the Revolving Credit Facility was $300.0, with $265.0 outstanding principal on the Term Loan as of December 31, 2014. The Credit Agreement contains certain affirmative and negative covenants, as well as terms and conditions that are customary for credit facilities of this type, including financial covenants for leverage and interest coverage ratios. The Company was in compliance with all covenants at December 31, 2014.
In the fourth quarter of 2009, the Company announced an offer to exchange one-thousand twenty dollars in principal amount of its 5.75% Junior Subordinated Convertible Debentures due September 2029 (2029 Convertible Debentures) for each one-thousand dollars in principal amount of its 4.875% Unsecured Senior Notes (4.875% Senior Notes) due December 15, 2009. We issued a total of $125.0 aggregate principal amount of the 2029 Convertible Debentures in exchange for $122.5 of the 4.875% Senior Notes. The entire balance of the 2029 Convertible Debentures was outstanding and convertible at the option of the holders as of December 31, 2014 and 2013.
During January 2014, the Company extended the terms of an asset securitization facility collateralized by accounts receivable of certain of the Company's subsidiaries, with a purchase limit of $150.0 expiring in January 2017. The asset securitization program is conducted through Convergys Funding Inc., a wholly-owned bankruptcy remote subsidiary. The asset securitization facility does not qualify for sale treatment under the authoritative guidance for the accounting for transfers and servicing of financial assets and extinguishments of liabilities. As of December 31, 2014, Convergys had drawn $40.0 in available funding from qualified receivables as part of the financing related to the acquisition of Stream. Amounts have been classified under this facility as a long-term debt within the Consolidated Balance Sheets. As of December 31, 2013, the facility was undrawn.
During 2014, we repurchased 2.3 of our common shares for $46.3 pursuant to outstanding authorizations. At December 31, 2014, the Company had the authority to repurchase an additional $87.1 of outstanding common shares pursuant to current authorizations. This is reflective of approval by the Company's Board of Directors in February 2013 to increase the remaining authorized share repurchases to $250.0 in the aggregate. The timing and terms of any future transactions will depend on a number of considerations
Convergys Corporation 2014 Annual Report 29
including market conditions and our liquidity and limits that may be applicable under the covenants in our credit agreement. The Company also repurchased 0.5 shares at an average price of $20.06 for aggregate proceeds of $9.5 subsequent to December 31, 2014, through February 18, 2015.
The following summarizes our contractual obligations at December 31, 2014, and the effect such obligations are expected to have on liquidity and cash flows in future periods:
Contractual Obligations | Total | Less Than 1 Year | 1-3 Years | After 3 Years | ||||||||
Debt and capital lease obligations (1) | $ | 444.2 | $ | 7.5 | $ | 92.3 | $ | 344.4 | ||||
Debt interest (2) | 129.7 | 13.7 | 37.8 | 78.2 | ||||||||
Operating leases (3) | 348.4 | 112.7 | 192.5 | 43.2 | ||||||||
Pension contributions (4) | 4.1 | 4.1 | — | — | ||||||||
Unrecognized tax benefits (5) | — | — | — | — | ||||||||
Total | $ | 926.4 | $ | 138.0 | $ | 322.6 | $ | 465.8 | ||||
(1) | See Note 7 of the Notes to Consolidated Financial Statements for further information. |
(2) | This includes interest expense on fixed and variable rate debt in addition to capital lease obligations. This includes only the cash payable component of interest expense in our 2029 Convertible Debentures, assumes the December 31, 2014 interest rate of 1.18% on the Asset Securitization Facility and assumes the December 31, 2014 interest rate of 1.9% paid with minimum amortization payments made on the Term Loan. |
(3) | See Note 11 of the Notes to Consolidated Financial Statements for further information. |
(4) | The Company met ERISA funding requirements for the 2015 plan year with contributions made in January 2015. Estimates for 2015 and beyond assume a 6.75% return on assets and Moving Ahead for Progress in the 21st Century Act (MAP-21) interest rates. Actual cash payments may vary based upon actual performance. |
(5) | Unrecognized tax benefits of $59.9 are excluded from this table as the uncertainty related to the amount and period of any cash settlement prevents the Company from making a reasonably reliable estimate. |
At December 31, 2014, we had outstanding letters of credit of approximately $25.5, bond obligations of approximately $2.6 related to performance and payment guarantees, and $30.0 related to performance and payment guarantees for our former HR Management line of business. Upon completion of the sale of the HR Management business to NorthgateArinso, we continue to be responsible for these bond obligations. Although NorthgateArinso is obligated to indemnify the Company for any and all losses, costs, liabilities and expenses incurred related to these performance bonds, the Company maintains a liability of approximately $0.4. We believe that any guarantee obligation that may arise related to performance and payment guarantees of continuing operations will not be material. The guarantee for this bond obligation expires in August 2016. We also have purchase commitments with telecommunications providers of approximately $17.3 for 2015.
During 2013 and 2014, our Board of Directors approved, and the Company has paid, the following dividends per common share:
Announcement Date | Record Date | Dividend Amount | Payment Date |
February 7, 2013 | March 22, 2013 | $0.06 | April 5, 2013 |
April 30, 2013 | June 21, 2013 | $0.06 | July 5, 2013 |
July 30, 2013 | September 20, 2013 | $0.06 | October 4, 2013 |
November 6, 2013 | December 27, 2013 | $0.06 | January 10, 2014 |
February 5, 2014 | March 21, 2014 | $0.06 | April 4, 2014 |
May 12, 2014 | June 19, 2014 | $0.07 | July 3, 2014 |
August 11, 2014 | September 19, 2014 | $0.07 | October 3, 2014 |
November 5, 2014 | December 26, 2014 | $0.07 | January 9, 2015 |
On February 18, 2015, we announced that our Board of Directors declared a quarterly cash dividend of $0.07 per common share to be paid on April 3, 2015 to shareholders of record as of March 20, 2015.
Convergys Corporation 2014 Annual Report 30
The Board expects that future cash dividends will be paid on a quarterly basis. However, any decision to pay future cash dividends will be subject to Board approval, and will depend on our future earnings, cash flow, financial condition, financial covenants and other relevant factors. We intend to continue to use cash dividends as a means of returning capital to our shareholders, subject to our ongoing review and determinations that cash dividends are in the best interests of our shareholders.
MARKET RISK
We are exposed to a variety of market risks, including the effects of changes in foreign currency exchange rates and interest rates. Market risk is the potential loss arising from adverse changes in market rates and prices. Our risk management strategy includes the use of derivative instruments to reduce the effects on our operating results and cash flows from fluctuations caused by volatility in currency exchange and interest rates. In using derivative financial instruments to hedge exposures to changes in exchange rates and interest rates, we expose ourselves to counterparty credit risk. We manage exposure to counterparty credit risk by entering into derivative financial instruments with investment grade-rated institutions that can be expected to perform fully under the terms of the agreements and by diversifying the number of financial institutions with which we enter into such agreements.
Interest Rate Risk
Convergys had $305.0 of variable rate debt outstanding as of December 31, 2014, associated with the Term Loan and Asset Securitization Facility. Therefore, Convergys is exposed to changes in interest rates. Holding other variables constant, including the total amount of outstanding indebtedness, a one hundred basis point increase in interest rates on our variable-rate debt would cause an estimated increase in interest expense of approximately $3.0 per year.
Foreign Currency Exchange Rate Risk
While most of our contracts are priced in U.S. Dollars, we recognize a substantial amount of revenue under contracts that are denominated in Australian Dollars, British Pounds and Euros. A significant increase in the value of the U.S. Dollar relative to these currencies may have a material adverse impact on the value of those revenues when translated to U.S. Dollars.
We serve many of our U.S.-based clients using contact center capacity outside of the U.S., primarily in the Philippines, India, Canada, China, Malaysia, Costa Rica, Colombia, Dominican Republic, El Salvador, Nicaragua and Honduras. Although the contracts with these clients are typically priced in U.S. Dollars, a substantial portion of the costs incurred to deliver services under these contracts are denominated in the local currency of the country where services are provided, which represents a foreign exchange exposure. As of December 31, 2014, we have hedged a portion of our exposure related to the anticipated cash flow requirements denominated in certain foreign currencies by entering into forward exchange contracts with several financial institutions to acquire a total of PHP 42,507.0 at a fixed price of $965.8 at various dates through September, 2017, INR 10,208.0 at a fixed price of $155.7 at various dates through December, 2017 and CAD 11.1 at a fixed price of $10.2 at various dates through December, 2015. The fair value of these derivative instruments as of December 31, 2014 is presented in Note 13 of the Notes to Consolidated Financial Statements. The potential loss in fair value at December 31, 2014 for such contracts resulting from a hypothetical 10% adverse change in currency exchange rates between the U.S. Dollar and the currencies above is approximately $113.2. This loss would be substantially mitigated by corresponding gains on the underlying exposures.
Other foreign currency exposures arise from transactions denominated in a currency other than the functional currency. We periodically enter into forward exchange contracts that are not designated as hedges. The purpose of these derivative instruments is to protect the Company against foreign currency exposure pertaining to receivables, payables and intercompany transactions that are denominated in currencies different from the functional currencies of the Company or the respective subsidiaries. The fair value of these derivative instruments not designated as hedges at December 31, 2014, was $0.3.
CRITICAL ACCOUNTING POLICIES AND ESTIMATES
We prepare our Financial Statements in conformity with accounting principles generally accepted in the United States. Our significant accounting policies are disclosed in Note 2 of Notes to Consolidated Financial Statements. The preparation of Financial Statements in accordance with accounting principles generally accepted in the United States requires us to make estimates and assumptions that affect reported amounts and related disclosures. On an ongoing basis, we evaluate our estimates and judgments in these areas based on historical experience and other relevant factors. Our estimates as of the date of the Financial Statements reflect our best judgment giving consideration to all currently available facts and circumstances. As such, these estimates may require adjustment in the future, as additional facts become known or as circumstances change.
Convergys Corporation 2014 Annual Report 31
We have identified below the accounting policies and estimates that we believe are most critical in compiling our statements of financial condition and operating results. We have reviewed these critical accounting policies and estimates and related disclosures with the Audit Committee of our Board of Directors.
Business Combinations
Accounting for acquisitions requires the Company to recognize separately from goodwill the assets acquired and the liabilities assumed at their acquisition date fair values. Goodwill as of the acquisition date is measured as the excess of consideration transferred over the net of the acquisition date fair values of the assets acquired and the liabilities assumed. While we use our best estimates and assumptions to accurately value assets acquired and liabilities assumed at the acquisition date as well as contingent consideration, where applicable, our estimates are inherently uncertain and subject to refinement. As a result, during the measurement period, which may be up to one year from the acquisition date, we record adjustments to the assets acquired and liabilities assumed with the corresponding offset to goodwill. Upon the conclusion of the measurement period or final determination of the values of assets acquired or liabilities assumed, whichever comes first, any subsequent adjustments are recorded to our consolidated statements of operations. Refer to Note 3 of the Notes to the Consolidated Financial Statements for a discussion of the Stream acquisition.
Goodwill
The Company has recorded on its Consolidated Balance Sheets goodwill of $850.7 and $589.4 at December 31, 2014 and 2013, respectively. This increase in 2014 was due to the Stream acquisition discussed in Note 3, as well as foreign currency translation. The Company tests goodwill for impairment annually as of October 1 and at other times if events have occurred or circumstances exist that indicate the carrying value of goodwill may no longer be recoverable.
The Company's reporting units are Customer Management - Agent Services and Customer Management - Customer Interaction Technology (CIT). Goodwill is allocated to the reporting units at the date the goodwill is initially recorded. Once goodwill has been allocated to the reporting units, it generally no longer retains its identification with a particular acquisition, but instead becomes identified with a reporting unit as a whole. As a result, all of the fair value of each reporting unit is available to support the value of goodwill allocated to the unit. As of December 31, 2014, the Company operated in one business segment as discussed in Note 17 of Notes to Consolidated Financial Statements.
Goodwill impairment testing is performed at the reporting unit level, one level below the business segment. As disclosed in Note 6 of Notes to Consolidated Financial Statements, we test goodwill for impairment annually as of October 1 and at other times if events have occurred or circumstances exist that indicate the carrying value of goodwill may no longer be recoverable, such as a significant adverse change in the business climate, a decision to sell or dispose of all or a significant portion of a reporting unit or a significant decline in the Company’s stock price.
For 2014, the Company tested goodwill for the Customer Management – Agent Services reporting unit, which includes 100% of the goodwill. As a result of the impairment of the CIT goodwill in the second quarter of 2012, only the Customer Management - Agent Services reporting unit carried a goodwill balance at October 1, 2014 and December 31, 2014.
The Company first assesses a range of qualitative factors including, but not limited to, macroeconomic conditions, industry conditions, the competitive environment, changes in the market for our products and services, regulatory and political developments, entity specific factors such as strategies and financial performance, when evaluating potential impairment for goodwill. If, after completing such assessment, it is determined more likely than not that the fair value of a reporting unit is less than its carrying value, we proceed to a two-step impairment test.
The first step compares the fair value of a reporting unit with its carrying amount, including the goodwill allocated to each reporting unit (Step 1). If the fair value of the reporting unit is in excess of the carrying value, the related goodwill is considered not to be impaired and no further analysis is necessary. If the carrying amount of the reporting unit exceeds the fair value, there is an indication of potential impairment and a second step of testing is performed to measure the amount of the impairment, if any, for that reporting unit.
When required, the second step compares the implied fair value of the reporting unit goodwill with the carrying amount of the reporting unit goodwill. The implied fair value of goodwill is determined in the same manner as the amount of goodwill recognized in a business combination, which is the excess of the fair value of the reporting unit determined in step one over the fair value of the net assets and identifiable intangibles as if the reporting unit were being acquired. Any excess of the carrying value of the
Convergys Corporation 2014 Annual Report 32
reporting unit goodwill over the implied fair value of the reporting unit goodwill will be recorded as an impairment loss. An impairment charge recognized cannot exceed the amount of goodwill allocated to a reporting unit and cannot be reversed subsequently even if the fair value of the reporting unit recovers.
Fair value of the reporting unit is determined using a combination of the market approach and the income approach. Under the market approach, fair value is based on revenue and earnings multiples for guideline public companies in the reporting unit's peer group. The market approach requires significant judgment regarding the selection of guideline companies. Under the income approach, fair value is dependent on the present value of net cash flows to be derived from the ownership. The income approach requires significant judgment including estimates about future cash flows and discount rates. The forecasted cash flows are based upon the Company’s long-term strategic business plan, and a terminal value is used to estimate the reporting units cash flows beyond this plan. The discount rate represents the weighted-average cost of capital, which is an estimate of the overall after-tax rate of return required by equity and debt market participants of a business enterprise. Both the market and income approaches require the use of significant judgments, including judgments about appropriate discount rates, perpetual growth rates and the timing of expected future cash flows. Discount rate assumptions are based upon an assessment of the risk inherent in the future cash flows.
The most recent annual impairment test performed as of October 1, 2014, indicated that the fair value of the Customer Management - Agent Services reporting unit was substantially in excess of its carrying value. Despite that excess, however, future impairment charges could still be required if a divestiture decision were made or other significant economic events occurred with respect to the reporting unit. Subsequent to our October 1, 2014 annual impairment test, no indications of an impairment were identified.
Other Intangible Assets
At December 31, 2014, we had a carrying value of $361.7 of other intangible assets, net of amortization, consisting of $342.1 in customer relationships, $13.1 in tradenames and $6.5 in software, which is classified in property, plant and equipment on the Consolidated Balance Sheets. As amortizable intangible assets, the Company evaluates the intangible assets for recoverability on an annual basis or if events or circumstances indicate a possible inability to recover their carrying amounts, by comparing estimates of undiscounted future cash flows to the carrying values of the related assets. Based on the results of testing, no impairment charges were recognized in 2014.
Property, Plant and Equipment
The cost of property, plant and equipment is depreciated by the straight-line method over the estimated useful lives of the assets. Buildings are generally depreciated over a 30-year life, software over a three- to eight-year life and equipment generally over a three-to-five-year life. Leasehold improvements are depreciated over the shorter of their estimated useful life or the remaining term of the associated lease. Assets held under capital leases are recorded at the lower of the net present value of the minimum lease payments or the fair value of the leased asset at the inception of the lease. Depreciation expense for assets held under captial lease is computed using the straight-line method over the shorter of the estimated useful lives of the assets or the period of the related lease. The Company reviews property, plant and equipment asset groups for impairment whenever events or changes in circumstances indicate the carrying amount of an asset may not be recoverable. The Company monitors these changes and events on at least a quarterly basis. Examples of events or changes in circumstances could include, but are not limited to, a prolonged economic downturn, current period operating or cash flow losses combined with a history of losses or a forecast of continuing losses associated with the use of an asset group, or a current expectation that an asset group will be sold or disposed of before the end of its previously estimated useful life. Recoverability is based upon projections of anticipated future undiscounted cash flows associated with the use and eventual disposal of the property, plant and equipment asset groups, as well as specific appraisals in certain instances. Reviews occur at the lowest level for which identifiable cash flows are largely independent of cash flows associated with other property, plant and equipment asset groups. If the future undiscounted cash flows result in a value that is less than the carrying value, then the long-lived asset is considered impaired and a loss is recognized based on the amount by which the carrying amount exceeds the estimated fair value. Various factors that the Company uses in determining the impact of these assessments include the expected useful lives of long-lived assets and our ability to realize any undiscounted cash flows in excess of the carrying amounts of such asset groups, and are affected primarily by changes in the expected use of the assets, changes in technology or development of alternative assets, changes in economic conditions, changes in operating performance and changes in expected future cash flows. As judgment is involved in determining the fair value of property, plant and equipment asset groups, there is risk that the carrying value of these assets may require adjustment in future periods.
During the second quarter of 2012, we committed to a plan to sell our Corporate office facilities in Cincinnati, Ohio. Accordingly, the property met the criteria to be classified as “Held-for-Sale” and was required to be measured at the lower of its carrying value
Convergys Corporation 2014 Annual Report 33
or fair value less costs to sell. We determined the fair value was less than its carrying amount; therefore we recognized an impairment loss of $42.6 ($27.0 after tax) included in asset impairment in the Consolidated Statements of Income. During 2013, we committed to sell a facility in Dallas, Texas. As of December 31, 2013 we recognized net impairment losses of $1.5 to adjust both facilities to fair value less costs to sell at the date of sale to a third-party buyer. Fair value and cost to sell estimates were based on corroborative market data. We completed the sale of both facilities in July 2013 resulting in cash collections of $47.6.
Income Taxes
The provision for income taxes includes income taxes paid, currently payable or receivable, and those deferred. Under U.S. GAAP, the Company recognizes deferred tax assets and liabilities based on the differences between the financial statement carrying amounts and the tax basis of assets and liabilities. The deferred tax assets and liabilities are determined based on the enacted tax rates expected to apply in the periods in which the deferred tax assets or liabilities are expected to be settled or realized.
The Company regularly reviews its deferred tax assets for recoverability and establishes a valuation allowance if it is more likely than not that some portion or all of a deferred tax asset will not be realized. The determination as to whether a deferred tax asset will be realized is made on a jurisdictional basis and is based on the evaluation of positive and negative evidence. This evidence includes historical pre-tax and taxable income, projected future taxable income, the expected timing of the reversal of existing temporary differences and the implementation of tax planning strategies. Projected future taxable income is based on expected results and assumptions as to the jurisdiction in which the income will be earned. The expected timing of the reversals of existing temporary differences is based on current tax law and the Company’s tax methods of accounting.
The Company also reviews its tax activities and evaluates uncertain tax positions using a two-step approach. The first step is to evaluate the tax position for recognition by determining whether the weight of available evidence indicates that it is more likely than not that the position will be sustained on audit, including resolution of related appeals or litigation processes, if any. The second step is to measure the tax benefit, which is the largest amount that is more than 50% likely of being realized upon ultimate settlement. The Company’s policy is to recognize interest and penalties accrued on unrecognized tax benefits as part of income tax expense. Significant judgment is required in determining our liability for uncertain tax positions. The application of tax laws and regulations is subject to legal and factual interpretation, judgment and uncertainty. Tax laws and regulations themselves are subject to change as a result of changes in fiscal policy, changes in legislation, the evolution of regulations and court rulings. Therefore, the actual liability for U.S. or foreign taxes may be significantly different from our estimates, which could result in the need to record additional tax liabilities or potentially reverse previously recorded tax liabilities. We believe that we make a reasonable effort to ensure accuracy in our judgments and estimates.
Other
We have made certain other estimates that, while not involving the same degree of judgment, are important to understanding our financial statements. These estimates are in the areas of measuring our obligations related to our defined benefit plans and self-insurance accruals.
NEW ACCOUNTING PRONOUNCEMENTS
For a discussion and analysis of recently issued accounting pronouncements and its impact on Convergys, see Note 2 of Notes to Consolidated Financial Statements.
Convergys Corporation 2014 Annual Report 34
ITEM 7A. QUANTITATIVE AND QUALITATIVE DISCLOSURES ABOUT MARKET RISK
The information required by Item 7A is included in Item 7 of this Form 10-K.
ITEM 8. FINANCIAL STATEMENTS AND SUPPLEMENTARY DATA
Beginning on page 37 are the Consolidated Financial Statements with applicable notes and the related Report of Independent Registered Public Accounting Firm, the supplementary financial information specified by Item 302 of Regulation S-K and Financial Statement Schedule II – Valuation and Qualifying Accruals.
Convergys Corporation 2014 Annual Report 35
REPORT OF INDEPENDENT REGISTERED PUBLIC ACCOUNTING FIRM
The Board of Directors and Shareholders of Convergys Corporation
We have audited the accompanying consolidated balance sheets of Convergys Corporation as of December 31, 2014 and 2013, and the related consolidated statements of income, comprehensive income, shareholders’ equity, and cash flows for each of the three years in the period ended December 31, 2014. Our audits also included the financial statement schedule listed in the Index at Item 15(a). These financial statements and schedule are the responsibility of the Company’s management. Our responsibility is to express an opinion on these financial statements and schedule based on our audits.
We conducted our audits in accordance with the standards of the Public Company Accounting Oversight Board (United States). Those standards require that we plan and perform the audit to obtain reasonable assurance about whether the financial statements are free of material misstatement. An audit includes examining, on a test basis, evidence supporting the amounts and disclosures in the financial statements. An audit also includes assessing the accounting principles used and significant estimates made by management, as well as evaluating the overall financial statement presentation. We believe that our audits provide a reasonable basis for our opinion.
In our opinion, the financial statements referred to above present fairly, in all material respects, the consolidated financial position of Convergys Corporation at December 31, 2014 and 2013, and the consolidated results of its operations and its cash flows for each of the three years in the period ended December 31, 2014, in conformity with U.S. generally accepted accounting principles. Also, in our opinion, the related financial statement schedule, when considered in relation to the basic financial statements taken as a whole, presents fairly in all material respects the information set forth therein.
We also have audited, in accordance with the standards of the Public Company Accounting Oversight Board (United States), Convergys Corporation’s internal control over financial reporting as of December 31, 2014, based on criteria established in Internal Control-Integrated Framework issued by the Committee of Sponsoring Organizations of the Treadway Commission (2013 framework) and our report dated February 18, 2015, expressed an unqualified opinion thereon.
/s/ Ernst & Young LLP |
Cincinnati, Ohio |
February 18, 2015 |
Convergys Corporation 2014 Annual Report 36
CONSOLIDATED STATMENTS OF INCOME
Year Ended December 31, | |||||||||
(Amounts in millions except per share amounts) | 2014 | 2013 | 2012 | ||||||
Revenues | $ | 2,855.5 | $ | 2,046.1 | $ | 2,005.0 | |||
Costs and Expenses: | |||||||||
Cost of providing services and products sold (1) | 1,814.5 | 1,335.1 | 1,289.5 | ||||||
Selling, general and administrative | 677.1 | 465.0 | 477.2 | ||||||
Research and development costs | 7.7 | 8.2 | 10.8 | ||||||
Depreciation | 142.9 | 85.5 | 82.4 | ||||||
Amortization | 24.7 | 5.3 | 6.3 | ||||||
Restructuring charges | 1.7 | 5.4 | 11.6 | ||||||
Asset impairment charges and other | (1.6 | ) | 1.5 | 88.6 | |||||
Transaction and integration costs | 37.7 | 2.7 | — | ||||||
Total costs and expenses | 2,704.7 | 1,908.7 | 1,966.4 | ||||||
Operating Income | 150.8 | 137.4 | 38.6 | ||||||
Other (expense) income, net | (2.2 | ) | 5.1 | 4.3 | |||||
Interest expense | (19.3 | ) | (11.5 | ) | (13.6 | ) | |||
Income before Income Taxes | 129.3 | 131.0 | 29.3 | ||||||
Income tax expense | 12.8 | 72.5 | 1.1 | ||||||
Income from Continuing Operations, net of tax | 116.5 | 58.5 | 28.2 | ||||||
Income from Discontinued Operations, net of tax | 3.5 | 2.4 | 72.4 | ||||||
Net Income | $ | 120.0 | $ | 60.9 | $ | 100.6 | |||
Basic Earnings per Common Share: | |||||||||
Continuing Operations | $ | 1.16 | $ | 0.57 | $ | 0.25 | |||
Discontinued Operations | 0.03 | 0.02 | 0.65 | ||||||
Basic Earnings per Common Share | $ | 1.19 | $ | 0.59 | $ | 0.90 | |||
Diluted Earnings per Common Share: | |||||||||
Continuing Operations | $ | 1.10 | $ | 0.54 | $ | 0.24 | |||
Discontinued Operations | 0.03 | 0.02 | 0.62 | ||||||
Diluted Earnings per Common Share | $ | 1.13 | $ | 0.56 | $ | 0.86 | |||
Weighted Average Common Shares Outstanding: | |||||||||
Basic | 100.7 | 103.3 | 112.2 | ||||||
Diluted | 106.2 | 109.2 | 117.1 | ||||||
Cash dividends declared per share | $ | 0.27 | $ | 0.24 | $ | 0.15 | |||
(1) | Exclusive of depreciation and amortization, with the exception of amortization of deferred charges. |
The accompanying notes are an integral part of the Consolidated Financial Statements.
Convergys Corporation 2014 Annual Report 37
CONSOLIDATED STATEMENTS OF COMPREHENSIVE INCOME
Year Ended December 31, | |||||||||
(In millions) | 2014 | 2013 | 2012 | ||||||
Net Income | $ | 120.0 | $ | 60.9 | $ | 100.6 | |||
Other Comprehensive (Loss) Income, net of tax: | |||||||||
Foreign currency translation adjustments | (36.2 | ) | (1.3 | ) | 22.3 | ||||
Change related to pension liability (net of tax (expense) benefit of $8.6, ($17.1) and ($0.6)) | (15.2 | ) | 26.2 | 1.0 | |||||
Unrealized gain (loss) on hedging activities (net of reclassification adjustments and net of tax benefit (expense) of ($2.9), $21.4 and ($8.1)) | 4.2 | (33.9 | ) | 12.9 | |||||
Total other comprehensive (loss) income | (47.2 | ) | (9.0 | ) | 36.2 | ||||
Total Comprehensive Income | $ | 72.8 | $ | 51.9 | $ | 136.8 | |||
The accompanying notes are an integral part of the Consolidated Financial Statements.
Convergys Corporation 2014 Annual Report 38
CONSOLIDATED BALANCE SHEETS
At December 31, | ||||||
(Amounts in millions) | 2014 | 2013 | ||||
ASSETS | ||||||
Current Assets: | ||||||
Cash and cash equivalents | $ | 198.9 | $ | 580.8 | ||
Short term investments | 13.0 | 82.9 | ||||
Receivables, net of allowances of $8.1 and $5.3 | 511.1 | 319.8 | ||||
Deferred income tax assets | 107.2 | 6.2 | ||||
Prepaid expenses | 28.9 | 25.2 | ||||
Other current assets | 31.8 | 45.5 | ||||
Total current assets | 890.9 | 1,060.4 | ||||
Property and equipment, net | 367.8 | 246.4 | ||||
Goodwill | 850.7 | 589.4 | ||||
Other intangibles, net | 355.2 | 20.4 | ||||
Deferred income tax assets | 8.2 | 8.9 | ||||
Other assets | 43.7 | 31.2 | ||||
Total Assets | $ | 2,516.5 | $ | 1,956.7 | ||
LIABILITIES AND SHAREHOLDERS' EQUITY | ||||||
Current Liabilities: | ||||||
Debt and capital lease obligations maturing within one year | $ | 7.5 | $ | 0.9 | ||
Payables and other current liabilities | 361.0 | 291.7 | ||||
Total current liabilities | 368.5 | 292.6 | ||||
Long-term debt and capital lease obligations | 368.4 | 60.2 | ||||
Deferred income tax liabilities | 275.6 | 150.8 | ||||
Accrued pension liabilities | 116.9 | 73.7 | ||||
Other long-term liabilities | 95.6 | 89.8 | ||||
Total liabilities | 1,225.0 | 667.1 | ||||
Convertible debentures conversion feature | 64.3 | 65.5 | ||||
Shareholders’ Equity: | ||||||
Preferred shares—without par value, 5.0 authorized; none issued or outstanding | — | — | ||||
Common shares—without par value, 500.0 authorized; 189.8 and 188.9 issued, 99.4 and 100.8 outstanding, as of December 31, 2014 and December 31, 2013, respectively | 1,077.5 | 1,074.4 | ||||
Treasury stock—90.4 shares in 2014 and 88.2 in 2013 | (1,491.2 | ) | (1,445.6 | ) | ||
Retained earnings | 1,707.6 | 1,614.8 | ||||
Accumulated other comprehensive loss | (66.7 | ) | (19.5 | ) | ||
Total shareholders’ equity | 1,227.2 | 1,224.1 | ||||
Total Liabilities and Shareholders’ Equity | $ | 2,516.5 | $ | 1,956.7 | ||
The accompanying notes are an integral part of the Consolidated Financial Statements.
Convergys Corporation 2014 Annual Report 39
CONSOLIDATED STATEMENTS OF CASH FLOWS
Year Ended December 31, | |||||||||
(Amounts in millions) | 2014 | 2013 | 2012 | ||||||
CASH FLOWS FROM OPERATING ACTIVITIES | |||||||||
Net income | $ | 120.0 | $ | 60.9 | $ | 100.6 | |||
Income from discontinued operations, net of tax | 3.5 | 2.4 | 72.4 | ||||||
Income from continuing operations, net of tax | 116.5 | 58.5 | 28.2 | ||||||
Adjustments to reconcile net income from continuing operations to net cash provided by operating activities of continuing operations: | |||||||||
Depreciation and amortization | 167.6 | 90.8 | 88.7 | ||||||
Asset impairment charges and other | (1.6 | ) | 1.5 | 88.6 | |||||
Deferred income tax (benefit) expense | (67.7 | ) | 63.9 | (4.2 | ) | ||||
Stock compensation expense | 8.4 | 13.4 | 20.2 | ||||||
Changes in assets and liabilities, net of acquisitions: | |||||||||
Change in receivables | (12.9 | ) | 4.5 | (14.1 | ) | ||||
Change in other current assets | 22.5 | 10.3 | (23.4 | ) | |||||
Change in deferred charges, net | 1.9 | 1.3 | 1.4 | ||||||
Change in other assets and liabilities | 15.8 | (3.6 | ) | (28.2 | ) | ||||
Change in payables and other current liabilities | 10.5 | (32.1 | ) | (56.5 | ) | ||||
Other, net | — | (0.1 | ) | 3.2 | |||||
Net cash provided by operating activities of continuing operations | 261.0 | 208.4 | 103.9 | ||||||
Net cash provided by operating activities of discontinued operations | — | 1.6 | 9.1 | ||||||
Net cash provided by operating activities | 261.0 | 210.0 | 113.0 | ||||||
CASH FLOWS FROM INVESTING ACTIVITIES | |||||||||
Capital expenditures | (116.7 | ) | (63.8 | ) | (98.4 | ) | |||
Proceeds from disposition of assets | 0.1 | 48.0 | — | ||||||
Purchase of short-term investments | (7.2 | ) | (175.3 | ) | (83.3 | ) | |||
Proceeds from maturity of short-term investments | 75.9 | 170.9 | 19.0 | ||||||
Acquisitions, net of cash acquired | (802.6 | ) | (16.4 | ) | — | ||||
Net cash used in investing activities of continuing operations | (850.5 | ) | (36.6 | ) | (162.7 | ) | |||
Net cash provided by investing activities of discontinued operations | — | 1.0 | 425.3 | ||||||
Net cash (used in) provided by investing activities | (850.5 | ) | (35.6 | ) | 262.6 | ||||
CASH FLOWS FROM FINANCING ACTIVITIES | |||||||||
Proceeds from issuance of other long-term debt | 344.9 | — | — | ||||||
Repayments of other long-term debt (term loan and capital lease obligations) | (107.1 | ) | (5.9 | ) | (66.5 | ) | |||
Proceeds from Asset Securitization Facility | 514.0 | — | — | ||||||
Repayment of Asset Securitization Facility | (474.0 | ) | — | — | |||||
Repurchase of common shares | (45.4 | ) | (122.6 | ) | (180.8 | ) | |||
Proceeds from exercise of stock options | 1.5 | 2.8 | 10.9 | ||||||
Cash paid for debt issuance costs | (2.0 | ) | — | — | |||||
Payments of dividends | (26.2 | ) | (23.8 | ) | (11.2 | ) | |||
Excess tax benefit from share-based payment arrangements | 1.9 | 1.2 | 5.0 | ||||||
Net cash provided by (used in) financing activities of continuing operations | 207.6 | (148.3 | ) | (242.6 | ) | ||||
Net cash used in financing activities of discontinued operations | — | — | (0.1 | ) | |||||
Net cash provided by (used in) financing activities | 207.6 | (148.3 | ) | (242.7 | ) | ||||
Net (decrease) increase in cash and cash equivalents | (381.9 | ) | 26.1 | 132.9 | |||||
Cash and cash equivalents at beginning of period | 580.8 | 554.7 | 421.8 | ||||||
Cash and cash equivalents at end of period | $ | 198.9 | $ | 580.8 | $ | 554.7 | |||
SUPPLEMENTAL CASH FLOW INFORMATION | |||||||||
Cash paid for interest | $ | 16.6 | $ | 11.2 | $ | 13.7 | |||
Income taxes paid/(refunded), net | $ | 52.7 | $ | (5.7 | ) | $ | 68.2 | ||
The accompanying notes are an integral part of the Consolidated Financial Statements.
Convergys Corporation 2014 Annual Report 40
CONSOLIDATED STATEMENTS OF SHAREHOLDERS' EQUITY
(Amounts in millions) | Number of Common Shares | Common Shares | Treasury Stock | Retained Earnings | Accumulated Other Comprehensive Loss | Total | |||||||||||
Balance at December 31, 2011 | 185.0 | $ | 1,111.8 | $ | (1,149.1 | ) | $ | 1,495.5 | $ | (46.7 | ) | $ | 1,411.5 | ||||
Issuance of common shares | 2.5 | — | — | — | — | — | |||||||||||
Treasury shares issued for share-based plans, net | — | — | 4.3 | (1.0 | ) | — | 3.3 | ||||||||||
Tax related to share-based arrangements, net of excess tax benefits | — | (14.6 | ) | — | — | — | (14.6 | ) | |||||||||
Proceeds from exercise of stock options | — | 10.9 | — | — | — | 10.9 | |||||||||||
Repurchase of common shares | — | — | (184.4 | ) | — | — | (184.4 | ) | |||||||||
Net income | — | — | — | 100.6 | — | 100.6 | |||||||||||
Other comprehensive loss | — | — | — | — | 36.2 | 36.2 | |||||||||||
Cash dividends declared | — | — | — | (16.5 | ) | — | (16.5 | ) | |||||||||
Amortization of stock-based compensation | — | 24.9 | — | — | — | 24.9 | |||||||||||
Balance at December 31, 2012 | 187.5 | 1,133.0 | (1,329.2 | ) | 1,578.6 | (10.5 | ) | 1,371.9 | |||||||||
Issuance of common shares | 1.4 | — | — | — | — | — | |||||||||||
Treasury shares issued for share-based plans, net | — | 0.1 | 2.6 | — | — | 2.7 | |||||||||||
Tax related to share-based arrangements, net of excess tax benefits | — | (9.4 | ) | — | — | — | (9.4 | ) | |||||||||
Proceeds from exercise of stock options | — | 2.8 | — | — | — | 2.8 | |||||||||||
Repurchase of common shares | — | — | (119.0 | ) | — | — | (119.0 | ) | |||||||||
Net income | — | — | — | 60.9 | — | 60.9 | |||||||||||
Other comprehensive income | — | — | — | — | (9.0 | ) | (9.0 | ) | |||||||||
Cash dividends declared | — | — | — | (24.7 | ) | — | (24.7 | ) | |||||||||
Amortization of stock-based compensation | — | 13.4 | — | — | — | 13.4 | |||||||||||
Convertible notes conversion feature | — | (65.5 | ) | — | — | — | (65.5 | ) | |||||||||
Balance at December 31, 2013 | 188.9 | 1,074.4 | (1,445.6 | ) | 1,614.8 | (19.5 | ) | 1,224.1 | |||||||||
Issuance of common shares | 0.9 | — | — | — | — | — | |||||||||||
Treasury shares issued for share-based plans, net | — | 0.3 | 0.7 | — | — | 1.0 | |||||||||||
Tax related to share-based arrangements, net of excess tax benefits | — | (8.3 | ) | — | — | — | (8.3 | ) | |||||||||
Proceeds from exercise of stock options | — | 1.5 | — | — | — | 1.5 | |||||||||||
Repurchase of common shares | — | — | (46.3 | ) | — | — | (46.3 | ) | |||||||||
Net income | — | — | — | 120.0 | — | 120.0 | |||||||||||
Other comprehensive loss | — | — | — | — | (47.2 | ) | (47.2 | ) | |||||||||
Cash dividends declared | — | — | — | (27.2 | ) | — | (27.2 | ) | |||||||||
Amortization of stock-based compensation | — | 8.4 | — | — | — | 8.4 | |||||||||||
Convertible notes conversion feature | — | 1.2 | — | — | — | 1.2 | |||||||||||
Balance at December 31, 2014 | 189.8 | $ | 1,077.5 | $ | (1,491.2 | ) | $ | 1,707.6 | $ | (66.7 | ) | $ | 1,227.2 | ||||
Convergys Corporation 2014 Annual Report 41
The accompanying notes are an integral part of the Consolidated Financial Statements.
Convergys Corporation 2014 Annual Report 42
NOTES TO CONSOLIDATED FINANCIAL STATEMENTS
(Amounts in millions except share and per share amounts)
1. BACKGROUND AND BASIS OF PRESENTATION
Convergys Corporation (the Company or Convergys) is a global customer management leader, focused on bringing value to its clients through every customer interaction.
On March 3, 2014, Convergys completed its acquisition of SGS Holdings, Inc. (Stream), a global customer management leader, providing technical support, customer care and sales, for Fortune 1000 companies. This acquisition expanded the Company's geographic footprint and capabilities, adding approximately 40,000 employees in 22 countries. Combined, Convergys now has 125,000 employees working out of more than 150 locations in 31 countries, interacting with our clients' customers in 47 languages. Stream's complementary client portfolio also diversifies Convergys' client base through the addition of leading technology, communications and other clients. Stream's operating results are included in Convergys' Consolidated Statements of Income beginning on March 3, 2014, and contributed revenue of $834.8 during 2014.
2. SIGNIFICANT ACCOUNTING POLICIES
Principles of Consolidation and Basis of Presentation
The accompanying Consolidated Financial Statements have been prepared in accordance with accounting principles generally accepted in the United States of America (U.S. GAAP) and U.S. Securities and Exchange Commission regulations. The Consolidated Financial Statements include the accounts of the Company’s majority-owned subsidiaries. All material intercompany accounts and transactions are eliminated upon consolidation.
Reclassification
Certain prior year balances in the Consolidated Statements of Income have been reclassified to conform to the current year presentation. The reclassifications were not material to the Consolidated Financial Statements.
Use of Estimates, Risks and Uncertainties
The preparation of the Consolidated Financial Statements in conformity with U.S. GAAP requires management to make estimates and assumptions that affect the amounts reported. These estimates include, but are not limited to, project completion dates, time and cost required to complete projects for purposes of revenue recognition and future revenue, expense and cash flow estimates for purposes of impairment analysis and loss contract evaluation. Actual results could differ from those estimates.
The Company’s results are affected by economic, political, legislative, regulatory and legal actions. Economic conditions, such as recessionary trends, inflation, interest and monetary exchange rates, and government fiscal policies, can have a significant effect on operations. While the Company maintains reserves for anticipated liabilities and carries various levels of insurance, the Company could be affected by civil, criminal, regulatory or administrative actions, claims or proceedings.
Foreign Currency Translation
Assets and liabilities of foreign operations are translated to U.S. Dollars at year-end exchange rates. Revenues and expenses are translated at average exchange rates for the year. Translation adjustments are accumulated and reflected as adjustments to other comprehensive (loss) income, a component of Shareholders’ Equity, and included in net earnings only upon sale or liquidation of the underlying foreign subsidiary. Gains or losses resulting from foreign exchange transactions related to balance sheet positions are recorded in the Consolidated Statements of Income within Other (expense) income, net.
Revenue Recognition
Revenues mostly consist of fees generated from outsourced services provided to the Company’s clients. Approximately 94% of the Company's revenues are derived from agent-related services. The Company typically recognizes these revenues as services are performed based on staffing hours or the number of contacts handled by service agents using contractual rates. The remaining revenues are derived from the sale of premise-based and hosted automated self-care and technology solutions and provision of professional services. Revenues from the sale of these solutions and provision of services are typically recognized as services are provided over the duration of the contract using contractual rates.
Revenues are recognized only when the services are performed, there is evidence of an arrangement, the Company determines that the fee is fixed and determinable and collection of the fee included in the arrangement is considered probable. When determining whether the fee is considered fixed and determinable and collection is probable, the Company considers a number of factors including the creditworthiness of the client and the contractual payment terms. If a client is not considered creditworthy, all revenue under arrangements with that client is recognized upon receipt of cash. If payment terms extend beyond what is considered
Convergys Corporation 2014 Annual Report 43
customary or standard in the related industry and geographic location, the related fees are considered extended and deferred until they become due and payable.
The Company considers the criteria established primarily by Accounting Standards Codification (ASC) Topic 605-45, “Principal Agent Considerations,” (ASC 605-45) in determining whether revenue should be recognized on a gross versus a net basis. Factors considered in determining if gross or net basis recognition is appropriate include whether the Company is primarily responsible to the client for the services, has discretion on vendor selection, or bears credit risk. The Company provides certain services to clients using third-party vendors. Typically, the costs incurred with third-party vendors related to these services are passed through to the clients. In consideration of the above mentioned criteria, the Company recognizes the net amount of total payments received from clients related to these services and total payments made by the Company to third-party vendors as cost of providing services and products sold.
The Company may earn supplemental revenues depending on the satisfaction of certain service levels or achievement of certain performance measurement targets. The supplemental revenues are recognized only after required measurement targets are met and the other criteria for recognition are satisified.
Stock-Based Compensation
The Company accounts for stock-based payment transactions in which the Company receives employee services in exchange for equity instruments of the Company. Stock-based compensation cost for restricted stock awards and restricted stock units and performance restricted stock units is measured based on the closing fair market value of the Company's common stock on the date of grant. Stock-based compensation cost for stock options is estimated at the grant date based on each option's fair-value as calculated by the Black-Scholes option-pricing model. The Company recognizes stock-based compensation cost as expense for awards other than its performance-based restricted stock units ratably on a straight-line basis over the requisite service period. The Company recognizes stock-based compensation cost associated with its performance based restricted stock units over the requisite service period if it is probable that the performance conditions will be satisfied. The Company will recognize a benefit from stock-based compensation in equity if an incremental tax benefit is realized by following the ordering provisions of the tax law. Tax benefits related to stock compensation expense are reported as financing cash flow and tax expenses are reported as operating cash flow. Further, the Company applies an estimated forfeiture rate to unvested awards when computing the stock compensation-related expenses.
Income Taxes
The provision for income taxes includes taxes paid, currently payable or receivable, and those deferred. Under U.S. GAAP, the Company recognizes deferred tax assets and liabilities based on the differences between the financial statement and tax basis of assets and liabilities using enacted tax rates in effect for the year in which the differences are expected to be settled or realized.
The Company regularly reviews its deferred tax assets for recoverability and establishes a valuation allowance if it is more likely than not that some portion or all of a deferred tax asset will not be realized. The determination as to whether a deferred tax asset will be realized is made on a jurisdictional basis and is based on the evaluation of positive and negative evidence. This evidence includes historical pre-tax and taxable income, projected future taxable income, the expected timing of the reversal of existing temporary differences and the implementation of tax planning strategies. Projected future taxable income is based on expected results and assumptions as to the jurisdiction in which the income will be earned. The expected timing of the reversals of existing temporary differences is based on current tax law and the Company’s tax methods of accounting.
The Company also reviews its tax activities and evaluates uncertain tax positions using a two-step approach. The first step is to evaluate the tax position for recognition by determining if the weight of available evidence indicates that it is more likely than not that the position will be sustained on audit, including resolution of related appeals or litigation processes, if any. The second step is to measure the tax benefit, which is the largest amount that is more than 50% likely of being realized upon ultimate settlement. The Company’s policy is to recognize interest and penalties accrued on unrecognized tax benefits as part of income tax expense.
Other Comprehensive Income (Loss)
Components of other comprehensive (loss) income include currency translation adjustments, changes related to pension liabilities, net of tax, and unrealized (losses) gains on hedging activities, net of tax. Foreign currency translation adjustments generally are not adjusted for income taxes as they relate to indefinite investments in non-U.S. operations. Accumulated other comprehensive (loss) income also includes, net of tax, actuarial gains or losses, prior service costs or credits and transition assets and obligations that are not recognized currently as components of net periodic pension cost.
Concentration of Credit Risk
In the normal course of business, the Company is exposed to credit risk. The principal concentrations of credit risk are cash and cash equivalents, short-term investments, accounts receivable and derivative instruments. The Company regularly monitors credit
Convergys Corporation 2014 Annual Report 44
risk exposures and takes steps to mitigate the likelihood of these exposures resulting in a loss. Historically, credit losses on accounts receivable have not been material because of the large concentration of revenues with a small number of large, established companies. The Company does not require collateral or other security to support accounts receivable. The Company evaluates the creditworthiness of its clients in conjunction with its revenue recognition processes, as discussed above, as well as through its ongoing collectability assessment processes for accounts receivable. The Company maintains an allowance for doubtful accounts receivable based upon factors surrounding the credit risk of specific clients, historical trends and other information. The Company limits its counterparty credit risk exposures by entering into derivative contracts with financial institutions that are investment grade rated.
Cash and Cash Equivalents
Cash and cash equivalents consist of cash on hand and short-term, highly liquid investments with original maturities of three months or less.
Receivables and Allowance for Doubtful Accounts
Trade receivables are comprised primarily of amounts owed to the Company by clients and are presented net of an allowance for doubtful accounts of $8.1 and $5.3 at December 31, 2014 and 2013, respectively. Contracts with individual clients determine when receivables are due, generally within 30-60 days, and whether interest is accrued on late payments.
The allowance for doubtful accounts is the Company’s best estimate of the amount of probable credit losses in the Company’s existing accounts receivable. The Company regularly reviews the adequacy of its allowance for doubtful accounts. The Company determines the allowance based on historical write-off experience and current economic conditions and also considers factors such as customer credit, past transaction history with the customer and changes in customer payment terms when determining whether the collection of a receivable is reasonably assured. Account balances are charged off against the allowance after all means of collection have been exhausted and the potential for recovery is considered remote.
Property and Equipment
Property and equipment are stated at cost. Depreciation is based on the straight-line method over the estimated useful lives of the assets. Buildings are generally depreciated over a 30-year life, software over a three- to eight-year life and equipment generally over a three-to-five-year life. Leasehold improvements are depreciated over the shorter of their estimated useful life or the remaining term of the associated lease. Assets held under capital leases are recorded at the lower of the net present value of the minimum lease payments or the fair value of the leased asset at the inception of the lease. Depreciation expense for assets held under captial lease is computed using the straight-line method over the shorter of the estimated useful lives of the assets or the period of the related lease. Included within Property and equipment is initial cost of $64.6 related to assets under capital lease arrangements.
The Company reviews property and equipment asset groups for impairment whenever events or changes in circumstances indicate the carrying amount of an asset may not be recoverable. The Company monitors these changes and events on at least a quarterly basis. Examples of events or changes in circumstances could include, but are not limited to, a prolonged economic downturn, current period operating or cash flow losses combined with a history of losses or a forecast of continuing losses associated with the use of an asset group, or a current expectation that an asset group will be sold or disposed of before the end of its previously estimated useful life. Recoverability is based upon projections of anticipated future undiscounted cash flows associated with the use and eventual disposal of the property and equipment asset groups, as well as specific appraisals in certain instances. Reviews occur at the lowest level for which identifiable cash flows are largely independent of cash flows associated with other property and equipment asset groups. If the future undiscounted cash flows result in a value that is less than the carrying value, then the long-lived asset is considered impaired and a loss is recognized based on the amount by which the carrying amount exceeds the estimated fair value. Various factors that the Company uses in determining the impact of these assessments include the expected useful lives of long-lived assets and our ability to realize any undiscounted cash flows in excess of the carrying amounts of such asset groups, and are affected primarily by changes in the expected use of the assets, changes in technology or development of alternative assets, changes in economic conditions, changes in operating performance and changes in expected future cash flows. Because judgment is involved in determining the fair value of property and equipment asset groups, there is risk that the carrying value of these assets may require adjustment in future periods.
Internal Use Software
The Company capitalizes certain expenditures for software that is purchased or internally developed for use in the business. During 2014, 2013, and 2012, internally developed software amounts capitalized were $4.9, $1.0 and $6.8, respectively. Amortization of internal use software begins when the software is ready for service and continues on the straight-line method over the estimated useful life.
Business Combinations
Convergys Corporation 2014 Annual Report 45
Accounting for acquisitions requires the Company to recognize separately from goodwill the assets acquired and the liabilities assumed at their acquisition date fair values. Goodwill as of the acquisition date is measured as the excess of consideration transferred over the net of the acquisition date fair values of the assets acquired and the liabilities assumed. While we use our best estimates and assumptions to accurately value assets acquired and liabilities assumed at the acquisition date as well as contingent consideration, where applicable, our estimates are inherently uncertain and subject to refinement. As a result, during the measurement period, which may be up to one year from the acquisition date, we record adjustments to the assets acquired and liabilities assumed with the corresponding offset to goodwill. Upon the conclusion of the measurement period or final determination of the values of assets acquired or liabilities assumed, whichever comes first, any subsequent adjustments are recorded to our consolidated statements of operations. Refer to Note 3 of the Notes to the Consolidated Financial Statements for a discussion of the Stream acquisition.
Goodwill and Other Intangibles
As discussed more fully in Note 6, goodwill is reviewed at the reporting unit level for impairment as of October 1 each year and at other times if events have occurred or circumstances exist that indicate the carrying value of goodwill may no longer be recoverable.
The first step compares the fair value of a reporting unit with its carrying amount, including the goodwill allocated to each reporting unit (Step 1). If the fair value of the reporting unit is in excess of the carrying value, the related goodwill is considered not to be impaired and no further analysis is necessary. If the carrying amount of the reporting unit exceeds the fair value, there is an indication of potential impairment and a second step of testing is performed to measure the amount of the impairment, if any, for that reporting unit.
When required, the second step compares the implied fair value of the reporting unit goodwill with the carrying amount of the reporting unit goodwill. The implied fair value of goodwill is determined in the same manner as the amount of goodwill recognized in a business combination, which is the excess of the fair value of the reporting unit determined in step one over the fair value of the net assets and identifiable intangibles as if the reporting unit were being acquired. Any excess of the carrying value of the reporting unit goodwill over the implied fair value of the reporting unit goodwill will be recorded as an impairment loss. An impairment charge recognized cannot exceed the amount of goodwill allocated to a reporting unit and cannot be reversed subsequently even if the fair value of the reporting unit recovers.
Fair value of the reporting unit is determined using a combination of the market approach and the income approach. Under the market approach, fair value is based on revenue and earnings multiples for guideline public companies in the reporting unit's peer group. The market approach requires significant judgment regarding the selection of guideline companies. Under the income approach, value is dependent on the present value of net cash flows to be derived from the ownership. The income approach requires significant judgment including estimates about future cash flows and discount rates. A combination of methodologies is used and weighted appropriately for reporting units with significant adverse changes in business climate.
Other intangibles, primarily customer relationship assets and trademarks, are amortized over a straight-line basis with estimated useful lives ranging from four to seventeen years and are evaluated periodically if events or circumstances indicate a possible inability to recover their carrying amounts.
Postemployment Benefits
The funded status of the Company’s pension and other postretirement benefit plans is recognized in the Consolidated Balance Sheets. The funded status is measured as the difference between the fair value of plan assets and the benefit obligation at December 31, the measurement date. For defined benefit pension plans, the benefit obligation is the projected benefit obligation (PBO) and for the other postretirement benefit plans the benefit obligation is the accumulated postretirement benefit obligation (APBO). The PBO represents the actuarial present value of benefits expected to be paid upon retirement. For active plans, the present value reflects estimated future compensation levels. The APBO represents the actuarial present value of postretirement benefits attributed to employee services already rendered. The fair value of plan assets represents the current market value of assets held by an irrevocable trust fund for the sole benefit of participants. The measurement of the benefit obligation is based on the Company’s estimates and actuarial valuations. These valuations reflect the terms of the plans and use participant-specific information such as compensation, age and years of service, as well as certain key assumptions that require significant judgment, including, but not limited to, estimates of discount rates, expected return on plan assets, rate of compensation increases, interest crediting rates and mortality rates. For additional information regarding plan assumptions and the current financial position of the pension and other postretirement plans, see Note 9.
The Company provides severance benefits to certain employees. The Company accrues the benefits when it becomes probable that such benefits will be paid and when sufficient information exists to make reasonable estimates of the amounts to be paid.
Convergys Corporation 2014 Annual Report 46
Government Grants
From time to time, the Company receives grants from local or state governments as an incentive to locate or retain operations in their jurisdictions. Depending on the arrangement, the grants are either received up-front or at the time the Company achieves the milestones set forth in the grant. The Company’s policy is to record the grant funds received as deferred credit and to amortize the deferred credit as a reduction of cost of providing services and products sold or selling, general and administrative expense as the milestones are met over the term of the grant.
Derivative Instruments
The Company’s risk management strategy includes the use of derivative instruments to reduce the effects on its operating results and cash flows from fluctuations caused by volatility in currency exchange and interest rates. The Company currently uses only cash flow hedges. These instruments are hedges of forecasted transactions or of the variability of cash flows to be received or paid related to a recognized asset or liability. The Company generally enters into forward exchange contracts expiring within 36 months as hedges of anticipated cash flows denominated in foreign currencies. These contracts are entered into to protect against the risk that the eventual cash flows resulting from such transactions will be adversely affected by changes in exchange rates. In using derivative financial instruments to hedge exposures to changes in exchange rates, the Company exposes itself to counterparty credit risk.
All derivatives, including foreign currency exchange contracts, are recognized in the Consolidated Balance Sheets at fair value. Fair values for the Company’s derivative financial instruments are based on quoted market prices of comparable instruments or, if none are available, on pricing models or formulas using current assumptions. On the date the derivative contract is entered into, the Company determines whether the derivative contract qualifies for designation as a hedge. For derivatives that are designated as hedges, the Company further designates the hedge as either a fair value or cash flow hedge; all currently existing hedges have been designated as cash flow hedges. Changes in the fair value of derivatives that are highly effective and designated as cash flow hedges are reported as a component of Other Comprehensive (Loss) Income and reclassified into earnings in the same line-item associated with the forecasted transaction and in the same periods during which the hedged transaction impacts earnings. The Company formally documents all relationships between hedging instruments and hedged items, as well as its risk management objective and strategy for undertaking various hedging activities. This process includes linking all derivatives that are designated as fair value or cash flow hedges to specific assets and liabilities on the balance sheet or to forecasted transactions, respectively. The Company also formally assesses, both at the hedge’s inception and on an ongoing basis, whether the derivatives that are used in hedging transactions are highly effective in offsetting changes in fair value or cash flows of hedged items. When it is determined that a derivative is not highly effective as a hedge or that it has ceased to be a highly effective hedge, the Company discontinues hedge accounting prospectively.
The Company also periodically enters into forward exchange contracts that are not designated as hedges. The purpose of the majority of these derivative instruments is to protect the Company against foreign currency exposure pertaining to receivables, payables and intercompany transactions that are denominated in currencies different from the functional currencies of the Company or the respective subsidiaries. The Company records changes in the fair value of these derivative instruments in the Consolidated Statements of Income within Other income, net.
Investments
Management determines the appropriate classification of securities at the time of purchase and re-evaluates such designation as of each balance sheet date. Currently all investment securities are classified as trading, and are reported within short-term investments in the Consolidated Balance Sheets. Trading securities are carried at fair value, with gains and losses, both realized and unrealized, reported in Other (expense) income, net in the Consolidated Statements of Income. The cost of securities sold is based upon the specific identification method. Interest and dividends on securities classified as trading is included in Other (expense) income, net.
Fair Value Measurements
The Company applies fair value accounting for all financial assets and liabilities and non-financial assets and liabilities that are recognized or disclosed at fair value in the consolidated financial statements on a recurring basis. The Company defines fair value as the price that would be received from selling an asset or paid to transfer a liability in an orderly transaction between market participants at the measurement date. When determining the fair value measurements for assets and liabilities, the Company considers the principal or most advantageous market in which the Company would transact and the market-based risk measurements or assumptions that market participants would use in pricing the asset or liability, such as inherent risk, transfer restrictions and credit risk.
New Accounting Pronouncements
Convergys Corporation 2014 Annual Report 47
In June 2014, the Financial Accounting Standards Board (FASB) issued Accounting Standards Update (ASU) 2014-12, "Accounting for Share-Based Payments When the Terms of an Award Provide That a Performance Target Could Be Achieved after the Requisite Service Period (Topic 718)." This ASU requires a reporting entity to treat a performance target that affects vesting and that could be achieved after the requisite service period as a performance condition, and apply existing guidance under the Stock Compensation Topic 718 as it relates to awards with performance conditions that affect vesting to account for such awards. This update will be applied prospectively and is effective for interim and annual periods beginning after December 15, 2015. This standard is not expected to have a material effect on the Company’s consolidated financial statements.
In May 2014, the FASB issued ASU 2014-09, "Revenue from Contracts with Customers (Topic 606)." The standard will apply one comprehensive revenue recognition model across all contracts, entities and sectors. The core principal of the new standard is that revenue should be recognized to depict the transfer of promised goods or services to customers in an amount that reflects the consideration to which the entity expects to be entitled in exchange for those goods or services. Once effective, this ASU will replace most of the existing revenue recognition requirements in U.S. GAAP. This update is effective for annual reporting periods beginning after December 15, 2016, including interim periods within that reporting period. The Company is currently assessing the effect that adoption of the new standard, including possible transition alternatives, will have on its consolidated financial statements.
In April 2014, the FASB issued ASU 2014-08, "Presentation of Financial Statements (Topic 205) and Property, Plant, and Equipment (Topic 360): Reporting Discontinued Operations and Disclosures of Disposals of Components of an Entity." This ASU changes the criteria for a disposal to qualify as discontinued operations and requires new disclosures for individually material disposal transactions that do not meet the definition of a discontinued operation. Under the new standard, companies report discontinued operations when they have a disposal that represents a strategic shift that has or will have a major impact on operations or financial results. Once adopted, this update will be applied prospectively and is effective for annual periods, and interim periods within those years, beginning after December 15, 2014. This standard is not expected to have a material effect on the Company's consolidated financial statements, but will impact the reporting of any future dispositions.
3. BUSINESS COMBINATIONS
Stream Acquisition
Background and Financing
On January 6, 2014, the Company and its wholly-owned subsidiary (Merger Sub), entered into an Agreement and Plan of Merger (the Merger Agreement) with Stream and, for limited purposes, other Sellers listed in the Merger Agreement. On March 3, 2014, Merger Sub was merged with and into Stream (the Merger), with Stream continuing as the surviving corporation and as a wholly owned subsidiary of Convergys. At the time of the Merger, each share of Stream common stock was converted into the right to receive an amount in cash, without interest.
The total purchase price, net of cash acquired, was $802.6, which was funded using available cash, borrowings under the Accounts Receivable Securitization Facility and proceeds from a term loan under the February 28, 2014 Credit Agreement (the Credit Agreement). The Credit Agreement consists of a term loan in the amount of $350.0 and a revolving credit facility in the amount of $300.0 (see Note 7, "Debt and Capital Lease Obligations" for the definition of these terms and further discussion).
The purchase price of Stream consisted of the following items:
Cash consideration for Stream stock (1) | $ | 481.0 | |
Cash consideration for Stream stock options (2) | 16.1 | ||
Cash consideration for repayment of Stream 11.25% Senior Secured Notes (3) | 243.0 | ||
Cash consideration for repayment of Stream 10.0% Promissory Notes (4) | 19.3 | ||
Cash consideration for repayment of Stream Revolving Credit Facility (5) | 63.4 | ||
Cash consideration for transaction expenses of Stream (6) | 7.8 | ||
Total cash consideration | 830.6 | ||
Cash acquired (7) | (28.0 | ) | |
Net consideration transferred | $ | 802.6 | |
(1) | The cash consideration for the outstanding shares of Stream's common stock, which includes final settlement for working capital. Stream outstanding common shares totaled 0.7 as of March 3, 2014. |
Convergys Corporation 2014 Annual Report 48
(2) | The cash consideration paid per share of "in the money" stock option awards. |
(3) | The cash consideration to repay Stream's 11.25% Senior Secured Notes due 2014, which reflects the aggregate principal and interest amounts of $230.0 and $13.0, respectively, as of March 3, 2014. |
(4) | The cash consideration to repay Stream's 10.0% Promissory Notes, which reflects the aggregate principal and interest amounts of $16.1 and $3.2, respectively, as of March 3, 2014. |
(5) | The cash consideration to repay Stream's Revolving Credit Facility, which reflects the aggregate principal and interest amounts of $63.1 and $0.3, respectively, as of March 3, 2014. |
(6) | Pursuant to the Merger Agreement, Convergys reimbursed the holders of Stream common stock for expenses incurred by Stream in connection with the merger. These expenses primarily related to third-party consulting services. |
(7) | Represents the Stream cash balance acquired at acquisition. |
The Company incurred $14.7 and $2.7 of transaction costs for the twelve months ended December 31, 2014 and 2013, respectively. These costs are included in Transaction and integration costs in the accompanying Consolidated Statements of Income.
Preliminary Purchase Price Allocation
The Company accounted for Stream using the acquisition method of accounting in accordance with applicable U.S. GAAP whereby the total purchase price was preliminarily allocated to tangible and intangible assets acquired and liabilities assumed based on respective fair values. The following table summarizes the preliminary values of the assets acquired and liabilities assumed at the date of acquisition:
March 3, 2014 | |||
Assets: | |||
Receivables | $ | 197.9 | |
Other current assets | 13.5 | ||
Property and equipment | 159.3 | ||
Goodwill | 277.5 | ||
Intangible assets | 370.4 | ||
Other assets | 7.8 | ||
Liabilities: | |||
Accounts payable | $ | (12.3 | ) |
Accrued expenses | (100.3 | ) | |
Other current liabilities | (3.8 | ) | |
Debt | (34.6 | ) | |
Deferred tax - net | (61.2 | ) | |
Other long-term liabilities | (11.6 | ) | |
Total purchase price | $ | 802.6 | |
As of December 31, 2014, the purchase price allocation for the acquisition was preliminary and subject to completion. Adjustments to the current fair value estimates in the above table may occur as the process conducted for various valuations and assessments is finalized, including tax assets, liabilities and other attributes. Goodwill is calculated as the excess of the consideration transferred over the net assets recognized and represents the estimated future economic benefits arising from other assets acquired that could not be individually identified and separately recognized. The factors contributing to the recognition of goodwill are based on several strategic and synergistic benefits that are expected to be realized from the Stream acquisition. The benefits include an enhanced global footprint and expanded language capabilities. None of the goodwill is expected to be deductible for income tax purposes and was entirely allocated to the Customer Management - Agent Services reporting unit for purposes of the evaluation for any future goodwill impairment. The Company evaluated whether any adjustments in the prior period purchase price allocation was material and concluded no retrospective adjustment to prior period financial statements were required.
Intangible Assets Identified
The following details the total intangible assets identified:
Convergys Corporation 2014 Annual Report 49
Intangible asset type | Value | Life (years) | ||||
Customer relationship | $ | 352.0 | 17 | |||
Trade name | 17.0 | 4 | ||||
Favorable lease contract | 1.4 | 1 | - | 7 | ||
Total | $ | 370.4 | ||||
The preliminary fair value of the customer relationship asset was determined using the income approach through an excess earnings analysis, with projected earnings discounted at a rate of 11.0%. The customer relationship intangible asset represents relationships between Stream and its customers. Convergys applied the income approach through a relief-from-royalty analysis to determine the preliminary fair value of the Stream trade name asset. The determination of the useful lives was based upon consideration of market participant assumptions and transaction specific factors.
Impact on Operating Results
The results of Stream's operations have been included in Convergys' Consolidated Financial Statements since the March 3, 2014 date of acquisition. The following table provides sales and results of operations from the acquired Stream business included in Convergys' December 31, 2014 results:
Three Months Ended | Twelve Months Ended | |||||
December 31, 2014 | December 31, 2014 | |||||
Revenues | $ | 253.3 | $ | 834.8 | ||
Income before income taxes | $ | 9.2 | $ | 11.2 | ||
The following unaudited pro forma information assumes the acquisition of Stream occurred at the beginning of the respective periods presented. The unaudited pro forma information presented below is for illustrative purposes only and does not reflect future events that may occur after December 31, 2014 or any operating efficiencies or inefficiencies that may result from the Stream acquisition and related financing. Additionally, this unaudited pro forma information for the twelve months ended December 31, 2014 includes certain one-time costs associated with the Company's integration of the acquired Stream operations. Therefore, the information is not necessarily indicative of results that would have been achieved had the business been combined during the periods presented or the results that the Company will experience going forward.
Year Ended December 31, | ||||||
Unaudited pro forma information | 2014 | 2013 | ||||
Revenues | $ | 3,026.9 | $ | 3,061.8 | ||
Income from Continuing Operations, net of tax | $ | 110.8 | $ | 56.0 | ||
Earnings from Continuing Operations per share | ||||||
Basic | $ | 1.10 | $ | 0.54 | ||
Diluted | $ | 1.04 | $ | 0.51 | ||
Weighted average common shares outstanding | ||||||
Basic | 100.7 | 103.3 | ||||
Diluted | 106.2 | 109.2 | ||||
Datacom Acquisition
On April 30, 2013, the Company acquired the customer management operations of New Zealand-based Datacom, including contact centers in Kuala Lumpur, Malaysia and Manila, Philippines. The purchase price of $20.0 Australian Dollar (approximately $20.0 U.S. Dollar) included $15.0 of cash paid at closing and $5.3 of debt obligations assumed, which were immediately paid by the Company, as well as working capital adjustments that were finalized during the third quarter of 2013. In connection with the acquisition, the Company recognized $12.2 of goodwill and $7.0 of customer relationship intangible asset. The customer relationship intangible asset will be amortized over an estimated economic useful life of 8 years. The determination of the useful life was based upon consideration of market participant and transaction specific factors. The Company included various industry studies, historical acquisition experience, economic factors, future cash flows of the combined company and the relative stability of the acquired customer base. The acquired goodwill is not expected to be deductible for income tax purposes.
4. DIVESTITURES AND DISCONTINUED OPERATIONS
Convergys Corporation 2014 Annual Report 50
Information Management
On May 16, 2012, the Company completed the sale of its Information Management line of business to NEC Corporation. During 2014 and 2013, the Company recorded an additional gain of $3.5 and $2.4, respectively, net of tax, as certain contingencies and tax positions related to Information Management were settled or adjusted.
The results of Information Management have been classified as discontinued operations for all periods presented. Certain costs previously allocated to the Information Management segment that do not qualify for discontinued operations accounting treatment are now reported as costs from continuing operations. The Company has taken action to reduce these costs and the transition services revenue from services provided to the buyer subsequent to completion of the sale substantially offset the remainder of these costs. During the twelve months ended December 31, 2014, the Company earned $8.2 in revenue under these transition services agreements, compared to $17.1 as of December 31, 2013. All transition services agreements expired by the end of the June 2014 quarter, and the Company has substantially eliminated the related costs.
Summarized operating results of the Information Management business are as follows:
Year Ended December 31, | |||||||||
2014 | 2013 | 2012 | |||||||
Revenue | $ | — | $ | — | $ | 128.8 | |||
Income before tax - Information Management operations (1) | — | — | 23.7 | ||||||
Gain (loss) on disposition (2) | 0.3 | (6.4 | ) | 99.8 | |||||
Income (loss) before income taxes | 0.3 | (6.4 | ) | 123.5 | |||||
Income tax (benefit) expense: | |||||||||
Expense related to Information Management operations | — | — | 7.9 | ||||||
(Benefit) expense related to gain on disposition | (3.2 | ) | (8.8 | ) | 83.6 | ||||
Income from discontinued operations, net of tax | $ | 3.5 | $ | 2.4 | $ | 32.0 | |||
(1) Excludes costs previously allocated to Information Management that did not meet the criteria for presentation within discontinued operations of $8.8 for 2012.
(2) Includes $22.8 of transaction costs related to the sale for 2012.
HR Management
In June 2010, the Company substantially completed the sale of the HR Management line of business to NorthgateArisno, the Human Resource division of Northgate Information Solutions Limited, for approximately $93.0. As a result of the sale, the operating results related to HR Management have been reflected as discontinued operations. During 2012, the Company recorded a tax benefit of $40.4, as certain contingencies and tax positions were settled or adjusted.
5. EARNINGS PER SHARE AND SHAREHOLDERS' EQUITY
Earnings per Share
The following is a reconciliation of the numerator and denominator of the basic and diluted earnings per share (EPS) computations:
Convergys Corporation 2014 Annual Report 51
Continuing Operations | Discontinued Operations | Total | |||||||||||||||
Shares (in Millions) | Shares | Net Income | Per Share Amount | Net Income | Per Share Amount | Per Share Amount | |||||||||||
2014: | |||||||||||||||||
Basic EPS | 100.7 | $ | 116.5 | $ | 1.16 | $ | 3.5 | $ | 0.03 | $ | 1.19 | ||||||
Effect of dilutive securities: | |||||||||||||||||
Stock-based compensation arrangements | 1.0 | — | (0.02 | ) | — | — | (0.02 | ) | |||||||||
Convertible Debt | 4.5 | — | (0.04 | ) | — | — | (0.04 | ) | |||||||||
Diluted EPS | 106.2 | $ | 116.5 | $ | 1.10 | $ | 3.5 | $ | 0.03 | $ | 1.13 | ||||||
2013: | |||||||||||||||||
Basic EPS | 103.3 | $ | 58.5 | $ | 0.57 | $ | 2.4 | $ | 0.02 | $ | 0.59 | ||||||
Effect of dilutive securities: | |||||||||||||||||
Stock-based compensation arrangements | 1.2 | — | (0.01 | ) | — | — | (0.01 | ) | |||||||||
Convertible Debt | 4.7 | — | (0.02 | ) | — | — | (0.02 | ) | |||||||||
Diluted EPS | 109.2 | $ | 58.5 | $ | 0.54 | $ | 2.4 | $ | 0.02 | $ | 0.56 | ||||||
2012: | |||||||||||||||||
Basic EPS | 112.2 | $ | 28.2 | $ | 0.25 | $ | 72.4 | $ | 0.65 | $ | 0.90 | ||||||
Effect of dilutive securities: | |||||||||||||||||
Stock-based compensation arrangements | 2.1 | — | — | — | (0.01 | ) | (0.01 | ) | |||||||||
Convertible Debt | 2.8 | — | (0.01 | ) | — | (0.02 | ) | (0.03 | ) | ||||||||
Diluted EPS | 117.1 | $ | 28.2 | $ | 0.24 | $ | 72.4 | $ | 0.62 | $ | 0.86 | ||||||
The diluted EPS calculation excludes the effect of 0.5, 0.6 and 1.0 of outstanding stock options for 2014, 2013 and 2012, respectively, because they are anti-dilutive. The calculation also excludes 0.6 of performance-based restricted stock units (0.3 granted in both 2014 and 2013) as performance criteria have not yet been fully defined, which precludes the establishment of a grant date for accounting purposes.
As described more fully in Note 7, the Company issued approximately $125.0 aggregate principal amount of 5.75% Junior Subordinated Convertible Debentures due 2029 (2029 Convertible Debentures) in 2009. The 2029 Convertible Debentures were initially convertible, subject to certain conditions, into shares of the Company's common stock at an initial conversion price of approximately $12.07 per share, or eighty-two and eighty-two hundredths shares per one thousand in principal amount of debentures. The conversion rate will be subject to adjustments for certain events outlined in the indenture governing the Debentures (the Indenture), including payment of dividends. As of December 31, 2014, the implied conversion rate for the Convertible Debentures was $11.65 per share, or eighty-five and eighty-three hundredths shares per one thousand in principal amount of debentures. There were 4.5, 4.7 and 2.8 dilutive shares related to the 2029 Convertible Debentures for 2014, 2013 and 2012, respectively.
Shareholders’ Equity
The Company repurchased 2.3 shares of its common stock during the year ended December 31, 2014 at an average price of $20.00 per share for a total of $46.3. Based upon timing of transactions, $0.9 of the shares repurchased had not settled as of December 31, 2014. There were 6.7 shares repurchased during the year ended December 31, 2013. Below is a summary of the Company’s share repurchases during 2014, 2013 and 2012:
Shares | Cost | |||
2014 | 2.3 | $ | 46.3 | |
2013 | 6.7 | $ | 119.0 | |
2012 | 12.3 | $ | 184.4 | |
At December 31, 2014, the Company has the authority to repurchase an additional $87.1 of outstanding common shares pursuant to current authorizations. This is reflective of approval by the Company's Board of Directors in February 2013 to increase the remaining authorized share repurchases to $250.0 in the aggregate. The timing and terms of any future transactions will depend on a number of considerations including market conditions and our liquidity and limits that may be applicable under the covenants in our credit agreement.
Convergys Corporation 2014 Annual Report 52
The Company also repurchased 0.5 shares at an average price of $20.06 for aggregate proceeds of $9.5 subsequent to December 31, 2014, through February 18, 2015.
Preferred Shares
The Company is authorized to issue up to 5.0 preferred shares, of which 4.0 would have voting rights. At December 31, 2014 and 2013, there were no preferred shares issued or outstanding.
Dividends
During 2013 and 2014, the Company's Board of Directors approved, and the Company has paid, the following dividends per common share:
Announcement Date | Record Date | Dividend Amount | Payment Date |
February 7, 2013 | March 22, 2013 | $0.06 | April 5, 2013 |
April 30, 2013 | June 21, 2013 | $0.06 | July 5, 2013 |
July 30, 2013 | September 20, 2013 | $0.06 | October 4, 2013 |
November 6, 2013 | December 27, 2013 | $0.06 | January 10, 2014 |
February 5, 2014 | March 21, 2014 | $0.06 | April 4, 2014 |
May 12, 2014 | June 19, 2014 | $0.07 | July 3, 2014 |
August 11, 2014 | September 19, 2014 | $0.07 | October 3, 2014 |
November 5, 2014 | December 26, 2014 | $0.07 | January 9, 2015 |
On February 18, 2015, the Company announced that its Board of Directors declared a quarterly cash dividend of $0.07 per common share to be paid on April 3, 2015 to shareholders of record as of March 20, 2015.
The Board expects that future cash dividends will be paid on a quarterly basis. However, any decision to pay future cash dividends will be subject to Board approval, and will depend on the Company's future earnings, cash flow, financial condition, financial covenants and other relevant factors.
6. GOODWILL AND OTHER INTANGIBLE AND LONG-LIVED ASSETS
Goodwill
The Company tests goodwill for impairment annually as of October 1 and at other times if events have occurred or circumstances exist that indicate the carrying value of goodwill may no longer be recoverable. Goodwill impairment testing is performed at the reporting unit level, one level below the business segment. The Company's reporting units are Customer Management - Agent Services and Customer Management - Customer Interaction Technology (CIT). As of December 31, 2014 and 2013, all goodwill was held by the Customer Management - Agent Services reporting unit, including 100% of the goodwill associated with the Stream acquisition.
The most recent annual impairment test performed as of October 1, 2014, indicated that the fair value of the Customer Management - Agent Services reporting unit was substantially in excess of its carrying values. Despite that excess, however, impairment charges could still be required if a divestiture decision were made or other significant economic events occurred with respect to the reporting unit. Subsequent to our October 1, 2014 annual impairment test, no indications of an impairment were identified.
During 2012, the sale of the Information Management business impacted the sale of certain products developed by the CIT reporting unit and co-marketed by CIT and the Information Management business. Due in part to this transition, the fair value of the CIT reporting unit was determined to be less than its carrying value. The conclusion of step two of the impairment analysis resulted in the impairment of the entire $46.0 goodwill balance of this reporting unit. The Company, therefore, recorded a $46.0 ($44.4 net of tax) goodwill impairment charge, included in asset impairment charges and other in the Consolidated Statements of Income during 2012. Fair value was determined based on discounted cash flow analysis which contains significant unobservable inputs that fell within Level 3 of the fair value hierarchy under U.S. GAAP.
Below is a progression of goodwill for 2014 and 2013:
Convergys Corporation 2014 Annual Report 53
Balance at December 31, 2012 | $ | 577.7 | |
Datacom acquisition | 12.2 | ||
Foreign currency and other | (0.5 | ) | |
Balance at December 31, 2013 | $ | 589.4 | |
Stream acquisition | 277.5 | ||
Foreign currency and other | (16.2 | ) | |
Balance at December 31, 2014 | $ | 850.7 | |
Other Intangible Assets
The Company’s other intangible assets, primarily acquired through business combinations, are evaluated periodically if events or circumstances indicate a possible inability to recover their carrying amounts. No impairment charges were recognized in any period presented. As of December 31, 2014 and 2013, the Company’s other intangible assets consisted of the following:
2014 | Gross Carrying Amount | Accumulated Amortization | Net | ||||||
Software (classified with Property & Equipment) | $ | 41.3 | $ | (34.8 | ) | $ | 6.5 | ||
Trademarks | 26.5 | (13.4 | ) | 13.1 | |||||
Customer relationships and other intangibles | 468.7 | (126.6 | ) | 342.1 | |||||
Total | $ | 536.5 | $ | (174.8 | ) | $ | 361.7 | ||
2013 | |||||||||
Software (classified with Property & Equipment) | $ | 41.3 | $ | (31.0 | ) | $ | 10.3 | ||
Trademarks | 10.0 | (10.0 | ) | — | |||||
Customer relationships and other intangibles | 126.3 | (105.9 | ) | 20.4 | |||||
Total | $ | 177.6 | $ | (146.9 | ) | $ | 30.7 | ||
The intangible assets are being amortized using the following amortizable lives: 5 to 8 years for software and 1 to 17 years for customer relationships and other intangibles. The remaining weighted average depreciation period for software is approximately 2.0 years. The remaining weighted average amortization period for customer relationships and other intangibles is approximately 15.0 years. Amortization of software is included within depreciation expense as the underlying assets are classified within property and equipment.
Amortization expense for intangibles was $24.7 and $5.3 for the years ended December 31, 2014 and 2013, respectively and the related estimated expense for the five subsequent fiscal years is as follows:
For the year ended 2015 | $ | 28 | |
For the year ended 2016 | 27 | ||
For the year ended 2017 | 27 | ||
For the year ended 2018 | 24 | ||
For the year ended 2019 | 23 | ||
Thereafter | 226 | ||
Total | $ | 355 | |
Long-Lived Assets
The Company evaluates its property and equipment when events or circumstances indicate a possible inability to recover their carrying amounts. During 2012, the Company committed to a plan to sell its Corporate office facilities in Cincinnati, Ohio. The facility met the "Held-for-Sale" criteria set forth in U.S. GAAP; the book value was adjusted to its fair value less costs to sell, resulting in an impairment charge of $42.6 ($27.0 after tax) recorded during the second quarter of 2012. During 2013, the Company committed to sell a facility in Dallas, Texas. During 2013, the Company recognized a net impairment loss of $1.5 to adjust both facilities to fair value less costs to sell at the date of sale to a third-party buyer. The Company measured assets held-for-sale at the lower of net book value or fair value less cost to sell. Fair value and cost to sell estimates were based on corroborative market data, which is a Level 2 input of the fair value hierarchy under U.S. GAAP. The Company completed the sale of these facilities in July 2013 resulting in cash collections of $47.6.
7. DEBT AND CAPITAL LEASE OBLIGATIONS
Convergys Corporation 2014 Annual Report 54
Debt and capital lease obligations consists of the following:
At December 31, | ||||||
2014 | 2013 | |||||
Term Loan | $ | 261.0 | $ | — | ||
2029 Convertible Debentures | 60.7 | 59.5 | ||||
Capital Lease Obligations | 14.2 | 1.6 | ||||
Accounts Receivable Securitization | 40.0 | — | ||||
Total debt | 375.9 | 61.1 | ||||
Less current maturities | 7.5 | 0.9 | ||||
Long-term debt | $ | 368.4 | $ | 60.2 | ||
Weighted average effective interest rates: | ||||||
Term Loan | 1.9 | % | — | % | ||
Accounts Receivable Securitization | 1.2 | % | — | % | ||
2029 Convertible Debentures | 6.7 | % | 6.6 | % | ||
Credit Facility
On February 28, 2014, the Company entered into a Credit Agreement establishing an unsecured credit facility in the aggregate amount of $650.0 (Credit Agreement). In connection with entering into the Credit Agreement, Convergys terminated the 300.0 Four-Year Competitive Advance and Revolving Credit Facility Agreement dated March 11, 2011 (the 2011 Credit Facility). The Credit Agreement consists of term loans (the Term Loan) in the aggregate amount of $350.0, and a revolving credit facility (the Revolving Credit Facility) in the amount of $300.0. The Company recorded the initial carrying amount of the Term Loan at 344.9, reflecting a discount of $5.1 resulting from fees paid directly to the lender at issuance. The discount will be amortized over the life of the Term Loan using the effective interest rate method (2.3% as of December 31, 2014), and is included in interest expense in the Consolidated Statements of Income. The conditions for the funding of the Term Loan and the Revolving Credit Facility were satisfied on March 3, 2014. Both mature on March 3, 2019, unless extended pursuant to the terms of the Credit Agreement. Outstanding amounts bear interest at one of the rates described in the Credit Agreement. During 2014, voluntary Term Loan principal payments of $85.0 were made by the Company. The next required principal payment is not due until September 30, 2017. While amounts borrowed and repaid under the Revolving Credit Facility may be re-borrowed, amounts repaid under the Term Loan may not be borrowed again under the Credit Agreement. Total borrowing capacity remaining under the Revolving Credit Facility was $300.0, with $265.0 outstanding principal on the Term Loan as of December 31, 2014.
The Credit Agreement contains certain affirmative and negative covenants, as well as terms and conditions that are customary for credit facilities of this type, including financial covenants for leverage and interest coverage ratios. The Company’s interest coverage ratio cannot be less than 4.00 to 1.00 as determined as of the most recently ended period of four consecutive fiscal quarters. The Company’s net leverage ratio ratio cannot be greater than 3.00 to 1.00 at anytime on or after the effective date. In the event of default, the lenders may terminate the commitments and declare the amounts outstanding, and all accrued interest, fees and other obligations, immediately due and payable. The Company was in compliance with all covenants at December 31, 2014.
Convertible Debentures
In the fourth quarter of 2009, the Company announced an offer to exchange one thousand twenty dollars in principal amount of its 5.75% Junior Subordinated Convertible Debentures due September 2029 (2029 Convertible Debentures) for each one thousand dollars in principal amount of its 4.875% Unsecured Senior Notes (4.875% Senior Notes) due December 15, 2009. Convergys issued a total of $125.0 aggregate principal amount of the 2029 Convertible Debentures in exchange for $122.5 of the 4.875% Senior Notes. At the date of issuance, the Company recognized the liability component of the 2029 Convertible Debenture at its fair value of $56.3. The liability component is recognized as the fair value of a similar instrument that does not have a conversion feature at issuance. The equity component, which is the value of the conversion feature at issuance, was recognized as the difference between the proceeds from the issuance of the debentures and the fair value of the liability component, after adjusting for the deferred tax impact of $32.7. The 2029 Convertible Debentures were issued at a coupon rate of 5.75%, which was below that of a similar instrument that does not have a conversion feature. Therefore, the valuation of the debt component, using the income approach, resulted in a debt discount. The debt discount is being amortized over the life of a similar debt instrument without a conversion feature, which the Company determined to equal the contractual maturity of the 2029 Convertible Debentures. Amortization is based upon the effective interest rate method and is included in interest expense in the Consolidated Statements of Income.
Convergys Corporation 2014 Annual Report 55
The 2029 Convertible Debentures, which pay a fixed rate of interest semi-annually, have a contingent interest component that will require the Company to pay interest based on the trading price of the Debentures exceeding a specified threshold at specified times, commencing on September 15, 2019, as outlined in the Indenture. The maximum amount of contingent interest that will accrue is 0.75% per annum of the average trading price of the Debentures during the periods specified in the Indenture. The fair value of this embedded derivative was not significant at December 31, 2014 or 2013.
The Company is not entitled to redeem the 2029 Convertible Debentures prior to September 15, 2019. On or after September 15, 2019, the Company may redeem for cash all or part of the 2029 Convertible Debentures at par value plus accrued but unpaid interest if certain trading conditions of the Company’s common stock are satisfied. The holders of the 2029 Convertible Debentures have the option to require redemption at par value plus accrued but unpaid interest upon the occurrence of a fundamental change, a defined term in the Indenture.
The 2029 Convertible Debentures are convertible at the option of the holders on or after September 15, 2028 and prior to that date only under the following circumstances: (1) during any calendar quarter commencing after December 31, 2009, if the last reported sales price of the Company’s common stock for at least 20 trading days (whether or not consecutive) during a period of 30 consecutive trading days ending on the last trading day of the preceding calendar quarter is greater than or equal to 130% of the applicable conversion price (currently $15.15) for the 2029 Convertible Debentures on each applicable trading day (hereinafter referred to as the Sales Price Condition); (2) during the five business day period after any five consecutive trading day period (the Measurement Period) in which, as determined following a request by a holder of 2029 Convertible Debentures as provided in the Indenture, the trading price per $1,000 principal amount of 2029 Convertible Debentures for each trading day of such Measurement Period was less than 98% of the product of the last reported sale price of the Company’s common shares and the applicable conversion rate for the 2029 Convertible Debentures on each such trading day; (3) if the Company elects to redeem any or all of the 2029 Convertible Debentures; or (4) upon the occurrence of specified corporate events pursuant to the terms of the Indenture. Upon conversion, the Company will pay cash up to the aggregate principal amount of the 2029 Convertible Debentures to be converted and pay or deliver, as the case may be, cash, common shares of the Company or a combination of cash and common shares of the Company, at the Company’s election, in respect of the remainder, if any, of the Company’s conversion obligation in excess of the aggregate principal amount of the 2029 Convertible Debentures being converted.
The 2029 Convertible Debentures were initially convertible, subject to certain conditions, into common shares of the Company at an initial conversion price of approximately $12.07 per share, or eighty-two and eighty-two hundredths shares per one thousand dollars in principal amount of debentures. As of December 31, 2014, the implied conversion rate for the 2029 Convertible Debentures was $11.65 per share, or eighty-five and eighty-three hundredths per one thousand in principal amount of debentures. The conversion rate will be subject to adjustment for certain events outlined in the indenture governing the Debentures (the Indenture), including payment of dividends. The conversion rate will increase for a holder who elects to convert this Debenture in connection with certain share exchanges, mergers or consolidations involving the Company, as described in the Indenture.
As of January 1, 2015 and 2014, the 2029 Convertible Debentures were convertible at the option of the holders. This conversion right was triggered upon satisfaction of the Sales Price Condition (the closing price of the Company’s common shares was greater than or equal to $15.15, 130% of the conversion price of the 2029 Convertible Debentures at December 31, 2014, for at least 20 of the last 30 consecutive trading days ending on December 31, 2014). As a result, the equity component of the 2029 Convertible Debentures equal to $64.3 (the difference between the par value and carrying value of the 2029 Convertible Debentures at December 31, 2014), has been classified as temporary equity within the December 31, 2014 Consolidated Balance Sheet since this amount was considered redeemable. The Company will reassess the convertibility of the 2029 Convertible Debentures and the related balance sheet classification on a prospective basis. There have been no conversions of the 2029 Convertible Debentures through the date of this filing.
During 2014 , Convergys identified a reclassification adjustment impacting the December 31, 2013 Consolidated Balance Sheet and the Consolidated Statements of Shareholders' Equity for the year then ended, related to the classification of the equity component associated with the 2029 Convertible Debentures. As a result of the trading price of the Company’s common shares and satisfaction of the Sales Price Condition, the 2029 Convertible Debentures were initially convertible at the option of the holders at March 31, 2013 and have remained convertible at the option of the holder through December 31, 2014. Accordingly, a portion of the equity component of the 2029 Convertible Debentures, equal to $65.5 at December 31, 2013 (the difference between the par value and carrying value of the 2029 Convertible Debentures), should have been classified as temporary equity within the Consolidated Balance Sheets and the Consolidated Statements of Shareholders' Equity at December 31, 2013. These amounts were originally classified within total shareholders’ equity. Convergys assessed the quantitative and qualitative impact of this adjustment and determined the effects on prior period financial statements were immaterial. Convergys has adjusted the reported balances at December 31, 2013 to correct the classification resulting from this immaterial error. This prior period reclassification had no
Convergys Corporation 2014 Annual Report 56
impact on the Consolidated Statements of Income, Consolidated Statements of Comprehensive Income, Consolidated Statements of Cash Flows or retained earnings balance in any period.
Based on quoted market prices at December 31, 2014, the fair value of the $125.0 aggregate principal amount of the Company’s 2029 Convertible Debentures is $249.7.
Asset Securitization Facility
During January 2014, the Company extended the terms of an asset securitization facility collateralized by accounts receivable of certain of the Company's subsidiaries, with a purchase limit to $150.0 expiring in January 2017. The asset securitization program is conducted through Convergys Funding Inc., a wholly-owned bankruptcy remote subsidiary of the Company. As of December 31, 2014, Convergys had drawn $40.0 in available funding from qualified receivables as part of the financing related to the acquisition of Stream. Amounts have been classified under this facility as long-term debt within the Consolidated Balance Sheets. As of December 31, 2013, this facility was undrawn.
At December 31, 2014, future minimum payments of the Company’s debt and capital lease arrangements (exclusive of a debt discounts) are as follows:
2015 | $ | 7.5 | |
2016 | 3.9 | ||
2017 | 52.8 | ||
2018 | 35.6 | ||
2019 | 219.1 | ||
Thereafter | 125.3 | ||
Total | $ | 444.2 | |
8. RESTRUCTURING
2014 Restructuring
During 2014, the Company recorded severance charges of $11.0 related to the elimination of certain redundant executive and non-executive positions as a result of the Company's integration of the Stream business. These amounts are included within Transaction and integration costs in the Consolidated Statements of Income and are expected to be substantially paid in cash by June 30, 2015. The total remaining liability under these severance-related actions, which is included within Payables and other current liabilities on the Company's Consolidated Balance Sheets, was $2.6 as of December 31, 2014.
During 2014, the Company also recorded a severance charge of $1.7 related to restructuring actions impacting approximately 400 employees. These actions were initiated to continue the Company's efforts to refine its operating model and reduce costs. The severance charge is included in Restructuring charges on the Consolidated Statement of Income and is expected to be substantially paid in cash by June 30, 2015. The total remaining liability under this severance-related restructuring plan, which is included within Payables and other current liabilities on the Consolidated Balance Sheets, was $1.3 as of December 31, 2014.
2013 Restructuring
During 2013, the Company recorded a severance charge of $4.3, impacting approximately 800 employees. These actions were initiated to continue the Company's efforts to refine its operating model and reduce costs. The total remaining liability under this severance-related restructuring plan, which is included in Payables and other current liabilities on the Company's Consolidated Balance Sheets was $2.3 as of December 31, 2013. The Company also recorded other restructuring expense of $1.1 during 2013. These amounts were fully settled during 2014.
2012 Restructuring
During 2012, the Company recorded restructuring charges of $11.6, consisting of $11.4 of severance-related charges and $0.2 of facility-related charges, as described below. The $11.4 of severance-related charges impacted approximately 100 professional employees and reflects the changes in the Company's executive management team and realignment of Corporate overhead as a result of the sale of the Information Management business. As of December 31, 2012, the remaining liability under this severance-related restructuring plan, which was included within Payables and other current liabilities on the Company's Consolidated Balance Sheets was $5.2. This amount was fully settled during 2013.
9. EMPLOYEE BENEFIT PLANS
Convergys Corporation 2014 Annual Report 57
Pensions
The Company sponsors a frozen defined benefit pension plan, which includes both a qualified and non-qualified portion, for all eligible employees (the cash balance plan) in the U.S and unfunded defined benefit plans for certain eligible employees in the Philippines, Malaysia and France (collectively, the defined benefit plans).The pension benefit formula for the cash balance plan is determined by a combination of compensation and age-based credits and annual guaranteed interest credits. Funding of the qualified portion of the cash balance plan has been achieved through contributions made to a trust fund. The contributions have been determined using the prescribed methods in accordance with the Pension Protection Act of 2006.
Based on the funded status of the cash balance plan and mandatory legislative requirements under the Pension Protection Act, beginning April 29, 2009, lump sum payments from the cash balance plan were partially restricted. In December 2012, the Company made contributions to the plan to satisfy funding requirements for 2013. Subsequently, on January 18, 2013, the Company received an Adjusted Funding Target Attainment Percentage (AFTAP) certification stating that the 2013 AFTAP for the defined benefit plan is 80 percent or higher. Accordingly, limitations on accelerated benefit distributions and benefit accruals no longer apply as of the date of the certification. The Company’s measurement date for all plans is December 31. The projected unit credit cost method is used for determining the unfunded executive pension cost for financial reporting purposes. The plan assumptions are evaluated annually and are updated as necessary.
Components of pension cost and other amounts recognized in other comprehensive income for the Company's defined benefit pension plans are as follows:
Year Ended December 31, | |||||||||
2014 | 2013 | 2012 | |||||||
Service cost | $ | 7.1 | $ | 5.0 | $ | 3.7 | |||
Interest cost on projected benefit obligation | 10.5 | 10.8 | 11.6 | ||||||
Expected return on plan assets | (9.2 | ) | (10.0 | ) | (11.6 | ) | |||
Amortization and deferrals—net | 8.1 | 11.6 | 17.2 | ||||||
Curtailment benefit | — | — | (0.2 | ) | |||||
Settlement charge | 4.6 | 13.4 | 6.8 | ||||||
Total pension cost | $ | 21.1 | $ | 30.8 | $ | 27.5 | |||
Other comprehensive (loss) income | $ | (23.4 | ) | $ | 46.9 | $ | 11.8 | ||
During 2014 and 2013, the Company recognized non-cash pension settlement charges of $4.6 and $13.4, respectively, resulting from a high volume of lump sum distributions. The settlement loss of $6.8 and curtailment benefit of $0.2 in 2012 related to the impact of the sale of the Information Management business. Pension cost for the defined benefit plans related to discontinued operations included in the table above for 2012 was $1.6.
The reconciliation of the defined benefit plans' projected benefit obligation and the fair value of plan assets for the years ended December 31, 2014 and 2013 are as follows:
Convergys Corporation 2014 Annual Report 58
At December 31, | ||||||
2014 | 2013 | |||||
Change in benefit obligation: | ||||||
Benefit obligation at beginning of year | $ | 228.1 | $ | 265.5 | ||
Service costs | 7.1 | 5.0 | ||||
Interest cost | 10.5 | 10.8 | ||||
Assumed obligation from Stream | 2.6 | — | ||||
Actuarial loss (gain) | 35.2 | (6.2 | ) | |||
Benefits paid | (23.9 | ) | (47.0 | ) | ||
Benefit obligation at end of year | $ | 259.6 | $ | 228.1 | ||
Change in plan assets: | ||||||
Fair value of plan assets at beginning of year | $ | 162.9 | $ | 171.7 | ||
Actual return on plan assets | 7.9 | 25.7 | ||||
Employer contribution | 3.6 | 12.5 | ||||
Benefits paid | (23.9 | ) | (47.0 | ) | ||
Fair value of plan assets at end of year | $ | 150.5 | $ | 162.9 | ||
Funded status | $ | (109.1 | ) | $ | (65.2 | ) |
Amounts recognized in the Consolidated Balance Sheets consisted of: | ||||||
Current liability | $ | (5.6 | ) | $ | (4.6 | ) |
Non-current liability | $ | (103.5 | ) | $ | (60.6 | ) |
Accumulated other comprehensive income (loss) | $ | (78.9 | ) | $ | (55.5 | ) |
Accumulated other comprehensive loss at December 31, 2014 and 2013 includes unrecognized actuarial losses of $78.9 ($47.2 net of tax) and $55.5 ($34.6 net of tax), respectively. The actuarial loss included in accumulated other comprehensive loss that is expected to be recognized in net periodic pension cost during 2015 is $10.2. The accumulated benefit obligation for the defined benefit plans was $259.6 and $228.1 at December 31, 2014 and 2013, respectively.
Estimated future benefit payments from the defined benefit plans are as follows:
2015 | $ | 15.8 | |
2016 | 16.1 | ||
2017 | 17.0 | ||
2018 | 18.3 | ||
2019 | 18.2 | ||
2020 - 2024 | 90.1 | ||
Total | $ | 175.5 | |
The Company also sponsors a non-qualified, unfunded executive deferred compensation plan (the EDCP). The EDCP which permitted eligible participants, including executive officers, to defer receipt of certain income, was initially frozen as of December 31, 2011. Before the plan was frozen, the Company provided a match to a participant's deferred amounts (reduced by the Company match eligible to be received under the Company's Retirement and Savings Plan). On July 25, 2013, the Company's Board of Directors authorized the Company to reinstate the EDCP, effective January 1, 2014, for eligible participants, including executive officers. Under this authorization, the Company matches up to 100% of the first 3% of a participant's deferred amounts and 50% of a participant's next 2% of deferred amounts. The Company match under the EDCP will be reduced by the Company match eligible to be received under the Company's Retirement and Savings Plan.
Benefits for the EDCP are based on employee deferrals, matching contributions and investment earnings on participant accounts. As further described in Note 12, "Financial Instruments," in December 2011, the Company made investments in certain securities which are held in a grantor trust for the benefit of participants of the executive deferred compensation plan. This investment was made in securities reflecting the hypothetical investment balances of plan participants.
Components of pension cost and other amounts recognized in other comprehensive loss for the EDCP are as follows:
Convergys Corporation 2014 Annual Report 59
Year Ended December 31, | |||||||||
2014 | 2013 | 2012 | |||||||
Service cost | $ | 1.3 | $ | — | $ | — | |||
Interest cost on projected benefit obligation | 0.5 | 0.4 | 1.0 | ||||||
Amortization and deferrals—net | — | 0.2 | (0.2 | ) | |||||
Curtailment loss, net | — | — | 0.1 | ||||||
Settlement gain | — | (0.3 | ) | (0.2 | ) | ||||
Total pension cost | $ | 1.8 | $ | 0.3 | $ | 0.7 | |||
Other comprehensive loss | $ | (0.8 | ) | $ | (1.0 | ) | $ | (1.9 | ) |
The reconciliation of the EDCP projected benefit obligation for the years ended December 31, 2014 and 2013 is as follows:
At December 31, | ||||||
2014 | 2013 | |||||
Change in benefit obligation: | ||||||
Benefit obligation at beginning of year | $ | 14.2 | $ | 21.1 | ||
Service cost | 1.3 | — | ||||
Interest cost | 0.5 | 0.4 | ||||
Actuarial loss | 0.8 | 0.9 | ||||
Benefits paid | (2.4 | ) | (8.2 | ) | ||
Benefit obligation at end of year | $ | 14.4 | $ | 14.2 | ||
Funded status | $ | (14.4 | ) | $ | (14.2 | ) |
Amounts recognized in the Consolidated Balance Sheets consisted of: | ||||||
Current liability | $ | (2.3 | ) | $ | (2.8 | ) |
Non-current liability | $ | (12.1 | ) | $ | (11.4 | ) |
Accumulated other comprehensive (loss) income | $ | (0.5 | ) | $ | 1.3 | |
Total benefits paid of $2.4 were made via employer contributions during 2014.
Accumulated other comprehensive loss at December 31, 2014 and 2013 includes unrecognized actuarial gains of $0.5 ($0.3 net of tax), and $1.3 ($0.8 net of tax). The accumulated benefit obligation for the EDCP was $14.4 and $14.2 at December 31, 2014 and 2013, respectively. There are no prior service cost expected to be recognized in net periodic pension cost during the year ending December 31, 2015.
Estimated future benefit payments from the EDCP are as follows:
2015 | $ | 2.3 | |
2016 | 2.0 | ||
2017 | 1.2 | ||
2018 | 0.7 | ||
2019 | 1.1 | ||
2020 - 2024 | 6.7 | ||
Total | $ | 14.0 | |
The following weighted-average rates were used in determining the benefit obligations at December 31:
2014 | 2013 | ||||||
Discount rate—projected benefit obligation | 1.75% | - | 4.90% | 4.25% | - | 4.90% | |
Future compensation growth rate | 2.87% | - | 4.00% | 2.50% | - | 4.00% | |
Expected long-term rate of return on plan assets | 6.75% | - | 7.00% | 6.75% | - | 8.00% | |
Convergys Corporation 2014 Annual Report 60
The following weighted-average rates were used in determining the pension cost for all years ended December 31:
2014 | 2013 | 2012 | |||||||
Discount rate—projected benefit obligation | 1.75% | - | 4.90% | 3.00% | - | 4.61% | 5.20% | - | 7.80% |
Future compensation growth rate | 2.50% | - | 4.00% | 4.00% | 4.00% | - | 5.50% | ||
Expected long-term rate of return on plan assets | 6.75% | - | 7.00% | 6.75% | - | 8.00% | 7.50% | - | 8.00% |
The range of discount rates utilized in determining the pension cost and projected benefit obligation of the Company's defined benefit plans reflects a lower prevalent rate applicable to the frozen cash balance plan for eligible employees in U.S. and a higher applicable rate for the unfunded defined benefit plan for certain eligible employees in the Philippines, France and Malaysia. The plans outside U.S. represented approximately 15.4% and 13% of the Company's total projected benefit obligation for all plans as of December 31, 2014 and 2013, respectively.
As a result of new mortality tables issued in October 2014 by the Society of Actuaries, the Company adopted the new mortality tables that increased its benefit obligations. The new mortality tables increase the assumed life expectancy of participants in the Company’s benefit plans, thereby increasing the total expected benefit payments over a longer time horizon. The adoption of these mortality tables currently has no significant effect on the Company’s expected pension contributions over the next several years.
As of December 31, 2014 and 2013, plan assets for the cash balance plan consisted of common/collective trusts (of which approximately 63% are invested in equity backed funds and 37% in funds invested in fixed income instruments, including cash), a private equity fund and Convergys common stock. At December 31, 2014, the Company’s targeted allocation was 65% equity and 35% fixed income. Plan assets for the cash balance plan included $3.7 and $4.9 of the Company’s common shares at December 31, 2014 and 2013, respectively. The investment objectives for the plan assets are to generate returns that will enable the plan to meet its future obligations. The Company’s expected long-term rate of return was determined based on the asset mix of the plan, projected returns, past performance and other factors. The Company contributed $10.0 in 2013 to fund its cash balance plan, which satisfied its 2014 Employee Retirement Income Security Act of 1974 (ERISA) funding requirements. There were no current year contributions. No plan assets are expected to be returned to the Company during 2015.
The following table sets forth by level, within the fair value hierarchy, the cash balance plan’s assets at fair value as of December 31, 2014 and 2013:
Investments | December 31, 2014 | Quoted Prices In Active Markets for Identical Assets (Level 1) | Significant Other Observable Inputs (Level 2) | Significant Unobservable Inputs (Level 3) | ||||||||
Common/Collective trusts | $ | 143.4 | $ | — | $ | 143.4 | $ | — | ||||
Convergys common stock | 3.7 | 3.7 | — | — | ||||||||
Equity fund | 3.4 | — | — | 3.4 | ||||||||
Total investments | $ | 150.5 | $ | 3.7 | $ | 143.4 | $ | 3.4 | ||||
Investments | December 31, 2013 | Quoted Prices In Active Markets for Identical Assets (Level 1) | Significant Other Observable Inputs (Level 2) | Significant Unobservable Inputs (Level 3) | ||||||||
Common/Collective trusts | $ | 154.5 | $ | — | $ | 154.5 | $ | — | ||||
Convergys common stock | 4.9 | 4.9 | — | — | ||||||||
Equity fund | 3.5 | — | — | 3.5 | ||||||||
Total investments | $ | 162.9 | $ | 4.9 | $ | 154.5 | $ | 3.5 | ||||
There were no transfers between the three levels of the fair value hierarchy during the years ended December 31, 2014 and 2013. For additional information on the fair value hierarchy, see Note 13.
The Company's pension plan holds level 2 investments in common/collective trust funds that are public investment vehicles valued using a net asset value (NAV) provided by the manager of each fund. The NAV is based on the underlying net assets owned by
Convergys Corporation 2014 Annual Report 61
the fund, divided by the number of shares outstanding. The NAV's unit price is quoted on a private market that may not be active. However, the NAV is based on the fair value of the underlying securities within the fund, which are traded on an active market, and valued at the closing price reported on the active market on which those individual securities are traded. The significant investment strategies of the funds are as described in the financial statements provided by each fund. There are no restrictions on redemptions from these funds.
The Company’s pension plan holds Level 3 investments within equity funds which primarily invests in domestic early stage capital funds. The fair value of these investments is based on the net asset value per share of the fund. The pension plan has approximately $0.2 in future funding requirements associated with this investment. The methods described above may produce a fair value calculation that may not be indicative of net realizable value or reflective of future fair values. Furthermore, while the Company believes its valuation methodologies are appropriate and consistent with other market participants, the use of different methodologies or assumptions to determine the fair value of certain financial instruments could result in a different fair value measurement. The following table provides a reconciliation of the beginning and ending balances for the Level 3 assets:
Year Ended December 31 | ||||||
2014 | 2013 | |||||
Balance, beginning of year | $ | 3.5 | $ | 4.3 | ||
Unrealized losses relating to instruments still held at the reporting date | (0.1 | ) | (0.8 | ) | ||
Balance, end of year | $ | 3.4 | $ | 3.5 | ||
Savings Plans
The Company sponsors a defined contribution plan covering substantially all U.S. employees. The Company’s contributions to the plan are based on matching a portion of the employee contributions. In 2014, the Company's matching contribution changed from 100% of the first 3% to 100% of the first 3% and 50% of the next 2% of eligible compensation deferred by the participant. As a result, total Company contributions to the defined contribution plan were $6.5 in 2014 compared to $5.5 and $6.7 for 2013 and 2012, respectively. Plan assets for these plans included 1.1 ($21.8) and 1.2 ($25.8) of Company’s common shares at December 31, 2014 and 2013, respectively.
Employee Postretirement Benefits Other Than Pensions
The Company sponsors postretirement health and life insurance plans for certain eligible employees. The plan provides eligible employees and retirees with the opportunity to direct an amount of their compensation or pension benefits to cover medical, dental and life insurance programs of their choice for their benefit and the benefit of their dependents. The plan covers both active and retired eligible employees of the Company and its subsidiaries. Employees’ eligibility to participate in the plan is based upon their date of hire. During the second quarter of 2011, the Company amended certain components of the postretirement health and life insurance plans to reduce certain benefits. The plan amendments constitute negative amendments. As a result of the plan amendments, the accumulated postretirement benefit obligation decreased approximately $20 from December 31, 2010, the impact of which was recognized as a reduction to net periodic benefit cost over the remaining future service years of the active participants over a weighted-average period of approximately 3 years. During 2012, the Company recognized a $3.8 curtailment benefit related to these plans as a result of the sale of the Information Management business.
The Company funds life insurance benefits of certain retirees through a Voluntary Employee Benefit Association (VEBA) trust. Contributions to the plan consist of (1) compensation or pension benefit deductions that the participant directs the Company, which is also the Plan Sponsor, to deposit into the plan on their behalf based on the coverage the participant has elected under the plan, and (2) amounts the Company pays to the plan that are in excess of the participant-directed deductions. Contributions to the VEBA are subject to IRS limitations developed using the aggregate cost method. At December 31, 2006, the Company eliminated the postretirement life insurance plan benefits for non-retirement eligible employees. The Company’s postretirement benefit plan benefit was $1.6, $4.3, and $9.5 for 2014, 2013 and 2012, respectively. The amounts included within accumulated other comprehensive loss related to these benefits were $2.8 and $4.6 at December 31, 2014 and 2013, respectively.
Components of other post-employment benefit plan cost and other amounts recognized in other comprehensive (loss) income for the postretirement health and life insurance plans are as follows:
Convergys Corporation 2014 Annual Report 62
2014 | 2013 | 2012 | |||||||
Service cost | $ | — | $ | — | $ | — | |||
Interest cost on projected benefit obligation | 0.2 | 0.2 | 0.3 | ||||||
Expected return on plan assets | (0.3 | ) | (0.4 | ) | (0.5 | ) | |||
Amortization and deferrals—net | (1.0 | ) | (3.8 | ) | (5.5 | ) | |||
Curtailment benefit | (0.5 | ) | (0.3 | ) | (3.8 | ) | |||
Total other benefit | $ | (1.6 | ) | $ | (4.3 | ) | $ | (9.5 | ) |
Other comprehensive (loss) income | $ | (1.8 | ) | $ | (2.0 | ) | $ | 8.3 | |
The reconciliation of the postretirement health and life insurance plan’s projected benefit obligation and the fair value of plan assets for the years ended December 31, 2014 and 2013 are as follows:
At December 31, | ||||||
2014 | 2013 | |||||
Change in benefit obligation: | ||||||
Benefit obligation at beginning of year | $ | 4.5 | $ | 6.9 | ||
Interest cost | 0.2 | 0.2 | ||||
Plan amendment | — | (1.3 | ) | |||
Actuarial loss (gain) | 0.1 | (0.9 | ) | |||
Benefits paid | (0.3 | ) | (0.4 | ) | ||
Benefit obligation at end of year | $ | 4.5 | $ | 4.5 | ||
Change in plan assets: | ||||||
Fair value of plan assets at beginning of year | $ | 4.9 | $ | 6.0 | ||
Actual return on plan assets | 0.1 | 0.1 | ||||
Employer contribution | (0.5 | ) | (0.8 | ) | ||
Benefits paid | (0.3 | ) | (0.4 | ) | ||
Fair value of plan assets at end of year | $ | 4.2 | $ | 4.9 | ||
Funded status | $ | (0.3 | ) | $ | 0.4 | |
Amounts recognized in the Consolidated Balance Sheets consisted of: | ||||||
Non-current assets | $ | 0.3 | $ | 1.2 | ||
Current liability | $ | (0.1 | ) | $ | (0.2 | ) |
Non-current liability | $ | (0.5 | ) | $ | (0.6 | ) |
Accumulated other comprehensive income | $ | 2.8 | $ | 4.6 | ||
Estimated future benefit payments from the postretirement health and life plan are as follows:
2015 | $ | 0.3 | |
2016 | 0.3 | ||
2017 | 0.2 | ||
2018 | 0.2 | ||
2019 | 0.2 | ||
2020 - 2024 | 1.1 | ||
Total | $ | 2.3 | |
Plan assets for the postretirement health and life plan of $4.2 and $4.9 at December 31, 2014 and 2013, respectively, are comprised of money market accounts, a Level 1 measure. The Company expects to make $0.1 in contributions in 2015 to fund its post retirement health and life plan. No plan assets are expected to be returned to the Company during 2015.
10. STOCK-BASED COMPENSATION PLANS
At December 31, 2014, the Company had 38.0 common shares that were authorized for issuance under the Convergys Corporation 1998 Long-Term Incentive Plan (Convergys LTIP), as amended on January 28, 2011. The Company granted stock options in 2012 and 2011 with exercise prices that were no less than market value of the stock at the grant date and have a ten-year term and vesting
Convergys Corporation 2014 Annual Report 63
terms of two to three years. The Company also grants certain employees and Directors restricted stock units. The restricted stock units do not possess voting rights and consist of both time-related and performance-related units. The restrictions for the time-related restricted stock units generally lapse one to three years after the grant date. The performance-related units vest upon the Company’s satisfaction of certain financial targets. Performance-related units that have not vested by the end of three years from the grant date (i.e., the performance conditions for vesting of those units have not been met within that period) are forfeited.
The following table shows certain information as of December 31, 2014, with respect to compensation plans under which common shares are authorized for issuance:
Shares (in millions) | Number of Common Shares to be Issued Upon Exercise | Weighted Average Exercise Price | Common Shares Available for Future Issuance | |||||
Equity compensation plans approved by shareholders | ||||||||
Stock options | 0.7 | $ | 13.24 | — | ||||
Restricted stock units | 1.9 | — | — | |||||
2.6 | $ | 13.24 | 8.0 | |||||
The Company’s operating results reflect stock-based compensation expense of $10.2, $13.4 and $21.6 for 2014, 2013 and 2012, respectively. Expense in 2014 included $1.8 related to awards classified as liabilities that will ultimately settle in cash. Expense in 2012 included incentive plan expense that was paid in cash based on relative shareholder return. Stock-based compensation expense related to discontinued operations was $1.4 for 2012.
Stock Options
Presented below is a summary of Company stock option activity:
Shares (in millions) | Shares | Weighted Average Exercise Price | |||
Options outstanding at January 1, 2012 | 3.9 | $ | 23.90 | ||
Options exercisable at January 1, 2012 | 3.2 | 25.97 | |||
Granted | 0.7 | 12.79 | |||
Exercised | (1.0 | ) | 11.62 | ||
Forfeited | (2.4 | ) | 31.33 | ||
Options outstanding at December 31, 2012 | 1.2 | $ | 12.91 | ||
Options exercisable at December 31, 2012 | 0.3 | $ | 11.86 | ||
Granted | — | — | |||
Exercised | (0.3 | ) | 12.24 | ||
Forfeited | (0.1 | ) | 13.31 | ||
Options outstanding at December 31, 2013 | 0.8 | $ | 13.11 | ||
Options exercisable at December 31, 2013 | 0.2 | $ | 13.14 | ||
Granted | — | — | |||
Exercised | (0.1 | ) | 12.38 | ||
Forfeited | — | — | |||
Options outstanding at December 31, 2014 | 0.7 | $ | 13.24 | ||
Options exercisable at December 31, 2014 | 0.5 | $ | 13.41 | ||
Approximately one-half of the stock options granted during 2012 and 2011 vested in two years and the remaining vest in three years. The Company uses the Black-Scholes option pricing model to calculate the fair value of stock options granted. For the 2012 grants, the weighted average fair value at grant date of $3.43 per option granted included assumptions of a strike price of $12.79, a 30.74% implied volatility, an expected term of 4.5 years, a risk-free rate of 0.76%, and a dividend yield of 0.00%. These 2012 option grants resulted in stock compensation expense of $0.2, $0.6 and $0.7 in 2014, 2013 and 2012, respectively. For the 2011 grants, the weighted average fair value at grant date of $4.06 per option granted included assumptions of a strike price of $13.79, a 31.11% implied volatility, an expected term of 4.5 years, a risk-free rate of 2.12%, and a dividend yield of 0.00%. These 2011 option grants resulted in stock compensation expense of $0.1 in 2014 and $0.3 in 2013 and 2012, respectively. Expected volatility is based on the unbiased standard deviation of the Company's common stock over the option term. The expected life of the options
Convergys Corporation 2014 Annual Report 64
represents the period of time that the Company expects the options granted to be outstanding. The risk-free rate is based on the U.S. Treasury yield curve in effect at the time of the grant of the option for the expected term of the instrument. The dividend yield reflects an estimate of dividend payouts over the term of the award.
The weighted average grant date fair value per share for the outstanding and exercisable options at December 31, 2014 was $3.72 and $3.84, respectively.
The following table summarizes the status of the Company stock options outstanding and exercisable at December 31, 2014:
Shares (in millions) | Options Outstanding | Options Exercisable | |||||||||||
Range of Exercise Prices | Shares | Weighted Average Remaining Contractual Life (in years) | Weighted Average Exercise Price | Shares | Weighted Average Remaining Contractual Life (in years) | Weighted Average Exercise Price | |||||||
$11.56 to $21.81 | 0.7 | 6.6 | 13.24 | 0.5 | 6.5 | 13.41 | |||||||
Total | 0.7 | 6.6 | $ | 13.24 | 0.5 | 6.5 | $ | 13.41 | |||||
The aggregate intrinsic value of stock options exercised was $1.1 in 2014, $1.3 in 2013 and $3.3 in 2012. The actual tax benefit realized from the exercised stock options was $0.2 in 2014, $0.3 in 2013 and $0.7 in 2012. As of December 31, 2014, the aggregate intrinsic value was $8.6 for both stock options outstanding and exercisable. Intrinsic value represents the Company's closing price on the last trading day of the year in excess of the weighted average exercise price for those tranches of options with a weighted average exercise price less than the closing price multiplied by the number of options outstanding or exercisable.
Restricted Stock Units
Time-based Restricted Stock Units
During the years ended December 31, 2014, 2013 and 2012, the Company granted 0.7, 0.6 and 1.0 shares, respectively, of time-based restricted stock units. The weighted average fair values of these grants were $20.55, $16.35 and $13.21, respectively. The 2014 and 2013 time-based grants are scheduled to vest 25% at the completion of year one after the grant date, 25% after year two and 50% after year three. The 2012 time-based grants vested 50% at the end of year two and 50% at the end of year three.
The total compensation cost related to non-vested time-based restricted stock units not yet recognized as of December 31, 2014 was approximately $13.5, which is expected to be recognized over a weighted average of 1.0 years. Changes to non-vested time-based restricted stock and restricted stock units for the years ended December 31, 2014 and 2013 were as follows:
Shares (in millions) | Number of Shares | Weighted Average Fair Value at Date of Grant | |||
Non-vested at December 31, 2011 | 2.1 | $ | 11.72 | ||
Granted | 1.0 | 13.21 | |||
Vested | (1.1 | ) | 10.69 | ||
Forfeited | (0.4 | ) | 12.94 | ||
Non-vested at December 31, 2012 | 1.6 | 13.04 | |||
Granted | 0.6 | 16.35 | |||
Vested | (0.7 | ) | 12.75 | ||
Forfeited | (0.1 | ) | 14.09 | ||
Non-vested at December 31, 2013 | 1.4 | 14.62 | |||
Granted | 0.7 | 20.55 | |||
Vested | (0.6 | ) | 14.33 | ||
Forfeited | (0.2 | ) | 18.85 | ||
Non-vested at December 31, 2014 | 1.3 | $ | 17.66 | ||
Convergys Corporation 2014 Annual Report 65
Performance-based Restricted Stock Units
During the years ended December 31, 2014, 2013 and 2012, the Company granted 0.3, 0.4 and 0.6 shares, respectively, of performance-based restricted stock units. The 2014 and 2013 grants each include 0.3 shares that provide for payout based upon the extent to which the Company achieves certain EPS targets, as determined by the Compensation and Benefits Committee of the Board of Directors, over three-year periods. Payout levels range from 50% to 200% of award shares earned. No payout can be earned if performance is below the minimum threshold level. As the targets for the third year of 2013 grants and second and third years of 2014 grants have not yet been set, the key terms have not been effectively communicated to the recipients, and as such the expense related to these grants cannot be recognized until the key terms are established. These grants have been excluded from the table below. The remaining 0.1 of performance-based shares granted in 2013 vested immediately.
Changes to non-vested performance-based restricted stock and restricted stock units for the years ended December 31, 2014 and 2013 were as follows:
Shares (in millions) | Number of Shares | Weighted Average Fair Value at Date of Grant | |||
Non-vested at December 31, 2011 | 1.8 | $ | 10.31 | ||
Granted | 0.6 | 12.95 | |||
Vested | (1.1 | ) | 9.63 | ||
Forfeited | (0.3 | ) | 12.30 | ||
Non-vested at December 31, 2012 | 1.0 | 12.69 | |||
Granted | 0.1 | 16.34 | |||
Vested | (0.8 | ) | 13.32 | ||
Forfeited | — | — | |||
Non-vested at December 31, 2013 | 0.3 | 12.90 | |||
Granted | — | — | |||
Vested | (0.3 | ) | 12.90 | ||
Forfeited | — | — | |||
Non-vested at December 31, 2014 | — | $ | — | ||
The aggregate intrinsic value of non-vested restricted stock units was $27.9 at December 31, 2014.
11. COMMITMENTS AND CONTINGENCIES
Commitments
The Company leases certain facilities and equipment used in its operations. Total rent expense was $125.2, $81.0 and $66.0 in 2014, 2013 and 2012, respectively.
At December 31, 2014, the total minimum rental commitments under non-cancelable operating leases are as follows:
2015 | $ | 112.7 | |
2016 | 87.4 | ||
2017 | 62.9 | ||
2018 | 42.2 | ||
2019 | 18.1 | ||
Thereafter | 25.1 | ||
Total | $ | 348.4 | |
At December 31, 2014, the Company had outstanding letters of credit of $25.5 related to performance and payment guarantees, of which $8.8 is set to expire by the end of 2014, $16.5 is set to expire within one to three years and $0.2 is set to expire after three years. The Company also had other bond obligations of $2.6 related to performance and payment guarantees.
Convergys Corporation 2014 Annual Report 66
At December 31, 2014, the Company had an outstanding performance bond obligation of $30.0 related to a performance and payment guarantee for the Company’s former HR Management line of business which was sold in 2010 to NorthgateArinso. Subsequent to completion of the sale of the HR Management business, the Company continues to be responsible for this bond obligation. As part of the gain on disposition, the Company recognized a liability equal to the present value of probability weighted cash flows of potential outcomes, a Level 3 fair value measurement. Although the buyer is obligated to indemnify the Company for any and all losses, costs, liabilities and expenses incurred related to these performance bonds, as of December 31, 2014 the Company maintains a liability of $0.4 for these obligations. The Company's guarantee for this bond obligation expires in August 2016.
The Company also has future purchase commitments with telecommunication providers of $17.3 at December 31, 2014.
Contingencies
The Company from time to time is involved in various loss contingencies, including tax and legal contingencies that arise in the ordinary course of business. The Company accrues for a loss contingency when it is probable that a liability has been incurred and the amount of such loss can be reasonably estimated. At this time, the Company believes that the results of any such contingencies, either individually or in the aggregate, will not have a materially adverse effect on the Company’s results of operations or financial condition. However, the outcome of any litigation cannot be predicted with certainty. An unfavorable resolution of one or more pending matters could have a materially adverse impact on the Company’s results of operations or financial condition in the future.
In November 2011, one of the Company's call center clients, Hyundai Motor America (Hyundai), tendered a contractual indemnity claim to Convergys Customer Management Group Inc., a subsidiary of the Company, relating to a putative class action captioned Brandon Wheelock, individually and on behalf of a class and subclass of similarly situated individuals, v. Hyundai Motor America, Orange County Superior Court, California, Case No. 30-2011-00522293-CU-BT-CJC. The lawsuit alleges that Hyundai violated California's telephone recording laws by recording telephone calls with customer service representatives without providing a disclosure that the calls might be recorded.
Convergys Customer Management Group Inc. is not named as a defendant in the lawsuit, and there has been no determination as to whether Convergys Customer Management Group Inc. will be required to indemnify Hyundai. The Company believes Convergys Customer Management Group Inc. has meritorious defenses to Hyundai's demand for indemnification and also believes there are meritorious defenses to Plaintiff's claims in the lawsuit. Pursuant to a Memorandum of Understanding dated April 29, 2014, Hyundai, Plaintiff and Convergys Customer Management Group Inc. agreed in principle to settle the lawsuit. As contemplated under the agreement in principle, the three parties recently executed a formal settlement agreement that is subject to approval by the Court. As a result of the agreement in principle to settle the lawsuit, the Company's accrued liability at December 31, 2014 is representative of the best estimate of the loss expected to be incurred with the resolution of Hyundai’s contractual indemnity claim. The ultimate resolution of the indemnity claim is not expected to have a material impact on the Company’s liquidity, results of operations or financial condition.
12. FINANCIAL INSTRUMENTS
Derivative Instruments
The Company is exposed to a variety of market risks, including the effects of changes in foreign currency exchange rates and interest rates. Market risk is the potential loss arising from adverse changes in market rates and prices. The Company’s risk management strategy includes the use of derivative instruments to reduce the effects on its operating results and cash flows from fluctuations caused by volatility in currency exchange and interest rates.
The Company serves many of its U.S.-based clients using contact center capacity outside of the U.S., primarily in the Philippines, India, Canada, China, Malaysia, Costa Rica, Colombia, Dominican Republic, El Salvador, Nicaragua and Honduras. Although the contracts with these clients are typically priced in U.S. Dollars, a substantial portion of the costs incurred to render services under these contracts are denominated in the local currency of the country where services are provided, which represents a foreign exchange exposure. The Company has hedged a portion of its exposure related to the anticipated cash flow requirements denominated in these foreign currencies by entering into forward exchange contracts with several financial institutions to acquire a total of PHP 42,507.0 at a fixed price of $965.8 at various dates through September, 2017, INR 10,208.0 at a fixed price of $155.7 at various dates through December, 2017 and CAD 11.1 at a fixed price of $10.2 at various dates through December, 2015. These instruments mature within the next 36 months and had a notional value of $1,131.7 at December 31, 2014 and $965.5 at
Convergys Corporation 2014 Annual Report 67
December 31, 2013. The derivative instruments discussed above are designated and are effective as cash flow hedges. The following table reflects the fair values of these derivative instruments:
At December 31, | ||||||
2014 | 2013 | |||||
Forward exchange contracts and options designated as hedging instruments: | ||||||
Included within other current assets | $ | 1.7 | $ | 4.3 | ||
Included within other non-current assets | 1.3 | 0.2 | ||||
Included within other current liabilities | 21.4 | 21.2 | ||||
Included within other long-term liabilities | 11.3 | 19.8 | ||||
The Company recorded a deferred tax benefit of $11.3 and $14.1 related to these derivatives at December 31, 2014 and 2013, respectively. A total of $18.3 and $22.5 of deferred losses, net of tax, related to these cash flow hedges at December 31, 2014 and 2013, respectively, were included in accumulated other comprehensive loss (OCL). As of December 31, 2014, deferred losses of $19.6 ($12.1 net of tax), on derivative instruments included in accumulated OCL are expected to be reclassified into earnings during the next 12 months. The following tables provide the effect of these derivative instruments on the Company’s Consolidated Financial Statements during 2014 and 2013, respectively:
2014:
Derivatives in Cash Flow Hedging Relationships | Gain (Loss) Recognized in OCL on Derivative (Effective Portion) | Gain (Loss) Reclassified from Accumulated OCL into Income (Effective Portion) | Location of Gain (Loss) Reclassified from Accumulated OCL into Income (Effective Portion) | ||||
Foreign exchange contracts | $ | (7.5 | ) | $ | (14.3 | ) | Cost of providing services and products sold and Selling, general and administrative |
2013:
Derivatives in Cash Flow Hedging Relationships | Gain (Loss) Recognized in OCL on Derivative (Effective Portion) | Gain (Loss) Reclassified from Accumulated OCL into Income (Effective Portion) | Location of Gain (Loss) Reclassified from Accumulated OCL into Income (Effective Portion) | ||||
Foreign exchange contracts | $ | (57.1 | ) | $ | (2.1 | ) | Cost of providing services and products sold and Selling, general and administrative |
The gain/loss recognized related to the ineffective portion of the derivative instruments was immaterial for the years ended December 31, 2014 and 2013.
During 2014, 2013 and 2012, the Company recorded net losses of $14.3, and $2.1 and a net gain of $14.8, respectively, related to the settlement of forward contracts and options which were designated as cash flow hedges.
The Company also enters into derivative instruments (forwards) to economically hedge the foreign currency impact of assets and liabilities denominated in nonfunctional currencies. During the year ended December 31, 2014, a gain of $2.0 was recognized related to changes in fair value of these derivative instruments not designated as hedges, compared to a gain of $2.4 in the same period in 2013. The gains and losses largely offset the currency gains and losses that resulted from changes in the assets and liabilities denominated in nonfunctional currencies. These gains and losses are classified within other income, net in the accompanying Consolidated Statements of Income. The fair value of these derivative instruments not designated as hedges at December 31, 2014, was $0.3.
Convergys Corporation 2014 Annual Report 68
The aggregate fair value of all derivative instruments in liability position at December 31, 2014 was $32.7 for which the Company has no posted collateral.
Short-term Investments
In December 2011, the Company made investments in certain securities, included within short-term investments in the Consolidated Balance Sheets, which are held in a grantor trust for the benefit of participants of the executive deferred compensation plan, which was frozen during the fourth quarter of 2011 and subsequently reopened, effective January 1, 2014. This investment reflects the hypothetical investment balances of plan participants. As of December 31, 2014 and 2013, the Company maintained investment securities with a fair value of $13.0 and $14.2, respectively, classified as trading securities. The investment securities include exchange-traded mutual funds, common stock of the Company and money market accounts. These securities are carried at fair value, with gains and losses, both realized and unrealized, reported in other income (expense), net in the Consolidated Statements of Income. The cost of securities sold is based upon the specific identification method. Interest and dividends on securities classified as trading are included in other income (expense), net.
Additionally, during 2013, the Company made investments in time deposits with maturities greater than 90 days and less than 180 days, included within short-term investments in the Consolidated Balance Sheets. As of December 31, 2014, no time deposits were held. The Company maintained short-term time deposits with a fair value of $68.7 as of December 31, 2013.
13. FAIR VALUE MEASUREMENTS
U.S. GAAP defines a hierarchy which prioritizes the inputs in measuring fair value. The three levels of the fair value hierarchy are as follows: Level 1 inputs are quoted prices (unadjusted) in active markets for identical assets or liabilities; Level 2 inputs are quoted prices for similar assets and liabilities in active markets or inputs that are observable for the asset or liability, either directly or indirectly through market corroboration, for substantially the full term of the financial instrument; and Level 3 inputs are unobservable inputs based on the Company’s assumptions used to measure assets and liabilities at fair value. A financial asset or liability’s classification within the hierarchy is determined based on the lowest level input that is significant to the fair value measurement.
At December 31, 2014 and 2013, the Company had foreign currency forward contracts measured at fair value. The fair values of these instruments were measured using valuations based upon quoted prices for similar assets and liabilities in active markets (Level 2) and are valued by reference to similar financial instruments, adjusted for terms specific to the contracts. There were no transfers between the three levels of the fair value hierarchy during the years ended December 31, 2014 and 2013. The derivative assets and liabilities measured at fair value on a recurring basis as of December 31, 2014 and 2013 were as follows:
December 31, 2014 | Quoted Prices In Active Markets for Identical Assets (Level 1) | Significant Other Observable Inputs (Level 2) | Significant Unobservable Inputs (Level 3) | ||||||||||||
Derivatives: | |||||||||||||||
Foreign currency forward contracts (asset position) | $ | 3.3 | $ | — | $ | 3.3 | $ | — | |||||||
Foreign currency forward contracts (liability position) | $ | 32.7 | $ | — | $ | 32.7 | $ | — | |||||||
December 31, 2013 | Quoted Prices In Active Markets for Identical Assets (Level 1) | Significant Other Observable Inputs (Level 2) | Significant Unobservable Inputs (Level 3) | ||||||||||||
Derivatives: | |||||||||||||||
Foreign currency forward contracts (asset position) | $ | 4.5 | $ | — | $ | 4.5 | $ | — | |||||||
Foreign currency forward contracts (liability position) | $ | 41.0 | $ | — | $ | 41.0 | $ | — | |||||||
The Company also had investment securities held in a grantor trust for the benefit of participants of the executive deferred compensation plan measured at fair value at December 31, 2014 and December 31, 2013. The fair value of these instruments was measured using the quoted prices in active markets for identical assets (Level 1). There were no transfers between the three levels of the fair value hierarchy during the years ended December 31, 2014 and 2013. The assets measured at fair value on a recurring basis as of December 31, 2014 and 2013 were as follows:
Convergys Corporation 2014 Annual Report 69
December 31, 2014 | Quoted Prices In Active Markets for Identical Assets (Level 1) | Significant Other Observable Inputs (Level 2) | Significant Unobservable Inputs (Level 3) | ||||||||||||
Investment securities: | |||||||||||||||
Mutual funds | $ | 10.3 | $ | 10.3 | $ | — | $ | — | |||||||
Convergys common stock | 2.1 | 2.1 | — | — | |||||||||||
Money market accounts | 0.6 | 0.6 | — | — | |||||||||||
Total | $ | 13.0 | $ | 13.0 | $ | — | $ | — | |||||||
December 31, 2013 | Quoted Prices In Active Markets for Identical Assets (Level 1) | Significant Other Observable Inputs (Level 2) | Significant Unobservable Inputs (Level 3) | ||||||||||||
Investment securities: | |||||||||||||||
Mutual funds | $ | 11.0 | $ | 11.0 | $ | — | $ | — | |||||||
Convergys common stock | 2.3 | 2.3 | — | — | |||||||||||
Money market accounts | 0.9 | 0.9 | — | — | |||||||||||
Total | $ | 14.2 | $ | 14.2 | $ | — | $ | — | |||||||
At December 31, 2013, the Company held time deposits with maturities greater than 90 days and less than 180 days measured at fair value. The valuation technique used to measure the fair value of the time deposits was based on observable market data. There were no transfers between the three levels of the fair value hierarchy. As of December 31, 2014, no time deposits were held. The assets measured at fair value on a recurring basis as of December 31, 2013 were as follows:
December 31, 2013 | Quoted Prices In Active Markets for Identical Assets (Level 1) | Significant Other Observable Inputs (Level 2) | Significant Unobservable Inputs (Level 3) | ||||||||||||
Short-term Investments: | |||||||||||||||
Cash time deposits | $ | 68.7 | $ | — | $ | 68.7 | $ | — | |||||||
Total | $ | 68.7 | $ | — | $ | 68.7 | $ | — | |||||||
Fair values of cash equivalents and current accounts receivable and payable approximate the carrying amounts because of their short-term nature.
14. INCOME TAXES
The Company’s provision for income taxes from continuing operations consists of the following:
Convergys Corporation 2014 Annual Report 70
Year Ended December 31, | |||||||||
2014 | 2013 | 2012 | |||||||
Current: | |||||||||
United States federal | $ | 33.8 | $ | (3.1 | ) | $ | (0.9 | ) | |
Foreign | 45.6 | 10.2 | 8.0 | ||||||
State and local | 1.1 | 1.5 | (1.8 | ) | |||||
Total current | 80.5 | 8.6 | 5.3 | ||||||
Deferred: | |||||||||
United States federal | (42.4 | ) | 30.7 | (4.7 | ) | ||||
Foreign | (27.5 | ) | 34.0 | (0.8 | ) | ||||
State and local | 2.2 | (0.8 | ) | 1.3 | |||||
Total deferred | (67.7 | ) | 63.9 | (4.2 | ) | ||||
Total | $ | 12.8 | $ | 72.5 | $ | 1.1 | |||
The Company’s combined pre-tax earnings from continuing operations relating to foreign subsidiaries or branches were $143.8, $99.1 and $77.1 during 2014, 2013 and 2012, respectively.
The following is a reconciliation of the statutory federal income tax rate with the effective tax rate from continuing operations for the tax expense in 2014, 2013 and 2012, respectively:
Year Ended December 31, | ||||||
2014 | 2013 | 2012 | ||||
U.S. federal statutory rate | 35.0 | % | 35.0 | % | 35.0 | % |
Permanent differences | 8.6 | 6.8 | 12.4 | |||
State and local income taxes, net of federal income tax | 1.7 | 0.4 | (3.4 | ) | ||
International rate differential, including tax holidays | (29.8 | ) | (14.0 | ) | (54.2 | ) |
Foreign valuation allowances | 2.3 | — | (4.9 | ) | ||
Asset impairments and other | — | — | 46.5 | |||
Adjustments for uncertain tax positions | 1.2 | 2.3 | (1.8 | ) | ||
Restructuring | — | — | (9.2 | ) | ||
Tax credits and other | (4.5 | ) | (10.4 | ) | (16.6 | ) |
Foreign repatriation, net of foreign tax credits | (4.6 | ) | 35.2 | — | ||
Effective rate | 9.9 | % | 55.3 | % | 3.8 | % |
The decrease in the income tax rate in 2014 was driven by a shift in the geographical mix of worldwide income, in addition to expense of $46.4 recognized in 2013 to record a deferred tax liability associated with a change in classification for a portion of the undistributed earnings of the Company's foreign subsidiaries. In conjunction with the acquisition of Stream, the Company repatriated $125.1 of its accumulated foreign earnings in a taxable transaction. As a result of the Stream acquisition, the Company recognized a $6.0 benefit as it was able to utilize certain foreign tax credit attributes. These foreign tax credits could not be taken into account in calculating the Company’s tax on the book-to-tax basis difference of its foreign subsidiaries until the acquisition of Stream was complete. As of December 31, 2014, the Company had $334.9 of undistributed earnings of its foreign subsidiaries for which it has not provided for U.S. federal income taxes or foreign withholding taxes because such earnings are intended to be reinvested indefinitely. It is not practicable to determine the amount of applicable taxes that would be due if such earnings were distributed.
The Company’s foreign taxes for 2014, 2013 and 2012 included $3.9, $2.5 and $3.5, respectively, of benefit derived from tax holidays in the Philippines, the Dominican Republic, Costa Rica, El Salvador, Malaysia and Tunisia. This resulted in a (3.0)%, (1.9)% and (11.6)% impact to the effective tax rate in 2014, 2013 and 2012, respectively. The tax holidays in the Philippines will expire in 2015 through 2018. The Company will apply to extend these tax holidays for additional terms of one to two years in accordance with local law.
The components of deferred tax assets and liabilities are as follows:
Convergys Corporation 2014 Annual Report 71
At December 31, | ||||||
2014 | 2013 | |||||
Deferred tax assets: | ||||||
Loss and credit carryforwards | $ | 104.7 | $ | 66.6 | ||
Pension and employee benefits | 44.7 | 31.7 | ||||
Restructuring charges | 1.3 | 0.6 | ||||
Deferred revenue | 2.9 | 3.9 | ||||
Foreign currency hedges | 11.4 | 11.5 | ||||
Intercompany payables/receivables | 48.3 | — | ||||
Other | 47.9 | 28.9 | ||||
Valuation allowances | (39.3 | ) | (26.2 | ) | ||
Total deferred tax assets | 221.9 | 117.0 | ||||
Deferred tax liabilities: | ||||||
Depreciation and amortization | 291.4 | 161.4 | ||||
Deferred implementation costs | 0.6 | 1.3 | ||||
Contingent debt and accrued interest | 67.7 | 57.6 | ||||
Unremitted foreign earnings | 15.7 | 61.8 | ||||
Other | 7.3 | 8.0 | ||||
Total deferred tax liabilities | 382.7 | 290.1 | ||||
Net deferred tax liabilities | $ | (160.8 | ) | $ | (173.1 | ) |
Deferred tax assets and liabilities in the preceding table, after netting by taxing jurisdiction, are in the following captions in the Consolidated Balance Sheets at December 31, 2014 and 2013.
At December 31, | ||||||
2014 | 2013 | |||||
Current deferred tax asset | $ | 107.2 | $ | 6.2 | ||
Non-current deferred tax asset | 8.2 | 8.9 | ||||
Current deferred tax liability | 0.6 | 37.4 | ||||
Non-current deferred tax liability | 275.6 | 150.8 | ||||
Total deferred tax liability | $ | (160.8 | ) | $ | (173.1 | ) |
As of December 31, 2014 and 2013, $5.2 and $0.3, respectively, of the valuation allowances relate to the Company’s foreign operations.
As of December 31, 2014, the Company has federal, state, and foreign operating loss carryforwards of $123.1, $752.8 and $46.5, respectively. The federal operating loss carryforwards and state operating loss carryforwards expire between 2017 and 2034. The foreign operating loss carryforwards include $11.9 with no expiration date; the remainder will expire between 2015 and 2032. The federal and state operating loss carryforwards include losses of $116.0 and $126.7, respectively, which were acquired in connection with business combinations. Utilization of the acquired federal and state tax loss carryforwards may be limited pursuant to Section 382 of the Internal Revenue Code of 1986.
As of December 31, 2014 and 2013, the liability for unrecognized tax benefits was $59.9 and $52.1, respectively, including $24.0 and $19.5 of accrued interest and penalties, respectively, and is recorded in the other long-term liabilities in the Consolidated Balance Sheets. The total amount of net unrecognized tax benefits that would affect income tax expense, if ever recognized in the Consolidated Financial Statements, is $50.1. This amount includes net interest and penalties of $21.8. The Company’s policy is to recognize interest and penalties accrued on unrecognized tax benefits as part of income tax expense. During 2014, the Company recognized expense of $4.2 in interest and penalties, compared to $0.2 during 2013.
A reconciliation of the beginning and ending total amounts of unrecognized tax benefits (exclusive of interest and penalties) is as follows:
Convergys Corporation 2014 Annual Report 72
2014 | 2013 | |||||
Balance at January 1 | $ | 32.6 | $ | 34.9 | ||
Additions based on tax positions related to the current year | 0.4 | 0.3 | ||||
Additions for tax positions of Stream on the date of acquisition | 5.9 | — | ||||
Settlements | 0.5 | (0.2 | ) | |||
Reductions for tax positions of prior years | (0.7 | ) | (1.8 | ) | ||
Lapse of statutes | (1.6 | ) | (0.6 | ) | ||
Balance at December 31 | $ | 37.1 | $ | 32.6 | ||
The liability for unrecognized tax benefits related to discontinued operations at December 31, 2014 and 2013 was $11.8 and $10.5, respectively.
The Company is currently attempting to resolve income tax audits relating to prior years in various jurisdictions. The Company has received assessments from these jurisdictions related to transfer pricing and deductibility of expenses. The Company believes that it is appropriately reserved with regard to these assessments as of December 31, 2014. Furthermore, the Company believes that it is reasonably possible that the total amounts of unrecognized tax benefits will decrease between $2.0 and $10.0 prior to December 31, 2015, based upon resolution of audits; however, actual developments could differ from those currently expected.
The Company files income tax returns in the U.S. federal jurisdiction, and various states and foreign jurisdictions. With a few exceptions, the Company is no longer subject to examinations by tax authorities for years before 2002.
15. ACCUMULATED OTHER COMPREHENSIVE INCOME (LOSS)
The following table summarizes the changes in the accumulated balances for each component of accumulated other comprehensive income (loss):
Foreign Currency | Derivative Financial Instruments | Pension Liability | Total | ||||||||||||||
Balance at December 31, 2012 | $ | 36.4 | $ | 11.4 | $ | (58.3 | ) | $ | (10.5 | ) | |||||||
Other comprehensive (loss) income before reclassifications, net of tax | (1.3 | ) | (35.1 | ) | 10.3 | (26.1 | ) | ||||||||||
Settlement of pension obligation, net of tax | — | — | 8.4 | 8.4 | |||||||||||||
Amounts reclassified from accumulated other comprehensive income, net of tax | — | 1.2 | 7.5 | 8.7 | |||||||||||||
Net current-period other comprehensive (loss) income | (1.3 | ) | (33.9 | ) | 26.2 | (9.0 | ) | ||||||||||
Balance at December 31, 2013 | $ | 35.1 | $ | (22.5 | ) | $ | (32.1 | ) | $ | (19.5 | ) | ||||||
Other comprehensive loss before reclassifications, net of tax | (36.2 | ) | (4.5 | ) | (21.9 | ) | (62.6 | ) | |||||||||
Settlement of pension obligation, net of tax | — | — | 2.9 | 2.9 | |||||||||||||
Amounts reclassified from accumulated other comprehensive income, net of tax | — | 8.7 | 3.8 | 12.5 | |||||||||||||
Net current-period other comprehensive (loss) income | (36.2 | ) | 4.2 | (15.2 | ) | (47.2 | ) | ||||||||||
Balance at December 31, 2014 | $ | (1.1 | ) | $ | (18.3 | ) | $ | (47.3 | ) | $ | (66.7 | ) | |||||
The following table summarizes the reclassification out of accumulated other comprehensive income (loss):
Convergys Corporation 2014 Annual Report 73
Details about Accumulated Other Comprehensive Income (Loss) Components | Amount Reclassified from Accumulated Other Comprehensive Income (Loss) | Affected Line Item in the Consolidated Statements of Income | ||||
2014: | ||||||
Loss on derivative instruments | $ | (14.3 | ) | Cost of providing services and products sold and Selling, general and administrative | ||
Tax benefit | 5.6 | Income tax expense | ||||
Loss on derivative instruments, net of tax | (8.7 | ) | Income from Continuing Operations, net of tax | |||
Adjustments of pension and other post employment obligations | (10.7 | ) | Selling, general and administrative | |||
Tax benefit | 4.0 | Income tax expense | ||||
Adjustment of pension and other post employment obligations, net of tax | (6.7 | ) | Income from Continuing Operations, net of tax | |||
Total reclassifications for the period | $ | (15.4 | ) | |||
2013: | ||||||
Loss on derivative instruments | $ | (2.1 | ) | Cost of providing services and products sold and Selling, general and administrative | ||
Tax benefit | 0.9 | Income tax expense | ||||
Loss on derivative instruments, net of tax | (1.2 | ) | Income from Continuing Operations, net of tax | |||
Adjustment of pension and other post employment obligations | (24.9 | ) | Selling, general and administrative | |||
Tax benefit | 9.0 | Income tax expense | ||||
Adjustment of pension and other post employment obligations, net of tax | (15.9 | ) | Income from Continuing Operations, net of tax | |||
Total reclassifications for the period | $ | (17.1 | ) | |||
16. ADDITIONAL FINANCIAL INFORMATION
At December 31, | ||||||
2014 | 2013 | |||||
Property and equipment, net: | ||||||
Land | $ | 6.9 | $ | 6.9 | ||
Buildings | 103.4 | 101.5 | ||||
Leasehold improvements | 285.0 | 189.3 | ||||
Equipment | 555.8 | 480.4 | ||||
Software | 339.2 | 311.9 | ||||
Construction in progress and other | 28.6 | 32.0 | ||||
1,318.9 | 1,122.0 | |||||
Less: Accumulated depreciation | (951.1 | ) | (875.6 | ) | ||
$ | 367.8 | $ | 246.4 | |||
Payables and other current liabilities: | ||||||
Accounts payable | $ | 40.1 | $ | 30.9 | ||
Deferred tax liability | 0.6 | 37.4 | ||||
Accrued income and other taxes | 34.6 | 22.3 | ||||
Accrued payroll-related expenses | 156.4 | 85.9 | ||||
Derivative liabilities | 21.4 | 21.2 | ||||
Accrued expenses, other | 84.5 | 68.9 | ||||
Restructuring and exit costs | 3.9 | 2.3 | ||||
Deferred revenue and government grants | 19.5 | 22.8 | ||||
$ | 361.0 | $ | 291.7 | |||
Convergys Corporation 2014 Annual Report 74
17. INDUSTRY SEGMENT AND GEOGRAPHIC OPERATIONS
Industry Segment Information
As a result of the change in classification of the Information Management business to discontinued operations, the change in our Chief Executive Officer in the fourth quarter of 2012, and in order to reflect the internal financial reporting structure and operating focus of our new management team and chief operating decision maker, we report operating results and assets and liabilities as a single segment on a consolidated basis. Segment information for previous periods has been reclassified to conform to the current reporting structure.
Geographic Operations
The following table presents certain geographic information regarding the Company’s operations:
Year Ended December 31, | |||||||||
2014 | 2013 | 2012 | |||||||
Revenues: | |||||||||
North America | $ | 2,320.3 | $ | 1,860.8 | $ | 1,836.4 | |||
Rest of World | 535.2 | 185.3 | 168.6 | ||||||
$ | 2,855.5 | $ | 2,046.1 | $ | 2,005.0 | ||||
At December 31, | ||||||
2014 | 2013 | |||||
Long-lived Assets: | ||||||
North America | $ | 1,031.3 | $ | 762.9 | ||
Rest of World | 594.3 | 133.4 | ||||
$ | 1,625.6 | $ | 896.3 | |||
Concentrations
The Company derives significant revenues from AT&T. Revenues from AT&T were 15.3%, 20.9% and 23.1% of the Company’s consolidated revenues from continuing operations for 2014, 2013 and 2012, respectively. Related accounts receivable from AT&T totaled $71.9 and $73.8 at December 31, 2014 and 2013, respectively. As of December 31, 2013 and 2012, the Company also derives significant revenues from DIRECTV and Comcast. Revenues from DIRECTV were 12.5% and 12.3% of the Company's consolidated revenues from continuing operations for 2013 and 2012, respectively. Revenues from Comcast were 12.4% and 12.4% of the Company's consolidated revenues from continuing operations for 2013 and 2012, respectively.
18. QUARTERLY FINANCIAL INFORMATION (UNAUDITED)
1st Quarter | 2nd Quarter | 3rd Quarter | 4th Quarter (a) | Total | |||||||||||||||
2014: | |||||||||||||||||||
Revenues | $ | 605.7 | $ | 736.4 | $ | 749.5 | $ | 763.9 | $ | 2,855.5 | |||||||||
Operating Income | 22.0 | 36.9 | 42.0 | 49.9 | 150.8 | ||||||||||||||
Income from Continued Operations, net of tax | 13.7 | 24.9 | 30.0 | 48.0 | 116.5 | ||||||||||||||
Income (loss) from Discontinued Operations, net of tax | 0.5 | (0.2 | ) | 2.8 | 0.4 | 3.5 | |||||||||||||
Net Income | 14.2 | 24.7 | 32.8 | 48.4 | 120.0 | ||||||||||||||
Basic Earnings Per Common Share: | |||||||||||||||||||
Continuing Operations | $ | 0.14 | $ | 0.25 | $ | 0.30 | $ | 0.48 | $ | 1.16 | |||||||||
Discontinued Operations | — | — | 0.03 | — | 0.03 | ||||||||||||||
Basic Earnings Per Common Share | $ | 0.14 | $ | 0.25 | $ | 0.33 | $ | 0.48 | $ | 1.19 | |||||||||
Diluted Earnings Per Common Share | |||||||||||||||||||
Continuing Operations | $ | 0.13 | $ | 0.23 | $ | 0.28 | $ | 0.46 | $ | 1.10 | |||||||||
Discontinued Operations | — | — | 0.03 | — | 0.03 | ||||||||||||||
Diluted Earnings Per Common Share | $ | 0.13 | $ | 0.23 | $ | 0.31 | $ | 0.46 | $ | 1.13 | |||||||||
Convergys Corporation 2014 Annual Report 75
1st Quarter | 2nd Quarter | 3rd Quarter | 4th Quarter (b) | Total | |||||||||||||||
2013: | |||||||||||||||||||
Revenues | $ | 493.5 | $ | 504.3 | $ | 521.0 | $ | 527.3 | $ | 2,046.1 | |||||||||
Operating Income | 36.5 | 30.1 | 31.3 | 39.5 | 137.4 | ||||||||||||||
Income (loss) from Continued Operations, net of tax | 30.2 | 22.0 | 28.2 | (21.9 | ) | 58.5 | |||||||||||||
(Loss) income from Discontinued Operations, net of tax | (5.1 | ) | 1.4 | 5.7 | 0.4 | 2.4 | |||||||||||||
Net Income (Loss) | 25.1 | 23.4 | 33.9 | (21.5 | ) | 60.9 | |||||||||||||
Basic Earnings (Loss) Per Common Share: | |||||||||||||||||||
Continuing Operations | $ | 0.28 | $ | 0.21 | $ | 0.27 | $ | (0.21 | ) | $ | 0.57 | ||||||||
Discontinued Operations | (0.04 | ) | 0.02 | 0.06 | — | 0.02 | |||||||||||||
Basic Earnings (Loss) Per Common Share | $ | 0.24 | $ | 0.23 | $ | 0.33 | $ | (0.21 | ) | $ | 0.59 | ||||||||
Diluted Earnings (Loss) Per Common Share | |||||||||||||||||||
Continuing Operations | $ | 0.27 | $ | 0.20 | $ | 0.26 | $ | (0.21 | ) | $ | 0.54 | ||||||||
Discontinued Operations | (0.04 | ) | 0.02 | 0.05 | — | 0.02 | |||||||||||||
Basic Earnings (Loss) Per Common Share | $ | 0.23 | $ | 0.22 | $ | 0.31 | $ | (0.21 | ) | $ | 0.56 | ||||||||
(a) Fourth quarter 2014 includes a decrease in operating income of $16.7 resulting from $2.2 of integration related expenses associated with Convergys' acquisition of Stream, $1.7 of pension settlement charge, $5.6 of depreciation expense resulting from the fair value write-up of property and equipment acquired from Stream, and $7.2 of amortization expense related to acquired intangible assets. Fourth quarter 2014 also includes $4.5 of tax benefit for the difference between the tax previously accrued on foreign earnings and the current estimate as of December 31, 2014.
(b) Fourth quarter 2013 includes a decrease in operating income of $5.2 resulting from $2.7 of transaction expenses associated with Convergys' acquisition of Stream, $1.3 of amortization expense related to acquired intangible assets and $1.2 of net pension and other post employment benefit plan charges. The net pension and other post employment benefit plan charge consists of a $1.5 pension settlement charge and settlement gain of $0.3 related to the Executive Deferred Compensation Plan. Fourth quarter 2013 also includes $46.4 of tax expense to record the deferred tax liability associated with a change in classification for a portion of undistributed earnings of the Company's foreign subsidiaries. See Note 14 of the Notes to Consolidated Financial Statements for further information.
The sum of the quarterly earnings (loss) per common share may not equal the annual amounts reported because per share amounts are computed independently for each quarter and for full year based on respective weighted-average common shares outstanding and other dilutive potential common shares.
Convergys Corporation 2014 Annual Report 76
ITEM 9. CHANGES IN AND DISAGREEMENTS WITH ACCOUNTANTS ON ACCOUNTING AND FINANCIAL DISCLOSURES
No disagreements with accountants on any accounting or financial disclosure or auditing scope or procedure occurred during 2014.
ITEM 9A. CONTROLS AND PROCEDURES
Evaluation of Disclosure Controls and Procedures
The Company’s Chief Executive Officer and Chief Financial Officer evaluated, together with General Counsel, the Chief Accounting Officer and other key members of management, the effectiveness of design and operation of the Company’s “disclosure controls and procedures” (as defined in Rules 13a-15(e) and 15d-15(e) under the Securities Exchange Act of 1934, as amended (the Act)) as of the year ended December 31, 2014 (Evaluation Date). Based on this evaluation, the Company’s Chief Executive Officer and Chief Financial Officer have concluded that the Company’s disclosure controls and procedures were effective as of the Evaluation Date such that the information required to be disclosed by the Company in the reports that it files or submits under the Act is accumulated and communicated to the Company’s management, including its Chief Executive Officer and Chief Financial Officer, as appropriate, to allow timely decisions regarding required disclosure, and are effective to ensure that such information is recorded, processed, summarized and reported within the time periods specified in the Securities and Exchange Commission’s rules and forms.
Changes in Internal Control
There have been no changes in the Company’s internal control over financial reporting that occurred during the fourth quarter ended December 31, 2014 that have materially affected, or are reasonably likely to materially affect, the Company’s internal control over financial reporting.
Convergys Corporation 2014 Annual Report 77
REPORT OF MANAGEMENT
Attestation Report on Internal Control Over Financial Reporting
Management’s Responsibilities for and Audit Committee Oversight of the Financial Reporting Process
The management of Convergys Corporation is responsible for the preparation, integrity and fair presentation of the Consolidated Financial Statements and all related information appearing in this Annual Report. The Consolidated Financial Statements and notes have been prepared in conformity with accounting principles generally accepted in the United States and include certain amounts, which are estimates based upon currently available information, and management’s judgment of current conditions and circumstances.
The Audit Committee, consisting entirely of independent directors, meets regularly with management, the compliance officer, internal auditors and the independent registered public accounting firm, and reviews audit plans and results, as well as management’s actions taken in discharging responsibilities for accounting, financial reporting and internal control. Ernst & Young LLP, independent registered public accounting firm, and the internal auditors have direct and confidential access to the Audit Committee at all times to discuss the results of their examinations.
Management’s Report on Internal Control over Financial Reporting
Convergys’ management is also responsible for establishing and maintaining adequate internal control over financial reporting that is designed to produce reliable Financial Statements in conformity with accounting principles generally accepted in the United States. The system of internal control over financial reporting is evaluated for effectiveness by management and tested for reliability through a program of internal audits. Actions are taken to correct potential deficiencies as they are identified. Any internal control system, no matter how well designed, has inherent limitations, including the possibility that a control can be circumvented or overridden and misstatements due to error or fraud may occur and may not be detected. Also, because of changes in conditions, internal control effectiveness may vary over time. Accordingly, even an effective system of internal control will provide only reasonable assurance with respect to Financial Statement preparation and presentation.
Convergys’ management assessed the effectiveness of the Company’s internal control over financial reporting as of December 31, 2014. In making this assessment, it used the criteria set forth in "Internal Control - Integrated Framework" issued by the Committee of Sponsoring Organizations of the Treadway Commission (2013 framework) (the COSO criteria). Our evaluation of internal control over financial reporting did not include the internal controls of SGS Holdings, Inc. (Stream), which was acquired by Convergys during the first quarter of 2014. Stream represented approximately 34% of total assets as of December 31, 2014, and 29% of revenues for the year then ended. Based on its assessment, management has concluded that, as of December 31, 2014, the Company’s internal control over financial reporting is effective based on the COSO criteria.
Convergys engaged Ernst & Young LLP in 2014 to perform an integrated audit of the Consolidated Financial Statements in accordance with auditing standards of the Public Company Accounting Oversight Board (United States). Their report appears on page 36. Additionally, Ernst & Young LLP has issued an audit report on the Company’s internal control over financial reporting. That report appears on page 79.
/s/ Andrea J. Ayers
Andrea J. Ayers
Chief Executive Officer
/s/ Andre S. Valentine
Andre S. Valentine
Chief Financial Officer
February 18, 2015
Convergys Corporation 2014 Annual Report 78
REPORT OF INDEPENDENT REGISTERED PUBLIC ACCOUNTING FIRM
The Board of Directors and Shareholders of Convergys Corporation
We have audited Convergys Corporation’s internal control over financial reporting as of December 31, 2014, based on criteria established in Internal Control-Integrated Framework issued by the Committee of Sponsoring Organizations of the Treadway Commission (2013 framework) (the COSO criteria). Convergys Corporation’s management is responsible for maintaining effective internal control over financial reporting, and for its assessment of the effectiveness of internal control over financial reporting included in the accompanying “Report of Management.” Our responsibility is to express an opinion on the company’s internal control over financial reporting based on our audit.
We conducted our audit in accordance with the standards of the Public Company Accounting Oversight Board (United States). Those standards require that we plan and perform the audit to obtain reasonable assurance about whether effective internal control over financial reporting was maintained in all material respects. Our audit included obtaining an understanding of internal control over financial reporting, assessing the risk that a material weakness exists, testing and evaluating the design and operating effectiveness of internal control based on the assessed risk, and performing such other procedures as we considered necessary in the circumstances. We believe that our audit provides a reasonable basis for our opinion.
A company’s internal control over financial reporting is a process designed to provide reasonable assurance regarding the reliability of financial reporting and the preparation of financial statements for external purposes in accordance with generally accepted accounting principles. A company’s internal control over financial reporting includes those policies and procedures that (1) pertain to the maintenance of records that, in reasonable detail, accurately and fairly reflect the transactions and dispositions of the assets of the company; (2) provide reasonable assurance that transactions are recorded as necessary to permit preparation of financial statements in accordance with generally accepted accounting principles, and that receipts and expenditures of the company are being made only in accordance with authorizations of management and directors of the company; and (3) provide reasonable assurance regarding prevention or timely detection of unauthorized acquisition, use, or disposition of the company’s assets that could have a material effect on the financial statements.
Because of its inherent limitations, internal control over financial reporting may not prevent or detect misstatements. Also, projections of any evaluation of effectiveness to future periods are subject to the risk that controls may become inadequate because of changes in conditions, or that the degree of compliance with the policies or procedures may deteriorate.
As indicated in the accompanying “Report of Management,” management’s assessment of and conclusion on the effectiveness of internal control over financial reporting did not include the internal controls of SGS Holdings, Inc., which is included in the 2014 consolidated financial statements of Convergys Corporation and constituted 34% of total assets as of December 31, 2014 and 29% of revenues, for the year then ended. Our audit of internal control over financial reporting of Convergys Corporation also did not include an evaluation of the internal control over financial reporting of SGS Holdings, Inc.
In our opinion, Convergys Corporation maintained, in all material respects, effective internal control over financial reporting as of December 31, 2014, based on the COSO criteria.
We also have audited, in accordance with the standards of the Public Company Accounting Oversight Board (United States), the consolidated balance sheets of Convergys Corporation as of December 31, 2014 and 2013, and the related consolidated statements of income, comprehensive income, shareholders’ equity, and cash flows for each of the three years in the period ended December 31, 2014, and our report dated February 18, 2015, expressed an unqualified opinion thereon.
/s/ Ernst & Young LLP
Cincinnati, Ohio
February 18, 2015
Convergys Corporation 2014 Annual Report 79
ITEM 9B. OTHER INFORMATION
On Friday, February 13, 2015, Claudia L. Cline, Executive Vice President and General Counsel, notified the Company of her intent to retire, effective June 30, 2015.
Convergys Corporation 2014 Annual Report 80
PART III
PART III, ITEM 10. THROUGH 14.
ITEM 10. DIRECTORS, EXECUTIVE OFFICERS AND CORPORATE GOVERNANCE
The information required by Item 10 with respect to directors, the Audit Committee of the Board of Directors, Audit Committee financial experts, Financial Code of Ethics and Section 16 compliance is incorporated herein by reference to the Company’s proxy statement relating to its annual meeting of shareholders to be held on April 22, 2015. See "Corporate Governance," "Board of Directors and Committees," "Election of Directors" and "Share Ownership" sections in the Company's proxy statement.
Certain information concerning the executive officers of the Company is contained on page 14 of this Form 10-K.
ITEM 11. EXECUTIVE COMPENSATION
The information required by Item 11 is incorporated herein by reference to the Company’s proxy statement relating to its annual meeting of shareholders to be held on April 22, 2015. See "Compensation and Benefits Committee Report," "Compensation Discussion and Analysis," "Summary Compensation Table," "Grants of Plan-Based Awards," "Outstanding Equity Awards at Fiscal Year End," "Option Exercises and Stock Vested," "Pension Benefits," Non-Qualified Deferred Compensation," "Payments Upon Termination or In Connection With Change of Control," and "Director Compensation" sections of the Company's proxy statement. See also "Compensation and Benefits Committee Interlocks and Insider Participation" under the "Corporate Governance" section in the proxy statement.
ITEM 12. SECURITY OWNERSHIP OF CERTAIN BENEFICIAL OWNERS AND MANAGEMENT AND RELATED STOCKHOLDER MATTERS
The share ownership of certain beneficial owners, directors and officers is incorporated herein by reference to the Company’s proxy statement relating to its annual meeting of shareholders to be held on April 22, 2015. See "Share Ownership" section of the Company's proxy statement.
The remaining information called for by this Item relating to “securities authorized for issuance under equity compensation plans” is incorporated by reference to Note 10 of the Notes to Consolidated Financial Statements.
ITEM 13. CERTAIN RELATIONSHIPS AND RELATED TRANSACTIONS, AND DIRECTOR INDEPENDENCE
Relationships and related transactions section, and director independence is incorporated herein by reference to the Company’s proxy statement relating to its annual meeting of shareholders to be held on April 22, 2015. See "Related Party Transactions" under the "Corporate Governance" section and "Director Independence" under the "Board of Directors and Committees" section of the Company's proxy statement.
ITEM 14. PRINCIPAL ACCOUNTANT FEES AND SERVICES
The information required by Item 14 is incorporated by reference to the Company’s proxy statement relating to its annual meeting of shareholders to be held on April 22, 2015. See "Audit Fees" section of the Company's proxy statement.
Convergys Corporation 2014 Annual Report 81
PART IV, ITEMS 15., 15(a)(1) AND (2)
PART IV
ITEM 15. EXHIBITS, FINANCIAL STATEMENT SCHEDULE
ITEM 15(a)(1) AND (2). LIST OF FINANCIAL STATEMENTS AND FINANCIAL SATEMENT SCHEDULE
The following consolidated financial statements of Convergys are included in Item 8:
Page | |||
(1 | ) | Consolidated Financial Statements: | |
Report of Independent Registered Public Accounting Firm | |||
Consolidated Statements of Income | |||
Consolidated Statements of Comprehensive Income | |||
Consolidated Balance Sheets | |||
Consolidated Statements of Cash Flows | |||
Consolidated Statements of Shareholders’ Equity | |||
Notes to Consolidated Financial Statements | |||
(2 | ) | Financial Statement Schedule: | |
II - Valuation and Qualifying Accounts | |||
Financial statement schedules other than that listed above have been omitted because the required information is not required or applicable.
CONVERGYS CORPORATION
SCHEDULE II — VALUATION AND QUALIFYING ACCOUNTS
(In millions)
Additions | ||||||||||||||||||
Description | Balance at Beginning of Period | Charged to Expense | Acquisition and Other Changes | Deductions | Balance at End of Period | |||||||||||||
Year 2014 | ||||||||||||||||||
Allowance for Doubtful Accounts | $ | 5.3 | $ | 14.5 | $ | 1.2 | $ | (15.2 | ) | [a] | $ | 5.8 | ||||||
Deferred Tax Asset Valuation Allowance | $ | 21.2 | $ | 10.2 | [b] | $ | 10.3 | $ | (2.4 | ) | [c] | $ | 39.3 | |||||
Year 2013 | ||||||||||||||||||
Allowance for Doubtful Accounts | $ | 5.9 | $ | 12.2 | $ | — | $ | (12.8 | ) | [a] | $ | 5.3 | ||||||
Deferred Tax Asset Valuation Allowance | $ | 19.7 | $ | 6.0 | [d] | $ | — | $ | (4.5 | ) | [e] | $ | 21.2 | |||||
Year 2012 | ||||||||||||||||||
Allowance for Doubtful Accounts | $ | 9.3 | $ | 11.9 | $ | — | $ | (15.3 | ) | [a] | $ | 5.9 | ||||||
Deferred Tax Asset Valuation Allowance | $ | 21.3 | $ | 4.2 | [b] | $ | — | $ | (5.8 | ) | [c] | $ | 19.7 | |||||
[a] | Primarily includes amounts written-off as uncollectible. |
[b] | Amounts relate to valuation allowances recorded for state and foreign operating loss carryforwards and capital loss carryforwards. |
[c] | Primarily includes the release of foreign valuation allowances related to the utilization of foreign net operating losses in the current year and adjustments related to state tax credits. |
[d] | Amounts relate to valuation allowances recorded for state operating loss carryforwards and federal operating loss carryforwards. |
[e] | Primarily includes the release of state valuation allowances and adjustment of valuation related to state operating loss carryfowards. |
Convergys Corporation 2014 Annual Report 82
[f] | Primarily includes the release of foreign valuation allowances related to the utilization of foreign net operating losses in the current year and adjustment of valuation related to state tax credits. |
[g] | Primarily includes the release of state valuation allowances related to the utilization of state net operating losses in the current year, adjustment of valuation related to state tax credits and capital loss carryforwards. |
Convergys Corporation 2014 Annual Report 83
(3) EXHIBITS:
Exhibits identified in parenthesis below, on file with the Securities and Exchange Commission (SEC), are incorporated herein by reference as exhibits hereto.
Exhibit Number
2.1 | Agreement and Plan of Merger with SGS Holdings, Inc., dated January 6, 2014. (Incorporated by reference from Exhibit 2.1 to Form 8-K filed on January 7, 2014.) |
3.1 | Amended Articles of Incorporation of the Company. (Incorporated by reference from Exhibit 3.1 to Form 10-Q filed on May 5, 2010.) |
3.2 | Amended and Restated Code of Regulations of Convergys Corporation. (Incorporated by reference from Exhibit 3.1 to Form 8-K filed on May 2, 2011.) |
4.1 | Indenture, dated October 13, 2009, by and between Convergys Corporation and U.S. Bank National Association, as trustee, relating to Convergys Corporation’s 5.75% Junior Subordinated Convertible Debentures due 2029. (Incorporated by reference from Exhibit 4.1 to Form 8-K filed October 13, 2009.) |
4.2 | Form of 5.75% Junior Subordinated Convertible Debenture due 2029. (Incorporated by reference from Exhibit 4.1 to Form 8-K filed October 13, 2009.) |
4.3 | Convergys Corporation Retirement and Savings Plan (PPA Restatement) dated January 28, 2013. (Incorporated by reference from Exhibit 4.6 to Form 10-K filed on February 28, 2014.) |
4.4 | Amendment to Convergys Corporation Retirement and Savings Plan (PPA Restatement) dated July 8, 2014. (Incorporated by reference from Exhibit 4.1 to Form 10-Q filed on November 5, 2014.) |
4.5 | Amendment to Convergys Corporation Retirement and Savings Plan (PPA Restatement) dated December 19, 2014. |
10.1 | Termination of a Material Definitive Agreement, dated May 31, 2012, in connection with the Company's purchase of its leased office facility in Orlando, Florida, and discharge of the related capital lease. (Incorporated by reference from Form 8-K filed on June 1, 2012.) |
10.2 | Stock and Asset Purchase Agreement, dated March 22, 2012, among the Company, NEC Corporation and NetCracker Technology Corporation. (Incorporated by reference from Exhibit 2.1 to Form 8-K, filed on March 27, 2012.) |
10.3 | Convergys Corporation Deferred Compensation and Long-Term Incentive Plan Award Deferral Plan for Non-Employee Directors as amended and restated effective February 24, 2004. (Incorporated by reference from Exhibit 10.24 to Form 10-Q filed on August 9, 2004.) * |
10.4 | Convergys Corporation Deferred Compensation Plan for Non-Employee Directors dated August 26, 2008. (Incorporated by reference from Exhibit 10.2 to Form 10-Q filed on November 5, 2008.) * |
10.5 | Convergys Corporation Amended and Restated Long-Term Incentive Plan, effective January 31, 2013. (Incorporated by reference to Exhibit 10.3 to Form 10-Q filed on April 30, 2013.) |
10.6 | Convergys Corporation Supplemental Executive Retirement Plan amended effective February 20, 2007. (Incorporated by reference from Exhibit 10.1 to Form 10-Q filed on August 7, 2007.) * |
10.7 | Convergys Corporation Supplemental Executive Retirement Plan as amended dated August 26, 2008. (Incorporated by reference from Exhibit 10.3 to Form 10-Q filed on November 5, 2008.) * |
10.8 | Amendment to Convergys Corporation Supplemental Executive Retirement Plan dated December 22, 2011. (Incorporated by reference from Exhibit 10.12 to Form 10-K filed on February 23, 2012.) * |
10.9 | Convergys Corporation Executive Deferred Compensation Plan as amended October 29, 2001. (Incorporated by reference from Exhibit 10.9 to Form 10-K filed on February 28, 2008.) * |
10.10 | Convergys Corporation Executive Deferred Compensation Plan as amended effective February 24, 2004. (Incorporated by reference from Exhibit 10.25 to Form 10-Q filed on August 9, 2004.) * |
10.11 | Convergys Corporation Executive Deferred Compensation Plan as amended dated December 21, 2005. (Incorporated by reference from Exhibit 10.14 to Form 10-K filed on February 27, 2009.) * |
10.12 | Convergys Corporation Executive Deferred Compensation Plan as amended dated October 21, 2008. (Incorporated by reference from Exhibit 10.15 to Form 10-K filed on February 27, 2009.) * |
10.13 | Amendment to Convergys Corporation Executive Deferred Compensation Plan dated April 1, 2011. (Incorporated by reference to Exhibit 10.50 to Form 10-K filed on February 23, 2012.) * |
10.14 | Amendment to Convergys Corporation Executive Deferred Compensation Plan dated December 22, 2011. (Incorporated by reference from Exhibit 10.17 to Form 10-K filed on February 23, 2012.) * |
10.15 | Amendment to Convergys Corporation Executive Deferred Compensation Plan. (Incorporated by reference from Exhibit 10.1 to Form 10-Q filed on November 6, 2013.) |
Convergys Corporation 2014 Annual Report 84
10.16 | Convergys Corporation Canadian Employee Share Plan. (Incorporated by reference from Exhibit 4.2.1 to Form S-8 Registration Statement (File No. 333-86137) filed on December 29, 1999.) * |
10.17 | Convergys Corporation Annual Executive Incentive Plan, as Amended and Restated, Effective on February 2, 2012. (Incorporated by reference from Exhibit 10.2 to Form 10-Q filed on May 8, 2012.) |
10.18 | Convergys Corporation Qualified and Non-Qualified Pension Plan as amended and restated dated January 28, 2008. (Incorporated by reference from Exhibit 10.22 to Form 10-K filed on February 27, 2009.) * |
10.19 | Amendment to Convergys Corporation Qualified and Non-Qualified Pension Plan dated March 31, 2008. (Incorporated by reference from Exhibit 10.23 to Form 10-K filed on February 27, 2009.) * |
10.20 | Amendment to Convergys Corporation Qualified and Non-Qualified Pension Plan dated December 17, 2008. (Incorporated by reference from Exhibit 10.24 to Form 10-K filed on February 27, 2009.) * |
10.21 | Amendment to Convergys Corporation Qualified and Non-Qualified Pension Plan dated June 29, 2011. (Incorporated by reference to Exhibit 10.51 to Form 10-K filed on February 23, 2012.) * |
10.22 | Amendment to Convergys Corporation Pension Plan (PPA Restatement) dated December 19, 2014. |
10.23 | 2012 Form of Executive Officer Severance Agreement. (Incorporated by reference from Exhibit 10.4 to Form 10-Q filed on July 31, 2012.) * |
10.24 | 2012 Convergys Corporation Senior Executive Severance Pay Plan dated December 1, 2014. |
10.25 | 2011 Form of Stock Option Award Agreement for Employees (Incorporated by reference from Exhibit 10.43 to Form 10-K filed on February 25, 2011).* |
10.26 | 2013 - 2014 Form of Time-Based Restricted Stock Unit Award Agreement (Incorporated by reference from Exhibit 10.1 to Form 10-Q filed on April 30, 2013). |
10.27 | 2013 - 2014 Form of Performance-Based Restricted Stock Unit Award Agreement (Incorporated by reference from Exhibit 10.2 to Form 10-Q filed on April 30, 2013). |
10.28 | Trust Agreement, dated as of December 23, 2011, between Convergys Corporate and Fidelity Management Trust Company for the Convergys Corporation Executive Deferred Compensation Plan and Convergys Corporate Deferred Compensation Plan for Non-Employee Directors Trust. (Incorporated by reference from Exhibit 10.42 to Form 10-K file on February 23, 2012.) * |
10.29 | Amended and Restated Letter Agreement, dated October 30, 2012, between the Company and Jeffrey H. Fox. (Incorporated by reference from Exhibit 10.42 to Form 10-K filed on February 21, 2013.) |
10.30 | Transition letter, dated April 26, 2013, between the Company and Jeffrey H. Fox. (Incorporated by reference from Exhibit 10.1 to Form 8-K filed on April 26, 2013.) |
10.31 | Receivables Sales Agreement, dated as of June 30, 2009, between Convergys Corporation, as Originator, and Convergys Funding Inc., as Buyer. (Incorporated by reference from Exhibit 10.1 to Form 10-Q filed on August 4, 2009.) |
10.32 | Receivables Purchase Agreement, dated as of June 30, 2009, among Convergys Funding Inc. as Seller, Convergys Corporation as Services, Wachovia Bank, National Association, Liberty Street Funding LLC, the Bank of Nova Scotia, The Bank of Nova Scotia as Scotiabank Group Agent, and Wachovia Bank, National Association as Administrative Agent. (Incorporated by reference from Exhibit 10.2 to Form 10-Q filed on August 4, 2009.) |
10.33 | Amendment No. 3 to Receivables Purchase Agreement, dated as of June 24, 2011, among Convergys Corporation, as initial Servicer and Performance Guarantor, Convergys Funding Inc., as Seller, Liberty Street Funding LLC, The Bank of Nova Scotia, as Purchaser and Scotiabank Group Agent, and Wells Fargo Bank, N.A., successor by merger to Wachovia Bank, National Association, as Purchaser and Administrative Agent. (Incorporated by reference from Exhibit 10.1 to Form 8-K filed on June 29, 2011.) |
10.34 | Amendment No. 5 to Receivables Purchase Agreement, dated as of January 6, 2014, among Convergys Corporation, as initial Servicer and Performance Guarantor, Convergys Funding Inc., as Seller, Liberty Street Funding LLC, The Bank of Nova Scotia, as a Committed Purchaser and as Scotiabank Group Agent, and Wells Fargo Bank, N.A., individually as a Purchaser and as Administrative Agent. (Incorporated by reference from Exhibit 10.46 to Form 10-K filed on February 28, 2014.) |
10.35 | $650,000,000 Credit Agreement dated as of February 28, 2014 among Convergys Corporation, the Lenders from time to time party hereto, Citibank, N.A., as Administrative Agent, Bank of America, N.A., as Syndication Agent, BNP Paribas, PNC Bank, National Association, The Bank of Nova Scotia, U.S. Bank National Association, and Wells Fargo Securities, LLC, as Senior Managing Agents, and BNP Paribas, PNC Bank, National Association, The Bank of Nova Scotia, U.S. Bank National Association, and Wells Fargo Bank, N.A., as Co-Documentation Agents, and Citigroup Global Markets Inc. and Merrill, Lynch, Pierce, Fenner & Smith Incorporated as Joint Lead Arrangers and Joint Bookrunners. (Incorporated by reference from Exhibit 10.1 to 8-K filed on March 3, 2014.) |
12 | Computation of Ratio of Earnings to Combined Fixed Charges and Preferred Dividends. |
21 | Subsidiaries of Convergys Corporation. |
Convergys Corporation 2014 Annual Report 85
23 | Consent of Ernst & Young LLP, Independent Registered Public accounting for the Company. |
24 | Powers of Attorney. |
31.1 | Rule 13a - 14(a) Certification by Chief Executive Officer. |
31.2 | Rule 13a - 14(a) Certification by Chief Financial Officer. |
32.1 | Certification by Chief Executive Officer of Periodic Financial Reports Pursuant to Section 906 of the Sarbanes-Oxley Act of 2002. |
32.2 | Certification by Chief Financial Officer of Periodic Financial Reports Pursuant to Section 906 of the Sarbanes-Oxley Act of 2002. |
101 | The following financial statements from the Company’s Annual Report on Form 10-K for the year ended December 31, 2013, filed on February 28, 2014, formatted in XBRL (Extensible Business Reporting Language): (i) Consolidated Statements of Income and Comprehensive Income, (ii) Consolidated Balance Sheets, (iii) Consolidated Statements of Cash Flows, (iv) Consolidated Statements of Shareholders' Equity, and (v) the Notes to Consolidated Financial Statements. |
* | Management contract or compensatory plan or arrangement. |
ITEM 15(b) AND (c). EXHIBITS AND FINANCIAL STATEMENT SCHEDULE
The responses to these portions of Item 15 are submitted as a separate section of this report.
Convergys Corporation 2014 Annual Report 86
SIGNATURES
Pursuant to the requirements of Section 13 or 15(d) of the Securities Exchange Act of 1934, the registrant has duly caused this report to be signed on its behalf by the undersigned, thereunto duly authorized.
CONVERGYS CORPORATION | |||
February 18, 2015 | By | /s/ Andre S. Valentine | |
Andre S. Valentine Chief Financial Officer | |||
Pursuant to the requirements of the Securities Exchange Act of 1934, this report has been signed below by the following persons on behalf of the registrant and in the capacities and on the date indicated.
Signature | Title | Date |
/s/ ANDREA J. AYERS | Chief Executive Officer and Director (Principal Executive Officer) | February 18, 2015 |
Andrea J. Ayers | ||
/s/ ANDRE S. VALENTINE | Chief Financial Officer (Principal Financial Officer) | February 18, 2015 |
Andre S. Valentine | ||
/s/ TAYLOR C. GREENWALD | Senior Vice President and Controller (Chief Accounting Officer) | February 18, 2015 |
Taylor C. Greenwald | ||
JOHN F. BARRETT* | Director | |
John F. Barrett | ||
CHERYL K. BEEBE* | Director | |
Cheryl K. Beebe | ||
RICHARD R. DEVENUTI* | Director | |
Richard R. Devenuti | ||
JEFFREY H. FOX* | Chairman | |
Jeffrey H. Fox | ||
JOSEPH E. GIBBS* | Director | |
Joseph E. Gibbs | ||
JOAN E. HERMAN* | Director | |
Joan E. Herman | ||
THOMAS L. MONAHAN III* | Director | |
Thomas L. Monahan III | ||
RONALD L. NELSON* | Director | |
Ronald L. Nelson | ||
RICHARD F. WALLMAN* | Director | |
Richard F. Wallman | ||
*By: /s/ Andre S. Valentine | February 18, 2015 | |
Andre S. Valentine as attorney-in-fact | ||
Convergys Corporation 2014 Annual Report 87