Attached files
| file | filename |
|---|---|
| 8-K - 8-K - VEECO INSTRUMENTS INC | a15-4648_18k.htm |
| EX-99.1 - EX-99.1 - VEECO INSTRUMENTS INC | a15-4648_1ex99d1.htm |
Exhibit 99.2
|
|
Q4 2014 Conference Call February 17, 2015 |

|
|
Safe Harbor To the extent that this presentation discusses expectations or otherwise makes statements about the future, such statements are forward-looking and are subject to a number of risks and uncertainties that could cause actual results to differ materially from the statements made. These items include the risk factors discussed in the Business Description and Management's Discussion and Analysis sections of Veeco's Annual Report on Form 10-K for the year ended December 31, 2013 and subsequent Quarterly Reports on Form 10-Q and current reports on Form 8-K. Veeco does not undertake any obligation to update any forward-looking statements to reflect future events or circumstances after the date of such statements. |
|
|
CEO Introduction John Peeler |
|
|
2014: Solid Execution in a Transition Year Revenue up 18% Bookings up 54% Gross Margin up 3 percentage points Generated $42M in Cash from Operations Achieved EBITDA Profitability Successful Cost Reduction and Site Consolidation Activities Improved Financial Performance |
|
|
2014: Solid Execution in a Transition Year EPIK700™ MOCVD Gained Traction in Multiple Regions Propel™ Launched for new opportunity in GaN Power GENxplor® MBE Captures Research Market Share Secured Sizeable Q4 Orders in Data Storage New Product Wins Acquired PSPNew Trajectory for Revenue & Profit Growth |
|
|
Resetting Business Strategy for ALD Technology Situation: FAST-ALD™ technology for flexible OLED demonstrated Veeco not selected for near-term device requirements Action: Q4 2014 impairment charge Cost reduction planned Next Steps: Continuing to assess flexible OLED market Focusing efforts on semiconductor and other applications |
|
|
Best Veeco Order Rate since 2011 Increase in MOCVD and Data Storage Fourth Quarter 2014 Highlights Orders up >80% sequentially to $196M Cash and Short Term Investments $392M Revenue grows 22% sequentially to $114M Generated ~$50M Cash from Operations |
|
|
CFO Financial Review Sam Maheshwari |

|
|
Q4 2014 GAAP to Non-GAAP Reconciliation Non-GAAP Adjustments In millions, except per share data GAAP Share-based Compensation Acquisition Related Other Non-GAAP Net sales $113.6 $ - $ - $ - $113.6 Gross profit 37.9 0.7 5.2 (a) - 43.7 Gross margin 33.3% 38.5% SG&A 24.5 (2.7) (3.2) (b) - 18.6 R&D 20.4 (1.2) - - 19.2 Amortization 4.2 - (4.2) - - Asset impairment 55.3 - - (55.3) - Other items (2.0) - - 2.3 (c) 0.3 Operating income (loss) (64.6) 4.5 12.6 53.0 5.6 Interest income 0.3 - - - 0.3 Taxes 7.4 - (2.7) (d) (5.4) (e) (0.8) Net income (loss) (56.9) 4.5 9.9 47.6 5.1 Basic EPS ($1.44) $0.13 Diluted EPS ($1.44) $0.13 Basic shares 39.4 39.4 Diluted shares 39.4 40.1 Non-GAAP operating income $5.6 Depreciation 2.7 Adjusted EBITDA $8.3 Non-GAAP Adjustments include: (a) The inventory fair value step-up associated with the PSP acquisition's purchase accounting is removed from cost of sales, (b) One-time PSP acquisition related transaction costs, (c) One-time $3.1M cumulative translation gain related to the liquidation of our Japanese subsidiary offset by $0.9M restructuring expense, (d) tax valuation allowance reversal associated with the PSP acquisition, and (e) $4.9M tax liability reversal related to an incentive tax rate in a foreign subsidiary as well as utilization of the 'with or without' method. Note: Amounts may not calculate precisely due to rounding. |
|
|
P&L Highlights (Non-GAAP) ($M)* Q1 14 Q2 14 Q3 14 Q4 14 Revenue 90.8 95.1 93.3 113.6 Gross Profit 34.3 31.3 33.2 43.7 % 37.8% 32.9% 35.5% 38.5% SG&A 18.6 18.6 18.9 18.6 R&D 18.7 19.9 18.9 19.2 OPEX 37.1 38.3 37.8 38.1 % 40.8% 40.2% 40.5% 33.6% Adjusted EBITDA 0.1 (4.1) (1.8) 8.3 % 0.2% -4.3% -1.9% 7.3% Non-GAAP EPS ($0.06) ($0.16) ($0.02) $0.13 * See financial tables for further details on the Non-GAAP Reconciliation Slides Note: Amounts may not calculate precisely due to rounding Q4 14 Includes PSP Impact |

|
|
Q4 2014 Bookings and Revenue Highlights $M Q4 13 Q1 14 Q2 14 Q3 14 Q4 14 MOCVD 52 83 75 81 142 MBE 11 4 6 9 5 PSP NA NA NA NA 3 ALD 0 0 0 3 0 Data Storage 22 15 23 14 45 Total 85 103 104 107 196 $M Q4 13 Q1 14 Q2 14 Q3 14 Q41 4 MOCVD 50 64 67 71 78 MBE 6 7 10 6 5 PSP NA NA NA NA 8 ALD 0 0 0 0 0 Data Storage 16 20 18 16 23 Total 73 91 95 93 114 Bookings Revenue Note: Amounts may not calculate precisely due to rounding |
|
|
Balance Sheet Highlights ($M) Q4 13 Q1 14 Q2 14 Q3 14 Q4 14 Cash & Short-term Investments 495 483 485 487 392 Accounts Receivable 24 51 58 62 60 Inventory 60 52 48 47 61 Accounts Payable 36 28 28 26 18 $145M in cash used for the SSEC (PSP) acquisition PSP Purchase ($M) Q4 13 Q1 14 Q2 14 Q3 14 Q4 14 DSO 29 50 55 59 48 DOI 92 93 70 77 68 DPO 57 45 39 39 22 |
|
|
Q1 2015 Guidance Q1 2015 Deferred Revenue >$25M (new EPIK700 Systems) GAAP Non-GAAP Revenue $92M - $100M $92M - $100M Gross Margins 33% - 35% 36% - 38% OPEX $52M - $54M $37M - $39M Adjusted EBITDA N/A $0M - $2M EPS ($0.59) - ($0.53) ($0.13) – ($0.07) |
|
|
Business Update & Outlook |

|
|
Backlighting trends remain positive; utilization rates recover after seasonal downtick LED Lighting (unit) Penetration 5% in 2014 Forecasted to be >25% by 2020 >100B LED Chips (units) Shipped in 2014 Forecasted to grow >20% CAGR to nearly 300B by 2019 Overall Market Trends Positive for Multi-Year MOCVD Growth Source: LED Inside |

|
|
EPIK700 MOCVD: Pulling Ahead of the Competition Highest productivity platform with up to 20% improved CoO compared to previous generations Designed for best-in-class uniformity which provides greater wafer yield Fastest to production with easy process transfer Most efficient capital investment for maximum profitability All betas accepted; quick process transfer of recipes – in discussions for multi-unit orders with multiple customers Strategic Wins in 4 Key Geographic Regions |
|
|
GaN Power Represents New MOCVD Growth Vector More than 30 Industry Leaders Investing in GaN Power R&D GaN Power Electronics Potential Customer Landscape |
|
|
Outstanding film uniformity, yield and device performance Long campaign runs for process development flexibility and best-in-class low particle defects Modular design for ease of configuration, operation and maintenanceand best cost of ownership Fast cycles of learning Single Wafer 200MM System to Accelerate Industry Transition from R&D to High Volume Manufacturing Propel Enables Cost Effective, High Yield GaN Power Devices |
|
|
“Soak and Spray” Technology enables Single Wafer Control with Low Cost of Batch Processing Highly Configurable Platform Serves Multiple Applications and Wafer Sizes Extends Compound Semi and MEMS Footprint Stepping Stone to Advanced Packaging Market Significant Overlap in Business Opportunities Working to Accelerate Growth for a Robust, Highly Profitable Business Increased Access to High Growth Markets Complimentary Differentiated Technology Synergistic Combination to Drive Growth & Profitability 1 3 PSP: Great Fit to Support our Growth in 2015, Beyond 2 |
|
|
Cleaning Tool Plasma Etch Equipment Silicon Thickness Measurement Award received by 3DIncites as best 2.5D/3D manufacturing equipment 2014 Highest uniformity and fast etch rates CMP 4 in 1 System Value Proposition – TSV Reveal Veeco’s Position for Advanced Packaging Growth Opportunity Lowest Cost of Ownership for Single Wafer Wet Processing |
|
|
Veeco’s Outlook: A Better 2015 Existing and New Market Opportunities Drive Revenue Growth Continued Bottom Line Improvement Focus on Differentiated Products & Lower Manufacturing Costs LED, Power Electronics & Mobility Targeting Gross Margins >40% Expect EBITDA Profitability Every Quarter of 2015 |

|
|
Q&A |

|
|
Reconciliation Tables |
|
|
Note On Reconciliation Tables These tables include financial measures adjusted for the impact of certain items; these financial measures are therefore not calculated in accordance with U.S. generally accepted accounting principles (“GAAP”). These Non-GAAP financial measures consider exclusion of: share-based compensation expense; one-time charges relating to restructuring initiatives, non-cash asset impairments, certain other non-operating gains and losses, and acquisition-related items such as one-time transaction costs, non-cash amortization of acquired intangible assets, and the stepped-up cost of sales associated with the purchase accounting of acquired inventory. These non-GAAP financial measures may be different from non-GAAP financial measures used by other companies. Non-GAAP financial measures should not be considered as a substitute for, or superior to, measures of financial performance prepared in accordance with GAAP. By excluding these items, non-GAAP financial measures are intended to facilitate meaningful comparisons to historical operating results, competitors' operating results, and estimates made by securities analysts. Management is evaluated on key performance metrics including adjusted EBITDA, which is used to determine management incentive compensation as well as to forecast future periods. These non-GAAP financial measures may be useful to investors in allowing for greater transparency of supplemental information used by management in its financial and operational decision-making. In addition, similar non-GAAP financial measures have historically been reported to investors; the inclusion of comparable numbers provides consistency in financial reporting. Investors are encouraged to review the reconciliation of the non-GAAP financial measures used in the Company’s news release to their most directly comparable GAAP financial measures. |
|
|
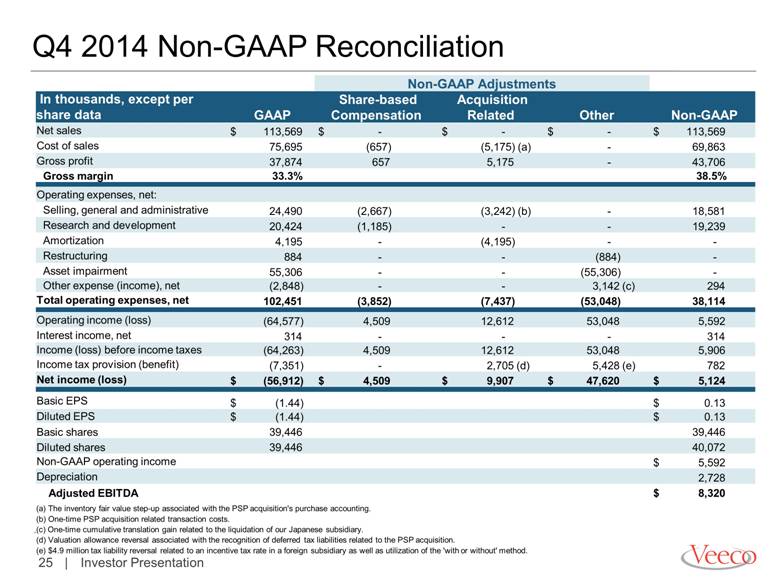
Q4 2014 Non-GAAP Reconciliation Non-GAAP Adjustments In thousands, except per share data GAAP Share-based Compensation Acquisition Related Other Non-GAAP Net sales $ 113,569 $ - $ - $ - $ 113,569 Cost of sales 75,695 (657) (5,175) (a) - 69,863 Gross profit 37,874 657 5,175 - 43,706 Gross margin 33.3% 38.5% Operating expenses, net: Selling, general and administrative 24,490 (2,667) (3,242) (b) - 18,581 Research and development 20,424 (1,185) - - 19,239 Amortization 4,195 - (4,195) - - Restructuring 884 - - (884) - Asset impairment 55,306 - - (55,306) - Other expense (income), net (2,848) - - 3,142 (c) 294 Total operating expenses, net 102,451 (3,852) (7,437) (53,048) 38,114 Operating income (loss) (64,577) 4,509 12,612 53,048 5,592 Interest income, net 314 - - - 314 Income (loss) before income taxes (64,263) 4,509 12,612 53,048 5,906 Income tax provision (benefit) (7,351) - 2,705 (d) 5,428 (e) 782 Net income (loss) $ (56,912) $ 4,509 $ 9,907 $ 47,620 $ 5,124 Basic EPS $ (1.44) $ 0.13 Diluted EPS $ (1.44) $ 0.13 Basic shares 39,446 39,446 Diluted shares 39,446 40,072 Non-GAAP operating income $ 5,592 Depreciation 2,728 Adjusted EBITDA $ 8,320 (a) The inventory fair value step-up associated with the PSP acquisition's purchase accounting. (b) One-time PSP acquisition related transaction costs. (c) One-time cumulative translation gain related to the liquidation of our Japanese subsidiary. (d) Valuation allowance reversal associated with the recognition of deferred tax liabilities related to the PSP acquisition. (e) $4.9 million tax liability reversal related to an incentive tax rate in a foreign subsidiary as well as utilization of the 'with or without' method. |
|
|
Q3 2014 Non-GAAP Reconciliation Non-GAAP Adjustments In thousands, except per share data GAAP Equity-based Compensation Other Non-GAAP Net sales $ 93,341 $ - $ - $ 93,341 Cost of sales 60,783 (619) - 60,164 Gross profit 32,558 619 - 33,177 Gross margin 34.9% 35.5% Operating expenses: Selling, general and administrative 21,712 (2,766) - 18,946 Research and development 19,968 (1,105) - 18,863 Amortization 3,149 - (3,149) - Restructuring 2,317 - (2,317) - Asset impairment 2,864 - (2,864) - Other expense (income), net 36 - - 36 Total operating expenses, net 50,046 (3,871) (8,330) 37,845 Operating income (loss) (17,488) 4,490 8,330 (4,668) Interest income (expense), net 305 - - 305 Income (loss) before income taxes (17,183) 4,490 8,330 (4,363) Income tax provision (benefit) (3,206) (140) (261) (3,607)* Net income (loss) $ (13,977) $ 4,630 $ 8,591 $ (756) Basic EPS $ (0.35) $ (0.02) Diluted EPS $ (0.35) $ (0.02) Basic shares 39,401 39,401 Diluted shares 39,401 39,401 Adjusted operating income $ (4,668) Depreciation 2,900 Adjusted EBITDA $ (1,768) *The 'with or without method' is utilized to determine the income tax effect of the non-GAAP adjustments. |
|
|
Q2 2014 Non-GAAP Reconciliation Non-GAAP Adjustments In thousands, except per share data GAAP Equity-based Compensation Other Non-GAAP Net sales $ 95,122 $ - $ - $ 95,122 Cost of sales 64,449 (620) - 63,829 Gross profit 30,673 620 - 31,293 Gross margin 32.2% 32.9% Operating expenses: Selling, general and administrative 21,891 (3,325) - 18,566 Research and development 21,011 (1,147) - 19,864 Amortization 2,899 - (2,899) - Restructuring 801 - (801) - Other expense (income), net (158) - - (158) Total operating expenses, net 46,444 (4,471) (3,700) 38,273 Operating income (loss) (15,771) 5,091 3,700 (6,980) Interest income (expense), net 72 - - 72 Income (loss) before income taxes (15,699) 5,091 3,700 (6,908) Income tax provision (benefit) (488) - (312) (800)* Net income (loss) $ (15,211) $ 5,091 $ 4,012 $ (6,108) Basic EPS $ (0.39) $ (0.16) Diluted EPS $ (0.39) $ (0.16) Basic shares 39,379 39,379 Diluted shares 39,379 39,379 Adjusted operating income $ (6,980) Depreciation 2,930 Adjusted EBITDA $ (4,050) *The 'with or without method' is utilized to determine the income tax effect of the non-GAAP adjustments. |
|
|
*The 'with or without method' is utilized to determine the income tax effect of the non-GAAP adjustments. Q1 2014 Non-GAAP Reconciliation Non-GAAP Adjustments In thousands, except per share data GAAP Equity-based Compensation Other Non-GAAP Net sales $ 90,841 $ - $ - $ 90,841 Cost of sales 57,064 (560) - 56,504 Gross profit 33,777 560 - 34,337 Gross margin 37.2% 37.8% Operating expenses: Selling, general and administrative 21,667 (3,101) - 18,566 Research and development 19,768 (1,062) - 18,707 Amortization 2,903 - (2,903) - Restructuring 392 - (392) - Changes in contingent consideration (29,368) - 29,368 - Other expense (income), net (212) - - (212) Total operating expenses, net 15,150 (4,162) 26,073 37,061 Operating income (loss) 18,627 4,722 (26,073) (2,724) Interest income (expense), net 164 - - 164 Income (loss) before income taxes 18,791 4,722 (26,073) (2,560) Income tax provision (benefit) (369) - 192 (177)* Net income (loss) $ 19,160 $ 4,722 $ (26,265) $ (2,383) Basic EPS $ 0.49 $ (0.06) Diluted EPS $ 0.48 $ (0.06) Basic shares 39,177 39,177 Diluted shares 39,937 39,177 Adjusted operating income $ (2,724) Depreciation 2,868 Adjusted EBITDA $ 144 |

|
|
Q1 2015 Guidance Non-GAAP Reconciliation Non-GAAP Adjustments In millions, except per share data GAAP Share-based Compensation Acquisition Related Other Non-GAAP Net Sales $ 92 - 100 $ - $ - $ - $ 92 - 100 Gross profit 31.0 - 35.5 0.7 1.8 (a) - 33.5 - 38.0 Gross margin 33% - 35% 36% - 38% Operating expenses, net 52.4 - 54.4 (4.5) (8.4) (b) (3.0) (c) 36.5 - 38.5 Operating income (loss) (21.4) - (18.9) (3.0) - (0.5) Depreciation 3.0 - 3.0 Adjusted EBITDA $ 0.0 - $2.5 Net income (loss) (23.6 ) - (21.0) 5.2 10.2 3.0 (5.2) - (2.6) Income (loss) per diluted common share: $(0.59) - $(0.53) $ (0.13) - (0.07) Weighted average number of diluted shares: 39.7 39.7 Note: Amounts may not calculate precisely due to rounding. (a) The inventory fair value step-up associated with the PSP acquisition's purchase accounting. (b) Acquisition related amortization expense. (c) Restructuring charges. |
