Attached files
| file | filename |
|---|---|
| EX-23.1 - CONSENT OF PRICEWATERHOUSECOOPERS LLP - MPM Holdings Inc. | d829674dex231.htm |
| EX-10.47 - SECOND AMENDED AND RESTATED SHARED SERVICES AGREEMENT - MPM Holdings Inc. | d829674dex1047.htm |
Table of Contents
As filed with the Securities and Exchange Commission on February 13, 2015
Registration No. 333-201338
UNITED STATES
SECURITIES AND EXCHANGE COMMISSION
Washington, D.C. 20549
AMENDMENT NO. 1
TO
FORM S-1
REGISTRATION STATEMENT
UNDER
THE SECURITIES ACT OF 1933
MPM HOLDINGS INC.
(Exact name of registrant as specified in its charter)
| Delaware | 2860 | 47-1756080 | ||
| (State or other jurisdiction of Incorporation or organization) |
(Primary Standard Industrial Classification Code Number) |
(I.R.S. Employer Identification No.) |
260 Hudson River Road
Waterford, NY 12188
(518) 237-3330
(Address, including zip code, and telephone number, including area code, of Registrant’s Principal Executive Offices)
Stephen J. Psutka, Esq.
MPM Holdings Inc.
260 Hudson River Road
Waterford, NY 12188
(518) 237-3330
(Name, address, including zip code, and telephone number, including area code, of agent for service)
With a copy to:
David S. Huntington, Esq.
Paul, Weiss, Rifkind, Wharton & Garrison LLP
1285 Avenue of the Americas
New York, New York 10019-6064
(212) 373-3000
Approximate date of commencement of proposed sale to public: As soon as practicable after this Registration Statement becomes effective.
If any of the securities being registered on this Form are to be offered on a delayed or continuous basis pursuant to Rule 415 under the Securities Act of 1933, check the following box. x
If this Form is filed to register additional securities for an offering pursuant to Rule 462(b) under the Securities Act, please check the following box and list the Securities Act registration statement number of the earlier effective registration statement for the same offering. ¨
If this Form is a post-effective amendment filed pursuant to Rule 462(c) under the Securities Act, check the following box and list the Securities Act registration number of the earlier effective registration statement for the same offering. ¨
If this Form is a post-effective amendment filed pursuant to Rule 462(d) under the Securities Act, check the following box and list the Securities Act registration statement number of the earlier effective registration statement for the same offering. ¨
Indicate by check mark whether the registrant is a large accelerated filer, an accelerated filer, a non-accelerated filer, or a smaller reporting company. See the definitions of “large accelerated filer,” “accelerated filer” and “smaller reporting company” in Rule 12b-2 of the Exchange Act.
| Large accelerated filer | ¨ | Accelerated filer | ¨ | |||
| Non-accelerated filer | x (Do not check if a smaller reporting company) | Smaller reporting company | ¨ | |||
CALCULATION OF REGISTRATION FEE
|
| ||||||||
| Title of each Class of Securities to be Registered |
Amount to be Registered(1) |
Proposed Maximum Offering Price Per Share(2) |
Proposed Maximum Aggregate Offering Price(1)(2) |
Amount of Registration Fee(2) | ||||
| Common stock, par value $0.01 per share |
39,305,466 shares | $20.33 | $799,080,124 | $92,854(3) | ||||
|
| ||||||||
|
| ||||||||
| (1) | The shares will be offered for resale by selling stockholders pursuant to the shelf prospectus contained herein. |
| (2) | Estimated solely for purposes of calculating the registration fee pursuant to Rule 457(o) under the Securities Act of 1933, as amended (the “Securities Act”). Our common stock is not traded on any national exchange and in accordance with Rule 457, the offering price per share is by the price set for shares in the Joint Chapter 11 Plan of Reorganization for Momentive Performance Materials Inc. and its Affiliated Debtors as approved by the United States Bankruptcy Court, Southern District of New York. |
| (3) | Previously paid. |
The registrant hereby amends this Registration Statement on such date or dates as may be necessary to delay its effective date until the registrant shall file a further amendment which specifically states that this Registration Statement shall thereafter become effective in accordance with Section 8(a) of the Securities Act or until the Registration Statement shall become effective on such date as the Commission, acting pursuant to said Section 8(a), may determine.
Table of Contents
The information in this preliminary prospectus is not complete and may be changed. The selling stockholders may not sell these securities until the registration statement filed with the Securities and Exchange Commission is effective. This preliminary prospectus is not an offer to sell these securities and it is not soliciting an offer to buy these securities in any jurisdiction where the offer or sale is not permitted.
Subject to Completion
Preliminary Prospectus dated February 13, 2015
PROSPECTUS
39,305,466 Shares

MPM Holdings Inc.
Common Stock
This prospectus relates to the offer and resale of up to an aggregate of 39,305,466 shares of common stock of MPM Holdings Inc. by the selling stockholders identified in this prospectus. We are not selling any shares under this prospectus. We will not receive any proceeds from the sale of shares being offered by the selling stockholders.
The selling stockholders may offer shares of our common stock from time to time, if and to the extent as they may determine, through public or private transactions or through other means described under “Plan of Distribution” at prevailing market prices, at prices different than prevailing market prices or at privately negotiated prices. The selling stockholders may sell shares through agents they select or through underwriters and dealers they select. The selling stockholders also may sell shares directly to investors. If the selling stockholders use agents, underwriters or dealers to sell the shares, we will name such agents, underwriters or dealers and describe any applicable commissions or discounts in a supplement to this prospectus if required.
Our common stock is not listed on any national securities exchange and no public market currently exists for our common stock.
Investing in our common stock involves risks. See “Risk Factors” beginning on page 12 of this prospectus for a discussion of certain risks that you should consider before buying shares of our common stock.
Neither the Securities and Exchange Commission nor any state securities commission has approved or disapproved of these securities or determined if this prospectus is truthful or complete. Any representation to the contrary is a criminal offense.
Prospectus dated , 2015.
Table of Contents
You should rely only on the information contained in this prospectus or to which we have referred you. We have not authorized any other person to provide you with different information. If anyone provides you with different or inconsistent information, you should not rely on it. We are not making an offer to sell these securities in any jurisdiction where the offer or sale is not permitted. You should assume that the information appearing in this prospectus is accurate only as of the date on the front cover of this prospectus. Our business, financial condition, results of operations and prospects may have changed since that date.
For investors outside the United States: We have not done anything that would permit this offering or possession or distribution of this prospectus in any jurisdiction where action for that purpose is required, other than in the United States. You are required to inform yourselves about and to observe any restrictions relating to this offering and the distribution of this prospectus outside of the United States.
i
Table of Contents
PRESENTATION OF FINANCIAL INFORMATION
Prior to October 24, 2014, the date we emerged from bankruptcy (the “Emergence Date”), MPM Holdings Inc. (“MPM Holdings”) had not conducted any business operations. Accordingly, unless otherwise noted or suggested by context, all financial information and data and accompanying financial statements and corresponding notes, as of and prior to the Emergence Date, as contained in this prospectus, reflect the actual historical consolidated results of operations and financial condition of Momentive Performance Materials Inc. (“MPM”) for the periods presented and do not give effect to the Plan of Reorganization (as defined below) or any of the transactions contemplated thereby or the adoption of “fresh-start” accounting. Thus, such financial information may not be representative of our performance or financial condition after the Emergence Date. Except with respect to such historical financial information and data and accompanying financial statements and corresponding notes or as otherwise noted or suggested by the context, all other information contained in this prospectus relates to MPM Holdings and its subsidiaries following the Emergence Date. When we use the terms “MPM Holdings,” “we,” the “Company,” “us,” “our” or similar words in this prospectus, unless the context otherwise requires, we are referring to MPM Holdings Inc. and its subsidiaries following emergence from the Bankruptcy Cases (as defined below).
MARKET AND INDUSTRY DATA AND FORECASTS
This prospectus includes estimates of market share and industry data and forecasts that we obtained from industry publications and surveys and/or internal company sources. Industry publications and surveys and forecasts generally state that the information contained therein has been obtained from sources believed to be reliable, but there can be no assurance as to the accuracy or completeness of included information. We have not independently verified any of the data from third-party sources, nor have we ascertained the underlying economic assumptions relied upon therein. Similarly, while we believe our internal estimates with respect to our industry are reliable, our estimates have not been verified by any independent sources. While we are not aware of any misstatements regarding any industry data presented in this prospectus, our estimates, in particular as they relate to market share and our general expectations, involve risks and uncertainties and are subject to change based on various factors, including those discussed under the section entitled “Risk Factors.” Unless otherwise noted, all information regarding our market share is based on the latest market data currently available to us, and all market share data is based on net sales in the applicable market.
We have proprietary rights to or are exclusively licensed to use a number of registered and unregistered trademarks that we believe are important to our business, including, without limitation, Momentive. We attempt to obtain registration of our key trademarks whenever possible or practicable and pursue any infringement of those trademarks. Solely for convenience, the trademarks, service marks and tradenames referred to in this prospectus are without the “®” and “TM” symbols, but such references are not intended to indicate, in any way, that we will not assert, to the fullest extent under applicable law, our rights or the rights of the applicable licensors to these trademarks, service marks and tradenames.
ii
Table of Contents
This summary highlights the more detailed information contained elsewhere in this prospectus. This summary may not contain all the information that may be important to you. You should carefully read the entire prospectus before making an investment decision, especially the information presented under the heading “Risk Factors.” In this prospectus, except as otherwise indicated herein, or as the context may otherwise require, all references to “MPM Holdings,” the “Company,” “we,” “us” and “our” refer to MPM Holdings Inc. and its subsidiaries and “MPM” refers to Momentive Performance Materials Inc.
Our Company
We believe we are one of the world’s largest producers of silicones and silicone derivatives and a global leader in the development and manufacture of products derived from quartz and specialty ceramics. Silicones are a multi-functional family of materials used in a wide variety of products, and serve as a critical ingredient in many construction, transportation, healthcare, personal care, electronic, consumer and agricultural uses. Silicones are generally used as an additive to a wide variety of end products in order to provide or enhance certain of their attributes, such as resistance (heat, ultraviolet light and chemical), lubrication, adhesion or viscosity. Some of the most well-known end-use product applications include bath and shower caulk, pressure-sensitive adhesive labels, foam products, cosmetics and tires. Due to the versatility and high-performance characteristics of silicones, they are increasingly being used as a substitute for other materials. Our Quartz division manufactures quartz, specialty ceramics and crystal products for use in a number of high-technology industries, which typically require products made to precise specifications. The cost of our products typically represents a small percentage of the overall cost of our customers’ products.
We believe that our scale and global reach provide significant efficiencies in our fixed and variable cost structure and that our breadth of related products provides significant operational, technological and commercial advantages. Our manufacturing capacity at our internal sites and our joint venture in China is sufficient to produce the substantial majority of one of our key intermediates, siloxane, which facilitates a low-cost operating structure and security of supply.
We are one of two producers in the silicones market with global siloxane production capacity. We currently have 22 production sites strategically located around the world, which allows us to produce the substantial majority of our key products locally in the Americas, Europe and Asia. Through this worldwide network of production facilities, we serve more than 4,500 customers between our Silicones and Quartz businesses in over 100 countries. Our customers include leading companies in their respective industries, such as Procter & Gamble, Avery, Continental Tire, Saint Gobain, Unilever, BASF, The Home Depot and Lowe’s.
We believe we have created a value-added, technical service-oriented business model that enables us to target and participate in high-margin and high-growth specialty markets. These specialty markets account for the majority of our revenues and continue to be a growing part of our business.
Revenue and Segment EBITDA, as defined elsewhere within this Prospectus Summary, for the nine months ended September 30, 2014 were $1,873 million and $177 million, respectively, and for the year ended December 31, 2013 were $2,398 million and $238 million, respectively. Net loss attributable to Momentive Performance Materials Inc. for the nine months ended September 30, 2014 was $361 million and for the year ended December 31, 2013 was $464 million. See “Management’s Discussion and Analysis of Financial Condition and Results of Operations—Reconciliation of Segment EBITDA to Net Loss” for a reconciliation of Segment EBITDA to net loss attributable to Momentive Performance Materials Inc.
1
Table of Contents
Our Strengths
Our company has the following competitive strengths:
Leading Global Silicones Producer. We believe we are one of the world’s largest producers of silicones and silicone derivatives, with leading positions in various product lines and geographic areas. We believe our scale, global reach and breadth of product offerings provide us with significant advantages over many of our competitors by allowing us to serve global customers with precise specifications, particularly those expanding production in developing nations.
Attractive Industry Growth Profile. The broad molecular characteristics of silicones continually lead to new uses and applications, which have led to worldwide industry growth in excess of GDP over the past 20 years. Drivers of growth include end-market growth and increased market penetration, with silicones increasingly being used as a value-added substitute for traditional materials or as a functional additive, which yields new properties for our customers’ products. For instance, silicones act as the conditioning ingredient in “2-in-1” shampoo.
Broad-Based Diversification.
Industry Diversification. Our Silicones business has a diversified revenue base across a variety of end-markets, reducing our vulnerability to industry trends. Furthermore, our products are often used in niche applications that represent a small portion of our customers’ material costs. Our leading end-markets are building and construction, which consists of industrial and infrastructure construction and repair, urethane foam additives, and a number of other specialty products.
Customer Diversification. We have a diverse customer base of more than 4,500 customers between our Silicones and Quartz businesses and are well balanced across multiple geographies. In 2013, our top 20 customers accounted for less than 22% of our total revenues, and no single customer accounted for more than 3% of our net sales. We have maintained long-standing relationships with many of our customers.
Geographic Diversification. We have a global sales presence, with approximately 39%, 28% and 33% of our 2013 revenues generated in the Americas, Europe and Asia, respectively.
Global Infrastructure. We are a global company with significant manufacturing capacity in each of the Americas, Europe and Asia. We have 22 production facilities located around the world, R&D centers on three continents and sales to customers in over 100 countries. The Silicones business has three siloxane production facilities located in Waterford, New York, Ohta, Japan and Leverkusen, Germany, as well as a siloxane manufacturing joint venture in Jiande, China, and two silanes production facilities in Sistersville, West Virginia and Termoli, Italy. The Quartz production sites are located in Ohio, Geesthacht, Germany, Kozuki, Japan and Wuxi, China.
We use our global platform to deliver products to companies efficiently on a worldwide basis. Many of our customers are expanding internationally to serve developing areas in Asia, Eastern Europe, Latin America, India and Russia. Maintaining close proximity to our international customers allows us to serve them more quickly and efficiently and thus build strong relationships.
Attractive Intermediate Position. We produce siloxane, the key intermediate required to manufacture silicones, in the United States, Germany and Japan, and source siloxane from a joint venture in China. This manufacturing capacity is sufficient to meet the substantial majority of our current requirements for siloxane. We also source a portion of our requirements through long-term and/or supply agreements. We believe this combination of siloxane supply, along with our ability to purchase siloxane from other suppliers when pricing is advantageous, reduces our overall cost structure and strengthens our overall competitiveness.
2
Table of Contents
Leading Fused Quartz and Specialty Ceramics Producer. We believe we are a global leader in the fused quartz and ceramics product markets in which we compete. In particular, we believe we are the largest manufacturer of quartz products for the semiconductor end-market and the second largest manufacturer of quartz products for fiber optics. Our leadership position and profitability are driven by several factors, including strong customer relationships and the precise quality and purity specifications of our products. Additionally, we believe we are a leader in several ceramic materials end-markets, including cosmetic additives.
Conservative Capital Structure with Stable Free Cash Flow Profile. With a long-dated debt maturity profile and no significant debt maturities due until 2021, we believe we have a conservative capital structure. We also have a modest fixed annual interest expense, as adjusted for the impact of restructuring our capital structure. We believe our stable free cash flow profile will support our long-term growth programs.
Strategy
We believe that we have opportunities for growth through the following long-term strategies:
Expand Our Global Reach in Faster Growing Regions. We intend to continue to grow internationally by expanding our sales presence around the world. Specifically, we are focused on growing our business in the high growth regions of Asia-Pacific, Eastern Europe, Latin America, India and the Middle East, where the usage of our products is increasing. For example, we recently commissioned new liquid silicone rubber and release coating production capabilities at our Rayong, Thailand site to serve the growing Asian Pacific market.
Develop and Market New Products. We will continue our efforts to expand our product offerings through research and development initiatives and research partnership formations with third parties. Through these innovation initiatives we expect to create new generations of products and services which will drive revenue and earnings growth over the long term. In 2013, 2012 and 2011, we invested $70 million, $69 million and $78 million, respectively, in research and development. In 2013, approximately 14% of our sales came from new products developed over the last five years as a result of our targeted new product development efforts. We also recently expanded our technology center in Seoul, Korea, and opened a new research and development facility in Bangalore, India, which further complements our network of key innovation centers strategically located near our global customers.
Increase Shift to High-Margin Specialty Products. We continue to proactively manage our product portfolio with a focus on specialty, high-margin applications. As a result of this capital allocation strategy and anticipated end market growth underlying these specialty segments, we believe high-margin specialty materials will continue to be a larger part of our broader portfolio. For instance, we are investing in our NXT* Silane manufacturing network through the expansion of our Termoli, Italy, site. NXT is an innovative product used in the production of tires, and can offer tire manufacturers the ability to reduce rolling resistance without loss of wet traction, as well as deliver benefits in the tire manufacturing process.
Continue Portfolio Optimization and Pursue Targeted Add-On Acquisitions and Joint Ventures. As a large manufacturer of performance materials with leadership in the production of silicone, silicone derivatives, quartz and specialty ceramics, we have an advantage in pursuing add-on acquisitions and joint ventures in areas that allow us to build upon our core strengths, expand our product, technology and geographic portfolio, and better serve our customers. We believe we may have the opportunity to consummate acquisitions at relatively attractive valuations due to the scalability of our existing global operations and deal-related synergies. In addition, we have and will continue to monitor the strategic landscape for opportunistic divestments consistent with our broader specialty strategy.
Implement Strategic Cost Reduction Initiatives. In July 2012, we approved certain restructuring actions in connection with the realignment of our businesses globally. As of September 31, 2014, we had realized
3
Table of Contents
approximately $34 million in cost savings as a result of these restructuring initiatives, and have approximately $2 million of in-process cost savings in connection with these initiatives that we expect to achieve over the next 9 to 12 months. We also continue to evaluate other actions that could lead to further savings.
Leverage Cost Savings from the Shared Services Agreement. The Shared Services Agreement with Hexion Inc. (formerly known as Momentive Specialty Chemicals Inc., “Hexion”) has resulted in significant synergies for us, including shared services and logistics optimization, best-of-source contractual terms, procurement savings, regional site rationalization and administrative and overhead savings. As of September 30, 2014, we have realized cumulative cost savings of $65 million as a result of the Shared Services Agreement. The Shared Services Agreement remains in place between us and Hexion following completion of our balance sheet restructuring, and both companies will continue to benefit from the optimized cost structure and services that it provides.
Risks Associated with our Business
Investing in our common stock involves a number of risks, including:
| • | Our substantial debt could adversely affect our operations and prevent us from satisfying our obligations under our debt obligations, and may have an adverse effect on our stock price. As of September 30, 2014, after giving pro forma effect to the Emergence, we would have had $1,203 million of consolidated outstanding indebtedness, and, based on our consolidated indebtedness after giving pro forma effect to the Emergence (as defined below), our annualized cash interest expense would be projected to be approximately $60 million based on interest rates at September 30, 2014; |
| • | The Chapter 11 proceedings may have disrupted our business and may have materially and adversely affected our operations; |
| • | If global economic conditions weaken again, it will negatively impact our business, results of operations and financial condition; |
| • | We may be unable to achieve the cost savings or synergies that we expect to achieve from our strategic initiatives, which would adversely affect our profitability and financial condition; |
| • | Fluctuations in direct or indirect raw material costs could have an adverse impact on our business; and |
| • | We depend on certain of our key executives and our ability to attract and retain qualified employees. |
For a discussion of the significant risks associated with our business, our industry and investing in our common stock, you should read the section entitled “Risk Factors.”
Emergence from Chapter 11 Proceedings
MPM Holdings was formed to serve as the parent holding company for certain subsidiaries of Momentive Performance Materials Holdings Inc. (“Old MPM Holdings”) after completion of proceedings under Chapter 11 of Title 11 of the United States Bankruptcy Code. Old MPM Holdings and certain of its domestics subsidiaries were debtors (the “Debtors”) in jointly administered bankruptcy cases in the United States Bankruptcy Court in the Southern District of New York (the “Court”) (the “Bankruptcy Cases”). Other subsidiaries of Old MPM Holdings were not involved in the Bankruptcy Cases. On September 11, 2014, the Bankruptcy Court confirmed our Joint Chapter 11 Plan of Reorganization for Momentive Performance Materials Inc. and its Affiliated Debtors (the “Plan of Reorganization”) and the Debtors emerged from bankruptcy on October 24, 2014 (the “Emergence Date”).
4
Table of Contents
On the Emergence Date, the Plan of Reorganization became effective and the Debtors emerged from the Chapter 11 proceedings (the “Emergence”). On or following the Emergence Date, and pursuant to the terms of the Plan of Reorganization, the following occurred:
| • | payment in full in cash to general unsecured creditors (including trade creditors) and holders of claims arising from the $75 million senior secured revolving credit facility (the “Cash Flow Facility”) and the $300 million senior secured debtor-in-possession term loan facility (the “DIP Term Loan Facility”); |
| • | conversion of our then-existing asset-based revolving facility into an exit $270 million asset-based revolving facility (the “ABL Facility”); |
| • | issuance of new 3.88% First-Priority Senior Secured Notes due 2021 (the “First Lien Notes”) and new 4.69% Second-Priority Senior Secured Notes due 2022 (the “Second Lien Notes”) to holders of MPM’s 8.875% First-Priority Senior Secured Notes due 2020 (the “Old First Lien Notes”) and 10% Senior Secured Notes due 2020 (the “Old Secured Notes”), respectively, and the cancellation of the Old First Lien Notes and the Old Secured Notes; |
| • | conversion of MPM’s 9.00% Second-Priority Springing Lien Notes due 2021 and 9.50% Second-Priority Springing Lien Notes due 2021 (collectively, “Old Second Lien Notes”) into the new equity of post-Emergence Date MPM (resulting in the issuance of 11,791,126 shares of MPM common stock), subject to dilution by the management incentive plan and common stock issued in the rights offerings; |
| • | issuance of 36,197,874 shares of post-Emergence Date MPM common stock (including shares issued in connection with the backstop commitment of the rights offerings (the “Backstop Commitment”)) resulting from the exercise of subscription rights issued to holders of the Old Second Lien Notes in $600 million rights offerings and the “commitment premium” paid in shares to the backstop parties in respect of their backstop commitment; |
| • | exchange of all shares of post-Emergence Date MPM common stock for common stock of MPM Holdings and the contribution by MPM Holdings of all shares of the post-Emergence Date MPM common stock to its wholly-owned subsidiary, MPM Intermediate Holdings Inc., a result of which MPM became a wholly owned subsidiary of MPM Intermediate Holdings Inc.; |
| • | cancellation of the equity of pre-Emergence Date MPM; |
| • | cancellation of MPM’s 11.5% Senior Subordinated Notes due 2016 (the “Subordinated Notes”); |
| • | a recovery to the holders of Old MPM Holdings’ 11% Senior Discount Note due June 4, 2017 (“PIK Notes”) of $9 million, which represents the amount of the cash available at Old MPM Holdings as of the Emergence Date, after taking into account administrative expenses; and |
| • | appointment of a new chief executive officer, chief financial officer and general counsel. |
5
Table of Contents
Organizational Structure
The chart below is a summary of the organizational structure of the Company and illustrates the long-term debt outstanding as of the date of this prospectus.
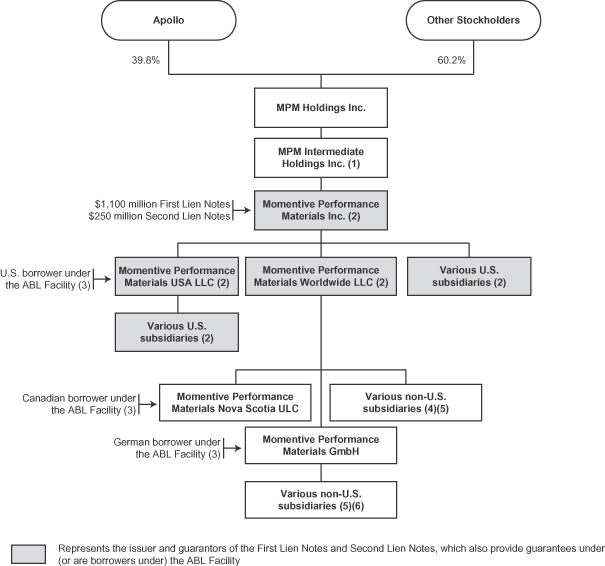
| (1) | Guarantor under the ABL Facility. |
| (2) | MPM and the guarantors also provide guarantees under (or are borrowers under) the ABL Facility. As of and for the nine-month period ended September 30, 2014, MPM (excluding its subsidiaries) and the guarantors collectively represented 33% of our total assets and 32% of our net sales, after intercompany eliminations. |
| (3) | Total estimated availability of $270 million, subject to borrowing base availability, of which approximately $133 million would have been available as of September 30, 2014, after giving effect to $63 million of outstanding borrowings and $74 million of outstanding letters of credit. The ABL Facility covenants include |
6
Table of Contents
| a fixed charge coverage ratio of 1.0 to 1.0 that will only apply if our availability is less than the greater of (a) 12.5% of the lesser of the borrowing base and the total ABL Facility commitments at such time and (b) $27 million. |
| (4) | Two indirect non-U.S. subsidiaries hold interests in Momentive Performance Materials (Nantong) Co., Ltd. (“MPM Nantong”), which, as of September 30, 2014, had approximately $37 million in long-term debt outstanding. One loan is denominated in Chinese renminbi and collateralized by certain assets of MPM Nantong. The interest rate on the loan as of September 30, 2014 was 6.46%, and $15 million was outstanding as of September 30, 2014. The loan is non-recourse to us and the guarantors and MPM Nantong is an unrestricted subsidiary under MPM’s indentures. MPM Nantong also has two working capital loan facilities providing for revolving secured loans of up to $16 million (subject to exchange rates), $15 million of which was outstanding as of September 30, 2014. These revolving loans, which are denominated in U.S. dollars and Chinese renminbi, must be paid down and renewed annually. The interest rates on these loans as of September 30, 2014 ranged from 4.0% to 6.0%. In addition, MPM Nantong entered into another working capital loan agreement with JiangSu Bank of China providing for revolving unsecured loans up to $15 million (subject to exchange rates), $7 million of which was outstanding as of September 30, 2014. This revolving loan is denominated in Chinese renminbi. The interest rate on this loan as of September 30, 2014 was 6.0%. |
| (5) | Certain of our non-U.S. subsidiaries provide guarantees under the ABL Facility but do not guarantee the First Lien Notes or the Second Lien Notes. |
| (6) | An indirect subsidiary owns Momentive Performance Materials (India) Private Limited, which, as of September 30, 2014, had approximately $3 million in long-term debt outstanding. |
Additional Information
MPM Holdings was incorporated under the laws of the State of Delaware on September 2, 2014. Our principal executive offices are located at 260 Hudson River Road, Waterford, NY 12188, and our telephone number is (518) 233-3370. The address of our Internet site is www.momentive.com. This Internet address is provided for informational purposes only and is not intended to function as a hyperlink. Accordingly, no information contained in this Internet address is included or incorporated by reference herein.
7
Table of Contents
The Offering
The following summary highlights all material information contained elsewhere in this prospectus but does not contain all the information that you should consider before investing in our common stock. We urge you to read this entire prospectus, including the “Risk Factors” section and the consolidated financial statements and related notes.
| Issuer |
MPM Holdings Inc. |
| Common stock offered by the selling stockholders |
Up to 39,305,466 shares of common stock. |
| Common stock outstanding as of December 18, 2014 |
47,989,000 shares of common stock. |
| Use of proceeds |
We will not receive any of the proceeds from the sale of shares offered by the selling stockholders. |
| Dividend policy |
We have not paid any dividends on our common stock. We do not intend to declare or pay any cash dividends on our common stock for the foreseeable future. |
| No current market |
Our common stock is not listed on any national securities exchange. |
| Risk factors |
You should carefully consider all of the information set forth in this prospectus and, in particular, the information under “Risk Factors” beginning on page 12 of this prospectus, prior to purchasing shares of our common stock offered hereby. |
Unless we specifically state otherwise, all share information in this prospectus is based on 47,989,000 shares outstanding as of December 18, 2014.
8
Table of Contents
SUMMARY HISTORICAL CONSOLIDATED FINANCIAL DATA OF MPM
The following table presents MPM’s summary historical financial information as of and for the periods presented. Prior to the Emergence Date, MPM Holdings had not conducted any business operations. Accordingly, unless otherwise noted or suggested by context, all financial information and data and accompanying financial statements and corresponding notes, as of and prior to the Emergence Date, as contained in this prospectus, reflect the actual historical consolidated results of operations and financial condition of MPM for the periods presented and do not give effect to the Plan of Reorganization or any of the transactions contemplated thereby or the adoption of “fresh-start” accounting.
The summary historical financial information as of December 31, 2013 and 2012 and for the years ended December 31, 2013, 2012 and 2011 have been derived from, and should be read in conjunction with, MPM’s audited financial statements, included elsewhere in this prospectus. The financial data as of December 31, 2011 has been derived from MPM’s audited consolidated financial statements and related notes thereto. The summary historical financial information as of September 30, 2014 and for the nine-month periods ended September 30, 2014 and September 30, 2013 has been derived from, and should be read in conjunction with, MPM’s unaudited condensed consolidated financial statements, included elsewhere in this prospectus. In the opinion of management, all adjustments consisting of normal recurring accruals considered necessary for a fair presentation have been included.
The results of operations for interim periods are not necessarily indicative of the operating results that may be expected for the entire year or any future period.
9
Table of Contents
| (dollars in millions, except per share data)
|
As of and for the nine-month period ended |
As of and for the year
ended December 31, |
||||||||||||||||||
| September 30, | September 30, | |||||||||||||||||||
| 2014 | 2013 | 2013 | 2012 | 2011 | ||||||||||||||||
| Statements of Operations |
||||||||||||||||||||
| Net sales |
$ | 1,873 | $ | 1,784 | $ | 2,398 | $ | 2,357 | $ | 2,637 | ||||||||||
| Costs and expenses: |
||||||||||||||||||||
| Cost of sales, excluding depreciation and amortization |
1,339 | 1,277 | 1,732 | 1,705 | 1,798 | |||||||||||||||
| Selling, general and administrative expense |
417 | 276 | 373 | 392 | 389 | |||||||||||||||
| Depreciation and amortization expense |
137 | 129 | 171 | 187 | 197 | |||||||||||||||
| Research and development expense |
58 | 51 | 70 | 69 | 78 | |||||||||||||||
| Restructuring and other costs |
20 | 17 | 21 | 43 | 33 | |||||||||||||||
|
|
|
|
|
|
|
|
|
|
|
|||||||||||
| Operating (loss) income |
(98 | ) | 34 | 31 | (39 | ) | 142 | |||||||||||||
| Other expenses (income) |
||||||||||||||||||||
| Interest expense, net |
153 | 234 | 394 | 277 | 256 | |||||||||||||||
| Other non-operating income, net |
— | — | — | (11 | ) | — | ||||||||||||||
| Loss (gain) on extinguishment and exchange of debt |
— | — | — | 57 | (7 | ) | ||||||||||||||
| Reorganization items, net |
114 | — | — | — | — | |||||||||||||||
|
|
|
|
|
|
|
|
|
|
|
|||||||||||
| Loss before income tax and earnings (losses) from unconsolidated entities |
(365 | ) | (200 | ) | (363 | ) | (362 | ) | (107 | ) | ||||||||||
| Income tax (benefit) expense |
(2 | ) | — | 104 | 8 | 27 | ||||||||||||||
|
|
|
|
|
|
|
|
|
|
|
|||||||||||
| Loss before earnings (losses) from unconsolidated entities |
(363 | ) | (200 | ) | (467 | ) | (370 | ) | (134 | ) | ||||||||||
| Earnings (losses) from unconsolidated entities, net of taxes |
2 | 2 | 3 | 5 | (6 | ) | ||||||||||||||
|
|
|
|
|
|
|
|
|
|
|
|||||||||||
| Net loss |
(361 | ) | (198 | ) | (464 | ) | (365 | ) | (140 | ) | ||||||||||
| Net income attributable to noncontrolling interest |
— | — | — | — | (1 | ) | ||||||||||||||
|
|
|
|
|
|
|
|
|
|
|
|||||||||||
| Net loss attributable to Momentive Performance Materials Inc. |
$ | (361 | ) | $ | (198 | ) | $ | (464 | ) | $ | (365 | ) | $ | (141 | ) | |||||
|
|
|
|
|
|
|
|
|
|
|
|||||||||||
| Loss per share—basic and diluted |
$ | (3,610,000 | ) | $ | (1,980,000 | ) | $ | (4,640,000 | ) | $ | (3,650,000 | ) | $ | (1,410,000 | ) | |||||
| Balance Sheet Data (at period end): |
||||||||||||||||||||
| Cash and cash equivalents |
$ | 139 | $ | 94 | $ | 110 | $ | 199 | ||||||||||||
| Adjusted working capital(1) |
1 | 192 | 290 | 378 | ||||||||||||||||
| Total assets |
2,664 | 2,694 | 2,904 | 3,161 | ||||||||||||||||
| Adjusted total long-term debt(2) |
3,084 | 3,083 | 3,081 | 2,895 | ||||||||||||||||
| Total net debt(3) |
3,365 | 3,163 | 3,006 | 2,735 | ||||||||||||||||
| Total liabilities |
4,491 | 4,174 | 4,052 | 3,901 | ||||||||||||||||
| Total deficit |
(1,827 | ) | (1,480 | ) | (1,148 | ) | (736 | ) | ||||||||||||
| Cash Flow provided by (used in): |
||||||||||||||||||||
| Operating activities |
$ | (125 | ) | $ | (129 | ) | $ | (150 | ) | $ | (95 | ) | $ | 106 | ||||||
| Investing activities |
(9 | ) | (63 | ) | (88 | ) | (102 | ) | (120 | ) | ||||||||||
| Financing activities |
184 | 176 | 220 | 111 | (41 | ) | ||||||||||||||
| Other Financial Data: |
||||||||||||||||||||
| Capital expenditures(4) |
53 | 51 | 91 | 98 | 116 | |||||||||||||||
| Adjusted EBITDA(5) |
229 | 228 | 385 | |||||||||||||||||
| Segment EBITDA(6) |
177 | 186 | 238 | 214 | 379 | |||||||||||||||
10
Table of Contents
| (1) | Working capital is defined as current assets net of current liabilities. In order to make period to period comparisons more meaningful, solely for the purposes of the summary historical financial information and not in the audited and unaudited financial statements, certain current and long-term liabilities were reclassified for the working capital calculation as of September 30, 2014 and as of December 31, 2013. Specifically, as of September 30, 2014 and as of December 31, 2013, Debt payable within one year of $1,350 million and $3,076 million, respectively, has been reclassified as long-term debt. In addition, as of September 30, 2014, $128 million has been reclassified from liabilities subject to compromise to current liabilities. The presentation is a non-GAAP measure. |
The following table reconciles adjusted working capital to working capital:
| September 30, 2014 |
December 31, 2013 |
|||||||
| Adjusted working capital |
$ | 1 | $ | 192 | ||||
| Long-term debt classified as current due to event of default |
(1,350 | ) | (3,076 | ) | ||||
| Current liabilities classified as liabilities subject to compromise |
128 | — | ||||||
|
|
|
|
|
|||||
| Working capital |
$ | (1,221 | ) | $ | (2,884 | ) | ||
|
|
|
|
|
|||||
| (2) | In order to make period to period comparisons more meaningful, solely for the purposes of the summary historical financial information and not in the audited and unaudited financial statements, certain current and long-term liabilities were reclassified as of September 30, 2014 and as of December 31, 2013. Specifically, as of September 30, 2014 and as of December 31, 2013, Debt payable within one year of $1,350 million and $3,076 million, respectively, has been reclassified as long-term debt. The presentation is a non-GAAP measure. |
The following table reconciles adjusted total long-term debt to total long-term debt:
| September 30, 2014 |
December 31, 2013 |
|||||||
| Adjusted total long-term debt |
$ | 3,084 | $ | 3,083 | ||||
| Long-term debt classified as current due to event of default |
(1,350 | ) | (3,076 | ) | ||||
| Long-term debt classified as liabilities subject to compromise |
(1,727 | ) | — | |||||
|
|
|
|
|
|||||
| Total long-term debt |
$ | 7 | $ | 7 | ||||
|
|
|
|
|
|||||
| (3) | Total net debt is defined as long-term debt plus short-term debt, less cash and cash equivalents. |
| (4) | Capital expenditures are presented on an accrual basis. |
| (5) | Adjusted EBITDA is defined in the instruments that govern our indebtedness. See “Management’s Discussion and Analysis of Financial Condition and Results of Operations—Covenants under our Debt Instruments” for a discussion of Adjusted EBITDA and a reconciliation of net loss attributable to Momentive Performance Materials Inc. to Adjusted EBITDA. |
| (6) | We have provided Segment EBITDA in this prospectus because it is the primary performance measure used by our senior management, the chief operating decision-maker and the board of directors to evaluate operating results and allocate capital resources among businesses. Segment EBITDA is also the profitability measure used to set management and executive incentive compensation goals. Segment EBITDA is the aggregate of the Segment EBITDA for our Silicones business and the Segment EBITDA for our Quartz business, less Other, which is primarily general and administrative expenses that are not allocated to the businesses. Segment EBITDA is not a presentation made in accordance with U.S. Generally Accepted Accounting Principles (“GAAP”) and our use of the term Segment EBITDA may vary from that of others in our industry. Segment EBITDA should not be considered as an alternative to net income, operating income or any other performance measures derived in accordance with GAAP or as measures of liquidity derived in accordance with GAAP. Segment EBITDA has important limitations as an analytical tool, including with respect to measuring our operating performance and our liquidity, and you should not consider it in isolation or as a substitute for analysis of our results as reported under GAAP. For example, Segment EBITDA excludes certain tax payments that may represent a reduction in cash available to us; does not reflect any cash requirements for the assets being depreciated and amortized that may have to be replaced in the future; does not reflect changes in, or cash requirements for, our working capital needs; does not reflect the significant interest expense, or the cash requirements necessary to service interest or principal payments, on our indebtedness; and does not include certain non-cash and certain other income and expenses. Non-cash charges primarily represent stock-based compensation expense, unrealized derivative and foreign exchange gains and losses and asset disposal gains and losses. Restructuring and other costs primarily include expenses from MPM’s restructuring and cost optimization programs and management fees paid to its owner. |
See “Management’s Discussion and Analysis of Financial Condition and Results of Operations” for a reconciliation of Segment EBITDA to net loss attributable to Momentive Performance Materials Inc.
11
Table of Contents
You should carefully consider the risk factors set forth below, as well as the other information contained in this prospectus. The risks described below are not the only risks facing us. Any of the following risks could materially and adversely affect our business, financial condition or operating results. In such a case, you may lose all or a part of your original investment.
Risks Relating to Our Bankruptcy Cases and Emergence
Our actual financial results may vary significantly from the projections that were filed with the Bankruptcy Court.
In connection with MPM’s disclosure statement relating to the Plan of Reorganization (the “Disclosure Statement”), and the hearing to consider confirmation of the Plan of Reorganization, MPM prepared projected financial information to demonstrate to the Bankruptcy Court the feasibility of the Plan of Reorganization and MPM’s ability to continue operations upon our emergence from the Bankruptcy Cases. This projected financial information was prepared by, and is the responsibility of, management of MPM. PricewaterhouseCoopers LLP neither examined, compiled nor performed any procedures with respect to the projected financial information and, accordingly, PricewaterhouseCoopers LLP does not express an opinion or any other form of assurance with respect thereto. The PricewaterhouseCoopers LLP report included in this document relates to the historical financial information of MPM. It does not extend to the projected financial information prepared for the Bankruptcy Court and should not be read to do so. Those projections were prepared solely for the purpose of the Bankruptcy Cases and have not been, and will not be, updated on an ongoing basis. Those projections are not included in this prospectus and have not been incorporated by reference into this prospectus and should not be relied upon in connection with the purchase or sale of common stock. At the time they were prepared, the projections reflected numerous assumptions concerning MPM’s anticipated future performance and with respect to prevailing and anticipated market and economic conditions that were and remain beyond our control and that may not materialize. Projections are inherently subject to substantial and numerous uncertainties and to a wide variety of significant business, economic and competitive risks and the assumptions underlying the projections and/or valuation estimates may prove to be wrong in material respects. Actual results may vary significantly from those contemplated by the projections that were prepared in connection with the Disclosure Statement and the hearing to consider confirmation of the Plan of Reorganization.
Our financial condition or results of operations will not be comparable to the financial condition or results of operations reflected in our historical financial statements.
Since October 24, 2014, we have been operating under a new capital structure. In addition, as required by fresh-start accounting, at October 24, 2014 our assets and liabilities were recorded at fair value, based on values determined in connection with the implementation of our Plan of Reorganization, which are significantly different than amounts in MPM’s historical financial statements. Accordingly, our financial condition and results of operations from and after the Emergence Date are not comparable to the financial condition or results of operations reflected in MPM’s historical financial statements included elsewhere in this prospectus.
The Chapter 11 proceedings may have disrupted our business and may have materially and adversely affected our operations.
We have attempted to minimize the adverse effect of our Chapter 11 reorganization on our relationships with our employees, suppliers, customers and other parties. Nonetheless, our relationships with our customers, suppliers, certain liquidity providers and employees may have been adversely impacted and our operations, currently and going forward, could have been materially and adversely affected.
12
Table of Contents
Risks Related to Our Business
If global economic conditions remain weak or deteriorate, it will negatively impact our business, results of operations and financial condition.
Global economic and financial market conditions, including severe market disruptions, for example, those that occurred in late 2008 and 2009 and the potential for a significant and prolonged global economic downturn, could impact our business operations in a number of ways including, but not limited to, the following:
| • | reduced demand in key customer segments, such as automotive, building, construction and electronics, compared to prior years; |
| • | payment delays by customers and reduced demand for our products caused by customer insolvencies and/or the inability of customers to obtain adequate financing to maintain operations. This situation could cause customers to terminate existing purchase orders and reduce the volume of products they purchase from us and further impact our customers’ ability to pay our receivables, requiring us to assume additional credit risk related to these receivables or limit our ability to collect receivables from that customer; |
| • | insolvency of suppliers or the failure of suppliers to meet their commitments resulting in product delays; |
| • | more onerous credit and commercial terms from our suppliers such as shortening the required payment period for outstanding accounts receivable or reducing or eliminating the amount of trade credit available to us; and |
| • | potential delays in accessing our ABL Facility or obtaining new credit facilities on terms we deem commercially reasonable or at all, and the potential inability of one or more of the financial institutions included in our ABL Facility to fulfill their funding obligations. Should a bank in our ABL Facility be unable to fund a future draw request, we could find it difficult to replace that bank in the facility. |
Global economic conditions may remain weak or deteriorate. In such event, the negative effects described above would likely be exacerbated and our liquidity, as well as our ability to maintain compliance with the financial maintenance covenants in our secured revolving credit facilities, could be significantly affected. See “Risks Related to Our Indebtedness—We may be unable to generate sufficient cash flows from operations to meet our consolidated debt service payments.” and “—We may be unable to maintain compliance with the financial maintenance or other covenants in the ABL Facility, which could result in an event of default under the credit agreement governing such facility that, if not cured or waived, would have a material adverse effect on our business, financial condition and results of operations.” As a result, it may cause us to defer needed capital expenditures, reduce research and development or other spending, defer costs to achieve productivity and synergy programs, sell assets or incur additional borrowings which may not be available or may only be available on terms significantly less advantageous than our current credit terms and could result in a wide-ranging and prolonged impact on general business conditions, thereby negatively impacting our business, results of operations and financial condition. In addition, if the global economic environment deteriorates or remains slow for an extended period of time, the fair value of our reporting units could be more adversely affected than we estimated in our analysis of reporting unit fair values at October 1, 2013. This could result in goodwill or other asset impairments, which could negatively impact our business, results of operations and financial condition.
Fluctuations in direct or indirect raw material costs could have an adverse impact on our business.
The prices of our direct and indirect raw materials have been, and we expect them to continue to be, volatile. If the cost of direct or indirect raw materials increases significantly and we are unable to offset the increased costs with higher selling prices, our profitability will decline. Increases in prices for our products could also hurt our ability to remain both competitive and profitable in the markets in which we compete.
13
Table of Contents
Although some of our materials contracts include competitive price clauses that allow us to buy outside the contract if market pricing falls below contract pricing, and certain contracts have minimum-maximum monthly volume commitments that allow us to take advantage of spot pricing, we may be unable to purchase raw materials at market prices. In addition, some of our customer contracts have fixed prices for a certain term, and as a result, we may not be able to pass on raw material price increases to our customers immediately, if at all. Due to differences in timing of the pricing trigger points between our sales and purchase contracts, there is often a “lead-lag” impact that can negatively impact our margins in the short term in periods of rising raw material prices and positively impact them in the short term in periods of falling raw material prices. Future raw material prices may be impacted by new laws or regulations, suppliers’ allocations to other purchasers, changes in our supplier manufacturing processes as some of our products are byproducts of these processes, interruptions in production by suppliers, natural disasters, volatility in the price of crude oil and related petrochemical products and changes in exchange rates.
An inadequate supply of direct or indirect raw materials and intermediate products could have a material adverse effect on our business.
Our manufacturing operations require adequate supplies of raw materials and intermediate products on a timely basis. The loss of a key source or a delay in shipments could have a material adverse effect on our business. Raw material availability may be subject to curtailment or change due to, among other things:
| • | new or existing laws or regulations; |
| • | suppliers’ allocations to other purchasers; |
| • | interruptions in production by suppliers; and |
| • | natural disasters. |
Many of our raw materials and intermediate products are available in the quantities we require from a limited number of suppliers.
For example, our silicones business is highly dependent upon access to silicon metal, a key raw material, and siloxane, an intermediate product that is derived from silicon metal. While silicon is itself abundant, silicon metal is produced through a manufacturing process and, in certain geographic areas, is currently available through a limited number of suppliers. In North America, there are only two significant silicon metal suppliers. In 2009 and 2010, two of our competitors acquired silicon metal manufacturing assets in North America and Europe, respectively, becoming vertically integrated in silicon metal for a portion of their supply requirements and reducing the manufacturing base of certain independent silicon metal producers. In addition, silicon metal producers face a number of regulations that affect the supply or price of silicon metal in some or all of the jurisdictions in which we operate. For example, significant anti-dumping duties of up to 139.5% imposed by the U.S. Department of Commerce and the International Trade Commission against producers of silicon metal in China and Russia effectively block the sale by all or most producers in these jurisdictions to U.S. purchasers, which restricts the supply of silicon metal and results in increased prices. We currently purchase silicon metal under multi-year, one-year or short-term contracts and in the spot market. We typically purchase silicon metal under contracts in the United States and Europe and in the spot market in Asia Pacific.
Our silicones business also relies heavily on siloxane as an intermediate product. Our manufacturing capacity at our internal sites and our joint venture in China is sufficient to meet the substantial majority of our current siloxane requirements. We also source a portion of our requirements from ASM under an existing purchase and sale agreement. In addition, from time to time we enter into supply agreements with other third parties to take advantage of favorable pricing and minimize our cost. There are also a limited number of third-party siloxane providers, and the supply of siloxane may be limited from time to time. In addition, regulation of siloxane producers can also affect the supply of siloxane. For example, in January 2006, the Ministry of Commerce of the People’s Republic of China issued a final determination of an anti-dumping investigation that imposed anti-dumping duties on all siloxane manufacturers, including us, ranging from 13% to 22%. These
14
Table of Contents
duties were terminated in January 2011. In late May 2009, China’s Ministry of Commerce also concluded an anti-dumping investigation of siloxane manufacturers in Thailand and South Korea, which resulted in an imposition of a 5.4% duty against our supplier, ASM, in Thailand, a 21.8% duty against other Thailand companies and a 25.1% duty against Korean companies.
Our quartz production relies heavily on naturally occurring quartz sand, which is currently available from a limited number of suppliers. A significant amount of the market for this sand is controlled by Unimin. Our long term purchase agreement with Unimin expired on December 31, 2012, and we are currently negotiating the terms of a new long term supply agreement with Unimin. While we expect to enter into a new agreement with Unimin within the first quarter of 2015, there can be no assurance that we will enter into such an agreement. Since the expiration of our agreement with Unimin, purchases from Unimin have been handled through purchase orders without disruption of supply to our Quartz business. We expect that process to continue if we are unable to enter into a new agreement, though no assurance can be made that this process will continue.
Should any of our key suppliers fail to deliver these or other raw materials or intermediate products to us or no longer supply us, we may be unable to purchase these materials in necessary quantities, which could adversely affect our volumes, or may not be able to purchase them at prices that would allow us to remain competitive. During the past several years, certain of our suppliers have experienced force majeure events rendering them unable to deliver all, or a portion of, the contracted-for raw materials. On these occasions, we were forced to purchase replacement raw materials in the open market at significantly higher costs or place our customers on an allocation of our products. In addition, we cannot predict whether new regulations or restrictions may be imposed in the future on silicon metal, siloxane or other key materials, which may result in reduced supply or further increases in prices. We cannot assure investors that we will be able to renew our current materials contracts or enter into replacement contracts on commercially acceptable terms, or at all. Fluctuations in the price of these or other raw materials or intermediate products, the loss of a key source of supply or any delay in the supply could result in a material adverse effect on our business.
Our production facilities are subject to significant operating hazards which could cause environmental contamination, personal injury and loss of life, and severe damage to, or destruction of property and equipment.
Our production facilities are subject to hazards associated with the manufacturing, handling, storage and transportation of chemical materials and products, including human exposure to hazardous substances, pipeline and equipment leaks and ruptures, explosions, fires, inclement weather and natural disasters, mechanical failures, unscheduled downtime, transportation interruptions, remedial complications, chemical spills, discharges or releases of toxic or hazardous substances or gases, storage tank leaks and other environmental risks. Additionally, a number of our operations are adjacent to operations of independent entities that engage in hazardous and potentially dangerous activities. Our operations or adjacent operations could result in personal injury or loss of life, severe damage to or destruction of property or equipment, environmental damage, or a loss of the use of all or a portion of one of our key manufacturing facilities. Such events at our facilities or adjacent third-party facilities, could have a material adverse effect on us.
We may incur losses beyond the limits or coverage of our insurance policies for liabilities that are associated with these hazards. In addition, various kinds of insurance for companies in the chemical industry have not been available on commercially acceptable terms, or, in some cases, have been unavailable altogether. In the future, we may not be able to obtain coverage at current levels, and our premiums may increase significantly on coverage that we maintain.
Environmental obligations and liabilities could have a substantial negative impact on our financial condition, cash flows and profitability.
Our operations involve the use, handling, processing, storage, transportation and disposal of hazardous materials and are subject to extensive and complex U.S. federal, state, local and non-U.S. supra-national, national, provincial, and local environmental, health and safety laws and regulations. These environmental laws and regulations include those that govern the discharge of pollutants into the air and water, the generation, use,
15
Table of Contents
storage, transportation, treatment and disposal of hazardous materials and wastes, the cleanup of contaminated sites, occupational health and safety and those requiring permits, licenses, or other government approvals for specified operations or activities. Our products are also subject to a variety of international, national, regional, state, and provincial requirements and restrictions applicable to the manufacture, import, export or subsequent use of such products. In addition, we are required to maintain, and may be required to obtain in the future, environmental, health and safety permits, licenses, or government approvals to continue current operations at most of our manufacturing and research facilities throughout the world.
Compliance with environmental, health and safety laws and regulations, and maintenance of permits, can be costly and complex, and we have incurred and will continue to incur costs, including capital expenditures and costs associated with the issuance and maintenance of letters of credit, to comply with these requirements. In 2013, we incurred capital expenditures of $18 million to comply with environmental laws and regulations and to make other environmental improvements. If we are unable to comply with environmental, health and safety laws and regulations, or maintain our permits, we could incur substantial costs, including fines and civil or criminal sanctions, third party property damage or personal injury claims or costs associated with upgrades to our facilities or changes in our manufacturing processes in order to achieve and maintain compliance, and may also be required to halt permitted activities or operations until any necessary permits can be obtained or complied with. In addition, future developments or increasingly stringent regulations could require us to make additional unforeseen environmental expenditures, which could have a material adverse effect on our business.
Actual and alleged environmental violations have been identified at our facility in Waterford, New York. We are cooperating with the New York State Department of Environmental Conservation (the “NYSDEC”) and the U.S. Environmental Protection Agency (the “USEPA”) and the U.S. Department of Justice in their respective investigations of that facility’s compliance with certain applicable environmental requirements, including certain requirements governing the operation of the facility’s hazardous waste incinerators. Although we currently believe that the costs and potential penalties associated with these investigations will not have a material adverse impact on our business, these investigations may result in administrative, civil or criminal enforcement by the State of New York and/or the United States and resolution of such enforcement actions will likely require payment of a monetary penalty and/or the imposition of other civil or criminal sanctions.
Environmental, health and safety requirements change frequently and have tended to become more stringent over time. We cannot predict what environmental, health and safety laws and regulations or permit requirements will be enacted or amended in the future, how existing or future laws or regulations will be interpreted or enforced or the impact of such laws, regulations or permits on future production expenditures, supply chain or sales. Our costs of compliance with current and future environmental, health and safety requirements could be material. Such future requirements include legislation designed to reduce emissions of carbon dioxide and other substances associated with climate change (“greenhouse gases”). The European Union has enacted greenhouse gas emissions legislation, and continues to expand the scope of such legislation. The USEPA has promulgated regulations applicable to projects involving greenhouse gas emissions above a certain threshold, and the United States and certain states within the United States have enacted, or are considering, limitations on greenhouse gas emissions. These requirements to limit greenhouse gas emissions could significantly increase our energy costs, and may also require us to incur material capital costs to modify our manufacturing facilities.
In addition, we are subject to liability associated with hazardous substances in soil, groundwater and elsewhere at a number of sites. These include sites that we formerly owned or operated and sites where hazardous wastes and other substances from our current and former facilities and operations have been sent, treated, stored or disposed of, as well as sites that we currently own or operate. Depending upon the circumstances, our liability may be strict, joint and several, meaning that we may be held responsible for more than our proportionate share, or even all, of the liability involved regardless of our fault or whether we are aware of the conditions giving rise to the liability. Environmental conditions at these sites can lead to environmental cleanup liability and claims against us for personal injury or wrongful death, property damages and natural resource damages, as well as to claims and obligations for the investigation and cleanup of environmental conditions. The extent of any of these liabilities is difficult to predict, but in the aggregate such liabilities could be material.
16
Table of Contents
We have been notified that we are or may be responsible for environmental remediation at certain sites in the United States. As the result of former, current or future operations, there may be additional environmental remediation or restoration liabilities or claims of personal injury by employees or members of the public due to exposure or alleged exposure to hazardous materials in connection with our operations, properties or products. Sites sold by us in past years may have significant site closure or remediation costs and our share, if any, may be unknown to us at this time. These environmental liabilities or obligations, or any that may arise or become known to us in the future, could have a material adverse effect on our financial condition, cash flows and profitability.
In addition, in the normal course of our business, we are required to provide financial assurances for contingent future costs associated with certain hazardous waste management and remedial activities. Pursuant to financial assurance requirements set forth in state hazardous waste permit regulations applicable to our manufacturing facilities in Waterford, NY and Sistersville, WV, we have provided letters of credit in the following amounts: $25 million for closure and post-closure care for the Waterford and the Sistersville facilities; and $10 million (annual aggregate) for accidental occurrences at the Waterford and Sistersville facilities. We are currently in discussions with the NYSDEC regarding the renewal of our Waterford facility’s hazardous waste permit. We have recently been advised by the NYDEC that the draft renewal permit will require $26 million in financial assurances for our Waterford facility, an increase to the amount currently being provided of approximately $8 million. We believe that the draft permit will also require a re-evaluation of the financial assurance amount within the next 3 years. One or more of our facilities may also in the future be subject to additional financial assurance requirements imposed by governmental authorities, including the USEPA. In this regard, the USEPA has identified chemical manufacturing as an industry for which it plans to develop, as necessary, proposed regulations identifying appropriate financial assurance requirements pursuant to §108(b) of CERCLA. Any increase in financial assurances required for our facilities in connection with environmental, health and safety laws or regulations or the maintenance of permits would likely increase our costs and could also materially impact our financial position. For example, to the extent we issue letters of credit under our ABL Facility to satisfy any financial assurance requirements, we would incur fees for the issuance and maintenance of these letters of credit and the amount of borrowings that would otherwise be available to us under such facility would be reduced.
Future chemical regulatory actions may decrease our profitability.
Several governmental entities have enacted, are considering or may consider in the future, regulations that may impact our ability to sell certain chemical products in certain geographic areas. In December 2006, the European Union enacted a regulation known as REACH. This regulation requires manufacturers, importers and consumers of certain chemicals manufactured in, or imported into, the European Union to register such chemicals and evaluate their potential impacts on human health and the environment. The implementing agency is currently in the process of determining if any chemicals should be further tested, regulated, restricted or banned from use in the European Union. Other countries have implemented, or are considering implementation of, similar chemical regulatory programs. When fully implemented, REACH and other similar regulatory programs may result in significant adverse market impacts on the affected chemical products. If we fail to comply with REACH or other similar laws and regulations, we may be subject to penalties or other enforcement actions, including fines, injunctions, recalls or seizures, which would have a material adverse effect on our financial condition, cash flows and profitability.
Similarly, the Canadian government is implementing an initiative to review certain chemical products for potential environmental and human health and safety impacts. The list of products being reviewed includes several chemicals sold by us. We are part of an industry organization that is working with the Canadian government to develop relevant data and information. Upon review of such data and information, the Canadian government may enact regulations that would limit our ability to sell the affected chemicals in Canada. As part of this initiative, based upon modeled potential impacts on the aquatic environment, the Canadian government has listed as environmentally toxic octamethylcyclotetrasiloxane, or D4, a chemical substance that we manufacture.
17
Table of Contents
The Canadian government has issued regulations to minimize the discharge of D4 from industrial facilities into the aquatic environment. We cannot at this time estimate the effect of these regulations on us or our financial condition, cash flows and profitability, but it could be material. The European Union is also reviewing D4, as well as decamethylcyclopentasiloxane, or D5, another chemical substance we manufacture, and may, pursuant to REACH, regulate the manufacture, import and/or use of these two chemical substances in the European Union. The USEPA has also stated that they are reviewing the potential environmental risks posed by these two substances to determine whether regulatory measures are warranted, and we and other silicones industry members have entered into a consent order with the USEPA to conduct certain studies to obtain relevant data. Finally, the Norwegian Climate and Pollution Agency has published a November 2011 study that identifies D4 and D5 as potential candidates for listing as persistent organic pollutants pursuant to the Stockholm Convention on Persistent Organic Pollutants (the “Stockholm Convention”), an international treaty aimed at eliminating or minimizing the release of organic chemicals that are toxic, resistant to degradation in the environment, and transported and deposited far from the point of release. Regulation of our products containing such substances by the European Union, Canada, the United States, parties to the Stockholm Convention and/or other jurisdictions would likely reduce our sales within the jurisdiction and possibly in other geographic areas as well. These reductions in sales could be material depending upon the extent of any such additional regulations.
We participate with other companies in trade associations and regularly contribute to the research and study of the safety and environmental impact of our products and raw materials, including siloxanes. These programs are part of a program to review the environmental impacts, safety and efficacy of our products. In addition, government and academic institutions periodically conduct research on potential environmental and health concerns posed by various chemical substances, including substances we manufacture and sell. These research results are periodically reviewed by state, national and international regulatory agencies and potential customers. Such research could result in future regulations restricting the manufacture or use of our products, liability for adverse environmental or health effects linked to our products, and/or de-selection of our products for specific applications. These restrictions, liability, and product de-selection could have a material adverse effect on our business, our financial condition and/or liquidity.
Scientists periodically conduct studies on the potential human health and environmental impacts of chemicals, including products we manufacture and sell. Also, nongovernmental advocacy organizations and individuals periodically issue public statements alleging human health and environmental impacts of chemicals, including products we manufacture and sell. Based upon such studies or public statements, our customers may elect to discontinue the purchase and use of our products, even in the absence of any government regulation. Such actions could significantly decrease the demand for our products and, accordingly, have a material adverse effect on our business, financial condition, cash flows and profitability.
We are subject to certain risks related to litigation filed by or against us, and adverse results may harm our business.
We cannot predict with certainty the cost of defense, of prosecution or of the ultimate outcome of litigation and other proceedings filed by or against us, including penalties or other civil or criminal sanctions, or remedies or damage awards, and adverse results in any litigation and other proceedings may materially harm our business. Litigation and other proceedings may include, but are not limited to, actions relating to intellectual property, international trade, commercial arrangements, product liability, environmental, health and safety, joint venture agreements, labor and employment or other harms resulting from the actions of individuals or entities outside of our control. In the case of intellectual property litigation and proceedings, adverse outcomes could include the cancellation, invalidation or other loss of material intellectual property rights used in our business and injunctions prohibiting our use of business processes or technology that are subject to third-party patents or other third-party intellectual property rights. Litigation based on environmental matters or exposure to hazardous substances in the workplace or based upon the use of our products could result in significant liability for us, which could have a material adverse effect on our business, financial condition and/or profitability.
18
Table of Contents
We remain subject to litigation relating to the Chapter 11 proceedings.
In connection with the Bankruptcy Cases, three appeals were filed relating to the confirmation of the Plan of Reorganization. Specifically, on September 15, 2014, U.S. Bank National Association (“U.S. Bank”) as trustee for the Subordinated Notes filed its appeal (the “U.S. Bank Appeal”) before the U.S. District Court for the Southern District of New York (the “District Court”) seeking a reversal of the Court’s determination that the Debtors’ Plan of Reorganization properly denied recovery to holders of the Subordinated Notes on the basis that those debt securities are contractually subordinated to the Old Second Lien Notes. In addition, on September 16, 2014, BOKF, NA, as trustee for the Old First Lien Notes (“First Lien Indenture Trustee”) and Wilmington Trust, National Association, as trustee for the Old Secured Notes (together with U.S. Bank and First Lien Trustee, the “Appellants”) filed their joint appeal (together with the U.S. Bank Appeal, the “Appeals”) before the District Court seeking reversal of the Bankruptcy Court’s determinations that (i) the Debtors were not required to compensate holders of the Old First Lien Notes and Old Secured Notes for any prepayment premiums and (ii) the interest rates on First Lien Notes and Second Lien Notes provided to holders of the Old First Lien Notes and Old Secured Notes under the Plan of Reorganization was proper and in accordance with United States Bankruptcy Code. Briefing has been completed, and the Appeals are still pending before the District Court. On November 11, 2014, the Debtors also filed a motion to dismiss the Appeals (the “Motion to Dismiss”) with the District Court asserting, inter alia, that granting the relief requested by the Appellants would be inequitable under the legal doctrine of equitable mootness. Briefing has also been completed in connection with the Motion to Dismiss and is still pending before the District Court. We cannot predict with certainty the ultimate outcome of the Appeals or the Motion to Dismiss. An adverse outcome could negatively affect our business, results of operations and financial condition.
Because we manufacture and use materials that are known to be hazardous, we are subject to, or affected by, certain product and manufacturing regulations, for which compliance can be costly and time consuming. In addition, we may be subject to personal injury or product liability claims as a result of human exposure to such hazardous materials.
We produce hazardous chemicals that require care in handling and use that are subject to regulation by many U.S. and non-U.S. national, supra-national, state and local governmental authorities. In some circumstances, these authorities must review and, in some cases approve, our products and/or manufacturing processes and facilities before we may manufacture and sell some of these chemicals. To be able to manufacture and sell certain new chemical products, we may be required, among other things, to demonstrate to the relevant authority that the product does not pose an unreasonable risk during its intended uses and/or that we are capable of manufacturing the product in compliance with current regulations. The process of seeking any necessary approvals can be costly, time consuming and subject to unanticipated and significant delays. Approvals may not be granted to us on a timely basis, or at all. Any delay in obtaining, or any failure to obtain or maintain, these approvals would adversely affect our ability to introduce new products and to generate revenue from those products. New laws and regulations may be introduced in the future that could result in additional compliance costs, bans on product sales or use, seizures, confiscation, recall or monetary fines, any of which could prevent or inhibit the development, distribution or sale of our products and could increase our customers’ efforts to find less hazardous substitutes for our products. We are subject to ongoing reviews of our products and manufacturing processes.
Products we have made or used could be the focus of legal claims based upon allegations of harm to human health. While we cannot predict the outcome of suits and claims, we believe that we maintain adequate reserves, in accordance with our policy, to address litigation and are adequately insured to cover foreseeable future claims. However, an unfavorable outcome in these litigation matters could have a material adverse effect on our business, financial condition and/or profitability and cause our reputation to decline.
19
Table of Contents
We are subject to claims from our customers and their employees, environmental action groups and neighbors living near our production facilities.
We produce and use hazardous chemicals that require appropriate procedures and care to be used in handling them or in using them to manufacture other products. As a result of the hazardous nature of some of the products we produce and use, we may face claims relating to incidents that involve our customers’ improper handling, storage and use of our products. Additionally, we may face lawsuits alleging personal injury or property damage by neighbors living near our production facilities. These lawsuits could result in substantial damage awards against us, which in turn could encourage additional lawsuits and could cause us to incur significant legal fees to defend such lawsuits, either of which could have a material adverse effect on our business, financial condition and/or profitability. In addition, the activities of environmental action groups could result in litigation or damage to our reputation.
As a global business, we are subject to numerous risks associated with our international operations that could have a material adverse effect on our business.
We have significant manufacturing and other operations outside the United States. Some of these operations are in jurisdictions with unstable political or economic conditions. There are numerous inherent risks in international operations, including, but not limited to:
| • | exchange controls and currency restrictions; |
| • | currency fluctuations and devaluations; |
| • | tariffs and trade barriers; |
| • | export duties and quotas; |
| • | changes in local economic conditions; |
| • | changes in laws and regulations; |
| • | exposure to possible expropriation or other government actions; |
| • | hostility from local populations; |
| • | diminished ability to legally enforce our contractual rights in non-U.S. countries; |
| • | restrictions on our ability to repatriate dividends from our subsidiaries; |
| • | unsettled political conditions and possible terrorist attacks against U.S. interests; and |
| • | natural disasters or other catastrophic events. |
Our international operations expose us to different local political and business risks and challenges. For example, we face potential difficulties in staffing and managing local operations, and we have to design local solutions to manage credit risks of local customers and distributors. In addition, some of our operations are located in regions that may be politically unstable, having particular exposure to riots, civil commotion or civil unrests, acts of war (declared or undeclared) or armed hostilities or other national or international calamity. In some of these regions, our status as a U.S. company also exposes us to increased risk of sabotage, terrorist attacks, interference by civil or military authorities or to greater impact from the national and global military, diplomatic and financial response to any future attacks or other threats.
Some of our operations are located in regions with particular exposure to natural disasters such as storms, floods, fires and earthquakes. It would be difficult or impossible for us to relocate these operations and, as a result, any of the aforementioned occurrences could materially adversely affect our business.
In addition, intellectual property rights may be more difficult to enforce in non-U.S. or non-Western Europe countries.
20
Table of Contents
Our overall success as a global business depends, in part, upon our ability to succeed under different economic, social and political conditions. We may fail to develop and implement policies and strategies that are effective in each location where we do business, and failure to do so could have a material adverse effect on our business, financial condition and results of operations.
Our business is subject to foreign currency risk.
In 2013, approximately 68% of our net sales originated outside the United States. In our consolidated financial statements, we translate our local currency financial results into U.S. dollars based on average exchange rates prevailing during a reporting period or the exchange rate at the end of that period. During times of a strengthening U.S. dollar, at a constant level of business, our reported international revenues and earnings would be reduced because the local currency would translate into fewer U.S. dollars.
In addition to currency translation risks, we incur a currency transaction risk whenever one of our operating subsidiaries enters into a purchase or a sales transaction or indebtedness transaction using a different currency from the currency in which it records revenues. Given the volatility of exchange rates, we may not manage our currency transaction and/or translation risks effectively, and volatility in currency exchange rates may materially adversely affect our financial condition or results of operations, including our tax obligations. Since most of our indebtedness is denominated in U.S. dollars, a strengthening of the U.S. dollar could make it more difficult for us to repay our indebtedness.
We have entered and expect to continue to enter into various hedging and other programs in an effort to protect against adverse changes in the non-U.S. exchange markets and attempt to minimize potential material adverse effects. These hedging and other programs may be unsuccessful in protecting against these risks. Our results of operations could be materially adversely affected if the U.S. dollar strengthens against non-U.S. currencies and our protective strategies are not successful. Likewise, a strengthening U.S. dollar provides opportunities to source raw materials more cheaply from foreign countries.
The European debt crisis and related European financial restructuring efforts have contributed to instability in global credit markets and may cause the value of the Euro to further deteriorate. If global economic and market conditions, or economic conditions in Europe, the United States or other key markets remain uncertain or deteriorate further, the value of the Euro and the global credit markets may weaken. While we do not transact a significant amount of business in Greece, Italy or Spain, the general financial instability in those countries could have a contagion effect on the region and contribute to the general instability and uncertainty in the European Union. If this were to occur, it could adversely affect our European customers and suppliers and in turn have a materially adverse effect on our international business and results of operations.
Fluctuations in energy costs could have an adverse impact on our profitability and negatively affect our financial condition.
Oil and natural gas prices have fluctuated greatly over the past several years and we anticipate that they will continue to do so. Natural gas and electricity are essential to our manufacturing processes, which are energy-intensive. Our energy costs represented approximately 7% of our total cost of sales for the years ended December 31, 2013, 2012 and 2011.
Our operating expenses will increase if our energy prices increase. Increased energy prices may also result in greater raw materials costs. If we cannot pass these costs through to our customers, our profitability may decline. In addition, increased energy costs may also negatively affect our customers and the demand for our products.
If our energy prices decrease, we expect benefits in the short-run with decreased operating expenses and increased operating income, but may face increased pricing pressure from competitors that are similarly impacted
21
Table of Contents
by energy prices. As a result, profitability may decrease over an extended period of time of lower energy prices. Moreover, any future increases in energy prices after a period of lower energy prices may have an adverse impact on our profitability for the reasons described above.
We face increased competition from other companies and from substitute products, which could force us to lower our prices, which would adversely affect our profitability and financial condition.
The markets that we operate in are highly competitive, and this competition could harm our results of operations, cash flows and financial condition. Our competitors include major international producers as well as smaller regional competitors. We may be forced to lower our selling price based on our competitors’ pricing decisions, which would reduce our profitability. This has been further magnified by the impact of the recent global economic downturn, as companies have focused more on price to retain business and market share. In addition, we face competition from a number of products that are potential substitutes for our products. Growth in substitute products could adversely affect our market share, net sales and profit margins.
There is also a trend in our industries toward relocating manufacturing facilities to lower cost regions, such as Asia, which may permit some of our competitors to lower their costs and improve their competitive position. Furthermore, there has been an increase in new competitors based in these regions.
Some of our competitors are larger, have greater financial resources, have a lower cost structure, and/or have less debt than we do. As a result, those competitors may be better able to withstand a change in conditions within our industry and in the economy as a whole. If we do not compete successfully, our operating margins, financial condition, cash flows and profitability could be adversely affected. Furthermore, if we do not have adequate capital to invest in technology, including expenditures for research and development, our technology could be rendered uneconomical or obsolete, negatively affecting our ability to remain competitive.
We have achieved significant cost savings as a result of the Shared Services Agreement with Hexion, and expect additional cost savings from our other strategic initiatives. If the Shared Services Agreement is terminated or materially amended, or we are unable to achieve cost savings from our other strategic initiatives, it could have a material adverse effect on our business operations, results of operations, and financial condition.
In October 2010, MPM entered into the Shared Services Agreement with Hexion (which, from October 1, 2010 through October 24, 2014, was a subsidiary under a common parent) (the “Shared Services Agreement”). Under this agreement, we provide to Hexion, and Hexion provides to us, certain services, including, but not limited to, executive and senior management, administrative support, human resources, information technology support, accounting, finance, technology development, legal and procurement services. We have realized significant cost savings under the Shared Services Agreement, including savings related to shared services and logistics optimization, best-of-source contractual terms, procurement savings, regional site rationalization, administrative and overhead savings. The Shared Services Agreement is subject to termination by Hexion (or us), without cause, on not less than thirty days prior written notice, and expires in October 2015 (subject to one-year renewals every year thereafter, absent contrary notice from either party). In conjunction with the consummation of the Plan of Reorganization and MPM’s emergence from Chapter 11, on October 24, 2014, the Shared Services Agreement was amended to, among other things, (i) exclude the services of certain executive officers, (ii) provide for a transition assistance period at the election of the recipient following termination of the Shared Services Agreement of up to 12 months, subject to one successive renewal period of an additional 60 days and (iii) provide for the use of an independent third-party audit firm to assist the Steering Committee with its annual review of billings and allocations. If the Shared Services Agreement is terminated, it could have a material adverse effect on our business operations, results of operations and financial condition, as we would need to replace the services no longer being provided by Hexion, and would lose a portion of the benefits being generated under the agreement at the time.
Furthermore, we have not yet realized all of the cost savings and synergies we expect to achieve from our other strategic initiatives. A variety of risks could cause us not to realize the expected cost savings and synergies,
22
Table of Contents
including but not limited to, higher than expected severance costs related to staff reductions; higher than expected retention costs for employees that will be retained; higher than expected stand-alone overhead expenses; delays in the anticipated timing of activities related to our cost-saving plan; and other unexpected costs associated with operating our business.
In addition, while we have been successful in reducing costs and generating savings, factors may arise that may not allow us to sustain our current cost structure. As market and economic conditions change, we may also launch other cost savings initiatives. To the extent we are permitted to include the pro forma impact of cost savings initiatives in the calculation of financial covenant ratios or incurrence tests under our ABL Facility or our indentures, our failure to realize such savings could impact our compliance with such covenants or tests.
Our success depends in part on our ability to protect our intellectual property rights, and our inability to enforce these rights could have a material adverse effect on our competitive position.
We rely on the patent, trademark, copyright and trade-secret laws of the United States and the countries where we do business to protect our intellectual property rights. We may be unable to prevent third parties from using our intellectual property without our authorization. The unauthorized use of our intellectual property could reduce any competitive advantage we have developed, reduce our market share or otherwise harm our business. In the event of unauthorized use of our intellectual property, litigation to protect or enforce our rights could be costly, and we may not prevail.
Many of our technologies are not covered by any patent or patent application, and our issued and pending U.S. and non-U.S. patents may not provide us with any competitive advantage and could be challenged by third parties. Our inability to secure issuance of our pending patent applications may limit our ability to protect the intellectual property rights these pending patent applications were intended to cover. Our competitors may attempt to design around our patents to avoid liability for infringement and, if successful, our competitors could adversely affect our market share. Furthermore, the expiration of our patents may lead to increased competition.
Our pending trademark applications may not be approved by the responsible governmental authorities and, even if these trademark applications are granted, third parties may seek to oppose or otherwise challenge these trademark applications. A failure to obtain trademark registrations in the United States and in other countries could limit our ability to protect our products and their associated trademarks and impede our marketing efforts in those jurisdictions.
In addition, effective patent, trademark, copyright and trade secret protection may be unavailable or limited in some foreign countries. In some countries we do not apply for patent, trademark or copyright protection. We also rely on unpatented proprietary manufacturing expertise, continuing technological innovation and other trade secrets to develop and maintain our competitive position. While we generally enter into confidentiality agreements with our employees and third parties to protect our intellectual property, these confidentiality agreements are limited in duration and could be breached, and may not provide meaningful protection of our trade secrets or proprietary manufacturing expertise. Adequate remedies may not be available if there is an unauthorized use or disclosure of our trade secrets and manufacturing expertise. In addition, others may obtain knowledge about our trade secrets through independent development or by legal means. The failure to protect our processes, apparatuses, technology, trade secrets and proprietary manufacturing expertise, methods and compounds could have a material adverse effect on our business by jeopardizing critical intellectual property.
Where a product formulation or process is kept as a trade secret, third parties may independently develop or invent and patent products or processes identical to our trade-secret products or processes. This could have an adverse impact on our ability to make and sell products or use such processes and could potentially result in costly litigation in which we might not prevail.
23
Table of Contents
We could face intellectual property infringement claims that could result in significant legal costs and damages and impede our ability to produce key products, which could have a material adverse effect on our business, financial condition and results of operations.
Our production processes and products are specialized; however, we could face intellectual property infringement claims from our competitors or others alleging that our processes or products infringe on their proprietary technology. If we were subject to an infringement suit, we may be required to change our processes or products, or stop using certain technologies or producing the infringing product entirely. Even if we ultimately prevail in an infringement suit, the existence of the suit could cause our customers to seek other products that are not subject to infringement suits. Any infringement suit could result in significant legal costs and damages and impede our ability to produce key products, which could have a material adverse effect on our business, financial condition and results of operations.
We depend on certain of our key executives and our ability to attract and retain qualified employees.
Our ability to operate our business and implement our strategies depends, in part, on the skills, experience and efforts of key members of our leadership team. We do not maintain any key-man insurance on any of these individuals. In addition, our success will depend on, among other factors, our ability to attract and retain other managerial, scientific and technical qualified personnel, particularly research scientists, technical sales professionals and engineers who have specialized skills required by our business and focused on the industries in which we compete. Competition for qualified employees in the materials industry is intense and the loss of the services of any of our key employees or the failure to attract or retain other qualified personnel could have a material adverse effect on our business or business prospects. Further, if any of these executives or employees joins a competitor, we could lose customers and suppliers and incur additional expenses to recruit and train personnel, who require time to become productive and to learn our business.
The diversion of our key personnel’s attention to other businesses could adversely affect our business and results of operations.
Certain members of our senior management team, including individuals who provide substantial services to our business, act in the same or similar capacities for, and are employed by, our affiliate, Hexion. Certain of our employees, who provide substantial services to our business, also act in the same or similar capacities and provide services with respect to Hexion. The services of such individuals are provided by us to Hexion, or by Hexion to us, pursuant to the Shared Services Agreement. Any or all of these individuals may be required to focus their time and energies on matters relating to Hexion that otherwise could be directed to our business and operations. If the attention of our senior management team, and/or such other individuals providing substantial services to our business, is significantly diverted from their responsibilities to us, it could affect our ability to service our existing business and develop new business, which could have a material adverse effect on our business and results of operations. We cannot assure you that the implementation of the Shared Services Agreement will not be disruptive to our business.
If we fail to extend or renegotiate our collective bargaining agreements with our works councils and labor unions as they expire from time to time, if disputes with our works councils or unions arise, or if our unionized or represented employees were to engage in a strike or other work stoppage, our business and operating results could be materially adversely affected.
As of December 31, 2013, approximately 46% of our employees were unionized or represented by works councils that were covered by collective bargaining agreements. In addition, some of our employees reside in countries in which employment laws provide greater bargaining or other employee rights than the laws of the United States. These rights may require us to expend more time and money altering or amending employees’ terms of employment or making staff reductions. For example, most of our employees in Europe are represented by works councils, which generally must approve changes in conditions of employment, including restructuring initiatives and changes in salaries and benefits. A significant dispute could divert our management’s attention and otherwise hinder our ability to conduct our business or to achieve planned cost savings.
24
Table of Contents
We may be unable to timely extend or renegotiate our collective bargaining agreements as they expire. For example, a majority of our manufacturing personnel at our Sistersville, West Virginia site and our Waterford, New York and Willoughby, Ohio sites are covered by collective bargaining agreements that expire in the summer of 2017 and the summer of 2016, respectively. We also may be subject to strikes or work stoppages by, or disputes with, our labor unions in connection with these collective bargaining agreements or otherwise. In January 2011, the union at our Waterford, New York facility representing approximately 780 employees went on strike for two days in response to grievances. In addition, in January and November 2009, this union filed a variety of unfair labor practice charges against us with the National Labor Relations Board (the “NLRB”) arising from our implementation of a new wage rate schedule, a new job classification structure and a new overtime procedure at our Waterford, New York facility. In January 2010, the NLRB filed a complaint against us relating to a portion of these charges, and in July 2010 we reached a settlement with respect to these claims and the complaint was withdrawn. If we fail to extend or renegotiate our collective bargaining agreements, if additional disputes with our works councils or unions arise or if our unionized or represented workers engage in a further strike or other work stoppage, we could incur higher labor costs or experience a significant disruption of operations, which could have a material adverse effect on our business, financial position and results of operations.
Our pension plans are unfunded or under-funded and our required cash contributions could be higher than we expect, each of which could have a material adverse effect on our financial condition and liquidity.
We sponsor various pension and similar benefit plans worldwide.
Our non-U.S. defined benefit pension plans were under-funded in the aggregate by $132 million as of December 31, 2013. Our U.S. defined benefit pension plans were under-funded in the aggregate by $59 million as of December 31, 2013.
We are legally required to make contributions to our pension plans in the future, and those contributions could be material. The need to make these cash contributions will reduce the amount of cash that would be available to meet other obligations or the needs of our business, which could have a material adverse effect on our financial condition and liquidity. In 2014, we expect to contribute approximately $18 million and $2 million to our U.S. and non-U.S. defined benefit pension plans, respectively, which we believe is sufficient to meet the minimum funding requirements as set forth in employee benefit and tax laws.
Our future funding obligations for our employee benefit plans depend upon the levels of benefits provided for by the plans, the future performance of assets set aside for these plans, the rates of interest used to determine funding levels, the impact of potential business dispositions, actuarial data and experience, and any changes in government laws and regulations. In addition, our employee benefit plans hold a significant amount of equity securities. If the market values of these securities decline, our pension expense and funding requirements would increase and, as a result, could have a material adverse effect on our business.
Any decrease in interest rates and asset returns, if and to the extent not offset by contributions, could increase our obligations under these plans. If the performance of assets in the funded plans does not meet our expectations, our cash contributions for these plans could be higher than we expect, which could have a material adverse effect on our financial condition and liquidity.
Natural or other disasters have, and could in the future disrupt our business and result in loss of revenue or higher expenses.
Any serious disruption at any of our facilities or our suppliers’ facilities due to hurricane, fire, earthquake, flood, terrorist attack or any other natural or man-made disaster could impair our ability to use our facilities and have a material adverse impact on our revenues and increase our costs and expenses. If there is a natural disaster or other serious disruption at any of our facilities or our suppliers’ facilities, it could impair our ability to adequately supply our customers and negatively impact our operating results.
25
Table of Contents
For example, our manufacturing facility in Ohta, Japan and the manufacturing facilities of certain of our suppliers were impacted by the effects of the earthquake and tsunami in Japan on March 11, 2011 and related events. Our Ohta facility is one of three facilities globally where we internally produce siloxane, a key intermediate required in our manufacturing process of silicones. We also produce a variety of finished silicone products at this plant, including highly specialized silicone products. We are currently able to shift only certain amounts of production to our other facilities throughout the world over the short term. Our Ohta plant, which is approximately 230 kilometers away from the nuclear power plant at Fukushima, Japan that incurred significant damage as a result of the earthquake, is our closest facility to the area affected by the earthquake and tsunami. We also have manufacturing and research facilities in Kozuki and Kobe, Japan that produce quartz products, and administration offices in Tokyo, Nagoya and Fukuoka, Japan, none of which were significantly impacted by the earthquake. In addition, our manufacturing facilities, primarily those located in the Asia Pacific region, purchase certain raw materials from suppliers throughout Japan. Our sales, operating income and Segment EBITDA in the first half of 2011 were reduced by approximately $31 million, $16 million and $16 million, respectively, as a result of the earthquake and related events, primarily due to power, transportation and other supply-related issues, along with reduced demand from Japanese customers impacted by the earthquake. Normal plant operations at our Ohta facility were restored in early May 2011 but uncertainty in Japan continues primarily with respect to the country’s energy infrastructure. To the extent further events or actions in Japan occur that impact its energy supply, including, but not limited to, rolling blackouts, restrictions on power usage, radiation exposure from nuclear power plants or the imposition of evacuation zones around such plants, it could materially and adversely affect our operations, operating results and financial condition.
In addition, many of our current and potential customers are concentrated in specific geographic areas. A disaster in one of these regions could have a material adverse impact on our operations, operating results and financial condition. Our business interruption insurance may not be sufficient to cover all of our losses from a disaster, in which case our unreimbursed losses could be substantial.
Acquisitions and joint ventures that we pursue may present unforeseen integration obstacles and costs, increase our leverage and negatively impact our performance. Divestitures that we pursue also may present unforeseen obstacles and costs.
We have made acquisitions of related businesses, and entered into joint ventures in the past and intend to selectively pursue acquisitions of, and joint ventures with, related businesses as one element of our growth strategy. Acquisitions may require us to assume or incur additional debt financing, resulting in additional leverage and complex debt structures. If such acquisitions are consummated, the risk factors we describe above and below, and for our business generally, may be intensified.
Our ability to implement our growth strategy is limited by covenants in our ABL Facility, indentures and other indebtedness, our financial resources, including available cash and borrowing capacity, and our ability to integrate or identify appropriate acquisition and joint venture candidates.
The expense incurred in consummating acquisitions of related businesses, or our failure to integrate such businesses successfully into our existing businesses, could result in our incurring unanticipated expenses and losses. Furthermore, we may not be able to realize any anticipated benefits from acquisitions or joint ventures. The process of integrating acquired operations into our existing operations may result in unforeseen operating difficulties and may require significant financial resources that would otherwise be available for the ongoing development or expansion of existing operations. Some of the risks associated with our acquisition and joint venture strategy include:
| • | potential disruptions of our ongoing business and distraction of management; |
| • | unexpected loss of key employees or customers of the acquired company; |
| • | conforming the acquired company’s standards, processes, procedures and controls with our operations; |
| • | coordinating new product and process development; |
26
Table of Contents
| • | hiring additional management and other critical personnel; and |
| • | increasing the scope, geographic diversity and complexity of our operations. |
In addition, we may encounter unforeseen obstacles or costs in the integration of acquired businesses. For example, if we were to acquire an international business, the preparation of the U.S. GAAP financial statements could require significant management resources. Also, the presence of one or more material liabilities of an acquired company that are unknown to us at the time of acquisition may have a material adverse effect on our business. Our acquisition and joint venture strategy may not be successfully received by customers, and we may not realize any anticipated benefits from acquisitions or joint ventures.
In addition we may pursue divestitures of certain of our businesses as one element of our portfolio optimization strategy. Divestitures may require us to separate integrated assets and personnel from our retained businesses and devote our resources to transitioning assets and services to purchasers, resulting in disruptions to our ongoing business and distraction of management.
Security breaches and other disruptions to our information technology infrastructure could interfere with our operations, and could compromise our information and the information of our customers and suppliers, exposing us to liability which would cause our business and reputation to suffer.
In the ordinary course of business, we rely upon information technology networks and systems, some of which are managed by third parties, to process, transmit and store electronic information, and to manage or support a variety of business processes and activities, including supply chain, manufacturing, distribution, invoicing, and collection of payments from customers. We use information technology systems to record, process and summarize financial information and results of operations for internal reporting purposes and to comply with regulatory financial reporting, legal and tax requirements. Additionally, we collect and store sensitive data, including intellectual property, proprietary business information, the propriety business information of our customers and suppliers, as well as personally identifiable information of our customers and employees, in data centers and on information technology networks. The secure operation of these information technology networks, and the processing and maintenance of this information is critical to our business operations and strategy. Despite security measures and business continuity plans, our information technology networks and infrastructure may be vulnerable to damage, disruptions or shutdowns due to attacks by hackers or breaches due to employee error or malfeasance, or other disruptions during the process of upgrading or replacing computer software or hardware, power outages, computer viruses, telecommunication or utility failures or natural disasters or other catastrophic events. The occurrence of any of these events could compromise our networks and the information stored there could be accessed, publicly disclosed, lost or stolen. Any such access, disclosure or other loss of information could result in legal claims or proceedings, liability or regulatory penalties under laws protecting the privacy of personal information, disrupt operations, and damage our reputation, which could adversely affect our business, financial condition and results of operations.
Limitations on our use of certain product-identifying information, including the GE name and monogram, could adversely affect our business and profitability.
Prior to December 2006, substantially all of our products and services were marketed using the GE brand name and monogram, and we believe the association with GE provided our products and services with preferred status among our customers and employees due to GE’s globally recognized brands and perceived high quality. MPM and GE are parties to a trademark license agreement, which was entered into in December 2006 and amended in May 2013, that grants MPM a limited right to, among other things, use the GE mark and monogram on our sealant, adhesive and certain other products. These rights extend for a term of five years through December 3, 2018, with options that allow MPM to renew the license through 2023, subject to certain terms and conditions, including the payment of royalties. MPM also has the right to use numerous product specifications that contain the letters “GE” for the life of the respective products. While we continue to use the GE mark and monogram on these products and continue to use these product specifications, we are not able to use the GE mark
27
Table of Contents
and monogram on other products, use GE as part of our name or advertise ourselves as a GE company. While we have not yet experienced any significant loss of business as a result of our limited use of the GE mark and monogram, our business could be disadvantaged in the future by the loss of association with the GE name on our sealant, adhesive and certain other products.
Risks Related to Our Indebtedness
We may be unable to generate sufficient cash flows from operations to meet our consolidated debt service payments.
We have substantial consolidated indebtedness. As of September 30, 2014, after giving pro forma effect to the Emergence, we would have had $1,203 million of consolidated outstanding indebtedness. Our projected annualized cash interest expense would have been approximately $60 million based on our consolidated indebtedness and interest rates at September 30, 2014 after giving pro forma effect to the Emergence but without giving effect to any subsequent borrowings or payments under the ABL Facility, of which $54 million represents cash interest expense on fixed-rate obligations.
Our ability to generate sufficient cash flows from operations to make scheduled debt service payments depends on a range of economic, competitive and business factors, many of which are outside of our control. Continued or increased weakness in economic conditions and our performance beyond our expectations would exacerbate these risks. Our business may generate insufficient cash flows from operations to meet our debt service and other obligations, and currently anticipated cost savings, working capital reductions and operating improvements may not be realized on schedule, or at all. To the extent our cash flow from operations is insufficient to fund our debt service obligations, aside from our current liquidity, we would be dependent on outside capital to meet the funding of our debt service obligations and to fund capital expenditures and other obligations. We were previously forced to take actions to restructure and refinance our indebtedness and there can be no assurances that we will be able to meet our scheduled debt service obligations in the future.
If we are unable to meet our expenses and debt service obligations, we may need to refinance all or a portion of our indebtedness on or before maturity, sell assets or issue additional equity securities. We may be unable to refinance any of our indebtedness, sell assets or issue equity securities on commercially reasonable terms, or at all, which could cause us to default on our obligations and result in the acceleration of our debt obligations. Our inability to generate sufficient cash flows to satisfy our outstanding debt obligations, or to refinance our obligations on commercially reasonable terms, would have a material adverse effect on our business, financial condition and results of operations.
Availability under the ABL Facility is subject to a borrowing base based on a specified percentage of eligible accounts receivable and inventory and, in certain foreign jurisdictions, machinery and equipment. As of September 30, 2014, after giving pro forma effect to the Emergence, the borrowing base (including various reserves) was determined to be approximately $270 million, and we had $74 million of drawn letters of credit and $133 million of available revolver borrowings under the ABL Facility. The borrowing base (including various reserves) is updated on a monthly basis, so the actual borrowing base could be lower in the future. To the extent the borrowing base is lower than we expect, that could significantly impair our liquidity.
Our substantial indebtedness could adversely affect our ability to raise additional capital to fund our operations and limit our ability to react to changes in the economy or our industry.
Our substantial consolidated indebtedness could have other important consequences, including but not limited to the following:
| • | it may limit our flexibility in planning for, or reacting to, changes in our operations or business; |
| • | we are more highly leveraged than many of our competitors, which may place us at a competitive disadvantage; |
| • | it may make us more vulnerable to downturns in our business or the economy; |
28
Table of Contents
| • | a substantial portion of our cash flows from operations will be dedicated to the repayment of our indebtedness and will not be available for other purposes; |
| • | it may restrict us from making strategic acquisitions, introducing new technologies, or exploiting business opportunities; |
| • | it may make it more difficult for us to satisfy our obligations with respect to our existing indebtedness; |
| • | it may adversely affect terms under which suppliers provide material and services to us; and |
| • | it may limit our ability to borrow additional funds or dispose of assets. |
There would be a material adverse effect on our business and financial condition if we were unable to service our indebtedness or obtain additional financing, as needed.
Despite our substantial indebtedness, we may still be able to incur significant additional indebtedness. This could intensify the risks described above and below.
We may be able to incur substantial additional indebtedness in the future. Although the terms governing our indebtedness contain restrictions on our ability to incur additional indebtedness, these restrictions are subject to numerous qualifications and exceptions, and the indebtedness we may incur in compliance with these restrictions could be substantial. Increasing our indebtedness could intensify the risks described above and below.
The terms governing our outstanding debt, including restrictive covenants, may adversely affect our operations.
The terms governing our outstanding debt contain, and any future indebtedness we incur would likely contain, numerous restrictive covenants that impose significant operating and financial restrictions on our ability to, among other things:
| • | incur or guarantee additional debt; |
| • | pay dividends and make other distributions to our stockholders; |
| • | create or incur certain liens; |
| • | make certain loans, acquisitions, capital expenditures or investments; |
| • | engage in sales of assets and subsidiary stock; |
| • | enter into sale/leaseback transactions; |
| • | enter into transactions with affiliates; and |
| • | transfer all or substantially all of our assets or enter into merger or consolidation transactions. |
As a result of these covenants, we are limited in the manner in which we conduct our business, and we may be unable to engage in favorable business activities or finance future operations or capital needs.
We may be unable to maintain compliance with the financial maintenance or other covenants in the ABL Facility, which could result in an event of default under the credit agreement governing such facility that, if not cured or waived, would have a material adverse effect on our business, financial condition and results of operations.
The credit agreement governing the ABL Facility requires us to maintain a minimum fixed charge coverage ratio of 1.0 to 1.0 at any time when the availability is less than the greater of (a) 12.5% of the lesser of the borrowing base and the total ABL Facility commitments at such time and (b) $27 million. The fixed charge coverage ratio under the agreement governing the ABL Facility is generally defined as the ratio of (a) Adjusted EBITDA minus non-financed capital expenditures and cash taxes to (b) debt service plus cash interest expense plus certain restricted payments, each measured on a last twelve months, or LTM, basis.
29
Table of Contents
A breach of our fixed charge coverage ratio, if in effect, could, if not waived, result in an event of default under our ABL Facility. Pursuant to the terms of the credit agreement governing the ABL Facility, our direct parent company will have the right, but not the obligation, to cure such default through the purchase of additional equity in up to three of any four consecutive quarters. If a breach of a fixed charge coverage ratio covenant is not cured or waived, or if any other event of default under the ABL Facility occurs, the lenders under such credit facility:
| • | would not be required to lend any additional amounts to us; |
| • | could elect to declare all borrowings outstanding under such ABL Facility, together with accrued and unpaid interest and fees, due and payable and could demand cash collateral for all letters of credit issued thereunder; |
| • | could apply all of our available cash that is subject to the cash sweep mechanism of the ABL Facility to repay these borrowings; and/or |
| • | could prevent us from making payments on our notes; |
any or all of which could result in an event of default under our notes.
The ABL Facility also provides for “springing control” over the cash in our deposit accounts constituting collateral for the ABL Facility, and such cash management arrangements include a cash sweep at any time that availability under the ABL Facility is less than the greater of (1) 12.5% of the lesser of the borrowing base and the total ABL Facility commitments at such time and (2) $27 million. Such cash sweep, if in effect, will cause all our available cash to be applied to outstanding borrowings under the ABL Facility. If we satisfy the conditions to borrowing under the ABL Facility while any such cash sweep is in effect, we may be able to make additional borrowings under the ABL Facility to satisfy our working capital and other operational needs. If we do not satisfy the conditions to borrowing, we will not be permitted to make additional borrowings under the ABL Facility, and we will not have sufficient cash to satisfy our working capital and other operational needs. The availability threshold for triggering a cash sweep is the same availability threshold for triggering the fixed charge coverage ratio covenant under the ABL Facility.
The terms governing our indebtedness limit our ability to sell assets and also restrict the use of proceeds from that sale. We may be unable to sell assets quickly enough or for sufficient amounts to enable us to meet our obligations. Furthermore, a substantial portion of our assets is, and may continue to be, intangible assets. Therefore, it may be difficult for us to pay our consolidated debt obligations in the event of an acceleration of any of our consolidated indebtedness.
If the indebtedness under the ABL Facility, the First Lien Notes or the Second Lien Notes were to be accelerated after an event of default, our respective assets may be insufficient to repay such indebtedness in full and our lenders could foreclose on the assets pledged under the applicable facility. Under these circumstances, a refinancing or additional financing may not be obtainable on acceptable terms, or at all, and we may be forced to explore a restructuring.
Repayment of our debt, including required principal and interest payments, depends on cash flows generated by our subsidiaries, which may be subject to limitations beyond our control.
Our subsidiaries own a significant portion of our consolidated assets and conduct a significant portion of our consolidated operations. Repayment of our indebtedness depends, to a significant extent, on the generation of cash flows and the ability of our subsidiaries to make cash available to us by dividend, debt repayment or otherwise. Our subsidiaries may not be able to, or may not be permitted to, make distributions to enable us to make payments on our indebtedness. Each subsidiary is a distinct legal entity and, under certain circumstances, legal and contractual restrictions may limit our ability to obtain cash from subsidiaries. While there are limitations on the ability of our subsidiaries to incur consensual restrictions on their ability to pay dividends or make intercompany payments, these limitations are subject to certain qualifications and exceptions. In the event that we are unable to receive distributions from our subsidiaries, we may be unable to make required principal and interest payments on our indebtedness.
30
Table of Contents
A downgrade in our debt ratings could restrict our access to, and negatively impact the terms of, current or future financings or trade credit.
Standard & Poor’s Ratings Services (“S&P”) and Moody’s Investors Service (“Moody’s”) maintain credit ratings on us and certain of our debt. Our S&P ratings are currently below investment grade and Moody’s is currently in the process of evaluating our ratings. Our ratings by Moody’s were downgraded in 2013, and again downgraded by S&P and Moody’s in 2014 prior to MPM’s filing a voluntary petition for reorganization (the “Bankruptcy Filing”) under Chapter 11 of the U.S. Bankruptcy Code. Any decision by these ratings agencies to downgrade the ratings of debt issued in connection with the Emergence or to put them on negative watch in the future could restrict our access to, and negatively impact the terms of, current or future financings and trade credit extended by our suppliers of raw materials or other vendors.
Risks Related to the Company’s Common Stock
There is no public market for our common stock.
There are substantial risks in investing in our common stock given the general illiquid nature of such securities. There is no public trading market for our securities. Holders of our securities may find it difficult or impossible to find a qualified purchaser for such securities at any price. Because of this, it is hard to determine exactly the value of our common stock.
Our stock price may be volatile or may decline regardless of our operating performance, and you may not be able to resell your shares at or above the offering price.
The price for our common stock may be volatile and may fluctuate significantly in response to a number of factors, most of which we cannot control, including, among others:
| • | changes in economic trends or the continuation of current economic conditions; |
| • | industry cycles and trends; |
| • | changes in government and environmental regulation; |
| • | adverse resolution of new or pending litigation against us; |
| • | changes in laws or regulations governing our business and operations; |
| • | the sustainability of an active trading market for our common stock; and |
| • | future sales of our common stock by our stockholders. |
These and other factors may lower the price of our common stock, regardless of our actual operating performance. In the event of a drop in the price of our common stock, you could lose a substantial part or all of your investment in our common stock.
In addition, the stock markets have experienced extreme price and volume fluctuations that have affected and continue to affect the market prices of equity securities of many companies. In the past, stockholders have instituted securities class action litigation following periods of market volatility. If we were to become involved in securities litigation, we could incur substantial costs and our resources and the attention of management could be diverted from our business.
Future sales of our common stock, or the perception that these sales may occur, may depress the price of our common stock.
Additional sales of a substantial number of our shares of common stock, or the perception that such sales may occur, could have a material adverse effect on the price of our common stock and could materially impair
31
Table of Contents
our ability to raise capital through the sale of additional shares. As of December 18, 2014, we had 47,989,000 shares of common stock issued and outstanding. Of these shares, 6,387,842 shares are freely tradable without restriction under the Securities Act of 1933, as amended (the “Securities Act”), except for any shares acquired by our directors, executive officers or other affiliates (as that term is defined in the Securities Act) and approximately 41,601,158 shares are restricted securities or control securities under the Securities Act. Restricted securities and control securities may not be sold in the public market unless the sale is registered under the Securities Act or an exemption from registration is available. The shares that constitute restricted securities and control securities are being registered pursuant to the registration statement of which this prospectus forms a part and may be sold under this prospectus. As of the date of this prospectus, the selling stockholders beneficially own approximately 91.3% of our common stock. The sale of all or a portion of the shares by the selling stockholders or our other stockholders, or the perception that these sales may occur, could cause the price of our common stock to decrease significantly.
Pursuant to the Company’s Registration Rights Agreement, the selling stockholders have certain demand and piggyback rights that may require us to file additional registration statements registering their common stock or to include sales of such common stock in registration statements that we may file for ourselves or other stockholders. Any shares of common stock sold under these registration statements or this prospectus will be freely tradable. In the event such registration rights are exercised and a large number of shares of common stock is sold, such sales could reduce the trading price of our common stock. These sales also could impede our ability to raise future capital. Additionally, we will bear all expenses in connection with this registration and any such registrations, except that the selling stockholders may be responsible for their pro rata shares of underwriters’ discounts and commissions, stock transfer taxes and certain legal expenses.
As a holding company, our only material assets will be our equity interests in our operating subsidiaries, and our principal source of revenue and cash flow will be distributions from such subsidiaries, which may be limited by law and/or contract in making such distributions.
As a holding company, our principal source of revenue and cash flow will be distributions from our subsidiaries. Therefore, our ability to carry out our business plan, to fund and conduct our business, service our debt and pay dividends (if any) in the future will depend on the ability of our subsidiaries to generate sufficient net income and cash flows to make upstream cash distributions to us. Our subsidiaries are separate legal entities, and although they may be wholly owned or controlled by us, they have no obligation to make any funds available to us, whether in the form of loans, dividends or otherwise. The ability of our subsidiaries to distribute cash to us may also be subject to, among other things, future restrictions that are contained in our subsidiaries’ agreements (as entered into from time to time), availability of sufficient funds in such subsidiaries and applicable laws and regulatory restrictions. Claims of creditors of our subsidiaries generally will have priority as to the assets of such subsidiaries over our claims and claims of our creditors and stockholders. To the extent the ability of our subsidiaries to distribute dividends or other payments to us could be limited in any way, this could materially limit our ability to fund and conduct our business, service our debt and pay dividends (if any).
Apollo is our largest stockholder and has significant influence over us, and its interests may conflict with or differ from your interests as a stockholder.
As of September 30, 2014, after giving effect to the Emergence, Apollo and its affiliates beneficially own approximately 39.8% of our common stock. In connection with the Emergence, Apollo designated four of our eleven directors. As a result of that representation, Apollo has the ability to exert significant influence over us.
The interests of Apollo could conflict with or differ from the interests of our other stockholders. For example, the concentration of ownership held by Apollo could delay, defer, cause or prevent a change of control of us or impede a merger, takeover or other business combination that you as a stockholder may otherwise view favorably. Apollo is in the business of making or advising on investments in companies and holds, and may from time to time in the future acquire, interests in or provide advice to businesses that directly or indirectly compete with certain portions of our business or are suppliers or customers of ours. Apollo may also pursue acquisitions that may be complementary to our business, and, as a result, those acquisition opportunities may not be available to us.
32
Table of Contents
Our Amended and Restated Certificate of Incorporation (“Certificate of Incorporation”) provides that we expressly renounce any interest or expectancy in any business opportunity, transaction or other matter in which Apollo, the Ad Hoc Group (as defined in the Certificate of Incorporation) or any of their respective affiliates (with respect to Apollo, the “Apollo Group”) participates or desires or seeks to participate in, even if the opportunity is one that we would reasonably be deemed to have pursued if given the opportunity to do so.
Provisions in our organizational documents may delay or prevent our acquisition by a third party.
Our Certificate of Incorporation and our amended and restated bylaws (“Bylaws”) contain several provisions that may make it more difficult or expensive for a third party to acquire control of us without the approval of our board of directors. These provisions also may delay, prevent or deter a merger, acquisition, tender offer, proxy contest or other transaction that might otherwise result in our stockholders receiving a premium over the market price for their common stock. These provisions include, among others:
| • | provisions relating to the appointment of directors for a period of time following the Emergence; |
| • | provisions requiring stockholders to hold at least 33% of our outstanding common stock in the aggregate to request special meetings; |
| • | provisions that provide that the doctrine of “corporate opportunity” will not apply with respect to Apollo, the Ad Hoc Group (as defined in the Certificate of Incorporation) and their respective affiliates with respect to the Company; and |
| • | provisions that require a non-interim Chief Executive Officer to review any business combination transaction. |
These provisions of our Certificate of Incorporation and Bylaws could discourage potential takeover attempts and reduce the price that investors might be willing to pay for our common stock in the future, which could reduce the market price of our common stock. For more information, see “Description of Capital Stock.”
33
Table of Contents
CAUTIONARY STATEMENTS CONCERNING FORWARD LOOKING STATEMENTS
This prospectus contains “forward-looking statements” within the meaning of the federal securities laws, which involve substantial risks and uncertainties. You can identify forward-looking statements because they contain words such as “believe,” “project,” “might,” “expect,” “may,” “will,” “should,” “seek,” “approximately,” “intend,” “plan,” “estimate,” or “anticipate” or similar expressions that concern our strategy, plans or intentions. All statements we make in this prospectus relating to our estimated and projected revenue, margins, costs, expenditures, cash flows, growth rates, financial results, and prospects are forward-looking statements. These forward-looking statements are subject to risks and uncertainties that may change at any time, and, therefore, our actual results may differ materially from those we expect. We derive many of our forward-looking statements from our operating budgets and forecasts, which we base upon many detailed assumptions. While we believe that our assumptions are reasonable, we caution that it is very difficult to predict the impact of known factors, and it is impossible for us to anticipate all factors that could affect our actual results.
We disclose important factors that could cause actual results to differ materially from our expectations under “Risk Factors” and elsewhere in this prospectus, including, without limitation, in conjunction with the forward-looking statements included in this prospectus. Some of the factors that we believe could affect our revenue, margins, costs, expenditures, cash flows, growth rates, financial results, business, condition and prospects include:
| • | disruptions to our business due to the Chapter 11 proceedings; |
| • | global economic conditions; |
| • | raw material costs and supply availability; |
| • | environmental hazards and regulations and related compliance and litigation costs; |
| • | litigation costs; |
| • | manufacturing regulations and related compliance and litigation costs; |
| • | risks associated with international operations; |
| • | foreign currency fluctuations; |
| • | rising energy costs; |
| • | increased competition; |
| • | the success of our strategic initiatives; |
| • | our holding company structure; |
| • | intellectual property protection and litigation; |
| • | our reliance on our key executives; |
| • | relations and costs associated with our workforce; |
| • | our pension liabilities; |
| • | disruptions to our information technology infrastructure; |
| • | natural disasters, acts of war, terrorism and other acts beyond our control; |
| • | the impact of our substantial indebtedness; |
| • | our incurring additional debt; |
| • | acquisitions, divestitures and joint ventures that we may pursue; |
| • | restrictive covenants related to our indebtedness; and |
| • | other factors presented under the heading “Risk Factors.” |
34
Table of Contents
We caution you that the foregoing list of important factors may not contain all of the material factors that are important to you. There may be other factors that could cause our actual results to differ materially from the results referred to in the forward-looking statements. In addition, in light of these risks and uncertainties, the matters referred to in the forward-looking statements contained in this prospectus may not in fact occur. We undertake no obligation to publicly update or revise any forward-looking statement as a result of new information, future events or otherwise, except as otherwise required by law.
35
Table of Contents
We will not receive any proceeds from the sale of shares of common stock that may be sold from time to time pursuant to this prospectus. The selling stockholders will receive all of the proceeds from the sale of the shares of common stock offered from time to time under this prospectus. We have agreed to pay certain expenses of the selling stockholders incurred in connection with the sale of common stock from time to time pursuant to this prospectus, but will not pay any underwriters’ discounts or commissions.
36
Table of Contents
MARKET PRICES AND DIVIDEND POLICY
Our common stock has no established public trading market.
Holders. As of December 15, 2014, there were 190 stockholders of record of our common stock, one of which was Cede & Co., a nominee for The Depository Trust Company. All of our common stock held by brokerage firms, banks and other financial institutions as nominees for beneficial owners are considered to be held of record by Cede & Co., who is considered to be one stockholder of record. A substantially greater number of holders of our common stock are “street name” or beneficial holders, whose shares of common stock are held of record by banks, brokers and other financial institutions. Because such shares of common stock are held on behalf of stockholders, and not by the stockholders directly, and because a stockholder can have multiple positions with different brokerage firms, banks and other financial institutions, we are unable to determine the total number of stockholders we have.
Dividends and Dividend Policy. We have not paid any dividends since our incorporation in 2014. For the foreseeable future, we intend to retain any earnings to finance our business and we do not anticipate paying any cash dividends on our common stock. Any future determination to pay dividends will be at the discretion of our board of directors in accordance with applicable law and will be dependent upon then-existing conditions, including our financial condition and results of operations, capital requirements, contractual restrictions, business prospects and other factors that our board of directors considers relevant.
37
Table of Contents
The following table sets forth MPM’s cash and cash equivalents and capitalization as of September 30, 2014 on an actual basis and on an as-adjusted basis to give effect to the Emergence. We have agreed to pay certain expenses of the selling stockholders incurred in connection with the sale of common stock from time to time pursuant to this prospectus, but will not pay any underwriters’ discounts or commissions. The selling stockholders will receive all of the proceeds from the sale of the shares of common stock offered from time to time under this prospectus. We will not receive any proceeds from the sale of common stock from time to time pursuant to this prospectus.
You should read the information set forth below in conjunction with MPM’s audited consolidated financial statements and the notes thereto and the section entitled “Management’s Discussion and Analysis of Financial Condition and Results of Operations” and MPM’s consolidated financial statements and the notes thereto included elsewhere herein.
| As of September 30, 2014 | ||||||||
| (dollars in millions) | Actual | As Adjusted for the Emergence |
||||||
| Cash and cash equivalents (including restricted cash of $5)(1) |
$ | 139 | $ | 259 | ||||
|
|
|
|
|
|||||
| Debt outstanding: |
||||||||
| DIP ABL Facility |
$ | 63 | $ | — | ||||
| ABL Facility(2) |
— | — | ||||||
| Cash Flow Facility |
20 | — | ||||||
| DIP Term Loan Facility |
300 | — | ||||||
| 3.88% First-Priority Senior Secured Notes due 2021 (includes $143 of unamortized debt discount) |
— | 957 | ||||||
| 8.875% First Lien Notes due 2020 |
1,100 | — | ||||||
| 10% Senior Secured Notes due 2020 |
250 | — | ||||||
| 4.69% Second-Priority Senior Secured Notes due 2022 (includes $48 of unamortized debt discount) |
— | 202 | ||||||
| 9.0% Springing Lien Dollar Notes due 2021 |
1,161 | — | ||||||
| 9.5% Springing Lien Euro Notes due 2021(3) |
184 | — | ||||||
| 11 1/2% Senior Subordinated Notes due 2016 |
382 | — | ||||||
| China bank loans |
37 | 37 | ||||||
| Other |
7 | 7 | ||||||
|
|
|
|
|
|||||
| Total debt |
3,504 | 1,203 | ||||||
|
|
|
|
|
|||||
| Total (deficit) equity |
(1,827 | ) | 888 | |||||
|
|
|
|
|
|||||
| Total capitalization |
$ | 1,677 | $ | 2,091 | ||||
|
|
|
|
|
|||||
| (1) | Cash and cash equivalents consist of bank deposits, money market and other financial instruments with an initial maturity of three months or less. |
| (2) | The ABL Facility has total maximum borrowing availability of $270 million, subject to a borrowing base. See “Description of Indebtedness—ABL Facility.” |
| (3) | U.S. dollar equivalent of the issued Euro Notes, the value of which was fixed by the Court. |
38
Table of Contents
UNAUDITED PRO FORMA CONDENSED FINANCIAL INFORMATION
The following sets forth unaudited pro forma condensed financial information of the Company prepared in accordance with Article XI of Regulation S-X. You should read this information in conjunction with “Management’s Discussion and Analysis of Financial Condition and Results of Operations,” “Risk Factors,” “Capitalization,” “Selected Historical Financial Data” and MPM’s consolidated financial statements and related notes and other financial information included elsewhere in this prospectus. The unaudited pro forma condensed financial information is based on and has been derived from MPM’s historical audited and unaudited consolidated financial statements included elsewhere in this prospectus.
The unaudited pro forma condensed consolidated statements of operations for the nine months ended September 30, 2014 and the year ended December 31, 2013 gives pro forma effect to the following events as if they occurred on January 1, 2013:
| • | the consummation of the Plan of Reorganization; |
| • | the adoption of fresh start reporting; and |
| • | accounting policy changes that management elected to adopt in conjunction with fresh start reporting. |
The unaudited condensed consolidated pro forma balance sheet as of September 30, 2014 gives effect to the consummation of the Plan of Reorganization and the adoption of fresh start reporting as if they occurred on September 30, 2014.
Pro forma adjustments for the Plan of Reorganization for the nine months ended September 30, 2014 and the year ended December 31, 2013 were made to reflect 1) the estimated effect of the consummation of the transactions contemplated by the Plan of Reorganization, including the issuance of the new debt and 2) the removal of Reorganization items, net which were directly attributable to MPM’s Chapter 11 proceedings and not expected to have a continuing effect on the results of operations.
Pro forma adjustments for fresh start accounting for the nine months ended September 30, 2014 and the year ended December 31, 2013 were made to reflect the depreciation and amortization adjustments related to the fair value adjustments that were made to allocate the reorganization value to the individual assets based on their estimated fair values. These adjustments reflect preliminary estimates, and actual amounts to be recorded as of the Effective Date may be materially different from these estimates.
The unaudited pro forma condensed financial information includes unaudited pro forma adjustments that are factually supportable and directly attributable to the respective transactions. In addition, with respect to the unaudited pro forma condensed statements of operations, the unaudited pro forma adjustments are expected to have a continuing impact on the Company’s results. The unaudited pro forma condensed consolidated balance sheet includes reorganization and fresh start accounting adjustments which will not have a continuing impact on the Company’s future results. The unaudited pro forma condensed consolidated financial information has been prepared by management for illustrative purposes only and does not purport to represent what the results of operations or financial condition would have been had the respective transactions actually occurred on the dates indicated, nor do they purport to project the results of operations or financial condition for any future period or as of any future date.
Historical basic and diluted loss per share is calculated based on weighted average common shares outstanding of MPM. Pro forma basic and diluted loss per share is calculated based on weighted average common shares outstanding of the Company.
39
Table of Contents
MPM Holdings Inc.
Unaudited Pro Forma Condensed Consolidated Statement of Operations
For the Nine Months Ended September 30, 2014
| Actual | Adjustments | Pro Forma | ||||||||||||||||||
| (in millions, except share and per share data) | Nine
Months Ended September 30, 2014 |
Reorganization (1) | Accounting Policy Changes (2) |
Fresh Start (3) |
||||||||||||||||
| Net sales |
$ | 1,873 | $ | — | $ | — | $ | — | $ | 1,873 | ||||||||||
| Cost of goods sold |
1,546 | (a)(b) | (33 | )(a) | 1,513 | |||||||||||||||
| Cost of sales, excluding depreciation and amortization |
1,339 | — | (1,339 | )(a) | — | — | ||||||||||||||
| Selling, general and administrative expense |
417 | — | (48 | )(a) | (23 | )(b) | 346 | |||||||||||||
| Depreciation and amortization expense |
137 | — | (137 | )(a) | — | — | ||||||||||||||
| Research and development expense |
58 | — | — | — | 58 | |||||||||||||||
| Restructuring and other costs |
20 | — | — | — | 20 | |||||||||||||||
|
|
|
|
|
|
|
|
|
|
|
|||||||||||
| Operating (loss) income |
(98 | ) | — | (22 | ) | 56 | (64 | ) | ||||||||||||
| Interest expense, net |
153 | (94 | )(a) | — | — | 59 | ||||||||||||||
| Reorganization items, net |
114 | (114 | )(b) | — | — | — | ||||||||||||||
|
|
|
|
|
|
|
|
|
|
|
|||||||||||
| (Loss) income before income tax and earnings from unconsolidated entities |
(365 | ) | 208 | (22 | ) | 56 | (123 | ) | ||||||||||||
| Income tax (benefit) expense |
(2 | ) | (59 | ) | (9 | )(c) | 21 | (c) | (49 | ) | ||||||||||
|
|
|
|
|
|
|
|
|
|
|
|||||||||||
| (Loss) income from before earnings from unconsolidated entities |
(363 | ) | 267 | (13 | ) | 35 | (74 | ) | ||||||||||||
| Earnings from unconsolidated entities, net of taxes |
2 | — | — | — | 2 | |||||||||||||||
|
|
|
|
|
|
|
|
|
|
|
|||||||||||
| Net (loss) income |
$ | (361 | ) | $ | 267 | $ | (13 | ) | $ | 35 | $ | (72 | ) | |||||||
|
|
|
|
|
|
|
|
|
|
|
|||||||||||
| Weighted average common shares outstanding—basic and diluted |
100 | 47,989,000 | ||||||||||||||||||
| Loss per share—basic and diluted |
$ | (3,610,000 | ) | $ | (1.50 | ) | ||||||||||||||
See Notes to Unaudited Pro Forma Condensed Statement of Operations
40
Table of Contents
MPM Holdings Inc.
Unaudited Pro Forma Condensed Consolidated Statement of Operations
For the Year Ended December 31, 2013
| Actual | Adjustments | Pro Forma | ||||||||||||||||||
| (in millions, except share and per share data) | Year Ended December 31, 2013 |
Reorganization(1) | Accounting Policy Changes(2) |
Fresh Start(3) | ||||||||||||||||
| Net sales |
$ | 2,398 | $ | — | $ | — | $ | — | $ | 2,398 | ||||||||||
| Cost of goods sold |
1,940 | (a)(b) | (36 | )(a) | 1,904 | |||||||||||||||
| Cost of sales, excluding depreciation and amortization |
1,732 | — | (1,732 | )(a) | — | — | ||||||||||||||
| Selling, general and administrative expense |
373 | — | (76 | )(a) | (27 | )(b) | 270 | |||||||||||||
| Depreciation and amortization expense |
171 | — | (171 | )(a) | — | — | ||||||||||||||
| Research and development expense |
70 | — | — | — | 70 | |||||||||||||||
| Restructuring and other costs |
21 | — | — | — | 21 | |||||||||||||||
|
|
|
|
|
|
|
|
|
|
|
|||||||||||
| Operating income |
31 | — | 39 | 63 | 133 | |||||||||||||||
| Interest expense, net |
394 | (314 | )(a) | — | — | 80 | ||||||||||||||
|
|
|
|
|
|
|
|
|
|
|
|||||||||||
| (Loss) income before income tax and earnings from unconsolidated entities |
(363 | ) | 314 | 39 | 63 | 53 | ||||||||||||||
| Income tax expense |
104 | (18 | )(c) | 16 | (c) | 24 | (c) | 126 | ||||||||||||
|
|
|
|
|
|
|
|
|
|
|
|||||||||||
| (Loss) income before earnings from unconsolidated entities |
(467 | ) | 332 | 23 | 39 | (73 | ) | |||||||||||||
| Earnings from unconsolidated entities, net of taxes |
3 | — | — | — | 3 | |||||||||||||||
|
|
|
|
|
|
|
|
|
|
|
|||||||||||
| Net (loss) income |
$ | (464 | ) | $ | 332 | $ | 23 | $ | 39 | $ | (70 | ) | ||||||||
|
|
|
|
|
|
|
|
|
|
|
|||||||||||
| Weighted average common shares outstanding—basic and diluted |
100 | 47,989,000 | ||||||||||||||||||
| Loss per share—basic and diluted |
$ | (4,640,000 | ) | $ | (1.46 | ) | ||||||||||||||
See Notes to Unaudited Pro Forma Condensed Statement of Operations
41
Table of Contents
Notes to Unaudited Pro Forma Condensed Consolidated Statements of Operations
(dollars in millions)
| (1) | Reflects the following adjustments to record the pro forma effects of the consummation of the Plan of Reorganization: |
| (a) | Reflects the change in net interest expense related to the new debt and the settlement of existing debt as part of the Plan of Reorganization: |
| Nine Months Ended September 30, 2014 |
Year Ended December 31, 2013 |
|||||||
| Newly issued debt: |
||||||||
| 3.88% First Lien Notes due 2021 |
$ | 32 | $ | 42 | ||||
| 4.69% Second Lien Notes due 2022 |
9 | 12 | ||||||
| Existing debt: |
||||||||
| China bank loans |
2 | 4 | ||||||
| Amortization of debt discount |
16 | 22 | ||||||
|
|
|
|
|
|||||
| Total |
59 | 80 | ||||||
| Historic interest expense |
(153 | ) | (313 | ) | ||||
| Historic write off of deferred debt issuance costs and discount |
— | (81 | ) | |||||
|
|
|
|
|
|||||
| Net pro forma change in interest |
$ | (94 | ) | $ | (314 | ) | ||
|
|
|
|
|
|||||
| (b) | Reflects an adjustment to remove Reorganization items, net of $114 included in MPM’s unaudited Condensed Consolidated Statement of Operations for the nine months ended September 30, 2014, which were directly attributable to MPM’s Chapter 11 bankruptcy proceedings. |
| (c) | The income tax impact was calculated by applying the weighted average tax rate to the pre-tax pro forma adjustments in addition to the benefit of current tax losses previously subject to valuation allowance. The weighted average tax rate was calculated by applying the appropriate statutory tax rate of the respective tax jurisdictions to which the pro forma adjustments relate and which are reasonably expected to occur. There is no net income tax impact calculated for the reorganization items as these changes are being treated as non-deductible for federal income tax purposes. |
| (2) (a) | As a result of the adoption of fresh start accounting upon MPM’s emergence from Chapter 11, management elected to change its accounting policy related to its income statement presentation of costs of goods sold. As a result, the Depreciation and amortization expense caption has been eliminated and the related expense has been allocated to Cost of goods sold and Selling general and administrative expense. |
| (b) | As a result of the adoption of fresh start accounting upon MPM’s emergence from Chapter 11, management elected to change its accounting policy related to the recognition of actuarial gains and losses and prior service costs resulting from plan amendments for defined benefit plans. Specifically, such actuarial gains and losses and prior service costs previously recognized as a component of other comprehensive income/(loss) in the historical balance sheet will be recognized directly as a component of earnings under the new policy. As a result, adjustments herein reflect $(22) and $39 previously recognized as a component of comprehensive income during the nine months ended September 30, 2014 and the year ended December 31, 2013, respectively. |
| (c) | The income tax impact was calculated by applying the weighted average tax rate to the pre-tax pro forma adjustments. The weighted average tax rate was calculated by applying the appropriate statutory tax rate of the respective tax jurisdictions to which the pro forma adjustments relate and which are reasonably expected to occur. |
42
Table of Contents
| (3) | Reflects the following adjustments to record the pro forma effects of fresh start accounting adjustments related to the Reorganization: |
| (a) | Reflects a net decrease in depreciation expense resulting from the estimated fair value adjustments to certain property and equipment and adjustments to the estimated useful lives of the assets. Also reflects a net increase to amortization expense resulting from the estimated fair value adjustments made to certain amortizable intangible assets. |
| Depreciation/Amortization | ||||||||||||||||
| Weighted Average Useful Life (in years) |
Estimated Fair Value |
Nine Months Ended September 30, 2014 |
Year Ended December 31, 2013 |
|||||||||||||
| Depreciable tangible property |
14 | $ | 1,040 | $ | 38 | $ | 51 | |||||||||
| Amortizable intangible assets |
12 | 102 | 6 | 9 | ||||||||||||
|
|
|
|
|
|
|
|||||||||||
| Total long-lived assets |
$ | 1,142 | 44 | 60 | ||||||||||||
|
|
|
|||||||||||||||
| Historical depreciation & amortization |
(77 | ) | (96 | ) | ||||||||||||
|
|
|
|
|
|||||||||||||
| Net pro forma change in depreciation & amortization |
$ | (33 | ) | $ | (36 | ) | ||||||||||
|
|
|
|
|
|||||||||||||
| (b) | Reflects a net decrease in depreciation expense resulting from the estimated fair value adjustments to certain property and equipment and adjustments to the estimated useful lives of the. Also reflects a net decrease to amortization expense resulting from the estimated fair value adjustments made to certain amortizable intangible assets. |
| Depreciation/Amortization | ||||||||||||||||
| Weighted Average Useful Life (in years) |
Estimated Fair Value |
Nine Months Ended September 30, 2014 |
Year Ended December 31, 2013 |
|||||||||||||
| Depreciable tangible property |
14 | $ | 1,040 | $ | 18 | $ | 24 | |||||||||
| Amortizable intangible assets |
11 | 276 | 19 | 25 | ||||||||||||
|
|
|
|
|
|
|
|||||||||||
| Total long-lived assets |
$ | 1,316 | 37 | 49 | ||||||||||||
|
|
|
|||||||||||||||
| Historical depreciation & amortization |
(60 | ) | (76 | ) | ||||||||||||
|
|
|
|
|
|||||||||||||
| Net pro forma change in depreciation & amortization |
$ | (23 | ) | $ | (27 | ) | ||||||||||
|
|
|
|
|
|||||||||||||
| (c) | The income tax impact was calculated by applying the weighted average tax rate to the pre-tax pro forma adjustments. The weighted average tax rate was calculated by applying the appropriate statutory tax rate of the respective tax jurisdictions to which the pro forma adjustments relate and which are reasonably expected to occur. |
43
Table of Contents
MPM Holdings Inc.
Unaudited Pro Forma Condensed Consolidated Balance Sheet
September 30, 2014
| Actual | Adjustments | |||||||||||||||
| (in millions) | September 30, 2014 |
Reorganization(1) | Fresh Start(2) | Pro Forma | ||||||||||||
| Assets |
||||||||||||||||
| Current assets: |
||||||||||||||||
| Cash and cash equivalents |
$ | 139 | $ | 120 | (a) | $ | — | $ | 259 | |||||||
| Accounts receivable |
340 | — | — | 340 | ||||||||||||
| Inventories |
429 | — | 9 | (a) | 438 | |||||||||||
| Deferred income taxes |
5 | 75 | (b) | (3 | )(b) | 77 | ||||||||||
| Other current assets |
76 | — | — | 76 | ||||||||||||
|
|
|
|
|
|
|
|
|
|||||||||
| Total current assets |
989 | 195 | 6 | 1,190 | ||||||||||||
| Investment in unconsolidated entities |
10 | — | 8 | (c) | 18 | |||||||||||
| Deferred income taxes |
3 | 25 | (b) | 14 | (b) | 42 | ||||||||||
| Other long-term assets |
24 | 3 | (c) | — | 27 | |||||||||||
| Property and equipment, net |
872 | — | 246 | (d) | 1,118 | |||||||||||
| Goodwill |
362 | — | (73 | )(e) | 289 | |||||||||||
| Other intangible assets, net |
404 | — | 11 | (f) | 415 | |||||||||||
|
|
|
|
|
|
|
|
|
|||||||||
| Total assets |
$ | 2,664 | $ | 223 | $ | 212 | $ | 3,099 | ||||||||
|
|
|
|
|
|
|
|
|
|||||||||
| Liabilities and Deficit |
||||||||||||||||
| Current liabilities: |
||||||||||||||||
| Accounts payable |
$ | 222 | $ | 38 | (d) | $ | — | $ | 260 | |||||||
| Debt payable within one year |
1,770 | (1,733 | )(e) | — | 37 | |||||||||||
| Interest payable |
59 | (58 | )(f) | — | 1 | |||||||||||
| Income taxes payable |
6 | — | — | 6 | ||||||||||||
| Deferred income taxes |
13 | — | — | 13 | ||||||||||||
| Accrued payroll and incentive compensation |
44 | 12 | (g) | — | 56 | |||||||||||
| Other current liabilities |
96 | (25 | )(h) | — | 71 | |||||||||||
|
|
|
|
|
|
|
|
|
|||||||||
| Total current liabilities |
2,210 | (1,766 | ) | — | 444 | |||||||||||
| Long-term liabilities: |
||||||||||||||||
| Long-term debt |
7 | 1,159 | (i) | — | 1,166 | |||||||||||
| Pension and post employment benefit obligations |
134 | 164 | (j) | 45 | (g) | 343 | ||||||||||
| Deferred income taxes |
63 | (65 | )(k) | 190 | (h) | 188 | ||||||||||
| Other long-term liabilities |
51 | 8 | (l) | 11 | (i) | 70 | ||||||||||
| Liabilities subject to compromise |
2,026 | (2,026 | )(m) | — | — | |||||||||||
|
|
|
|
|
|
|
|
|
|||||||||
| Total liabilities |
4,491 | (2,526 | ) | 246 | 2,211 | |||||||||||
|
|
|
|
|
|
|
|
|
|||||||||
| (Deficit) Equity |
||||||||||||||||
| Common stock (Successor) |
— | — | (n) | — | — | |||||||||||
| Additional paid-in capital (Successor) |
— | 888 | (n) | — | 888 | |||||||||||
| Common stock (Predecessor) |
— | — | (o) | — | — | |||||||||||
| Additional paid-in capital (Predecessor) |
713 | (713 | )(o) | — | — | |||||||||||
| Accumulated other comprehensive income |
219 | — | (219 | )(j) | — | |||||||||||
| Accumulated deficit |
(2,759 | ) | 2,574 | (p) | 185 | (j) | — | |||||||||
|
|
|
|
|
|
|
|
|
|||||||||
| Total (deficit) equity |
(1,827 | ) | 2,749 | (34 | ) | 888 | ||||||||||
|
|
|
|
|
|
|
|
|
|||||||||
| Total liabilities and (deficit) equity |
$ | 2,664 | $ | 223 | $ | 212 | $ | 3,099 | ||||||||
|
|
|
|
|
|
|
|
|
|||||||||
See Notes to Unaudited Pro Forma Balance Sheet
44
Table of Contents
Notes to Unaudited Pro Forma Condensed Consolidated Balance Sheet
(dollars in millions)
Reorganization Adjustments
| (a) | Reflects the net cash received as of the Effective Date from implementation of the Plan of Reorganization: |
| Sources: |
||||
| Proceeds from the Rights Offerings |
$ | 600 | ||
| Uses: |
||||
| Claims paid at emergence |
(11 | ) | ||
| Repayment of DIP Term Loan |
(300 | ) | ||
| Repayment of DIP ABL Facility |
(63 | ) | ||
| Repayment of Cash Flow Facility |
(20 | ) | ||
| Other fees and expenses |
(86 | )* | ||
|
|
|
|||
| Total uses |
(480 | ) | ||
|
|
|
|||
| Net cash received |
$ | 120 | ||
|
|
|
|||
| * | Other fees and expenses primarily represent $58 of accrued and unpaid interest and $25 for emergence and success fees. A portion of the net cash received has been earmarked for future use and was not paid out on the Effective Date. |
| (b) | Represents the deferred tax asset impact of the reorganization adjustments, resulting from recognizing certain reorganization costs deductible in future periods. |
| (c) | Represents $3 of debt issuance costs incurred related to the issuance of replacement notes to holders of the First Lien Notes and Second Lien Notes. |
| (d) | Represents $38 of claims expected to be satisfied in cash that were reclassified from “Liabilities subject to compromise,” including $9 of success fees. |
| (e) | On the Effective Date, the Company repaid $300 in outstanding DIP Term Loans, $20 in outstanding borrowings under the Cash Flow Facility and $63 in outstanding borrowings under the DIP ABL Facility in full, and issued replacement notes to holders of the $1,100 in outstanding First Lien Notes due 2020 and $250 in outstanding Second Lien Notes due 2020 (which are classified as “Long-term debt”). The Company’s Senior Subordinated Notes were cancelled on account of the subordination provisions set forth in the indenture to the Senior Subordinated Notes. |
| (f) | On the Effective Date, the Company repaid $56 of accrued unpaid interest related to the First Lien Notes and the Second Lien Notes, as well as $2 of other accrued unpaid interest. |
| (g) | Represents $12 of accrued incentive compensation expected to be satisfied in cash that was reclassified from “Liabilities subject to compromise.” |
| (h) | Represents the reclassification of the BCA Commitment Premium of $30 to equity, partially offset by $5 of other current liabilities that were reclassified from “Liabilities subject to compromise”. |
| (i) | Represents the issuance of replacement notes to holders of the $1,100 in outstanding First Lien Notes due 2021 and $250 in outstanding Second Lien Notes due 2022. The replacement notes were recorded at estimated fair value, which was determined based on a market approach utilizing current market yields. |
| (j) | Represents $164 of pension and post employment benefit obligations that were reclassified from “Liabilities subject to compromise”. |
| (k) | Represents the deferred tax liability impact of the reorganization adjustments, resulting from the reduction in tax attributes upon emergence. |
| (l) | Represents $8 of other long-term liabilities that were reclassified from “Liabilities subject to compromise”. |
| (m) | Reflects the settlement of liabilities subject to compromise in accordance with the Plan of Reorganization. |
| (n) | Reflects the issuance of 47,989,000 shares of New Common Stock pursuant to the Rights Offerings, Second Lien Notes Equity Distribution and Backstop Commitment. |
| (o) | Reflects the cancellation of Predecessor Company equity to accumulated deficit. |
45
Table of Contents
| (p) | Reflects the cumulative impact of the reorganization adjustments discussed above: |
| Gain on settlement of LSTC |
$ | 1,679 | ||
| Fair value adjustments to debt |
191 | |||
| Success fees accrued at emergence |
(9 | ) | ||
|
|
|
|||
| Net gain on reorganization adjustments |
1,861 | |||
| Cancellation of Predecessor Company equity |
713 | |||
|
|
|
|||
| Net impact to Accumulated deficit |
$ | 2,574 | ||
|
|
|
Fresh Start Adjustments
| (a) | Reflects the adjustments made to record inventories at their estimated fair value, which were determined based upon their estimated net realizable values. |
| (b) | Represents the deferred tax asset impact of the fresh start adjustments, resulting from the recognition of deductible goodwill in foreign jurisdictions. |
| (c) | Reflects the adjustment made to record the Company’s ownership interest in Zhejiang Xinan Momentive Performance Materials Co., Ltd, a joint venture in China which manufactures siloxane, at its estimated fair value. |
| (d) | Reflects the adjustments made to record property, plant and equipment at its estimated fair value. Depreciable lives were also revised to reflect the remaining estimated useful lives of the related property, plant and equipment which range from 11 to 26 years. |
| (e) | Reflects the adjustments made to record the elimination of the Predecessor goodwill balance of $362 and to record Successor goodwill of $289, which represents the reorganizational value of assets in excess of amounts allocated to identified tangible and intangible assets. |
| (f) | Reflects the adjustments made to write-off Predecessor other intangible assets of $404 and to record $415 in estimated fair value of Successor other intangible assets using estimated useful lives which range from 7 to 13 years. Fair value was comprised of the following: |
| i) | Trademarks of $68, which were valued using the relief from royalty income approach; |
| ii) | Technology based intangible assets of $102, which were valued using the relief from royalty income approach; |
| iii) | Customer related intangible assets of $208, which were valued using the multi-period excess earnings income approach; and |
| iv) | In-process research and development of $37, which was valued using the cost approach. |
| (g) | Reflects the adjustment made to remeasure pension and post employment benefit obligations, which was determined based upon assumptions related to discount rates and expected return on assets, as well as certain other assumptions related to demographic factors. |
| (h) | Represents the deferred tax liability impact of the fresh start adjustments, resulting from the reduction in tax basis of depreciable and amortizable assets. |
| (i) | Primarily reflects the adjustment made to record certain environmental liabilities and unfavorable contracts at estimated fair value. |
| (j) | Reflects the cumulative impact of the fresh start accounting adjustments discussed above and the elimination of the Predecessor Company’s accumulated other comprehensive income: |
| Establishment of Successor goodwill |
$ | 289 | ||
| Elimination of Predecessor goodwill |
(362 | ) | ||
| Establishment of Successor other intangible assets |
415 | |||
| Elimination of Predecessor other intangible assets |
(404 | ) | ||
| Inventory fair value adjustment |
9 | |||
| Property, plant and equipment fair value adjustment |
246 | |||
| Pension and post employment obligations remeasurement adjustment |
(45 | ) | ||
| Other assets and liabilities fair value adjustment |
(3 | ) | ||
|
|
|
|||
| Net gain on fresh start adjustments |
145 | |||
| Tax impact on fresh start adjustments |
(179 | ) | ||
| Elimination of Predecessor Company accumulated other comprehensive income |
219 | |||
|
|
|
|||
| Net impact on accumulated deficit |
$ | 185 | ||
|
|
|
46
Table of Contents
SELECTED HISTORICAL CONSOLIDATED FINANCIAL DATA OF MPM
The following table presents MPM’s summary historical financial information as of and for the periods presented. Prior to the Emergence Date, MPM Holdings had not conducted any business operations. Accordingly, unless otherwise noted or suggested by context, all financial information and data and accompanying financial statements and corresponding notes, as of and prior to the Emergence Date, as contained in this prospectus, reflect the actual historical consolidated results of operations and financial condition of MPM for the periods presented and do not give effect to the Plan of Reorganization or any of the transactions contemplated thereby or the adoption of “fresh-start” accounting.
The selected historical consolidated financial data as of December 31, 2013, and 2012 and for the fiscal years ended December 31, 2013, 2012, and 2011 have been derived from the audited consolidated financial statements of MPM, included elsewhere in this prospectus.
The financial data as of December 31, 2011, 2010 and 2009 and for the fiscal years ended December 31, 2010 and 2009 have been derived from our audited consolidated financial statements and related notes thereto.
The selected historical financial data as of September 30, 2014 and for the nine-month periods ended September 30, 2014 and 2013 have been derived from the unaudited condensed consolidated financial statements of the Company, included elsewhere in this prospectus. In the opinion of management, all adjustments consisting of normal recurring accruals considered necessary for a fair presentation have been included.
You should read the following selected historical financial data in conjunction with “Management’s Discussion and Analysis of Financial Condition and Results of Operations,” “Risk Factors” and our consolidated financial statements and related notes and other financial information included elsewhere in this prospectus.
47
Table of Contents
You should read the following selected historical financial data in conjunction with “Management’s Discussion and Analysis of Financial Condition and Results of Operations,” “Risk Factors” and our consolidated financial statements and related notes and other financial information included elsewhere in this prospectus.
| Nine-month period ended | Year ended December 31, | |||||||||||||||||||||||||||
| (dollars in millions, except per share data) | September 30, 2014 |
September 30, 2013 |
2013 | 2012 | 2011 | 2010 | 2009 | |||||||||||||||||||||
| Statements of Operations Data: |
||||||||||||||||||||||||||||
| Net sales |
$ | 1,873 | $ | 1,784 | $ | 2,398 | $ | 2,357 | $ | 2,637 | $ | 2,588 | $ | 2,083 | ||||||||||||||
| Costs and expenses: |
||||||||||||||||||||||||||||
| Cost of sales, excluding depreciation and amortization |
1,339 | 1,277 | 1,732 | 1,705 | 1,798 | 1,645 | 1,420 | |||||||||||||||||||||
| Selling, general and administrative expense |
417 | 276 | 373 | 392 | 389 | 388 | 346 | |||||||||||||||||||||
| Depreciation and amortization expense |
137 | 129 | 171 | 187 | 197 | 197 | 191 | |||||||||||||||||||||
| Research and development expense |
58 | 51 | 70 | 69 | 78 | 73 | 63 | |||||||||||||||||||||
| Restructuring and other costs |
20 | 17 | 21 | 43 | 33 | 23 | 23 | |||||||||||||||||||||
|
|
|
|
|
|
|
|
|
|
|
|
|
|
|
|||||||||||||||
| Operating (loss) income |
(98 | ) | 34 | 31 | (39 | ) | 142 | 262 | 40 | |||||||||||||||||||
| Other expense (income): |
||||||||||||||||||||||||||||
| Interest expense, net |
153 | 234 | 394 | 277 | 256 | 249 | 258 | |||||||||||||||||||||
| Other non-operating income, net |
— | — | — | (11 | ) | — | — | (12 | ) | |||||||||||||||||||
| Loss (gain) on extinguishment and exchange of debt |
— | — | — | 57 | (7 | ) | 78 | (179 | ) | |||||||||||||||||||
| Reorganization items, net |
114 | — | — | — | — | — | — | |||||||||||||||||||||
|
|
|
|
|
|
|
|
|
|
|
|
|
|
|
|||||||||||||||
| Loss before income taxes and earnings (losses) from unconsolidated entities |
(365 | ) | (200 | ) | (363 | ) | (362 | ) | (107 | ) | (65 | ) | (27 | ) | ||||||||||||||
| Income tax (benefit) expense |
(2 | ) | — | 104 | 8 | 27 | (2 | ) | 15 | |||||||||||||||||||
|
|
|
|
|
|
|
|
|
|
|
|
|
|
|
|||||||||||||||
| Loss before earnings (losses) from unconsolidated entities |
(363 | ) | (200 | ) | (467 | ) | (370 | ) | (134 | ) | (63 | ) | (42 | ) | ||||||||||||||
| Earnings (losses) from unconsolidated entities, net of taxes |
2 | 2 | 3 | 5 | (6 | ) | — | — | ||||||||||||||||||||
|
|
|
|
|
|
|
|
|
|
|
|
|
|
|
|||||||||||||||
| Net loss |
(361 | ) | (198 | ) | (464 | ) | (365 | ) | (140 | ) | (63 | ) | (42 | ) | ||||||||||||||
| Net income attributable to noncontrolling interest |
— | — | — | — | (1 | ) | (1 | ) | — | |||||||||||||||||||
|
|
|
|
|
|
|
|
|
|
|
|
|
|
|
|||||||||||||||
| Net loss income attributable to Momentive Performance Materials Inc. |
$ | (361 | ) | $ | (198 | ) | $ | (464 | ) | $ | (365 | ) | $ | (141 | ) | $ | (64 | ) | $ | (42 | ) | |||||||
|
|
|
|
|
|
|
|
|
|
|
|
|
|
|
|||||||||||||||
| Loss per share, basic and diluted |
$ | (3,610,000 | ) | $ | (1,980,000 | ) | $ | (4,640,000 | ) | $ | (3,650,000 | ) | $ | (1,410,000 | ) | $ | (640,000 | ) | $ | (420,000 | ) | |||||||
| Dividends declared per common share |
$ | — | $ | 4,600 | $ | 4,600 | $ | 3,185 | $ | 7,500 | $ | 12,500 | $ | — | ||||||||||||||
| Balance Sheet Data (at period end): |
||||||||||||||||||||||||||||
| Cash and cash equivalents |
$ | 139 | $ | 94 | $ | 110 | $ | 199 | $ | 250 | $ | 207 | ||||||||||||||||
| Working capital(1) |
1 | 192 | 290 | 378 | 493 | 388 | ||||||||||||||||||||||
| Total assets |
2,664 | 2,694 | 2,904 | 3,161 | 3,288 | 3,304 | ||||||||||||||||||||||
| Total long-term debt(2) |
3,084 | 3,083 | 3,081 | 2,895 | 2,952 | 2,955 | ||||||||||||||||||||||
| Total net debt(3) |
3,365 | 3,163 | 3,006 | 2,735 | 2,729 | 2,847 | ||||||||||||||||||||||
| Total liabilities |
4,491 | 4,174 | 4,052 | 3,901 | 3,896 | 3,855 | ||||||||||||||||||||||
| Total deficit |
(1,827 | ) | (1,480 | ) | (1,148 | ) | (736 | ) | (604 | ) | (578 | ) | ||||||||||||||||
| Cash Flow provided by (used in): |
||||||||||||||||||||||||||||
| Operating activities |
$ | (125 | ) | $ | (129 | ) | $ | (150 | ) | $ | (95 | ) | $ | 106 | $ | 253 | $ | 27 | ||||||||||
| Investing activities |
(9 | ) | (63 | ) | (88 | ) | (102 | ) | (120 | ) | (95 | ) | (85 | ) | ||||||||||||||
| Financing activities |
184 | 176 | 220 | 111 | (41 | ) | (112 | ) | (66 | ) | ||||||||||||||||||
| Other Financial Data: |
||||||||||||||||||||||||||||
| Capital expenditures(4) |
$ | 53 | $ | 51 | $ | 91 | $ | 98 | $ | 116 | $ | 95 | $ | 77 | ||||||||||||||
| (1) | Working capital is defined as current assets net of current liabilities. In order to make period to period comparisons more meaningful, solely for the purposes of the summary historical financial information and not in the audited and unaudited financial statements, certain current and long-term liabilities were reclassified for the working capital calculation as of September 30, 2014 and as of December 31, 2013. Specifically, as of September 30, 2014 and as of December 31, 2013, Debt payable within one year of $1,350 million and $3,076 million, respectively, has been reclassified as long-term debt. In addition, as of September 30, 2014, $128 million has been reclassified from liabilities subject to compromise to current liabilities. The presentation is a non-GAAP measure. |
| (2) | In order to make period to period comparisons more meaningful, solely for the purposes of the summary historical financial information and not in the audited and unaudited financial statements, certain current and long-term liabilities were reclassified as of September 30, 2014 and as of December 31, 2013. Specifically, as of September 30, 2014 and as of December 31, 2013, Debt payable within one year of $1,350 million and $3,076 million, respectively, has been reclassified as long-term debt. The presentation is a non-GAAP measure. |
| (3) | Total net debt is defined as long-term debt plus short-term debt less cash and cash equivalents. |
| (4) | Capital expenditures are presented on an accrual basis. |
48
Table of Contents
MANAGEMENT’S DISCUSSION AND ANALYSIS OF FINANCIAL
CONDITION AND RESULTS OF OPERATIONS
You should read the following discussion and analysis of our financial condition as of December 31, 2013 and 2012 and for the years ended December 31, 2013, 2012 and 2011 with the audited consolidated financial statements and related notes, and for the nine-month periods ended September 30, 2014 and 2013 with the unaudited condensed consolidated financial statements and related notes, each included elsewhere herein. The following discussion and analysis contains forward-looking statements that reflect our plans, estimates and beliefs, and which involve numerous risks and uncertainties, including, but not limited to, the risks and uncertainties described in “Risk Factors.” Actual results may differ materially from those contained in any forward-looking statements. See “Forward-Looking and Cautionary Statements.” We refer to Momentive Performance Materials Inc. herein as “we,” “us,” “our,” “MPM” or the “Company.”
Overview and Outlook
We believe we are one of the world’s largest producers of silicones and silicone derivatives and a global leader in the development and manufacture of products derived from quartz and specialty ceramics. Silicones are a multi-functional family of materials used in a wide variety of products and serve as a critical ingredient in many construction, transportation, healthcare, personal care, electronic, consumer and agricultural uses. Silicones are generally used as an additive to a wide variety of end products in order to provide or enhance certain of their attributes, such as resistance (heat, ultraviolet light and chemical), lubrication, adhesion or viscosity. Some of the most well-known end-use product applications include bath and shower caulk, pressure-sensitive adhesive labels, foam products, cosmetics and tires. Due to the versatility and high-performance characteristics of silicones, they are increasingly being used as a substitute for other materials. Our Quartz business manufactures quartz, specialty ceramics and crystal products for use in a number of high-technology industries, which typically require products made to precise specifications. The cost of our products typically represents a small percentage of the overall cost of our customers’ products.
We serve more than 4,500 customers between our Silicones and Quartz businesses in over 100 countries. Our customers include leading companies in their respective industries, such as Procter & Gamble, Avery, Continental Tire, Saint Gobain, Unilever, BASF, The Home Depot and Lowe’s.
Emergence from Chapter 11 Proceedings
On October 24, 2014 (the “Effective Date”), the Plan of Reorganization became effective and the Debtors emerged from the Chapter 11 proceedings.
On or following the Effective Date, and pursuant to the terms of the Plan of Reorganization, the following occurred or is in the process of occurring:
| • | payment in full in cash to general unsecured creditors (including trade creditors) and holders of claims arising from the Cash Flow Facility and the DIP Term Loan Facility; |
| • | conversion of our then-existing asset based revolving facility into the ABL Facility; |
| • | issuance of the First Lien Notes and Second Lien Notes to holders of the Old First Lien Notes and Old Secured Notes, respectively, and the cancellation of the Old First Lien Notes and the Old Secured Notes; |
| • | conversion of the Old Second Lien Notes into the new equity of post-Emergence Date MPM (resulting in the issuance of 11,791,126 shares of post-Emergence Date MPM common stock), subject to dilution by the management incentive plan and common stock issued in the rights offerings; |
| • | issuance of 36,197,874 shares of post-Emergence Date MPM common stock (including shares issued in connection with the Backstop Commitment) resulting from the exercise of subscription rights issued to holders of the Old Second Lien Notes in the $600 million rights offerings and the “commitment premium” paid in shares to the backstop parties in respect of their backstop commitment; |
49
Table of Contents
| • | exchange of all shares of post-Emergence Date MPM common stock for common stock of MPM Holdings and the contribution by MPM Holdings of all shares of the post-Emergence Date MPM common stock to its wholly-owned subsidiary, MPM Intermediate Holdings Inc., a result of which MPM became a wholly owned subsidiary of MPM Intermediate Holdings Inc.; |
| • | cancellation of the equity of pre-Emergence Date MPM; |
| • | cancellation of the Senior Subordinated Notes; |
| • | a recovery to the holders of Old MPM Holdings’ PIK Notes in the amount of the cash available at Old MPM Holdings as of the Emergence Date, after taking into account administrative expenses; and |
| • | appointment of a new chief executive officer, chief financial officer and general counsel. |
Shared Services Agreement
In October 2010, we entered into a shared services agreement with Hexion (which, from October 1, 2010 through October 24, 2014, was a subsidiary under a common parent) (the “Shared Services Agreement”), pursuant to which we provide to Hexion, and Hexion provides to us, certain services, including, but not limited to, executive and senior management, administrative support, human resources, information technology support, accounting, finance, technology development, legal and procurement services. The Shared Services Agreement is subject to termination by either the Company or Hexion, without cause, on not less than 30 days’ written notice, and expires in October 2015 (subject to one-year renewals every year thereafter; absent contrary notice from either party). The Shared Services Agreement establishes certain criteria upon which the costs of such services are allocated between us and Hexion and requires that the Steering Committee formed under the agreement meet no less than annually to evaluate and determine an equitable allocation percentage. The allocation percentage for 2014 remains unchanged from 2013, which was 57% for Hexion and 43% for us.
The Shared Services Agreement has resulted in significant synergies for us, including shared services and logistics optimization, best-of-source contractual terms, procurement savings, regional site rationalization and administrative and overhead savings. We projected achieving a total of approximately $65 million of cost savings in connection with the Shared Services Agreement, and through September 30, 2014, we have fully realized all of these savings. Despite the Bankruptcy Filing, the Shared Services Agreement has continued in effect along with the majority of the savings from these synergies. On the Emergence Date, the Shared Services Agreement was amended to, among other things, (i) exclude the services of certain executive officers, (ii) provide for a transition assistance period at the election of the recipient following termination of the Shared Services Agreement of up to 12 months, subject to one successive renewal period of an additional 60 days and (iii) provide for the use of an independent third-party audit firm to assist the Steering Committee with its annual review of billings and allocations.
Reportable Segments
Our businesses are based on the products that we offer and the markets that we serve. At September 30, 2014 and December 31, 2013, our businesses were managed as one reportable segment; however, given the differing technology and marketing strategies, we report the results for the Silicones and Quartz businesses separately.
The Company’s organizational structure continues to evolve. We are also continuing to refine our business and operating structure to better align our services to our customers and improve our cost position, while continuing to invest in global growth opportunities.
First Nine Months of 2014 Overview
| • | To address the risk of being able to continue as a going concern, we have undertaken steps to restructure our balance sheet and capital structure, and on October 24, 2014, we successfully emerged from the Chapter 11 proceedings. |
50
Table of Contents
| • | Net sales increased $89 million in the first nine months of 2014, as compared to the first nine months of 2013, primarily due to improved demand for our silicones products in the construction and automotive markets as a result of successful growth initiatives and economic improvement primarily in Europe, which was partially offset by decreased demand in the solar market. |
| • | Segment EBITDA decreased $9 million in the first nine months of 2014, as compared to the first nine months of 2013, due primarily to inflation in raw material costs, disruptions in certain plant operations, decreased demand in the solar market and challenges within our supply chain as a result of the Chapter 11 proceedings. These decreases were partially offset by the impact of the increase in net sales discussed above. |
| • | As of September 30, 2014, we have realized cumulative cost savings of $65 million as a result of the Shared Services Agreement with Hexion and $34 million in cost savings as a result of other initiatives. As of September 30, 2014, we have approximately $2 million of in-process cost savings in connection with other initiatives that we expect to achieve over the next 9 to 12 months. |
| • | Future growth initiatives include: |
| • | The expansion of our site in Termoli, Italy to add the capability to manufacture NXT* Silane, which is an innovative product used in the production of tires, and can offer tire manufacturers the ability to reduce rolling resistance without loss of wet traction, as well as deliver benefits in the tire manufacturing process. The site expansion will double our current NXT* Silane manufacturing capacity and is expected to be completed in late 2015. |
2013 Overview
| • | Net sales increased $41 million in 2013 compared to 2012, primarily due to improved demand for our silicones products in the North American market, partially offset by continued softness in the markets for semiconductor and solar related products. |
| • | Segment EBITDA increased $24 million in 2013 compared to 2012, primarily as a result of the successful implementation of growth, cost control and productivity initiatives. |
| • | During 2013, we realized approximately $9 million in cost savings as a result of the Shared Services Agreement with Hexion bringing our total realized savings under the agreement to $64 million. During 2013, we also realized approximately $16 million in cost savings as a result of other initiatives bringing our total realized savings under these initiatives to $31 million. As of December 31, 2013, we have approximately $1 million of in-process cost savings in connection with the Shared Services Agreement and approximately $5 million of in-process cost savings in connection with other initiatives that we expect to achieve over the next 12 to 15 months. |
| • | In May 2013, one of our subsidiaries entered into a new purchase and sale agreement with Asia Silicones Monomer Limited (“ASM”) in connection with the sale by an affiliate of GE of its equity interests in ASM. The new agreement provides us with a long-term supply of siloxane through 2026 and the option to extend such agreement through 2036. The agreement replaced and superseded (i) an off-take agreement with ASM, pursuant to which we sourced a portion of our siloxane, and (ii) a long-term supply agreement, pursuant to which GE and its affiliate ensured that we were provided with a minimum annual supply of siloxane from ASM or an alternative source in certain circumstances through December 2026. In connection with the foregoing transactions, our direct parent received a one-time payment of approximately $102 million from GE, which was subsequently contributed to us. |
| • | Also in May 2013, we entered into an amendment to the Trademark License Agreement, dated as of December 3, 2006, by and between GE Monogram Licensing International and us, to, among other things, revise the royalty payable to GE Monogram Licensing International and provide for an option to extend such agreement for an additional five-year period through 2023. In connection with the amendment, our direct parent recorded a gain and related intangible asset of $7 million, which was subsequently contributed to us. |
51
Table of Contents
Short-term Outlook
Our business is impacted by general economic and industrial conditions, including general industrial production, automotive builds, housing starts, construction activity, consumer spending and semiconductor capital equipment investment. Our business has both geographic and end market diversity which often reduces the impact of any one of these factors on our overall performance.
Due to continued worldwide economic volatility and uncertainty, the outlook for the remainder of 2014 for our business is difficult to predict. Although we expect certain global markets to begin to stabilize, a continued lack of consumer confidence and overcapacity in our industry could continue to negatively impact the results of both of our businesses. Overall we expect moderate increases in volumes during the remainder of 2014 as compared to 2013 due to expected growth within the construction and transportation markets.
We expect continued growth in demand in our specialty silicones businesses, particularly as we continue our investment in developing new products to support future growth. However, we expect continued softness in semiconductor and solar demand and further delay in recovery in these markets to adversely affect volumes in our Quartz business for the remainder of 2014 and into 2015. In addition, as we have emerged from Chapter 11 bankruptcy, we expect the related one-time impacts on our business to subside in 2015. We expect the increase in liquidity and lower debt service requirements resulting from our successful restructuring efforts to increase our future operational and financial flexibility. As a result, we will be well positioned to leverage our leadership positions, optimize our portfolio and drive new growth programs.
We are continuing to invest in growth opportunities in our higher-growth product lines and geographical regions, and will leverage the combination of our proprietary technologies, strategic investments in key assets and leading presence in high-growth end markets to benefit as the global economy recovers and for long-term success. We are also focused on gaining productivity efficiencies to reduce material costs and improve margins through investments in reliable and stable operations. We also continue to execute restructuring and cost reduction programs, with $2 million of in-process cost savings. We continue to evaluate additional actions, as well as productivity measures, that could lead to further savings. Such actions could result in more significant restructuring, exit and disposal costs and asset impairments in the future.
An additional economic recession or further postponement of the modest economic recovery could have an adverse impact on our business and results of operations. If global economic growth remains slow for an extended period of time or another economic recession occurs, the fair value of our reporting units and long-lived assets could be more adversely affected than we estimated in earlier periods. This may result in goodwill or other additional asset impairments beyond amounts that have already been recognized.
We expect long-term raw material cost fluctuations to continue because of price movements of key feedstocks. To help mitigate the fluctuations in raw material pricing, we have purchase and sale contracts and commercial arrangements with many of our vendors and customers that contain periodic price adjustment mechanisms. Due to differences in the timing of pricing mechanism trigger points between our sales and purchase contracts, there is often a lead-lag impact during which margins are negatively impacted in the short term when raw material prices increase and are positively impacted in the short term when raw material prices fall.
We remain optimistic about our position in the global markets when they recover to more stable conditions.
Matters Impacting Comparability of Results
Our Consolidated Financial Statements include the accounts of the Company, its majority-owned subsidiaries in which minority shareholders hold no substantive participating rights and variable interest entities in which we have a controlling financial interest. Intercompany accounts and transactions are eliminated in consolidation.
52
Table of Contents
Raw Materials
Raw materials comprised approximately 70% of our cost of sales, excluding depreciation and amortization in 2013. The largest raw material used in our Silicones business is silicon metal. The cost of silicon metal comprised approximately 22% of our total raw material costs in our Silicones’ manufacturing processes in 2013. The market price of silicon metal rose through 2010 and peaked in early 2011. Market prices declined steadily through 2011 and leveled out at the end of 2012. The extended economic slowdown and deteriorating conditions in the solar sector are adversely impacting this market, leading to favorable market prices during 2013, which slightly improved material margins. The largest raw material used in our Quartz business is a specific type of sand, which is currently available from a limited number of suppliers. Because Unimin controls a significant amount of the quartz sand market, it exercises significant control over quartz sand prices, which have been steadily increasing. Our long term purchase agreement with Unimin expired on December 31, 2012. We are currently negotiating the terms of a new long term supply agreement with Unimin and expect to enter into an agreement within the first quarter of 2015. Since the expiration of our agreement with Unimin, purchases from Unimin have been handled through purchase orders without disruption of supply to our Quartz business and we expect that process to continue if we are unable to enter into a new agreement. We also use other quartz sand sources around the world.
Other Comprehensive Income
Our other comprehensive income is significantly impacted by foreign currency translation and defined benefit pension and postretirement benefit adjustments. The impact of foreign currency translation is driven by the translation of assets and liabilities of our foreign subsidiaries which are denominated in functional currencies other than the U.S. dollar. The primary assets and liabilities driving the adjustments are cash and cash equivalents; accounts receivable; inventory; property, plant and equipment; goodwill and other intangible assets; accounts payable and pension and other postretirement benefit obligations. The primary currencies in which these assets and liabilities are denominated are the euro and Japanese yen. The impact of defined benefit pension and postretirement benefit adjustments is primarily driven by unrecognized actuarial gains and losses related to our defined benefit and other postretirement benefit plans, as well as the subsequent amortization of gains and losses from accumulated other comprehensive income in periods following the initial recording of such items. These actuarial gains and losses are determined using various assumptions, the most significant of which are (i) the weighted average rate used for discounting the liability, (ii) the weighted average expected long-term rate of return on pension plan assets, (iii) the weighted average rate of future salary increases and (iv) the anticipated mortality rate tables.
53
Table of Contents
Results of Operations
CONSOLIDATED STATEMENTS OF OPERATIONS
| Nine Months Ended September 30, |
Year Ended December 31, | |||||||||||||||||||
| (dollars in millions, except per share data) | 2014 | 2013 | 2013 | 2012 | 2011 | |||||||||||||||
| Net sales |
$ | 1,873 | $ | 1,784 | $ | 2,398 | $ | 2,357 | $ | 2,637 | ||||||||||
| Costs and expenses: |
||||||||||||||||||||
| Cost of sales, excluding depreciation and amortization |
1,339 | 1,277 | 1,732 | 1,705 | 1,798 | |||||||||||||||
| Selling, general and administrative expense |
417 | 276 | 373 | 392 | 389 | |||||||||||||||
| Depreciation and amortization expense |
137 | 129 | 171 | 187 | 197 | |||||||||||||||
| Research and development expense |
58 | 51 | 70 | 69 | 78 | |||||||||||||||
| Restructuring and other costs |
20 | 17 | 21 | 43 | 33 | |||||||||||||||
|
|
|
|
|
|
|
|
|
|
|
|||||||||||
| Operating (loss) income |
(98 | ) | 34 | 31 | (39 | ) | 142 | |||||||||||||
| Operating (loss) income as a percentage of net sales |
(5 | )% | 2 | % | 1 | % | (2 | )% | 5 | % | ||||||||||
| Interest expense, net |
153 | 234 | 394 | 277 | 256 | |||||||||||||||
| Other non-operating income, net |
— | — | — | (11 | ) | — | ||||||||||||||
| Loss (gain) on extinguishment and exchange of debt |
— | — | — | 57 | (7 | ) | ||||||||||||||
| Reorganization items, net |
114 | — | — | — | — | |||||||||||||||
|
|
|
|
|
|
|
|
|
|
|
|||||||||||
| Total non-operating expense |
267 | 234 | 394 | 323 | 249 | |||||||||||||||
|
|
|
|
|
|
|
|
|
|
|
|||||||||||
| Loss before income taxes and earnings (losses) from unconsolidated entities |
(365 | ) | (200 | ) | (363 | ) | (362 | ) | (107 | ) | ||||||||||
| Income tax (benefit) expense |
(2 | ) | — | 104 | 8 | 27 | ||||||||||||||
|
|
|
|
|
|
|
|
|
|
|
|||||||||||
| Loss before earnings (losses) from unconsolidated entities |
(363 | ) | (200 | ) | (467 | ) | (370 | ) | (134 | ) | ||||||||||
| Earnings (losses) from unconsolidated entities, net |
2 | 2 | 3 | 5 | (6 | ) | ||||||||||||||
| Net loss |
(361 | ) | (198 | ) | (464 | ) | (365 | ) | (140 | ) | ||||||||||
| Net income attributable to noncontrolling interest |
— | — | — | — | (1 | ) | ||||||||||||||
|
|
|
|
|
|
|
|
|
|
|
|||||||||||
| Net loss attributable to Momentive Performance Materials Inc. |
$ | (361 | ) | $ | (198 | ) | $ | (464 | ) | $ | (365 | ) | $ | (141 | ) | |||||
|
|
|
|
|
|
|
|
|
|
|
|||||||||||
| Other comprehensive income (loss) |
$ | 17 | $ | (32 | ) | $ | 22 | $ | (48 | ) | $ | 11 | ||||||||
|
|
|
|
|
|
|
|
|
|
|
|||||||||||
| Loss per share—basic and diluted |
$ | (3,610,000 | ) | $ | (1,980,000 | ) | $ | (4,640,000 | ) | $ | (3,650,000 | ) | $ | (1,410,000 | ) | |||||
54
Table of Contents
Net Sales
Net sales in the first nine months of 2014 increased $89 million, or 5%, compared to the first nine months of 2013. The increase was primarily due to an increase in volume of $56 million, an increase in price and mix shift of $29 million and favorable exchange rate fluctuations of $4 million. Net sales were positively impacted by improved demand for our silicones products in the construction and automotive markets as a result of successful growth initiatives and economic improvement, primarily in Europe, partially offset by decreased demand in the solar market.
In 2013, net sales increased by $41 million, or 2%, compared to 2012. Volume increases positively impacted net sales by $95 million, and were partially offset by unfavorable foreign exchange rate fluctuations of $36 million and a decrease in price and mix shift of $18 million. The volume increases were primarily driven by improved demand for our silicones products in construction, automotive and personal care applications as a result of successful growth initiatives and economic improvement primarily in the North American market.
In 2012, net sales decreased by $280 million, or 11%, compared to 2011. The decrease was primarily due to a decrease in price and mix shift of $154 million, a decrease in volume of $69 million and unfavorable exchange rate fluctuations of $57 million. Sales were negatively impacted by lower demand in the automotive, construction, electronics and industrial sectors, as well as by a downturn in demand for semiconductor related products.
Operating (Loss) Income
In the first nine months of 2014, operating income decreased $132 million, from income of $34 million to a loss of $98 million. Cost of sales, excluding depreciation increased by $62 million compared to the first nine months of 2013. Of the total increase in cost of sales, $39 million was due to the increase in volume discussed above. Cost of sales was also negatively impacted by $20 million unfavorable variances in raw materials and processing costs and $4 million of unfavorable exchange rate fluctuations. Selling, general and administrative expense and depreciation and amortization expense for the first nine months of 2014 increased by $149 million compared to the first nine months of 2013. The increase was primarily due to unrealized foreign currency losses of approximately $102 million related to certain intercompany arrangements for which we are no longer able to assert permanent reinvestment due to the substantial doubt about our ability to continue as a going concern for the next 12 months under our current capital structure, as well as $12 million of accelerated depreciation related to certain long-lived assets that were disposed of before the end of their estimated useful lives. Research and development expense for the first nine months of 2014 increased by $7 million compared to the first nine months of 2013 primarily related to timing of new projects. Restructuring and other costs for the first nine months of 2014 increased by $3 million compared to the first nine months of 2013. For the first nine months of 2014, these costs were primarily related to one-time charges for services and certain costs associated with restructuring our capital structure prior to the Bankruptcy Filing, partially offset by a gain related to a claim settlement. For the first nine months of 2013, these costs were primarily related to one-time expenses for services and integration costs.
In 2013, operating income increased $70 million, from a loss of $39 million to income of $31 million, compared to 2012. The increase was partially due to the $41 million increase in net sales discussed above. Cost of sales, excluding depreciation and amortization increased by $27 million, which was primarily due to the increase in volumes discussed above, and was partially offset by deflation in raw materials and processing costs of $40 million, as well as a positive impact from exchange rate fluctuations of $29 million. Selling, general and administrative and depreciation and amortization expense decreased by $35 million due to lower depreciation and amortization expense of $16 million and lower compensation and benefit expense as a result of reduced headcount from our restructuring programs, which was partially offset by unfavorable exchange rate fluctuations of $10 million. Research and development expense remained relatively flat compared to 2012. Restructuring and other costs decreased by $22 million primarily due to the wind-down of 2012 restructuring activities, which consisted of severance charges associated with workforce reductions and other one-time expenses for services and integration.
55
Table of Contents
In 2012, operating income decreased $181 million, from income of $142 million to a loss of $39 million, compared to 2011. The decrease was partially due to the $280 million decrease in net sales discussed above. Cost of sales, excluding depreciation and amortization decreased by $93 million, which was primarily due to favorable exchange rate fluctuations of $51 million, cost savings as a result of the Shared Services Agreement with Hexion and other initiatives of $31 million and the impact of lower sales, partially offset by inflation in raw material and processing costs of $41 million and lower factory leverage. Selling, general and administrative and depreciation and amortization expense decreased by $7 million compared to 2011. The decrease was primarily due to cost savings as a result of the Shared Services Agreement with Hexion of $15 million and lower depreciation and amortization expense, partially offset by inflation of $8 million. Research and development expense decreased by $9 million, which was primarily due to the timing of new projects. Restructuring and other costs increased by $10 million compared to 2011. In 2012, restructuring and other costs were comprised of restructuring related costs of $23 million and other costs of $20 million, which were primarily related to payments for services and integration costs. In 2011, restructuring and other costs were comprised of restructuring related costs of $8 million and other costs of $25 million, mainly consisting of costs related to the Momentive Combination (as defined below) and Shared Services Agreement and various debt restructuring activities.
Non-Operating Expense
In the first nine months of 2014, total non-operating expense increased by $33 million compared to the first nine months of 2013. The increase was driven by reorganization items, net of $114 million, which primarily consisted of professional fees related to the Bankruptcy Filing of $62 million, the $30 million BCA Commitment Premium and financing fees related to our DIP Facilities of $19 million, as well as other fees related to the Bankruptcy Filing of $3 million. These expenses were partially offset by a decrease in interest expense of $81 million, which was primarily due to ceasing interest accruals on the Debtor’s unsecured debt beginning in April 2014 as a result of the Bankruptcy Filing.
In 2013, total non-operating expense increased by $71 million compared to 2012, primarily due to an increase in interest expense of $117 million, which was driven by higher average outstanding debt balances and interest rates as a result of the refinancing transactions in April, May and October 2012, as well as the write off of $81 million in unamortized deferred debt issuance costs and $2 million in unamortized debt discount due to the reclassification of outstanding debt to current in the fourth quarter of 2013 as a result of the substantial doubt about our ability to continue as a going concern for the next twelve months, which would represent a covenant violation and would make the debt callable. These increases were partially offset by a $57 million loss on extinguishment of debt related to the debt refinancing transactions in 2012, which did not recur in 2013. Other non-operating income, net, decreased by $11 million as a result of a one-time gain recognized in 2012 from the sale of a building lease option to a third party as well as a one-time royalty payment received from our siloxane joint venture in China, neither of which recurred in 2013.
In 2012, total non-operating expense increased by $74 million compared to 2011, primarily due to a $57 million loss on extinguishment of debt recognized in 2012 related to the debt refinancing transactions in April, May and October 2012. In 2011, a $7 million gain on extinguishment of debt was recognized in connection with the repurchase of €17 million of 9.5% Second-Priority Springing Lien Notes. In 2012, interest expense increased $21 million due to higher average outstanding debt balances and interest rates as a result of the debt refinancing transactions in April, May and October 2012. Other non-operating income, net increased by $11 million as a result of a one-time gain recognized in 2012 from the sale of a building lease option to a third party as well as a one-time royalty payment received from our siloxane joint venture in China.
Income Tax (Benefit) Expense
The effective tax rate was 1% and 0% for the first nine months of 2014 and the first nine months of 2013, respectively. The change in the effective tax rate was primarily attributable to the amount and distribution of income and loss among the various jurisdictions in which we operate. The effective tax rates were also impacted by operating losses generated in jurisdictions where no tax benefit was recognized due to the maintenance of a full valuation allowance.
56
Table of Contents
For the first nine months of 2014, income taxes included favorable discrete tax adjustments of $9 million pertaining to unrealized losses on intercompany transactions and the resolution of certain tax matters in U.S. and non-U.S. jurisdictions. For the first nine months of 2013, income taxes included favorable discrete tax adjustments of $1 million pertaining to the resolution of certain tax matters in U.S. and non-U.S. jurisdictions.
We are recognizing the earnings of non-U.S. operations currently in our U.S. consolidated income tax return as of September 30, 2014, and are expecting that all earnings will be repatriated to the United States. We have accrued the incremental tax expense expected to be incurred upon the repatriation of these earnings.
In 2013, income tax expense increased by $96 million compared to 2012. The effective income tax rate was (29)% for 2013 compared to (2)% for 2012. The change in the effective tax rate in 2013 was primarily due to our inability to continue our permanent reinvestment assertion related to certain intercompany arrangements, the maintenance of a full valuation allowance against a substantial amount of our net deferred tax assets and the establishment of valuation allowances in certain non-U.S. jurisdictions. In addition, the foreign rate differential increased by $12 million due to changes in estimates of our uncertain tax positions and also by the geographic mix of earnings across several jurisdictions, which were offset against changes in valuation allowances described above. The valuation allowance, which relates principally to U.S. and certain non-U.S. deferred tax assets, was established and maintained based on our assessment that a portion of the deferred tax assets will likely not be realized. In 2013, a new valuation allowance of $20 million was established in certain non-U.S. jurisdictions based on the Company’s assessment that the net deferred tax assets will likely not be realized.
In 2012, income tax expense decreased by $19 million compared to 2011. The effective income tax rate was (2)% for 2012 compared to (25)% for 2011. In 2012, we established a new valuation allowance of $9 million in certain non-U.S. jurisdictions based on the Company’s assessment that the net deferred tax assets will likely not be realized. The change in the effective tax rate in 2012 was primarily due to the maintenance of a full valuation allowance against a substantial amount of our net deferred tax assets and the establishment of valuation allowances in certain non-U.S. jurisdictions. In addition, the change in effective tax rate was driven by a decrease in earnings across several foreign jurisdictions, which were offset against changes in valuation allowances described above, as well as a $4 million increase due to changes in tax rates applied to various jurisdictions in which we operate. The valuation allowance, which relates principally to U.S. and certain non-U.S. deferred tax assets, was established and maintained based on our assessment that a portion of the deferred tax assets will likely not be realized.
We are recognizing the earnings of non-U.S. operations currently in our U.S. consolidated income tax return as of September 30, 2014 and are expecting that all earnings will be repatriated to the United States. We have accrued the incremental tax expense expected to be incurred upon the repatriation of these earnings. In addition, we have certain intercompany arrangements that, if settled, may trigger taxable gains or losses based on foreign currency exchange rates in place at the time of settlement. As a result of the conditions related to our ability to continue as a going concern described above, in the fourth quarter of 2013, we are no longer able to assert permanent reinvestment with respect to certain intercompany arrangements previously considered indefinite, and are now recording deferred taxes on the foreign currency translation impact. This change in assertion resulted in a tax expense of $86 million in the period the change occurred.
Other Comprehensive Income (Loss)
For the first nine months of 2014, foreign currency translation positively impacted other comprehensive income by $38 million, primarily due to the impact of the strengthening of the U.S. dollar against the Japanese yen, particularly in the last month of the period, partially offset by the strengthening of the U.S. dollar against the euro. For the first nine months of 2014, pension and postretirement benefit adjustments negatively impacted other comprehensive income by $21 million, primarily due to unrecognized actuarial losses related to the remeasurement of the defined benefit pension obligations in conjunction with the ratification of a new collective bargaining agreement in August 2014.
57
Table of Contents
For the first nine months of 2013, foreign currency translation negatively impacted other comprehensive income by $44 million, primarily due to strengthening of the U.S. dollar against the Japanese yen and the euro. For the first nine months of 2013, pension and postretirement benefit adjustments positively impacted other comprehensive income by $12 million, primarily due to the recognition of a curtailment gain related to the remeasurement of the defined benefit pension obligation in conjunction with the ratification of a new collective bargaining agreement in July 2013, as well as the amortization of actuarial losses recorded in prior periods.
For the year ended December 31, 2013, foreign currency translation negatively impacted other comprehensive income by $6 million, primarily due to the strengthening of the U.S. dollar against the Japanese yen, partially offset by the weakening of the U.S. dollar against the euro. Additionally, for the year ended December 31, 2013, a tax benefit of $54 million was recognized in other comprehensive income related to a change in assertion with respect to certain intercompany arrangements, which were previously considered indefinite. For the year ended December 31, 2013, pension and postretirement benefit adjustments positively impacted other comprehensive income by $28 million, primarily due to unrecognized actuarial gains driven by an increase in the discount rate at December 31, 2013, favorable asset experience and the amortization of unrecognized actuarial losses recorded in prior periods.
For the year ended December 31, 2012, foreign currency translation negatively impacted other comprehensive loss by $29 million, primarily due to the strengthening of the U.S. dollar against the Japanese yen, partially offset by the weakening of the U.S. dollar against the euro. For the year ended December 31, 2012, pension and postretirement benefit adjustments negatively impacted other comprehensive loss by $19 million, primarily due to unrecognized actuarial losses driven by a decrease in the discount rate at December 31, 2012 and unfavorable asset experience. These decreases were partially offset by the positive impact of a curtailment gain recognized on domestic pension benefit plans.
For the year ended December 31, 2011, foreign currency translation positively impacted other comprehensive loss by $26 million, primarily due to the weakening of the U.S. dollar against the Japanese yen, partially offset by the strengthening of the U.S. dollar against the euro. For the year ended December 31, 2011, pension and postretirement benefit adjustments negatively impacted other comprehensive loss by $15 million, primarily due to unrecognized actuarial losses driven by a decrease in the discount rate at December 31, 2011 and unfavorable asset experience.
Results of Operations by Business
Following are net sales and Segment EBITDA by business. Segment EBITDA is defined as EBITDA (earnings before interest, income taxes, depreciation and amortization) adjusted for certain non-cash and certain other income and expenses. Segment EBITDA is the primary performance measure used by our senior management, the chief operating decision-maker and the Board of Directors to evaluate operating results and allocate capital resources among businesses. Segment EBITDA is also the profitability measure used to set management and executive incentive compensation goals.
| Nine Months Ended September 30, |
Year Ended December 31, | |||||||||||||||||||
| (dollars in millions) | 2014 | 2013 | 2013 | 2012 | 2011 | |||||||||||||||
| Net Sales(1): |
||||||||||||||||||||
| Silicones |
$ | 1,736 | $ | 1,636 | $ | 2,197 | $ | 2,136 | $ | 2,310 | ||||||||||
| Quartz |
137 | 148 | 201 | 221 | 327 | |||||||||||||||
|
|
|
|
|
|
|
|
|
|
|
|||||||||||
| Total |
$ | 1,873 | $ | 1,784 | $ | 2,398 | $ | 2,357 | $ | 2,637 | ||||||||||
|
|
|
|
|
|
|
|
|
|
|
|||||||||||
| Segment EBITDA: |
||||||||||||||||||||
| Silicones |
$ | 206 | $ | 193 | $ | 248 | $ | 206 | $ | 291 | ||||||||||
| Quartz |
19 | 27 | 37 | 44 | 101 | |||||||||||||||
| Other |
(48 | ) | (34 | ) | (47 | ) | (36 | ) | (13 | ) | ||||||||||
58
Table of Contents
| (1) | Inter-business sales are not significant and, as such, are eliminated within the selling business. |
Nine Months Ended September 30, 2014 vs. Nine Months Ended September 30, 2013 Business Results
Following is an analysis of the percentage change in sales by business from the nine months ended September 30, 2013 to the nine months ended September 30, 2014:
| Volume | Price/ Mix |
Currency Translation |
Total | |||||||||||||
| Silicones |
4 | % | 2 | % | — | % | 6 | % | ||||||||
| Quartz |
(8 | )% | — | % | 1 | % | (7 | )% | ||||||||
Silicones
Net sales in the first nine months of 2014 increased $100 million, or 6%, compared to the first nine months of 2013. The increase was primarily due to an increase in volume of $68 million and an increase in price and mix shift of $29 million, as well as favorable exchange rate fluctuations of $3 million. Net sales were positively impacted by improved demand for our silicones products in the construction and automotive markets as a result of successful growth initiatives and economic improvement, primarily in Europe.
Segment EBITDA in the first nine months of 2014 increased by $13 million to $206 million compared to the first nine months of 2013. The increase was due to the increase in net sales discussed above, and was partially offset by raw material inflation, disruptions in plant operations and incremental transportation costs due to adverse weather conditions in the first nine months of 2014, as well as the negative impact on our business resulting from the Chapter 11 proceedings.
Quartz
Net sales in the first nine months of 2014 decreased $11 million, or 7%, compared to the first nine months of 2013. The decrease was primarily due to a decrease in volumes of $12 million, and was partially offset by favorable exchange rate fluctuations of $1 million. Volume decreases were primarily due to decreased demand in the solar market
Segment EBITDA in the first nine months of 2014 decreased by $8 million to $19 million compared to the first nine months of 2013. The decrease was primarily due to the decrease in net sales discussed above, as well as decreased productivity in processing costs, and was partially offset by cost control and other operational efficiencies.
Other
Other is primarily general and administrative expenses that are not allocated to the businesses, such as shared service and administrative functions. Other charges increased by $14 million to $48 million compared to the first nine months of 2013 primarily due to higher compensation costs and costs to support initiatives in our information technology, human resources and environmental, health and safety functions.
2013 vs. 2012 Business Results
Following is an analysis of the percentage change in sales by business from 2012 to 2013:
| Volume | Price/ Mix |
Currency Translation |
Total | |||||||||||||
| Silicones |
5 | % | (1 | )% | (1 | )% | 3 | % | ||||||||
| Quartz |
(8 | )% | — | % | (1 | )% | (9 | )% | ||||||||
59
Table of Contents
Silicones
Net sales in 2013 increased $61 million, or 3%, compared to 2012. The increase was primarily due to an increase in volume of $112 million, partially offset by unfavorable exchange rate fluctuations of $33 million and a decrease in price and mix shift of $18 million. The volume increases were driven by the execution of growth initiatives primarily in the North American and Pacific markets, which contributed to increased demand for our products, primarily in construction, automotive and oil and gas applications.
Segment EBITDA in 2013 increased by $42 million to $248 million compared to 2012. The increase was primarily due to the increase in sales discussed above, as well as the impact of cost control and productivity initiatives.
Quartz
Net sales in 2013 decreased $20 million, or 9%, compared to 2012. The decrease was primarily due to lower volumes of $17 million reflecting a downturn in demand for semiconductor and solar related products, as well as unfavorable exchange rate fluctuations of $3 million.
Segment EBITDA in 2013 decreased by $7 million to $37 million compared to 2012. The decrease was primarily due to the decrease in sales discussed above as well as challenges in the solar and lighting markets.
Other
Other is primarily general and administrative expenses that are not allocated to the businesses, such as shared service and administrative functions. Other charges increased by $11 million to $47 million compared to 2012, primarily due to increased expenses that were not assessed to the businesses.
2012 vs 2011 Business Results
Following is an analysis of the percentage change in sales by business from 2011 to 2012:
| Volume | Price/ Mix |
Currency Translation |
Total | |||||||||||||
| Silicones |
1 | % | (7 | )% | (2 | )% | (8 | )% | ||||||||
| Quartz |
(31 | )% | — | % | (1 | )% | (32 | )% | ||||||||
Silicones
Net sales in 2012 decreased $174 million, or 8%, compared to 2011. The decrease was primarily due to a decrease in price and mix shift of $155 million and unfavorable exchange rate fluctuations of $54 million, partially offset by an increase in volume of $35 million. Sales in our Silicones business were negatively impacted by lower sales in the automotive, construction, electronics and industrial markets.
Segment EBITDA in 2012 decreased by $85 million to $206 million compared to 2011. The decrease was primarily due to the factors discussed above, partially offset by a royalty payment received from our siloxane joint venture in China and the earnings from our unconsolidated affiliates.
Quartz
Net sales in 2012 decreased $106 million, or 32%, compared to 2011. The decrease was primarily due to lower volumes reflecting a downturn in demand for semiconductor related products.
Segment EBITDA in 2012 decreased by $57 million to $44 million compared to 2011. The decrease was primarily due to the factors discussed above.
60
Table of Contents
Other
Other is primarily general and administrative expenses that are not allocated to the businesses, such as shared service and administrative functions. Other charges increased by $23 million to $36 million compared to 2011, primarily due to increased expenses that were not assessed to the businesses.
Reconciliation of Segment EBITDA to Net Loss:
| Nine Months Ended September 30, |
Year Ended December 31, | |||||||||||||||||||
| (dollars in millions) | 2014 | 2013 | 2013 | 2012 | 2011 | |||||||||||||||
| Segment EBITDA: |
||||||||||||||||||||
| Silicones |
$ | 206 | $ | 193 | $ | 248 | $ | 206 | $ | 291 | ||||||||||
| Quartz |
19 | 27 | 37 | 44 | 101 | |||||||||||||||
| Other |
(48 | ) | (34 | ) | (47 | ) | (36 | ) | (13 | ) | ||||||||||
| Reconciliation: |
||||||||||||||||||||
| Items not included in Segment EBITDA: |
||||||||||||||||||||
| Non-cash charges |
(116 | ) | (4 | ) | (12 | ) | (7 | ) | (14 | ) | ||||||||||
| Restructuring and other costs |
(20 | ) | (17 | ) | (21 | ) | (43 | ) | (33 | ) | ||||||||||
| Reorganization items, net |
(114 | ) | — | — | — | — | ||||||||||||||
|
|
|
|
|
|
|
|
|
|
|
|||||||||||
| Total adjustments |
(250 | ) | (21 | ) | (33 | ) | (50 | ) | (47 | ) | ||||||||||
| Interest expense, net |
(153 | ) | (234 | ) | (394 | ) | (277 | ) | (256 | ) | ||||||||||
| Income tax benefit (expense) |
2 | — | (104 | ) | (8 | ) | (27 | ) | ||||||||||||
| Depreciation and amortization |
(137 | ) | (129 | ) | (171 | ) | (187 | ) | (197 | ) | ||||||||||
| (Loss) gain on extinguishment and exchange of debt |
— | — | — | (57 | ) | 7 | ||||||||||||||
|
|
|
|
|
|
|
|
|
|
|
|||||||||||
| Net loss attributable to Momentive Performance |
(361 | ) | (198 | ) | (464 | ) | (365 | ) | (141 | ) | ||||||||||
| Net income attributable to noncontrolling interest |
— | — | — | — | 1 | |||||||||||||||
|
|
|
|
|
|
|
|
|
|
|
|||||||||||
| Net loss |
$ | (361 | ) | $ | (198 | ) | $ | (464 | ) | $ | (365 | ) | $ | (140 | ) | |||||
|
|
|
|
|
|
|
|
|
|
|
|||||||||||
Items Not Included in Segment EBITDA
Not included in Segment EBITDA are certain non-cash and other income and expenses. Non-cash charges primarily represent stock-based compensation expense, unrealized derivative and foreign exchange gains and losses and asset disposal gains and losses. Restructuring and other costs primarily include expenses from the Company’s restructuring and cost optimization programs and management fees paid to its owner. For the nine months ended September 30, 2014, non-cash charges primarily included net unrealized foreign exchange transaction losses related to certain intercompany arrangements and losses on the disposal of certain assets. For the nine months ended September 30, 2014, restructuring and other costs primarily included expenses from our restructuring and cost optimization programs. For the nine months ended September 30, 2014, restructuring and other costs also included costs associated with restructuring our capital structure incurred prior to the filing of the Bankruptcy Cases. For the nine months ended September 30, 2014, these costs were partially offset by a gain related to a claim settlement. For the years ended 2013, 2012 and 2011, non-cash charges primarily represent stock-based compensation expense, unrealized derivative and foreign exchange gains and losses and asset disposal gains and losses. For the nine months ended September 30, 2014, reorganization items, net represented incremental costs incurred directly as a result of the Bankruptcy Filing, including certain professional fees, the BCA Commitment Premium and financing fees related to the DIP Facilities.
Liquidity and Capital Resources
We are a highly leveraged company. Our primary sources of liquidity are cash on hand, cash flow from operations and funds available under our credit facilities. Our primary continuing liquidity needs are to finance our working capital, debt service and capital expenditures.
61
Table of Contents
At September 30, 2014, after giving pro forma effect to the Emergence, we would have had $1,203 million of indebtedness. Accordingly, we have significant debt service obligations. In addition, at September 30, 2014, after giving pro forma effect to the Emergence, we would have had $450 million in liquidity consisting of the following:
| • | $254 million of unrestricted cash and cash equivalents (of which $121 million is maintained in foreign jurisdictions); and |
| • | $196 million of borrowings available under the ABL Facility (subject to a fixed charge coverage ratio of 1.0 to 1.0 that will only apply if our availability is less than the greater of (a) 12.5% of the lesser of the borrowing base and the total ABL Facility commitments at such time and (b) $27 million). |
As part of the Bankruptcy Filing, we and certain of our subsidiaries obtained debtor-in-possession financing (“DIP Facilities”). The DIP Facilities were comprised of a $270 million asset-based revolving loan and a $300 million term loan. Access to the full amount of the DIP Facilities was approved by the Court. As of September 30, 2014, $300 million was outstanding under the DIP Term Loan Facility and $63 million was outstanding under the DIP ABL Facility. In conjunction with our emergence from Chapter 11 bankruptcy, on October 24, 2014, the DIP Term Loan Facility was terminated and paid in full, and the DIP ABL Facility was converted into the ABL Facility.
As of the Emergence Date, following the restructuring of our capital structure and the Rights Offerings, we had significant liquidity of approximately $360 million.
Our net working capital (defined as accounts receivable and inventory less accounts payable) at September 30, 2014 and December 31, 2013 was $482 million and $440 million, respectively. The increase in net working capital of $42 million from December 31, 2013 was due primarily to an increase in inventory levels and accounts receivable to meet increased volumes and demand levels. Accounts payable increased as a result of the same factors, as well as due to the Bankruptcy Filing, as certain pre-petition accounts payable remain unpaid pending the consummation of the Plan of Reorganization. To minimize the impact of net working capital on cash flows, we continue to review inventory safety stock levels where possible. We also continue to focus on receivable collections by offering incentives to customers to encourage early payment, or accelerating receipts through the sale of receivables.
We periodically borrowed from our DIP ABL Facility to support our short-term liquidity requirements, particularly when net working capital requirements increase in response to seasonality of our volumes in the summer months. As of September 30, 2014, we had $63 million of outstanding borrowings under the DIP ABL Facility.
Emergence from Chapter 11 Bankruptcy
Following, and as a result of, our emergence from the Chapter 11 proceedings, we believe we are favorably positioned to fund our ongoing liquidity requirements for the foreseeable future through cash generated from operations, as well as available borrowings under our ABL Facility. The additional liquidity provided by the Rights Offerings and the impact of the Plan of Reorganization on our capital structure, resulting in reduced annual debt service obligations of approximately $230 million, will increase our future operational and financial flexibility and leave us well positioned to make strategic capital investments, leverage our leadership positions with both our customers and suppliers, optimize our portfolio and drive new growth programs.
62
Table of Contents
Sources and Uses of Cash
Following are highlights from our Consolidated Statements of Cash Flows:
| Nine Months Ended September 30, |
Year Ended December 31, | |||||||||||||||||||
| (dollars in millions) | 2014 | 2013 | 2013 | 2012 | 2011 | |||||||||||||||
| Sources (uses) of cash: |
||||||||||||||||||||
| Operating activities |
$ | (125 | ) | $ | (129 | ) | $ | (150 | ) | $ | (95 | ) | $ | 106 | ||||||
| Investing activities |
(9 | ) | (63 | ) | (88 | ) | (102 | ) | (120 | ) | ||||||||||
| Financing activities |
184 | 176 | 220 | 111 | (41 | ) | ||||||||||||||
| Effect of exchange rates on cash flow |
— | (2 | ) | (3 | ) | (3 | ) | 4 | ||||||||||||
|
|
|
|
|
|
|
|
|
|
|
|||||||||||
| Net increase (decrease) in cash and cash equivalents |
$ | 50 | $ | (18 | ) | $ | (21 | ) | $ | (89 | ) | $ | (51 | ) | ||||||
|
|
|
|
|
|
|
|
|
|
|
|||||||||||
Operating Activities
In the first nine months of 2014, operations used $125 million of cash. Net loss of $361 million included $285 million of non-cash expense items, of which $137 million was for depreciation and amortization, $30 million was for the non-cash BCA Commitment Premium, $109 million was for unrealized foreign currency losses, $19 million was for the reclassification of DIP Facility financing fees and $15 million was for deferred income taxes. Net working capital used $59 million of cash, as compared to $64 million of cash used in the nine months ended September 30, 2013. This change was primarily driven by the impacts of the Bankruptcy Filing as it relates to the aging of pre-petition accounts payable, but was largely offset by the increase in inventory as a result of increased sales volume and strategic inventory build. Changes in other assets and liabilities, income taxes payable and due to/from affiliates provided $10 million, and were driven by the timing of when items were expensed versus paid, which primarily included the impact of the Bankruptcy Filing on certain pre-petition liabilities, interest expense, taxes and restructuring expenses.
In the first nine months of 2013, operations used $129 million of cash. Net loss of $198 million included $133 million of non-cash expense items, of which $129 million was for depreciation and amortization, $7 million was amortization of debt discount and deferred issuance costs and $5 million was for unrealized foreign currency losses. These were partially offset by $10 million for deferred income taxes. Net working capital used $64 million of cash, driven by increases in inventory of $37 million and accounts receivable of $37 million, partially offset by an increase in accounts payable of $10 million. Changes in other assets and liabilities, income taxes payable and due to/from affiliates were neutral, and are driven by the timing of when items were expensed versus paid, which primarily included interest expense, taxes and restructuring expenses.
In 2013, operations used $150 million of cash. Net loss of $464 million included $364 million of non-cash expense items, of which $171 million was for depreciation and amortization, $81 million was for the write-off of unamortized deferred financing costs, $86 million was for deferred tax expense, $10 million was for the amortization of debt discount and issuance costs and $12 million was for unrealized foreign currency losses. Net working capital used $47 million of cash, as compared to $7 million of cash used in the year ended December 31, 2012. This change was primarily driven by the increase in sales volume and impacts on accounts receivable, inventory and accounts payables. Changes in other assets and liabilities, due to/from affiliates and income taxes payable used cash of $3 million, and are driven by the timing of when items were expensed versus paid, which primarily included interest expense, taxes, pension plan contributions and restructuring expenses.
In 2012, operations used $95 million of cash. Net loss of $365 million included $250 million of non-cash expense items, of which $187 million was for depreciation and amortization, $18 million was for the amortization of debt discount and deferred issuance costs, $57 million was for loss on extinguishment of debt and $1 million was for unrealized foreign currency losses. These items were partially offset by a $10 million deferred tax benefit. Net
63
Table of Contents
working capital used $7 million of cash, as compared to $4 million of cash generated in the year ended December 31, 2011. This change was driven by the decrease in sales and raw materials costs and resulting impacts on accounts receivable, inventory and accounts payables. This impact was largely offset by the impacts of lower days of sales, inventory and payables outstanding. Changes in other assets and liabilities, due to/from affiliates and income taxes payable provided cash of $27 million due to the timing of when items were expensed versus paid, which primarily included interest expense, taxes and restructuring expenses.
In 2011, operations provided $106 million of cash. Net loss of $140 million included $221 million of non-cash expense items, of which $197 million was for depreciation and amortization, $15 million was for the amortization of debt discount and deferred issuance costs, $9 million was for deferred income taxes and $7 million was for unrealized foreign currency losses. These items were partially offset by a $7 million gain on extinguishment of debt. Net working capital provided $4 million of cash, driven by a decrease in accounts receivable of $22 million and an increase in accounts payables of $1 million, partially offset by an increase in inventory of $19 million. Changes in other assets and liabilities, due to/from affiliates and income taxes payable provided cash of $21 million due to the timing of when items were expensed versus paid, which primarily included interest expense, taxes and restructuring expenses.
Investing Activities
In the first nine months of 2014, investing activities used $9 million. We spent $70 million for ongoing capital expenditures related to environmental, health and safety compliance and maintenance projects (of which $53 million represented current year asset additions, with the remainder spent on asset additions made in prior periods). These expenditures were offset by the consolidation of Superholdco Finance Corp. (“Finco”), which provided a $50 million increase in cash, as well as the $12 million in proceeds received from the sale of a subsidiary to Hexion.
In the first nine months of 2013, investing activities used $63 million. We spent $57 million for ongoing capital expenditures related to environmental, health and safety compliance and maintenance projects (including capitalized interest). We also spent $2 million on the acquisition of intangible assets, and an increase in restricted cash used $5 million. These expenditures were partially offset by proceeds of $1 million from the sale of assets.
In 2013, investing activities used $88 million. We spent $81 million for ongoing capital expenditures (including capitalized interest) related to environmental, health and safety compliance and maintenance projects. We also spent $3 million on the acquisition of intangible assets, and an increase in restricted cash used $5 million. These expenditures were partially offset by proceeds of $1 million from the sale of certain assets.
In 2012, investing activities used $102 million. We spent $107 million for ongoing capital expenditures related to environmental, health and safety compliance and maintenance projects. We also spent $2 million on the acquisition of intangible assets. These expenditures were partially offset by proceeds of $7 million from the sale of assets.
In 2011, investing activities used $120 million. We spent $112 million for ongoing capital expenditures related to environmental, health and safety compliance and maintenance projects. We also spent $2 million on the acquisition of intangible assets and made a $6 million capital contribution to our siloxane joint venture in China.
Financing Activities
In the first nine months of 2014, financing activities provided $184 million. Net short-term debt borrowings were $305 million, which primarily consisted of $300 million of borrowings under our DIP Term Loan Facility. Net long-term debt repayments were $52 million, which primarily consisted of net repayments under the $270 million asset-based revolving loan facility entered into in April 2013 (the “Old ABL Facility”) and our Cash Flow Facility. Additionally, the repayment of an affiliated loan in conjunction with various transactions with Finco used cash of $50 million. We also paid $19 million of financing fees related to the DIP Facilities.
64
Table of Contents
In the first nine months of 2013, financing activities provided $176 million. Net long-term debt borrowings were $86 million, which primarily consisted of net borrowings under our Old ABL Facility. We also paid $11 million in financing fees related to our Old ABL Facility, and received proceeds from a capital contribution of $102 million from our parent.
In 2013, financing activities provided $220 million. Net long-term debt borrowings were $132 million, which primarily consisted of net borrowings under our Old ABL Facility of $135 million. Net short-term debt repayments were $2 million. We also paid $12 million in financing fees related to our Old ABL Facility, and received proceeds from a capital contribution of $102 million from our parent.
In 2012, financing activities provided $111 million. Net long-term debt borrowings were $192 million, which consisted primarily of proceeds of $250 million from the issuance of 10% Senior Secured Notes due October 2020 and $175 million of incremental term loans due May 2015, partially offset by the repayment of $240 million of term loans maturing May 2015 and $178 million of term loans maturing December 2013, all as part of our refinancing transactions in 2012. These increases were partially offset by $51 million of original issue discounts and tender premiums and $33 million for the payment of debt issuance costs related to these refinancing transactions.
In 2011, financing activities used $41 million, which primarily consisted of net long-term debt repayments of $36 million, as well as $5 million for the payment of debt issuance costs. We also paid $1 million in dividends to our parent.
At September 30, 2014, our senior secured revolving credit facilities consisted of our $270 million DIP ABL Facility and our $75 million Cash Flow Facility. The ABL Facility and Cash Flow Facility, which were entered into in April 2013, replaced our prior senior secured credit facility that consisted of a $300 million revolving credit facility and a $33 million synthetic letter of credit facility. In April 2014, we entered into the DIP ABL Facility, which amended and restated our existing ABL Facility, and the DIP Term Loan Facility. At September 30, 2014, there were $63 million of borrowings outstanding under the DIP ABL Facility and $20 million outstanding under the Cash Flow Facility. The outstanding letters of credit under the DIP ABL Facility at September 30, 2014 were $74 million, leaving unused borrowing capacity under the DIP ABL Facility of $133 million. Upon consummation of the Plan of Reorganization, on October 24, 2014, the DIP ABL Facility was converted into the ABL Facility and the $300 million DIP Term Loan was repaid in full.
The credit agreement governing the ABL Facility contains various restrictive covenants that prohibit us and/or restrict our ability to prepay indebtedness, including our First Lien Notes and Second Lien Notes (collectively, the “notes”). In addition, the credit agreement governing the ABL Facility and the indentures governing our notes, among other things, restrict our ability to incur indebtedness or liens, make investments or declare or pay any dividends. However, all of these restrictions are subject to exceptions.
There are certain restrictions on the ability of certain of our subsidiaries to transfer funds to the parent of such subsidiaries in the form of cash dividends, loans or otherwise, which primarily arise as a result of certain foreign government regulations or as a result of restrictions within certain subsidiaries’ financing agreements that limit such transfers to the amounts of available earnings and profits or otherwise limit the amount of dividends that can be distributed. In either case, we have alternative methods to obtain cash from these subsidiaries in the form of intercompany loans and/or returns of capital in such instances where payment of dividends is limited to the extent of earnings and profits.
We have recorded deferred taxes on the earnings of our foreign subsidiaries, as they are not considered to be permanently reinvested as those foreign earnings are needed for operations in the United States.
65
Table of Contents
Covenants under our Debt Instruments
The instruments that govern our indebtedness contain, among other provisions, restrictive covenants (and incurrence tests in certain cases) regarding indebtedness, dividends and distributions, mergers and acquisitions, asset sales, affiliate transactions, capital expenditures and the maintenance of certain financial ratios. Payment of borrowings under the ABL Facility and our notes may be accelerated if there is an event of default as determined under the governing debt instrument. Events of default under the credit agreement governing the ABL Facility include the failure to pay principal and interest when due, a material breach of a representation or warranty, events of bankruptcy, a change of control and most covenant defaults. Events of default under the indentures governing our notes include the failure to pay principal and interest, a failure to comply with covenants, subject to a 30-day grace period in certain instances, and certain events of bankruptcy.
The ABL Facility does not have any financial maintenance covenant other than a minimum fixed charge coverage ratio of 1.0 to 1.0 that would only apply if our availability under the ABL Facility at any time was less than the greater of (a) 12.5% of the lesser of the borrowing base and the total ABL Facility commitments at such time and (b) $27 million. The fixed charge coverage ratio is generally defined as the ratio of (a) Adjusted EBITDA minus non-financed capital expenditures and cash taxes to (b) debt service plus cash interest expense plus certain restricted payments, each measured on a last twelve months, or LTM, basis and calculated as of the last day of the applicable fiscal quarter.
In addition to the financial maintenance covenant described above, we are also subject to certain incurrence tests under the indentures governing our notes that restrict our ability to take certain actions if we are unable to meet specified ratios. For instance, the indentures governing our notes contain an incurrence test that restricts our ability to incur indebtedness or make investments, among other actions, if we do not maintain an Adjusted EBITDA to Fixed Charges ratio (measured on a LTM basis) of at least 2.0 to 1.0. The Adjusted EBITDA to Fixed Charges ratio under the indentures is generally defined as the ratio of (a) Adjusted EBITDA to (b) net interest expense excluding the amortization or write-off of deferred financing costs, each measured on a LTM basis. The restrictions on our ability to incur indebtedness or make investments under the indentures that apply as a result, however, are subject to exceptions, including exceptions that permit indebtedness under the ABL Facility.
The ABL Facility also provides for “springing control” over the cash in our deposit accounts constituting collateral for the ABL Facility, and such cash management arrangements include a cash sweep at any time that availability under the ABL Facility is less than the greater of (1) 12.5% of the lesser of the borrowing base and the total ABL Facility commitments at such time and (2) $27 million. Such cash sweep, if in effect, will cause all our available cash to be applied to outstanding borrowings under the ABL Facility. If we satisfy the conditions to borrowing under the ABL Facility while any such cash sweep is in effect, we may be able to make additional borrowings under the ABL Facility to satisfy our working capital and other operational needs. If we do not satisfy the conditions to borrowing, we will not be permitted to make additional borrowings under the ABL Facility, and we will not have sufficient cash to satisfy our working capital and other operational needs. The availability threshold for triggering a cash sweep is the same availability threshold for triggering the fixed charge coverage ratio covenant under the ABL Facility.
Adjusted EBITDA is defined as EBITDA adjusted for certain non-cash and certain non-recurring items and other adjustments calculated on a pro-forma basis, including the expected future cost savings from business optimization or other programs and the expected future impact of acquisitions, in each case as determined under the governing debt instrument. As we are highly leveraged, we believe that including the supplemental adjustments that are made to calculate Adjusted EBITDA provides additional information to investors about our ability to comply with our financial covenants and to obtain additional debt in the future. Adjusted EBITDA is not a defined term under U.S. GAAP. Adjusted EBITDA is not a measure of financial condition, liquidity or profitability, and should not be considered as an alternative to net income (loss) determined in accordance with U.S. GAAP or operating cash flows determined in accordance with U.S. GAAP. Additionally, EBITDA is not intended to be a measure of free cash flow for management’s discretionary use, as it does not take into account
66
Table of Contents
certain items such as interest and principal payments on our indebtedness, depreciation and amortization expense (because we use capital assets, depreciation and amortization expense is a necessary element of our costs and ability to generate revenue), working capital needs, tax payments (because the payment of taxes is part of our operations, it is a necessary element of our costs and ability to operate), non-recurring expenses and capital expenditures. Fixed Charges under the indentures should not be considered as an alternative to interest expense.
The following table reconciles net loss to EBITDA and Adjusted EBITDA for the periods presented:
| September 30, 2014 LTM Period |
Year Ended December 31 | |||||||||||||||
| (dollars in millions) | 2013 | 2012 | 2011 | |||||||||||||
| Net loss |
$ | (628 | ) | $ | (464 | ) | $ | (365 | ) | $ | (141 | ) | ||||
| Loss (gain) on extinguishment and exchange of debt |
— | — | 57 | (7 | ) | |||||||||||
| Interest expense, net |
314 | 394 | 277 | 256 | ||||||||||||
| Income tax expense |
102 | 104 | 8 | 27 | ||||||||||||
| Depreciation and amortization |
179 | 171 | 187 | 197 | ||||||||||||
|
|
|
|
|
|
|
|
|
|||||||||
| EBITDA |
(33 | ) | 205 | 164 | 332 | |||||||||||
| Noncontrolling interest(a) |
— | — | — | 1 | ||||||||||||
| Restructuring and other costs(b) |
24 | 21 | 43 | 35 | ||||||||||||
| Reorganization items, net(c) |
114 | — | — | — | ||||||||||||
| Non-cash charges(d) |
127 | 12 | 4 | 3 | ||||||||||||
| Management fee and other(e) |
— | — | 7 | 6 | ||||||||||||
| Pro forma savings from Shared Services Agreement(f) |
— | 1 | 9 | 28 | ||||||||||||
| Pro forma savings from other initiatives(g) |
2 | 5 | 21 | 2 | ||||||||||||
| Exclusion of Unrestricted Subsidiary results(h) |
(17 | ) | (15 | ) | (20 | ) | (22 | ) | ||||||||
|
|
|
|
|
|
|
|
|
|||||||||
| Adjusted EBITDA |
$ | 217 | $ | 229 | $ | 228 | $ | 385 | ||||||||
|
|
|
|
|
|
|
|
|
|||||||||
| Pro Forma Fixed Charges(i) |
$ | 56 | ||||||||||||||
|
|
|
|||||||||||||||
| Ratio of Adjusted EBITDA to Fixed Charges(j) |
3.85 | |||||||||||||||
| (a) | Reflects the elimination of noncontrolling interests resulting from the sale of the Shenzhen joint venture in 2011. |
| (b) | Relates primarily to one-time payments for services and integration expenses, as well as costs related to restructuring our capital structure incurred prior to the Bankruptcy Filing. |
| (c) | Represent incremental costs incurred directly as a result of the Bankruptcy Filing, including certain professional fees, the $30 million commitment premium for the Rights Offerings and financing fees related to the DIP Facilities. |
| (d) | Non-cash items include the effects of (i) stock-based compensation expense, (ii) non-cash mark-to-market revaluation of foreign currency forward contracts and unrealized gains or losses on revaluations of the U.S. dollar denominated debt of our foreign subsidiaries and the Euro denominated debt of our U.S. subsidiary, (iii) unrealized natural gas derivative gains or losses and (iv) impairments or disposals. For the twelve month period ended September 30, 2014, non-cash items primarily include: the effects of unrealized foreign exchange transaction losses related to certain intercompany arrangements, stock-based compensation expense, unrealized derivative gains and losses and asset disposals. For the year ended December 31, 2013, non-cash items primarily include: (i) pension curtailment gains of $3 million, (ii) unrealized foreign currency exchange losses of $12 million, (iii) stock-based compensation expense of $1 million and (iv) loss of asset disposals of $4 million. For the fiscal year ended December 31, 2012, non-cash items include: (i) unrealized foreign currency exchange loss of $1 million, (ii) asset disposal charges of $3 million, (iii) stock-based compensation expense of $1 million and (iv) pension curtailment gains of $1 million. For the fiscal year ended December 31, 2011, non-cash items include: stock-based compensation expense of $2, million, (ii) unrealized foreign currency exchange loss of $7 million and (iii) a pension curtailment gain of $6 million. |
| (e) | Management Fees and Other include management and other fees to Apollo and affiliates and business optimization expenses. |
| (f) | Primarily represents pro forma impact of expected savings from the Shared Services Agreement with Hexion. Savings from the Shared Services Agreement represent the unrealized savings from shared services and logistics optimization, best-of-source contractual terms, procurement savings, and regional site |
67
Table of Contents
| rationalization as a result of the Momentive Combination, and represent our estimate of the unrealized savings from such initiatives that would have been realized had the related actions been completed at the beginning of the LTM period. Best of source contractual terms, procurement and logistics savings relate to cost savings as a result of lower cost contracts for raw materials and logistics as a result of better leverage with vendors. |
| (g) | Represents pro forma impact of in-process cost reduction programs savings. Cost reduction program savings represent the unrealized headcount reduction savings and plant rationalization savings related to cost reduction programs and other unrealized savings associated with the Company’s business realignments activities, and represent our estimate of the unrealized savings from such initiatives that would have been realized had the related actions been completed at the beginning of the LTM period. The savings are calculated based on actual costs of exiting headcount and elimination or reduction of site costs. |
| (h) | Reflects the exclusion of the EBITDA of our subsidiaries that are designated as Unrestricted Subsidiaries under our debt documents. |
| (i) | Reflects pro forma interest expense based on interest rates at September 30, 2014, and after giving pro forma effect to the Emergence. |
| (j) | Our ability to incur additional indebtedness is restricted under the indentures governing certain notes, unless the Company has an Adjusted EBITDA to Fixed Charges ratio of 2.0 to 1.0. As of September 30, 2014, we were able to satisfy this test on a pro forma basis. |
Contractual Obligations
The following table presents our contractual cash obligations at December 31, 2013. Our contractual cash obligations consist of legal commitments at December 31, 2013 that require us to make fixed or determinable cash payments, regardless of the contractual requirements of the specific vendor to provide us with future goods or services. This table does not include information about most of our recurring purchases of materials used in our production; our raw material purchase contracts do not meet this definition since they generally do not require fixed or minimum quantities. Contracts with cancellation clauses are not included, unless a cancellation would result in a major disruption to our business. These contractual obligations are grouped in the same manner as they are classified in the Consolidated Statements of Cash Flows in order to provide a better understanding of the nature of the obligations.
| (dollars in millions) | Payments Due By Year | |||||||||||||||||||||||||||
| Contractual Obligation |
2014 | 2015 | 2016 | 2017 | 2018 | 2019 and beyond |
Total | |||||||||||||||||||||
| Operating activities: |
||||||||||||||||||||||||||||
| Purchase obligations(1) |
$ | 125 | $ | 122 | $ | 94 | $ | 94 | $ | 94 | $ | 750 | $ | 1,279 | ||||||||||||||
| Interest on fixed rate debt obligations(2) |
288 | 288 | 285 | 244 | 244 | 478 | 1,827 | |||||||||||||||||||||
| Interest on variable rate debt obligations(2) |
6 | 4 | 3 | 3 | 1 | — | 17 | |||||||||||||||||||||
| Operating lease obligations |
16 | 9 | 7 | 3 | 2 | 3 | 40 | |||||||||||||||||||||
| Funding of pension and other postretirement obligations(3) |
24 | 13 | 17 | 17 | 17 | — | 88 | |||||||||||||||||||||
| Restructuring reserves |
4 | — | — | — | — | — | 4 | |||||||||||||||||||||
| Investing activities: |
||||||||||||||||||||||||||||
| Investment in joint venture(4) |
26 | — | — | — | — | — | 26 | |||||||||||||||||||||
| Financing activities: |
||||||||||||||||||||||||||||
| Long-term debt, including current maturities(5) |
39 | 7 | 382 | — | 135 | 2,694 | 3,257 | |||||||||||||||||||||
|
|
|
|
|
|
|
|
|
|
|
|
|
|
|
|||||||||||||||
| Total |
$ | 528 | $ | 443 | $ | 788 | $ | 361 | $ | 493 | $ | 3,925 | $ | 6,538 | ||||||||||||||
|
|
|
|
|
|
|
|
|
|
|
|
|
|
|
|||||||||||||||
| (1) | Purchase obligations are comprised of the fixed or minimum amounts of goods and/or services under long-term contracts and assumes that certain contracts are terminated in accordance with their terms after giving the requisite notice which is generally two to three years for most of these contracts; however, under certain circumstances, some of these minimum commitment term periods could be further reduced which would significantly decrease these contractual obligations. |
68
Table of Contents
| (2) | Based on applicable interest rates in effect at December 31, 2013. |
| (3) | Pension and other postretirement contributions have been included in the above table for the next five years. These amounts include estimated benefit payments to be made for unfunded foreign defined benefit pension plans as well as estimated contributions to our funded defined benefit plans. The assumptions used by our actuaries in calculating these projections includes a weighted average annual return on pension assets of approximately 7% for the years 2014 – 2018 and the continuation of current law and plan provisions. These estimated payments may vary based on the actual return on our plan assets or changes in current law or plan provisions. See Note 12 to our audited Consolidated Financial Statements contained elsewhere herein for more information on our pension and postretirement obligations. |
| (4) | We previously planned to make additional capital contributions of $26 million to our siloxane joint venture in China in 2014; however, the joint venture partners are in discussions regarding the timing and amounts of any future contributions. |
| (5) | As of December 31, 2013 and September 30, 2014, all outstanding debt related to the Old ABL Facility, the First Lien Notes, the Senior Secured Notes, the Springing Lien Notes and the Senior Subordinated Notes has been classified as “Debt payable within one year” in the Consolidated Balance Sheets included in our unaudited and audited financial statements included elsewhere herein. See Note 7 to our audited Consolidated Financial Statements contained elsewhere herein for more information. |
The table above excludes payments for income taxes and environmental obligations since, at this time, we cannot determine either the timing or the amounts of all payments beyond 2014. At December 31, 2013, we recorded unrecognized tax benefits and related interest and penalties of $54 million. We estimate that we will pay approximately $18 million in 2014 for local, state and international income taxes. We expect non-capital environmental expenditures for 2014 through 2018 totaling $2 million. See Notes 10 and 11 to our audited Consolidated Financial Statements included elsewhere herein for more information on these obligations.
The following table presents our contractual cash obligations related to our long-term debt as of December 31, 2013, as adjusted for the impact of restructuring our capital structure.
| (dollars in millions) | Payments Due By Year | |||||||||||||||||||||||||||
| Contractual Obligations |
2014 | 2015 | 2016 | 2017 | 2018 | 2019 and beyond |
Total | |||||||||||||||||||||
| Operating activities: |
||||||||||||||||||||||||||||
| Interest on fixed rate debt obligations |
$ | 54 | $ | 54 | $ | 54 | $ | 54 | $ | 54 | $ | 167 | $ | 437 | ||||||||||||||
| Financing activities: |
||||||||||||||||||||||||||||
| Long-term debt, including current maturities |
39 | 7 | — | — | — | 1,350 | 1,396 | |||||||||||||||||||||
|
|
|
|
|
|
|
|
|
|
|
|
|
|
|
|||||||||||||||
| Total |
$ | 93 | $ | 61 | $ | 54 | $ | 54 | $ | 54 | $ | 1,517 | $ | 1,833 | ||||||||||||||
|
|
|
|
|
|
|
|
|
|
|
|
|
|
|
|||||||||||||||
Critical Accounting Estimates
In preparing our financial statements in conformity with accounting principles generally accepted in the United States, we have to make estimates and assumptions about future events that affect the amounts of reported assets, liabilities, revenues and expenses, as well as the disclosure of contingent assets and liabilities in the financial statements and accompanying notes. Some of these accounting policies require the application of significant judgment by management to select the appropriate assumptions to determine these estimates. By their nature, these judgments are subject to an inherent degree of uncertainty; therefore, actual results may differ significantly from estimated results. We base these judgments on our historical experience, advice from experienced consultants, forecasts and other available information, as appropriate. Our significant accounting policies are more fully described in Note 2 to our audited Consolidated Financial Statements included elsewhere herein.
69
Table of Contents
Income Taxes
Income taxes are accounted for under the asset and liability method. Deferred tax assets and liabilities are recognized for the future tax consequences attributable to differences between the financial statement carrying amounts of existing assets and liabilities and their respective tax bases and operating loss and tax credit carry forwards. Deferred tax assets and liabilities are measured using enacted tax rates expected to apply to taxable income in the years in which those temporary differences are expected to be recovered or settled. The effect on deferred tax assets and liabilities of a change in tax rates is recognized in income in the period that includes the enactment dates. Deferred tax assets are subject to valuation allowances based upon management’s estimates of realizability.
At December 31, 2013 and 2012, we had valuation allowances of $972 million and $812 million respectively, against our deferred income tax assets. At December 31, 2013, we had a $790 million valuation allowance against all of our net U.S. federal and state deferred tax assets, as well as a valuation allowance of $182 million against a portion of our net foreign deferred income tax assets, primarily in Germany. At December 31, 2012, we had a $685 million valuation allowance against all of our net U.S. federal and state deferred tax assets, as well as a valuation allowance of $127 million against a portion of our net foreign deferred income tax assets, primarily in Germany. The valuation allowances require an assessment of both negative and positive evidence, such as operating results during the most recent three-year period. This evidence is given more weight than our expectations of future profitability, which are inherently uncertain.
The Company considered all available evidence, both positive and negative, in assessing the need for a valuation allowance for deferred tax assets. The Company evaluated four possible sources of taxable income when assessing the realization of deferred tax assets:
| • | Taxable income in prior carryback years; |
| • | Future reversal of existing taxable temporary differences; |
| • | Tax planning strategies; and |
| • | Future taxable income exclusive of reversing temporary differences and carryforwards. |
In 2013, a new valuation allowance of $20 million was established in certain non-U.S. jurisdictions based on the Company’s assessment that the net deferred tax assets will likely not be realized. The negative evidence used in the determination to establish the valuation allowance is discussed in Note 10 to our audited Consolidated Financial Statements included elsewhere herein.
The Income Taxes Topic, ASC 740, clarifies the accounting for uncertainty in income taxes recognized in the financial statements. ASC 740 prescribes a recognition threshold and measurement attribute for the financial statement recognition and measurement of tax positions taken or expected to be taken in its tax return. We also apply the guidance relating to de-recognition, classification, interest and penalties, accounting in interim periods, disclosure and transition.
The calculation of our income tax liabilities involves dealing with uncertainties in the application of complex domestic and foreign income tax regulations. Unrecognized tax benefits are generated when there are differences between tax positions taken in a tax return and amounts recognized in the Consolidated Financial Statements. Tax benefits are recognized in the Consolidated Financial Statements when it is more likely than not that a tax position will be sustained upon examination. Tax benefits are measured as the largest amount of benefit that is greater than 50% likely to be realized upon settlement. To the extent we prevail in matters for which liabilities have been established, or are required to pay amounts in excess of our liabilities, our effective income tax rate in a given period could be materially impacted. An unfavorable income tax settlement would require the use of cash and result in an increase in our effective income tax rate in the year it is resolved. A favorable income tax settlement would be recognized as a reduction in the effective income tax rate in the year of resolution. At December 31, 2013 and 2012, we recorded unrecognized tax benefits and related interest and penalties of $54 million and $39 million, respectively.
70
Table of Contents
Pensions
The amounts that we recognize in our financial statements for pension benefit obligations are determined by actuarial valuations. Inherent in these valuations are certain assumptions, the more significant of which are:
| • | The weighted average rate used for discounting the liability; |
| • | The weighted average expected long-term rate of return on pension plan assets; |
| • | The method used to determine market-related value of pension plan assets; |
| • | The weighted average rate of future salary increases; and |
| • | The anticipated mortality rate tables. |
The discount rate reflects the rate at which pensions could be effectively settled. When selecting a discount rate, our actuaries provide us with a cash flow model that uses the yields of high-grade corporate bonds with maturities consistent with our anticipated cash flow projections.
The expected long-term rate of return on plan assets is determined based on the various plans’ current and projected asset mix. To determine the expected overall long-term rate of return on assets, we take into account the rates on long-term debt investments that are held in the portfolio, as well as expected trends in the equity markets, for plans including equity securities.
The rate of increase in future compensation levels is determined based on salary and wage trends in the chemical and other similar industries, as well as our specific compensation targets.
The mortality tables that are used represent the most commonly used mortality projections for each particular country and reflect projected mortality improvements.
We believe the current assumptions used to estimate plan obligations and pension expense are appropriate in the current economic environment. However, as economic conditions change, we may change some of our assumptions, which could have a material impact on our financial condition and results of operations.
The following table presents the sensitivity of our projected pension benefit obligation (“PBO”), accumulated benefit obligation (“ABO”), deficit (“Deficit”) and 2014 pension expense to the following changes in key assumptions:
| (dollars in millions) | Increase / (Decrease) at December 31, 2013 |
Increase
/ (Decrease) |
||||||||||||||
| PBO | ABO | Deficit | 2014 Expense | |||||||||||||
| Assumption: |
||||||||||||||||
| Increase in discount rate of 0.5% |
$ | (26 | ) | $ | (24 | ) | $ | 21 | $ | (1 | ) | |||||
| Decrease in discount rate of 0.5% |
28 | 27 | (24 | ) | 1 | |||||||||||
| Increase in estimated return on assets of 1.0% |
N/A | N/A | N/A | (1 | ) | |||||||||||
| Decrease in estimated return on assets of 1.0% |
N/A | N/A | N/A | 1 | ||||||||||||
As a result of the adoption of fresh start accounting, we elected to change our method of accounting on a prospective basis, for recognizing gains and losses resulting from changes in actuarial assumptions. Actuarial gains and losses will be recognized directly as a component of earnings in the Statement of Operations.
71
Table of Contents
Impairment of Long-Lived Assets, Goodwill and Other Intangible Assets
As events warrant, we evaluate the recoverability of long-lived assets, other than goodwill and other indefinite-lived intangibles, by assessing whether the carrying value can be recovered over their remaining useful lives through the expected future undiscounted operating cash flows of the underlying business. Impairment indicators include, but are not limited to, a significant decrease in the market price of a long-lived asset; a significant adverse change in the manner in which the asset is being used or in its physical condition; a significant adverse change in legal factors or the business climate that could affect the value of a long-lived asset; an accumulation of costs significantly in excess of the amount originally expected for the acquisition or construction of a long-lived asset; current period operating or cash flow losses combined with a history of operating or cash flow losses associated with the use of the asset; or a current expectation that it is more likely than not that a long-lived asset will be sold or otherwise disposed of significantly before the end of its previously estimated useful life. As a result, future decisions to change our manufacturing process, exit certain businesses, reduce excess capacity, temporarily idle facilities and close facilities could result in material impairment charges. Long-lived assets are grouped together at the lowest level for which identifiable cash flows are largely independent of cash flows of other groups of long-lived assets. Any impairment loss that may be required is determined by comparing the carrying value of the assets to their estimated fair value. We do not have any indefinite-lived intangibles, other than goodwill.
We perform an annual assessment of qualitative factors to determine whether the existence of any events or circumstances leads to a determination that it is more likely than not that the fair value of a reporting unit is less than the carrying amount of the reporting unit’s net assets. If, after assessing all events and circumstances, we determine it is more likely than not that the fair value of a reporting unit is less than the carrying amount of the reporting unit’s net assets, we use a probability weighted market and income approach to estimate the fair value of the reporting unit. Our market approach is a comparable analysis technique commonly used in the investment banking and private equity industries based on the EBITDA multiple technique. Under this technique, estimated fair value is the result of a market based EBITDA multiple that is applied to an appropriate historical EBITDA amount, adjusted for the additional fair value that would be assigned by a market participant obtaining control over the reporting unit. Our income approach is a discounted cash flow model. The discounted cash flow model requires management to project revenues, operating expenses, working capital investment, capital spending and cash flows over a multiyear period, as well as determine the weighted average cost of capital to be used as a discount rate. Applying this discount rate to the multiyear projections provides an estimate of fair value for the reporting unit. The discounted cash flow model does not include cash flows related to interest payments and debt service, as the related debt has not been pushed down to the reporting unit level. Our reporting units include silicones and quartz. Our reporting units are one level below our operating segments for which discrete financial information is available and reviewed by segment management.
At both October 1, 2013 and 2012, the estimated fair value of each of our reporting units was deemed to be substantially in excess of the carrying amount of assets (including goodwill) and liabilities assigned to each unit. The Quartz reporting unit’s goodwill has been fully impaired.
Recently Issued Accounting Standards
Newly Adopted Accounting Standards
On February 5, 2013, we adopted the provisions of Accounting Standards Update No. 2013-02: Comprehensive Income (Topic 220): Reporting of Amounts Reclassified Out of Accumulated Other Comprehensive Income (“ASU 2013-02”). ASU 2013-02 amended existing comprehensive income guidance and is intended to improve the reporting of reclassifications out of accumulated other comprehensive income. The guidance requires additional detail about the effect of significant reclassifications out of accumulated other comprehensive income on the respective line items in net income. ASU 2013-02 allows an entity to provide information about the effects on net income of significant amounts reclassified out of each component of accumulated other comprehensive income on the face of the statement where net income is presented or as a
72
Table of Contents
separate disclosure in the notes to the financial statements. The adoption of ASU 2013-02 did not have a material impact on our audited Consolidated Financial Statements. See Note 14 to our audited Consolidated Financial Statements included elsewhere herein for the disclosures required by the adoption of ASU 2013-02.
Newly Issued Accounting Standards
In July 2013, the FASB issued Accounting Standards Update No. 2013-11: Presentation of an Unrecognized Tax Benefit When a Net Operating Loss Carryforward, a Similar Tax Loss, or a Tax Credit Carryforward Exists (“ASU 2013-11”). ASU 2013-11 amended existing income tax guidance and is intended to reduce the diversity in practice by providing guidance on the presentation of unrecognized tax benefits and will better reflect the manner in which an entity would settle at the reporting date any additional income taxes that would result from the disallowance of a tax position when net operating loss carryforwards, similar tax losses or tax credit carryforwards exist. We elected to adopt ASU 2013-11 during the year ended December 31, 2013. The adoption of ASU 2013-11 did not have a material impact on our Consolidated Financial Statements.
In May, 2014, the Financial Accounting Standards Board (“FASB”) issued Accounting Standards Board Update No. 2014-09: Revenue from Contracts with Customers (Topic 606) (“ASU 2014-09”). ASU 2014-09 supersedes the existing revenue recognition guidance and most industry-specific guidance applicable to revenue recognition. According to the new guidance, an entity will apply a principles-based five step model to recognize revenue upon the transfer of promised goods or services to customers and in an amount that reflects the consideration for which the entity expects to be entitled in exchange for those goods or services. The guidance is effective for annual periods beginning after December 15, 2016, including interim periods within that reporting period and early application is not permitted. We are currently assessing the potential impact of ASU 2014-09 on our financial statements.
In August 2014, the FASB issued Accounting Standards Board Update No. 2014-15: Presentation of Financial Statements—Going Concern—Disclosures of Uncertainties about an entity’s Ability to Continue as a Going Concern (“ASU 2014-15”). ASU 2014-15 provides new guidance related to management’s responsibility to evaluate whether there is substantial doubt about an entity’s ability to continue as a going concern by incorporating and expanding upon certain principles that are currently in U.S. auditing standards and to provide related footnote disclosures. This new guidance is effective for the annual period ending after December 15, 2016, and for annual periods and interim periods thereafter. The requirements of ASU 2014-15 are not expected to have a significant impact on our financial statements.
Quantitative and Qualitative Disclosures about Market Risk
We are exposed to market risks arising from our normal business activities. These market risks principally involve the possibility of changes in interest rates, currency exchange rates or commodity prices that would adversely affect the value of our financial assets and liabilities or future cash flows and earnings. Market risk is the potential loss arising from adverse changes in market rates and prices.
Foreign Exchange Risk
Our international operations accounted for approximately 68% of our net sales in 2013, 2012 and 2011. As a result, we have significant exposure to foreign exchange risk related to transactions that can potentially be denominated in many foreign currencies. These transactions include foreign currency denominated imports and exports of raw materials and finished goods (both intercompany and third party) and loan repayments. The functional currency of our operating subsidiaries is generally the related local currency.
We aim to reduce foreign currency cash flow exposure due to exchange rate fluctuations by hedging foreign currency transactions when economically feasible. Our use of forward and option contracts is designed to protect our cash flows against unfavorable movements in exchange rates, to the extent of the amount under contract. We
73
Table of Contents
do not attempt to hedge foreign currency exposure in a manner that would entirely eliminate the effect of changes in foreign currency exchange rates on net income and cash flow. We do not speculate in foreign currency, nor do we hedge the foreign currency translation of our international businesses to the U.S. dollar for purposes of consolidating our financial results or other foreign currency net asset or liability positions. The counter-parties to our hedge contracts are financial institutions with investment-grade credit ratings.
Our foreign exchange risk is also mitigated because we operate in many foreign countries, which reduces the concentration of risk in any one currency. In addition, certain of our foreign operations have limited imports and exports, which reduces the potential impact of foreign currency exchange rate fluctuations.
Interest Rate Risk
As of December 31, 2013, $181 million (including $135 million of borrowings under our Old ABL Facility), or approximately 6%, of our borrowings, were at variable interest rates and expose us to interest rate risk. As a result, we have been and will continue to be subject to the variations in interest rates in respect of our variable rate debt. Assuming the amount of our variable rate debt remains the same, an increase of 1% in the interest rates on our variable rate debt would increase our 2014 estimated debt service requirements by approximately $2 million. While we may enter into agreements intending to limit our exposure to higher interest rates, any such agreements may not offer complete protection from this risk. See “Risk Factors” elsewhere herein for additional discussion about interest rate risk.
Following is a summary of our outstanding debt as of December 31, 2013 and 2012 (see Note 7 to our audited Consolidated Financial Statements elsewhere herein for additional information on our debt). The fair value of our publicly held debt is based on the price at which the bonds are traded or quoted at December 31, 2013 and 2012. All other debt fair values are based on other similar financial instruments, or based upon interest rates that are currently available to us for the issuance of debt with similar terms and maturities.
| (dollars in millions) | 2013 | 2012 | ||||||||||||||||||||||
| Year |
Debt Maturities |
Weighted Average Interest Rate |
Fair Value | Debt Maturities |
Weighted Average Interest Rate |
Fair Value | ||||||||||||||||||
| 2013 |
$ | 35 | 9.4 | % | $ | 35 | ||||||||||||||||||
| 2014 |
$ | 39 | 9.1 | % | $ | 39 | 9 | 9.4 | % | 9 | ||||||||||||||
| 2015 |
7 | 9.1 | % | 7 | 7 | 9.4 | % | 7 | ||||||||||||||||
| 2016 |
382 | 8.9 | % | 260 | 382 | 9.2 | % | 214 | ||||||||||||||||
| 2017 |
— | 8.8 | % | — | — | 9.1 | % | — | ||||||||||||||||
| 2018 |
135 | 8.9 | % | 135 | — | 9.1 | % | — | ||||||||||||||||
| 2019 and beyond |
2,694 | 9.1 | % | 2,588 | 2,685 | 9.1 | % | 2,323 | ||||||||||||||||
|
|
|
|
|
|
|
|
|
|||||||||||||||||
| $ | 3,257 | $ | 3,029 | $ | 3,118 | $ | 2,588 | |||||||||||||||||
|
|
|
|
|
|
|
|
|
|||||||||||||||||
74
Table of Contents
The following table presents our outstanding debt as of December 31, 2013, as adjusted for the impact of restructuring our capital structure:
| (dollars in millions) | 2013 | |||||||||||
| Year |
Debt Maturities |
Weighted Average Interest Rate |
Fair Value | |||||||||
| 2013 |
||||||||||||
| 2014 |
$ | 39 | 9.1 | % | 39 | |||||||
| 2015 |
7 | 9.1 | % | 7 | ||||||||
| 2016 |
— | — | — | |||||||||
| 2017 |
— | — | — | |||||||||
| 2018 |
— | — | — | |||||||||
| 2019 and beyond |
1,350 | 4.0 | % | 1,159 | ||||||||
|
|
|
|
|
|||||||||
| $ | 1,396 | $ | 1,205 | |||||||||
|
|
|
|
|
|||||||||
Commodity Risk
We are exposed to price risks on raw material purchases. We pursue ways to diversify and minimize material costs through strategic raw material purchases, and through commercial and contractual pricing agreements and customer price adjustments. For our commodity raw materials, we have purchase contracts that have periodic price adjustment provisions. We rely on key suppliers for most of our raw materials. The loss of a key source of supply or a delay in shipments could have an adverse effect on our business. Should any of our suppliers fail to deliver or should any key supply contracts be canceled, we would be forced to purchase raw materials in the open market, and no assurances can be given that we would be able to make these purchases or make them at prices that would allow us to remain competitive. Also, we will consider hedging strategies that minimize risk or reduce volatility when available.
75
Table of Contents
Overview
Momentive Performance Materials Inc., a Delaware corporation, together with its subsidiaries (collectively referred to herein as “we,” “us,” “our,” “MPM” or the “Company”), is one of the world’s largest producers of silicones and silicone derivatives and a global leader in the development and manufacture of products derived from quartz and specialty ceramics.
As a result of the Company’s reorganization and emergence from Chapter 11 bankruptcy on October 24, 2014, the Company’s direct parent is MPM Intermediate Holdings Inc., a holding company and wholly owned subsidiary of MPM Holdings Inc., the ultimate parent entity of MPM (“MPM Holdings”). Prior to its reorganization, the Company, through a series of intermediate holding companies, was controlled by investment funds managed by affiliates of Apollo Management Holdings, L.P.
Products and Markets
Our products are used in thousands of applications and are sold into diverse markets, such as industrial, building and construction, transportation, agriculture, electronics, healthcare and personal care, as well as higher growth markets, such as semiconductor and fiber optics. The diversity of our products limits our dependence on any one market or end-use. We have a history of product innovation and success in introducing new products to new markets, as evidenced by more than 3,600 patents, the majority of which relate to the development of new products and manufacturing processes.
As of September 30, 2014, we had 22 production sites strategically located around the world, which allows us to produce the substantial majority of our key products locally in the Americas, Europe and Asia. Through this worldwide network of production facilities, we serve more than 4,500 customers between our Silicones and Quartz businesses in over 100 countries. We use our global platform to deliver products to companies efficiently on a worldwide basis. Many of our customers are expanding internationally to serve developing areas in Asia, Eastern Europe, Latin America, India and Russia. Maintaining close proximity to our international customers allows us to serve them more quickly and efficiently and thus build strong relationships. Our customers include leading companies in their respective industries, such as Procter & Gamble, Avery, Continental Tire, Saint Gobain, Unilever, BASF, The Home Depot and Lowe’s.
We believe that our scale and global reach provide significant efficiencies in our fixed and variable cost structure and that our breadth of related products provides significant operational, technological and commercial advantages. Our manufacturing capacity at our internal sites and joint venture in China is sufficient to produce the substantial majority of one of our key intermediates, siloxane, which facilitates a cost effective operating structure and security of supply.
We believe we have created a value-added, technical service-oriented business model that enables us to target and participate in high-margin and high-growth specialty markets. These specialty markets account for the majority of our revenues and continue to be a growing part of our business.
Growth and Strategy
We believe that we have opportunities for growth through the following long-term strategies:
Expand Our Global Reach in Faster Growing Regions. We intend to continue to grow internationally by expanding our sales presence around the world. Specifically, we are focused on growing our business in the high growth regions of Asia-Pacific, Eastern Europe, Latin America, India and the Middle East, where the usage of our products is increasing. For example, we recently commissioned new liquid silicone rubber and release coating production capabilities at our Rayong, Thailand site to serve the growing Asian Pacific market.
76
Table of Contents
Develop and Market New Products. We will continue our efforts to expand our product offerings through research and development initiatives and research partnership formations with third parties. Through these innovation initiatives we expect to create new generations of products and services which will drive revenue and earnings growth over the long term. In 2013, 2012 and 2011, we invested $70 million, $69 million and $78 million, respectively in research and development. In 2013, approximately 14% of our sales came from new products developed over the last five years as a result of our targeted new product development efforts. We also recently expanded our technology center in Seoul, Korea, and opened a new research and development facility in Bangalore, India, which further complements our network of key innovation centers strategically located near our global customers.
Increase Shift to High-Margin Specialty Products. We continue to proactively manage our product portfolio with a focus on specialty, high-margin applications. As a result of this capital allocation strategy and anticipated end market growth underlying these specialty segments, we believe high-margin specialty materials will continue to be a larger part of our broader portfolio. For instance, we are investing in our NXT* Silane manufacturing network through the expansion of our Termoli, Italy, site. NXT is an innovative product used in the production of tires, and can offer tire manufacturers the ability to reduce rolling resistance without loss of wet traction, as well as deliver benefits in the tire manufacturing process.
Continue Portfolio Optimization and Pursue Targeted Add-On Acquisitions and Joint Ventures. As a large manufacturer of performance materials with leadership in the production of silicone, silicone derivatives, quartz and specialty ceramics, we have an advantage in pursuing add-on acquisitions and joint ventures in areas that allow us to build upon our core strengths, expand our product, technology and geographic portfolio, and better serve our customers. We believe we may have the opportunity to consummate acquisitions at relatively attractive valuations due to the scalability of our existing global operations and deal-related synergies. In addition, we have and will continue to monitor the strategic landscape for opportunistic divestments consistent with our broader specialty strategy.
Implement Strategic Cost Reduction Initiatives. In July 2012, we approved certain restructuring actions in connection with the realignment of our businesses globally. As of September 31, 2014, we had realized approximately $34 million in cost savings as a result of these restructuring initiatives, and have approximately $2 million of in-process cost savings in connection with these initiatives that we expect to achieve over the next 9 to 12 months. We also continue to evaluate other actions that could lead to further savings.
Leverage Cost Savings from the Shared Services Agreement. The Shared Services Agreement with Hexion Inc. (formerly known as Momentive Specialty Chemicals Inc., “Hexion”) has resulted in significant synergies for us, including shared services and logistics optimization, best-of-source contractual terms, procurement savings, regional site rationalization and administrative and overhead savings. As of September 30, 2014, we have realized cumulative cost savings of $65 million as a result of the Shared Services Agreement The Shared Services Agreement remains in place between us and Hexion following completion of our balance sheet restructuring, and both companies will continue to benefit from the optimized cost structure and services that it provides.
Industry and Competitors
We compete with a variety of companies, including large global chemical companies and small specialty chemical companies, in each of our product lines. The principal factors of competition in our industry include product quality, customer service and breadth of product offerings, product innovation, manufacturing efficiency, distribution and price. Some of our competitors are larger, have greater financial resources and have less debt than we do and may, as a result, be better able to withstand changes in conditions throughout our industry relating to pricing or otherwise and the economy as a whole. We believe that no single company competes with us across all of our existing product lines.
77
Table of Contents
Our Businesses
The following paragraphs discuss our businesses, corresponding key product lines and primary end-use applications of our key products as of December 31, 2013.
Silicones
2013 Net Sales: $2,197 million
We believe we are one of the world’s largest producers of silicones and silicone derivatives, with leading positions in various product lines and geographic areas. We manufacture a wide range of high-performing elastomers, engineered materials and fluids. Silicones are generally used as an additive to a wide variety of end products in order to provide or enhance certain of their attributes, such as resistance (heat, ultraviolet light and chemical), lubrication, adhesion or viscosity. Product families within our silicones business include fluids (textiles, personal care, home care, agriculture and oil and gas applications), silanes and resins (tires, additives for coatings, masonry water repellents and protective coatings for plastics and rubber), elastomers (healthcare and automotive applications), intermediates, specialty coatings, room temperature vulcanizers, urethane additives (polyurethane foam additives) and consumer and construction sealants. Silicones are used in product formulations primarily due to two distinguishing factors: (i) their high degree of inertness (i.e., resistance to heat, electricity and chemical reactions); and (ii) their ability during manufacturing to greatly modify their viscosity, enabling production of end-products with a significant variation in levels of lubricity or adhesion. Silicones are developed using separate finishing processes to generate a wide variety of different performance characteristics and are typically used in applications where traditional materials cannot perform under required conditions. Entirely new applications for silicones continue to emerge as a result of their versatility and broad range of properties. We have a broad range of specialty silicones technologies, with highly advanced research, applications development and technical service capabilities.
Products
Our silicones product portfolio consists primarily of those set forth below.
| • | Fluids. Fluids products are polydimethylsiloxane polymers, co-polymers, elastomers and gel networks, high-performance antifoams and emulsions. Silicone fluids exhibit low surface tension, excellent gloss, excellent sensory, softening and conditioning properties, good thermal stability and excellent viscosity over a wide temperature range, which permits usage in a number of applications. Fluids are used primarily in the personal care, home care and auto care, textiles, oil and gas, agriculture and industrial end-markets and are sold under the Magnasoft, Sagtex, Formasil, Silwet, Silsoft, Silshine, Tospearl and Velvesil brands. |
| • | Silanes and Resins. Silane and resin products are primarily used as components in a variety of specialty applications where improved performance is desired. Resins are used as binders in the production of formulated products such as adhesives, laminates, paints and coatings, and sealants and caulks. Their use is generally focused on situations where required performance characteristics, such as paintability, high-temperature or harsh environmental resistance, are beyond the scope of traditional materials. Our Tospearl resins are also used as light diffusion aids in LCD/LED screens, lighting and as slip agents in plastic packaging materials and paints & coatings. Silanes are used as high-performance coupling agents, adhesion promoters or as reactive intermediates. Silane and resin products are sold into a diverse range of end-markets, including aerospace, construction, coatings and inks, paint, adhesives, electronics, motor vehicles, sealants, rubber and plastics. We sell silane and specialty resins brands including: Silblock, A-Link, Wetlink, Silquest, NXT, Pearlene, SPUR, Tospearl and CoatOSil. |
| • | Intermediates. Intermediate products are a broad set of siloxane, silane, and by-product materials produced in chemical operation and primarily used as inputs for other product portfolios. |
78
Table of Contents
| • | Elastomers. Silicone elastomers are blends of silicone polymers and various fillers and include solid and liquid elastomers. Favorable performance characteristics include a broad temperature range, excellent resistance to weathering, low toxicity, good electrical insulation properties and acoustical damping qualities. Silicone elastomers are used in the production of a variety of products, including gaskets, seals, hoses and tubing, as well as numerous consumer items. Elastomers products are used primarily in the healthcare, consumer products, energy and automotive end-markets and are sold under the Tufel, Ultra Tufel, Silplus, LSR/LIM, Silopren, and Addisil brand names. |
| • | Specialty Coatings. Specialty Coatings products are fully formulated solutions designed to enhance performance and drive productivity in various applications. Performance attributes include high-temperature resistance, abrasion resistance, pressure sensitive adhesion or release and weatherability. Specialty Coatings products are sold into a diverse range of end-markets, including construction, tape and label, adhesives, electronics and automotive. Specialty Coatings brands include SilForce, Silgrip, Silblock, Baysilone, and Anchorsil. |
| • | Room Temperature Vulcanizers. Room Temperature Vulcanization (“RTV”) products consist of highly engineered gels, greases, adhesives, encapsulants and sealants. Different types of chemistries are employed based on the application to cure the material at room temperature, with heat or by UV light. Custom fillers and additives are used to enhance performance in areas such as electrical and thermal conductivity, cure speed, adhesion to plastics and metals, optical clarity and resistance to heat. RTV products are used primarily in micro- and macro-electronics assembly, consumer electronics, automotive, aerospace, consumer goods and industrial sealing applications. RTV products include the TSE, SilCool, InvisiSil and SnapSil brand names. |
| • | Urethane Additives. Urethane Additive’s product portfolio includes silicone surfactants used essentially for stabilizing polyurethane foam and a diverse line of tertiary amines to provide blow, gel and balanced catalysis in polyurethane foam reaction. Polyurethane applications include furniture, bedding, auto interior, appliances, construction, carpet backing, footwear and PU leather. Urethane additive products are sold under the Niax and Geolite brands. |
| • | Consumer and Construction Sealants. Consumer sealants are used by homeowners, builders and contractors for a variety of projects throughout the home including increasing energy efficiency, reducing damaging effects of moisture and protecting the home from pollen, pollution and pests. Construction sealants are used in structural glazing, weather-sealing, and insulated glass applications in new and remedial large-scale commercial building projects. We have a trademark license agreement with GE Monogram Licensing International which gives us an exclusive right to use the GE brand for these products through 2018, with a five-year renewal option through 2023. Our consumer and construction sealant products are also sold under various private labels for a number of hardware and paint retailers. |
End-Markets and Applications
The physical properties of silicones, such as weather-ability, longevity and tolerance to a wide temperature range, make them versatile products with broad commercial applications. In the building and construction industry, silicone sealants and caulks are used to seal expansion and control joints in pre-cast exterior concrete panels and metal curtain walls, as well as in siding, window and door perimeters. In the transportation industry, silicones are used in a variety of original equipment manufacturer and aftermarket applications. In the electronics industry, silicones’ tolerance to high temperatures give them a considerable advantage relative to other, traditional materials in a variety of computers and electronics manufacturing applications. In the personal care industry, silicones are used in consumer goods such as hair care and shaving products, antiperspirants and deodorants, cosmetics and shower and bath products. In the healthcare industry, silicones are used in medical equipment, as well as in surgeries and other general medical procedures. We believe that such a broad range of commercial uses not only helps to maintain a steady demand for our products in industries that are less vulnerable to economic cycles but also allows us to explore new applications for our products in high-growth industries.
79
Table of Contents
Raw Materials
| • | Silicon Metal. Silicon metal is an inorganic material that is not derived from petrochemicals. Major silicon metal suppliers include FerroAtlantica, Elkem, Globe Specialty Metals, Advanced Metallurgical Group, Rima, Simcoa and other smaller vendors located around the world. We currently purchase silicon metal under multi-year, one-year or short-term contracts and in the spot market. We typically purchase silicon metal under contracts in the United States and Europe and in the spot market in Asia Pacific. |
| • | Siloxane. Siloxane is a key intermediate required to produce the silicones polymer. We are one of two producers in the silicones market with global siloxane production capacity, and we produce siloxane for our internal use in Waterford, New York; Leverkusen, Germany and Ohta, Japan and source siloxane from a joint venture in Jiande, China. This manufacturing capacity is sufficient to meet the substantial majority of our current siloxane requirements. We also source a portion of our requirements under a purchase and sale agreement with Asia Silicones Monomer Limited (“ASM”). In addition, from time to time, we enter into supply agreements with third parties to take advantage of favorable pricing and minimize our costs. |
| • | Methanol. Methanol is a key raw material for the production of methyl chloride, which is used to produce chlorosilanes. Major methanol suppliers include Methanex, MHTL and Mitsubishi Gas Chemicals. We typically enter into annual or quarterly contracts for methanol. |
Quartz
2013 Net Sales: $201 million
We believe that our Quartz business is a global leader in the development and manufacturing of fused quartz and ceramic materials. Fused quartz, a man-made glass manufactured principally from quartz sand, is used in processes requiring extreme temperature, high purity and other specific characteristics. Fused quartz and ceramic materials are used in a wide range of industries, including semiconductor, lamp tubing, manufacturing, packaging, cosmetics and fiber optics. We believe that our Quartz business is a leading global producer of quartz tubing, ingots and crucibles and high-performance, non-oxide ceramic powders, coatings and solids.
Our Quartz business’ products are used as a superior substitute for glass. On a microscopic level, normal glass is filled with impurities, bubbles and other flaws. For this reason, applications that require transparency and a high level of purity or stress-resistance (such as process equipment for semiconductor manufacturing or lamp lenses for video projectors) require the use of quartz. A significant driver of our Quartz volumes derives from microchip makers adding to or adjusting their manufacturing lines for newly developed products. The manufacture of quartz products for use in the production of semiconductors generated approximately 45% of our Quartz business’ revenue for the fiscal year ended December 31, 2013 compared to 41% in 2012 and 48% in 2011.
Raw Materials
Raw material costs accounted for approximately 70% of our cost of sales in 2013. In 2013, we purchased approximately $955 million of raw materials. The majority of raw materials that we use to manufacture our products are available from more than once source, and are readily available in the open market. We have long-term purchase agreements for certain raw materials that ensure the availability of adequate supply. Although we seek to offset increases in raw material prices with increases in our product prices, we may not always be able to do so, and there are periods when price increases lag behind raw material price increases.
Naturally occurring quartz sand is the key raw material for many of the products manufactured by the Quartz business, which is currently available from a limited number of suppliers. The Unimin Corporation (“Unimin”), a major producer of natural quartz sand, controls a significant portion of the market for this sand. As a result, Unimin exercises significant control over quartz sand prices, which have been steadily increasing. In
80
Table of Contents
recent years, these increases have averaged approximately 3-5% per year. Our long term purchase agreement with Unimin expired on December 31, 2012. We are currently negotiating the terms of a new long term supply agreement with Unimin and expect to enter into an agreement within the first quarter of 2015. We also use other quartz sand sources around the world.
Marketing, Customers and Seasonality
We market an extensive product line to meet a wide variety of customer needs. We focus on customers who are, or have the potential to be, leaders in their industries and have growth objectives that support our own growth objectives. In addition, we focus on customers who value our service-oriented business model. This approach includes high-quality, reliable products backed by local sales support and technical expertise. An important component of our strategy is to utilize our broad product capabilities to win high-end specialty business from our customers. These customers value these capabilities and, as a result, we are able to become a supplier of choice, given our relationship and ability to develop solutions to meet their precise needs.
In 2013, our largest customer accounted for less than 3% of our net sales, and our top twenty customers accounted for approximately 22% of our net sales. Neither our overall Company nor any of our businesses depends on any single customer or a particular group of customers; therefore, the loss of any single customer would not have a material adverse effect on any of our businesses or the Company as a whole.
We do not experience significant seasonality of demand, although sales have historically been slightly higher during the second and fourth quarters due to increased industrial activity. Seasonality trends, however, have been skewed in recent years primarily due to volatile global economic conditions.
Research and Development
Research and development expenses include wages and benefits for research personnel including engineers and chemists; payments to consultants and outside testing services, costs of supplies and chemicals used in in-house laboratories and costs of research and development facilities. Our research and development efforts focus on the development of new applications for our existing products and technological advances that we hope will lead to new products. For the years ended December 31, 2013, 2012 and 2011, we spent $70 million, $69 million and $78 million, respectively, on research and development.
Intellectual Property
We own, license or have rights to over 3,600 patents, approximately 100 trademarks and various patent and trademark applications and technology licenses around the world. These patents will expire between 2014 and 2031. Our rights under such patents and licenses are a significant strategic asset in the conduct of our business. Patents, patent applications, trademarks and trademark applications relating to our Velvesil, Silwet, Silsoft, SPUR+, and NXT brands, technologies and products are considered material to our business. See “Certain Relationships and Related Transactions, and Director Independence” for a description of our licensing arrangements with GE.
Industry Regulatory Matters
Domestic and international laws regulate the production and marketing of chemical substances. Although almost every country has its own legal procedure for registration and import, laws and regulations in the European Union, the United States, and China are the most significant to our business. These laws typically prohibit the import or manufacture of chemical substances unless the substances are registered or are on the country’s chemical inventory list, such as the European inventory of existing commercial chemical substances and the U.S. Toxic Substances Control Act inventory. Chemicals that are on one or more of these lists can usually be registered and imported without requiring additional testing in countries that do not have such lists, although additional administrative hurdles may exist. Under such laws, countries may also require toxicity testing to be conducted on chemicals in order to register them or may place restrictions on the import, manufacture and/or use of a chemical.
81
Table of Contents
The European Commission enacted a regulatory system in 2006, known as Registration, Evaluation, Authorization and Restriction of Chemical substances (“REACH”), which requires manufacturers, importers and consumers of certain chemicals to register these chemicals and evaluate their potential impact on human health and the environment. As REACH matures, significant market restrictions could be imposed on the current and future uses of chemical products that we use as raw materials or that we sell as finished products in the European Union. Other countries may also enact similar regulations.
In the European Union and other jurisdictions committed to compliance with the Kyoto Protocol to the United Nations Framework Convention on Climate Change, there is an increasing likelihood that our manufacturing sites will be affected in some way over the next few years by taxation of greenhouse gas, or GHG emissions. In addition, although the United States is not a signatory to the Kyoto Protocol, several states, including California and New York, are implementing their own GHG regulatory programs, and the enactment of federal climate change legislation in the United States is a possibility for the future. While only a small number of our sites are currently affected by existing GHG regulations, and none have experienced or anticipate significant cost increases as a result, it is likely that GHG emission restrictions will increase over time. Potential consequences of such restrictions include increases in energy costs above the level of general inflation, as well as direct compliance costs. Currently, however, it is not possible to estimate the likely financial impact of potential future regulation on any of our sites.
Environmental Regulations
Our policy is to strive to operate our plants in a manner that protects the environment and the health and safety of our employees, customers and communities. We have implemented company-wide environmental, health and safety policies and practices managed by our Environmental, Health and Safety, or EH&S department, and overseen by the EH&S Committee of the Board of Managers of Hexion Holdings LLC (formerly known as Momentive Performance Materials Holdings LLC, “Hexion Holdings”). Our EH&S department has the responsibility to ensure that our operations worldwide comply with environmental, health and safety laws and regulations. This responsibility is executed via training, communication of EH&S policies, formulation of relevant policies and standards, EH&S audits and incident response planning and implementation. Our EH&S policies and practices include management systems and procedures relating to environmental emissions, waste generation, process safety management, handling, storage and disposal of hazardous substances, worker health and safety requirements, emergency planning and response and product stewardship.
Our operations involve the use, handling, processing, storage, transportation and disposal of hazardous materials and are subject to extensive environmental regulation at the federal, state and international level. Our production facilities require operating permits that are subject to renewal or modification. Violations of environmental laws or permits may result in restrictions being imposed on operating activities, substantial fines, penalties, damages or other costs. In addition, statutes such as the federal Comprehensive Environmental Response, Compensation and Liability Act, or CERCLA, and comparable state and foreign laws impose strict, joint and several liability for investigating and remediating the consequences of spills and other releases of hazardous materials, substances and wastes at current and former facilities and at third-party disposal sites. Other laws permit individuals to seek recovery of damages for alleged personal injury or property damage due to exposure to hazardous substances and conditions at or from our facilities or to hazardous substances otherwise owned, sold or controlled by us. Therefore, notwithstanding our commitment to environmental management, environmental health and safety, we may incur liabilities in the future, and these liabilities may result in a material adverse effect on our business, financial condition, results of operations or cash flows.
Although our environmental policies and practices are designed to ensure compliance with international, federal and state laws and environmental regulations, future developments and increasingly stringent regulation could require us to make additional unforeseen environmental expenditures.
We expect to incur future costs for capital improvements and general compliance under environmental laws, including costs to acquire, maintain and repair pollution control equipment. In 2013, we incurred capital expenditures of $18 million on an aggregate basis to comply with environmental laws and regulations and to
82
Table of Contents
make other environmental improvements. We estimate that our capital expenditures in 2014 for environmental controls at our facilities will be approximately $31 million. This estimate is based on current regulations and other requirements, but it is possible that a material amount of capital expenditures, in addition to those we currently anticipate, could be necessary if these regulations or other requirements or other facts change.
Employees
As of December 31, 2013, we had approximately 4,500 employees. Approximately 46% of our employees are members of a labor union or are represented by workers’ councils that have collective bargaining agreements. We believe that we have good relations with our union and non-union employees.
In July 2013, the labor union representing the Willoughby, Ohio, and Waterford, New York facilities ratified a new three-year collective bargaining agreement. In July 2014, the labor union representing the Sistersville, West Virginia facility ratified a new three-year collective bargaining agreement, extending the agreement until July 2017.
Properties
Our headquarters is located in Waterford, NY. Our major manufacturing facilities are primarily located in North America, Europe and Asia. As of September 30, 2014, we operated 10 domestic production and manufacturing facilities in 6 states and 12 foreign production and manufacturing facilities, primarily in China, Germany, Italy and Japan.
We believe our production and manufacturing facilities are well maintained and effectively utilized and are adequate to operate our business. Following are our production and manufacturing facilities, executive offices and technology research centers as of September 30, 2014:
| Location |
Real Property Interest |
Business in Which Property is Used | ||
| Americas: |
||||
| Waterford, NY |
Owned | Silicones | ||
| Tarrytown, NY(1) |
Leased | Silicones | ||
| Sistersville, WV |
Owned | Silicones | ||
| Chino, CA |
Leased | Silicones | ||
| Garrett, IN |
Leased | Silicones | ||
| New Smyrna Beach, FL |
Owned | Silicones | ||
| Itatiba, Brazil |
Owned | Silicones | ||
| Strongsville, OH |
Owned | Quartz | ||
| Willoughby, OH |
Owned | Quartz | ||
| Richmond Heights, OH |
Owned | Quartz | ||
| Newark, OH |
Owned | Quartz | ||
| Europe: |
||||
| Leverkusen, Germany |
Leased | Silicones | ||
| Bergen op Zoom, Netherlands |
Leased | Silicones | ||
| Lostock, United Kingdom |
Leased | Silicones | ||
| Termoli, Italy |
Owned | Silicones | ||
| Antwerp, Belgium |
Leased | Silicones | ||
| Geesthacht, Germany |
Owned | Quartz | ||
| Asia Pacific: |
||||
| Nantong, China |
Leased | Silicones | ||
| Ohta, Japan |
Owned | Silicones | ||
83
Table of Contents
| Location |
Real Property Interest |
Business in Which Property is Used | ||
| Rayong, Thailand |
Leased | Silicones | ||
| Bangalore, India(1) |
Leased | Silicones | ||
| Chennai, India |
Owned | Silicones | ||
| Seoul, South Korea(1) |
Leased | Silicones | ||
| Shanghai, China(1) |
Leased | Silicones | ||
| Kobe, Japan(1) |
Leased | Quartz | ||
| Kozuki, Japan |
Owned | Quartz | ||
| Wuxi, China |
Leased | Quartz |
| (1) | Technology research center. |
Legal Proceedings
Various claims, lawsuits and administrative proceedings are pending or threatened against us and/or our subsidiaries, arising from the ordinary course of business with respect to commercial, product liability, employee, environmental and toxic exposure matters. Historically, we have not faced any litigation matters or series of litigation matters that have had a material adverse impact on our business. In addition, we do not believe that there is any pending or threatened litigation, either individually or in the aggregate, that is likely to have a material adverse effect on our business. We have a number of lawsuits pending against us alleging personal injury due to exposure to hazardous materials, many of which are multi-defendant lawsuits on behalf of large groups of plaintiffs. We believe we are indemnified by GE for any liability arising from any such lawsuits existing prior to our creation on December 3, 2006, through the acquisition of certain assets, liabilities and subsidiaries of GE that comprised GE Advanced Materials, an operating unit within the Industrial Segment of GE, by MPM Holdings and us (the “GE Advanced Materials Acquisition”). We cannot predict with certainty the outcome of any litigation or the potential for future litigation and any such matters, if they occur, could materially adversely affect our business and operations.
Appeals Relating to the Confirmation of the Plan of Reorganization in the Bankruptcy Cases
In connection with the Bankruptcy Cases, three appeals were filed relating to the confirmation of the Plan of Reorganization. Specifically, on September 15, 2014, U.S. Bank National Association (“U.S. Bank”) as trustee for the Subordinated Notes filed its appeal (the “U.S. Bank Appeal”) before the U.S. District Court for the Southern District of New York (the “District Court”) seeking a reversal of the Court’s determination that the Debtors’ Plan of Reorganization properly denied recovery to holders of the Subordinated Notes on the basis that those debt securities are contractually subordinated to the Old Second Lien Notes. In addition, on September 16, 2014, BOKF, NA, as trustee for the Old First Lien Notes (“First Lien Indenture Trustee”) and Wilmington Trust, National Association, as trustee for the Old Secured Notes (together with U.S. Bank and First Lien Trustee, the “Appellants”) filed their joint appeal (together with the U.S. Bank Appeal, the “Appeals”) before the District Court seeking reversal of the Bankruptcy Court’s determinations that (i) the Debtors were not required to compensate holders of the Old First Lien Notes and Old Secured Notes for any prepayment premiums and (ii) the interest rates on First Lien Notes and Second Lien Notes provided to holders of the Old First Lien Notes and Old Secured Notes under the Plan of Reorganization was proper and in accordance with United States Bankruptcy Code. Briefing has been completed, and the Appeals are still pending before the District Court. On November 11, 2014, the Debtors also filed a motion to dismiss the Appeals (the “Motion to Dismiss”) with the District Court asserting, inter alia, that granting the relief requested by the Appellants would be inequitable under the legal doctrine of equitable mootness. Briefing has also been completed in connection with the Motion to Dismiss and is still pending before the District Court. We cannot predict with certainty the ultimate outcome of the Appeals or the Motion to Dismiss.
84
Table of Contents
Italian Tax Claim
On June 17, 2014, an Italian tax court of appeals (the “Italian Court of Appeals”) decided against the Company related to its 2003 income tax position resulting from the acquisition by General Electric Company (“GE”) of an Italian company in the same year. GE subsequently sold this Italian subsidiary to the Company as part of the acquisition of GE Advanced Materials in 2006 (the “GE Advanced Materials Acquisition”). Having considered the use of debt financing and other characteristics of the acquisition by GE, the Italian Court of Appeals determined that the goodwill amortization and interest expense related to the acquisition by GE were not deductible for tax purposes. Prior to this decision, the Company had received favorable rulings by lower level Italian trial courts in a series of similar cases regarding the same matter.
On August 7, 2014, the Italian Court of Appeals affirmed the prior decisions of the Italian tax trial courts in the Company’s favor regarding the deductions made in the years 2004 through 2007. The Company is currently preparing to appeal the adverse decision related to the 2003 tax year before the Italian Supreme Court and believes it has a considerable likelihood of obtaining a favorable outcome. As of September 30, 2014, the total potential assessment, including penalties and interest, is €45 million, or approximately $57 million, of which €30 million, or approximately $38 million, relates to the period of ownership subsequent to the GE Advanced Materials Acquisition.
The Company continues to believe its tax filing position is appropriate and that it is more likely than not this position will prevail upon appeal to the Italian Supreme Court. As a result, the Company has not recorded any income tax liability related to this matter as of September 30, 2014. Additionally, in conjunction with the GE Advanced Materials Acquisition, the Company and GE entered into an agreement providing for the indemnification by GE for tax matters related to the GE Advanced Materials Acquisition. The Company is currently evaluating the impact of this agreement on its potential exposure.
Environmental Matters
Our operations are subject to extensive environmental regulation at the federal, state and international level and our production facilities require operating permits that are subject to renewal or modification. Our operations also involve the use, handling, processing, storage, transportation and disposal of hazardous materials, and we may be exposed to the risk of claims for environmental remediation or restoration.
We have adopted and implemented health, safety and environmental policies, which include systems and procedures governing environmental emissions, waste generation, process safety management, handling, storage and disposal of hazardous substances, worker health and safety requirements, emergency planning and response, and product stewardship. In order to comply with environmental, health and safety laws and regulations, and maintenance of permits, we have incurred and will continue to incur costs, including capital expenditures for projects related to environmental improvements. In addition, pursuant to applicable hazardous waste regulations, we are required to provide financial assurances for contingent future costs associated with certain hazardous waste management and remedial activities. We have obtained $35 million in letters of credit for financial assurance required under applicable hazardous waste regulations, including $25 million for closure and post-closure care for the Waterford, NY and Sisterville, WV facilities, and $10 million (annual aggregate) for accidental occurrences at those facilities. We are currently in discussions with the NYSDEC regarding the renewal of our Waterford facility’s hazardous waste permit. We have recently been advised by the NYDEC that the draft renewal permit will require $26 million in financial assurances for our Waterford facility, an increase to the amount currently being provided of approximately $8 million. We believe that the draft permit will also require a re-evaluation of the financial assurance amount within the next 3 years. One or more of our U.S. facilities may also in the future be subject to additional financial assurance requirements imposed by governmental authorities, including the USEPA. In this regard, the USEPA has identified chemical manufacturing as an industry for which it plans to develop, as necessary, proposed regulations identifying appropriate financial assurance requirements pursuant to §108(b) of CERCLA.
85
Table of Contents
We are currently conducting investigations and/or cleanup of known or potential contamination at several of our facilities, and have been named as a potentially responsible party at several third party Superfund sites. In connection with the GE Advanced Materials Acquisition, GE has agreed to indemnify us for liabilities associated with contamination at former properties and for liabilities associated with third-party waste disposal sites. GE has also agreed that if we suffer any losses that are the subject of an indemnification obligation under a third party contract with respect to which GE is an indemnitee, GE will pursue such indemnification on our behalf and provide us with any benefits received.
While we do not anticipate material costs in excess of current reserves and/or available indemnification relating to known or potential environmental contamination, the discovery of additional contamination, or the imposition of more stringent cleanup requirements, could require us to make significant expenditures in excess of such reserves and/or indemnification.
We have been named as a defendant in a series of multi-defendant lawsuits based on our alleged involvement in the supply of allegedly hazardous materials. The plaintiffs seek damages for alleged personal injury resulting from exposure to various chemicals. These claims have not resulted in material judgments or settlements historically and we do not anticipate that these claims present any material risk to our business in the future. In addition, we have been indemnified by GE for any liability arising from any such claims existing prior to the consummation of the GE Advanced Materials Acquisition. However, we cannot predict with certainty the outcome of any such claims or the involvement we might have in such matters in the future.
In 2008, we became aware and disclosed to the NYSDEC that, in certain instances, our Waterford, New York, facility may have failed to comply with the State and federal regulatory requirements governing the treatment of hazardous waste. During 2008, the NYSDEC initiated an investigation into these disclosures and issued a notice of violation alleging certain noncompliances. Subsequently, in the second quarter 2009, the USEPA and the U.S. Department of Justice sought, through search warrant and subpoena, additional information related to the alleged noncompliances. We are cooperating fully with the State and federal authorities. State and federal authorities have the statutory authority to seek civil and criminal sanctions, including but not limited to monetary penalties, for any noncompliances identified.
86
Table of Contents
Executive Officers and Directors
Set forth below are the names, ages and current positions of our executive officers and directors as of December 15, 2014.
| Name |
Age |
Title | ||
| John G. Boss |
55 | Chief Executive Officer and President and Director | ||
| Brian D. Berger |
43 | Interim Chief Financial Officer | ||
| Douglas A. Johns |
57 | Executive Vice President and Secretary | ||
| George F. Knight |
57 | Senior Vice President and Treasurer | ||
| Stephen J. Psutka |
51 |
Interim General Counsel | ||
| Mahesh Balakrishnan |
31 |
Director | ||
| Bradley J. Bell |
62 | Director and Chairman of the Board | ||
| John D. Dionne |
51 |
Director | ||
| Robert Kalsow-Ramos |
28 | Director | ||
| Scott M. Kleinman |
41 | Director | ||
| Julian Markby |
62 | Director | ||
| Daniel C. Murphy |
40 |
Director | ||
| Jason New |
45 |
Director | ||
| David B. Sambur |
33 | Director | ||
| Marvin Schlanger |
66 | Director |
John G. Boss was appointed as a director and Interim Chief Executive Officer and President on October 24, 2014 pursuant to the Plan of Reorganization. On December 15, 2014, he was appointed as Chief Executive Officer and President. He joined the Company as Executive Vice President and President of the Silicones and Quartz Division in March 2014. Mr. Boss was the former President of Honeywell Safety Products at Honeywell International from February 2012 to March 2014. He served in various leadership positions with Honeywell International since 2003, including Vice President and General Manager of Specialty Products from 2008 through 2012 and Vice President and General Manager of Specialty Chemicals from 2005 through 2008. Before joining Honeywell International, Mr. Boss was Vice President and General Manager of the Specialty and Fine Chemicals business of Great Lakes Chemical Corporation from 2000 through 2003, and Vice President and Business Director at Ashland Corporation (formerly International Specialty Products) from 1996 through 2000.
Brian D. Berger was appointed as Interim Chief Financial Officer on October 24, 2014 pursuant to the Plan of Reorganization. He joined the Company as Vice President, Finance of the Silicones and Quartz Division in 2012 and served as Interim President of the Silicones and Quartz Division from August 2013 to March 2014. Prior to joining the Company, Mr. Berger served as Director, Shared Services of Stanley Black & Decker from 2010 through 2012 and as Director, Americas Shared Financial Services of SABIC Innovative Plastics from 2008 through 2010. Mr. Berger joined GE in 1994 and held numerous financial management roles from 1994 to 2008 in various GE Plastics businesses operating across the world.
Douglas A. Johns was elected Executive Vice President, Secretary and General Counsel on September 4, 2014. Pursuant to the Plans of Reorganization on October 24, 2014 he was replaced by Mr. Psutka as General Counsel. Mr. Johns was elected General Counsel and Secretary upon formation of MPM on December 4, 2006. He was named Executive Vice President on October 1, 2010. He also serves as Executive Vice President and General Counsel of Hexion Inc. and as Executive Vice President, Secretary, and General Counsel of Hexion Holdings LLC, having been elected to those positions on October 1, 2010. Prior to the formation of MPM, Mr. Johns served as General Counsel for GE Advanced Materials, a division of General Electric Company, from 2004 to December 2006. Mr. Johns began his career as a trial lawyer at the U.S. Department of Justice and was in private practice before joining GE in 1991, where he served as Senior Counsel for global regulatory and environmental matters and Senior Business Counsel at GE Plastics’ European headquarters in Bergen Op Zoom, The Netherlands from 2001 to 2004.
87
Table of Contents
George F. Knight was elected Senior Vice President and Treasurer on September 4, 2014. He was elected Senior Vice President, Finance, and Treasurer of Momentive Performance Materials Inc. and Hexion Holdings LLC on October 1, 2010 and November 1, 2010, respectively. Mr. Knight also serves in that capacity for Hexion Inc., having been elected Vice President, Finance and Treasurer in July 2002 and promoted to Senior Vice President on June 1, 2005. He joined the Company in 1997 as Director and then Vice President of Mergers and Acquisitions-Finance for Borden, Inc. From 1999 to 2001 he served as Vice President, Finance for Borden Foods Corporation.
Stephen J. Psutka was appointed as Interim General Counsel on October 24, 2014 pursuant to the Plan of Reorganization. Mr. Psutka has been with MPM since its formation on December 4, 2006, initially serving as its General Counsel, Americas. He assumed the role of Associate General Counsel, Silicones and Quartz Division in February of 2011, serving in such capacity until his appointment as Interim General Counsel. Prior to the formation of MPM, Mr. Psutka served as the Americas Counsel, Silicones for GE Advanced Materials, a division of General Electric Company, from 2005 to December 2006. Mr. Psutka joined GE in 1996, serving in various business and transactions counsel roles for its GE Plastics division, after beginning his career in private practice as a corporate and business transactions lawyer.
Mahesh Balakrishnan was appointed as a Director on October 24, 2014 pursuant to the Plan of Reorganization. Mr. Balakrishnan is a Senior Vice President in Oaktree’s Opportunities Funds. He joined Oaktree in 2007 and has been focused on investing in the Chemicals, Energy, Financial Institutions, Real Estate and Shipping sectors. Mr. Balakrishnan has worked with a number of Oaktree’s portfolio companies and currently serves on the boards of STORE Capital Corp. and Excel Maritime Carriers. He has been active on a number of creditors’ committees during restructuring of investments, including Eagle Bulk Shipping, Excel Maritime Carriers, Lehman Brothers and LyondellBasell. Prior to Oaktree, Mr. Balakrishnan spent two years in the Financial Sponsors & Leveraged Finance group at UBS Investment Bank. Mr. Balakrishnan graduated cum laude with a B.A. degree in Economics (Honors) from Yale University.
Bradley J. Bell was appointed as a Director on October 24, 2014 pursuant to the Plan of Reorganization and as Chairman of the Board on December 15, 2014. He has been a member of the Board of Directors of Hennessy Capital Acquisition Corporation since January 16, 2014, serving as the Chairman of the Audit Committee. Mr. Bell also has served on the Board of Directors of IDEX Corporation since 2001, chairing the Nominating and Corporate Governance Committee since 2010 and serving on the Compensation Committee since 2011. Since 2003, he has been a member of the Board of Directors of Compass Minerals Corporation, where he has been the Compensation Committee Chair since 2010 and a member of the Audit Committee since 2014, and was a member the Nominating and Corporate Governance Committee from 2009 to 2014. Mr. Bell was Executive Vice President and Chief Financial Officer at Nalco Holding Co. (formerly known as Nalco Chemical Co.) from November 2003 to September 2010. He also served as a Senior Vice President and Chief Financial Officer of Rohm & Haas Co. from 1997 to May 2003. In light of Mr. Bell’s extensive finance and business experience and over 20 years’ experience of serving on Boards of Directors of publicly traded companies, we believe it is appropriate for Mr. Bell to serve as a director of the Company.
John D. Dionne was appointed as a Director on October 24, 2014 pursuant to the Plan of Reorganization. He is a Senior Advisor of the Blackstone Group and a Field Fellow with the Harvard Business School. He was most recently a Senior Managing Director at Blackstone and Global Head of its Private Equity Investor Relations and Business Development Groups. He also served as a member of Blackstone’s Private Equity Investment and Valuation Committees. Mr. Dionne originally joined Blackstone in 2004 as the Founder and Chief Investment Officer of the Blackstone Distressed Securities Fund, the firm’s initial entry into the single-manager hedge fund practice, with peak assets under management of $2 billion. During this period, he also served on the Investment Committees of Blackstone’s GSO and Kalix investment businesses. Before joining Blackstone, Mr. Dionne was for several years a Partner and Portfolio Manager for Bennett Restructuring Funds, specializing in investing in financially troubled companies. He is a Chartered Financial Analyst and Certified Public Accountant (inactive). Mr. Dionne is a graduate of the Harvard Business School and The University of Scranton. In light of our ownership structure and his extensive finance and business experience, we believe it is appropriate for Mr. Dionne to serve as a director of the Company.
88
Table of Contents
Robert Kalsow-Ramos was appointed as a Director on October 24, 2014 pursuant to the Plan of Reorganization. Mr. Kalsow-Ramos is a Principal in Apollo Global Management’s Private Equity Group, where he has worked since 2010. Prior to joining Apollo, Mr. Kalsow-Ramos was a member of the Transportation Investment Banking Group at Morgan Stanley from 2008 to 2010. He also serves on the Board of Directors of Noranda Aluminum Holding Corporation and the Board of Managers of Hexion Holdings LLC (the indirect parent of Hexion). In addition, he is chairman of the Audit Committee and a member of the Compensation Committee of the Board of Managers of Hexion Holdings LLC. Mr. Kalsow-Ramos’ extensive finance and business experience gives him insights into strategic and financial matters and qualifies him to serve on our Board of Directors.
Scott M. Kleinman was appointed as a Director on October 24, 2014 pursuant to the Plan of Reorganization. Mr. Kleinman is the Lead Partner for Private Equity at Apollo, where he has worked since February 1996. Prior to that time, Mr. Kleinman was employed by Smith Barney Inc. in its Investment Banking division. Mr. Kleinman is also a director of the following companies affiliated with Apollo: Hexion Holdings LLC, Verso Paper Corp., Verso Paper Inc., Verso Paper Holdings, LLC, Taminco Global Chemical Corporation and Tamico Acquisition Corp. Within the past five years, Mr. Kleinman was also a director of Noranda Aluminum Holding Corporation, Realogy Corporation, Hexion Inc., and LyondellBasell Industries N.V. He is a member of the Executive, Audit and Compensation Committees of the Board of Managers of Hexion Holdings LLC. In light of our ownership structure and Mr. Kleinman’s position with Apollo and his extensive finance and business experience, we believe it is appropriate for Mr. Kleinman to serve as a director of the Company.
Julian Markby was appointed as a Director on October 24, 2014 pursuant to the Plan of Reorganization. Mr. Markby has been an independent financial consultant and corporate director since 2005. Mr. Markby has been a member of the Board and the Audit Committee of Thiele Kaolin Company from April 2011 to present, serving as the Audit Committee Chair since May 1, 2013. He has also been Chairman of the Board of SP Fiber Holdings, Inc. since December 2013 and has been a director and member of the Audit and Compensation Committees since September 2012. In addition, he has been a member of the Board and the Audit and Compensation committees of Altegrity, Inc. since October 2014. Mr. Markby was a past director of MPM from April 2013 to October 2014 and NewPage Corporation from January 2011 to December 2012. Previously, Mr. Markby was an investment banker for over 25 years, most recently at Wasserstein Perella and Dresdner Kleinwort Wasserstein for over 8 years. Mr. Markby’s extensive finance and business experience qualifies him to serve on our Board of Directors.
Daniel C. Murphy was appointed as a Director on October 24, 2014 pursuant to the Plan of Reorganization. He serves as Portfolio Manager and Head of Fixed Income for Pentwater Capital Management, LP since August 2013 and previously from February 2008 to February 2011. Previously, he was an analyst for Anchorage Advisors, LLC. Prior to that, Mr. Murphy served as a Director of Credit Portfolio Management for Canadian Imperial Bank of Commerce and an Associate in Leverage Finance for CIBC World Markets Corp. He also served as a Director of Six Flags Entertainment Corp. and a member of the Audit Committee from April 2010 to May 2011. Mr. Murphy’s extensive finance and business experience qualifies him serve on our Board of Directors.
Jason New was appointed as a Director on October 24, 2014 pursuant to the Plan of Reorganization. He is a Senior Managing Director of The Blackstone Group and Head of Special Situation Investing for GSO Capital Partners. Mr. New focuses on managing GSO’s public investment portfolio with a specific emphasis on stressed and distressed companies and on sourcing direct special situation investment opportunities. Mr. New is a member of the GSO Investment Committee. Before joining GSO Capital in 2005, Mr. New was a senior member of Credit Suisse’s distressed finance group. Mr. New joined Credit Suisse in 2000 when it acquired Donaldson, Lufkin & Jenrette (“DLJ”), where he was a member of DLJ’s restructuring group. Prior to joining DLJ in 1999, he was an associate with the law firm Sidley Austin LLP where he practiced law in the firm’s corporate reorganization group. He has been a Director of Eastman Kodak Company since September 2013 and he served as Director of Cheniere Energy, Inc. Mr. New received a JD from Duke University School of Law and a BA, magna cum laude, from Allegheny College. In light of our ownership structure and his extensive finance and business experience, we believe it is appropriate for Mr. New to serve as a director of the Company.
89
Table of Contents
David B. Sambur was appointed as a Director on October 24, 2014 pursuant to the Plan of Reorganization. He is a Partner at Apollo, where he has worked since 2004. He was a member of the Leveraged Finance Group of Salomon Smith Barney Inc. from 2002 to 2004. He is also a director of Hexion Holdings LLC, Verso Paper Corp., Verso Paper Inc., Verso Paper Holdings LLC, Caesars Entertainment Corporation, Caesars Acquisition Company and AP Gaming Holdco, Inc. (a parent of AGS Capital, LLC), all companies affiliated with Apollo. He is a member of the Audit and Compensation Committees of the Board of Managers of Hexion Holdings LLC. In light of our ownership structure and his extensive financial and business experience, we believe it is appropriate for Mr. Sambur to serve as a director of the Company.
Marvin Schlanger was appointed as a Director on October 24, 2014 pursuant to the Plan of Reorganization. Since October 1998, Mr. Schlanger has been a principal in the firm of Cherry Hill Chemical Investments, LLC, which provides management services and capital to the chemical and allied industries. Prior to October 1998, he held various positions with ARCO Chemical Company, serving as President and Chief Executive Officer from May 1998 to July 1998 and as Executive Vice President and Chief Operating Officer from 1994 to May 1998. He served as Chairman and Chief Executive Officer of Resolution Performance Products LLC and RPP Capital Corporation from November 2000 and Chairman of Resolution Specialty Materials Company from August 2004 until the formation of Hexion Inc. in May 2005. Mr. Schlanger is also a director and the Chairman of the Board of CEVA Group Plc, and a director of UGI Corporation, UGI Utilities Inc., Amerigas Partners, LLP and Hexion Holdings, LLC. Mr. Schlanger was formerly Chairman of the Supervisory Board of LyondellBasell Industries N.V., CEO and Chairman of Resolution Performance Products, LLC, Chairman of Covalence Specialty Materials Corp., and Chairman of Resolution Specialty Materials, LLC. Mr. Schlanger’s extensive finance and business experience qualifies him to serve on our Board of Directors.
Committees of the Board of Directors
Audit Committee
Our audit committee consists of Messrs. New, Markby and Kalsow-Ramos, with Mr. Markby serving as its chairman. Each of Messrs. New, Markby and Kalsow-Ramos qualifies as an audit committee financial expert as defined in Item 407(d) of Regulation S-K. Mr. Markby meets the independence and the experience requirements of the federal securities laws.
The principal duties and responsibilities of our audit committee are as follows:
| • | to monitor our accounting, internal control and external reporting policies and practices; |
| • | to oversee the integrity of our financial statements; |
| • | to oversee the independence, qualifications and performance of the independent auditor (including appointment, termination and compensation of the independent auditor); |
| • | to oversee the performance of our internal audit function; and |
| • | to oversee our compliance with legal, ethical and regulatory matters as well as our standards of business. |
The audit committee has the authority to retain counsel and advisors to fulfill its responsibilities and duties.
Compensation Committee
Our compensation committee consists of Messrs. Balakrishnan, Sambur and Bell, with Mr. Bell serving as its chairman.
90
Table of Contents
The principal duties and responsibilities of our compensation committee are as follows:
| • | to provide oversight on the design and implementation of the compensation policies, strategies, plans and programs for our key employees and outside directors and disclosure relating to these matters; |
| • | to review and make recommendations to the Board of Directors with respect to the compensation of our chief executive officer and other executive officers; |
| • | to evaluate the performance of the chief executive officer; |
| • | to approve or and make recommendations to the Board of Directors with respect to the employment agreements, separation packages and severance benefits of executive officers; |
| • | to monitor and make recommendations with respect to management succession planning; and |
| • | to provide oversight on the regulatory compliance with respect compensation matters. |
Nominating and Governance Committee
Our nominating and governance committee consists of Messrs. Murphy, Bell and Kleinman, with Mr. Bell serving as its chairman.
The principal duties and responsibilities of the nominating committee are as follows:
| • | to oversee the selection of members of the Board of Directors; |
| • | to develop and recommend to the Board of Directors corporate governance guidelines; |
| • | to oversee the evaluation of the Board of Directors, management and each Board committee. |
| • | to establish criteria for board and committee membership and recommend to the Board of Directors proposed nominees for election to the Board of Directors and for membership on committees of the Board of Directors; and |
| • | to oversee and review the policy and process for stockholder communication to the Board of Directors. |
Environmental, Health and Safety Committee
Our environmental, health and safety committee consists of Messrs. Balakrishnan, Dionne and Schlanger, with Mr. Schlanger serving as its chairman.
The principal duties and responsibilities of the environmental, health and safety committee are as follows:
| • | to oversee the environmental, health and safety compliance programs and initiatives; |
| • | to oversee compliance with environmental, health and safety indemnifications; |
| • | to monitor our environmental, health and safety performance statistics; |
| • | to recommend the general budget for environmental, health and safety capital spending; and |
| • | to oversee environmental, health and safety audit program. |
Other Committees
Our Bylaws provide that our Board of Directors may establish one or more additional committees. In addition to MPM Holdings’ four standing committees, in connection with the Emergence, the Board of Directors created a special committee (the “Special Committee”) to assist in identifying and hiring a permanent Chief Executive Officer, a permanent Chief Financial Officer and a permanent General Counsel. The Special Committee consists of Messrs. Balakrishnan, Bell and Sambur, with Mr. Bell serving as its chairman.
Code of Ethics
We have adopted a Code of Conduct that applies to our directors, officers and employees. These standards are designed to deter wrongdoing and to promote the honest and ethical conduct of all employees. The Code of Conduct is posted on our website: www.momentive.com under “Investor Relations Momentive Performance Materials Inc.” Any substantive amendment to, or waiver from, any provision of the Code of Conduct with respect to any senior executive or financial officer will be posted on this website.
91
Table of Contents
COMPENSATION DISCUSSION AND ANALYSIS
In this Compensation Discussion and Analysis, the terms “our” and “we” refer to Momentive Performance Materials Inc. We describe our process of determining the compensation and benefits provided to our “Named Executive Officers” in 2013. Our Named Executive Officers are: Craig O. Morrison, President and Chief Executive Officer (our “CEO”); William H. Carter, Executive Vice President and Chief Financial Officer (our “CFO”); Judith A. Sonnett, Executive Vice President, Human Resources; Douglas A. Johns, Executive Vice President and General Counsel; Nathan Fisher, Executive Vice President, Procurement; and John C. Dandolph, our former Executive Vice President and President, Silicones and Quartz Division.
Messrs. Morrison, Carter, Johns, Fisher and Ms. Sonnett provide services to the Company and Hexion Inc. (formerly known as Momentive Specialty Chemicals Inc., “MSC”), which is another subsidiary of our former parent company, Hexion Holdings LLC (formerly known as Momentive Performance Materials Holdings LLC, “Momentive Holdings”), on a shared basis pursuant to the Shared Services Agreement between the Company and MSC, which is further described below. Messrs. Morrison, Carter, Fisher and Ms. Sonnett are employed by MSC, and accordingly participates in the compensation and benefits programs of MSC and Momentive Holdings. Mr. Johns is employed by us and accordingly participate in the compensation and benefits programs of MPM and Momentive Holdings. Mr. Dandolph was employed by us and provided services solely to the Company. He left the Company in August 2013.
Shared Services Agreement
In connection with the closing of the transaction in 2010 in which Old MPM Holdings and Hexion LLC (formerly known as Momentive Specialty Chemicals Holdings LLC), the parent company of MSC, became subsidiaries of Momentive Holdings (the “Momentive Combination”), we entered into the Shared Services Agreement with MSC. Under this agreement, MSC provides to us, and we provide to MSC, a range of services on a shared basis including the services of certain executives and employees. In 2013, the fully burdened costs of the shared executives and other employees were allocated 57% to MSC and 43% to us. However, if 100% of any cost is demonstrably attributable to or for the benefit of either MSC or us, the entire amount of such cost is allocated to the company realizing such benefit. Fully burdened costs for shared employees include salary, bonus, cash grants under annual incentive compensation plans, costs under health care, life insurance, pension, retirement, deferred compensation and severance plans and associated overhead. The costs are calculated in accordance with accounting policies and procedures approved, from time to time, by the parties.
Oversight of the Executive Compensation Program
Generally, the Compensation Committee of the Board of Directors of MPM (the “MPM Committee”) is responsible for establishing the compensation and benefits of the executive officers employed by MPM. Similarly, the Compensation Committee of the Board of Directors of MSC (the “MSC Committee”) is responsible for establishing the compensation and benefits of the executive officers employed by MSC. In 2013, the MPM Committee and the MSC Committee were comprised of the same individuals, and the committees followed similar compensation philosophies and objectives. References to the “Committee” mean the MPM Committee and/or the MSC Committee, as appropriate.
The Committee sets the principles and strategies that guide the design of our executive compensation program. The Committee annually evaluates the performance and compensation levels of the Named Executive Officers. This annual compensation review process includes an evaluation of key objectives and measurable contributions to ensure that incentives are not only aligned with the Company’s strategic goals, but also enable us to attract and retain a highly qualified and effective management team. Based on this evaluation, the Committee approves each executive officer’s compensation level, including base salary, annual incentive opportunities and long-term incentive opportunities.
92
Table of Contents
Executive Summary
Executive Compensation Objectives and Strategy
Our executive compensation program is designed to set compensation and benefits at a level that is reasonable, internally fair and externally competitive. Specifically, the Committee is guided by the following objectives:
| • | Pay for Performance. We emphasize pay for performance based on achievement of company operational and financial objectives and the realization of personal goals. We believe that a significant portion of each executive’s total compensation should be variable and contingent upon the achievement of specific and measurable financial and operational performance goals. |
| • | Align Incentives with Shareholders. Our executive compensation program is designed to focus our Named Executive Officers on our key strategic, financial and operational goals that will translate into long-term value creation for our shareholders. |
| • | Balance Critical Short-Term Objectives and Long-term Strategy. We believe that the compensation packages we provide to our Named Executive Officers should include a mix of short-term, cash-based incentive awards that encourage the achievement of annual goals, and long-term cash and equity elements that reward long-term value creation for the business. |
| • | Attract, Retain and Motivate Top Talent. We design our executive compensation program to be externally competitive in order to attract, retain and motivate the most talented executive officers who will drive company objectives. |
| • | Pay for Individual Achievement. We believe that each executive officer’s total compensation should correlate to the scope of his or her responsibilities and relative contributions to the Company’s performance. |
2013 Executive Compensation Highlights
| • | In recent years, the Company has focused on (i) motivating our Named Executive Officers to deliver improved performance and (ii) retaining key talent during difficult business cycles. To accomplish these objectives, the Committee designed a long-term compensation program that provides value to our Named Executive Officers and other key associates upon achievement of performance goals and continued service. This long-term compensation program was also designed to complement our equity award program. |
| • | In March 2013, the Momentive Holdings Committee approved grants of performance-based restricted deferred units of Momentive Holdings and options to purchase units of Momentive Holdings under the 2011 Equity Plan to a select group of Company leaders, including our Named Executive Officers. |
| • | Where legal and business considerations permitted, we delayed the effective date of our annual merit base salary increases to July 2013 for all salaried associates globally, including for our Named Executive Officers, because earnings missed expectations in 2012. The Committee typically reviews the base salaries of our Named Executive Officers in the first quarter of each year. In July 2013, the Committee determined that measured increases to our Named Executive Officers’ base salaries were merited in light of their achievements of specific company, divisional and individual goals. |
| • | We generally continued our executive compensation program in other respects. For example, we adopted an annual cash incentive plan for 2013, which was designed to reward our Named Executive Officers for delivering increased value to the organization against annual financial goals and other critical business objectives. |
| • | Apollo, as the Company’s controlling shareholder, and its representatives continue to be actively involved in making recommendations regarding the structure of our executive compensation program and the amounts payable to our Named Executive Officers. The Company is not currently required to hold a shareholder advisory “say-on-pay” vote. |
93
Table of Contents
Evaluating Company and Individual Performance
In determining 2013 compensation, the Committee considered the following accomplishments of our Named Executive Officers in 2012:
| • | Mr. Morrison, our President and Chief Executive: The Committee considered Mr. Morrison’s strong leadership of the business during challenging business conditions, his drive for continuous process improvement, his focus on environmental and safety goals and his strong process orientation. During 2012, Mr. Morrison served as acting President—Silicones and Quartz Division. In addition, the Committee recognized the need for our CEO’s base salary to be competitive with the general market. |
| • | Mr. Carter, our Executive Vice President and Chief Financial Officer: The Committee considered his leadership related to cash management and balance sheet restructuring in a challenging business environment. Additionally, the Committee recognized his impact on the substantial process improvements and cost reductions as a significant component of the implementation of the shared services organization. |
| • | Ms. Sonnett, our Executive Vice President, Human Resources: The Committee recognized her leadership in implementing core components of the global total rewards strategy, including a global compensation framework, harmonized U.S. medical and pension plans and an integrated employee performance management process. |
| • | Mr. Johns, our Executive Vice President and General Counsel: The Committee recognized his effective management of major legal cases during 2012, the continued development of his team and the legal function and his management of external legal resources in getting results. |
| • | Mr. Fisher, our Executive Vice President of Procurement: The Committee recognized his efforts in producing significant cost productivity and his effective vendor management during difficult business conditions. Additionally, Mr. Fisher was recognized for his accomplishments related to analysis of management of raw materials. |
| • | Mr. Dandolph, our former Executive Vice President and President—Silicones and Quartz Division: The Committee recognized Mr. Dandolph for his significant efforts in restructuring MPM on the basis of global product lines which resulted in not only more agile decision making but also a reduction in the cost structure. Additionally, Mr. Dandolph drove strong EH&S results and quickly established a strong leadership presence in his new role as President—Silicones and Quartz Division. |
Use of Compensation Data
In order to obtain a general understanding of current compensation practices when setting total compensation levels for our Named Executive Officers, the Committee considers broad-based competitive market data on total compensation packages provided to executive officers with similar responsibilities at comparable companies. Such companies include those within the chemical industry, as well as those with similar revenues and operational complexity outside the chemical industry. The Committee uses third-party salary surveys, including Hewitt Executive Compensation and Towers Watson Executive Compensation surveys.
Components of Our Executive Compensation Program
The principal components of our executive compensation program are as follows:
| Type |
Components | |
| Annual Cash Compensation |
Base Salary | |
| Annual Incentive Awards | ||
| Discretionary Awards | ||
| Long-term Incentives |
Equity Awards | |
| Long-term Cash Awards | ||
| Benefits |
Health, Welfare and Retirement Benefits | |
| Other |
International Assignment Compensation | |
| Change-in-control and Severance Benefits |
94
Table of Contents
The following section describes each of these components in further detail.
Annual Cash Compensation
Base Salaries
The annual base salaries of our Named Executive Officers are designed to be commensurate with professional status, accomplishments, scope of responsibility, overall impact on the organization, and size and complexity of the business or functional operations managed. The annual base salaries of our Named Executive Officers are also intended to be externally competitive with the market.
The Committee reviews our Named Executive Officers’ base salary levels (i) annually, in conjunction with the annual performance review conducted globally for non-bargained salaried employees, and (ii) in conjunction with new hires, promotions or significant changes in job responsibilities. In approving increases to base salaries, the Committee considers various factors, such as job performance, total target compensation, impact on value creation and the externally competitive marketplace. The Committee typically conducts its annual performance reviews of base salaries in the first quarter and determines whether any increases are merited based on the prior year’s performance; however, the reviews for 2012 performance for many of our salaried non-bargained associates, including our Named Executive Officers, were deferred until July 2013 as a consequence of lower-than-expected earnings for the second half of 2012.
In July 2013, each of our Named Executive Officers received a merit increase in base salary in recognition of accomplishments in 2012 (described above under “Evaluating Company and Individual Performance”). The merit increase and any other adjustment for each Named Executive Officer is shown in the table below:
| Name |
2012 Base Salary | 2013 Base Salary | 2013 Increase | |||||||||
| Mr. Morrison |
$ | 1,050,000 | $ | 1,102,500 | 5.00 | % | ||||||
| Mr. Carter |
741,556 | 767,510 | 3.50 | % | ||||||||
| Ms. Sonnett |
416,000 | 434,720 | 4.50 | % | ||||||||
| Mr. Johns |
457,600 | 475,904 | 4.00 | % | ||||||||
| Mr. Fisher |
327,600 | 340,704 | 4.00 | % | ||||||||
| Mr. Dandolph |
400,000 | 425,000 | 6.25 | % | ||||||||
Annual Incentive Awards
Our annual incentive compensation plan is a short-term performance incentive designed to reward participants for delivering increased value to the organization against specific financial and other critical business objectives. Annual incentive compensation awards are targeted at a level that, when combined with base salaries and other components of our total rewards program, is intended to yield total annual compensation that is competitive in the external marketplace, while performance above the target is intended to yield total annual compensation above the market median.
The performance targets for the applicable components of the annual incentive compensation plan are identical for executives and other eligible, salaried employees. We strive to set annual incentive award targets that are achievable only through strong performance, believing this motivates our executives and other participants to deliver ongoing value creation, while allowing the Company to attract and retain highly talented senior executives. Annual incentive award targets are determined in connection with the development of an overall budget for Momentive Holdings and its subsidiaries. Performance measures may be based on a number of factors, such as our prior-year performance; current market trends; anticipated synergies; integration efforts around acquired assets or businesses; potential pricing actions; raw material projections; the realization of planned productivity initiatives; expansion plans; new product development; environmental, health and safety, and other strategic factors that could potentially impact operations.
95
Table of Contents
The 2013 Annual Incentive Compensation Plan
In early 2013, the MPM Committee, MSC Committee and the Compensation Committee of the Board of Managers of Momentive Holdings (the “Momentive Holdings Committee”) approved the 2013 annual incentive compensation plan for employees of the Company, MSC and their subsidiaries, which we refer to as the “2013 ICP.” Under the 2013 ICP, our Named Executive Officers and other eligible participants had the opportunity to earn annual cash incentive compensation based upon the achievement of certain performance targets.
The performance targets under the 2013 ICP for our Named Executive Officers with corporate roles (Messrs. Morrison, Carter, Johns, Fisher and Ms. Sonnett) were based 100% upon the results of our ultimate parent, Momentive Holdings, rather than on the results of the Company or MSC alone. This design recognizes the fact that most of our Named Executive Officers and many other Company associates have responsibilities for, or provide services to, both the Company and MSC under the Shared Services Agreement.
The performance targets under the 2013 ICP for our Named Executive Officer with divisional responsibilities (Mr. Dandolph) were based primarily upon the division’s results. We believe that our Division President’s incentive compensation must have a strong tie to the division’s performance where he has the greatest impact and closest line of sight, and therefore 90% of Mr. Dandolph’s performance target was tied to the division’s results. The performance targets were established based on the following performance measures:
| Performance Measure |
Description |
2013 Target | ||
| Segment EBITDA |
Segment EBITDA (earnings before interest, taxes, depreciation and amortization, adjusted to exclude certain noncash, certain other income and expenses and discontinued operations) was used as the primary profitability measure for determining the level of financial performance for management and executive annual incentive compensation purposes.
Segment EBITDA of Momentive Holdings in 2013 (“Momentive Segment EBITDA”) corresponds to the sum of “MPM Segment EBITDA” and “MSC Segment EBITDA” less certain Momentive Holdings expenses. MPM Segment EBITDA and MSC Segment EBITDA are defined herein and in MSC’s Annual Report on Form 10-K for the year ended December 31, 2013 (the “MSC 2013 Annual Report”), respectively. See Item 7 of Part II of this Annual Report for a reconciliation of MPM Segment EBITDA to Net Income (loss); see Item 7 of Part II of the 2013 MSC Annual Report for a reconciliation of MSC Segment EBITDA to Net Income (loss). |
The Momentive Segment EBITDA target for 2013 was set based upon factors impacting Momentive Holdings’ operating subsidiaries, including, but not limited to, competitive business dynamics in the markets, raw material trends, anticipated business unit growth, anticipated cost synergies and business unit budget projections. For the 2013 ICP, the targeted Momentive Segment EBITDA was $770 million. |
96
Table of Contents
| Performance Measure |
Description |
2013 Target | ||
| Cash Flow |
Cash flow encompasses Segment EBITDA, net trading capital improvement and/or usage, capital spending and interest paid along with other smaller operating cash flow items such as income taxes paid and pension contributions. The purpose of this component is to increase focus on cost control and cost reduction actions to preserve an adequate amount of liquidity to fund operations and capital expenditures, service debt and ultimately sustain the business through difficult economic cycles.
|
The cash flow targets were established as a result of budget projections. For the 2013 ICP, the targeted cash flow for Momentive Holdings was a net usage of cash equal to $255 million. | ||
| Environmental Health & Safety (“EH&S”) |
As a chemical manufacturer, our operations involve the use of hazardous materials, and are subject to extensive environmental regulation. As a result, EH&S is a core value and a critical focus for all associates. | For the 2013 ICP, we established occupational illness and injury rate (“OIIR”) and environmental reportable incidences (“ERI”) goals as our EH&S targets, and set goals for Momentive Holdings and the Company’s divisions. OIIR is measured based on the number of reportable injuries or incidents per 200,000 work hours. The 2013 goal for Momentive Holdings represents approximately a 5% improvement from prior year actual statistics. The 2013 goal for ERI is intended to continue to drive focus and improvement in our ongoing commitment to the communities in which we operate. The 2012 goal for Momentive Holdings represents an approximate 5—10% improvement from the end of the prior year. |
Each of the 2013 performance targets was measured independently such that a payout of one element was not dependent upon the achievement of the others. This was intended to keep associates focused on driving continuous improvement in EH&S and cash flow, in addition to EBITDA.
Awards under the 2013 ICP were calculated as follows: Each participant was designated a target award under the 2013 ICP based on a percentage of his or her base salary, which varies per participant based on the scope of the participant’s responsibilities and externally competitive benchmarks. Payout of the target award is based on the achievement of the performance targets described above, subject to a sliding scale and the relative weightings of the performance targets noted in the table below. Depending upon alignment, (i) achievement of Segment EBITDA ranging from 88% of target to 95% of target would be necessary in order for a participant to earn the minimum 30% of the allocated target award for the EBITDA component, and (ii) achievement of Segment EBITDA ranging from 110% of target to 128% of target would be necessary in order for a participant to earn the maximum 200% of his or her target award for the Segment EBITDA target. The payment range for achieving the performance targets for EH&S was 100% (target) and 200% (maximum) of the allocated target award for each EH&S component. The payment range for achieving the performance target for Cash Flow was 50% (minimum), 100% (target) and 200% (maximum) of the allocated target award for the Cash Flow component. These achievement and payout metrics are similar to those in prior year plan designs, which the Committee has found effective in accomplishing the purpose of the plan.
97
Table of Contents
The following table summarizes the target awards, performance measures, weightings, achievements and payouts for the 2013 ICP awards granted to our Named Executive Officers. The 2013 ICP awards will be paid in April 2014 and the amounts are reflected in the “Non-Equity Incentive Plan Compensation” column of the Summary Compensation Table shown on page 100.
| Name |
Incentive Target (% of Base Salary) |
Target Award ($) |
Performance Criteria / Weighting % |
Performance Achieved (%) |
Actual 2013 ICP Payout ($) |
|||||||||||
| C. Morrison |
100% | 1,102,500 | Momentive Segment EBITDA / 60% | 0 | % | — | ||||||||||
| EH&S Goals / 10% | 100 | % | 110,250 | |||||||||||||
| Momentive Cash Flow / 30% | 0 | % | — | |||||||||||||
| W. Carter |
80% | 614,008 | Momentive Segment EBITDA / 60% | 0 | % | — | ||||||||||
| EH&S Goals / 10% | 100 | % | 61,401 | |||||||||||||
| Momentive Cash Flow / 30% | 0 | % | — | |||||||||||||
| J. Sonnett |
70% | 304,304 | Momentive Segment EBITDA / 60% | 0 | % | — | ||||||||||
| EH&S Goals / 10% | 100 | % | 30,430 | |||||||||||||
| Momentive Cash Flow / 30% | 0 | % | — | |||||||||||||
| D. Johns |
70% | 333,133 | Momentive Segment EBITDA / 60% | 0 | % | — | ||||||||||
| EH&S Goals / 10% | 100 | % | 33,313 | |||||||||||||
| Momentive Cash Flow / 30% | 0 | % | — | |||||||||||||
| N. Fisher |
60% | 204,422 | Momentive Segment EBITDA / 60% | 0 | % | — | ||||||||||
| EH&S Goals / 10% | 100 | % | 20,442 | |||||||||||||
| Momentive Cash Flow / 30% | 0 | % | — | |||||||||||||
| J. Dandolph |
80% | 340,000 | Momentive Segment EBITDA / 10% | 0 | % | — | ||||||||||
| Division Segment EBITDA / 50% | 30 | % | — | |||||||||||||
| EH&S Goals / 10% | 0 | % | — | |||||||||||||
| Division Cash Flow / 30% | 0 | % | — | |||||||||||||
Discretionary Awards
The CEO periodically uses discretionary awards to reward exemplary efforts. Often, such efforts are required by atypical business conditions or are related to special projects impacting long-term business results. Discretionary awards are also used for retention purposes or in connection with a new hiring or promotion. Any discretionary award to an executive officer must be approved by the Committee. No discretionary awards were made to our Named Executive Officers for services performed in 2013.
Long-term Incentive Awards
Equity Awards
The Committee believes that equity awards play an important role in creating incentives to maximize Company performance, motivating and rewarding long-term value creation, and further aligning the interests of our executive officers with those of our shareholders. Our Named Executive Officers, as well as other members of the leadership team and other eligible associates, participate in equity plans sponsored by Momentive Holdings, MSC Holdings or MPM Holdings. Awards under these plans are factored into the executive compensation program established by the Committee. Our long-term strategy includes the use of periodic grants, rather than ongoing annual grants of equity. We believe that periodic grants provide an incentive toward a long-term projected value.
Our equity awards contain time, performance and service vesting requirements. Awards that are conditioned on time and service vesting requirements function as a retention incentive, while awards that are conditioned on performance and service vesting requirements are linked to the attainment of specific long-term objectives.
98
Table of Contents
The type of equity awards we have historically used are (i) options to purchase common units and (ii) restricted deferred units. Prior to the Momentive Combination, Messrs. Morrison, Carter and Fisher received awards under the 2004 Stock Incentive Plan (the “MSC 2004 Stock Plan”) and the 2004 Deferred Compensation Plan (the “MSC 2004 DC Plan”) and Ms. Sonnett received an award under the 2007 Long-term Incentive Plan (the “MSC 2007 Long-term Plan”), which plans are administered by MSC Holdings or MSC. Prior to the Momentive Combination, Messrs. Johns and Dandolph received awards under the 2007 Long-term Incentive Plan administered by MPM Holdings (the “MPM 2007 Plan”). At the time of the Momentive Combination, all outstanding equity awards that covered common units of MSC Holdings and shares of MPM Holdings were converted to cover units of Momentive Holdings. In February 2011, the Momentive Holdings Committee approved and granted awards under a new long-term equity incentive plan for key leaders and directors of the Company and MSC (the “2011 Equity Plan”). Each of these equity plans are described in the “Narrative to Outstanding Equity Awards Table” and/or the “Narrative to the Nonqualified Deferred Compensation Table,” below.
2013 Equity Grants
In March 2013, the Momentive Holdings Committee approved grants of performance-based restricted deferred units of Momentive Holdings and options to purchase units of Momentive Holdings under the 2011 Equity Plan to a select group of Company leaders, including our Named Executive Officers. The amount of the award for each Named Executive Officer was customized based upon the current value of such Named Executive Officer’s existing equity holdings, the target amount of his or her 2012 LTIP award (defined below) and Momentive Holdings’ 2013-2016 business plan. The choice to provide a long-term incentive in the form of equity in 2013 was based on consideration of the overall mix of long-term cash and equity incentives.
The 2013 grants to Named Executive Officers are subject to time-based or performance-based vesting requirements. The time-based awards require continued service, while the performance-based awards vest upon both the achievement of certain unit prices following certain corporate transactions involving Momentive Holdings and continued service, which we believe encourages the attainment of specific long-term financial objectives. The material terms of the grants made to our Named Executive Officers in 2013 are further described in the Narrative to the Grants of Plan-Based Awards Table.
Long-term Cash Awards
The Committee may, from time to time, approve long-term cash awards or plans for our key associates, including our Named Executive Officers. These awards are designed to pay over extended performance periods, subject to the achievement of specified, measurable performance goals, and are further conditioned upon continued employment. As such, these awards are useful in providing a defined value for achievement of our financial targets, as well as leadership stability. In addition, long-term cash awards help complement equity awards which are not yet liquid.
Our Named Executive Officers currently participate in the Momentive Holdings LLC 2012 Long-term Cash Incentive Plan (the “2012 LTIP”). Awards under the 2012 LTIP are based on a percentage of base salary and are subject to time and service requirements, as well as the achievement of key performance objectives supporting the long-term health of the business. Under the 2012 LTIP, 50% of a grantee’s target award will be paid in April 2015 if the grantee is still actively employed at that time, or upon a Complete Change in Control (as defined in the 2011 Equity Plan) prior to April 1, 2015. Payment of the remaining 50% of the target award, which is payable in 25% increments, is conditioned upon the achievement by Momentive Holdings of certain annual EBITDA targets as well as continued employment through the applicable payment date. These amounts will be paid, if earned, no earlier than the first quarter of 2016. The measurement period for the achievement of the annual EBITDA targets begins January 1, 2013 and runs through fiscal Year-End 2020. As of December 31, 2013, the EBITDA targets had not yet been achieved. The 2012 LTIP will terminate if the EBITDA targets have not been achieved by fiscal Year-End 2020. No new long-term cash awards or plans were adopted in 2013.
99
Table of Contents
Benefits
The Company provides a comprehensive group of benefits to eligible associates, including our Named Executive Officers. These include health and welfare benefits as well as retirement benefits. Our benefit programs are designed to provide market competitive benefits for associates and their covered dependents.
Each of our Named Executive Officers participates in qualified defined benefit and defined contribution retirement plans on substantially the same terms as other participating employees of MPM and MSC, as applicable. In addition, because individuals are subject to U.S. tax limitations on contributions to qualified retirement plans, in January 2013, MPM adopted a defined contribution Supplemental Executive Retirement Plan, a nonqualified plan, to provide these associates, including our Named Executive Officers, with an incremental benefit on eligible earnings above the U.S. tax limits for qualified plans. Our Named Executive Officers are eligible to participate in the nonqualified plans on the same basis as our other highly compensated salaried associates.
Our savings plan, a defined contribution plan (the “MPM 401(k) Plan”), covers our U.S. employees. This plan allows eligible employees to make pretax contributions from 1% to 15% of eligible earnings for highly-compensated employees and 30% for all other employees up to the federal limits for qualified plans. Those employees are also eligible to receive matching contributions from the Company equal to 100% on contributions of up to 5% of eligible earnings. All other employees are eligible to receive matching contributions from the Company of 50% of contributions of up to either 7% or 8%, depending on the date of hire. In addition, the Company makes an annual retirement contribution ranging from 3% to 7% of eligible compensation, depending on years of benefit service, to eligible associates actively employed on the last day of the year. An additional company contribution may be made if we achieve specified annual financial goals established at the beginning of each plan year. Messrs. Morrison, Carter, Fisher and Ms. Sonnett participate in MSC’s defined contribution plan (the “MSC 401(k) Plan”), which provides substantially the same benefits as those the Company provides to its U.S. salaried exempt employees.
There were no significant changes to the Company’s benefit plans in 2013 that would impact our Named Executive Officers. There is a description of these plans in the Narrative to the Pension Benefits Table and Narrative to the Nonqualified Deferred Compensation Table below
Other
International Assignment Compensation
The Company may provide certain additional benefits to an executive officer if he or she is on an international assignment. These benefits are externally competitive and a means to compensate the executive officer for financial expenses that would not exist if the executive remained in his or her home country. For example, the Company may provide a disturbance allowance, family travel and housing allowances, tax equalization payments, and reimbursements or payments for relocation to the executive officer’s home country. We believe that, as a growing global company, it is necessary to offer this compensation to encourage key employees and executives to temporarily relocate for strategic business reasons. Although none of our Named Executive Officers received international assignment compensation in fiscal year 2013, we have provided such compensation to Named Executive Officers in the past and may do so in the future.
Change-in-Control and Severance Benefits
Our Named Executive Officers are generally entitled to change-in-control and severance protections. We believe that appropriate change-in-control and severance protections accomplish two objectives. First, they create an environment where key executives are able to take actions in the best interest of the Company without incurring undue personal risk. Second, they foster management stability during periods of potential uncertainty. We are also cognizant that excessive pay in the way of change-in-control and severance protection would not be
100
Table of Contents
in the best interest of the Company because such pay may encourage undue risk-taking. In an attempt to balance the delicate equation, the Committee has determined to provide these benefits very selectively. The change-in-control and severance benefits payable to our Named Executive Officers are discussed in the Narrative to the Summary Compensation Table and in the discussion on Potential Payments Upon Termination of Employment, below.
Summary Compensation Table—Fiscal 2013
The following table provides information about the compensation for the years ended December 31, 2013, 2012 and 2011 for our Chief Executive Officer, Chief Financial Officer and our three next most highly compensated executive officers as of December 31, 2013 and one former executive officer who resigned from the Company in August 2013 but who would have been among the three next most highly compensated executive officers if he had remained an executive officer of the Company at December 31, 2013. We collectively refer to such individuals as our Named Executive Officers. The compensation for those Named Executive Officers who provide services to us and MSC on a shared basis is shown regardless of the source of compensation or the cost allocations of any compensation amounts under the Shared Services Agreement.
SUMMARY COMPENSATION TABLE—FISCAL 2013
| Name and Principal Position (a) |
Year (b) |
Salary ($) (c) |
Bonus ($) (d) |
Stock Awards ($) (e) |
Options Awards ($) (f) (1) |
Non-Equity Incentive Plan Compensation ($) (g) (2) |
Change in Pension Value and Nonqualified Deferred Compensation Earnings ($) (h) (3) |
All Other Compen- sation ($) (i) (4) |
Total ($) (j) |
|||||||||||||||||||||||||||
| Craig O. Morrison |
2013 | 1,075,240 | — | 805,245 | 350,304 | 110,250 | — | 98,677 | 2,439,716 | |||||||||||||||||||||||||||
| President and Chief Executive Officer |
2012 | 1,024,039 | — | — | 72,364 | 280,035 | 69,981 | 56,563 | 1,502,982 | |||||||||||||||||||||||||||
| 2011 | 986,538 | — | 911,687 | 1,311,610 | 106,000 | 23,721 | 119,818 | 3,459,374 | ||||||||||||||||||||||||||||
| William H. Carter |
2013 | 754,034 | — | 740,036 | 321,937 | 61,401 | — | 76,576 | 1,953,984 | |||||||||||||||||||||||||||
| Executive Vice President and Chief Financial Officer |
2012 | 726,747 | — | — | 57,890 | 158,218 | 92,415 | 39,410 | 1,074,680 | |||||||||||||||||||||||||||
| 2011 | 705,651 | — | 729,352 | 1,049,288 | 60,465 | 28,301 | 72,166 | 2,645,223 | ||||||||||||||||||||||||||||
| Judith S. Sonnett |
2013 | 425,000 | — | 379,916 | 165,274 | 30,430 | — | 59,062 | 1,059,682 | |||||||||||||||||||||||||||
| Executive Vice President, Human Resources |
2012 | 407,692 | — | — | 720 | 66,568 | 31,800 | 31,712 | 538,492 | |||||||||||||||||||||||||||
| 2011 | 400,000 | — | 721,636 | 1,038,192 | 25,440 | 11,283 | 46,650 | 2,243,201 | ||||||||||||||||||||||||||||
| Douglas A. Johns |
2013 | 466,400 | — | 271,908 | 118,287 | 33,313 | — | 46,466 | 936,374 | |||||||||||||||||||||||||||
| Executive Vice President and General Counsel |
2012 | 445,661 | — | — | — | 73,225 | 195,968 | 25,664 | 740,518 | |||||||||||||||||||||||||||
| 2011 | 418,658 | — | 189,806 | 273,067 | 22,260 | 322,615 | 15,686 | 1,242,092 | ||||||||||||||||||||||||||||
| Nathan E. Fisher |
2013 | 333,900 | — | 253,334 | 110,208 | 20,442 | — | 41,347 | 759,231 | |||||||||||||||||||||||||||
| Executive Vice President, Procurement |
2012 | 321,058 | — | — | — | 43,685 | 16,975 | 26,273 | 407,991 | |||||||||||||||||||||||||||
| 2011 | 315,000 | — | 372,556 | 535,980 | 16,695 | 5,337 | 33,692 | 1,279,260 | ||||||||||||||||||||||||||||
| John C. Dandolph* |
2013 | 266,539 | — | 326,711 | 142,128 | — | — | 119,310 | 854,688 | |||||||||||||||||||||||||||
| Executive Vice President and President, Silicones and Quartz Division |
2012 | 371,343 | 100,000 | — | — | 68,750 | 97,074 | 136,759 | 773,926 | |||||||||||||||||||||||||||
| 2011 | 295,000 | — | 63,551 | 91,429 | — | 88,716 | 363,146 | 901,842 | ||||||||||||||||||||||||||||
| * | Mr. Dandolph resigned from the Company in August 2013. |
| (1) | The amounts shown in column (f) for 2013 reflect the grant date fair value of stock-based awards granted under the 2011 Equity Plan as computed in accordance with ASC Topic 718. The grant date fair value of restricted deferred units of Momentive Holdings with performance conditions assume the probable outcome of such performance conditions. For discussion of the assumptions used in computing the fair value of stock-based awards, refer to footnote 9 to the audited financial statements included in Item II of this report. The terms of the awards granted under the 2011 Equity Plan and related performance conditions are described in the Narrative to the Grants of Plan Based Awards Table below. |
| (2) | The amounts shown in column (g) for 2013 reflect the amounts earned under the 2013 ICP, our annual incentive compensation plan, based on performance achieved for 2013. The material terms of the 2013 ICP are described in the Compensation Discussion & Analysis above. The 2013 ICP awards will be paid in April 2014. |
101
Table of Contents
| (3) | The amounts shown in column (h) reflect no actuarial increase in the present value of benefits under the MPM U.S. Pension Plan and MPM Supplemental Plan for Mr. Johns and no actuarial increase in the present value of benefits under the MPM U.S. Pension Plan and the forfeited value of the unvested MPM Supplemental Plan for Mr. Dandolph, and under the MSC U.S. Pension Plan and MSC Supplemental Plan for Messrs. Morrison, Carter, Fisher and Ms. Sonnett. In 2013, there was a decrease in the actuarial present value of benefits under the MSC U.S. Pension Plan and MSC Supplemental Plan for all Named Executive Officers due to an increase in the discount rate assumptions used to calculate the actuarial value of benefits under those plans. The amount of the decrease for Mr. Morrison was $18,177 for the MSC U.S. Pension Plan and $73,174 for the MSC Supplemental Plan. The amount of the decrease for Mr. Carter was $31,938 for the MSC U.S. Pension Plan and $86,986 for the MSC Supplemental Plan. The amount of the decrease for Ms. Sonnett was $25,551 for the MSC U.S. Pension Plan and $15,077 for the MSC Supplemental Plan. The amount of the decrease for Mr. Johns was $15,105 for the MPM U.S. Pension Plan and $70,271 for the MPM Supplemental Plan. The amount of the decrease for Mr. Fisher was $17,544 for the MSC U.S. Pension Plan and $5,269 for the MSC Supplemental Plan. The amount of the decrease for Mr. Dandolph was $18,371 for the MPM U.S. Pension Plan. The MPM Supplemental Plan was not applicable to Mr. Dandolph because he forfeited the benefit under that plan as a result of his resignation prior to vesting. See the Pension Benefits Table below for additional information regarding our pension calculations, including the assumptions used for these calculations. There were no above-market earnings on nonqualified deferred compensation plans for our Named Executive Officers for 2013. |
| (4) | The amount shown for 2013 in column (i) for Mr. Morrison includes an accrued future contribution of $55,014 to the MSC Supplemental Executive Retirement Plan (“SERP”) and an accrued future annual retirement contribution to his 401(k) Plan account of $10,200. In addition, the amount includes perquisite payments made by the Company to Mr. Morrison totaling $19,594 which relate to taxes owed by Mr. Morrison but paid by the Company. For Mr. Carter, the amount shown for 2013 in column (i) includes an accrued future contribution of $32,863 to the MSC SERP and an accrued future annual retirement contribution to his 401(k) Plan account of $12,750. In addition, the amount includes perquisite payments made by the Company to Mr. Carter totaling $15,863 which relate to taxes owed by Mr. Carter but paid by the Company. For Ms. Sonnett the amount shown for 2013 in column (i) includes a $12,750 company matching contributions to her 401(k) Plan account, an accrued future contribution of $11,828 to the MSC SERP and an accrued future annual retirement contribution to her 401(k) Plan account of $12,750. In addition, the amount includes perquisite payments made by the Company to Ms. Sonnett totaling $15,552 which includes $15,510 of taxes owed by Ms. Sonnett but paid by the Company. For Mr. Johns the amount shown for 2013 in column (i) includes an accrued future company contribution of $14,231 to the MPM Supplemental Executive Retirement Plan (“SERP”) and an accrued future company annual retirement contribution to our 401(k) Plan of $15,300. For Mr. Fisher the amount shown for 2013 in column (i) includes a $12,750 MSC matching contribution to his MSC 401(k) Plan account, an accrued future MSC contribution of $6,129 to the MSC SERP and an accrued future MSC annual retirement contribution to the MSC 401(k) Plan of $10,200. The amount shown for 2013 in column (i) for Mr. Dandolph includes $12,750 of company matching contributions to his 401(k) Plan account, $17,300 of vacation pay paid upon his resignation and $84,912 in perquisite payments, which includes $9,730 of legal fees paid by the Company related to Mr. Dandolph’s wife’s relocation to the U.S., $21,323 related to relocation expenses and $53,359 of U.S. and Chinese taxes owed by Mr. Dandolph but paid by the Company. |
102
Table of Contents
Grants of Plan-Based Awards—Fiscal 2013
The following table presents information about grants of awards during the year ended December 31, 2013 under our 2013 ICP and 2011 Equity Plan.
| Name (a) |
Grant Date (b) |
Estimated Future |
Estimated Future |
All Other Stock Awards: Number of Shares of Stock or Units (#) (i) |
All
Other Option Awards: Number of Securities Underlying Options (#) (j) |
Exercise or Base Price of Option Awards ($/Sh) (k) |
Grant Date Fair Value of Stock and Option Awards ($) (l) |
|||||||||||||||||||||||||||||
| Threshold ($) (c) |
Target ($) (d) |
Maximum ($) (e) |
Target
(#) (g) |
|||||||||||||||||||||||||||||||||
| Craig O. Morrison |
||||||||||||||||||||||||||||||||||||
| 2013 ICP |
— | 55,125 | 1,102,500 | 2,205,000 | — | — | — | — | — | |||||||||||||||||||||||||||
| 2011 Equity Plan: |
||||||||||||||||||||||||||||||||||||
| Options |
3/8/2013 | — | — | — | — | — | 778,454 | 1.42 | 350,304 | |||||||||||||||||||||||||||
| RDUs |
3/8/2013 | — | — | — | 614,691 | — | — | — | 805,245 | |||||||||||||||||||||||||||
| William H. Carter |
||||||||||||||||||||||||||||||||||||
| 2013 ICP |
— | 30,700 | 614,008 | 1,228,017 | — | — | — | — | — | |||||||||||||||||||||||||||
| 2011 Equity Plan: |
||||||||||||||||||||||||||||||||||||
| Options |
3/8/2013 | — | — | — | — | — | 715,415 | 1.42 | 321,937 | |||||||||||||||||||||||||||
| RDUs |
3/8/2013 | — | — | — | 564,913 | — | — | — | 740,036 | |||||||||||||||||||||||||||
| Judith A. Sonnett |
||||||||||||||||||||||||||||||||||||
| 2013 ICP |
— | 15,215 | 304,304 | 608,608 | — | — | — | — | — | |||||||||||||||||||||||||||
| 2011 Equity Plan: |
||||||||||||||||||||||||||||||||||||
| Options |
3/8/2013 | — | — | — | — | — | 367,276 | 1.42 | 165,274 | |||||||||||||||||||||||||||
| RDUs |
3/8/2013 | — | — | — | 290,012 | — | — | — | 379,916 | |||||||||||||||||||||||||||
| Douglas A. Johns |
||||||||||||||||||||||||||||||||||||
| 2013 ICP |
— | 16,657 | 333,133 | 666,266 | — | — | — | — | — | |||||||||||||||||||||||||||
| 2011 Equity Plan: |
— | — | — | — | — | |||||||||||||||||||||||||||||||
| Options |
3/8/2013 | — | — | — | — | — | 262,861 | 1.42 | 118,287 | |||||||||||||||||||||||||||
| RDUs |
3/8/2013 | — | — | — | 207,563 | — | — | — | 271,908 | |||||||||||||||||||||||||||
| Nathan E. Fisher |
||||||||||||||||||||||||||||||||||||
| 2013 ICP |
— | 10,221 | 204,422 | 408,845 | — | — | — | — | — | |||||||||||||||||||||||||||
| 2011 Equity Plan: |
||||||||||||||||||||||||||||||||||||
| Options |
3/8/2013 | — | — | — | — | — | 244,906 | 1.42 | 110,208 | |||||||||||||||||||||||||||
| RDUs |
3/8/2013 | — | — | — | 193,385 | — | — | — | 253,334 | |||||||||||||||||||||||||||
| John C. Dandolph |
||||||||||||||||||||||||||||||||||||
| 2011 Equity Plan: |
— | — | — | — | — | |||||||||||||||||||||||||||||||
| Options |
3/8/2013 | — | — | — | — | — | 315,841 | 1.42 | 142,128 | |||||||||||||||||||||||||||
| RDUs |
3/8/2013 | — | — | — | 249,398 | — | — | — | 326,711 | |||||||||||||||||||||||||||
Narrative to Summary Compensation Table and Grants of Plan-Based Awards Table
Employment Agreements
The Company or MSC has employment agreements or employment letters with certain of our Named Executive Officers, which provide for their terms of compensation and benefits, severance, and certain restrictive covenants. Further details regarding the severance and restrictive covenant provisions are described below under “Potential Payments upon a Termination or Change in Control.”
2013 Annual Incentive Compensation Plan (2013 ICP)
Information on the 2013 ICP targets, performance components, weightings, and payouts for each of our Named Executive Officers can be found in the Compensation Discussion and Analysis section of this Report.
Unit Options and Restricted Deferred Units Granted under the 2011 Equity Plan
On March 8, 2013, our Named Executive Officers received awards of performance-based restricted deferred units (“RDUs”) of Momentive Holdings and options to purchase units of Momentive Holdings under the 2011 Equity Plan. Such awards are shown in the table above. The RDUs are nonvoting units of measurement which are deemed for bookkeeping purposes to be equivalent to one common unit of Momentive Holdings.
103
Table of Contents
The unit options vest and become exercisable in four equal annual installments on December 31 of each year from 2013 to 2016. However, in the event of certain change-in-control transactions, the remaining unvested unit options vest six months following the date of such a transaction.
The RDUs vest on the earlier to occur of i) one year from the date that the common unit value is at least $3.50 following certain corporate transactions and ii) the six-month anniversary of the date that the common unit value is at least $3.50 following certain change-in-control transactions.
The vesting terms of the unit options and RDUs described above are each conditioned on the Named Executive Officer’s continued employment through the vesting dates specified above, subject to certain exceptions. With respect to any RDUs that vest as a result of a corporate or change-in-control transaction, such RDUs will be delivered promptly following the vesting date, or a cash payment will be delivered in settlement thereof, depending on the type of transaction. The unit options and RDUs contain restrictions on transferability and other customary terms and conditions.
Outstanding Equity Awards at Fiscal 2013 Year-End
The following table presents information about outstanding and unexercised options and outstanding and unvested stock awards held by our Named Executive Officers at December 31, 2013. The securities underlying the awards are common units of Momentive Holdings and were granted under the MSC 2004 Stock Plan, the MSC 2007 Long-term Plan, the MPM 2007 Plan and the 2011 Equity Plan. See the Narrative to the Outstanding Equity Awards Table below for a discussion of these plans and the vesting conditions applicable to the awards.
OUTSTANDING EQUITY AWARDS TABLE
2013 FISCAL YEAR-END
| Option Awards | Stock Awards | |||||||||||||||||||||||||||||||||||
| Name (a) |
Number of Securities Underlying Unexercised Options (#) Exercisable (b) |
Number of Securities Underlying Unexercised Options (#) Unexercisable (c) |
Equity Incentive Plan Awards: Number of Securities Underlying Unexercised Unearned Options (#) (d) |
Option Exercise Price ($) (e) |
Option Expiration Date (f) |
Number of Shares or Units of Stock That Have Not Vested (#) (g) |
Market Value of Shares or Units of Stock That Have Not Vested ($) (h) (1) |
Equity Incentive Plan Awards: Number of Unearned Shares, Units or Other Rights That Have Not Vested (#) (i) |
Equity Incentive Plan Awards: Market or Payout Value of Unearned Shares, Units or Other Rights That Have Not Vested ($) (j) (1) |
|||||||||||||||||||||||||||
| Craig O. Morrison |
||||||||||||||||||||||||||||||||||||
| MSC 2004 Stock Plan: |
||||||||||||||||||||||||||||||||||||
| Tranche A Options |
301,514 | — | — | 6.22 | 12/31/2017 | — | — | — | — | |||||||||||||||||||||||||||
| Tranche B Options |
301,514 | — | — | 6.22 | 12/31/2017 | — | — | — | — | |||||||||||||||||||||||||||
| 2011 Equity Plan: |
||||||||||||||||||||||||||||||||||||
| 2011 Grant: |
||||||||||||||||||||||||||||||||||||
| Tranche A Options2 |
217,875 | 72,626 | — | 4.85 | 2/23/2021 | — | — | — | — | |||||||||||||||||||||||||||
| Tranche B Options3 |
— | — | 145,250 | 4.85 | 2/23/2021 | — | — | — | — | |||||||||||||||||||||||||||
| Tranche C Options4 |
— | — | 145,250 | 4.85 | 2/23/2021 | — | — | — | — | |||||||||||||||||||||||||||
| Tranche A RDUs5 |
— | — | — | — | — | 24,208 | 29,292 | — | — | |||||||||||||||||||||||||||
| Tranche B RDUs3 |
— | — | — | — | — | — | — | 48,417 | 58,585 | |||||||||||||||||||||||||||
| Tranche C RDUs4 |
— | — | — | — | — | — | — | 48,417 | 58,585 | |||||||||||||||||||||||||||
| 2013 Grant: |
||||||||||||||||||||||||||||||||||||
| Unit Options6 |
194,613 | 583,841 | — | 1.42 | 3/8/2023 | — | — | — | — | |||||||||||||||||||||||||||
| RDUs7 |
— | — | — | — | — | — | — | 614,691 | 743,776 | |||||||||||||||||||||||||||
104
Table of Contents
| Option Awards | Stock Awards | |||||||||||||||||||||||||||||||||||
| Name (a) |
Number of Securities Underlying Unexercised Options (#) Exercisable (b) |
Number of Securities Underlying Unexercised Options (#) Unexercisable (c) |
Equity Incentive Plan Awards: Number of Securities Underlying Unexercised Unearned Options (#) (d) |
Option Exercise Price ($) (e) |
Option Expiration Date (f) |
Number of Shares or Units of Stock That Have Not Vested (#) (g) |
Market Value of Shares or Units of Stock That Have Not Vested ($) (h) (1) |
Equity Incentive Plan Awards: Number of Unearned Shares, Units or Other Rights That Have Not Vested (#) (i) |
Equity Incentive Plan Awards: Market or Payout Value of Unearned Shares, Units or Other Rights That Have Not Vested ($) (j) (1) |
|||||||||||||||||||||||||||
| William H. Carter |
||||||||||||||||||||||||||||||||||||
| MSC 2004 Stock Plan: |
||||||||||||||||||||||||||||||||||||
| Tranche A Options |
241,211 | — | — | 6.22 | 12/31/2017 | — | — | — | — | |||||||||||||||||||||||||||
| Tranche B Options |
241,211 | — | — | 6.22 | 12/31/2017 | — | — | — | — | |||||||||||||||||||||||||||
| 2011 Equity Plan: |
||||||||||||||||||||||||||||||||||||
| 2011 Grant: |
||||||||||||||||||||||||||||||||||||
| Tranche A Options2 |
174,300 | 58,101 | — | 4.85 | 2/23/2021 | — | — | — | — | |||||||||||||||||||||||||||
| Tranche B Options3 |
— | — | 116,200 | 4.85 | 2/23/2021 | — | — | — | — | |||||||||||||||||||||||||||
| Tranche C Options4 |
— | — | 116,200 | 4.85 | 2/23/2021 | — | — | — | — | |||||||||||||||||||||||||||
| Tranche A RDUs5 |
— | — | — | — | — | 19,367 | 23,434 | — | — | |||||||||||||||||||||||||||
| Tranche B RDUs3 |
— | — | — | — | — | — | — | 38,733 | 46,867 | |||||||||||||||||||||||||||
| Tranche C RDUs4 |
— | — | — | — | — | — | — | 38,733 | 46,867 | |||||||||||||||||||||||||||
| 2013 Grant: |
||||||||||||||||||||||||||||||||||||
| Unit Options6 |
178,853 | 536,562 | — | 1.42 | 3/8/2023 | — | — | — | — | |||||||||||||||||||||||||||
| RDUs7 |
— | — | — | — | — | — | — | 564,913 | 683,545 | |||||||||||||||||||||||||||
| Judith A. Sonnett |
||||||||||||||||||||||||||||||||||||
| MSC 2007 Long-term Plan Options10 |
— | — | 18,000 | 10.81 | 12/31/2017 | — | — | — | — | |||||||||||||||||||||||||||
| 2011 Equity Plan: |
||||||||||||||||||||||||||||||||||||
| 2011 Grant: |
||||||||||||||||||||||||||||||||||||
| Tranche A Options2 |
172,458 | 57,486 | — | 4.85 | 2/23/2021 | — | — | — | — | |||||||||||||||||||||||||||
| Tranche B Options3 |
— | — | 114,971 | 4.85 | 2/23/2021 | — | — | — | — | |||||||||||||||||||||||||||
| Tranche C Options4 |
— | — | 114,971 | 4.85 | 2/23/2021 | — | — | — | — | |||||||||||||||||||||||||||
| Tranche A RDUs5 |
— | — | — | — | — | 19,161 | 23,185 | — | — | |||||||||||||||||||||||||||
| Tranche B RDUs3 |
— | — | — | — | — | — | — | 38,324 | 46,372 | |||||||||||||||||||||||||||
| Tranche C RDUs4 |
— | — | — | — | — | — | — | 38,324 | 46,372 | |||||||||||||||||||||||||||
| 2013 Grant: |
||||||||||||||||||||||||||||||||||||
| Unit Options6 |
91,819 | 275,457 | — | 1.42 | 3/8/2023 | — | — | — | — | |||||||||||||||||||||||||||
| RDUs7 |
— | — | — | — | — | — | — | 290,012 | 350,915 | |||||||||||||||||||||||||||
| Douglas A. Johns |
||||||||||||||||||||||||||||||||||||
| MPM 2007 Plan: |
||||||||||||||||||||||||||||||||||||
| Tranche A Options |
89,979 | — | — | 2.59 | 3/30/2017 | — | — | — | — | |||||||||||||||||||||||||||
| Tranche B Options8 |
— | — | 89,941 | 2.59 | 3/30/2017 | — | — | — | — | |||||||||||||||||||||||||||
| Tranche C Options9 |
— | — | 89,941 | 2.59 | 3/30/2017 | — | — | — | — | |||||||||||||||||||||||||||
| 2011 Equity Plan: |
||||||||||||||||||||||||||||||||||||
| 2011 Grant: |
||||||||||||||||||||||||||||||||||||
| Tranche A Options2 |
45,360 | 15,120 | — | 4.85 | 2/23/2021 | — | — | — | — | |||||||||||||||||||||||||||
| Tranche B Options3 |
— | — | 30,240 | 4.85 | 2/23/2021 | — | — | — | — | |||||||||||||||||||||||||||
| Tranche C Options4 |
— | — | 30,240 | 4.85 | 2/23/2021 | — | — | — | — | |||||||||||||||||||||||||||
| Tranche A RDUs5 |
— | — | — | — | — | 5,040 | 6,098 | — | — | |||||||||||||||||||||||||||
| Tranche B RDUs3 |
— | — | — | — | — | — | — | 10,080 | 12,197 | |||||||||||||||||||||||||||
| Tranche C RDUs4 |
— | — | — | — | — | — | — | 10,080 | 12,197 | |||||||||||||||||||||||||||
| 2013 Grant: |
||||||||||||||||||||||||||||||||||||
| Unit Options6 |
65,715 | 197,146 | — | 1.42 | 3/8/2023 | — | — | — | — | |||||||||||||||||||||||||||
| RDUs7 |
— | — | — | — | — | — | — | 207,563 | 251,151 | |||||||||||||||||||||||||||
105
Table of Contents
| Option Awards | Stock Awards | |||||||||||||||||||||||||||||||||||
| Name (a) |
Number of Securities Underlying Unexercised Options (#) Exercisable (b) |
Number of Securities Underlying Unexercised Options (#) Unexercisable (c) |
Equity Incentive Plan Awards: Number of Securities Underlying Unexercised Unearned Options (#) (d) |
Option Exercise Price ($) (e) |
Option Expiration Date (f) |
Number of Shares or Units of Stock That Have Not Vested (#) (g) |
Market Value of Shares or Units of Stock That Have Not Vested ($) (h) (1) |
Equity Incentive Plan Awards: Number of Unearned Shares, Units or Other Rights That Have Not Vested (#) (i) |
Equity Incentive Plan Awards: Market or Payout Value of Unearned Shares, Units or Other Rights That Have Not Vested ($) (j) (1) |
|||||||||||||||||||||||||||
| Nathan E. Fisher |
||||||||||||||||||||||||||||||||||||
| MSC 2004 Stock Plan: |
||||||||||||||||||||||||||||||||||||
| Tranche A Options |
46,929 | — | — | 6.22 | 12/31/2017 | — | — | — | — | |||||||||||||||||||||||||||
| Tranche B Options |
46,929 | — | — | 6.22 | 12/31/2017 | — | — | — | — | |||||||||||||||||||||||||||
| 2011 Equity Plan: |
||||||||||||||||||||||||||||||||||||
| 2011 Grant: |
||||||||||||||||||||||||||||||||||||
| Tranche A Options2 |
89,032 | 29,678 | — | 4.85 | 2/23/2021 | — | — | — | — | |||||||||||||||||||||||||||
| Tranche B Options3 |
— | — | 59,356 | 4.85 | 2/23/2021 | — | — | — | — | |||||||||||||||||||||||||||
| Tranche C Options4 |
— | — | 59,356 | 4.85 | 2/23/2021 | — | — | — | — | |||||||||||||||||||||||||||
| Tranche A RDUs5 |
— | — | — | — | — | 9,893 | 11,971 | — | — | |||||||||||||||||||||||||||
| Tranche B RDUs3 |
— | — | — | — | — | — | — | 19,785 | 23,940 | |||||||||||||||||||||||||||
| Tranche C RDUs4 |
— | — | — | — | — | — | — | 19,785 | 23,940 | |||||||||||||||||||||||||||
| 2013 Grant: |
||||||||||||||||||||||||||||||||||||
| Unit Options6 |
61,226 | 183,680 | — | 1.42 | 3/8/2023 | — | — | — | — | |||||||||||||||||||||||||||
| RDUs7 |
— | — | — | — | — | — | — | 193,385 | 233,996 | |||||||||||||||||||||||||||
| John C. Dandolph |
||||||||||||||||||||||||||||||||||||
| 2011 Equity Plan: |
— | — | — | — | ||||||||||||||||||||||||||||||||
| 2011 Grant: |
||||||||||||||||||||||||||||||||||||
| Tranche A Options2 |
— | — | — | 4.85 | 2/23/2021 | — | — | — | — | |||||||||||||||||||||||||||
| Tranche B Options3 |
— | — | — | 4.85 | 2/23/2021 | — | — | — | — | |||||||||||||||||||||||||||
| Tranche C Options4 |
— | — | — | 4.85 | 2/23/2021 | — | — | — | — | |||||||||||||||||||||||||||
| Tranche A RDUs5 |
— | — | — | — | — | — | — | — | — | |||||||||||||||||||||||||||
| Tranche B RDUs3 |
— | — | — | — | — | — | — | — | — | |||||||||||||||||||||||||||
| Tranche C RDUs4 |
— | — | — | — | — | — | — | — | — | |||||||||||||||||||||||||||
| (1) | Because equity interests in our ultimate parent, Momentive Holdings, are not publicly traded, there is no closing market price at the completion of the fiscal year. The market values shown in columns (h) and (j) are based on the value of a unit of Momentive Holdings as of December 31, 2013, as determined by Momentive Holdings Board of Managers for management equity transaction purposes. In light of differences between the companies, including differences in capitalization, a value of a unit in Momentive Holdings does not necessarily equal the value of a share of the Company’s common stock. |
| (2) | This award vests in four equal annual installments on each December 31, beginning in 2011. The amount shown in column (b) is the vested amount at December 31, 2013. The amount shown in column (c) will vest ratably on December 31, 2014, subject to accelerated vesting six months following certain change-in-control transactions. |
| (3) | This award vests on the earlier to occur of (i) the two-year anniversary of the date that the common unit value is at least $10 following certain corporate transactions and (ii) six months following the date that the common unit value is at least $10 following certain change-in-control transactions. |
| (4) | This award vests on the earlier to occur of (i) the one-year anniversary of the date that the common unit value is at least $15 following certain corporate transactions and (ii) six months following the date that the common unit value is at least $15 following certain change-in-control transactions. |
| (5) | This award vests in four equal annual installments on each December 31 of 2011 through 2014. Vested RDUs are shown in the Nonqualified Deferred Compensation Table because delivery is deferred until no later than 60 days after January 1, 2015, pursuant to the terms of the award agreement. The amount shown in column (g) will vest ratably on December 31, 2014, subject to accelerated vesting six months following certain change-in-control transactions. |
| (6) | This award vests in four equal annual installments on each December 31 of 2013 through 2016. The amount shown in column (b) is the vested amount at December 31, 2013. The amount shown in column (c) will vest ratably on December 31, 2014, December 31, 2015 and December 31, 2016, subject to accelerated vesting six months following certain change-in-control transactions. |
106
Table of Contents
| (7) | This award vests on the earlier to occur of (i) the one-year anniversary of the date that the common unit value is at least $3.50 following certain corporate transactions and (ii) six months following the date that the common unit value is at least $3.50 following certain change-in-control transactions. |
| (8) | This award vests on the earlier of (i) the date that Apollo realizes an internal rate of return of at least 20% on its original investment in MPM Holdings and (ii) the date that Apollo achieves a minimum cash-on-cash return of 1.75 times its original investment in MPM Holdings. |
| (9) | This award vests on the earlier of (i) the date that Apollo realizes an internal rate of return of at least 25% on its original investment in MPM Holdings and (ii) the date that Apollo achieves a minimum cash-on-cash return of 2.25 times its original investment in MPM Holdings. |
| (10) | This award vests in percentages, depending upon the internal rate of return realized by Apollo on its original investment in MSC Holdings following the occurrence of certain corporate transactions. |
Narrative to Outstanding Equity Awards Table
2011 Equity Plan
2013 Grant
In March 2013, all of our Named Executive Officers were granted restricted deferred units and unit options under the 2011 Equity Plan, a portion of which vested on December 31, 2013. For a description of these grants and the terms of the plan, see the Grants of Plan Based Awards Fiscal 2013 Table and Narrative above.
2011 Grant
On February 23, 2011, our Named Executive Officers received awards of restricted deferred units (RDUs) and unit options in Momentive Holdings under the 2011 Equity Plan. Such awards are shown in the table above. The RDUs are nonvoting units of measurement that are deemed for bookkeeping purposes to be equivalent to one common unit of Momentive Holdings. Of the RDUs and options granted in 2011, approximately 50% are “Tranche A RDUs” and options with time-based vesting (subject to acceleration in the event of certain change-in-control transactions) and approximately 50% are “Tranche B and C RDUs” and options with performance-based vesting.
For our Named Executive Officers, the Tranche A RDUs and options vest and become exercisable in four equal annual installments on December 31 of each year from 2011 to 2014. However, in the event of certain change-in-control transactions, the remaining unvested Tranche A RDUs and options vest six months following the date of such transaction. The Tranche A RDUs that vested on December 31, 2011 and December 31, 2012 were delivered on February 28, 2013. With respect to the Tranche A RDUs that vested on December 31, 2013 and will vest on December 31, 2014, such units will be delivered within 60 days of January 1, 2015.
With respect to the performance-vesting RDUs and options, 50% are designated Tranche B and 50% are designated Tranche C. The Tranche B RDUs and options vest on the earlier to occur of (i) the two-year anniversary of the date that the common unit value is at least $10 following certain corporate transactions and (ii) six months following the date that the common unit value is at least $10 following certain change-in-control transactions. The Tranche C RDUs and options vest on the earlier to occur of (i) the one-year anniversary of the date that the common unit value is at least $15 following certain corporate transactions and (ii) six months following the date that the common unit value is at least $15 following certain change-in-control transactions. The vesting terms of the RDUs and options described above in each case are conditioned on the executive’s continued employment through the vesting dates mentioned above, subject to certain exceptions. With respect to any RDUs that vest as a result of a corporate or change-in-control transaction, such RDUs will be delivered promptly following the vesting date, or a cash payment will be delivered in settlement thereof, depending on the type of transaction. The RDUs and unit options contain restrictions on transferability and other customary terms and conditions. For information on the vested awards, see the Narrative to the Nonqualified Deferred Compensation Table.
107
Table of Contents
MSC 2007 Long-term Plan
The outstanding options held by Ms. Sonnett under the MSC 2007 Long-term Plan originally covered the equity securities of Hexion LLC and were subsequently converted into awards covering equity securities of Momentive Holdings, pursuant to the terms of the Combination Agreement. The option awards vest only if Apollo realizes certain internal rates of return on its original investment in MSC Holdings following the occurrence of certain corporate transactions.
MPM 2007 Plan
The outstanding options held by Messrs. Johns and Dandolph under the MPM 2007 Plan originally covered the equity securities of MPM Holdings and were subsequently converted into awards covering equity securities of Momentive Holdings, pursuant to the terms of the Combination Agreement. The Tranche A options under the MPM 2007 Plan reported in the table above time-vested over four or five years. The unvested Tranche B and C options vest on the earlier of (i) the date that Apollo realizes an internal rate of return of at least 20% and 25%, respectively, on its original investment in MPM Holdings and (ii) the date that Apollo achieves a minimum cash-on-cash return of 1.75 and 2.25, respectively, on its original investment in MPM Holdings. Vesting of the above awards is conditioned on the executive’s continued employment through the applicable vesting dates.
MSC 2004 Stock Incentive Plan
Messrs. Morrison and Carter were granted options under the MSC 2004 Stock Incentive Plan (the “MSC 2004 Stock Plan”), which originally covered the equity securities of Hexion LLC, now known as MSC Holdings. These options were subsequently converted into options to purchase common units of Momentive Holdings, pursuant to the terms of the Combination Agreement. The “Tranche A” options under the MSC 2004 Stock Plan reported in the table above vested over five years and were fully vested as of December 31, 2011. The “Tranche B” options under the MSC 2004 Stock Plan reported in the table vested as of August 12, 2014, the eighth anniversary of the grant date.
In addition to the RDUs and options shown above, Messrs. Morrison and Carter have deferred compensation held in the form of fully vested deferred stock units in Momentive Holdings: Mr. Morrison holds 241,211 of such units and Mr. Carter holds 192,969 of such units. These deferred stock units will be distributed upon termination of employment or retirement, and are shown in the Nonqualified Deferred Compensation Table. For information on the deferred stock units, see the Narrative to the Nonqualified Deferred Compensation Table.
Option Exercises and Stock Vested—Fiscal 2013
The following table presents information on vesting of certain awards of common units of Momentive Holdings during the year ended December 31, 2013.
108
Table of Contents
OPTION EXERCISES AND STOCK VESTED TABLE—FISCAL 2013
| Option Awards | Stock Awards | |||||||||||||||
| Name (a) |
Number of Shares Acquired on Exercise (b) |
Value Realized on Exercise (c) |
Number of Shares Acquired on Vesting (#) (d) (1) |
Value Realized on Vesting ($) (c) (2) |
||||||||||||
| Craig O. Morrison |
||||||||||||||||
| 2011 Equity Plan Tranche A RDUs |
— | — | 24,208 | 29,292 | ||||||||||||
| William H. Carter |
||||||||||||||||
| 2011 Equity Plan Tranche A RDUs |
— | — | 19,367 | 23,434 | ||||||||||||
| Judith A. Sonnett |
||||||||||||||||
| 2011 Equity Plan Tranche A RDUs |
— | — | 19,161 | 23,185 | ||||||||||||
| Douglas A. Johns |
||||||||||||||||
| 2011 Equity Plan Tranche A RDUs |
— | — | 5,040 | 6,098 | ||||||||||||
| Nathan E. Fisher |
||||||||||||||||
| 2011 Equity Plan Tranche A RDUs |
— | — | 9,892 | 11,969 | ||||||||||||
| John C. Dandolph |
||||||||||||||||
| 2011 Equity Plan Tranche A RDUs |
— | — | — | — | ||||||||||||
| (1) | The amount shown in column (d) for this award represents the number of restricted deferred units that vested on December 31, 2013. Delivery of these restricted units will occur within 60 days of January 1, 2015. |
| (2) | The amount shown in column (e) is based upon the value of a unit of Momentive Holdings on the vesting date as determined by the Momentive Holdings’ Board of Managers for management equity transaction purposes. |
Pension Benefits—Fiscal 2013
The following table presents information regarding the benefits payable to each of our Named Executive Officers at, following, or in connection with their retirement under the qualified and nonqualified defined benefit pension plans of MPM and MSC as of December 31, 2013. The table does not provide information regarding the defined contribution plans of MPM or MSC. The amounts shown in the table for each participant represent the present value of the annuitized benefit and does not represent the actual cash balance of a participant’s account. Because the MSC U.S. Pension Plan and the MSC Supplemental Plan were frozen prior to the Momentive Combination and the benefits under such plans arise solely from services provided to MSC, the costs of such plans are not allocated in any manner to MPM under the Shared Services Agreement.
109
Table of Contents
PENSION BENEFITS TABLE—FISCAL 2013
| Name (a) |
Plan Name (b) |
Number of Years Credited Service (#) (c) (1) |
Present Value of Accumulated Benefit ($) (d) (2) |
Payments During Last Fiscal Year ($) (e) |
||||||||||
| Craig O. Morrison |
MSC U.S. Pension Plan | 7.27 | 100,054 | — | ||||||||||
| MSC Supplemental Plan | 6.78 | 402,781 | — | |||||||||||
| William H. Carter |
MSC U.S. Pension Plan | 14.25 | 194,328 | — | ||||||||||
| MSC Supplemental Plan | 13.76 | 529,267 | — | |||||||||||
| Judith A. Sonnett |
MSC U.S. Pension Plan | 10.67 | 135,351 | — | ||||||||||
| MSC Supplemental Plan | 10.17 | 79,867 | — | |||||||||||
| Douglas A. Johns |
MPM U.S. Pension Plan | 5.59 | 178,000 | — | ||||||||||
| MPM Supplemental Plan | 4.92 | 819,549 | — | |||||||||||
| Nathan E. Fisher |
MSC U.S. Pension Plan | 6.33 | 73,818 | — | ||||||||||
| MSC Supplemental Plan | 5.84 | 22,169 | — | |||||||||||
| John C. Dandolph |
MPM U.S. Pension Plan | 5.59 | 58,570 | — | ||||||||||
| MPM Supplemental Plan | 4.92 | — | — | |||||||||||
| (1) | The number of years of credit service set forth in column (c) reflects benefit service years which are used to determine benefit accrual under the applicable plan, and do not necessarily reflect the Named Executive Officer’s years of vested service. |
| (2) | The accumulated benefit for the MPM U.S. Pension Plan is based on service and earnings (base salary and bonus, as described below) that are considered for the period from January 29, 2007 to August 31, 2012. The present value of accumulated benefits under the MPM Supplemental Plan for Mr. Johns plans has been calculated assuming (i) Mr. Johns will remain in service with us until the age at which retirement could occur without any reduction in benefits under the MPM Supplemental Pension Plan (age 60) and (ii) that the benefit is payable under the available forms of annuity consistent with the assumptions as described in Note 12 to our Consolidated Financial Statements. As described in such note, the discount rate is 5.1% for the MPM U.S. Pension Plan and 5.05% for the MPM Supplemental Plan. If the assumed retirement age were changed to age 65, the normal retirement age on or after April 1, 2008 for exempt employees as defined in the plans, the present value for the MPM U.S. Pension Plan and MPM Supplemental Plan would instead be $158,927 and $580,100 for Mr. Johns. The postretirement mortality assumption is based on the 2013 static mortality tables as defined in the Pension Protection Act of 2006. Mr. Dandolph forfeited his unvested MPM Supplemental Pension Plan benefit when he resigned his position in 2013. The value of Mr. Dandolph’s MPM Pension Plan is based on retirement at normal retirement age under the Plan, age 65. |
Narrative to Pension Benefits Table
MSC U.S. Pension Plan and MSC Supplemental Plan
The benefits associated with the MSC U.S. Pension Plan and MSC Supplemental Plan were frozen June 30, 2009 and January 1, 2009, respectively. Although participants will continue to receive interest credits under the plans from MSC, no additional benefit credits will be provided. Prior to the freeze, the MSC U.S. Pension Plan provided benefit credits equal to 3% of earnings to the extent that this credit does not exceed the Social Security wage base for the year plus 6% of eligible earnings in excess of the social security wage base to covered U.S. associates subject to the IRS prescribed limit applicable to tax qualified plans.
The MSC Supplemental Plan provided nonqualified pension benefits in excess of allowable limits for the qualified pension plans. The benefit formula mirrored the qualified MSC U.S. Pension Plan but applied only to eligible compensation above the federal limits for qualified plans. The accrued benefits are unfunded and are paid from MSC’s general assets upon the participant’s termination of employment with MSC.
110
Table of Contents
Under both the MSC U.S. Pension Plan and MSC Supplemental Plan, eligible earnings included annual incentive awards that were paid currently, but excluded any long term incentive awards. Historically, the accrued benefits earned interest credits based on one year Treasury bill rates until the participant begins to receive benefit payments. Effective January 1, 2012, the plans were amended to provide a minimum interest crediting rate of 300 basis points. The interest rate determined under the plan for fiscal 2013 was 3%. Participants vest after the completion of three years of service.
The net present value of the MSC pension benefits was determined based on a discount rate of 4.45% and the RP-2000 mortality tables for combined active and healthy annuitants projected to 2020.
MPM U.S. Pension Plan and MPM Supplemental Plan
Benefits for U.S. salaried exempt employees under the MPM U.S. Pension Plan were frozen as of August 31, 2012. Benefits under the MPM Supplemental Plan were frozen as of December 31, 2011. Although affected participants will continue to earn vesting credits under the plans, no additional benefit service will be credited following the dates of the freeze.
Prior to the freeze, the MPM U.S. Pension Plan provided benefits based primarily on a formula that took into account the participant’s highest 60-month average compensation earned during the final 120 months of service times years of credited benefit service. Eligible compensation under this formula includes base salary and one half of the eligible annual incentive payments, subject to the IRS prescribed limit applicable to tax qualified plans.
U.S. employees who are classified as exempt employees, including the participating Named Executive Officers, are generally eligible to retire under the MPM U.S. Pension Plan with unreduced benefits at age 65 (or at age 62 with 25 years of vesting service if hired before January 1, 2005). U.S. employees who are classified as nonexempt employees are generally eligible to retire under this plan with unreduced benefits at age 60. Employees vest in this plan at the earlier of five years of qualifying service or age 60. In addition, the plan provides for Social Security supplements until the participant attains age 63 or reaches the age at which he is eligible for 80% Social Security benefit, if earlier, if the employee was hired prior to January 1, 2005. These supplements are not available for salaried exempt associates who commence their pension benefit after December 2012.
The MPM Supplemental Plan provides nonqualified pension benefits in excess of IRS prescribed limits for the qualified pension plans. The MPM Supplemental Plan is unfunded and is not qualified for tax purposes. An employee’s annual supplemental pension, when combined with certain amounts payable under the Company’s tax qualified and other pension programs and Social Security, will equal 1.75% of the employee’s “earnings credited for retirement benefits” multiplied by the number of the employee’s years of credited service, up to a maximum of 60% of such earnings credited for retirement benefits. The “earnings credited for retirement benefits” are the employee’s average annual compensation (base salary and bonus) for the highest 36 consecutive months out of the last 120 months prior to retirement. Participants are generally not eligible for benefits under the MPM Supplemental Pension Plan if they leave the Company prior to reaching age 60, except in the event that the Company terminates the participant’s employment without cause following five years of service. The normal retirement age as defined in this Plan is 65; however, early unreduced retirement is permitted at age 60, and benefits must commence the January 1 following the later of termination of employment and attainment of age 60. These supplemental benefits are paid in the form of an annuity with joint and survivor benefits.
For a discussion of the assumptions applied in calculating the present value of benefits reported in the table above for Messrs. Johns and Dandolph, please see Note 12 to the audited Consolidated Financial Statements included elsewhere herein.
111
Table of Contents
Nonqualified Deferred Compensation—Fiscal 2013
The following table presents information with respect to each defined contribution or other plan that provides for the deferral of compensation on a basis that is not tax qualified. Because the benefits under the MSC Supplemental Plan and the MSC 2004 DC Plan arise solely from services provided to MSC, the costs of such plans are not allocated in any manner to MPM under the Shared Services Agreement.
NONQUALIFIED DEFERRED COMPENSATION TABLE—FISCAL 2013
| Name (a) |
Executive Contributions in Last FY ($) (b) |
Registrant Contributions in Last FY ($) (c) |
Aggregate Earnings (Loss) in Last FY ($) (d) |
Aggregate Withdrawals/ Distributions ($) (e) |
Aggregate Balance at Last FYE ($) (f) |
|||||||||||||||
| Craig O. Morrison |
||||||||||||||||||||
| MSC Supplemental Plan |
— | — | 13,607 | — | 904,112 | |||||||||||||||
| MSC SERP1 |
— | 44,002 | 2,079 | — | 155,070 | |||||||||||||||
| MSC 2004 DC Plan2 |
— | — | (50,654 | ) | — | 291,866 | ||||||||||||||
| 2011 Equity Plan Tranche A RDUs3 |
— | 29,292 | (10,168 | ) | — | 87,876 | ||||||||||||||
| William H. Carter |
||||||||||||||||||||
| MSC Supplemental Plan |
— | — | 26,066 | — | 1,731,899 | |||||||||||||||
| MSC SERP1 |
— | 26,861 | 1,180 | — | 88,748 | |||||||||||||||
| MSC 2004 DC Plan2 |
— | — | (40,523 | ) | — | 233,493 | ||||||||||||||
| 2011 Equity Plan Tranche A RDUs3 |
— | 23,434 | (8,134 | ) | — | 70,302 | ||||||||||||||
| Judith A. Sonnett |
||||||||||||||||||||
| MSC Supplemental Plan |
— | — | 1,219 | — | 80,993 | |||||||||||||||
| MSC SERP1 |
— | 9,157 | 467 | — | 34,548 | |||||||||||||||
| 2007 Long-term Plan RSUs4 |
— | — | (1,260 | ) | — | 7,260 | ||||||||||||||
| 2011 Equity Plan Tranche A RDUs3 |
— | 23,185 | (8,048 | ) | — | 69,557 | ||||||||||||||
| Douglas A. Johns |
||||||||||||||||||||
| MPM SERP |
— | 9,783 | 92 | — | 9,875 | |||||||||||||||
| 2011 Equity Plan Tranche A RDUs3 |
— | 6,098 | (2,117 | ) | — | 18,296 | ||||||||||||||
| Nathan E. Fisher |
||||||||||||||||||||
| MSC Supplemental Plan |
— | — | 382 | — | 25,366 | |||||||||||||||
| MSC SERP1 |
— | 4,388 | 259 | — | 18,924 | |||||||||||||||
| MSC 2004 DC Plan2 |
— | — | (7,884 | ) | — | 45,427 | ||||||||||||||
| 2011 Equity Plan Tranche A RDUs3 |
— | 11,969 | (4,155 | ) | — | 35,910 | ||||||||||||||
| John C. Dandolph |
||||||||||||||||||||
| MPM SERP |
— | 6,067 | 57 | — | 6,124 | |||||||||||||||
| 2011 Equity Plan Tranche A RDUs3 |
— | — | — | — | — | |||||||||||||||
| (1) | The amount shown in column (c) for the MSC SERP is included in the All Other Compensation column of the Summary Compensation Table for 2012. These amounts were earned in 2012 and credited to the accounts by MSC in 2013. |
| (2) | The amount shown in column (f) is based on the number of vested units multiplied by the value of a common unit of Momentive Holdings on December 31, 2013, as determined by Momentive Holdings’ Board of Managers for management equity purposes. In the Summary Compensation Table in the MSC Annual Report on Form 10K for the fiscal year ended December 31, 2004, MSC reported the amount of a bonus for Mr. Carter and restricted stock payments for Mr. Morrison, a portion of which were deferred in the form of stock units. |
| (3) | The amount shown in column (c) reflects the value of restricted deferred units that vested during the fiscal year but, pursuant to the terms of the award agreement, delivery is deferred until early 2015. The value of these restricted deferred units is based on the number of vested units multiplied by the value of a common |
112
Table of Contents
| unit of Momentive Holdings on December 31, 2013, as determined by Momentive Holdings’ Board of Managers for management equity purposes. The grant date fair value of these units is included in the 2011 “Stock Awards” column of the Summary Compensation Table. The grant date fair value was reported in our Summary Compensation Table for 2011 as compensation. The number of vested restricted deferred units held by our Named Executive Officers is as follows: Mr. Morrison, 72,625; Mr. Carter, 58,101; Ms. Sonnett, 57,485; Mr. Johns, 15,120; Mr. Fisher 29,678 and Mr. Dandolph, 0. |
| (4) | The amount shown in column (f) is based on the number of vested units multiplied by the value of a common unit of Momentive Holdings on December 31, 2013, as determined by Momentive Holdings’ Board of Managers for management equity purposes. In the Summary Compensation Table in the MSC Annual Report on Form 10K for the fiscal year ended December 31, 2008, MSC reported the amount as a stock award. |
Narrative to the Nonqualified Deferred Compensation Table
MSC Supplemental Plan
Effective January 1, 2009, the benefits associated with this plan were frozen. This plan provided supplemental retirement benefits in the form of voluntary employee deferral opportunities and employer match on compensation earned above the IRS limit on qualified plans. The MSC Supplemental Plan benefits are unfunded and paid from MSC’s general assets upon the associate’s termination of employment. Interest credits are made to the participants’ accounts at an interest rate determined by MSC, which has been defined as the rate equivalent to the fixed income fund of the MSC 401(k) Plan.
MSC SERP
MSC adopted the MSC SERP in 2011 to provide certain of its executives and other highly compensated employees, including Messrs. Morrison, Carter, Fisher and Ms. Sonnett, an annual contribution of 5% of eligible earnings above the maximum limitations set by the IRS for contributions to a qualified pension plan. The MSC SERP is an unfunded nonqualified plan. Account credits are made to the plan during the second quarter of each year. Interest credits are provided in the participant’s SERP accounts at an interest rate determined by MSC, which has been defined as the rate equivalent to the fixed income fund of the MSC 401(k) Plan. This deferred compensation is paid six months following termination of employment.
MSC 2004 DC Plan
In 2004, in connection with Apollo’s acquisition of MSC, Messrs. Morrison, Carter and Fisher deferred the receipt of compensation and were credited with a number of deferred stock units in Hexion LLC equal in value to the amount of compensation deferred. Mr. Morrison holds 241,211 of such units, Mr. Carter holds 192,969 of such units and Mr. Fisher holds 37,543 of such units. At the time of the Momentive Combination, the deferred stock units were converted to units of Momentive Holdings. These deferred stock units are held pursuant to the MSC 2004 DC Plan, which is an unfunded plan, and will be distributed upon termination of employment or retirement. In certain instances, MSC may distribute a cash equivalent rather than stock units.
MSC 2007 Long-term Plan
Under the MSC 2007 Long-term Plan, Ms. Sonnet’s vested RSUs will not be distributed until her termination of employment with the Company, unless such termination is for cause, in which case the units will be forfeited.
2011 Equity Plan
On February 23, 2011, our Named Executive Officers received awards of restricted deferred units, or “RDUs,” in Momentive Holdings under the 2011 Equity Plan. The RDUs are nonvoting units of measurement which are deemed for bookkeeping purposes to be equivalent to one common unit of Momentive Holdings. Of
113
Table of Contents
the RDUs granted in 2011, approximately 50% are Tranche A RDUs with time-based vesting (subject to acceleration in the event of certain corporate or change-in-control transactions). On December 31, 2013, an additional 25% of the Tranche A RDUs vested: Mr. Morrison, 24,208 RDUs; Mr. Carter, 19,367 RDUs; Ms. Sonnett, 19,161 RDUs; Mr. Johns, 5,040 RDUs; Mr. Fisher, 9,892 RDUs and Mr. Dandolph, 0 RDUs. In accordance with the terms of the 2011 Equity Plan, delivery of the RDUs that vested on December 31, 2013 is deferred until early 2015. For additional information on the awards under the 2011 Equity Plan, including the vesting and delivery terms, see the Narrative to the Outstanding Equity Awards Table.
Potential Payments Upon Termination or Change in Control
Termination Payments
As described above, the Company or MSC has employment agreements or employment letters with certain of our Named Executive Officers that provide for severance under certain circumstances as well as restrictive covenants. MSC has employment agreements with Messrs. Morrison and Carter which provide that if the executive’s employment is terminated by MSC without cause or the executive resigns for good reason (as defined in their employment agreements), MSC will provide them with continued base salary through their severance period (18 months in the case of Mr. Morrison and 24 months in the case of Mr. Carter) and a lump sum payment equal to the estimated cost for the executive to continue COBRA coverage for 18 months. In addition, any accrued but unpaid compensation through the termination dated (such as accrued but unpaid base salary, earned but unpaid bonus, and accrued and unused vacation) will be paid in a lump sum payment at the time of termination. The employment agreements also contain the following restrictive covenants:
| • | a confidentiality agreement; |
| • | an agreement not to compete with MSC for (i) 18 months following termination of employment, in the case of Mr. Morrison, and (ii) two years following termination of employment, in the case of Mr. Carter; and |
| • | a non-solicitation agreement for an additional year beyond their severance periods. |
Under Mr. Johns’ 2007 employment letter with MPM, upon termination of his employment without cause, Mr. Johns was entitled to severance no less favorable than the policies and practices of GE, as in effect at the time with respect to GE employees in the senior executive band (other than with respect to benefits pursuant to any early retirement program, which may be changed from time to time). In connection with Mr. Johns’ promotion in 2010, Mr. Johns’ severance benefits were modified to applicable severance benefits and extended to a period of 18 months. Pursuant to his employment letter, Mr. Johns is also subject to certain noncompetition and non-solicitation restrictions during the term of his employment and for one year following the termination of his employment, as well as ongoing confidentiality obligations.
Under applicable corporate severance guidelines based on the executive’s position and length of service with the Company, Ms. Sonnett and Mr. Fisher are entitled to cash severance payments in the event their employment is terminated without cause. Severance payments under such guidelines are conditioned on the executive’s compliance with noncompetition and non-solicitation covenants.
114
Table of Contents
The following table describes payments that would have been made to Messrs. Morrison, Carter, Johns, Fisher and Ms. Sonnett had they been terminated at December 31, 2013. The amounts shown for Mr. Dandolph in the table below reflect the benefits and payments he received as a result of his resignation from the Company on August 19, 2013.
| Name |
Cash Severance ($) (1) |
Estimated Value of Non-Cash Benefits ($) (2) |
2013 ICP ($) (3) |
2007 Long- Term Plan ($) (4) |
MSC 2004 DC Plan ($) (5) |
|||||||||||||||
| Craig O. Morrison |
1,653,750 | 49,339 | 110,250 | — | 291,866 | |||||||||||||||
| William H. Carter |
1,535,020 | 27,478 | 61,401 | — | 233,493 | |||||||||||||||
| Judith A. Sonnett |
434,720 | 16,973 | 30,430 | 7,260 | — | |||||||||||||||
| Douglas A. Johns |
713,856 | 29,894 | 33,313 | — | — | |||||||||||||||
| Nathan E. Fisher |
340,704 | 16,924 | 20,442 | — | 45,427 | |||||||||||||||
| John C. Dandolph |
— | 5,245 | — | — | — | |||||||||||||||
| (1) | This column reflects cash severance payments due under the Named Executive Officer’s employment agreement or under applicable MSC or MPM severance guidelines, as described above, based on salary as of December 31, 2013. |
| (2) | This column reflects the estimated value of health care benefits and outplacement services for the Named Executive Officers. The values are based upon the cost of such benefit at December 31, 2013. |
| (3) | This column reflects the amount earned by each executive under the 2013 ICP, which would be paid if he or she was employed by MSC or MPM on December 31, 2013, but incurred a termination of employment by MSC or MPM, as applicable, without cause prior to payment. The incentive payment is forfeited if the executive resigns or incurs a termination of employment by MSC or MPM, as applicable, for cause prior to payment. |
| (4) | This column reflects the value of the common units that would be distributed under the 2007 Long-term Plan upon termination of employment by the Company without cause. |
| (5) | This column reflects the value of the common units or cash that would be distributed under the MSC 2004 DC Plan, using the Year-End unit value as determined by the Momentive Holdings Board of Managers, and the value of vested options granted under the MSC 2004 Stock Plan, which, if exercised, would be distributed upon termination of employment for any reason. |
In addition to these benefits, our Named Executive Officers would also generally be entitled to receive the benefits set forth above in the Pension Benefits Table and Nonqualified Deferred Compensation Table following a termination of employment for any reason. Under the terms of the MPM Holdings Securityholders Agreement, in the event of a termination of Mr. Johns’ employment without “cause” or he resigns for “good reason” (as such terms are defined in the Securityholders Agreement), he may exercise a put right within 90 days of his termination of employment entitling him to sell all (but not less than all) of his original equity investment in MPM Holdings (converted into 89,979 common units of Momentive Holdings) to MPM Holdings at a price equal to his original cost of $250,000. Upon termination for any reason, the Named Executive Officers would also be entitled to payment for unused vacation days, if any. Mr. Dandolph received $17,300 for unused vacation.
Change-in-Control Payments
As noted above in the Narrative to the Outstanding Equity Awards Table, our Named Executive Officers will also be entitled to accelerated vesting of their outstanding unvested equity awards under the 2011 Equity Plan, MPM 2007 Plan and MSC 2007 Long Term Plan in connection with certain corporate transactions or change-in-control transactions. There was no value in any of the options held by our Named Executive Officers at December 31, 2013 because the option exercise prices all exceeded the Year-End unit value as determined by the Momentive Holdings’ Board of Managers for management equity purposes.
115
Table of Contents
Upon a “Complete Change in Control,” as defined in the 2011 Equity Plan, 50% of the target awards to our Named Executive Officers under the 2012 LTIP would vest and become payable. In such event, Messrs. Morrison, Carter, Johns, Fisher and Ms. Sonnett would be entitled to payments of $2,625,000, $1,112,334, $686,400, $491,400 and $624,000 respectively.
Director Compensation—Fiscal 2013
The following table presents information regarding the compensation earned or paid during 2013 to our directors who are not also Named Executive Officers and who served on our Board of Directors during the year.
| Name (a) |
Fees Earned or Paid in Cash ($) (b) |
Option Awards ($) (d) (3) |
Total ($) (h) | |||||||||
| Scott M. Kleinman(1) |
97,000 | — | 97,000 | |||||||||
| Jordan C. Zaken(1) |
107,000 | — | 107,000 | |||||||||
| David B. Sambur(1) |
103,000 | — | 103,000 | |||||||||
| Julian Markby(2) |
80,625 | — | 80,625 | |||||||||
| Lee C. Stewart(2) |
80,625 | — | 80,625 | |||||||||
| (1) | Messrs. Kleinman, Zaken and Sambur are also members of Momentive Holdings’ Board of Managers and receive director fees for their services to Momentive Holdings. The Company does not pay any additional fees for their services as directors to our Board of Directors. The amount shown in column (b) reflects the total fees earned or paid for services to Momentive Holdings. 43% of such fees are funded by the Company. |
| (2) | The Company funded 100% of the total fees paid to this director. |
| (3) | As of December 31, 2013, Messrs. Kleinman, Zaken and Sambur held options to purchase 213,850, 78,141 and 50,000 common units in Momentive Holdings, respectively. All of the options held by Messrs. Sambur and Zaken are fully vested. Of the options held by Mr. Kleinman, 185,709 are fully vested. The remainder of Mr. Kleinman’s options vest upon an initial public offering of the Company or its parent. |
Narrative to the Director Compensation Table
Each member of our Board of Directors and the Board of Managers of Momentive Holdings who is not an employee or officer of the Company receives an annual retainer of $75,000 payable quarterly in advance. In addition, in 2013, each such director received $2,000 for each meeting of the Board or a committee of the Board that he attended in person and $1,000 for attending teleconference meetings or for participating in regularly scheduled in-person meetings via teleconference. Our directors who are also directors of Momentive Holdings, and who receive director fees for services to Momentive Holdings, do not receive additional compensation for services on the Company’s Board of Directors.
Compensation Committee Interlocks and Insider Participation
Messrs. Zaken and Sambur, whose names appear on the Compensation Committee Report above, are employed by Apollo Management, L.P., our indirect controlling shareholder. Neither of these directors is or has been an executive officer of the Company. None of our executive officers served as a director or a member of a compensation committee (or other committee serving an equivalent function) of any other entity, the executive officers of which served as a director or member of our Compensation Committee during the fiscal year ended December 31, 2013.
116
Table of Contents
PRINCIPAL AND SELLING STOCKHOLDERS
The following table sets forth as of February 1, 2015 information regarding the beneficial ownership of our common stock and shows the number of shares of common stock and percentage owned by:
| • | each member of our Board of Directors and each of our named executive officers; |
| • | all of the executive officers and members of the Board of Directors as a group; |
| • | each person known to beneficially own more than 5% of our common stock, each of whom is a selling stockholder; and |
| • | all other selling stockholders. |
As of February 1, 2015, we had 47,989,000 shares of common stock outstanding. The amounts and percentages of common stock beneficially owned are reported on the basis of regulations of the SEC governing the determination of beneficial ownership of securities. Under the rules of the SEC, a person is deemed to be a “beneficial owner” of a security if that person has or shares “voting power,” which includes the power to vote or to direct the voting of such security, or “investment power,” which includes the power to dispose of or to direct the disposition of such security. A person is also deemed to be a beneficial owner of any securities of which that person has a right to acquire beneficial ownership within 60 days. Under these rules, more than one person may be deemed a beneficial owner of the same securities and a person may be deemed a beneficial owner of securities as to which he has no economic interest. Except as otherwise indicated in the footnotes below, each of the beneficial owners has, to our knowledge, sole voting and investment power with respect to the indicated common stock.
| Name of Beneficial Owner(1) |
Number of Shares of Common Stock Beneficially Owned |
Percent of Class |
Shares of Common Stock That May Be Offered for Resale(2) |
|||||||||
| Directors and Named Executive Officers: |
||||||||||||
| Mahesh Balakrishnan(3) |
— | — | — | |||||||||
| Bradley Bell |
— | — | — | |||||||||
| John G. Boss |
— | — | — | |||||||||
| John D. Dionne |
— | — | — | |||||||||
| Robert Kalsow-Ramos(4) |
— | — | — | |||||||||
| Scott Kleinman(4) |
— | — | — | |||||||||
| Julian Markby |
— | — | — | |||||||||
| Daniel C. Murphy |
— | — | — | |||||||||
| Jason New |
— | — | — | |||||||||
| David B. Sambur(4) |
— | — | — | |||||||||
| Marvin Schlanger |
— | — | — | |||||||||
| Douglas A. Johns |
— | — | — | |||||||||
| Brian D. Berger |
— | — | — | |||||||||
| William H. Carter |
— | — | — | |||||||||
| Nathan Fisher |
— | — | — | |||||||||
| Craig Morrison |
— | — | — | |||||||||
| Stephen J. Psutka |
— | — | — | |||||||||
| Judith Sonnett |
— | — | — | |||||||||
| Susan Walden |
— | — | — | |||||||||
| Named Executive Officers and Directors as a group |
— | — | — | |||||||||
| 5% Selling Stockholders: |
||||||||||||
| Euro VI (BC) Sà.r.l(5) |
19,084,996 | 39.77 | % | 19,084,996 | ||||||||
| OCM Opps MTIV Holdings, LLC(6) |
6,551,657 | 13.65 | % | 6,551,657 | ||||||||
| Pentwater Capital Management(7) |
3,440,525 | 7.17 | % | 3,440,525 | ||||||||
| GSO Capital Partners(8) |
3,279,600 | 6.83 | % | 3,279,600 | ||||||||
| Carlson Capital(9) |
2,402,716 | 5.01 | % | 1,397,225 | ||||||||
117
Table of Contents
| Name of Beneficial Owner(1) |
Number of Shares of Common Stock Beneficially Owned |
Percent of Class |
Shares of Common Stock That May Be Offered for Resale(2) |
|||||||||
| Other Selling Stockholders: |
||||||||||||
| Third Avenue Funds(10) |
2,354,360 | 4.91 | % | 1,416,797 | ||||||||
| Aristeia Capital(11) |
2,137,612 | 4.45 | % | 1,375,506 | ||||||||
| Ares Management(12) |
1,981,349 | 4.13 | % | 1,208,157 | ||||||||
| D.E. Shaw Galvanic Portfolios, L.L.C(13) |
902,304 | 1.88 | % | 506,750 | ||||||||
| Fortress Credit Advisors(14) |
632,957 | 1.32 | % | 632,957 | ||||||||
| Napier Park Global Capital(15) |
605,551 | 1.26 | % | 327,392 | ||||||||
| Nexpoint Credit Strategies Fund(16) |
229,157 | 0.48 | % | 83,904 | ||||||||
| (1) | Unless otherwise noted, the address for each person listed in this table is c/o Momentive Performance Materials Inc., 260 Hudson River Road, Waterford, NY 12188. |
| (2) | The shares of our common stock that may be offered for resale by the selling stockholders pursuant to this prospectus were acquired by the selling stockholders in connection with the Emergence pursuant to the Plan of Reorganization in transactions that were exempt from registration under Section 4(a)(2) of the Securities Act and Section 1145 of the Bankruptcy Code. See “Summary—Emergence from Chapter 11 Proceedings” for additional information regarding the Emergence and how the selling stockholders acquired shares of our common stock. We have been advised that none of the selling stockholders is a broker-dealer and that each selling stockholder that is an affiliate of a broker-dealer acquired its shares of common stock in the ordinary course of its business and, at the time of acquisition, had no agreements or understandings, directly or indirectly, with any person to distribute the shares. |
| (3) | The address for Mr. Balakrishnan is 333 South Grand Avenue, 28th Floor, Los Angeles, CA 90071. |
| (4) | The address of each of Messrs. Kalsow-Ramos, Kleinman and Sambur is c/o Apollo Management, L.P., 9 West 57th Street, New York, New York 10019. |
| (5) | AIF VI Euro Holdings, L.P. (“AIF VI Euro”) is the sole shareholder of Euro VI (BC). Apollo Advisors VI (EH), L.P. (“Advisors VI (EH)”) is the general partner of AIF VI Euro, and Apollo Advisors VI (EH-GP), Ltd. (“Advisors VI (EH-GP)”) is the general partner of Advisors VI (EH). Apollo Principal Holdings III, L.P. (“Principal III”) is the sole shareholder of Advisors VI (EH-GP). Apollo Principal Holdings III GP, Ltd. (“Principal III GP”) is the general partner of Principal III. Apollo Management VI, L.P. (“Management VI”) is the manager of AIF VI Euro, and AIF VI Management, LLC (“AIF VI LLC”) is the general partner of Management VI. Apollo Management, L.P. (“Apollo Management”) is the sole member and manager of AIF VI LLC, and Apollo Management GP, LLC (“Management GP”) is the general partner of Apollo Management. Apollo Management Holdings, L.P. (“Management Holdings”) is the sole member and manager of Management GP. Apollo Management Holdings GP, LLC (“Management Holdings GP”) is the general partner of Management Holdings. Leon Black, Joshua Harris and Marc Rowan are the managers, as well as executive officers, of Management Holdings GP, and the directors of Principal III GP, and as such may be deemed to have voting and dispositive control of the shares of common stock held of record by Euro VI (BC). The address of Euro VI BC is 7, Val Ste Croix, L-1371 Luxembourg. The address of AIF VI Euro, Advisors VI (EH), Advisors VI (EH-GP), Principal III and Principal III GP is c/o Intertrust Corporate Services (Cayman) Limited, 190 Elgin Street, George Town, KY1-9005 Grand Cayman, Cayman Islands. The address of each of Management VI, AIF VI LLC, Apollo Management, Management GP, Management Holdings and Management Holdings GP, and Messrs. Black, Harris and Rowan, is 9 West 57th Street, 43rd Floor, New York, New York 10019. |
| (6) | The manager of OCM Opps MTIV Holdings, LLC (“Opps MTIV”) is Oaktree Fund GP, LLC (“GP LLC”). The managing member of GP LLC is Oaktree Fund GP I, L.P. (“GP I”). The general partner of GP I is Oaktree Capital I, L.P. (“Capital I”). The general partner of Capital I is OCM Holdings I , LLC (“Holdings I”). The managing member of Holdings I is Oaktree Holdings, LLC (“Holdings”). The managing member of Holdings is Oaktree Capital Group, LLC (‘‘OCG”). The duly elected manager of OCG is |
118
Table of Contents
| Oaktree Capital Group Holdings GP, LLC. The members of Oaktree Capital Group Holdings GP, LLC are Howard Marks, Bruce Karsh, Jay Wintrob, John Frank, Sheldon Stone, Larry Keele, Stephen Kaplan and David Kirchheimer. Each of the managing members, managers, general partners, and members described above disclaims beneficial ownership of any shares of common stock beneficially or of record owned by Opps MTIV, except to the extent of any pecuniary interest therein. Mr. Balakrishnan, an employee of Oaktree Capital Management, L. P., an affiliate of Opps MTIV, has been a Director of the Company since October 24, 2014. The business address for each of the persons and entities named in this footnote is 333 South Grand Avenue, 28th Floor, Los Angeles, CA 90071. |
| (7) | Includes (i) 115,210 shares held of record by Pentwater Capital Management LP as investment advisor to Pentwater Event Driven Cayman Fund Limited, (ii) 495,719 shares held of record by Oceana Master Fund Ltd., (iii) 608,466 shares held of record by Pentwater Capital Management LP acting as investment manager for and on behalf of Pentwater Event Equity Reflection Fund, a sub-fund of an Irish open ended umbrella type investment company incorporated with variable capital and with segregated liability between sub-funds, called AAI Pentwater Fund Plc, (iv) 501,359 shares held of record by Pentwater Capital Management LP as investment advisor to LMA SPC for and on behalf of MAP98 Segregated Portfolio, (v) 23,539 shares held of record by Pentwater Equity Opportunities Master Fund Ltd, (vi) 1,625,707 shares held of record by PWCM Master Fund Ltd, (vii) 10,011 shares held of record by Pentwater Merger Arbitrage Master Fund Ltd and (viii) 60,514 shares held of record by Pentwater Credit Opportunities Master Fund Ltd. Matthew C. Halboner, CIO and CEO of Pentwater Capital Management LP, exercises voting and investment control with respect to the shares held by the entities named in this footnote. Daniel C. Murphy, Portfolio Manager and Head of Fixed Income for Pentwater Capital Management, LP, has been a Director of the Company since October 24, 2014. The business address for each person and entity named in this footnote 7 is 614 Davis St., Evanston, IL 60201. |
| (8) | Includes (i) 13,940 shares held of record by FS Global Credit Opportunities Fund (“FS Fund”), (ii) 771,065 shares held of record by GSO Special Situations Fund LP (“Special Situations Fund”), (iii) 49,444 shares held of record by GSO Special Situations Master Fund LP (“Special Situations Master Fund”), (iv) 865,590 shares held of record by GSO Special Situations Overseas Master Fund Ltd (“Special Situations Overseas Master Fund”), (v) 98,023 shares held of record by Steamboat Credit Opportunities Master Fund LP (“Steamboat Fund”), (vi) 120,767 shares held of record by GSO Aiguille des Grands Montets Fund I LP (“Grands Montets Fund I”), (vii) 73,922 shares held of record by each of GSO Aiguille des Grands Montets Fund II LP (“Grands Montets Fund II”) and GSO Aiguille des Grands Montets Fund III LP (“Grands Montets Fund III”), (viii) 97,090 shares held of record by GSO Cactus Credit Opportunities Fund LP (“Cactus Fund”), (ix) 134,155 shares held of record by GSO Churchill Partners LP (“Churchill Partners”), (x) 88,758 shares held of record by GSO Coastline Credit Partners LP (“Coastline Credit Partners”), (xi) 457,082 shares held of record by GSO Credit-A Partners LP (“Credit-A Partners”), and (xii) 435,842 shares held of record by GSO Palmetto Opportunistic Investment Partners LP (“Palmetto Partners”). |
| FS Global Advisor, LLC (“FS Advisor”) serves as the investment adviser of FS Fund. The investment committee of FS Advisor makes investment decisions on behalf of FS Advisor and has the power to vote or to direct the vote of, and to dispose or to direct the disposition of, the shares of the Company held by FS Fund. The members of the investment committee of FS Advisor are Michael C. Forman, Gerald F. Stahlecker, Zachary Klehr and Robert Hoffman. None of FS Advisor or any member of FS Advisor’s investment committee owns any shares of the Company directly, and FS Advisor and each member of FS Advisor’s investment committee disclaims beneficial ownership of the shares of the Company held by FS Fund, except, in the case of the members of FS Advisor’s investment committee, to the extent of their pecuniary interest therein. The business address of FS Fund, FS Advisor and each member of FS Advisor’s investment committee is 201 Rouse Boulevard, Philadelphia, Pennsylvania 19112. |
| GSO Capital Partners LP (“GSO Capital Partners”) is the non-discretionary investment subadviser to FS Advisor. GSO Capital Partners votes at the direction of FS Advisor. GSO Capital Partners is the investment adviser to Special Situations Fund, Special Situations Master Fund, Special Situations Overseas Master Fund, Steamboat Fund, Grands Montets Fund I, Grands Montets Fund II, Grands Montets Fund III, Cactus Fund, Churchill Partners, Coastline Credit Partners, Credit-A Partners and Palmetto Partners. GSO Advisor |
119
Table of Contents
| Holdings LLC (“GSO Advisor”) is the general partner of GSO Capital Partners. Blackstone Holdings I L.P. (“Blackstone I”) is the sole member of GSO Advisor. Blackstone Holdings I/II GP Inc. (“Blackstone I/II GP”) is the general partner of Blackstone I. The Blackstone Group L.P. (“Blackstone Group”) is the controlling shareholder of Blackstone I/II GP. Blackstone Group Management L.L.C. (“Blackstone Group Management”) is the general partner of Blackstone Group. Blackstone Group Management is controlled by Stephen A. Schwarzman, one of its founders. Each of Bennett J. Goodman, J. Albert Smith III and Douglas I. Ostrover is an executive of GSO Capital Partners and may be deemed to have shared voting power and/or investment power with respect to the shares held by funds managed or advised by GSO Capital Partners. Each of such persons disclaims beneficial ownership of the shares directly held by such funds (other than such funds to the extent of their direct holdings). |
| Jason New, Senior Managing Director of Blackstone Group (an affiliate of GSO Capital Partners), has been a Director of the Company since October 24, 2014. Mr. New disclaims any beneficial ownership of the shares of our common stock held by the foregoing entities. In the ordinary course of business, GSO Capital Partners and its affiliates, including Blackstone Group manage, advise or sub-advise certain funds whose portfolio companies may have relationships with the Company. The business address for each of the persons and entities named in this footnote 8, unless otherwise stated, is 345 Park Avenue, 31st Floor, New York, NY 10154. |
| (9) | Includes (i) 2,294,199 shares held of record by Double Black Diamond Offshore Ltd. (“Double Black Diamond”), of which 1,333,695 shares may be offered for sale, and (ii) 108,517 shares held of record by Black Diamond Offshore Ltd. (“Black Diamond”), of which 63,530 shares may be offered for sale. The investment advisor of each of Black Diamond and Double Black Diamond is Carlson Capital, L.P., and the general partner of Carlson Capital, L.P. is Asgard Investment Corp. II. The sole stockholder of Asgard Investment Corp. II. is Asgard Investment Corp., and Clint D. Carlson is its controlling person. The business address of each person and entity named in this footnote 9 is 2100 McKinney Ave, Suite 1800, Dallas, TX 75201. |
| (10) | Includes (i) 2,178,290 shares held of record by Third Avenue Trust, on behalf of Third Avenue Focused Credit Fund, of which 1,310,842 shares may be offered for sale, (ii) 43,564 shares held of record by Third Avenue Management LLC, on behalf of Manulife Global Focused Balanced Fund, of which 26,216 shares may be offered for sale, (iii) 18,150 shares held of record by Third Avenue Capital Plc c/o Third Avenue High Yield Credit Fund, of which 10,922 shares may be offered for sale, (iv) 5,443 shares held of record by Third Avenue Value Income Fund, L.P., of which 3,276 shares may be offered for sale, and (v) 108,913 shares held of record by JURA LIMITED, of which 65,541 shares may be offered for sale. The investment manager or investment sub-adviser, as the case may be, of each of the funds is Third Avenue Management LLC. Thomas Lapointe exercises voting and investment control with respect to the shares held by the entities named in this footnote 10. The business address for each of the persons and entities, except for JURA LIMITED, named in this footnote 10 is 622 Third Avenue, 32nd Floor, New York, NY 10017. The business address of JURA LIMITED is 13 Par - La - Ville Rd, Hamilton, HM08 Bermuda. |
| (11) | Includes (i) 1,956,654 shares held of record by Aristeia Horizons LP (“Horizons”), of which 1,194,548 shares may be offered for sale, (ii) 52,607 shares held of record by Compass TSMA LP (“TSMA”), all of which may be offered for sale, (iii) 41,595 shares held of record by Compass ESMA LP (“ESMA”), all of which may be offered for sale, and (iv) 86,756 shares held of record by Windermere Ireland Fund PLC (“Ireland Fund”), all of which may be offered for sale. |
| Aristeia Capital, L.L.C. and Aristeia Advisors, L.P. (collectively, “Aristeia”) may be deemed the beneficial owners of the securities in their capacity as the investment manager and/or general partner, as the case may be, of Horizons, Ireland Fund, ESMA and TSMA (each a “Aristeia Fund” and collectively, the “Aristeia Funds”). As investment manager and/or general partner of each Aristeia Fund, Aristeia has voting and investment control with respect to the securities held by each Aristeia Fund. Aristeia is owned by Kevin C. Toner, Robert H. Lynch, Jr., Anthony M. Frascella and William R. Techar. Each of Aristeia and such individuals disclaims beneficial ownership of the securities referenced herein except to the extent of its or |
120
Table of Contents
| his direct or indirect economic interest in the Aristeia Funds. The business address for each of the persons and entities named in this footnote 11 is c/o Aristeia Capital LLC, 136 Madison Avenue, 3rd floor, New York, NY 10016. |
| (12) | Includes (i) 36,304 shares held of record by Anthem, Inc. (“Anthem”), of which 21,847 shares may be offered for sale, (ii) 45,380 shares held of record by PPF Nominee 1 B.V. (“PPF Nominee”), of which 27,309 shares may be offered for sale, (iii) 18,150 shares held of record by Ontario Public Service Employees Union Pension Plan Trust Fund (“Ontario Fund”), of which 10,922 shares may be offered for sale, (iv) 99,837 shares held of record by Ares Senior Loan Trust (“Loan Trust”), of which 60,080 shares may be offered for sale, (v) 108,914 shares held of record by ASIP (Holdco) IV S.à.r.l. (“ASIP IV”), of which 65,542 shares may be offered for sale, (vi) 54,455 shares held of record by Ares Multi-Strategy Credit Fund V (H), L.P. (“Multi-Strategy Fund”), of which 32,770 shares may be offered for sale, (vii) 245,057 shares held of record by Transatlantic Reinsurance Company (“Transatlantic”), of which 147,470 shares may be offered for sale, (viii) 117,990 shares held of record by RSUI Indemnity Company (“RSUI”), of which 71,004 shares may be offered for sale, (ix) 555,464 shares held of record by Ares Special Situations Fund III, L.P. (“Special Situations Fund”), of which 334,265 shares may be offered for sale, and (x) 699,798 shares held of record by Ares SSF Riopelle, L.P. (“SSF Riopelle”), of which 436,948 shares may be offered for sale. |
| The manager of Anthem is Ares WLP Management L.P., the general partner of which is Ares WLP Management GP LLC. The portfolio manager of PPF Nominee is Ares Management Limited. The investment counsel of Ontario Fund is AELIS X Management, L.P., the general partner of which is AELIS X Management GP, LLC. The investment adviser of Loan Trust is Ares Senior Loan Trust Management, L.P., the general partner of which is Ares Senior Loan Trust Management, LLC. The investment manager of ASIP IV is ASIP Operating Manager IV LLC. The manager of Multi-Strategy Fund is Ares MSCF V (H) Management LLC, the manager of which is Ares Capital Management III LLC. The portfolio manager of Transatlantic and RSUI is Ares ASIP VII Management, L.P., the general partner of which is Ares ASIP VII GP, LLC. The manager of Special Situations Fund is ASSF Operating Manager III, LLC. The manager of SSF Riopelle is ASSF Riopelle Management, LLC. Americo Cascella, Portfolio Manager, and John Eanes, Portfolio Manager, exercise voting and investment control with respect to the shares held by Anthem, PPF Nominee, Ontario Fund and Loan Trust. Americo Cascella, Portfolio Manager, and Seth J. Brufsky, Portfolio Manager, exercise voting and investment control with respect to the shares held by ASIP IV, Multi-Strategy Fund, Transatlantic and RSUI. Americo Cascella, Portfolio Manager, and Darryl Schall, Portfolio Manager, exercise voting and investment control with respect to the shares held by Special Situations Fund. Jeff Moore, Portfolio Manager, and Darryl Schall, Portfolio Manager, exercise voting and investment control with respect to the shares held by SSF Riopelle. The business address of each person and entity named in this footnote 12 is 2000 Avenue of the Stars, 12th floor, Los Angeles, CA 90067. |
| (13) | The investment adviser of D. E. Shaw Galvanic Portfolios, LLC (“Portfolios”) is D. E. Shaw Adviser II, L.L.C. (“Adviser”) and the manager is D. E. Shaw Manager II, L.L.C. (“Manager”). The managing member of Adviser is D. E. Shaw & Co., L.P. (“DESCO LP”) and the managing member of Manager is D. E. Shaw & Co., L.L.C. (“DESCO LLC”). DESCO LP and DESCO LLC may be deemed to have the shared power to exercise voting and investment control with respect to the shares held by Portfolios. Anne Dinning, Julius Gaudio, Maximilian Stone, and Eric Wepsic, or their designees, exercise voting and investment control over such shares on DESCO LP and DESCO LLC’s behalf. D. E. Shaw & Co., Inc. (“DESCO Inc.”), as general partner of DESCO LP, and D. E. Shaw & Co. II, Inc. (“DESCO II Inc.”), as managing member of DESCO LLC, may be deemed to have the shared power to exercise voting and investment control with respect to the shares. Each of DESCO LP, DESCO LLC, DESCO Inc., or DESCO II Inc. disclaims beneficial ownership of the shares. By virtue of David E. Shaw’s position as President and sole shareholder of DESCO Inc. and as President and sole shareholder of DESCO II Inc., he may be deemed to have the shared power to exercise voting and investment control with respect to the shares. David E. Shaw disclaims beneficial ownership of the shares held by Portfolios. The business address of each person and entity named in this footnote 13 is 1166 Avenue of the Americas, New York, NY 10036. |
121
Table of Contents
| (14) | Includes (i) 431,096 shares held of record by Drawbridge DSO Securities LLC (“Drawbridge DSO”), (ii) 168,598 shares held of record by Drawbridge OSO Securities LLC, (iii) 28,482 shares held of record by Worden Master Fund LP, and (iv) 4,781 shares held of record by Worden Master Fund II LP, in each case all of which may be offered for sale. The general partner of Worden Master Fund LP and Worden Master Fund II LP is Fortress Special Opportunities I GP LLC. Such entities are managed within the Credit Funds business of Fortress Investment Group. The Co-Chief Investment Officers of the Credit Funds business are Peter L. Briger, Jr. and Constantine M. Dakolias, who exercise voting and investment control with respect to the shares held by the entities named in this footnote. The business address for Drawbridge DSO and the investment manager of each other entity listed in this footnote 14 is c/o Fortress Investment Group, 1345 Avenue of the Americas, New York, NY 10105. |
| (15) | Includes (i) 196,895 shares held of record by Napier Park Distressed Debt Opportunity Master Fund, Ltd., of which 120,044 shares may be offered for sale, (ii) 235,108 shares held of record by DStar Ltd., of which 130,957 shares may be offered for sale, and (iii) 173,548 shares held of record by Napier Park Select Master Fund, LP., of which 76,391 shares may be offered for sale. Napier Park Global Capital (US) LP (“Napier Park”) acts as the investment manager or investment advisor, as the case may be, to all of the entities listed above in this footnote 15. Napier Park exercises voting and investment control with respect to the shares held by the entities through its Distressed Debt Investment Team, where James Duplessie exercises voting and investment control with respect to such shares on behalf of the team. The business address of each person and entity named in this footnote 15 is c/o Napier Park Global Capital, 280 Park Avenue, 3rd Floor, New York, NY 10017. |
| (16) | The investment adviser of Nexpoint Credit Strategies Fund (“Nexpoint”) is Nexpoint Advisors, L.P. James Dondero exercises voting and/or investment control with respect to the shares held by Nexpoint. The business address of each person and entity named in this footnote 16 is 300 Crescent Court Suite 700, Dallas, TX 75201. |
Relationships with Selling Stockholders
None of the selling stockholders, other than Apollo, has had any material relationships with the Company within the past three years other than representation on the Company’s board of directors as described in the table above. See “Certain Relationships and Related Party Transactions.”
122
Table of Contents
CERTAIN RELATIONSHIPS AND RELATED PARTY TRANSACTIONS
MPM has entered into various agreements with GE and Apollo and their affiliates on terms which management has concluded are fair to MPM. Agreements with GE and its affiliates were entered into primarily in connection with the GE Advanced Materials Acquisition. Agreements with Apollo and its affiliates were entered into primarily in connection with the GE Advanced Materials Acquisition and the Momentive Combination.
Apollo Management Agreement
MPM was subject to a management consulting and advisory services agreement with Apollo and its affiliates for the provision of management and advisory services for an initial term of up to twelve years. Under such agreement, MPM agreed to indemnify Apollo and its affiliates and their directors, officers, and representatives for potential losses relating to the services contemplated under these agreements. Terms of the agreement provided for annual fees of $4 million plus out of pocket expenses, payable in one lump sum annually, and provide for a lump-sum settlement equal to the net present value of the remaining annual management fees payable under the remaining term of the agreement in connection with a sale or initial public offering by MPM. This annual management fee was waived for 2013 and 2014. MPM paid annual fees of $4 million in each of 2012 and 2011 and also reimbursed Apollo for expenses totaling less than $1 million, including certain third-party consulting fees, in each of 2012 and 2011. In connection with the Emergence, the management agreement was terminated pursuant to the court order confirming the Plan of Reorganization, effective as of April 13, 2014.
Registration Rights Agreement
On October 24, 2014, in connection with the Emergence, we entered into a registration rights agreement with certain of our stockholders (the “Registration Rights Agreement”), which provides our stockholders party thereto certain registration rights.
Under the Registration Rights Agreement, we are required to file a shelf registration statement (on Form S-3 if permitted) and use our reasonable best efforts to cause the registration statement to become effective for the benefit of all stockholders party to the Registration Rights Agreement. Any individual holder or holders of our outstanding common stock party thereto can demand an unlimited number of “shelf takedowns,” which may be conducted in underwritten offerings so long as the total offering size is reasonably expected to exceed $50 million. The registration statement of which this prospectus forms a part was filed to satisfy our obligation under the Registration Rights Agreement.
Each holder or holders party to the Registration Rights Agreement who own at least 10% of our outstanding common stock, or held at least 10% of our common stock as of the date of the Registration Rights Agreement and could reasonably be considered our affiliate, have Form S-1 demand registration rights, which may be conducted in an underwritten offering, as long as the total offering price is reasonably expected to be at least $50 million, and which may not exceed two in any six month period or eight in total, subject to certain exceptions and to customary cutback provisions. In addition, a holder of at least 10% of our common stock has unlimited Form S-3 demand registration rights, which may be conducted in underwritten offerings, as long as the total offering price is reasonably expected to be at least $50 million, subject to customary cutback provisions.
Each stockholder party to the Registration Rights Agreement has unlimited piggyback registration rights with respect to underwritten offerings, subject to certain exceptions and limitations.
The foregoing registration rights are subject to certain cutback provisions and customary suspension/blackout provisions. We have agreed to pay all registration expenses under the Registration Rights Agreement. We are paying the registration expenses for the registration statement of which this prospectus forms a part. In connection with the registrations described above, we have agreed to indemnify the stockholders against certain liabilities.
The Registration Rights Agreement also contains certain holdback agreements that apply to each stockholder party to the Registration Rights Agreement. Generally, without our prior consent and subject to limited exceptions, the stockholders party to the Registration Rights Agreement have agreed to, if requested,
123
Table of Contents
enter into an agreement not to publicly sell or distribute our equity securities beginning ten days prior to the pricing of our initial public offering for the 180-day period following the closing date of our initial public offering and, if participating in a future shelf takedown or other underwritten public offering, beginning ten days prior to the pricing of that offering and for the 90-day period following the closing date of such offering.
Transactions with Hexion
Shared Services Agreement
On October 1, 2010, in connection with the closing of the Momentive Combination, MPM entered into a shared services agreement with Hexion (which, from October 1, 2010 through October 24, 2014, was a subsidiary under a common parent), as amended on March 17, 2011 and October 24, 2014 (the “Shared Services Agreement”). Under this agreement, MPM provides to Hexion, and Hexion provides to MPM, certain services, including, but not limited to, executive and senior management, administrative support, human resources, information technology support, accounting, finance, technology development, legal and procurement services. The Shared Services Agreement establishes certain criteria upon which the costs of such services are allocated between Hexion and MPM. In 2013, service costs were allocated 57% to Hexion and 43% to MPM and in 2012 and 2011, 51% to Hexion and 49% to MPM, except to the extent that 100% of any cost was demonstrably attributable to or for the benefit of either Hexion or MPM, in which case the entire cost was allocated to such party. The allocation percentage for 2014 remains unchanged from 2013. The Shared Services Agreement is subject to termination by either MPM or Hexion, without cause, on not less than 30 days’ written notice, and expires in October 2015 (subject to one-year renewals every year thereafter; absent contrary notice from either party).
Pursuant to this agreement, during the nine months ended September 30, 2014 and 2013, MPM incurred approximately $76 million and $67 million, respectively, of net costs for shared services and Hexion incurred approximately $100 million and $90 million, respectively, of net costs for shared services. During the years ended December 31, 2013, 2012 and 2011, MPM incurred approximately $92 million, $148 million and $158 million, respectively, of net costs for shared services and Hexion incurred approximately $121 million, $155 million and $163 million, respectively, of net costs for shared services. Included in the net costs incurred during the nine months ended September 30, 2014 and 2013, were net billings from Hexion to MPM of $31 million and $21 million, respectively, and during the years ended December 31, 2013, 2012 and 2011, were net billings from Hexion to MPM of approximately $31 million, $22 million and $11 million, respectively, in each case to bring the percentage of total net incurred costs for shared services under the Shared Services Agreement to the applicable allocation percentage, as well as to reflect costs allocated 100% to one party.
Pursuant to this agreement, MPM had accounts receivable of less than $1 million, and $3 million as of December 31, 2012 and 2011, respectively. MPM had accounts payable to Hexion of $14 million at September 30, 2014. Accounts payable to Hexion were $4 million, less than $1 million, and $15 million at December 31, 2013, 2012 and 2011, respectively. During the years ended December 31, 2013, 2012 and 2011, MPM realized approximately $9 million, $31 million and $23 million, respectively, in cost savings as a result of the Shared Services Agreement.
On March 17, 2011, MPM amended the Shared Services Agreement with Hexion to reflect the terms of the Master Confidentiality and Joint Development Agreement (the “JDA”) by and between Hexion and MPM entered into on the same date.
The Shared Services Agreement incorporates by reference the terms of the JDA and provides that in the event of a conflict between such agreements, the terms of the JDA shall control. The JDA, which is effective as of October 1, 2010, sets forth the terms and conditions for (i) the disclosure, receipt and use of each party’s confidential information; (ii) any research and development (“R&D”) collaborations agreed to be pursued by Hexion and MPM; (iii) the ownership of products, technology and intellectual property (“IP”) resulting from such collaborations; (iv) licenses under each party’s respective IP; and (v) strategies for commercialization of products and/or technology developed under the agreement.
124
Table of Contents
Pursuant to the JDA, each party has sole ownership rights for any R&D work product and related IP developed under the agreement (“Technology”) for their respective product categories and/or technology fields (as defined in the JDA). For Technology that relates to product categories and/or technology fields of both Hexion and MPM (“Hybrid Technology”), a steering committee made up of three representatives of each party shall determine which party shall be granted ownership rights, subject to certain exceptions. In the event that the steering committee is unable to reach a decision, the Hybrid Technology shall be jointly owned by the parties. In addition, under the terms of the JDA, each party grants to the other party a non-exclusive royalty-bearing (subject to certain exceptions) license for the Technology or the Hybrid Technology. The royalty shall be determined by the respective representatives of the parties through the steering committee in arm’s-length good faith negotiations. The parties also grant royalty-free licenses to each other with respect to their IP for R&D, including for initiatives outside the scope of the JDA. The JDA has a term of 20 years, subject to early termination pursuant to its terms for cause or for a change of control.
In conjunction with the consummation of the Plan of Reorganization, the Shared Services Agreement was amended to, among other things, (i) exclude the services of certain executive officers, (ii) provide for a transition assistance period at the election of the recipient following termination of the Shared Services Agreement of up to 12 months, subject to one successive renewal period of an additional 60 days and (iii) provide for the use of an independent third-party audit firm to assist the Steering Committee with its annual review of billings and allocations.
Purchases and Sales of Products and Services with Hexion
MPM also sells products to, and purchases products from, Hexion pursuant to a Master Buy/Sell Agreement dated as of September 6, 2012 (the “Master Buy/Sell Agreement”). Prices under the agreement are determined by a formula based upon certain third party sales of the applicable product, or in the event that no qualifying third party sales have taken place, based upon the average contribution margin generated by certain third party sales of products in the same or a similar industry. The standard terms and conditions of the seller in the applicable jurisdiction apply to transactions under the Master Buy/Sell Agreement. One of our subsidiaries also acts as a non-exclusive distributor in India for certain subsidiaries of Hexion pursuant to Distribution Agreements dated as of September 6, 2012 (the “Distribution Agreements”). Prices under the Distribution Agreements are determined by a formula based on the weighted average sales price of the applicable product less a margin. The Master Buy/Sell Agreement and Distribution Agreements have initial terms of three years and may be terminated for convenience by either party thereunder upon 30 days’ prior notice in the case of the Master/Buy Sell Agreement and upon 90 days’ prior notice in the case of the Distribution Agreements. Pursuant to these agreements and other purchase orders, during the nine months ended September 30, 2014 and 2013, MPM sold $6 million and $4 million, respectively, of products to Hexion and purchased less than $1 million and $1 million, respectively. MPM sold $9 million and $3 million of products to Hexion during 2013 and 2012, respectively, and MPM purchased less than $1 million of products from Hexion in each year.
As of September 30, 2014, MPM had $1 million of accounts receivable from Hexion and less than $1 million of accounts payable to Hexion related to these agreements and as of December 31, 2013 and 2012, MPM had $1 million and less than $1 million, respectively, of accounts receivable from, and less than $1 million, in each year, of accounts payable to Hexion.
Other Transactions with Hexion
In April 2014, MPM sold 100% of its interest in our Canadian subsidiary to a subsidiary of Hexion for a purchase price of $12 million. As a part of the transaction MPM also entered into a non-exclusive distribution agreement with a subsidiary of Hexion, whereby the subsidiary of Hexion will act as a distributor of certain of our products in Canada. The agreement has a term of 10 years, and is cancelable by either party with 180 days’ notice. MPM will compensate the subsidiary of Hexion for acting as distributor at a rate of 2% of the net selling price of the related products sold. During the nine months ended September 30, 2014, MPM sold approximately
125
Table of Contents
$20 million of products to Hexion under this distribution agreement, and paid less than $1 million to Hexion as compensation for acting as distributor of the products. As of September 30, 2014, MPM had $3 million of accounts receivable from Hexion related to this distribution agreement.
In March 2014, MPM entered into an Employee Services Agreement with Hexion Holdings, Hexion and Momentive Performance Materials Holdings Employee Corporation (“Employee Corp”), a subsidiary of Hexion Holdings (the “Services Agreement”). The Services Agreement provides for the executive services of Mr. Jack Boss, an employee of Employee Corp., to be made available to us and sets forth the terms with respect to payment for the cost of such services. Mr. Boss was elected Executive Vice President and President Silicones and Quartz Division of MPM effective March 31, 2014. Pursuant to the Services Agreement, MPM agrees to pay 100% of Mr. Boss’s costs of employment which are set forth in the offer letter filed as an exhibit to MPM’s Annual Report and comprised of “Covered Costs” including an annual base salary of $585,000, a sign-on bonus of $1,300,000 payable between 2014 and 2015, annual incentive compensation, relocation costs, severance and benefits and other standard reasonable business expenses. MPM paid less than $1 million under the Service Agreement during the nine months ended September 30, 2014.
In March 2014, MPM entered into a ground lease with a Brazilian subsidiary of Hexion to lease a portion of our manufacturing site in Itatiba, Brazil, where the subsidiary of Hexion will construct and operate an epoxy production facility. In conjunction with the ground lease, MPM also entered into a site services agreement whereby it will provide to the subsidiary of Hexion various services such as environmental, health and safety, security, maintenance and accounting, amongst others, to support the operation of this new facility. MPM received less than $1 million from Hexion under this agreement during the nine months ended September 30, 2014.
Purchases and Sales of Products and Services with Affiliates other than Hexion
MPM sells products to various Apollo and GE affiliates other than Hexion. These sales were $9 million and $7 million for the nine months ended September 30, 2014 and 2013, respectively, and $9 million, $16 million and $17 million for the years ended December 31, 2013, 2012 and 2011, respectively. MPM had accounts receivable from these affiliates of $2 million at September 30, 2014 and $1 million and $5 million at December 31, 2013 and 2012, respectively.
MPM also purchases products and services from various Apollo and GE affiliates other than Hexion. These purchases were $12 million and $13 million for the nine months ended September 30, 2014 and 2013, respectively, and $19 million, $17 million and $27 million for the years ended December 31, 2013, 2012 and 2011, respectively. MPM had accounts payable to these affiliates of $1 million as of September 30, 2014 and $2 million and less than $1 million at December 31, 2013 and 2012, respectively.
Transactions with GE and its Affiliates
ASM Off-Take Agreement
Through May 17, 2013, MPM was a party to an (i) off-take agreement (the “Old Off-Take Agreement”) with Asia Silicones Monomer Limited (“ASM”), which was 50% owned by GE Monomer (Holdings) Pte Ltd. up until such date, and (ii) a long-term supply agreement with GE and GE Monomer (Holdings) Pte. Ltd. (the “Old GE Supply Agreement”), which was entered into at the closing of the GE Advanced Materials Acquisition. Under the Old Off-Take Agreement, ASM was obligated to provide siloxane and certain related products to MPM through 2014 (or until certain ASM financing obligations were satisfied). Under the Old GE Supply Agreement, GE and GE Monomer (Holdings) Pte. Ltd. agreed to ensure MPM a minimum annual supply of siloxane and certain related products from ASM or an alternative source in certain circumstances through December 2026. Under the Old Off-Take Agreement, MPM purchased approximately $35 million, $92 million and $109 million of siloxane and certain related products from ASM for the years ended December 31, 2013, 2012 and 2011, respectively.
126
Table of Contents
At the closing of the GE Advanced Materials Acquisition, GE Monomer (Holdings) Pte. Ltd. also assigned its interest as licensor under a certain Technology License Agreement with ASM to MPM, which assumed all of the obligations of GE Monomer (Holdings) Pte. Ltd. under such agreement. Pursuant to the Technology License Agreement, which was to terminate in 2039, MPM received royalties from ASM of approximately $2 million in each of 2012 and 2011 and less than $1 million in 2013.
On May 17, 2013, MPM entered into a new purchase and sale agreement (the “PSA”) with ASM in connection with the sale (the “GE ASM Sale”) by GE Monomer (Holdings) Pte Ltd., an affiliate of the General Electric Company (“GE”) of its equity interests in ASM. As a result of the GE ASM Sale, ASM is no longer an affiliate of us. The new PSA provides MPM with a long-term supply of siloxane through 2026 and the option to extend such agreement through 2036. The PSA replaced and superseded the Old Off-Take Agreement and the Old GE Supply Agreement. In connection with the foregoing transactions, MPM’s former direct parent received a one-time payment of approximately $102 million from GE, which amount was subsequently contributed to MPM.
Trademark License Agreement
On May 17, 2013, MPM entered into an amendment to the Trademark License Agreement, dated as of December 3, 2006, by and between GE Monogram Licensing International and us, to, among other things, revise the royalty payable to GE Monogram Licensing International and provide for an option to extend such agreement for an additional five-year period through 2023. In connection with the amendment, MPM’s former direct parent recorded a gain and related intangible asset of $7 million. The intangible asset was subsequently contributed to MPM.
Intellectual Property Cross License Agreement
MPM and GE are parties to an intellectual property cross-licensing agreement to ensure that the MPM Group owns or has the right to use all intellectual property necessary to conduct its business as was conducted at the time of the GE Advanced Materials Acquisition. The agreement provides for four different categories of ownership and licensing terms (including the scope, duration and exclusivity of the license) based on the use of the intellectual property by the MPM Group or by GE prior to closing of the GE Advanced Materials Acquisition. All licenses of intellectual property by GE to the MPM Group or by the MPM Group to GE are perpetual and royalty-free.
Revolving Credit Facility
In April 2013, MPM entered into a $75 million revolving credit facility with an affiliate of GE (the “Cash Flow Facility”). Prior to entry into the Cash Flow Facility, an affiliate of GE was one of the lenders under MPM’s old revolving credit facility, representing approximately $160 million of the lenders’ $300 million revolving credit facility commitment. As of September 30, 2014, $20 million was outstanding under the Cash Flow Facility. The Cash Flow Facility was terminated in connection with the Emergence.
Participation of Apollo Global Securities in Refinancing Transactions
In 2012, Apollo Global Securities, LLC (“AGS”), an affiliate of Apollo, acted as one of the initial purchasers and received less than $1 million and approximately $1 million in connection with the sales of the Old Secured Notes and the Old First Lien Notes, respectively. AGS also received less than $1 million in connection with arranging the issuance of the Old Secured Notes and approximately $1 million in connection with arranging the issuance of the Old First Lien Notes and the commitments for the Old ABL Facility.
127
Table of Contents
Other Transactions and Arrangements
Prior to June 30, 2014, Hexion Holdings (MPM’s ultimate parent prior to October 24, 2014) purchased insurance policies which also covered MPM and Hexion. Amounts were billed to MPM annually based on its relative share of the insurance premiums and amortized over the term of the policy. There were no billings to MPM for the nine months ended September 30, 2014. Hexion Holdings billed MPM $9 million for the year ended December 31, 2013. MPM had accounts payable to Hexion Holdings of approximately $3 million under these arrangements at December 31, 2013.
In April 2014, MPM entered into an accounts receivable purchase and sale agreement with a newly formed subsidiary of Hexion Holdings. The agreement contains customary terms and conditions associated with such arrangements. On April 7, 2014, under this agreement, MPM sold approximately $51 million of accounts receivable to the subsidiary of Hexion Holdings, and received 95% of the proceeds in cash, with the remaining 5% to be received in cash when the sold receivables are fully collected by the subsidiary of Hexion Holdings.
Review, Approval or Ratification of Transactions with Related Persons
Our Audit Committee Charter requires that the Audit Committee review and approve all transactions between related persons required to be reported under the provisions of Item 404 of Regulation S-K under the Securities Act and the Exchange Act.
The types of transactions that are covered by the policy include all transactions required to be so reported, including financial and other transactions, arrangements or relationships in which we or any of its subsidiaries is a participant and in which a related person has a direct or indirect material interest, where the amount involved exceeds $120,000. There were no transactions required to be reported under the provisions of Item 404 of Regulation S-K since the beginning of the last year where the above procedures did not require review, approval or ratification or where such procedures were not followed.
Related persons include directors and director nominees, executive officers, stockholders beneficially owning more than 5% of our voting stock, and immediate family members of any of the previously described persons. A related person could also be an entity in which a director, executive officer or 5% stockholder is an employee, general partner or 5% stockholder.
Our Certificate of Incorporation also requires that any transaction between the Company and any stockholder or affiliate thereof be approved by a majority of the directors who are not appointed by and are not otherwise affiliated with the related party, subject to certain exceptions including for transactions that involve payments or value equal to or less than $1,750,000.
Director Independence
We have no securities listed for trading on a national securities exchange or in an automated inter-dealer quotation system of a national securities association, which has requirements that a majority of our Board of Directors be independent. For purposes of complying with the disclosure requirements of the SEC, we have adopted the definition of independence used by the New York Stock Exchange. Under the New York Stock Exchange’s definition of independence, Messrs. Bell, Dionne and Markby are independent.
128
Table of Contents
The Company has the following secured indebtedness outstanding:
| • | the ABL Facility; |
| • | the First Lien Notes; and |
| • | the Second Lien Notes. |
Each of the foregoing are secured by separate collateral agreements with substantially identical terms and covering substantially identical collateral except with respect to foreign collateral, which is only pledged in favor of the lenders under the ABL Facility.
ABL Facility
Upon emergence from the Chapter 11 proceedings, the debtor-in-possession and exit senior secured asset-based revolving credit facility converted into an exit senior secured asset-based revolving credit facility (the “ABL Facility”). The ABL Facility provides borrowing availability equal to the lesser of (a) $270 million and (b) the borrowing base described below. The commitments under the ABL Facility consist of a $200 million last-in, first-out tranche (the “Tranche A Commitments”) and a $70 million first-in, last-out tranche (the “Tranche B Commitments”). The ABL Facility has a five-year term.
In addition, we may request one or more incremental revolving commitments under the ABL Facility in an aggregate principal amount up to the greater of (a) $80 million and (b) the excess of the borrowing base over the amount of the then-effective commitments under the ABL Facility at the time of such increase (to the extent we can identify lenders willing to make such an increase available to us).
The borrowing base for the Tranche A Commitments is, at any time of determination, an amount (net of reserves) equal to the sum of:
| • | 85% of the amount of eligible accounts receivable (including trade receivables), plus |
| • | the lesser of (i) 70% of the amount of eligible inventory and (ii) 85% of the net orderly liquidation value of eligible inventory. |
The borrowing base for the Tranche B Commitments is, at any time of determination, an amount (net of reserves) equal to the sum of:
| • | 5% of the amount of eligible accounts receivable (including trade receivables), plus |
| • | the lesser of (i) 5% of the amount of eligible inventory and (ii) 5% of the net orderly liquidation value of eligible inventory, plus |
| • | in the case of the borrowing base for our German subsidiaries and our Canadian subsidiary, the lesser of (i) 80% of the net orderly liquidation value of eligible machinery and equipment located in Canada, the United Kingdom, Germany and the Netherlands and (ii) $50 million. |
The ABL Facility includes borrowing capacity available for letters of credit and for borrowings on same-day notice, referred to as swingline loans.
We may voluntarily repay outstanding loans under the ABL Facility at any time without premium or penalty, other than customary “breakage” costs with respect to eurocurrency loans.
The borrowings under the ABL Facility bear interest at a rate equal to an applicable margin (subject to adjustment based on average availability) plus, as determined at our option, either (a) a base rate (the “ABR
129
Table of Contents
Rate”) determined by reference to the highest of (1) the U.S. federal funds rate plus 0.50%, (2) the prime rate of the administrative agent or one of its affiliates, and (3) the adjusted LIBOR rate for a one-month interest period plus 1.0%, and (b) a eurocurrency rate (“LIBOR”) determined by reference to the costs of funds for eurocurrency deposits in dollars in the London interbank market for the interest period relevant to such borrowing adjusted for certain additional costs, with Canadian-equivalent options in the case of borrowings by our Canadian subsidiary.
The initial applicable margin for LIBOR rate borrowings under the ABL Facility was 2.00% for Tranche A Commitments and 2.75% for Tranche B Commitments. The initial applicable margin for ABR Rate borrowings under the ABL Facility was 1.00% for Tranche A Commitments and 1.75% for Tranche B Commitments. The foregoing applicable margins are adjusted depending on the availability under the ABL Facility. Following and during the continuance of an event of default, overdue amounts owing under our ABL Facility will bear interest at a rate per annum equal to the rate otherwise applicable thereto plus an additional 2.0%.
In addition to paying interest on outstanding principal under the ABL Facility, are required to pay a commitment fee to the lenders in respect of the unutilized commitments thereunder at an initial rate equal to 0.375% per annum, which could be adjusted to 0.25% per annum depending on the usage. We also pay a customary letter of credit fee, including a fronting fee of 0.125% per annum of the stated amount of each outstanding letter of credit, and customary agency fees.
Our ABL Facility contains customary covenants that, among other things, restrict, subject to certain exceptions, our ability, and the ability of our subsidiaries, to incur indebtedness, sell assets, make investments, engage in acquisitions, mergers or consolidations and make dividends or other restricted payments. Our ABL Facility also contains certain customary affirmative covenants and events of default. The negative covenants in the ABL Facility include, among other things, limitations (none of which are absolute) on our ability to:
| • | sell assets; |
| • | incur additional indebtedness; |
| • | repay other indebtedness; |
| • | pay dividends and distributions or repurchase our capital stock; |
| • | create liens on assets; |
| • | make investments, loans, guarantees or advances; |
| • | make certain acquisitions; |
| • | engage in mergers or consolidations; |
| • | enter into sale leaseback transactions; |
| • | engage in certain transactions with affiliates; |
| • | amend certain material agreements governing our indebtedness; |
| • | amend our organizational documents; and |
| • | change the business conducted by us and our subsidiaries. |
In addition, the ABL Facility requires us to maintain a minimum fixed charge coverage ratio at any time when the average availability is less than the greater of (a) 12.5% of the lesser of (i) the borrowing base at such time and (ii) the aggregate amount of ABL Facility commitments at such time, and (b) $27 million. In that event (the “Availability Triggering Event”), we must satisfy a minimum fixed charge coverage ratio of 1.0 to 1.0. For purposes of determining compliance with the fixed charge coverage ratio maintenance covenant for any applicable fiscal quarter, we may exercise an equity cure by issuing certain permitted securities for cash or otherwise receive cash contributions that will, upon the receipt of such cash by us, be included in the calculation of EBITDA. We expect that, on a pro forma basis giving effect to the Emergence, the fixed charge coverage ratio will not be in effect.
130
Table of Contents
The events of default under our ABL Facility include, without limitation, nonpayment, misrepresentations, breach of covenants, insolvency, bankruptcy, certain judgments, change of control (as defined in our ABL Facility) and cross-defaults.
All obligations under the ABL Facility are unconditionally guaranteed by the Company’s parent, us, and, subject to certain exceptions, each of our existing and future direct and indirect U.S. subsidiaries, which we refer to collectively as “U.S. Guarantors.” In addition, all obligations of MPM GmbH, MPM Quartz and MPM Canada under the ABL Facility are guaranteed by MPM USA, the U.S. Guarantors, and certain other direct and indirect foreign subsidiaries of the Company, which we collectively refer to as the “Foreign Guarantors.” The obligations of MPM USA under the ABL Facility and any hedging arrangements and cash management services and the guarantees in respect of those obligations are secured by substantially all of the assets and stock (but in the case of non-U.S. subsidiaries, limited to 65% of the voting equity of such subsidiaries) owned by MPM USA and the U.S. Guarantors, other than the intercompany note issued to the Company by Japan Acquisition Co. and subject to certain other exceptions. The obligations of MPM GmbH, MPM Quartz and MPM Canada under the ABL Facility and any hedging arrangements and cash management services and the guarantees in respect of those obligations are secured by substantially all of the assets and stock owned by MPM USA and the U.S. Guarantors and by the receivables, inventory and other current assets, and the equipment and machinery (and proceeds thereof) of MPM GmbH, MPM Quartz, MPM Canada and certain of the Foreign Guarantors, subject to certain exceptions. Such security interest will consist, (1) with respect to the assets of MPM USA and the U.S. Guarantors constituting collateral, of a first-priority security interest with respect to the ABL priority collateral (with the First Lien Notes (as defined below) secured by second-priority security interests therein) and a second-priority security interest with respect to the non-ABL priority collateral (with the First Lien Notes (as defined below) secured by first-priority security interests therein) and (2) of a first-priority lien with respect to the assets of MPM GmbH, MPM Quartz, MPM Canada and the Foreign Guarantors constituting collateral.
First Lien Notes
General
The 3.88% First-Priority Senior Secured Notes due 2021 (the “First Lien Notes”) consist of $1,100 million original aggregate principal amount.
Rankings
The First Lien Notes rank equally in right of payment to all of the Company’s existing and future senior indebtedness and rank senior in right of payment to all of the Company’s existing and future subordinated indebtedness. The First Lien Notes rank effectively junior in priority to the Company’s obligations under the ABL Facility to the extent of the value of the ABL Priority Collateral (which generally includes most of the Registrant’s and its domestic subsidiaries’ inventory and accounts receivable and related assets); equal with holders of other obligations secured pari passu with the First Lien Notes including other first priority obligations (to the extent of the value of such collateral); effectively senior to any junior priority obligations (to the extent of the value of such collateral) including the Company’s Second Lien Notes and the Company’s obligations under the ABL Facility to the extent of the value of the collateral that is not ABL Priority Collateral; and effectively senior to any senior unsecured obligations (to the extent of the value of such collateral).
Optional Redemption
The First Lien Notes may be redeemed at the applicable redemption price, plus accrued and unpaid interest.
Mandatory Redemption
The Company is not required to make mandatory redemption or sinking fund payments with respect to the First Lien Notes.
131
Table of Contents
Change in Control
In the event of a Change in Control (as defined in the applicable indenture), a holder has the right to require us to buy such holder’s First Lien Notes at 100% of their principal amount, plus accrued and unpaid interest.
Covenants
Under the terms of the indenture governing the First Lien Notes, the Company is subject to covenants that, among other things, limit the Company’s ability and the ability of certain of the Company’s subsidiaries to (i) incur or guarantee additional indebtedness or issue preferred stock; (ii) grant liens on assets; (iii) pay dividends or make distributions to the Company’s stockholders; (iv) repurchase or redeem capital stock or subordinated indebtedness; (v) make investments or acquisitions; (vi) incur restrictions on the ability of the Company’s subsidiaries to pay dividends or to make other payments to us; (vii) enter into transactions with the Company’s affiliates; (viii) merge or consolidate with other companies or transfer all or substantially all of the Company’s assets; and (ix) transfer or sell assets.
Events of Default
The First Lien Notes specify events of default including failure to pay principal and interest on the First Lien Notes, subject to a 30-day grace period, a failure to comply with covenants, subject to a 60-day grace period in certain instances, and certain bankruptcy, insolvency or reorganization events with respect to us.
Second Lien Notes
General
The 4.69% Second-Priority Senior Secured Notes due 2022 (the “Second Lien Notes”) consist of $250 million original aggregate principal amount.
Rankings
The Second Lien Notes rank equally in right of payment to all of the Company’s existing and future senior indebtedness and rank senior in right of payment to all of the Company’s existing and future subordinated indebtedness. The Second Lien Notes rank junior in priority as to collateral with respect to the First Lien Notes and the ABL Facility and holders of certain other obligations secured pari passu with other first-priority obligations (to the extent of the value of such collateral) and senior in priority as to collateral with respect to all of the Company’s existing and future obligations secured by a junior lien on the collateral.
Optional Redemption
The Second Lien Notes may be redeemed at the applicable redemption price, plus accrued and unpaid interest.
Mandatory Redemption
The Company is not required to make mandatory redemption or sinking fund payments with respect to the Second Lien Notes.
Change of Control
In the event of a Change in Control (as defined below), a holder has the right to require us to buy such holder’s Second Lien Notes at 100% of their principal amount, plus accrued and unpaid interest.
132
Table of Contents
A “Change of Control” shall be deemed to have occurred: upon the Company becoming aware of the acquisition by any person or group, other than any of the permitted holders, by way of merger, consolidation or other business combination or purchase of beneficial ownership of more than 50% of the total voting power of the voting stock of the Company; or upon the sale, lease or transfer of substantially all of the assets of the Company and its subsidiaries, taken as a whole, to any person other than any of the permitted holders.
Covenants
Under the terms of the indenture governing the Second Lien Notes, the Company is subject to covenants that, among other things, restrict its ability to create liens on its assets, incur debt, incur debt at its subsidiaries, pay dividends, issue disqualified and preferred stock or enter into sale leaseback transactions.
Events of Default
The Second Lien Notes specify events of default including failure to pay principal and interest on the Second Lien Notes, a failure to comply with covenants, subject to a 30-day grace period in certain instances, and certain bankruptcy, insolvency or reorganization events with respect to us.
133
Table of Contents
Capital Stock
Our amended and restated certificate of incorporation (the “Certificate of Incorporation”) has an authorized capital stock consisting of 70,000,000 shares of common stock, par value $0.01 per share. As of December 18, 2014, we had 47,989,000 shares of common stock outstanding. Summarized below are material provisions of our Certificate of Incorporation and amended and restated bylaws, as well as relevant sections of the Delaware General Corporation Law (the “DGCL”). The following summary is qualified in its entirety by the provisions of our Certificate of Incorporation and amended and restated bylaws (the “Bylaws”), copies of which have been filed as exhibits to the registration statement of which this prospectus is a part, and by the applicable provisions of the DGCL.
Common stock
The holders of our common stock are entitled to one vote per share on all matters submitted to a vote of stockholders, including the election of directors. Holders of the common stock do not have cumulative voting rights, which means that the holders of a majority of the outstanding common stock voting for the election of directors can elect all directors then being elected. The holders of our common stock are entitled to receive dividends when, as, and if declared by our board of directors out of legally available funds. Upon our liquidation or dissolution, the holders of common stock will be entitled to share ratably in those of our assets that are legally available for distribution to stockholders after payment of liabilities.
The holders of our common stock that beneficially own more than 2.5% of the outstanding shares of common stock have pre-emptive rights (“Preemptive Rightsholders”) until the earlier of the listing of the common stock on a national securities exchange (a “Listing”) or the consummation of the first public offering and sale of common stock (an “IPO”). Preemptive Rightsholders have the right to elect to purchase their pro rata portion of the number of shares of common stock to be issued by the Company in a proposed transaction at the same price and on the same terms and conditions as in such transaction, subject to certain exceptions including common stock issued pursuant to (i) equity-based compensation or incentive plans approved by the Board, (ii) stock splits, payments of dividends or other similar transactions approved by the Board, (iii) consideration in any business combination, consolidation, merger or acquisition transaction or joint venture, (iv) as a bona fide equity kicker in connection with incurring indebtedness, subject to certain exceptions, and (v) to the Company or a direct or indirect wholly-owned subsidiary of the Company.
Corporate Opportunity
Our Certificate of Incorporation provides that the doctrine of “corporate opportunity” will not apply with respect to Apollo, the Ad Hoc Group (as defined in the Certificate of Incorporation) and their respective affiliates in a manner that would prohibit them from investing in, or having a relationship with, a competing businesses or pursuing business opportunities that are ones that the Company might reasonably be deemed to have pursued.
Certain Certificate of Incorporation, Bylaw and Statutory Provisions
The provisions of our Certificate of Incorporation and Bylaws and of the DGCL summarized below may have an anti-takeover effect and may delay, deter or prevent a tender offer or takeover attempt that you might consider in your best interest, including an attempt that might result in your receipt of a premium over the market price for your shares.
Directors’ Liability; Indemnification of Directors and Officers
Section 145 of the DGCL authorizes a court to award, or a corporation’s board of directors to grant, indemnity to directors and officers in terms sufficiently broad to permit such indemnification under certain circumstances for liabilities, including reimbursements for expenses incurred arising under the Securities Act.
134
Table of Contents
Our Certificate of Incorporation limits the liability of our officers and directors to the maximum extent permitted by Delaware law. Delaware law provides that directors will not be personally liable for monetary damages for breach of their fiduciary duties as directors, except liability for:
| • | any breach of the duty of loyalty to the corporation or its stockholders; |
| • | acts or omissions not in good faith or which involve intentional misconduct or knowing violations of law; |
| • | unlawful payments of dividends or unlawful stock repurchases or redemptions; or |
| • | any transaction from which the director derived an improper personal benefit. |
The effect of this provision is to eliminate our rights, and our stockholders’ rights, to recover monetary damages against a director for breach of a fiduciary duty of care as a director. This provision does not limit or eliminate our rights or those of any stockholder to seek non-monetary relief such as an injunction or rescission in the event of a breach of a director’s duty of care. The provisions will not alter the liability of directors under federal securities laws. Our Certificate of Incorporation also requires us to advance expenses, including attorneys’ fees, to our directors and officers in connection with legal proceedings, subject to very limited exceptions.
Any amendment to or repeal of these provisions will not adversely affect any right or protection of our directors in respect of any act or failure to act that occurred prior to any amendment to or repeal of such provisions or the adoption of an inconsistent provision. If the DGCL is amended to provide further limitation on the personal liability of directors of corporations, then the personal liability of our directors will be further limited to the greatest extent permitted by the DGCL. In addition, we intend to enter into separate indemnification arrangements with each of our directors. We also maintain director and officer liability insurance.
Special Meetings of Stockholders
Our Bylaws provide that special meetings of stockholders may be called only by the chairperson of our board of directors, the president or secretary of the Company, or at the request of holders of at least 33% of our outstanding common stock. Except as described above, stockholders will not be permitted to call a special meeting of stockholders, to require that the chairman call such a special meeting, or to require that the president or secretary request the calling of a special meeting of stockholders. These provisions, taken together, will prevent stockholders from forcing consideration by the stockholders of stockholder proposals over the opposition of the board, except at an annual meeting or under the circumstances described above.
Stockholder Action
Our Bylaws provide that prior to a Listing or an IPO, stockholders may take action by written consent if the consent is signed by holders of our outstanding shares having the number of votes that would be necessary to authorize or take such action at a meeting at which all shares entitled to vote thereon were present. Following the earlier of a Listing or an IPO, stockholders may take action by written consent only if the written consent is signed by all holders of outstanding stock of the Company.
Directors
Our board of directors currently has eleven members. Each of our directors will serve an initial term of the earlier to occur of (i) October 24, 2016 and (ii) the date of a Listing or an IPO (the “First Election”). Prior to the First Election, no the size of the board of directors will consist of no less than nine members and no more than eleven members, and no director may be removed, with or without cause, without the affirmative vote of the holders of ninety percent (90%) of the then outstanding shares of common stock. After the First Election, the number of directors may be changed by a resolution of a majority of the board of directors. Our board of directors may elect a director to fill a vacancy, including vacancies created by the expansion of the board of directors, upon the affirmative vote of a majority of the remaining directors then in office.
135
Table of Contents
Our Certificate of Incorporation and Bylaws provide that directors will be elected by a plurality of the votes, but do not provide for cumulative voting in the election of directors.
Business Combinations
Interested Stockholders
In general, section 203 of the DGCL prevents an interested stockholder (which is defined generally as a person owning 15% or more of the corporation’s outstanding voting stock) of a Delaware corporation from engaging in a business combination (as defined therein) for three years following the date that person became an interested stockholder unless various conditions are satisfied. We have elected to opt out of the provisions of section 203. Accordingly, we will not be subject to the anti-takeover effects of section 203.
Chief Executive Officer Review
Our Certificate of Incorporation provides that the Company will not be party to a business combination transaction until such time as a Chief Executive Officer that has been appointed other than on an interim or temporary basis (as determined by a majority of the directors who were not appointed by and are not otherwise affiliated with Apollo or the Ad Hoc Group) has reviewed the proposed terms and conditions of such transaction.
Forum for Adjudication of Disputes
Our Certificate of Incorporation provides that unless the Company consents in writing to the selection of an alternative forum, the Court of Chancery of the State of Delaware will be the sole and exclusive forum for any derivative action or proceeding brought on behalf of the Company, any action asserting breach of a fiduciary duty owed by any director, officer or other employee of the Company, any action asserting a claim arising pursuant to the DGCL or any action asserting a claim governed by the internal affairs doctrine. Although we have included a choice of forum provision in our Bylaws, it is possible that a court could rule that such provision is inapplicable or unenforceable. In addition, this provision would not affect the ability of our stockholders to seek remedies under the federal securities laws.
Amendment of the Certificate of Incorporation and Bylaws
Our Certificate of Incorporation may be amended in accordance with the provisions of the DGCL, which requires a majority of the outstanding stock of our common stock to vote in favor of an amendment, except that (i) the provisions relating to preemptive rights, the number of term of directors and the chief executive officer may not be altered, amended or repealed until the earlier of the occurrence of a Listing and an IPO and (ii) the provisions relating to affiliate transactions may not be altered, amended or repealed without the affirmative vote of the holders of all the then outstanding shares of common stock (other than in connection with a Listing or an IPO) and the approval of both a majority of directors not affiliated with Apollo and the holders of a majority of the then outstanding shares of common stock, disregarding for purposes of such calculation any shares of common stock beneficially owned by Apollo or any of its affiliates.
In addition, the board of directors is permitted to alter our Bylaws without obtaining stockholder approval. Stockholders may only alter our Bylaws with the affirmative vote of at least a majority of the then outstanding shares of common stock.
Transfer Agent and Registrar
The transfer agent and registrar for our common stock is Wells Fargo Bank, National Association.
National Securities Exchange Listing
Our common stock is not listed on any national securities exchange and there can be no assurance that our common stock will achieve a listing on a national securities exchange.
136
Table of Contents
We are registering common stock covered by this prospectus to permit the selling stockholders to conduct public secondary trading of these shares from time to time after the date of this prospectus. We will not receive any of the proceeds of the sale of the common stock offered by this prospectus. The aggregate proceeds to the selling stockholders from the sale of the common stock will be the purchase price of the common stock less any discounts and commissions. We have agreed to pay certain expenses of the selling stockholders incurred in connection with the sale of common stock from time to time pursuant to this prospectus, but will not pay any underwriters’ discounts or commissions.
Each selling stockholder reserves the right to accept and, together with its agents, to reject, any proposed purchases of common stock to be made directly or through agents. If any pledgee, donee, transferee or other successor to the selling stockholders named in this prospectus wishes to sell under this prospectus, we will file a prospectus supplement identifying such successors as selling stockholders.
The shares of common stock offered by this prospectus may be sold from time to time to purchasers:
| • | directly by the selling stockholders and their successors, which includes their donees, pledgees or transferees or their successors-in-interest; or |
| • | through underwriters, broker-dealers or agents, who may receive compensation in the form of discounts, commissions or agent’s commissions from the selling stockholders or the purchasers of the common stock. These discounts, concessions, or commissions may be in excess of those customary in the types of transaction involved. |
These sales may be effected in one or more transactions:
| • | on any national securities exchange or quotation service on which our common stock may be listed or quoted at the time of sale; |
| • | in the over-the-counter market; |
| • | in transactions otherwise than in the over-the-counter market; |
| • | through the writing of options (including the issuance by the selling stockholders of derivative securities), whether the options or such other derivative securities are listed on an options exchange or otherwise; |
| • | through the settlement of short sales; or |
| • | through any combination of the foregoing. |
These transactions may include block transactions or crosses. Crosses are transactions in which the same broker acts as an agent on both sides of the trade. In connection with the sales of our common stock, the selling stockholders may enter into hedging transactions with broker-dealers or other financial institutions that, in turn, may:
| • | engage in short sales of the common stock in the course of hedging their positions; |
| • | sell the common stock short and deliver the common stock to close out short positions; |
| • | loan or pledge the common stock to broker-dealers or other financial institutions that in turn may sell the common stock; |
| • | enter into option or other transactions with broker-dealers or other financial institutions that require the delivery to the broker-dealer or other financial institution of the common stock, which the broker-dealer or other financial institution may resell; or |
| • | enter into transactions in which a broker-dealer makes purchases as a principal for resale for its own account or through other types of transactions. |
137
Table of Contents
A short sale of common stock by a broker-dealer, financial institution or selling stockholder would involve the sale of such common stock that is not owned, and therefore must be borrowed, in order to make delivery of the security in connection with such sale. In connection with a short sale of common stock, a broker-dealer, financial institution or selling stockholder may purchase shares on the open market to cover positions created by short sales. In determining the source of the common stock to close out such short positions, the broker-dealer, financial institution or selling stockholders may consider, among other things, the price of shares available for purchase in the open market.
At the time a particular offering of the shares is made, a prospectus supplement, if required, will be distributed, which will set forth the names of the selling stockholders, the aggregate amount of shares being offered and the terms of the offering, including, to the extent required, (1) the name or names of any underwriters, broker-dealers or agents, (2) any discounts, commissions and other terms constituting compensation from the selling stockholders and (3) any discounts, commissions or concessions allowed or reallowed to be paid to broker-dealers.
Pursuant to a requirement by FINRA, the maximum commission or discount to be received by any FINRA member or independent broker-dealer may not be greater than 8% of the gross proceeds received by the selling stockholders for the sale of any common stock being offered by this prospectus.
There can be no assurance that any selling stockholder will sell any or all of the common stock under this prospectus. Further, we cannot assure you that any such selling stockholder will not transfer, devise or gift the common stock by other means not described in this prospectus. In addition, any common stock covered by this prospectus that qualifies for sale under Rule 144 or Rule 144A of the Securities Act may be sold under Rule 144 or Rule 144A rather than under this prospectus. The Common Stock Covered by this Prospectus may also be sold to non-U.S. persons outside the U.S. in accordance with Regulation S under the Securities Act rather than under this Prospectus. The common stock may be sold in some states only through registered or licensed brokers or dealers. In addition, in some states the common stock may not be sold unless it has been registered or qualified for sale or an exemption from registration or qualification is available and complied with.
The selling stockholders and any other person participating in the sale of the common stock will be subject to the Exchange Act. The Exchange Act rules include, without limitation, Regulation M, which may limit the timing of purchases and sales of any of the common stock by the selling stockholders and any other person. In addition, Regulation M may restrict the ability of any person engaged in the distribution of the common stock to engage in market-making activities with respect to the particular common stock being distributed. This may affect the marketability of the common stock and the ability of any person or entity to engage in market-making activities with respect to the common stock.
In the Registration Rights Agreement, we have agreed to indemnify or provide contribution to the selling stockholders against certain liabilities, including certain liabilities under the Securities Act and the Exchange Act. In addition, we have agreed to pay substantially all of the expenses incidental to the registration of the common stock, including the payment of federal securities law and state “blue sky” registration fees excluding underwriting discounts and commissions relating to the sale of common stock.
138
Table of Contents
CERTAIN U.S. FEDERAL INCOME TAX CONSIDERATIONS
The following is a discussion of the material U.S. federal income tax consequences of the acquisition, ownership and disposition of common stock by beneficial owners of our common stock that acquire common stock pursuant to this offering and that hold such shares as capital assets (generally, for investment). This discussion is not a complete analysis or listing of all of the possible tax consequences of such transactions and does not address all tax considerations that might be relevant to particular stockholders in light of their personal circumstances or to persons that are subject to special tax rules. In addition, this description of the material U.S. federal income tax consequences does not address the tax treatment of special classes of stockholders, such as:
| • | financial institutions |
| • | regulated investment companies |
| • | real estate investment trusts |
| • | tax-exempt entities |
| • | insurance companies |
| • | persons holding the shares as part of a hedging, integrated or conversion transaction, constructive sale or “straddle,” |
| • | persons who acquired common stock through the exercise or cancellation of employee stock options or otherwise as compensation for their services |
| • | U.S. expatriates |
| • | persons subject to the alternative minimum tax |
| • | dealers or traders in securities or currencies |
| • | holders whose functional currency is not the U.S. dollar. |
This summary does not address estate and gift tax consequences (except to the extent specifically provided herein) or tax consequences under any state, local or foreign laws.
For purposes of this section, you are a “U.S. Holder” if you are: (1) an individual citizen of the United States or a resident alien of the United States; (2) a corporation (or other entity treated as a corporation for U.S. federal income tax purposes) created or organized under the laws of the United States or any state thereof or the District of Columbia; (3) an estate the income of which is subject to U.S. federal income taxation regardless of its source; or (4) a trust (A) if a court within the United States is able to exercise primary supervision over its administration and one or more U.S. persons have authority to control all substantial decisions of the trust or (B) that has a valid election in effect under applicable Treasury regulations to be treated as a U.S. person.
If you are an individual, you may be treated as a resident alien of the United States, as opposed to a non-resident alien, for U.S. federal income tax purposes if you are present in the United States for at least 31 days in a calendar year and for an aggregate of at least 183 days during a three-year period ending in such calendar year. For purposes of this calculation, you would count all of the days that you were present in the then-current year, one-third of the days that you were present in the immediately preceding year and one-sixth of the days that you were present in the second preceding year. Resident aliens are subject to United States federal income tax as if they were U.S. citizens, and thus would constitute “U.S. Holders” for purposes of the discussion below. If you are a citizen or tax resident of a country with which the United States has a tax treaty, other rules may apply in determining whether you are a resident alien.
The term “Non-U.S. Holder” means any beneficial owner of common stock that is neither a U.S. Holder nor a partnership (including for this purpose any entity that is treated as a partnership for U.S. federal income tax purposes).
139
Table of Contents
If a partnership or other pass-through entity is a beneficial owner of common stock, the tax treatment of a partner or other owner will generally depend upon the status of the partner (or other owner) and the activities of the entity. If you are a partner (or other owner) of a pass-through entity that acquires common stock, you should consult your tax advisor regarding the tax consequences of acquiring, owning and disposing of common stock.
The following discussion is based upon the Internal Revenue Code of 1986, as amended (the “Code”), U.S. judicial decisions, administrative pronouncements and existing and proposed Treasury regulations, all as in effect as of the date hereof. All of the preceding authorities are subject to change, possibly with retroactive effect, so as to result in U.S. federal income tax consequences different from those discussed below. We have not requested, and will not request, a ruling from the U.S. Internal Revenue Service (the “IRS”) with respect to any of the U.S. federal income tax consequences described below, and as a result there can be no assurance that the IRS will not disagree with or challenge any of the conclusions we have reached and describe herein.
The following discussion is for general information only and is not intended to be, nor should it be construed to be, legal or tax advice to any holder or prospective holder of common stock and no opinion or representation with respect to the U.S. federal income tax consequences to any such holder or prospective holder is made. Prospective purchasers are urged to consult their tax advisors as to the particular consequences to them under U.S. federal, state and local, and applicable foreign tax laws of the acquisition, ownership and disposition of common stock.
U.S. Holders
The rules discussed in the following paragraphs will apply to your acquisition, ownership and disposition of common stock if you are a U.S. Holder, as defined above.
Distributions
Distributions of cash or property that we pay in respect of our common stock will constitute dividends for U.S. federal income tax purposes to the extent paid from our current or accumulated earnings and profits (as determined under U.S. federal income tax principles) and will be includible in gross income by you when actually or constructively received in accordance with your regular method of accounting for U.S. federal income tax purposes. Any such dividend will generally be eligible for the dividends received deduction if you are a corporate U.S. Holder that meets the holding period and other requirements for the dividends received deduction. If you are a non-corporate U.S. Holder, dividends received may be eligible for U.S. federal income taxation at the long-term capital gains rates generally applicable to individuals, provided that the applicable holding period and other requirements are met. If the amount of a distribution exceeds our current and accumulated earnings and profits, such excess first will be treated as a tax-free return of capital to the extent of your tax basis in our common stock, and thereafter will be treated as capital gain.
Sale, Exchange or Other Taxable Disposition of Common Stock
You generally will recognize gain or loss upon the taxable sale, exchange or other disposition of common stock in an amount equal to the difference between (i) the amount realized upon the sale, exchange or other taxable disposition and (ii) your adjusted tax basis in the common stock. Generally, such gain or loss will be capital gain or loss and will be long-term capital gain or loss if, on the date of the sale, exchange or other taxable disposition, you have held the common stock for more than one year. Long-term capital gains will be taxed at a maximum rate of 20%. The deductibility of capital losses is subject to limitations under the Code.
Information Reporting and Backup Withholding
In general, information reporting will apply to dividends paid to you in respect of common stock and the proceeds received by you from the sale, exchange or other disposition of common stock within the United States unless you are a corporation or other exempt recipient. A backup withholding tax may apply to such payments if you fail to provide a taxpayer identification number or certification of exempt status, or you fail to report in full dividend and interest income.
140
Table of Contents
Backup withholding is not an additional tax. Any amounts withheld under the backup withholding rules will be allowed as a refund or credit against your U.S. federal income tax liability, provided that you furnish the required information to the IRS.
Non-U.S. Holders
Distributions
Distributions of cash or property that we pay in respect of common stock will constitute dividends for U.S. federal income tax purposes to the extent paid from our current or accumulated earnings and profits (as determined under U.S. federal income tax principles). Except as described below under “—Non-U.S. Holders—U.S. Trade or Business Income,” you generally will be subject to U.S. federal withholding tax at a 30% rate, or at a reduced rate prescribed by an applicable income tax treaty, on any dividends received in respect of our common stock. If the amount of the distribution exceeds our current and accumulated earnings and profits, such excess first will be treated as a return of capital to the extent of your tax basis in our common stock, and thereafter will be treated as capital gain. However, except to the extent that we elect (or the paying agent or other intermediary through which you hold your common stock elects) otherwise, we (or the intermediary) must generally withhold on the entire distribution, in which case you would be entitled to a refund from the IRS for the withholding tax on the portion of the distribution that exceeded our current and accumulated earnings and profits. In order to obtain a reduced rate of U.S. federal withholding tax under an applicable income tax treaty, you will be required to provide a properly executed IRS Form W-8BEN or W-8BEN-E (or successor form) certifying your entitlement to benefits under the treaty. If you are eligible for a reduced rate of U.S. federal withholding tax under an income tax treaty, you may obtain a refund or credit of any excess amounts withheld by filing an appropriate claim for a refund with the IRS. You are urged to consult your own tax advisor regarding your possible entitlement to benefits under an income tax treaty.
Sale, Exchange or Other Taxable Disposition of Common Stock
You generally will not be subject to U.S. federal income or withholding tax in respect of any gain on a sale, exchange or other disposition of common stock unless:
| • | the gain is U.S. trade or business income, in which case, such gain will be taxed as described in “U.S. Trade or Business Income,” below. |
| • | you are an individual who is present in the United States for 183 or more days in the taxable year of the disposition and certain other conditions are met, in which case you will be subject to U.S. federal income tax at a rate of 30% (or a reduced rate under an applicable tax treaty) on the amount by which certain capital gains allocable to U.S. sources exceed certain capital losses allocable to U.S. sources; or |
| • | we are or have been a “U.S. real property holding corporation” (a “USRPHC”) under section 897 of the Code at any time during the shorter of the five-year period ending on the date of the disposition and your holding period for the common stock, in which case, subject to the exception set forth in the second sentence of the next paragraph, such gain will be subject to U.S. federal income tax in the same manner as U.S. trade or business income. |
In general, a corporation is a USRPHC if the fair market value of its “U.S. real property interests” equals or exceeds 50% of the sum of the fair market value of its worldwide real property interests and its other assets used or held for use in a trade or business. In the event that we are determined to be a USRPHC, gain will not be subject to tax as U.S. trade or business income if your holdings (direct and indirect) at all times during the applicable period constituted 5% or less of our common stock, provided that our common stock were regularly traded on an established securities market during such period. We believe that were are not currently, and we do not anticipate becoming in the future, a “U.S. real property holding corporation” for U.S. federal income tax purposes.
141
Table of Contents
U.S. Trade or Business Income
For purposes of this discussion, dividend income and gain on the sale, exchange or other taxable disposition of our common stock will be considered to be “U.S. trade or business income” if (A) such income or gain is (i) effectively connected with your conduct of a trade or business within the United States and (ii) if you are eligible for the benefits of an income tax treaty with the United States, attributable to a permanent establishment (or, if you are an individual, a fixed base) that you maintain in the United States or (B) we are or have been a USRPHC at any time during the shorter of the five-year period ending on the date of the disposition of your interest and your holding period for the common stock (subject to the exception set forth above in the second paragraph of “Sale, Exchange or Other Taxable Disposition of Common Stock”. Generally, U.S. trade or business income is not subject to U.S. federal withholding tax (provided that you comply with applicable certification and disclosure requirements, including providing a properly executed IRS Form W-ECI (or successor form)); instead, you are subject to U.S. federal income tax on a net basis at regular U.S. federal income tax rates (in the same manner as a U.S. person) on your U.S. trade or business income. If you are a corporation, any U.S. trade or business income that you receive may also be subject to a “branch profits tax” at a 30% rate, or at a lower rate prescribed by an applicable income tax treaty.
U.S. Federal Estate Tax
If you are an individual Non-U.S. Holder who is treated as the owner of or has made certain lifetime transfers of an interest in our common stock, you will be required to include the value thereof in your gross estate for U.S. federal estate tax purposes, and may be subject to U.S. federal estate tax unless an applicable estate tax treaty provides otherwise.
Information Reporting and Backup Withholding Tax
We must annually report to the IRS and to each Non-U.S. Holder any dividend income that is subject to U.S. federal withholding tax, or that is exempt from such withholding pursuant to an income tax treaty. Copies of these information returns may also be made available under the provisions of a specific treaty or agreement to the tax authorities of the country in which a Non-U.S. Holder resides. Under certain circumstances, the Code imposes a backup withholding obligation on certain reportable payments. Dividends paid to you will generally be exempt from backup withholding if you provide a properly executed IRS Form W-8BEN or W-8BEN-E (or successor form) or otherwise establish an exemption and we do not have actual knowledge or reason to know that you are a U.S. person or that the conditions of such other exemption are not, in fact, satisfied.
The payment of the proceeds from the disposition of common stock to or through the U.S. office of any broker (U.S. or non-U.S.) will be subject to information reporting and possible backup withholding unless you certify as to your non-U.S. status under penalties of perjury or otherwise establish an exemption and the broker does not have actual knowledge or reason to know that you are a U.S. person or that the conditions of any other exemption are not, in fact, satisfied. The payment of proceeds from the disposition of our common stock to or through a non-U.S. office of a non-U.S. broker will not be subject to information reporting or backup withholding unless the non-U.S. broker has certain types of relationships with the United States (a “U.S. related financial intermediary”). In the case of the payment of proceeds from the disposition of our common stock to or through a non-U.S. office of a broker that is either a U.S. person or a U.S. related financial intermediary, the Treasury regulations require information reporting (but not backup withholding) on the payment unless the broker has documentary evidence in its files that the owner is a Non-U.S. Holder and the broker has no knowledge to the contrary. You are urged to consult your tax advisor on the application of information reporting and backup withholding in light of your particular circumstances.
Backup withholding is not an additional tax. Any amounts withheld under the backup withholding rules from a payment to you will be refunded or credited against your U.S. federal income tax liability, if any, provided that the required information is furnished to the IRS.
142
Table of Contents
Additional Withholding Requirements Under FATCA
Sections 1471 through 1474 of the Code, commonly referred to as FATCA, and applicable Treasury Regulations impose withholding at a rate of 30% on payments of dividends on, and gross proceeds from the sale or redemption of, our common stock paid to “foreign financial institutions” (which is broadly defined for this purpose and in general includes investment vehicles) and certain other non-U.S. entities unless various U.S. information reporting and due diligence requirements (generally relating to ownership by U.S. persons of certain interests in or accounts with those entities) have been satisfied, or an exemption applies. An intergovernmental agreement between the United States and an applicable foreign country may modify these requirements. If FATCA withholding is imposed, a beneficial owner of our common stock that is not a foreign financial institution generally will be entitled to a refund of any amounts withheld in excess of otherwise applicable withholding tax by filing a U.S. federal income tax return (which may entail significant administrative burden). A beneficial owner that is a foreign financial institution but not a “participating foreign financial institution” (as defined under FATCA) will be able to obtain a refund only to the extent an applicable income tax treaty with the United States entitles such beneficial owner to an exemption from, or reduced rate of, tax on the payment that was subject to withholding under FATCA. These withholding requirements apply to any payments of dividends on our common stock, as well as to payments of gross proceeds from a disposition of our common stock made on or after January 1, 2017. Non-U.S. Holders should consult their tax advisers regarding the effects of FATCA on their investment in our common stock and their potential ability to obtain a refund of any FATCA withholding.
143
Table of Contents
The validity of the shares of common stock being offered hereby will be passed upon for us by Paul, Weiss, Rifkind, Wharton & Garrison LLP, New York, New York.
The financial statements as of December 31, 2013 and 2012 and for each of the three years in the period ended December 31, 2013 included in this Prospectus have been so included in reliance on the report (which contains an emphasis of a matter related to alleviating substantial doubt about the Company’s ability to continue as a going concern) of PricewaterhouseCoopers LLP, an independent registered public accounting firm, given on the authority of said firm as experts in auditing and accounting.
WHERE YOU CAN FIND ADDITIONAL INFORMATION
We have filed with the SEC a registration statement under the Securities Act referred with respect to the shares of our common stock offered by this prospectus. This prospectus, filed as part of the registration statement, does not contain all of the information set forth in the registration statement or the exhibits and schedules thereto as permitted by the rules and regulations of the SEC. For further information about us and our common stock, you should refer to the registration statement. This prospectus summarizes provisions that we consider material of certain contracts and other documents to which we refer you. Because the summaries may not contain all of the information that you may find important, you should review the full text of those documents.
The registration statement, including its exhibits and schedules, may be inspected and copied at the public reference facilities maintained by the SEC at 100 F Street, N.E., Room 1580, Washington, D.C. 20549. You may obtain information on the operation of the public reference room by calling 1-202-551-8909. Copies of such materials are also available by mail from the Public Reference Branch of the SEC at 100 F Street, N.E., Room 1580, Washington, D.C. 20549 at prescribed rates. In addition, the SEC maintains a website at http://www.sec.gov from which interested persons can electronically access the registration statement, including the exhibits and schedules to the registration statement.
We have not authorized anyone to give you any information or to make any representations about us or the transactions we discuss in this prospectus other than those contained in this prospectus. If you are given any information or representations about these matters that is not discussed in this prospectus, you must not rely on that information. This prospectus is not an offer to sell or a solicitation of an offer to buy securities anywhere or to anyone where or to whom we are not permitted to offer or sell securities under applicable law.
144
Table of Contents
Index to Consolidated Financial Statements
| |
Page Number |
| ||
| Consolidated Financial Statements of Momentive Performance Materials Inc. |
||||
| F-2 | ||||
| F-3 | ||||
| Consolidated Statements of Operations for the years ended December 31, 2013, 2012, and 2011 |
F-4 | |||
| Consolidated Statements of Comprehensive Loss for the years ended December 31, 2013, 2012, and 2011 |
F-5 | |||
| Consolidated Statements of Cash Flows for the years ended December 31, 2013, 2012, and 2011 |
F-6 | |||
| Consolidated Statements of Deficit for the years ended December 31, 2013, 2012, and 2011 |
F-7 | |||
| F-8 | ||||
| F-53 | ||||
| Condensed Consolidated Financial Statements of Momentive Performance Materials Inc. (unaudited) |
||||
| Condensed Consolidated Balance Sheets at September 30, 2014 and December 31, 2013 |
F-54 | |||
| F-55 | ||||
| F-56 | ||||
| F-57 | ||||
| Condensed Consolidated Statement of Deficit for the nine months ended September 30, 2014 |
F-58 | |||
| F-59 | ||||
F-1
Table of Contents
Report of Independent Registered Public Accounting Firm
To the Board of Directors and Shareholder of
Momentive Performance Materials Inc.
In our opinion, the consolidated financial statements listed in the accompanying index present fairly, in all material respects, the financial position of Momentive Performance Materials Inc. and its subsidiaries at December 31, 2013 and 2012, and the results of their operations and their cash flows for each of the three years in the period ended December 31, 2013 in conformity with accounting principles generally accepted in the United States of America. In addition, in our opinion, the financial statement schedule listed in the accompanying index presents fairly, in all material respects, the information set forth therein when read in conjunction with the related consolidated financial statements. These financial statements and financial statement schedule are the responsibility of the Company’s management. Our responsibility is to express an opinion on these financial statements and financial statement schedule based on our audits. We conducted our audits of these statements in accordance with the standards of the Public Company Accounting Oversight Board (United States). Those standards require that we plan and perform the audit to obtain reasonable assurance about whether the financial statements are free of material misstatement. An audit includes examining, on a test basis, evidence supporting the amounts and disclosures in the financial statements, assessing the accounting principles used and significant estimates made by management, and evaluating the overall financial statement presentation. We believe that our audits provide a reasonable basis for our opinion.
In our report dated April 11, 2014, our opinion contained an emphasis of a matter relating to substantial doubt about the Company’s ability to continue as a going concern. As discussed in Note 1 to the consolidated financial statements, the Company’s re-organization plan became effective and the Company emerged from Chapter 11 bankruptcy on October 24, 2014. Based on the Company’s liquidity position upon emergence, there is no longer substantial doubt about the Company’s ability to continue as a going concern.
PricewaterhouseCoopers LLP
Columbus, Ohio
April 11, 2014, except for the earnings per common share data included in the Consolidated Statements of Operations, the emergence from bankruptcy discussed in Note 1 to the consolidated financial statements, and the elimination of the substantial doubt about the Company’s ability to continue as a going concern as discussed in the second paragraph of this report, as to which the date is December 31, 2014.
F-2
Table of Contents
MOMENTIVE PERFORMANCE MATERIALS INC.
CONSOLIDATED BALANCE SHEETS
| (In millions, except share data) |
December 31, 2013 |
December 31, 2012 |
||||||
| Assets |
||||||||
| Current assets: |
||||||||
| Cash and cash equivalents (including restricted cash of $5 at December 31, 2013) |
$ | 94 | $ | 110 | ||||
| Accounts receivable (net of allowance for doubtful accounts of $4 and $3, respectively) |
326 | 293 | ||||||
| Due from affiliates (see Note 4) |
5 | 6 | ||||||
| Inventories: |
||||||||
| Raw materials |
128 | 107 | ||||||
| Finished and in-process goods |
240 | 267 | ||||||
| Deferred income taxes (see Note 10) |
6 | 6 | ||||||
| Other current assets |
61 | 58 | ||||||
|
|
|
|
|
|||||
| Total current assets |
860 | 847 | ||||||
| Investment in unconsolidated entities |
8 | 5 | ||||||
| Deferred income taxes (see Note 10) |
3 | 27 | ||||||
| Other long-term assets |
33 | 104 | ||||||
| Property and equipment: |
||||||||
| Land |
77 | 82 | ||||||
| Buildings |
377 | 359 | ||||||
| Machinery and equipment |
1,582 | 1,503 | ||||||
|
|
|
|
|
|||||
| 2,036 | 1,944 | |||||||
| Less accumulated depreciation |
(1,082 | ) | (928 | ) | ||||
|
|
|
|
|
|||||
| 954 | 1,016 | |||||||
| Goodwill (see Note 6) |
381 | 412 | ||||||
| Other intangible assets, net (see Note 6) |
455 | 493 | ||||||
|
|
|
|
|
|||||
| Total assets |
$ | 2,694 | $ | 2,904 | ||||
|
|
|
|
|
|||||
| Liabilities and Deficit |
||||||||
| Current liabilities: |
||||||||
| Accounts payable |
$ | 250 | $ | 254 | ||||
| Due to affiliates (see Note 4) |
9 | 3 | ||||||
| Debt payable within one year (See Note 7) |
3,250 | 35 | ||||||
| Interest payable |
88 | 83 | ||||||
| Income taxes payable (see Note 10) |
6 | 6 | ||||||
| Deferred income taxes (see Note 10) |
12 | 19 | ||||||
| Accrued payroll and incentive compensation |
44 | 51 | ||||||
| Other current liabilities |
85 | 106 | ||||||
|
|
|
|
|
|||||
| Total current liabilities |
3,744 | 557 | ||||||
| Long-term liabilities: |
||||||||
| Long-term debt (see Note 7) |
7 | 3,081 | ||||||
| Pension liabilities (see Note 12) |
280 | 311 | ||||||
| Deferred income taxes (see Note 10) |
77 | 47 | ||||||
| Other long-term liabilities |
66 | 56 | ||||||
|
|
|
|
|
|||||
| Total liabilities |
4,174 | 4,052 | ||||||
|
|
|
|
|
|||||
| Commitments and contingencies (see Note 11) |
||||||||
| Deficit: |
||||||||
| Common stock – $0.01 par value; 100 shares authorized, issued and outstanding at December 31, 2013 and 2012 |
— | — | ||||||
| Additional paid-in capital |
716 | 606 | ||||||
| Accumulated other comprehensive income |
202 | 180 | ||||||
| Accumulated deficit |
(2,398 | ) | (1,934 | ) | ||||
|
|
|
|
|
|||||
| Total deficit |
(1,480 | ) | (1,148 | ) | ||||
|
|
|
|
|
|||||
| Total liabilities and deficit |
$ | 2,694 | $ | 2,904 | ||||
|
|
|
|
|
|||||
See Notes to Consolidated Financial Statements
F-3
Table of Contents
MOMENTIVE PERFORMANCE MATERIALS INC.
CONSOLIDATED STATEMENTS OF OPERATIONS
| Year Ended December 31, | ||||||||||||
| (In millions, except share and per share data) |
2013 | 2012 | 2011 | |||||||||
| Net sales |
$ | 2,398 | $ | 2,357 | $ | 2,637 | ||||||
| Costs and expenses: |
||||||||||||
| Cost of sales, excluding depreciation and amortization |
1,732 | 1,705 | 1,798 | |||||||||
| Selling, general and administrative expense |
373 | 392 | 389 | |||||||||
| Depreciation and amortization expense |
171 | 187 | 197 | |||||||||
| Research and development expense |
70 | 69 | 78 | |||||||||
| Restructuring and other costs (see Note 3) |
21 | 43 | 33 | |||||||||
|
|
|
|
|
|
|
|||||||
| Operating income (loss) |
31 | (39 | ) | 142 | ||||||||
| Interest expense, net (see Note 7) |
394 | 277 | 256 | |||||||||
| Other non-operating income, net |
— | (11 | ) | — | ||||||||
| Loss (gain) on extinguishment and exchange of debt (see Note 7) |
— | 57 | (7 | ) | ||||||||
|
|
|
|
|
|
|
|||||||
| Loss before income taxes and earnings (losses) from unconsolidated entities |
(363 | ) | (362 | ) | (107 | ) | ||||||
| Income tax expense (see Note 10) |
104 | 8 | 27 | |||||||||
|
|
|
|
|
|
|
|||||||
| Loss before earnings (losses) from unconsolidated entities |
(467 | ) | (370 | ) | (134 | ) | ||||||
| Earnings (losses) from unconsolidated entities, net of taxes |
3 | 5 | (6 | ) | ||||||||
|
|
|
|
|
|
|
|||||||
| Net loss |
(464 | ) | (365 | ) | (140 | ) | ||||||
| Net income attributable to noncontrolling interest |
— | — | (1 | ) | ||||||||
|
|
|
|
|
|
|
|||||||
| Net loss attributable to Momentive Performance Materials Inc. |
$ | (464 | ) | $ | (365 | ) | $ | (141 | ) | |||
|
|
|
|
|
|
|
|||||||
| Weighted average common shares outstanding—basic and diluted |
100 | 100 | 100 | |||||||||
| Loss per share—basic and diluted |
$ | (4,640,000 | ) | $ | (3,650,000 | ) | $ | (1,410,000 | ) | |||
See Notes to Consolidated Financial Statements
F-4
Table of Contents
MOMENTIVE PERFORMANCE MATERIALS INC.
CONSOLIDATED STATEMENTS OF COMPREHENSIVE LOSS
| Year Ended December 31, | ||||||||||||
| (In millions) |
2013 | 2012 | 2011 | |||||||||
| Net loss |
(464 | ) | (365 | ) | (140 | ) | ||||||
| Other comprehensive income (loss), net of tax: |
||||||||||||
| Foreign currency translation |
(6 | ) | (29 | ) | 26 | |||||||
| Gain (loss) recognized from pension and postretirement benefits |
28 | (19 | ) | (15 | ) | |||||||
|
|
|
|
|
|
|
|||||||
| Other comprehensive income (loss) |
22 | (48 | ) | 11 | ||||||||
|
|
|
|
|
|
|
|||||||
| Comprehensive loss |
(442 | ) | (413 | ) | (129 | ) | ||||||
| Comprehensive income attributable to noncontrolling interest |
— | — | (1 | ) | ||||||||
|
|
|
|
|
|
|
|||||||
| Comprehensive loss attributable to Momentive Performance Materials Inc. |
$ | (442 | ) | $ | (413 | ) | $ | (130 | ) | |||
|
|
|
|
|
|
|
|||||||
See Notes to Consolidated Financial Statements
F-5
Table of Contents
MOMENTIVE PERFORMANCE MATERIALS INC.
CONSOLIDATED STATEMENTS OF CASH FLOWS
| Year Ended December 31, | ||||||||||||
| (In millions) |
2013 | 2012 | 2011 | |||||||||
| Cash flows (used in) provided by operating activities |
||||||||||||
| Net loss |
$ | (464 | ) | $ | (365 | ) | $ | (140 | ) | |||
| Adjustments to reconcile net loss to net cash (used in) provided by operating activities: |
||||||||||||
| Depreciation and amortization |
171 | 187 | 197 | |||||||||
| Write-off of unamortized deferred financing costs (see Note 2) |
81 | — | — | |||||||||
| Loss (gain) on the extinguishment of debt |
— | 57 | (7 | ) | ||||||||
| Amortization of debt discount and issuance costs |
10 | 18 | 15 | |||||||||
| Deferred income tax expense (benefit) |
86 | (10 | ) | 9 | ||||||||
| Unrealized foreign currency losses |
12 | 1 | 7 | |||||||||
| Other non-cash adjustments |
4 | (3 | ) | — | ||||||||
| Net change in assets and liabilities: |
||||||||||||
| Accounts receivable |
(39 | ) | 16 | 22 | ||||||||
| Inventories |
(1 | ) | 13 | (19 | ) | |||||||
| Due to/from affiliates |
6 | (10 | ) | 10 | ||||||||
| Accounts payable |
(7 | ) | (36 | ) | 1 | |||||||
| Income taxes payable |
6 | — | (5 | ) | ||||||||
| Other assets, current and non-current |
(21 | ) | 5 | (7 | ) | |||||||
| Other liabilities, current and non-current |
6 | 32 | 23 | |||||||||
|
|
|
|
|
|
|
|||||||
| Net cash (used in) provided by operating activities |
(150 | ) | (95 | ) | 106 | |||||||
|
|
|
|
|
|
|
|||||||
| Cash flows used in investing activities |
||||||||||||
| Capital expenditures |
(79 | ) | (107 | ) | (112 | ) | ||||||
| Capitalized interest |
(2 | ) | — | — | ||||||||
| Purchases of intangible assets |
(3 | ) | (2 | ) | (2 | ) | ||||||
| Change in restricted cash |
(5 | ) | — | — | ||||||||
| Proceeds from sale of assets |
1 | 7 | — | |||||||||
| Investment in unconsolidated affiliate |
— | — | (6 | ) | ||||||||
|
|
|
|
|
|
|
|||||||
| Net cash used in investing activities |
(88 | ) | (102 | ) | (120 | ) | ||||||
|
|
|
|
|
|
|
|||||||
| Cash flows provided by (used in) financing activities |
||||||||||||
| Net short-term debt (repayments) borrowings |
(2 | ) | 3 | 1 | ||||||||
| Borrowings of long-term debt |
419 | 1,725 | 52 | |||||||||
| Repayments of long-term debt |
(287 | ) | (1,533 | ) | (88 | ) | ||||||
| Proceeds from capital contribution (see Note 4) |
102 | — | — | |||||||||
| Long-term debt financing fees |
(12 | ) | (33 | ) | (5 | ) | ||||||
| Payments of original issue discounts and tender premiums |
— | (51 | ) | — | ||||||||
| Common stock dividends paid |
— | — | (1 | ) | ||||||||
|
|
|
|
|
|
|
|||||||
| Net cash provided by (used in) financing activities |
220 | 111 | (41 | ) | ||||||||
|
|
|
|
|
|
|
|||||||
| Decrease in cash and cash equivalents |
(18 | ) | (86 | ) | (55 | ) | ||||||
| Effect of exchange rate changes on cash |
(3 | ) | (3 | ) | 4 | |||||||
| Cash and cash equivalents, beginning of year |
110 | 199 | 250 | |||||||||
|
|
|
|
|
|
|
|||||||
| Cash and cash equivalents, end of year |
$ | 89 | $ | 110 | $ | 199 | ||||||
|
|
|
|
|
|
|
|||||||
| Supplemental disclosures of cash flow information |
||||||||||||
| Cash paid for: |
||||||||||||
| Interest |
$ | 299 | $ | 237 | $ | 203 | ||||||
| Income taxes, net of refunds |
13 | 18 | 22 | |||||||||
| Non-cash investing activity: |
||||||||||||
| Capital expenditures included in accounts payable |
$ | 29 | $ | 17 | $ | 26 | ||||||
| Non-cash financing activity: |
||||||||||||
| Non-cash capital contribution from parent (see Note 4) |
$ | 7 | $ | — | $ | — | ||||||
See Notes to Consolidated Financial Statements
F-6
Table of Contents
MOMENTIVE PERFORMANCE MATERIALS INC.
CONSOLIDATED STATEMENTS OF DEFICIT
| (In millions) |
Common Stock |
Additional Paid-in Capital |
Accumulated Deficit |
Accumulated Other Comprehensive Income |
Noncontrolling Interest |
Total Deficit | ||||||||||||||||||
| Balance December 31, 2010 |
$ | — | $ | 603 | $ | (1,428 | ) | $ | 217 | $ | 4 | $ | (604 | ) | ||||||||||
| Net (loss) income |
— | — | (141 | ) | — | 1 | (140 | ) | ||||||||||||||||
| Other comprehensive income |
— | — | — | 11 | — | 11 | ||||||||||||||||||
| Stock-based compensation expense |
— | 3 | — | — | — | 3 | ||||||||||||||||||
| Dividends declared to parent, at $7,500 per share |
— | (1 | ) | — | — | — | (1 | ) | ||||||||||||||||
| Disposition of noncontrolling interest |
— | — | — | — | (5 | ) | (5 | ) | ||||||||||||||||
|
|
|
|
|
|
|
|
|
|
|
|
|
|||||||||||||
| Balance December 31, 2011 |
— | 605 | (1,569 | ) | 228 | — | (736 | ) | ||||||||||||||||
| Net loss |
— | — | (365 | ) | — | — | (365 | ) | ||||||||||||||||
| Other comprehensive loss |
— | — | — | (48 | ) | — | (48 | ) | ||||||||||||||||
| Stock-based compensation expense |
— | 1 | — | — | — | 1 | ||||||||||||||||||
|
|
|
|
|
|
|
|
|
|
|
|
|
|||||||||||||
| Balance at December 31, 2012 |
— | 606 | (1,934 | ) | 180 | — | (1,148 | ) | ||||||||||||||||
| Net loss |
— | — | (464 | ) | — | — | (464 | ) | ||||||||||||||||
| Other comprehensive income |
— | — | — | 22 | — | 22 | ||||||||||||||||||
| Stock-based compensation expense |
— | 1 | — | — | — | 1 | ||||||||||||||||||
| Capital contribution from parent (see Note 4) |
— | 102 | — | — | — | 102 | ||||||||||||||||||
| Non-cash capital contribution from parent (see Note 4) |
— | 7 | — | — | — | 7 | ||||||||||||||||||
|
|
|
|
|
|
|
|
|
|
|
|
|
|||||||||||||
| Balance at December 31, 2013 |
$ | — | $ | 716 | $ | (2,398 | ) | $ | 202 | $ | — | $ | (1,480 | ) | ||||||||||
|
|
|
|
|
|
|
|
|
|
|
|
|
|||||||||||||
See Notes to Consolidated Financial Statements
F-7
Table of Contents
MOMENTIVE PERFORMANCE MATERIALS INC.
Notes to Consolidated Financial Statements
(In millions, except share data)
1. Business and Basis of Presentation
Based in Waterford, New York, Momentive Performance Materials Inc. (the “Company” or “MPM”), is comprised of two businesses: Silicones and Quartz. Silicones is a global business engaged in the manufacture, sale and distribution of silanes, specialty silicones and urethane additives. Quartz, also a global business, is engaged in the manufacture, sale and distribution of high-purity fused quartz and ceramic materials.
The Company’s direct parent is Momentive Performance Materials Holdings Inc. (“MPM Holdings”), a holding company and wholly owned subsidiary of Momentive Performance Materials Holdings LLC (“Momentive Holdings”), the ultimate parent entity of MPM. On October 1, 2010, MPM Holdings and Momentive Specialty Chemicals Holdings LLC (“MSC Holdings”), the parent company of Momentive Specialty Chemicals Inc. and its subsidiaries (collectively “MSC”), became subsidiaries of Momentive Holdings. This transaction is referred to as the “Momentive Combination.” Momentive Holdings is controlled by investment funds managed by affiliates of Apollo Management Holdings, L.P. (together with Apollo Global Management, LLC and subsidiaries, “Apollo”).
Going Concern & Liquidity and Capital Resources
The accompanying Consolidated Financial Statements have been prepared assuming that the Company will continue as a going concern. For the years ended December 31, 2013, 2012, and 2011, the Company has successive periods of “Loss before income taxes and earnings (losses) from unconsolidated entities” of $363, $362 and $107, respectively. Based on these factors, the Company’s current liquidity position as of December 31, 2013 and projections of operating results and cash flows in 2014, the Company believed there to be substantial doubt about its ability to continue as a going concern for the next twelve months. The Company did not anticipate its operating cash flows and liquidity in 2014 will be sufficient to fund its most significant cash obligations necessary to continue as a going concern.
On April 13, 2014 (the “Petition Date”), Momentive Performance Materials Holdings Inc. (the Company’s direct parent prior to October 24, 2014) (“Old MPM Holdings”), the Company and certain of its U.S. subsidiaries (collectively, the “Debtors”) filed voluntary petitions for reorganization under Chapter 11 of the U.S. Bankruptcy Code (the “Bankruptcy Code”) in the United States Bankruptcy Court for the Southern District of New York (the “Court”). In order for the Company to emerge successfully from Chapter 11, it needed to obtain the Court’s confirmation of a Chapter 11 plan of reorganization proposed by the Debtors (as amended, supplemented or modified, the “Plan”), which has enabled the Company to transition from Chapter 11 into ordinary course operations outside of bankruptcy.
On October 24, 2014 (the “Effective Date”), the Plan became effective and the Debtors emerged from the Chapter 11 proceedings. On or following the Effective Date, and pursuant to the terms of the Plan, the following occurred or is in the process of occurring:
| • | payment in full in cash to general unsecured creditors (including trade creditors) and holders of claims arising from the Cash Flow Facility and the DIP Term Loan Facility; |
| • | payment in full by way of replacement notes to holders of the First Lien Notes and the Senior Secured Notes; |
| • | conversion of the Springing Lien Notes into the new equity of the post-Effective Date Company (the “Successor Company”) (resulting in the issuance of 11,791,126 shares of New Common Stock) (the “Second Lien Notes Equity Distribution”), subject to dilution by the management incentive plan and the Rights Offerings Stock; |
F-8
Table of Contents
| • | subscription rights to holders of the Springing Lien Notes in the Rights Offerings (resulting in the issuance of 36,197,874 shares of New Common Stock (including shares issued in connection with the Backstop Commitment)); |
| • | a recovery to the holders of Old MPM Holdings’ PIK notes in the amount of the cash available at Old MPM Holdings as of the Effective Date, after taking into account administrative expenses; |
| • | cancellation of the Senior Subordinated Notes on account of the subordination provisions set forth in the indenture to the Senior Subordinated Notes; |
| • | cancellation of the equity of the pre-Effective Date Company (the “Predecessor Company”); |
| • | entry into the $270 Exit ABL Facility (see Note 9); and |
| • | appointment of a new chief executive officer, chief financial officer and general counsel. |
Based upon the Company’s liquidity position upon emergence from bankruptcy, the Company believes there is no longer substantial doubt about its ability to continue as a going concern for the next twelve months. The Company anticipates its operating cash flows and liquidity will be sufficient to fund its most significant cash obligations necessary to continue as a going concern for the next twelve months.
2. Summary of Significant Accounting Policies
Principals of Consolidation—The Consolidated Financial Statements include the accounts of the Company and its majority-owned subsidiaries in which minority shareholders hold no substantive participating right, and variable interest entities in which the Company is the primary beneficiary. Intercompany accounts and transactions are eliminated in consolidation. The Company’s share of net earnings of 20% to 50% owned companies, for which it has the ability to exercise significant influence over operating and financial policies (but not control), are included in “Earnings from unconsolidated entities, net of taxes” in the Consolidated Statements of Operations. Investments in the other companies are carried at cost.
The Company’s unconsolidated investment accounted for under the equity method of accounting is a 49% ownership interest in Zhejiang Xinan Momentive Performance Materials Co., Ltd, a joint venture in China which manufactures siloxane, one of our key intermediate materials.
The Company previously planned to make additional capital contributions of $26 to this joint venture in 2014; however, the joint venture partners are in discussions regarding the timing and amounts of any future contributions.
Foreign Currency Translations—Assets and liabilities of foreign affiliates are translated at the exchange rates in effect at the balance sheet date. Income, expenses and cash flows are translated at average exchange rates during the year. The Company recognized transaction (losses) gains of $(16), $0 and $5 for the years ended December 31, 2013, 2012 and 2011, respectively, which are included as a component of “Net loss.” In addition, gains or losses related to the Company’s intercompany loans payable and receivable denominated in a foreign currency other than the subsidiary’s functional currency that are deemed to be permanently invested are remeasured to cumulative translation recorded in “Accumulated other comprehensive income” in the Consolidated Balance Sheets. The effect of translation is included in “Accumulated other comprehensive income.”
Use of Estimates—The preparation of financial statements in conformity with accounting principles generally accepted in the United States of America requires management to make estimates and assumptions that affect the reported amounts of assets and liabilities and also the disclosure of contingent assets and liabilities at the date of the financial statements. In addition, it requires management to make estimates and assumptions that affect the reported amounts of revenues and expenses during the reporting period. The most significant estimates that are included in the financial statements are legal liabilities, deferred tax assets and liabilities and related
F-9
Table of Contents
valuation allowances, income tax accruals, pension and postretirement assets and liabilities, valuation allowances for accounts receivable and inventories, general insurance liabilities, asset impairments, fair value of stock awards and fair values of assets acquired and liabilities assumed in business acquisitions. Actual results could differ from these estimates.
Cash and Cash Equivalents—The Company considers all highly liquid investments that are purchased with an original maturity of three months or less to be cash equivalents. At both December 31, 2013 and 2012, the Company had interest-bearing time deposits and other cash equivalent investments of $4. These amounts are included in the Consolidated Balance Sheets as a component of “Cash and cash equivalents.”
Allowance for Doubtful Accounts—The allowance for doubtful accounts is estimated using factors such as customer credit ratings and past collection history. Receivables are charged against the allowance for doubtful accounts when it is probable that the receivable will not be collected.
Inventories—Inventories are stated at lower of cost or market using the first-in, first-out method. Costs include direct material, direct labor and applicable manufacturing overheads, which are based on normal production capacity. Abnormal manufacturing costs are recognized as period costs and fixed manufacturing overheads are allocated based on normal production capacity. An allowance is provided for excess and obsolete inventories based on management’s review of inventories on-hand compared to estimated future usage and sales. Inventories in the Consolidated Balance Sheets are presented net of an allowance for excess and obsolete inventory of $23 at both December 31, 2013 and 2012.
Deferred Expenses—Deferred debt financing costs are included in “Other long-term assets” in the Consolidated Balance Sheets and are amortized over the life of the related debt or credit facility using the effective interest method. Upon extinguishment of any debt, the related debt issuance costs are written off. At December 31, 2013 and 2012, the Company’s unamortized deferred financing costs were $0 and $78, respectively. During the year ended December 31, 2013, the Company wrote off $81 of unamortized deferred financing costs as a result of the substantial doubt about its ability to continue as a going concern for the next twelve months and the resulting reclassification of all outstanding debt related to the ABL Facility, the First Lien Notes, the Senior Secured Notes and the Springing Lien Notes to “Debt payable within one year’ in the Consolidated Balance Sheets (see Note 7). This amount is included in “Interest expense, net” in the Consolidated Statements of Operations.
Property and Equipment—Land, buildings and machinery and equipment are stated at cost less accumulated depreciation. Depreciation is recorded on a straight-line basis over the estimated useful lives of the properties (the average estimated useful lives for buildings and machinery are 20 years and 15 years, respectively). Assets under capital leases are amortized over the lesser of their useful life or the lease term. Major renewals and betterments are capitalized. Maintenance, repairs, minor renewals and turnarounds (periodic maintenance and repairs to major units of manufacturing facilities) are expensed as incurred. When property and equipment is retired or disposed of, the asset and related depreciation are removed from the accounts and any gain or loss is reflected in operating income. The Company capitalizes interest costs that are incurred during the construction of property and equipment. Depreciation expense was $130, $144 and $152 for the years ended December 31, 2013, 2012 and 2011, respectively.
Capitalized Software—The Company capitalizes certain costs, such as software coding, installation and testing, that are incurred to purchase or create and implement computer software for internal use. Amortization is recorded on the straight-line basis over the estimated useful lives, which range from 1 to 5 years.
Goodwill and Intangibles—The excess of purchase price over net tangible and identifiable intangible assets of businesses acquired is carried as “Goodwill” in the Consolidated Balance Sheets. Separately identifiable intangible assets that are used in the operations of the business (e.g., patents and technology, customer lists and contracts) are recorded at cost (fair value at the time of acquisition) and reported as “Other intangible assets, net” in the Consolidated Balance Sheets. Costs to renew or extend the term of identifiable intangible assets are
F-10
Table of Contents
expensed as incurred. The Company does not amortize goodwill or indefinite-lived intangible assets. Intangible assets with determinable lives are amortized on a straight-line basis over the shorter of the legal or useful life of the assets, which range from 1 to 20 years (see Note 6).
Impairment—The Company reviews property and equipment and all amortizable intangible assets for impairment whenever events or changes in circumstances indicate that the carrying amount of these assets may not be recoverable. Recoverability is based on estimated undiscounted cash flows or other relevant observable measures. The Company tests goodwill for impairment annually, or when events or changes in circumstances indicate impairment may exist, by comparing the estimated fair value of each reporting unit to its carrying value to determine if there is an indication that a potential impairment may exist.
Goodwill
The Company performs an annual assessment of qualitative factors to determine whether the existence of any events or circumstances leads to a determination that it is more likely than not that the fair value of a reporting unit is less than the carrying amount of the reporting unit’s net assets. If, after assessing all events and circumstances, the Company determines it is more likely than not that the fair value of a reporting unit is less than the carrying amount of the reporting unit’s net assets, the Company uses a probability weighted market and income approach to estimate the fair value of the reporting unit. The Company’s market approach is a comparable analysis technique commonly used in the investment banking and private equity industries based on the EBITDA (earnings before interest, income taxes, depreciation and amortization) multiple technique. Under this technique, estimated fair value is the result of a market-based EBITDA multiple that is applied to an appropriate historical EBITDA amount, adjusted for the additional fair value that would be assigned by a market participant obtaining control over the reporting unit. The Company’s income approach is a discounted cash flow model. When the carrying amount of the reporting unit’s goodwill is greater than the estimated fair value of the reporting unit’s goodwill, an impairment loss is recognized for the difference.
At both October 1, 2013 and 2012, the estimated fair value of each of the Company’s reporting units was deemed to be substantially in excess of the carrying amount of assets (including goodwill) and liabilities assigned to each unit.
General Insurance—The Company is generally insured for losses and liabilities for workers’ compensation, physical damage to property, business interruption and comprehensive general, product and vehicle liability under high-deductible insurance policies. The Company records losses when they are probable and reasonably estimable and amortizes insurance premiums over the life of the respective insurance policies.
Legal Claims and Costs—The Company accrues for legal claims and costs in the period in which a claim is made or an event becomes known, if the amounts are probable and reasonably estimable. Each claim is assigned a range of potential liability and the most likely amount is accrued. If there is no amount in the range of potential liability that is most likely, the low end of the range is accrued. The amount accrued includes all costs associated with the claim, including settlements, assessments, judgments, fines and incurred legal fees (see Note 11).
Environmental Matters—Accruals for environmental matters are recorded when it is probable that a liability has been incurred and the amount of the liability can be reasonably estimated. Environmental accruals are reviewed on a quarterly basis and as events and developments warrant (see Note 11).
Asset Retirement Obligations—Asset retirement obligations are initially recorded at their estimated net present values in the period in which the obligation occurs, with a corresponding increase to the related long-lived asset. Over time, the liability is accreted to its settlement value and the capitalized cost is depreciated over the useful life of the related asset. When the liability is settled, a gain or loss is recognized for any difference between the settlement amount and the liability that was recorded.
Revenue Recognition—Revenue for product sales, net of estimated allowances and returns, is recognized as risk and title to the product transfer to the customer, which either occurs at the time shipment is made or upon delivery. In situations where product is delivered by pipeline, risk and title transfers when the product moves
F-11
Table of Contents
across an agreed-upon transfer point, which is typically the customers’ property line. Product sales delivered by pipeline are measured based on daily flow meter readings. The Company’s standard terms of delivery are included in its contracts of sale or on its invoices.
Shipping and Handling—Freight costs that are billed to customers are included in “Net sales” in the Consolidated Statements of Operations. Shipping costs are incurred to move the Company’s products from production and storage facilities to the customer. Handling costs are incurred from the point the product is removed from inventory until it is provided to the shipper and generally include costs to store, move and prepare the products for shipment. Shipping and handling costs are recorded in “Cost of sales, excluding depreciation and amortization” in the Consolidated Statements of Operations.
Research and Development Costs—Funds are committed to research and development activities for technical improvement of products and processes that are expected to contribute to future earnings. All costs associated with research and development are charged to expense as incurred. Research and development and technical service expense was $70, $69 and $78 for the years ended December 31, 2013, 2012 and 2011, respectively, and is included in “Selling, general and administrative expense” in the Consolidated Statements of Operations.
Restructuring and Other Costs—The Company incurred “Restructuring and other costs” totaling $21, $43 and $33 for the years ended December 31, 2013, 2012 and 2011, respectively. For 2012 and 2011, these costs primarily represent expenses to implement productivity savings programs to optimize the Company’s cost structure. Also included in these amounts for the years ended December 31, 2013, 2012 and 2011 are costs related to one-time payments for services and integration expenses (see Note 3).
Pension Liabilities—Pension assumptions are significant inputs to the actuarial models that measure pension benefit obligations and related effects on operations. Two assumptions—discount rate and expected return on assets—are important elements of plan expense and asset/liability measurement. The Company evaluates these critical assumptions at least annually on a plan and country-specific basis. The Company periodically evaluates other assumptions involving demographic factors, such as retirement age, mortality and turnover, and updates them to reflect the Company’s experience and expectations for the future. Actual results in any given year will often differ from actuarial assumptions because of economic and other factors.
Accumulated and projected benefit obligations are measured as the present value of future cash payments. The Company discounts those cash payments using the weighted average of market-observed yields for high quality fixed income securities with maturities that correspond to the payment of benefits. Lower discount rates increase present values and subsequent-year pension expense; higher discount rates decrease present values and subsequent-year pension expense.
To determine the expected long-term rate of return on pension plan assets, the Company considers current and expected asset allocations, as well as historical and expected returns on various categories of plan assets. In developing future return expectations for the principal benefit plans’ assets, the Company evaluates general market trends as well as key elements of asset class returns such as expected earnings growth, yields and spreads across a number of potential scenarios.
Income Taxes—The Company recognizes deferred tax assets and liabilities for the expected future tax consequences of temporary differences between the financial statement carrying amounts and the tax bases of the assets and liabilities.
Deferred tax balances are adjusted to reflect tax rates, based on current tax laws, which will be in effect in the years in which temporary differences are expected to reverse. Deferred tax assets are reduced by a valuation allowance when, in the opinion of management, it is more likely than not that some portion or all of the deferred tax assets will not be realized (see Note 10).
F-12
Table of Contents
Unrecognized tax benefits are generated when there are differences between tax positions taken in a tax return and amounts recognized in the consolidated financial statements. Tax benefits are recognized in the consolidated financial statements when it is more likely than not that a tax position will be sustained upon examination. Tax benefits are measured as the largest amount of benefit that is greater than 50% likely of being realized upon settlement. The Company classifies interest and penalties as a component of tax expense.
The majority of the Company’s non-U.S. operations have been treated as branches of the U.S. Company and are included in the MPM and MPM Holdings’ U.S. consolidated income tax return. For the purpose of the consolidated financial statements, for the years ended December 31, 2013, 2012 and 2011, the tax provision for all operations has been prepared on a consolidated basis.
Earnings Per Share—The Company calculates earnings per share as the ratio of net income (loss) to weighted average basic and diluted common shares outstanding. For the years ended December 31, 2013, 2012 and 2011, there were no potentially issuable common shares; therefore, basic and diluted weighted average shares outstanding were the same. The stock options discussed in Note 9 are options to purchase common units in Momentive Holdings, the Company’s ultimate parent prior to October 24, 2014, and are therefore not included in the diluted earnings per share calculation of the Company.
Derivative Financial Instruments—The Company is a party to natural gas futures to reduce its cash flow exposure to changes in natural gas prices. The Company does not hold or issue derivative financial instruments for trading purposes. All derivative financial instruments, whether designated in hedging relationships or not, are recorded in the Consolidated Balance Sheets at fair value. If a derivative financial instrument is designated as a fair-value hedge, the changes in the fair value of the derivative financial instrument and the hedged item are recognized in earnings. If the derivative financial instrument is designated as a cash flow hedge, changes in the fair value of the derivative financial instrument are recorded in “Accumulated other comprehensive income” in the Consolidated Balance Sheets, to the extent effective, and are recognized in the Company’s Consolidated Statements of Operations when the hedged item impacts earnings. The cash flows from derivative financial instruments accounted for as hedges are classified in the same category as the item being hedged in the Consolidated Statements of Cash Flows. The Company documents effectiveness assessments in order to use hedge accounting at each reporting period.
Stock-Based Compensation—Stock-based compensation cost is measured at the grant date based on the fair value of the award which is amortized as expense over the requisite service period on a graded-vesting basis (see Note 9).
Concentrations of Credit Risk—Financial instruments that potentially subject the Company to concentrations of credit risk are primarily temporary investments and accounts receivable. The Company places its temporary investments with high quality institutions and, by policy, limits the amount of credit exposure to any one institution. Concentrations of credit risk for accounts receivable are limited due to the large number of customers in the Company’s customer base and their dispersion across many different industries and geographies. The Company generally does not require collateral or other security to support customer receivables.
Concentrations of Supplier Risk—The Company relies on long-term agreements with key suppliers for most of its raw materials. The loss of a key source of supply or a delay in shipments could have an adverse effect on its business. Should any of the suppliers fail to deliver or should any of the key long-term supply contracts be canceled, the Company would be forced to purchase raw materials at current market prices. The Company’s largest supplier provides approximately 9% of raw material purchases. In addition, several of the feedstocks at various facilities are transported through a pipeline from one supplier.
Subsequent Events—The Company has evaluated events and transactions subsequent to December 31, 2013 through April 11, 2014, the date of issuance of its Consolidated Financial Statements, and updated the evaluation of subsequent events through December 31, 2014.
Reclassifications—Certain prior period balances have been reclassified to conform with current presentations.
F-13
Table of Contents
Recently Issued Accounting Standards
Newly Adopted Accounting Standards
On February 5, 2013, the Company adopted the provisions of Accounting Standards Update No. 2013-02: Comprehensive Income (Topic 220): Reporting of Amounts Reclassified Out of Accumulated Other Comprehensive Income (“ASU 2013-02”). ASU 2013-02 amended existing comprehensive income guidance and is intended to improve the reporting of reclassifications out of accumulated other comprehensive income. The guidance requires additional detail about the effect of significant reclassifications out of accumulated other comprehensive income on the respective line items in net income. ASU 2013-02 allows an entity to provide information about the effects on net income of significant amounts reclassified out of each component of accumulated other comprehensive income on the face of the statement where net income is presented or as a separate disclosure in the notes to the financial statements. The adoption of ASU 2013-02 did not have a material impact on the Company’s Consolidated Financial Statements. See Note 14 for the disclosures required by the adoption of ASU 2013-02.
Newly Issued Accounting Standards
In July 2013, the FASB issued Accounting Standards Update No. 2013-11: Presentation of an Unrecognized Tax Benefit When a Net Operating Loss Carryforward, a Similar Tax Loss, or a Tax Credit Carryforward Exists (“ASU 2013-11”). ASU 2013-11 amended existing income tax guidance and is intended to reduce the diversity in practice by providing guidance on the presentation of unrecognized tax benefits and will better reflect the manner in which an entity would settle at the reporting date any additional income taxes that would result from the disallowance of a tax position when net operating loss carryforwards, similar tax losses or tax credit carryforwards exist. The Company elected to adopt ASU 2013-11 during the year ended December 31, 2013. The adoption of ASU 2013-11 did not have a material impact on the Company’s Consolidated Financial Statements.
3. Restructuring and Other Costs
Included in restructuring and other costs are costs related to restructuring (primarily severance payments associated with workforce reductions) and services and other expenses associated with transformation savings activities.
In the second quarter of 2012, in response to the uncertain economic outlook, the Company initiated significant restructuring programs with the intent to optimize its cost structure. Prior to the second quarter of 2012, the Company had recognized significant restructuring costs primarily related to the Momentive Combination. As of December 31, 2013, the costs expected to be incurred on restructuring activities are estimated at $1, consisting mainly of workforce reductions. The Company estimates that these restructuring cost activities will occur over the next 9 to 15 months.
The following table summarizes restructuring information. All costs are primarily related to workforce reductions:
| Total | ||||
| Future restructuring costs expected to be incurred |
$ | 1 | ||
|
|
|
|||
| Cumulative restructuring costs incurred through December 31, 2013 |
$ | 35 | ||
|
|
|
|||
| Accrued liability at December 31, 2011 |
$ | 8 | ||
| Restructuring charges |
23 | |||
| Payments |
(14 | ) | ||
|
|
|
|||
| Accrued liability at December 31, 2012 |
17 | |||
| Restructuring charges |
— | |||
| Reserve adjustments |
(1 | ) | ||
| Payments |
(12 | ) | ||
|
|
|
|||
| Accrued liability as of December 31, 2013 |
$ | 4 | ||
|
|
|
|||
F-14
Table of Contents
Workforce reduction costs primarily relate to non-voluntary employee termination benefits and are accounted for under the guidance for nonretirement postemployment benefits or as exit and disposal costs, as applicable. During the years ended December 31, 2013, 2012 and 2011, charges of $0, $23 and $8, respectively, are included in “Restructuring and other costs” in the Consolidated Statements of Operations. At December 31, 2013 and 2012, the Company had accrued $4 and $17, respectively, for restructuring liabilities in “Other current liabilities” in the Consolidated Balance Sheets. All of the restructuring activity related to the Silicones business.
For the years ended December 31, 2013, 2012 and 2011, the Company recognized other costs of $21, $20 and $25, respectively. These costs are primarily comprised of one-time payments for services and integration expenses, and are included in “Restructuring and other costs” in the Consolidated Statements of Operations.
4. Related Party Transactions
Administrative Services, Management and Consulting Agreement
The Company is subject to a management consulting and advisory services agreement with Apollo and its affiliates for the provision of management and advisory services for an initial term of up to twelve years. The Company also agreed to indemnify Apollo and its affiliates and their directors, officers, and representatives for potential losses relating to the services contemplated under these agreements. Terms of the agreement provide for annual fees of $4 plus out of pocket expenses, payable in one lump sum annually, and provide for a lump-sum settlement equal to the net present value of the remaining annual management fees payable under the remaining term of the agreement in connection with a sale or initial public offering by the Company. This annual management fee was waived for 2013.
Shared Services Agreement
On October 1, 2010 in connection with the closing of the Momentive Combination, the Company entered into a shared services agreement with MSC, as amended on March 17, 2011 (the “Shared Services Agreement”). Under this agreement, the Company provides to MSC, and MSC provides to the Company, certain services, including, but not limited to, executive and senior management, administrative support, human resources, information technology support, accounting, finance, technology development, legal and procurement services. The Shared Services Agreement establishes certain criteria upon which the costs of such services are allocated between the Company and MSC. Pursuant to this agreement, during the years ended December 31, 2013, 2012 and 2011, the Company incurred approximately $92, $148 and $158, respectively, of net costs for shared services and MSC incurred approximately $121, $155 and $163, respectively, of net costs for shared services. Included in the net costs incurred during the years ended December 31, 2013, 2012 and 2011 were net billings from MSC to the Company of $31, $22 and $11, respectively, to bring the percentage of total net incurred costs for shared services under the Shared Services Agreement to the applicable allocation percentage, as well as to reflect costs allocated 100% to one party. The allocation percentage was initially set at 51% for MSC and 49% for the Company at the inception of the agreement. Following the required annual review by the Steering Committee in accordance with the terms of the Shared Service Agreement, the allocation percentage for 2013 was set at 43% for the Company and 57% for MSC. The Company had accounts receivable of $0 and less than $1 as of December 31, 2013 and 2012, respectively, and accounts payable to MSC of $4 and less than $1 at December 31, 2013 and 2012, respectively. During the years ended December 31, 2013, 2012 and 2011, the Company realized approximately $9, $31 and $23, respectively, in cost savings as a result of the Shared Services Agreement.
Purchases and Sales of Products and Services with MSC
The Company also sells products to, and purchase products from, MSC pursuant to a Master Buy/Sell Agreement dated as of September 6, 2012 (the “Master Buy/Sell Agreement”). Prices under the agreement are determined by a formula based upon certain third party sales of the applicable product, or in the event that no qualifying third party sales have taken place, based upon the average contribution margin generated by certain
F-15
Table of Contents
third party sales of products in the same or a similar industry. The standard terms and conditions of the seller in the applicable jurisdiction apply to transactions under the Master Buy/Sell Agreement. A subsidiary of the Company also acts as a non-exclusive distributor in India for certain of MSC’s subsidiaries pursuant to Distribution Agreements dated as of September 6, 2012 (the “Distribution Agreements”). Prices under the Distribution Agreements are determined by a formula based on the weighted average sales price of the applicable product less a margin. The Master Buy/Sell Agreement and Distribution Agreements have initial terms of 3 years and may be terminated for convenience by either party thereunder upon 30 days’ prior notice in the case of the Master/Buy Sell Agreement and upon 90 days’ prior notice in the case of the Distribution Agreements. Pursuant to these agreements and other purchase orders, during the years ended December 31, 2013 and 2012, the Company sold $9 and $3, respectively, of products to MSC and purchased less than $1 of products from MSC. As of December 31, 2013 and 2012, the Company had $1 and less than $1, respectively, of accounts receivable from MSC and less than $1 of accounts payable to MSC related to these agreements.
Purchases and Sales of Products and Services with Affiliates Other Than MSC
The Company sells products to various Apollo and GE affiliates other than MSC. These sales were $9, $16 and $17 for the years ended December 31, 2013, 2012 and 2011, respectively. The Company had accounts receivable from these affiliates of $1 and $5 at December 31, 2013 and 2012, respectively. The Company also purchases products and services from various Apollo and GE affiliates other than MSC. These purchases were $19, $17 and $27 for the years ended December 31, 2013, 2012 and 2011, respectively. The Company had accounts payable to these affiliates of $2 and less than $1 at December 31, 2013 and 2012, respectively.
Transactions with GE and its Affiliates
ASM Off-Take Agreement
Through May 17, 2013, the Company was a party to an (i) off-take agreement (the “Old Off-Take Agreement”) with Asia Silicones Monomer Limited (“ASM”), which was 50% owned by GE Monomer (Holdings) Pte Ltd. up until such date, and (ii) a long-term supply agreement with GE and GE Monomer (Holdings) Pte. Ltd. (the “Old GE Supply Agreement”), which was entered into at the closing of the GE Advanced Materials Acquisition. Under the Old Off-Take Agreement, ASM was obligated to provide siloxane and certain related products to the Company through 2014 (or until certain ASM financing obligations were satisfied). Under the Old GE Supply Agreement, GE and GE Monomer (Holdings) Pte. Ltd. agreed to ensure the Company a minimum annual supply of siloxane and certain related products from ASM or an alternative source in certain circumstances through December 2026. Under the Old Off-Take Agreement, the Company purchased approximately $35 of siloxane and certain related products from ASM for the year ended December 31, 2013.
On May 17, 2013, the Company entered into a new purchase and sale agreement (the “PSA”) with ASM in connection with the sale (the “GE ASM Sale”) by GE Monomer (Holdings) Pte Ltd., an affiliate of the General Electric Company (“GE”) of its equity interests in ASM. As a result of the GE ASM Sale, ASM is no longer an affiliate of the Company. The new PSA provides the Company with a long-term supply of siloxane through 2026 and the option to extend such agreement through 2036. The PSA replaced and superseded the Old Off-Take Agreement and the Old GE Supply Agreement. In connection with the foregoing transactions, the Company’s direct parent received a one-time payment of approximately $102 from GE, which amount was subsequently contributed to the Company.
Trademark License Agreement
Also on May 17, 2013, the Company entered into an amendment to the Trademark License Agreement, dated as of December 3, 2006, by and between GE Monogram Licensing International and the Company, to, among other things, revise the royalty payable to GE Monogram Licensing International and provide for an option to extend such agreement for an additional five-year period through 2023. In connection with the amendment, the Company’s direct parent recorded a gain and related intangible asset of $7. The intangible asset was subsequently contributed to the Company.
F-16
Table of Contents
Revolving Credit Facility
In April 2013, the Company entered into a $75 revolving credit facility with an affiliate of GE (the “Cash Flow Facility”) (see Note 7). Prior to entry into the Cash Flow Facility, an affiliate of GE was one of the lenders under the Company’s Old Revolver (as further described in Note 7), representing approximately $160 of the lenders’ $300 revolving credit facility commitment (see Note 7).
Participation of Apollo Global Securities in Refinancing Transactions
In 2012, Apollo Global Securities, LLC (“AGS”), an affiliate of Apollo, acted as one of the initial purchasers and received less than $1 and $1 in connection with the Company’s sales of the Senior Secured Notes and the First Lien Notes, respectively (see Note 7). AGS also received less than $1 in connection with arranging the issuance of the Senior Secured Notes and $1 in connection with arranging the issuance of the First Lien Notes and the commitments for the ABL Facility (see Note 7).
Other Transactions and Arrangements
Momentive Holdings purchases insurance policies which also cover the Company and MSC. Amounts are billed to the Company based on the Company’s relative share of the insurance premiums. Momentive Holdings billed the Company $9 for both the years ended December 31, 2013 and 2012. The Company had accounts payable to Momentive Holdings of approximately $3 under these arrangements at both December 31, 2013 and 2012.
The Company declared dividends of less than $1 in each of 2013 and 2012 to fund the compensation of the Board of Managers of Momentive Holdings.
Subsequent Events
In April 2014, the Company sold 100% of its interest in its Canadian subsidiary to a subsidiary of MSC for a purchase price of $12. As a part of the transaction the Company also entered into a non-exclusive distribution agreement with a subsidiary of MSC, whereby the subsidiary of MSC will act as a distributor of certain of the Company’s products in Canada. The agreement has a term of 10 years, and is cancelable by either party with 180 days’ notice. The Company will compensate the subsidiary of MSC for acting as distributor at a rate of 2% of the net selling price of the related products sold. Additionally, the Company will provide transitional services to the subsidiary of MSC for period of 6 months.
In April 2014, the Company entered into an accounts receivable purchase and sale agreement with a newly formed subsidiary of Momentive Holdings. The agreement contains customary terms and conditions associated with such arrangements. On April 7, 2014, under this agreement, the Company sold approximately $51 of accounts receivable to the subsidiary of Momentive Holdings, and received 95% of the proceeds in cash, with the remaining 5% to be received in cash when the sold receivables are fully collected by the subsidiary of Momentive Holdings.
In March 2014, the Company entered into an Employee Services Agreement with Momentive Holdings, MSC and Momentive Performance Materials Holdings Employee Corporation (“Employee Corp”), a subsidiary of Momentive Holdings (the “Services Agreement”). The Services Agreement provides for the executive services of Mr. Jack Boss, an employee of Employee Corp., to be made available to the Company and sets forth the terms with respect to payment for the cost of such services. Mr. Boss was elected Executive Vice President and President Silicones and Quartz Division of the Company effective March 31, 2014. Pursuant to the Services Agreement, the Company agrees to pay 100% of Mr. Boss’s costs of employment which are set forth in the offer letter filed as an exhibit to this Annual Report and comprised of “Covered Costs” including an annual base salary of $585 thousand, a sign-on bonus of $1.3 million payable between 2014 and 2015, annual incentive compensation, relocation costs, severance and benefits and other standard reasonable business expenses.
F-17
Table of Contents
In March 2014, the Company entered into a ground lease with a Brazilian subsidiary of MSC to lease a portion of the Company’s manufacturing site in Itatiba, Brazil, where the subsidiary of MSC will construct and operate an epoxy production facility. In conjunction with the ground lease, the Company also entered into a site services agreement whereby it will provide to the subsidiary of MSC various services such as environmental, health and safety, security, maintenance and accounting, amongst others, to support the operation of this new facility.
5. Fair Value Measurements
Fair value is the exchange price that would be received for an asset or paid to transfer a liability (an exit price) in the principal or most advantageous market for the asset or liability in an orderly transaction between market participants on the measurement date. A fair value hierarchy exists, which requires an entity to maximize the use of observable inputs and minimize the use of unobservable inputs when measuring fair value. The three levels of inputs that may be used to measure fair value are:
| • | Level 1: Inputs are quoted prices (unadjusted) for identical assets or liabilities in active markets. |
| • | Level 2: Pricing inputs are other than quoted prices in active markets included in Level 1, which are either directly or indirectly observable as of the reported date. |
| • | Level 3: Unobservable inputs, that are supported by little or no market activity and are developed based on the best information available in the circumstances. For example, inputs derived through extrapolation or interpolation that cannot be corroborated by observable market data. |
At December 31, 2013 and December 31, 2012, the Company had less than $1 of natural gas derivative contracts, which are measured using Level 2 inputs, and are included in “Other current assets” in the Consolidated Balance Sheets. The fair value of the natural gas derivative contracts generally reflects the estimated amounts that the Company would receive or pay, on a pre-tax basis, to terminate the contracts at the reporting date based on broker quotes for the same or similar instruments. Counterparties to these contracts are highly rated financial institutions, none of which experienced any significant downgrades in the year ended December 31, 2013 that would reduce the fair value receivable amount owed, if any, to the Company.
The following table summarizes the carrying amount and fair value of the Company’s non-derivative financial instruments at December 31, 2013:
| Carrying Amount |
Fair Value | |||||||||||||||||||
| Level 1 | Level 2 | Level 3 | Total | |||||||||||||||||
| December 31, 2013 |
||||||||||||||||||||
| Debt |
$ | 3,257 | $ | — | $ | 3,029 | $ | — | $ | 3,029 | ||||||||||
| December 31, 2012 |
||||||||||||||||||||
| Debt |
$ | 3,116 | $ | — | $ | 2,588 | $ | — | $ | 2,588 | ||||||||||
Fair values of debt classified as Level 2 are determined based on other similar financial instruments, or based upon interest rates that are currently available to the Company for the issuance of debt with similar terms and maturities. The carrying amount of cash and cash equivalents, accounts receivable, accounts payable and other accrued liabilities are considered reasonable estimates of their fair values due to the short-term maturity of these financial instruments.
F-18
Table of Contents
6. Goodwill and Intangible Assets
The Company’s gross carrying amount and accumulated impairments of goodwill consist of the following as of December 31:
| 2013 | 2012 | |||||||||||||||||||||||||||||||
| Gross Carrying Amount |
Accumulated Impairments |
Accumulated Foreign Currency Translation |
Net Book Value |
Gross Carrying Amount |
Accumulated Impairments |
Accumulated Foreign Currency Translation |
Net Book Value |
|||||||||||||||||||||||||
| Silicones |
$ | 988 | $ | (700 | ) | $ | 93 | $ | 381 | $ | 988 | $ | (700 | ) | $ | 124 | $ | 412 | ||||||||||||||
| Quartz |
149 | (158 | ) | 9 | — | 149 | (158 | ) | 9 | — | ||||||||||||||||||||||
|
|
|
|
|
|
|
|
|
|
|
|
|
|
|
|
|
|||||||||||||||||
| Total |
$ | 1,137 | $ | (858 | ) | $ | 102 | $ | 381 | $ | 1,137 | $ | (858 | ) | $ | 133 | $ | 412 | ||||||||||||||
|
|
|
|
|
|
|
|
|
|
|
|
|
|
|
|
|
|||||||||||||||||
The changes in the net carrying amount of goodwill by business for the years ended December 31, 2013 and 2012 are as follows:
| Silicones | Quartz | Total | ||||||||||
| Balance as of December 31, 2011 |
$ | 432 | $ | — | $ | 432 | ||||||
| Foreign currency translation |
(20 | ) | — | (20 | ) | |||||||
|
|
|
|
|
|
|
|||||||
| Balance as of December 31, 2012 |
412 | — | 412 | |||||||||
| Foreign currency translation |
(31 | ) | — | (31 | ) | |||||||
|
|
|
|
|
|
|
|||||||
| Balance as of December 31, 2013 |
$ | 381 | $ | — | $ | 381 | ||||||
|
|
|
|
|
|
|
|||||||
The Company’s intangible assets with identifiable useful lives consist of the following as of December 31:
| 2013 | 2012 | |||||||||||||||||||||||||||||||
| Gross Carrying Amount |
Accumulated Impairments |
Accumulated Amortization |
Net Book Value |
Gross Carrying Amount |
Accumulated Impairments |
Accumulated Amortization |
Net Book Value |
|||||||||||||||||||||||||
| Customer relationships |
$ | 426 | $ | — | $ | (170 | ) | $ | 256 | $ | 426 | $ | — | $ | (146 | ) | $ | 280 | ||||||||||||||
| Trademarks |
150 | — | (64 | ) | 86 | 142 | — | (53 | ) | 89 | ||||||||||||||||||||||
| Unpatented technology |
144 | — | (56 | ) | 88 | 144 | — | (44 | ) | 100 | ||||||||||||||||||||||
| Patents and other |
67 | — | (42 | ) | 25 | 64 | — | (40 | ) | 24 | ||||||||||||||||||||||
|
|
|
|
|
|
|
|
|
|
|
|
|
|
|
|
|
|||||||||||||||||
| Total |
$ | 787 | $ | — | $ | (332 | ) | $ | 455 | $ | 776 | $ | — | $ | (283 | ) | $ | 493 | ||||||||||||||
|
|
|
|
|
|
|
|
|
|
|
|
|
|
|
|
|
|||||||||||||||||
The impact of foreign currency translation on intangible assets in included in accumulated amortization.
Total intangible amortization expense for the years ended December 31, 2013, 2012 and 2011 was $41, $43 and $45, respectively.
Estimated annual intangible amortization expense for 2014 through 2018 is as follows:
| 2014 |
$ | 46 | ||
| 2015 |
43 | |||
| 2016 |
43 | |||
| 2017 |
43 | |||
| 2018 |
42 |
F-19
Table of Contents
7. Debt and Lease Obligations
Debt outstanding as of December 31, 2013 and 2012 is as follows:
| 2013 | 2012 | |||||||||||||||
| Long-Term | Due Within One Year |
Long-Term | Due Within One Year |
|||||||||||||
| ABL Facility |
$ | — | $ | 135 | $ | — | $ | — | ||||||||
| Cash Flow Facility |
— | — | — | — | ||||||||||||
| First Lien and Senior Secured Notes: |
||||||||||||||||
| 8.875% First Lien Notes due 2020 |
— | 1,100 | 1,100 | — | ||||||||||||
| 10.00% Senior Secured Notes due 2020 |
— | 250 | 250 | — | ||||||||||||
| Springing Lien Notes: |
||||||||||||||||
| 9.00% Springing Lien Dollar Notes due 2021 |
— | 1,161 | 1,161 | — | ||||||||||||
| 9.50% Springing Lien Euro Notes due 2021 |
— | 183 | 175 | — | ||||||||||||
| Other Borrowings: |
||||||||||||||||
| 11.50% Senior Subordinated Notes due 2016 (includes $2 of unamortized debt discount at December 31, 2012) |
— | 382 | 380 | — | ||||||||||||
| China bank loans at 5.9% and 6.6% at December 31, 2013 and 2012, respectively |
7 | 33 | 13 | 29 | ||||||||||||
| Other at 11% at December 31, 2013 and 2012 |
— | 6 | 2 | 6 | ||||||||||||
|
|
|
|
|
|
|
|
|
|||||||||
| Total debt |
$ | 7 | $ | 3,250 | $ | 3,081 | $ | 35 | ||||||||
|
|
|
|
|
|
|
|
|
|||||||||
As discussed in Note 1, the Company believes there is substantial doubt about its ability to continue as a going concern for the next twelve months, including its ability to fund its debt service obligations. The inability of the Company to fund such debt service obligations is an event of default under the ABL Facility (described below) and under the indentures that govern the Company’s notes. As such, all outstanding debt as of December 31, 2013 related to the ABL Facility, the First Lien Notes, the Senior Secured Notes, the Springing Lien Notes and the Senior Subordinated Notes has been classified as “Debt payable within one year” in the Consolidated Balance Sheets and related footnote disclosures.
ABL Facility and Cash Flow Facility
In April 2013, the Company entered into two new senior secured revolving credit facilities: a $270 asset-based revolving loan facility with a syndicate of lenders, which is subject to a borrowing base (the “ABL Facility”), and a $75 revolving credit facility with an affiliate of GE, which supplements the ABL Facility (the “Cash Flow Facility”). The ABL Facility and Cash Flow Facility replaced the Company’s prior senior secured credit facility (the “Old Credit Facility”), which consisted of a $300 revolving credit facility (the “Old Revolver”) and a $33 synthetic letter of credit facility.
The ABL Facility has a five-year term, unless, on the date that is 91 days prior to the scheduled maturity of the Company’s 11.5% Senior Subordinated Notes due 2016 (the “Senior Subordinated Notes”), more than $50 aggregate principal amount of such notes is outstanding, in which case the ABL Facility will mature on such earlier date. Availability under the ABL Facility is $270, subject to a borrowing base that is based on a specified percentage of eligible accounts receivable and inventory and, in certain foreign jurisdictions, machinery and equipment. The ABL Facility includes borrowing capacity for letters of credit of up to $125. The borrowers under the ABL Facility are the Company’s wholly-owned subsidiaries: Momentive Performance Materials USA Inc. (“MPM USA”), Momentive Performance Materials GmbH (“MPM GmbH”), Momentive Performance Materials Quartz GmbH (“MPM Quartz”) and Momentive Performance Materials Nova Scotia ULC (“MPM Nova Scotia”).
The ABL Facility bears interest at a floating rate based on, at the Company’s option, an adjusted LIBOR rate plus an initial applicable margin of 2.25% or an alternate base rate plus an initial applicable margin of
F-20
Table of Contents
1.25%. From and after the date of delivery of the borrowing base certificate for May 2013, the applicable margin for such borrowings will be adjusted depending on the availability under the ABL Facility. As of December 31, 2013, the applicable margin for LIBOR rate loans was 2.25% and for alternate base rate loans was 1.25%. In addition to paying interest on outstanding principal under the ABL Facility, the Company will be required to pay a commitment fee to the lenders in respect of the unutilized commitments at an initial rate equal to 0.50% per annum, subject to adjustment depending on the usage. The ABL Facility does not have any financial maintenance covenant, other than a minimum fixed charge coverage ratio of 1.0 to 1.0 that would only apply if availability is less than the greater of (a) 12.5% of the lesser of the borrowing base and the total ABL Facility commitments at such time and (b) $27. The fixed charge coverage ratio under the credit agreement governing the ABL Facility is generally defined as the ratio of (a) Adjusted EBITDA minus non-financed capital expenditures and cash taxes to (b) debt service plus cash interest expense plus certain restricted payments, each measured on a last twelve months basis. The ABL Facility is secured by, among other things, first-priority liens on most of the inventory and accounts receivable and related assets of the Company, its domestic subsidiaries and certain of its foreign subsidiaries, and, in the case of certain foreign subsidiaries, machinery and equipment (the “ABL Priority Collateral”), and second-priority liens on certain collateral that generally includes most of the Company’s, its domestic subsidiaries’ and certain of its foreign subsidiaries’ assets other than ABL Priority Collateral (the “Notes Priority Collateral”), in each case subject to certain exceptions and permitted liens.
The Cash Flow Facility matures on December 3, 2014, which is the same maturity as that for the Old Revolver. The amount committed under the Cash Flow Facility is $75, which may not be borrowed if the borrowing of such amount (or any portion thereof) could be borrowed under the ABL Facility without violating a utilization test under the Cash Flow Facility. The borrowers under the Cash Flow Facility are MPM USA, MPM GmbH and MPM Nova Scotia.
The Cash Flow Facility bears interest at a floating rate based on LIBOR plus a margin of 6.00%. In addition to paying interest on outstanding principal under the Cash Flow Facility, the Company is required to pay an undrawn fee of 3.00% to the lender in respect of the unutilized commitments. The Cash Flow Facility has substantially the same incurrence covenants and maintenance covenants as the Old Credit Facility, except that the senior secured leverage ratio maintenance covenant, which requires the Company to maintain a specified net first-lien indebtedness to Adjusted EBITDA ratio if there are any outstanding borrowings thereunder, will not begin to apply until the third quarter of 2014.
The security arrangements for the Cash Flow Facility include (i) first-priority liens on the Notes Priority Collateral owned by the Company and its domestic subsidiaries, which are pari passu with the Company’s 8.875% First-Priority Senior Secured Notes due 2020 (the “First Lien Notes”), (ii) second-priority liens on the ABL Priority Collateral owned by the Company and its domestic subsidiaries, which are junior to the ABL Facility and pari passu with the First Lien Notes, (iii) first-priority liens on Notes Priority Collateral owned by certain foreign subsidiaries of the Company, which are senior to the ABL Facility, and (iv) second-priority liens on the ABL Priority Collateral owned by such foreign subsidiaries, which are junior to the ABL Facility, in each case subject to certain exceptions and permitted liens.
As of December 31, 2013, the Company had $135 of outstanding borrowings under the ABL Facility. Outstanding letters of credit under the ABL Facility at December 31, 2013 were $69, leaving an unused borrowing capacity of $107 under the ABL Facility and the Cash Flow Facility (without triggering the financial maintenance covenant under the ABL Facility).
Prior Senior Secured Credit Facilities
As described above, the Company’s prior senior secured credit facilities were replaced by the ABL Facility and the Cash Flow Facility in April 2013. The term loans under the prior senior secured credit facilities were repaid in full in November 2012 in connection with the issuance of the First Lien Notes. Prior to November 2012, the senior secured credit facilities included a term loan facility with a maturity date in 2015, and prior to April
F-21
Table of Contents
2013, the senior secured credit facilities included the Old Revolver described above, which had a maturity date in 2014 and bore interest at an adjusted LIBOR rate plus an applicable margin of 6.00%.
First Lien Notes
In October 2012, MPM Escrow LLC and MPM Finance Escrow Corp. (the “Escrow Issuers”), wholly owned special purpose subsidiaries of the Company, issued $1,100 principal amount of First Lien Notes in a private offering. The proceeds from the sale of First Lien Notes were initially placed in escrow and were released in November 2012 following the Company’s assumption of all obligations of the Escrow Issuers under the First Lien Notes and the Company’s amendment of its credit agreement governing its senior secured credit facilities in existence at that time. The proceeds from the sale of the First Lien Notes were used (i) to repay all amounts outstanding under such senior secured credit facilities (without reducing the commitments under the revolving credit facility), (ii) to irrevocably deposit approximately $219 with the trustee for the 12 1/2% Second-Lien Senior Secured Notes due 2014 (the “Old Second Lien Notes”) in order to satisfy and discharge all of the Company’s outstanding $200 aggregate principal amount of the Old Second Lien Notes, which were redeemed at a redemption price equal to 103.125% plus accrued and unpaid interest to the redemption date, (iii) to pay related fees and expenses and (iv) for general corporate purposes. The Company recognized a loss of $51, including $12 of foreign currency exchange losses, on this extinguishment of debt. Included in the loss of $51 is an out of period credit of $4 related to an over expensing of debt discount interest on the Old Second Lien Notes that was not material to the prior years. These amounts are included in “Loss (gain) on extinguishment and exchange of debt” in the Consolidated Statements of Operations.
The First Lien Notes are guaranteed on a senior secured basis by the existing domestic subsidiaries that are guarantors under the Company’s Cash Flow Facility and will be guaranteed on the same basis by any future domestic subsidiaries that guarantee any debt of the Company or of any guarantor of the First Lien Notes. The First Lien Notes are secured by first-priority liens on the Notes Priority Collateral owned by the Company and its domestic subsidiaries, and by second-priority liens on the domestic portion of ABL Priority Collateral owned by the Company and its domestic subsidiaries, in each case subject to certain exceptions and permitted liens. The first-priority liens in such Notes Priority Collateral and the second-priority liens in such ABL Priority Collateral securing the First Lien Notes are shared pari passu with the lenders under the Cash Flow Facility, in each case subject to certain exceptions and permitted liens.
Senior Secured Notes
In May 2012, the Company issued $250 in aggregate principal amount of 10% Senior Secured Notes due October 2020 (the “Senior Secured Notes”) at an issue price of 100%. The Company used the net proceeds to repay $240 in aggregate principal amount of existing term loans maturing May 2015 under the Old Credit Facility. The Company recognized a loss of $6 on this extinguishment of debt, which is included in “Loss (gain) on extinguishment and exchange of debt” in the Consolidated Statements of Operations. The Senior Secured Notes are guaranteed on a senior secured basis by the Company’s existing domestic subsidiaries that are guarantors under the Company’s Cash Flow Facility and will be guaranteed on the same basis by any future domestic subsidiaries that guarantee any debt of the Company or of any guarantor of the Senior Secured Notes. The Senior Secured Notes are secured by a security interest in the Notes Priority Collateral and the ABL Priority Collateral in each case owned by the Company and its domestic subsidiaries, which interest is junior in priority to the liens on such collateral securing the ABL Facility, the Cash Flow Facility and the First Lien Notes and senior in priority to the liens on such collateral securing the Springing Lien Notes.
Springing Lien Notes
In November 2010, the Company issued approximately $848 U.S. dollar equivalent principal amount of USD 9.0% Second-Priority Springing Lien Notes due 2021 (the “Springing Lien Dollar Notes”) and EUR 9.5% Second-Priority Springing Lien Notes due 2021 (the “Springing Lien Euro Notes” and, together with the
F-22
Table of Contents
Springing Lien Dollar Notes, the “Springing Lien Notes”) in a private offering (the “Springing Lien Note Offering”). The Springing Lien Notes are guaranteed on a second-priority secured basis by the Company’s existing domestic subsidiaries that are guarantors under the Company’s Cash Flow Facility and will be guaranteed on the same basis by any future domestic subsidiaries that guarantee any debt of the Company or of any guarantor of the Springing Lien Notes. The Springing Lien Notes are secured by a second-priority security interest in the Notes Priority Collateral and the ABL Priority Collateral in each case owned by the Company and its domestic subsidiaries, which interest is junior in priority to the liens on such collateral securing the ABL Facility, the Cash Flow Facility, the First Lien Notes and the Senior Secured Notes. The Company used the net proceeds from the offering of Springing Lien Notes to, (i) pay the consideration with respect to the tender offers (the “Tender Offers”) and redemption of the remaining series of the Company’s previously outstanding senior notes (the “Old Senior Notes”) and (ii) pay certain related transaction costs and expenses.
In connection with the closing of the Springing Lien Note Offering, investment funds affiliated with Apollo Global Management, LLC entered into an agreement to exchange the entire amount of their holdings of each series of the Company’s Old Senior Notes for the Springing Lien Dollar Notes at an exchange ratio determined based on the consideration offered to holders in the Tender Offers, and intended to give Apollo an aggregate value equivalent to that which it would receive if it had received the total consideration in the Tender Offers and used the proceeds thereof to invest in the Springing Lien Dollar Notes (the “Apollo Exchange”). The Company issued approximately $526 of Springing Lien Dollar Notes to Apollo in the Apollo Exchange. Apollo owned approximately $234 principal amount of the 9.75% Senior Notes, €88 principal amount of the 9% Senior Notes and $139 principal amount of old senior toggle notes of the Company.
In October 2011, the Company repurchased approximately €17 in aggregate principal amount of the Springing Lien Euro Notes on the open market, reducing the aggregate principal amount of Springing Lien Euro Notes outstanding from €150 to €133. The total purchase excluding accrued interest paid by the Company was €12. The Company recognized a gain on the extinguishment of $7, including $1 of foreign currency exchange gains, which is included in “Loss (gain) on extinguishment and exchange of debt” in the Consolidated Statements of Operations.
Senior Subordinated Notes
The Senior Subordinated Notes are unsecured senior subordinated obligations of the Company, which mature on December 1, 2016. The Senior Subordinated Notes are guaranteed on an unsecured senior subordinated basis by each of the Company’s domestic subsidiaries that is a guarantor under the Company’s Cash Flow Facility and will be guaranteed on the same basis by any future domestic subsidiaries that guarantee any debt of the Company or any guarantor of the Senior Subordinated Notes.
General
The credit agreements governing the ABL Facility and the Cash Flow Facility and the indentures governing the First Lien Notes, Senior Secured Notes, Springing Lien Notes and Senior Subordinated Notes also limit the Company’s ability to, among other things: (i) incur additional indebtedness; (ii) declare or pay dividends or make other distributions or repurchase or redeem Company stock; (iii) make investments; (iv) sell assets, including capital stock of restricted subsidiaries; (v) enter into agreements restricting the Company’s subsidiaries ability to pay dividends; (vi) consolidate, merge, sell or otherwise dispose of all or substantially all of the Company’s assets; (vii) enter into transactions outside the ordinary course of business with our affiliates; and, (viii) incur liens.
The Company and certain of its domestic subsidiaries have pledged, to the applicable collateral agents, 100% of non-voting and 65% of voting equity interests in the Company’s and such domestic subsidiaries’ first-tier foreign subsidiaries, in each case to secure the obligations of the Company and the other domestic obligors under the ABL Facility, the Cash Flow Facility and the First Lien Notes, Senior Secured Notes and Springing
F-23
Table of Contents
Lien Notes, and 35% of voting equity interests in the Company’s and such domestic subsidiaries’ first-tier foreign subsidiaries, to secure the obligations of the foreign obligors under the ABL Facility and the Cash Flow Facility. In addition, certain of the Company’s German subsidiaries have pledged, to the applicable collateral agents, 100% of non-voting and voting equity interests in such German subsidiaries’ German subsidiaries, to secure the obligations of the foreign obligors under the ABL Facility and the Cash Flow Facility.
As of December 31, 2013, the Company was in compliance with all the covenants included in the agreements governing its outstanding indebtedness.
In 2014, the Company’s auditors, PricewaterhouseCoopers LLP, have expressed in their opinion to the Consolidated Financial Statements that there is substantial doubt about the Company’s ability to continue as a going concern for the next twelve months. Additionally, the Company did not furnish its financial statements for the fiscal year ended December 31, 2013 to the lenders under the ABL Facility and Cash Flow Facility within the required time frame of 95 days from such fiscal year end. Both of these events trigger a violation of the covenants under the ABL Facility and Cash Flow Facility. If such covenant violations are not waived or cured within a specified cure period, such violations may give rise to an acceleration under the ABL Facility and Cash Flow Facility and may also trigger cross-acceleration clauses under the indentures that govern the Company’s notes. Accordingly, the Company is in the process of obtaining waivers of these covenant violations from its lenders under the ABL Facility and Cash Flow Facility. Pursuant to such waivers, the lenders would also agree, subject to certain conditions and/or ongoing covenants and termination events, to waive any defaults or events of default arising under the ABL Facility or the Cash Flow Facility as a result of the commencement of a Chapter 11 filing. The Company expects to obtain these waivers.
Scheduled Maturities
Aggregate maturities of debt and minimum rentals under operating leases at December 31, 2013 for the Company are as follows:
| Year |
Debt(1) | Minimum Rentals Under Operating Leases |
||||||
| 2014 |
$ | 3,250 | $ | 16 | ||||
| 2015 |
7 | 9 | ||||||
| 2016 |
— | 7 | ||||||
| 2017 |
— | 3 | ||||||
| 2018 |
— | 2 | ||||||
| 2019 and thereafter |
— | 3 | ||||||
|
|
|
|
|
|||||
| Total |
$ | 3,257 | $ | 40 | ||||
|
|
|
|
|
|||||
| (1) | As described above, all outstanding debt as of December 31, 2013 related to the ABL Facility, the First Lien Notes, the Senior Secured Notes the Springing Lien Notes and the Senior Subordinated Notes has been classified as “Debt payable within one year” in the Consolidated Balance Sheets and related footnote disclosures. |
The Company’s operating leases consist primarily of vehicles, equipment, land and buildings. Rental expense under operating leases amounted to $15, $25 and $23 for each of the years ended December 31, 2013, 2012 and 2011, respectively.
F-24
Table of Contents
8. Deficit
Common Stock
At December 31, 2013 and 2012, common stock consists of 100 shares issued and outstanding with a par value of one cent per share. At December 31, 2013 and 2012, MPM Holdings represented the sole shareholder of the Company.
Paid-in Capital
Additional paid-in capital primarily relates to the excess of paid-in-capital over the par value of the common shares from MPM Holdings’ capital contribution of $904 to the Company in 2006, net of $305 in deemed dividend to GE.
During the year ended December 31, 2013, in conjunction with the GE ASM Sale, the Company’s direct parent received a one-time payment of approximately $102 from GE, which amount was subsequently contributed to the Company (see Note 4). Additionally, during the year ended December 31, 2013, in connection with an amendment to the Trademark License Agreement, dated as of December 3, 2006, by and between GE Monogram Licensing International and the Company, the Company’s direct parent recorded a gain and related intangible asset of $7. This intangible asset was subsequently contributed to the Company (see Note 4). Both of these transactions were recorded in “Additional Paid-in Capital” in the Consolidated Statements of Deficit.
9. Stock Option Plans and Stock Based Compensation
The following is a summary of existing stock based compensation plans and outstanding shares as of December 31, 2013:
| Plan Name |
Shares Outstanding |
Plan Expiration |
Vesting Terms |
Option/ Unit Term |
Number of Shares Authorized | |||||
| 2007 Long-Term Incentive Plan |
March 2017 | 10 years | 19,275,900 | |||||||
| Tranche A Options |
2,690,591 | Fully vested | ||||||||
| Tranche B Options |
2,690,095 | Performance-based: Vest upon the earlier of i) the date that Apollo realizes a specified internal rate of return on its original investment in Momentive Holdings and ii) the date that Apollo achieves a specified cash-on-cash return on its original investment in Momentive Holdings. | ||||||||
| Tranche C Options |
2,689,317 | Performance-based: Vest upon the earlier of i) the date that Apollo realizes a specified internal rate of return on its original investment in Momentive Holdings and ii) the date that Apollo achieves a specified cash-on-cash return on its original investment in Momentive Holdings. | ||||||||
| Director Options |
616,824 | Fully vested |
F-25
Table of Contents
| Plan Name |
Shares Outstanding |
Plan Expiration |
Vesting Terms |
Option/ Unit Term |
Number of Shares Authorized | |||||
| Momentive Performance Materials Holdings LLC 2011 Equity Incentive Plan |
February 2021 | 10 years | 20,800,000 | |||||||
| 2011 Grant |
||||||||||
| Tranche A Options and RDUs(1) |
Options: 515,712 RDUs: 85,948 |
Time-vest ratably over 4 years; Accelerated vesting six months after certain change of control transactions | ||||||||
| Tranche B Options and RDUs(2) |
Options: 257,853 RDUs: 85,951 |
Performance-based: Vest upon the earlier of i) the two year anniversary from the date of the achievement of the targeted common unit value following certain corporate transactions or ii) the six month anniversary from the date the targeted common unit value is achieved following certain change of control transactions | ||||||||
| Tranche C Options and RDUs(3) |
Options: 257,853 RDUs: 85,951 |
Performance-based: Vest upon the earlier of i) the one year anniversary from the date of the achievement of the targeted common unit value following certain corporate transactions or ii) the six month anniversary from the date the targeted common unit value is achieved following certain change of control transactions | ||||||||
| 2013 Grant |
||||||||||
| Unit Options(4) |
1,215,741 | Time-vest ratably over 4 years; Accelerated vesting six months after a change of control event as defined by the 2011 Equity Plan | 10 years | |||||||
| Restricted Deferred Units(5) |
959,984 | Performance-based: Vest upon the earlier of i) one year from the achievement of the targeted common unit value and a realization event or ii) six months from the achievement of the targeted common unit value and a change in control event, as such terms are defined by the 2011 Equity Plan | N/A |
| (1) | 2,584,845 Tranche A Options and 451,898 Tranche A RDUs related to employees of MSC were also outstanding as of December 31, 2013 |
| (2) | 1,262,387 Tranche B Options and 434,867 Tranche B RDUs related to employees of MSC were also outstanding as of December 31, 2013 |
| (3) | 1,262,387 Tranche C Options and 434,867 Tranche C RDUs related to employees of MSC were also outstanding as of December 31, 2013 |
| (4) | 4,692,441 Unit Options related to employees of MSC were also outstanding as of December 31, 2013 |
| (5) | 3,705,294 RDUs related to employees of MSC were also outstanding as of December 31, 2013 |
F-26
Table of Contents
Summary of Plans
Legacy Plan
Prior to the Momentive Combination, the Company’s parent maintained a stock-based compensation plan (the “2007 Long-Term Incentive Plan”). The options granted under the 2007 Long-Term Incentive Plan were to purchase common units in MPM Holdings. Effective October 1, 2010, in conjunction with the Momentive Combination, stock options to purchase common units in MPM Holdings were converted to options to purchase units of Momentive Holdings at an exchange ratio of 38.5518 Momentive Holdings options for each 1 option of MPM Holdings.
2011 Equity Plan
On February 23, 2011, the Compensation Committee of the Board of Managers of Momentive Holdings approved the Momentive Performance Materials Holdings LLC 2011 Equity Incentive Plan (the “2011 Equity Plan”). Under the 2011 Equity Plan, Momentive Holdings can award unit options, unit awards, restricted units, restricted deferred units, and other unit-based awards. The restricted deferred units are nonvoting units of measurement, which are deemed to be equivalent to one common unit of Momentive Holdings. The unit options are options to purchase common units of Momentive Holdings. The awards contain restrictions on transferability and other typical terms and conditions.
Unit Options
On March 8, 2013, the Company granted Unit Options with an aggregate grant date fair value of approximately $1. The fair value was estimated at the grant date using a Monte Carlo valuation method. The Monte Carlo valuation method requires the use of a range of assumptions. The range of risk-free interest rates was 0.11% to 2.06%, expected volatility rates ranged from 28.1% to 35.5% and the dividend rate was 0%. The expected life assumption is not used in the Monte Carlo valuation method, but the output of the model indicated a weighted-average expected life of 6.2 years.
In 2011, the Company granted Tranche A Options with an aggregate grant date fair value of approximately $2. The fair value was estimated at the grant date using a Black-Scholes option pricing model. The assumptions used to estimate the fair value were a 2.21% risk free interest rate, a 6.25 year expected life, a 37.4% expected volatility rate and a 0% dividend rate.
In 2011, the Company granted Tranche B and Tranche C Options with performance and market conditions, each with an aggregate grant date fair value of approximately $1. The fair value was estimated at the grant date using a Monte Carlo valuation method, which is a commonly accepted valuation model for awards with market and performance conditions. The Monte Carlo valuation method requires the use of a range of assumptions. The range of risk-free interest rates were 0.16% to 3.49%, expected volatility rates ranged from 34.5% to 41.5% and the dividend rate was 0%. The expected life is not used in the Monte Carlo valuation method, but the output of the model indicated a weighted average expected life of 9.2 years. As of December 31, 2013, it is not probable the related options will vest. Compensation cost will be recognized over the service period once the satisfaction of the performance condition is probable.
Restricted Deferred Units
On March 8, 2013, the Company granted RDUs with performance and market conditions with an aggregate grant date fair value of approximately $2. The fair value was estimated at the grant date using the same Monte Carlo valuation method and assumptions used for the Unit Options. The RDUs have an indefinite life, thus the term used in the valuation model was 30 years, which resulted in a weighted-average expected life of 22 years. As of December 31, 2013, it is not probable the related RDUs will vest. Compensation cost will be recognized over the service period once the satisfaction of the performance condition is probable.
F-27
Table of Contents
In 2011, the Company granted Tranche A RDUs with an aggregate grant date fair value of approximately $1.
In 2011, the Company granted Tranche B RDUs and Tranche C RDUs with an aggregate grant date fair value of approximately $1. The fair value of each RDU was estimated at the grant date using the same Monte Carlo valuation method and assumptions as for the unit options. The RDU’s have an indefinite life, thus the term used in the valuation model was 30 years, which resulted in a weighted average expected life of 21.4 years. As of December 31, 2013, it is not probable the related RDUs will vest. Compensation cost will be recognized over the service period once the satisfaction of the performance condition is probable.
Although the 2011 Equity Plan is issued by Momentive Holdings, the underlying compensation cost represents compensation costs paid for by Momentive Holdings on MPM’s behalf, as a result of the employees’ service to MPM. All compensation cost is recorded over the requisite service period on a graded-vesting basis and is included in “Selling, general and administrative expense” in the Consolidated Statements of Operations.
Financial Statement Impact
Share-based compensation expense is recognized, net of estimated forfeitures, over the requisite service period on a graded-vesting basis. The Company adjusts compensation expense periodically for forfeitures.
The Company recognized share-based compensation expense of $1, less than $1 and $2 for the years ended December 31, 2013, 2012 and 2011, respectively. The amounts are included in “Selling, general and administrative expense” in the Consolidated Statements of Operations. The Company recognized no tax benefits. The Company expects additional compensation expense of $5, which will be recognized over the vesting period of the underlying share-based awards. $1 is expected to be recognized ratably over a weighted-average period of 1.5 years, while the remaining $4 will be recognized upon an initial public offering or other future contingent event.
The following is a summary of the Company’s stock option plans activity as of and for the years ended December 31, 2013:
| Momentive Holdings Common Units |
Weighted Average Exercise Price |
|||||||
| Outstanding at December 31, 2012 |
10,350,073 | $ | 2.88 | |||||
| Granted |
1,531,582 | $ | 1.42 | |||||
| Forfeited |
(947,669 | ) | $ | 2.22 | ||||
|
|
|
|||||||
| Outstanding at December 31, 2013 |
10,933,986 | $ | 2.69 | |||||
|
|
|
|||||||
| Exercisable at December 31, 2013 |
3,898,931 | $ | 2.75 | |||||
| Expected to vest at December 31, 2013 |
1,053,364 | $ | 1.87 | |||||
At December 31, 2013, exercise prices for options outstanding ranged from $1.42 and $4.85 with a weighted average remaining contractual life of 4.9 years. The weighted average remaining contractual life for options exercisable and options expected to vest was 4.6 and 8.7 years, respectively. At December 31, 2013, the aggregate intrinsic value of both options exercisable and options expected to vest was $0.
The total amount of cash received and total intrinsic value (which is the amount by which the stock price exceeded the exercise price of the options on the date of exercise) of options exercised during the years ended December 31, 2013, 2012 and 2011 was $0.
F-28
Table of Contents
Restricted Unit Activity
Following is a summary of the Company’s restricted unit plan activity for the year ended December 31, 2013:
| Momentive Holdings Common Units |
Weighted Average Grant Date Fair Value |
|||||||
| Nonvested at December 31, 2012 |
308,988 | $ | 4.64 | |||||
| Restricted units granted |
1,209,382 | $ | 1.31 | |||||
| Restricted units vested |
(42,975 | ) | $ | 4.85 | ||||
| Restricted units forfeited |
(300,535 | ) | $ | 1.80 | ||||
|
|
|
|||||||
| Nonvested at December 31, 2013 |
1,174,860 | $ | 1.92 | |||||
|
|
|
|||||||
The weighted average remaining contractual life for time-based vesting restricted units granted and outstanding was 1.0 year.
10. Income Taxes
For the years ended December 31, 2013, 2012 and 2011, the Company’s tax provision was computed based on the legal entity structure, as described in Note 1. Any tax benefit or valuation allowance related to net operating losses (“NOL”) was recognized and evaluated on a stand-alone basis.
The domestic and foreign components of loss before income taxes are as follows:
| Year ended December 31, | ||||||||||||
| 2013 | 2012 | 2011 | ||||||||||
| Domestic |
$ | (251 | ) | $ | (239 | ) | $ | (101 | ) | |||
| Foreign |
(112 | ) | (123 | ) | (6 | ) | ||||||
|
|
|
|
|
|
|
|||||||
| Total |
$ | (363 | ) | $ | (362 | ) | $ | (107 | ) | |||
|
|
|
|
|
|
|
|||||||
Income tax expense (benefit) attributable to loss from operations consists of:
| Current | Deferred | Total | ||||||||||
| Year ended December 31, 2013: |
||||||||||||
| United States federal |
$ | — | $ | (15 | ) | $ | (15 | ) | ||||
| State and local |
— | — | — | |||||||||
| Non U.S. jurisdictions |
18 | 101 | 119 | |||||||||
|
|
|
|
|
|
|
|||||||
| $ | 18 | $ | 86 | $ | 104 | |||||||
|
|
|
|
|
|
|
|||||||
| Year ended December 31, 2012: |
||||||||||||
| United States federal |
$ | — | $ | (7 | ) | $ | (7 | ) | ||||
| State and local |
(1 | ) | — | (1 | ) | |||||||
| Non U.S. jurisdictions |
19 | (3 | ) | 16 | ||||||||
|
|
|
|
|
|
|
|||||||
| $ | 18 | $ | (10 | ) | $ | 8 | ||||||
|
|
|
|
|
|
|
|||||||
| Year ended December 31, 2011: |
||||||||||||
| United States federal |
$ | — | $ | — | $ | — | ||||||
| State and local |
— | — | — | |||||||||
| Non U.S. jurisdictions |
18 | 9 | 27 | |||||||||
|
|
|
|
|
|
|
|||||||
| $ | 18 | $ | 9 | $ | 27 | |||||||
|
|
|
|
|
|
|
|||||||
F-29
Table of Contents
Income tax expense attributable to loss from operations was $104, $8 and $27 for the years ended December 31, 2013, 2012 and 2011, respectively, and differed from the amounts computed by applying the U.S. federal income tax rate of 35% to pretax loss from continuing operations as a result of the following:
| Year ended December 31, | ||||||||||||
| 2013 | 2012 | 2011 | ||||||||||
| Income tax expense: |
||||||||||||
| Computed expected tax benefit |
$ | (127 | ) | $ | (127 | ) | $ | (37 | ) | |||
| State and local income taxes, net of Federal income tax benefit |
— | (1 | ) | — | ||||||||
| Increase (reduction) in income taxes resulting from: |
||||||||||||
| Tax rate changes |
— | 2 | (2 | ) | ||||||||
| Non U.S. tax rate differential |
26 | (1 | ) | 2 | ||||||||
| Branch accounting effect |
(50 | ) | 33 | 12 | ||||||||
| Withholding taxes |
1 | 1 | 1 | |||||||||
| Valuation allowance |
172 | 96 | 53 | |||||||||
| Permanent differences |
(4 | ) | 1 | (2 | ) | |||||||
| Change in permanent reinvestment assertion |
86 | — | — | |||||||||
| Settlements |
— | 4 | — | |||||||||
|
|
|
|
|
|
|
|||||||
| Total |
$ | 104 | $ | 8 | $ | 27 | ||||||
|
|
|
|
|
|
|
|||||||
The tax effects of temporary differences that give rise to significant portions of the deferred tax assets and deferred tax liabilities at December 31, 2013 and 2012 are presented below.
| Domestic | Foreign | |||||||||||||||
| 2013 | 2012 | 2013 | 2012 | |||||||||||||
| Current deferred tax assets: |
||||||||||||||||
| Inventory |
$ | 9 | $ | 9 | $ | 4 | $ | 4 | ||||||||
| Vacation |
6 | 2 | 2 | 1 | ||||||||||||
| Provision for expenses related to timing |
6 | 6 | 4 | 19 | ||||||||||||
| Other |
10 | 7 | 3 | 2 | ||||||||||||
|
|
|
|
|
|
|
|
|
|||||||||
| Total current deferred tax assets |
31 | 24 | 13 | 26 | ||||||||||||
|
|
|
|
|
|
|
|
|
|||||||||
| Noncurrent deferred tax assets: |
||||||||||||||||
| Amortization |
88 | 128 | 5 | 6 | ||||||||||||
| Depreciation |
29 | 27 | 15 | 14 | ||||||||||||
| Pension |
108 | 121 | 31 | 34 | ||||||||||||
| Net operating losses |
478 | 375 | 131 | 122 | ||||||||||||
| Branch accounting future benefit |
28 | 12 | — | — | ||||||||||||
| Reserves |
2 | 2 | — | — | ||||||||||||
| Deferred interest deductions |
— | — | 47 | 29 | ||||||||||||
| Other |
27 | 6 | 1 | 1 | ||||||||||||
|
|
|
|
|
|
|
|
|
|||||||||
| Total noncurrent deferred tax assets |
760 | 671 | 230 | 206 | ||||||||||||
|
|
|
|
|
|
|
|
|
|||||||||
| Total gross deferred tax assets |
791 | 695 | 243 | 232 | ||||||||||||
| Less valuation allowance |
(790 | ) | (685 | ) | (182 | ) | (127 | ) | ||||||||
|
|
|
|
|
|
|
|
|
|||||||||
| Net deferred tax assets |
1 | 10 | 61 | 105 | ||||||||||||
|
|
|
|
|
|
|
|
|
|||||||||
| Current deferred tax liabilities: |
||||||||||||||||
| Inventory |
— | — | 6 | 9 | ||||||||||||
| Provision for expenses related to timing |
— | — | 2 | 2 | ||||||||||||
| Other |
— | — | 5 | 13 | ||||||||||||
|
|
|
|
|
|
|
|
|
|||||||||
| Total current deferred tax liabilities |
— | — | 13 | 24 | ||||||||||||
| Noncurrent deferred tax liabilities: |
||||||||||||||||
| Amortization |
— | — | 59 | 67 | ||||||||||||
| Depreciation |
— | — | 33 | 42 | ||||||||||||
| Other |
1 | 10 | 36 | 5 | ||||||||||||
|
|
|
|
|
|
|
|
|
|||||||||
| Total noncurrent deferred tax liabilities |
1 | 10 | 128 | 114 | ||||||||||||
|
|
|
|
|
|
|
|
|
|||||||||
| Total deferred tax liabilities |
1 | 10 | 141 | 138 | ||||||||||||
|
|
|
|
|
|
|
|
|
|||||||||
| Net deferred tax asset (liability) |
$ | — | $ | — | $ | (80 | ) | $ | (33 | ) | ||||||
|
|
|
|
|
|
|
|
|
|||||||||
F-30
Table of Contents
NOL Schedule
| Country |
NOL Value | |||
| United States |
$ | 1,348 | ||
| Germany |
241 | |||
| Japan |
100 | |||
| Thailand |
55 | |||
| Other |
15 | |||
|
|
|
|||
| Total |
$ | 1,759 | ||
|
|
|
|||
At December 31, 2013, 2012 and 2011, the Company had available approximately $1,759, $1,428 and $1,111 of gross net operating loss carryforwards with expiration dates ranging from one year to indefinite that may be applied against future taxable income, respectively. The NOL schedule above has been prepared on a separate return basis. Had the schedule been prepared on a consolidated return basis, the U.S. net operating loss would have been $102 lower. In addition, $447 of the $1,348 U.S. net operating loss carryforwards are subject to dual consolidated loss rules and potentially could be recaptured, resulting in a cash tax due of up to $156 plus additional interest, should certain triggering events occur within the certification period. The net operating losses for the United States, Japan and Thailand will begin to expire in 2026, 2014 and 2016, respectively. The net operating losses for Germany have no expiration date.
The ultimate realization of deferred tax assets is dependent upon the generation of future taxable income during the periods in which those temporary differences become deductible. Management considers the scheduled reversal of deferred tax liabilities, projected future taxable income and tax planning strategies in making this assessment. Based upon the level of historical taxable income and projections for future taxable income over the periods in which the net deferred tax assets are deductible, management believes it is more likely that the Company will not realize the benefit of most of their net deferred tax assets. As of December 31, 2013 and 2012, in some jurisdictions in which there is a net deferred tax asset, the Company has established a full valuation allowance. However, there are exceptions for certain non U.S. jurisdictions where, based on management’s assessment, it is more likely than not the net deferred tax asset will be realized. For the years ending December 31, 2013 and 2012, the Company established new valuation allowances of $20 and $9, respectively, in certain non-U.S. jurisdictions based on its assessment that the net deferred tax assets will likely not be realized.
Under branch accounting, the inclusion of the non-U.S. operations in the U.S. income tax return requires the establishment of a deferred tax asset or liability to offset the foreign affiliates’ tax consequences; eliminating a duplicative deferred tax benefit or expense. The branch accounting future benefit deferred tax asset of $28 and $12 at December 31, 2013 and 2012, respectively, principally represents the offset to the non-US affiliates deferred tax liabilities.
The Company revised its unrecognized tax benefits table for the periods presented in its 2012 Annual Report on Form 10-K to correctly reflect certain unrecognized tax benefits that were previously shown in error on a net basis, instead of a gross basis. This correction, which the Company determined is not material, has no impact on any financial statements or footnotes, except for the table of unrecognized tax benefits included in the 2012 Annual Report on Form 10-K. The impacts of the corrections for the specified periods are as follows:
| As Previously Reported |
As Revised | |||||||
| Unrecognized Tax Benefits, December 31, 2010 |
$ | 20 | $ | 33 | ||||
| Additions for tax positions of the current year |
3 | 6 | ||||||
| Additions for tax positions of prior years |
1 | 1 | ||||||
| Reductions for tax positions of prior years |
(4 | ) | (4 | ) | ||||
| Settlements |
— | — | ||||||
| Statute of limitations expiration |
(1 | ) | (1 | ) | ||||
| Foreign currency translation |
2 | 2 | ||||||
|
|
|
|
|
|||||
F-31
Table of Contents
| As Previously Reported |
As Revised | |||||||
| Balance at December 31, 2011 |
21 | 37 | ||||||
| Additions for tax positions of the current year |
3 | 5 | ||||||
| Additions for tax positions of prior years |
2 | 2 | ||||||
| Reductions for tax positions of prior years |
(1 | ) | (1 | ) | ||||
| Settlements |
— | — | ||||||
| Statute of limitations expiration |
(1 | ) | (1 | ) | ||||
| Foreign currency translation |
(4 | ) | (4 | ) | ||||
|
|
|
|
|
|||||
| Balance at December 31, 2012 |
$ | 20 | $ | 38 | ||||
|
|
|
|
|
|||||
A reconciliation of the beginning and ending amount of unrecognized tax benefits is as follows:
| Unrecognized Tax Benefits, December 31, 2011 |
$ | 37 | ||
| Additions for tax positions of the current year |
5 | |||
| Additions for tax positions of prior years |
2 | |||
| Reductions for tax positions of prior years |
(1 | ) | ||
| Statute of limitations expiration |
(1 | ) | ||
| Foreign currency translation |
(4 | ) | ||
|
|
|
|||
| Balance at December 31, 2012 |
38 | |||
| Additions for tax positions of the current year |
6 | |||
| Additions for tax positions of prior years |
14 | |||
| Statute of limitations expiration |
(2 | ) | ||
| Foreign currency translation |
(6 | ) | ||
|
|
|
|||
| Balance at December 31, 2013 |
$ | 50 | ||
|
|
|
|||
Liabilities for unrecognized tax benefits as of December 31, 2013 relate to various foreign jurisdictions. If recognized, all of the unrecognized tax benefits as of December 31, 2013 would reduce the Company’s effective tax rate.
The Company recognizes interest and penalties related to unrecognized tax benefits in the provision for income taxes. As of December 31, 2013 and 2012, the Company has recorded a liability of approximately $4 and $1, respectively, for interest and penalties.
The Company files income tax returns in the U.S. federal jurisdiction and various states and foreign jurisdictions. In the normal course of business the Company is subject to examination by taxing authorities throughout the world with examinations ongoing in a few of those jurisdictions including Canada, Germany, India, Italy and Korea. Such major jurisdictions with open tax years are as follows: United States 2006-2013, Germany 2007-2013, Italy 2004-2013, Switzerland 2009-2013, Singapore 2006-2013, Japan 2007-2013, Thailand 2010-2013, Hong Kong 2008-2013, Canada 2009-2013 and Brazil 2008-2013. Unrecognized tax benefits are not expected to change significantly over the next 12 months.
The Company is recognizing the earnings of non-U.S. operations currently in its U.S. consolidated income tax return as of December 31, 2013 and is expecting that all earnings will be repatriated to the U.S. The Company has accrued the incremental tax expense expected to be incurred upon the repatriation of these earnings. In addition, the Company has certain intercompany arrangements that, if settled, may trigger taxable gains or losses based on foreign currency exchange rates in place at the time of settlement. As a result of the conditions related to the Company’s ability to continue as a going concern described in Note 1, in the fourth quarter of 2013, the Company is no longer able to assert permanent reinvestment with respect to certain intercompany arrangements previously considered indefinite, and is now recording deferred taxes on the foreign currency translation impact. This change in assertion resulted in a tax expense of $86 in the period the change occurred.
F-32
Table of Contents
11. Commitments and Contingencies
Non-Environmental Legal Matters
The Company is subject to various claims and legal actions arising in the ordinary course of business, none of which management believes has a reasonable possibility of having a material adverse effect on the Company’s consolidated financial position, results of operations or liquidity.
Purchase Commitments
The Company has signed multi-year agreements with vendors in order to obtain favorable pricing and terms on products that are necessary for the ongoing operation of its business. Under the terms of these agreements, the Company has committed to contractually specified minimums over the contractual periods. A majority of these contractual commitments are related to the off-take agreement with ASM (see Note 4). As of December 31, 2013, future contractual minimums are as follows:
| Year |
Total | |||
| 2014 |
$ | 125 | ||
| 2015 |
122 | |||
| 2016 |
94 | |||
| 2017 |
94 | |||
| 2018 |
94 | |||
| 2019 and beyond |
750 | |||
|
|
|
|||
| Total minimum payments |
1,279 | |||
| Less: Amount representing interest |
(217 | ) | ||
|
|
|
|||
| Present value of minimum payments |
$ | 1,062 | ||
|
|
|
|||
Environmental Matters
The Company is involved in certain remediation actions to clean up hazardous wastes as required by federal and state laws. Liabilities for remediation costs at each site are based on the Company’s best estimate of discounted future costs. As of both December 31, 2013 and 2012, the Company had recognized obligations of $6 for remediation costs at the Company’s manufacturing facilities and offsite landfills. These amounts are included in “Other long-term liabilities” in the Consolidated Balance Sheets.
Waterford, NY Site
The Company currently owns and operates a manufacturing site in Waterford, NY. In 1988, a consent decree was signed with the State of New York which requires recovery of groundwater at the site to contain migration of specified contaminants in the groundwater. A groundwater pump and treat system and groundwater monitoring program are currently operational to implement the requirements of this consent decree.
Due to the long-term nature of the project and the uncertainty inherent in estimating future costs of implementing this program, this liability was recorded at its net present value of $3, which assumes a 9% discount rate and a time period of 50 years. The undiscounted liability, which is expected to be paid over the next 50 years, is approximately $15. Over the next five years the Company expects to make ratable payments totaling $2.
12. Pension and Postretirement Benefits
Domestic Pension Plans
The Company’s U.S. defined benefit plan provides benefits to substantially all U.S. employees based on a formula recognizing length of service and final average earnings. For grandfathered employees, the formula is based on the greater of career earnings or final average earnings. Certain benefit provisions are subject to
F-33
Table of Contents
collective bargaining with U.S. labor unions. Effective August 31, 2012, the benefits under the U.S. defined benefit plan were frozen for all U.S. salaried exempt employees and effective December 31, 2013, these benefits were frozen for non-grandfathered employees at two locations covered by a collective bargaining agreement.
Substantially all U.S. employees may also participate in the Company’s defined contribution plan. Under this plan, eligible employees may invest a portion of their earnings, with the Company matching up to a maximum of 5% of the employees’ annual earnings . In conjunction with the freeze of the U.S. pension benefit, the Company enhanced its defined contribution plan for impacted employees by providing a Company match up to 5% of the eligible compensation. The Company also provides an annual retirement contribution, which is a contribution that will be deposited in the accounts of eligible employees each year based on years of service. Finally, the Company also instituted an achievement match, which is a contribution that will be deposited into the accounts of eligible employees each year if global incentive targets are achieved.
Foreign Pension Plans
Outside the U.S., the Company maintains its principal defined benefit pension plans in Germany, Japan and Switzerland (collectively, Foreign or Foreign Pension Plans). The Company maintains additional defined benefit pension plans in various other locations. These additional plans are not significant and are excluded from the disclosures presented below.
The Company’s defined benefit pension plans in Germany cover substantially all of its employees. These plans are not funded and benefits are paid from the Company to retirees directly. The benefits are based on years of service and the employee’s final pensionable salary, as defined by the plan. The benefits are not vested until the employee retires at a minimum eligible age of 60 years.
The Company’s defined benefit pension plan in Japan covers substantially all of its employees. The benefits of the Company’s Japanese pension plan are based on years of service and the employee’s three highest years of compensation during the last 10 years of employment. The pension plan assets are managed by a variety of Japanese financial institutions.
In Switzerland, the Company’s defined benefit plan provides pension, death and disability benefits to substantially all employees. Benefits are based on participants’ accumulated account balances plus an annuity conversion factor established by the Swiss government. The pension liability is administered through a collective foundation.
The Company also offers a defined benefit pension plan to its employees in the Netherlands. The Company’s pension expense associated with contributions to these pension plans was $1 for the year ended December 31, 2013 and less than $1 for the years ended December 31, 2012 and 2011, respectively.
Postretirement Plans
The Company’s U.S. health and welfare plan provides benefits to pay medical expenses, dental expenses, flexible spending accounts for otherwise unreimbursed expenses, short-term disability benefits, and life and accidental death and dismemberment insurance benefits. Retirees share in the cost of healthcare benefits. The Company funds retiree healthcare benefits on a pay-as-you-go basis. The Company uses a December 31 measurement date for this plan. The Company also provides non-pension postretirement benefit plans to certain Brazilian associates. The Brazilian plan became effective in 2012 as a result of a change in certain regulations, and provides retirees with access to medical benefits, with the retiree being responsible for 100% of the premiums.
F-34
Table of Contents
The following table presents the change in benefit obligation, change in plan assets and components of funded status for the Company’s defined benefit pension and non-pension postretirement benefit plans for the years ended December 31:
| Pension Benefits | Non-Pension Postretirement Benefits |
|||||||||||||||||||||||||||||||
| 2013 | 2012 | 2013 | 2012 | |||||||||||||||||||||||||||||
| U.S. Plans |
Non-U.S. Plans |
U.S. Plans |
Non-U.S. Plans |
U.S. Plans |
Non-U.S. Plans |
U.S. Plans |
Non-U.S. Plans |
|||||||||||||||||||||||||
| Change in Benefit Obligation |
||||||||||||||||||||||||||||||||
| Benefit obligation at beginning of year |
$ | 178 | $ | 162 | $ | 153 | $ | 132 | $ | 91 | $ | — | $ | 104 | $ | — | ||||||||||||||||
| Service cost |
9 | 7 | 18 | 6 | 2 | — | 2 | — | ||||||||||||||||||||||||
| Interest cost |
8 | 4 | 7 | 4 | 4 | — | 5 | — | ||||||||||||||||||||||||
| Actuarial (gains) losses |
(28 | ) | 8 | 20 | 32 | (13 | ) | (1 | ) | (17 | ) | — | ||||||||||||||||||||
| Foreign currency exchange rate changes |
— | (6 | ) | — | (6 | ) | — | — | — | — | ||||||||||||||||||||||
| Benefits paid |
(3 | ) | (4 | ) | (1 | ) | (6 | ) | (3 | ) | — | (3 | ) | — | ||||||||||||||||||
| Plan amendments |
3 | — | — | — | — | 2 | — | — | ||||||||||||||||||||||||
| Plan curtailments |
(3 | ) | (3 | ) | (19 | ) | — | — | — | — | — | |||||||||||||||||||||
| Plan settlements |
— | (12 | ) | — | — | — | — | — | — | |||||||||||||||||||||||
|
|
|
|
|
|
|
|
|
|
|
|
|
|
|
|
|
|||||||||||||||||
| Benefit obligation at end of year |
164 | 156 | 178 | 162 | 81 | 1 | 91 | — | ||||||||||||||||||||||||
| Change in Plan Assets |
||||||||||||||||||||||||||||||||
| Fair value of plan assets at beginning of year |
91 | 34 | 70 | 33 | — | — | — | — | ||||||||||||||||||||||||
| Actual return on plan assets |
13 | 6 | 9 | 3 | — | — | — | — | ||||||||||||||||||||||||
| Foreign currency exchange rate changes |
— | (4 | ) | — | (2 | ) | — | — | — | — | ||||||||||||||||||||||
| Employer contributions |
4 | 4 | 13 | 6 | 3 | — | 3 | — | ||||||||||||||||||||||||
| Benefits paid |
(3 | ) | (4 | ) | (1 | ) | (6 | ) | (3 | ) | — | (3 | ) | — | ||||||||||||||||||
| Plan settlements |
— | (12 | ) | — | — | — | — | — | — | |||||||||||||||||||||||
|
|
|
|
|
|
|
|
|
|
|
|
|
|
|
|
|
|||||||||||||||||
| Fair value of plan assets at end of year |
105 | 24 | 91 | 34 | — | — | — | — | ||||||||||||||||||||||||
|
|
|
|
|
|
|
|
|
|
|
|
|
|
|
|
|
|||||||||||||||||
| Funded status of the plan at end of year |
$ | (59 | ) | $ | (132 | ) | $ | (87 | ) | $ | (128 | ) | $ | (81 | ) | $ | (1 | ) | $ | (91 | ) | $ | — | |||||||||
|
|
|
|
|
|
|
|
|
|
|
|
|
|
|
|
|
|||||||||||||||||
| Amounts recognized in the Consolidated Balance Sheets at December 31 consist of: |
||||||||||||||||||||||||||||||||
| Other current liabilities |
$ | — | $ | (3 | ) | $ | — | $ | (2 | ) | $ | (4 | ) | $ | — | $ | (3 | ) | $ | — | ||||||||||||
| Long-term pension and post employment benefit obligations |
(59 | ) | (129 | ) | (87 | ) | (126 | ) | (77 | ) | (1 | ) | (88 | ) | — | |||||||||||||||||
| Accumulated other comprehensive loss (income) |
5 | 33 | 26 | 31 | (1 | ) | — | 8 | — | |||||||||||||||||||||||
|
|
|
|
|
|
|
|
|
|
|
|
|
|
|
|
|
|||||||||||||||||
| Net amounts recognized |
$ | (54 | ) | $ | (99 | ) | $ | (61 | ) | $ | (97 | ) | $ | (82 | ) | $ | (1 | ) | $ | (83 | ) | $ | — | |||||||||
| Amounts recognized in Accumulated other comprehensive income at December 31 consist of: |
||||||||||||||||||||||||||||||||
| Net actuarial (gain) loss |
$ | (12 | ) | $ | 35 | $ | 23 | $ | 36 | $ | (19 | ) | $ | (1 | ) | $ | (6 | ) | $ | — | ||||||||||||
| Net prior service cost (benefit) |
2 | (3 | ) | (1 | ) | (4 | ) | 8 | 2 | 9 | — | |||||||||||||||||||||
| Deferred income taxes |
15 | 1 | 4 | (1 | ) | 10 | (1 | ) | 5 | — | ||||||||||||||||||||||
|
|
|
|
|
|
|
|
|
|
|
|
|
|
|
|
|
|||||||||||||||||
| Net amounts recognized |
$ | 5 | $ | 33 | $ | 26 | $ | 31 | $ | (1 | ) | $ | — | $ | 8 | $ | — | |||||||||||||||
| Accumulated benefit obligation |
$ | 153 | $ | 149 | $ | 161 | $ | 153 | ||||||||||||||||||||||||
| Accumulated benefit obligation for funded plans |
135 | 54 | 140 | 78 | ||||||||||||||||||||||||||||
| Pension plans with underfunded or non-funded accumulated benefit obligations at December 31: |
||||||||||||||||||||||||||||||||
| Aggregate projected benefit obligation |
$ | 164 | $ | 156 | $ | 178 | $ | 162 | ||||||||||||||||||||||||
| Aggregate accumulated benefit obligation |
153 | 149 | 161 | 153 | ||||||||||||||||||||||||||||
| Aggregate fair value of plan assets |
105 | 24 | 91 | 34 | ||||||||||||||||||||||||||||
| Pension plans with projected benefit obligations in excess of plan assets at December 31: |
||||||||||||||||||||||||||||||||
| Aggregate projected benefit obligation |
$ | 164 | $ | 156 | $ | 178 | $ | 162 | ||||||||||||||||||||||||
| Aggregate fair value of plan assets |
105 | 24 | 91 | 34 | ||||||||||||||||||||||||||||
F-35
Table of Contents
For U.S. pension plans, the net accumulated unrecognized losses decreased by approximately $21 due to additional unrecognized actuarial gains of $24, net of tax, as a result of the increase in the discount rate at December 31, 2013. Partially offset by $3 relating to U.S. plan amendments that extended certain benefit provisions scheduled to expire on June 30, 2013 into 2014 as well as reflecting changes as a result of union negotiations, which included freezing pension benefits for non-grandfathered employees and providing enhanced benefits to those employees under the savings plan beginning in 2014 and allowing grandfathered employees the option of electing to maintain their current pension benefits or have their pension benefits frozen and provide a similar enhanced benefits in the savings plan as the non-grandfathered employees. The net accumulated unrecognized losses relating to the Non-U.S. pension plans increased by $2, net of tax, due to additional unrecognized actuarial losses of $6, net of tax, as a result of the decrease in the discount rate at December 31, 2013. Partially offset by amortization of net losses of $2 and prior service cost of $2.
The foreign currency impact reflected in these roll-forward tables are primarily for changes in the euro versus the U.S. dollar.
Following are the components of net pension and postretirement expense recognized for the years ended December 31:
| Pension Benefits | ||||||||||||||||||||||||
| U.S. Plans | Non-U.S. Plans | |||||||||||||||||||||||
| 2013 | 2012 | 2011 | 2013 | 2012 | 2011 | |||||||||||||||||||
| Service cost |
$ | 9 | $ | 18 | $ | 19 | $ | 7 | $ | 6 | $ | 7 | ||||||||||||
| Interest cost on projected benefit obligation |
8 | 7 | 7 | 4 | 4 | 4 | ||||||||||||||||||
| Expected return on assets |
(7 | ) | (6 | ) | (5 | ) | (1 | ) | (1 | ) | (1 | ) | ||||||||||||
| Amortization of prior service benefit |
— | — | (1 | ) | — | — | — | |||||||||||||||||
| Amortization of net losses |
— | 1 | — | 1 | — | 1 | ||||||||||||||||||
| Curtailment gain |
(3 | ) | (1 | ) | (6 | ) | (1 | ) | — | — | ||||||||||||||
| Settlement loss |
— | — | — | 1 | — | — | ||||||||||||||||||
|
|
|
|
|
|
|
|
|
|
|
|
|
|||||||||||||
| Net expense |
$ | 7 | $ | 19 | $ | 14 | $ | 11 | $ | 9 | $ | 11 | ||||||||||||
|
|
|
|
|
|
|
|
|
|
|
|
|
|||||||||||||
| Non-Pension Postretirement Benefits | ||||||||||||||||||||||||
| U.S. Plans | Non-U.S. Plans | |||||||||||||||||||||||
| 2013 | 2012 | 2011 | 2013 | 2012 | 2011 | |||||||||||||||||||
| Service cost |
$ | 2 | $ | 2 | $ | 1 | $ | — | $ | — | $ | — | ||||||||||||
| Interest cost on projected benefit obligation |
4 | 5 | 5 | — | — | — | ||||||||||||||||||
| Amortization of prior service cost |
1 | 2 | 1 | — | — | — | ||||||||||||||||||
|
|
|
|
|
|
|
|
|
|
|
|
|
|||||||||||||
| Net expense |
$ | 7 | $ | 9 | $ | 7 | $ | — | $ | — | $ | — | ||||||||||||
|
|
|
|
|
|
|
|
|
|
|
|
|
|||||||||||||
The following amounts were recognized in “Other comprehensive loss” during the year ended December 31, 2013:
| Pension Benefits |
Non-Pension Postretirement Benefits |
Total | ||||||||||||||||||||||
| U.S. Plans |
Non-U.S. Plans |
U.S. Plans |
Non-U.S. Plans |
U.S. Plans |
Non-U.S. Plans |
|||||||||||||||||||
| Net actuarial (gains) losses arising during the year |
$ | (34 | ) | $ | 4 | $ | (13 | ) | $ | (1 | ) | $ | (47 | ) | $ | 3 | ||||||||
| Prior service cost from plan amendments |
3 | — | — | 2 | 3 | 2 | ||||||||||||||||||
| Amortization of prior service cost |
— | (2 | ) | (1 | ) | — | (1 | ) | (2 | ) | ||||||||||||||
| Amortization of net losses |
— | (2 | ) | — | — | — | (2 | ) | ||||||||||||||||
|
|
|
|
|
|
|
|
|
|
|
|
|
|||||||||||||
| (Gain) loss recognized in other comprehensive loss |
(31 | ) | — | (14 | ) | 1 | (45 | ) | 1 | |||||||||||||||
| Deferred income taxes |
10 | 2 | 5 | (1 | ) | 15 | 1 | |||||||||||||||||
|
|
|
|
|
|
|
|
|
|
|
|
|
|||||||||||||
| (Gain) loss recognized in other comprehensive loss, net of tax |
$ | (21 | ) | $ | 2 | $ | (9 | ) | $ | — | $ | (30 | ) | $ | 2 | |||||||||
|
|
|
|
|
|
|
|
|
|
|
|
|
|||||||||||||
F-36
Table of Contents
The amounts in “Accumulated other comprehensive loss” that are expected to be recognized as components of net periodic benefit cost (benefit) during the next fiscal year are as follows:
| Pension Benefits | Non-Pension Postretirement Benefits |
Total | ||||||||||||||||||||||
| U.S. Plans |
Non-U.S. Plans |
U.S. Plans |
Non-U.S. Plans |
U.S. Plans |
Non-U.S. Plans |
|||||||||||||||||||
| Prior service cost |
$ | — | $ | — | $ | 1 | $ | — | $ | 1 | $ | — | ||||||||||||
| Net actuarial loss (gain) |
— | 1 | (1 | ) | — | (1 | ) | 1 | ||||||||||||||||
|
|
|
|
|
|
|
|
|
|
|
|
|
|||||||||||||
Determination of Actuarial Assumptions
The Company’s actuarial assumptions are determined based on the demographics of the population, target asset allocations for funded plans, regional economic trends, statutory requirements and other factors that could impact the benefit obligation and plan assets. For our European plans, these assumptions are set by country, as the plans within these countries have similar demographics, and are impacted by the same regional economic trends and statutory requirements.
The discount rates selected reflect the rate at which pension obligations could be effectively settled. The Company selects the discount rates based on cash flow models using the yields of high-grade corporate bonds or the local equivalent with maturities consistent with the Company’s anticipated cash flow projections.
The expected rates of future compensation level increases are based on salary and wage trends in the chemical and other similar industries, as well as the Company’s specific long-term compensation targets by country. Input is obtained from the Company’s internal Human Resources group and from outside actuaries. These rates include components for wage rate inflation and merit increases.
The expected long-term rates of return on plan assets are determined based on the plans’ current and projected asset mix. To determine the expected overall long-term rate of return on assets, the Company takes into account the rates on long-term debt investments held within the portfolio, as well as expected trends in the equity markets, for plans including equity securities. Peer data and historical returns are reviewed and the Company consults with its actuaries, as well as the Plan’s investment advisors, to confirm that the Company’s assumptions are reasonable.
The weighted average rates used to determine the benefit obligations were as follows at December 31:
| Pension Benefits | Non-Pension Postretirement Benefits | |||||||||||||||||||||||||||||||
| 2013 | 2012 | 2013 | 2012 | |||||||||||||||||||||||||||||
| U.S. Plans |
Non-U.S. Plans |
U.S. Plans |
Non-U.S. Plans |
U.S. Plans |
Non-U.S. Plans |
U.S. Plans |
Non-U.S. Plans |
|||||||||||||||||||||||||
| Discount rate |
5.1 | % | 2.7 | % | 4.2 | % | 2.4 | % | 4.8 | % | 12.0 | % | 4.0 | % | — | |||||||||||||||||
| Rate of increase in future compensation levels |
— | 2.6 | % | 3.5 | % | 2.4 | % | — | — | — | — | |||||||||||||||||||||
| The weighted average assumed health care cost trend rates are as follows at December 31: |
||||||||||||||||||||||||||||||||
| Health care cost trend rate assumed for next year |
— | — | — | — | 7.3 | % | 11.5 | % | 7.5 | % | — | |||||||||||||||||||||
| Rate to which the cost trend rate is assumed to decline (the ultimate trend rate) |
— | — | — | — | 4.5 | % | 7.3 | % | 4.5 | % | — | |||||||||||||||||||||
| Year that the rate reaches the ultimate trend rate |
— | — | — | — | 2023 | 2022 | 2023 | — | ||||||||||||||||||||||||
F-37
Table of Contents
The weighted average rates used to determine net periodic pension expense (benefit) were as follows for the years ended December 31:
| Pension Benefits | ||||||||||||||||||||||||
| U.S. Plans | Non-U.S. Plans | |||||||||||||||||||||||
| 2013 | 2012 | 2011 | 2013 | 2012 | 2011 | |||||||||||||||||||
| Discount rate |
4.2 | % | 5.0 | % | 5.6 | % | 2.4 | % | 3.0 | % | 2.6 | % | ||||||||||||
| Rate of increase in future compensation levels |
3.5 | % | 4.3 | % | 4.4 | % | 2.4 | % | 2.3 | % | 2.1 | % | ||||||||||||
| Expected long-term rate of return on plan assets |
7.5 | % | 7.5 | % | 8.0 | % | 3.3 | % | 2.7 | % | 2.7 | % | ||||||||||||
| Non-Pension Postretirement Benefits | ||||||||||||||||||||||||
| U.S. Plans | Non-U.S. Plans | |||||||||||||||||||||||
| 2013 | 2012 | 2011 | 2013 | 2012 | 2011 | |||||||||||||||||||
| Discount rate |
4.0 | % | 4.6 | % | 5.1 | % | — | — | — | |||||||||||||||
A one-percentage-point change in the assumed health care cost trend rates would change the projected benefit obligation for international non-pension postretirement benefits by $3 and service cost and interest cost by a negligible amount. The impact on U.S. plans is negligible.
Pension Investment Policies and Strategies
The Company’s investment strategy for the assets of its North American defined benefit pension plans is to maximize the long-term return on plan assets using a mix of equities and fixed income investments with a prudent level of risk. Risk tolerance is established through careful consideration of plan liabilities, plan funded status and expected timing of future cash flow requirements. The investment portfolio contains a diversified blend of equity and fixed-income investments. For U.S. plans, equity investments are also diversified across U.S. and international stocks, as well as growth, value and small and large capitalization investments. Investment risk and performance is measured and monitored on an ongoing basis through periodic investment portfolio reviews, annual liability measurements and periodic asset and liability studies.
The Company periodically reviews its target allocation of North American plan assets among the various asset classes. The targeted allocations are based on anticipated asset performance, discussions with investment professionals and on the projected timing of future benefit payments. In 2012 the U.S. Asset Investment Policy was updated to reflect an update in the Company’s investment strategy to invest in long-term debt securities that more closely match the projected future cash flows of the Plan.
The Company observes local regulations and customs governing its European pension plans in determining asset allocations, which generally require a blended weight leaning toward more fixed income securities, including government bonds.
| Actual | Target 2014 |
|||||||||||
| 2013 | 2012 | |||||||||||
| Weighted average allocations of U.S. pension plan assets at December 31: |
||||||||||||
| Equity securities |
60 | % | 59 | % | 59 | % | ||||||
| Debt securities |
38 | % | 41 | % | 41 | % | ||||||
| Cash, short-term investments and other |
2 | % | — | — | ||||||||
|
|
|
|
|
|
|
|||||||
| Total |
100 | % | 100 | % | 100 | % | ||||||
|
|
|
|
|
|
|
|||||||
| Weighted average allocations of non-U.S. pension plan assets at December 31: |
||||||||||||
| Equity securities |
33 | % | 37 | % | 33 | % | ||||||
| Debt securities |
19 | % | 38 | % | 19 | % | ||||||
| Cash, short-term investments and other |
48 | % | 25 | % | 48 | % | ||||||
|
|
|
|
|
|
|
|||||||
| Total |
100 | % | 100 | % | 100 | % | ||||||
|
|
|
|
|
|
|
|||||||
F-38
Table of Contents
Fair Value of Plan Assets
Fair value is the exchange price that would be received for an asset or paid to transfer a liability (an exit price) in the principal or most advantageous market for the asset or liability in an orderly transaction between market participants on the measurement date. Fair value measurement provisions establish a fair value hierarchy which requires an entity to maximize the use of observable inputs and minimize the use of unobservable inputs when measuring fair value. This guidance describes three levels of inputs that may be used to measure fair value:
| • | Level 1: Inputs are quoted prices (unadjusted) for identical assets or liabilities in active markets. |
| • | Level 2: Pricing inputs are other than quoted prices in active markets included in Level 1, which are either directly or indirectly observable as of the reported date. Level 2 equity securities are primarily in pooled asset and mutual funds and are valued based on underlying net asset value multiplied by the number of shares held. |
| • | Level 3: Unobservable inputs that are supported by little or no market activity and are developed based on the best information available in the circumstances. For example, inputs derived through extrapolation or interpolation that cannot be corroborated by observable market data. |
The following table presents U.S. pension plan investments measured at fair value on a recurring basis as of December 31, 2013 and 2012:
| Fair Value Measurements Using | ||||||||||||||||||||||||||||||||
| 2013 | 2012 | |||||||||||||||||||||||||||||||
| Quoted Prices in Active Markets for Identical Assets (Level 1) |
Significant Other Observable Inputs (Level 2) |
Unobservable Inputs (Level 3) |
Total | Quoted Prices in Active Markets for Identical Assets (Level 1) |
Significant Other Observable Inputs (Level 2) |
Unobservable Inputs (Level 3) |
Total | |||||||||||||||||||||||||
| Large cap equity funds(a) |
$ | — | $ | 26 | $ | — | $ | 26 | $ | — | $ | 22 | $ | — | $ | 22 | ||||||||||||||||
| Small/mid cap equity funds(a) |
— | 18 | — | 18 | — | 15 | — | 15 | ||||||||||||||||||||||||
| Other international equity(a) |
— | 19 | — | 19 | — | 17 | — | 17 | ||||||||||||||||||||||||
| Debt securities/fixed income(b) |
— | 41 | — | 41 | — | 37 | — | 37 | ||||||||||||||||||||||||
| Cash, money market and other(c) |
— | 1 | — | 1 | — | — | — | — | ||||||||||||||||||||||||
|
|
|
|
|
|
|
|
|
|
|
|
|
|
|
|
|
|||||||||||||||||
| Total |
$ | — | $ | 105 | $ | — | $ | 105 | $ | — | $ | 91 | $ | — | $ | 91 | ||||||||||||||||
|
|
|
|
|
|
|
|
|
|
|
|
|
|
|
|
|
|||||||||||||||||
F-39
Table of Contents
The following table presents non-U.S. pension plan investments measured at fair value on a recurring basis as of December 31, 2013 and 2012:
| Fair Value Measurements Using | ||||||||||||||||||||||||||||||||
| 2013 | 2012 | |||||||||||||||||||||||||||||||
| Quoted Prices in Active Markets for Identical Assets (Level 1) |
Significant Other Observable Inputs (Level 2) |
Unobservable Inputs (Level 3) |
Total | Quoted Prices in Active Markets for Identical Assets (Level 1) |
Significant Other Observable Inputs (Level 2) |
Unobservable Input (Level 3) |
Total | |||||||||||||||||||||||||
| Other international equity(a) |
$ | — | $ | 11 | $ | — | $ | 11 | $ | — | $ | 14 | $ | — | $ | 14 | ||||||||||||||||
| Debt securities/fixed income(a) |
— | 7 | — | 7 | — | 13 | — | 13 | ||||||||||||||||||||||||
| Pooled insurance products with fixed income guarantee(a) |
— | 5 | — | 5 | — | 6 | — | 6 | ||||||||||||||||||||||||
| Cash, money market and other(c) |
— | 1 | — | 1 | — | 1 | — | 1 | ||||||||||||||||||||||||
|
|
|
|
|
|
|
|
|
|
|
|
|
|
|
|
|
|||||||||||||||||
| Total |
$ | — | $ | 24 | $ | — | $ | 24 | $ | — | $ | 34 | $ | — | $ | 34 | ||||||||||||||||
|
|
|
|
|
|
|
|
|
|
|
|
|
|
|
|
|
|||||||||||||||||
| (a) | Level 2 equity securities are primarily in pooled asset and mutual funds and are valued based on underlying net asset value multiplied by the number of shares held. |
| (b) | Level 2 fixed income securities are valued using a market approach that includes various valuation techniques and sources, primarily using matrix/market corroborated pricing based on observable inputs including yield curves and indices. |
| (c) | Cash, money market and other securities include mutual funds, certificates of deposit and other short-term cash investments for which the share price is $1 or book value is assumed to equal fair value due to the short duration of the investment term. |
Projections of Plan Contributions and Benefit Payments
The Company expects to make contributions totaling $20 to its defined benefit pension plans in 2014.
Estimated future plan benefit payments as of December 31, 2013 are as follows:
| Pension Benefits | Non-Pension Postretirement Benefits |
|||||||||||||||
| Year |
U.S. Plans | Non-U.S. Plans | U.S. Plans | Non-U.S. Plans | ||||||||||||
| 2014 |
$ | 3 | $ | 4 | $ | 4 | $ | — | ||||||||
| 2015 |
4 | 5 | 4 | — | ||||||||||||
| 2016 |
4 | 5 | 5 | — | ||||||||||||
| 2017 |
5 | 6 | 5 | — | ||||||||||||
| 2018 |
6 | 7 | 5 | — | ||||||||||||
| 2019-2023 |
48 | 37 | 29 | — | ||||||||||||
13. Segment and Geographic Information
The Company’s businesses are based on the products that the Company offers and the markets that it serves. At December 31, 2013, the Company’s two businesses are managed as one reportable segment; however, given the differing technology and marketing strategies, the Company reports the results for the Silicones and Quartz businesses separately.
F-40
Table of Contents
The Silicones business is engaged in the manufacture, sale and distribution of silanes, specialty silicones and urethane additives. The Quartz business is engaged in the manufacture, sale and distribution of high-purity fused quartz and ceramic materials. The Company’s businesses are organized based on the nature of the products they produce.
The Company’s organizational structure continues to evolve. It is also continuing to refine its business and operating structure to better align its services to its customers and improve its cost position, while continuing to invest in global growth opportunities.
Following are net sales and Segment EBITDA (earnings before interest, income taxes, depreciation and amortization) by business. Segment EBITDA is defined as EBITDA adjusted for certain non-cash and certain other income and expenses. Segment EBITDA is the primary performance measure used by the Company’s senior management, the chief operating decision-maker and the board of directors to evaluate operating results and allocate capital resources among businesses. Segment EBITDA is also the profitability measure used to set management and executive incentive compensation goals. Other is primarily general and administrative expenses that are not allocated to the businesses, such as shared service and administrative functions.
Net Sales(1):
| Year ended December 31, | ||||||||||||
| 2013 | 2012 | 2011 | ||||||||||
| Silicones |
$ | 2,197 | $ | 2,136 | $ | 2,310 | ||||||
| Quartz |
201 | 221 | 327 | |||||||||
|
|
|
|
|
|
|
|||||||
| Total |
$ | 2,398 | $ | 2,357 | $ | 2,637 | ||||||
|
|
|
|
|
|
|
|||||||
Segment EBITDA:
| Year ended December 31, | ||||||||||||
| 2013 | 2012 | 2011 | ||||||||||
| Silicones(2) |
$ | 248 | $ | 206 | $ | 291 | ||||||
| Quartz |
37 | 44 | 101 | |||||||||
| Other |
(47 | ) | (36 | ) | (13 | ) | ||||||
Depreciation and Amortization:
| Year ended December 31, | ||||||||||||
| 2013 | 2012 | 2011 | ||||||||||
| Silicones |
$ | 150 | $ | 162 | $ | 170 | ||||||
| Quartz |
21 | 25 | 27 | |||||||||
|
|
|
|
|
|
|
|||||||
| Total |
$ | 171 | $ | 187 | $ | 197 | ||||||
|
|
|
|
|
|
|
|||||||
Capital Expenditures:
| Year ended December 31, | ||||||||||||
| 2013 | 2012 | 2011 | ||||||||||
| Silicones |
$ | 73 | $ | 80 | $ | 89 | ||||||
| Quartz |
18 | 18 | 27 | |||||||||
|
|
|
|
|
|
|
|||||||
| Total |
$ | 91 | $ | 98 | $ | 116 | ||||||
|
|
|
|
|
|
|
|||||||
F-41
Table of Contents
Total Assets(3):
| As of December 31, | ||||||||
| 2013 | 2012 | |||||||
| Silicones |
$ | 2,428 | $ | 2,615 | ||||
| Quartz |
257 | 256 | ||||||
| Other |
9 | 33 | ||||||
|
|
|
|
|
|||||
| Total |
$ | 2,694 | $ | 2,904 | ||||
|
|
|
|
|
|||||
| (1) | Interbusiness sales are not significant and, as such, are eliminated within the selling business. |
| (2) | Included in the Silicones business’ Segment EBITDA are “Earnings (losses) from unconsolidated entities, net of taxes” of $3, $5 and $(6) for the years ended December 31, 2013, 2012 and 2011, respectively. |
| (3) | Deferred income taxes are included within other as reconciling amounts to the Company’s total assets as presented on the Consolidated Balance Sheets. |
Reconciliation of Segment EBITDA to Net Loss:
| Year ended December 31, | ||||||||||||
| 2013 | 2012 | 2011 | ||||||||||
| Segment EBITDA: |
||||||||||||
| Silicones |
$ | 248 | $ | 206 | $ | 291 | ||||||
| Quartz |
37 | 44 | 101 | |||||||||
| Other |
(47 | ) | (36 | ) | (13 | ) | ||||||
| Reconciliation: |
||||||||||||
| Items not included in Segment EBITDA: |
||||||||||||
| Non-cash charges |
(12 | ) | (7 | ) | (14 | ) | ||||||
| Restructuring and other costs |
(21 | ) | (43 | ) | (33 | ) | ||||||
|
|
|
|
|
|
|
|||||||
| Total adjustments |
(33 | ) | (50 | ) | (47 | ) | ||||||
| Interest expense, net |
(394 | ) | (277 | ) | (256 | ) | ||||||
| Income tax expense |
(104 | ) | (8 | ) | (27 | ) | ||||||
| Depreciation and amortization |
(171 | ) | (187 | ) | (197 | ) | ||||||
| (Loss) gain on extinguishment and exchange of debt |
— | (57 | ) | 7 | ||||||||
|
|
|
|
|
|
|
|||||||
| Net loss attributable to Momentive Performance Materials Inc. |
(464 | ) | (365 | ) | (141 | ) | ||||||
| Net income attributable to noncontrolling interest |
— | — | 1 | |||||||||
|
|
|
|
|
|
|
|||||||
| Net loss |
$ | (464 | ) | $ | (365 | ) | $ | (140 | ) | |||
|
|
|
|
|
|
|
|||||||
Items Not Included in Segment EBITDA
Not included in Segment EBITDA are certain non-cash and other income and expenses. Non-cash charges primarily represent stock-based compensation expense, unrealized derivative and foreign exchange gains and losses and asset disposal gains and losses. Restructuring and other costs primarily include expenses from the Company’s restructuring and cost optimization programs and management fees paid to its owner.
Geographic Information:
The following tables show data by geographic area. Net sales are based on the location of the operation recording the final sale to the customer. Total long-lived assets consist of property and equipment, net of accumulated depreciation, intangible assets, net of accumulated amortization and goodwill.
F-42
Table of Contents
Net Sales(1):
| Year ended December 31, | ||||||||||||
| 2013 | 2012 | 2011 | ||||||||||
| United States |
$ | 775 | $ | 744 | $ | 847 | ||||||
| Germany |
657 | 644 | 711 | |||||||||
| China |
320 | 293 | 471 | |||||||||
| Japan |
215 | 263 | 346 | |||||||||
| Other International |
431 | 413 | 262 | |||||||||
|
|
|
|
|
|
|
|||||||
| Total |
$ | 2,398 | $ | 2,357 | $ | 2,637 | ||||||
|
|
|
|
|
|
|
|||||||
| (1) | Sales are attributed to the country in which the individual business locations reside. |
Long-Lived Assets:
| As of December 31, | ||||||||
| 2013 | 2012 | |||||||
| United States |
$ | 522 | $ | 539 | ||||
| Germany |
410 | 406 | ||||||
| China |
374 | 475 | ||||||
| Japan |
147 | 159 | ||||||
| Other International |
337 | 342 | ||||||
|
|
|
|
|
|||||
| Total |
$ | 1,790 | $ | 1,921 | ||||
|
|
|
|
|
|||||
14. Changes in Accumulated Other Comprehensive Income
Following is a summary of changes in “Accumulated other comprehensive income” for the year ended December 31, 2013 and 2012:
| Year Ended December 31, | ||||||||||||||||||||||||
| 2013 | 2012 | |||||||||||||||||||||||
| Defined Benefit Pension and Postretirement Plans |
Foreign Currency Translation Adjustments |
Total | Defined Benefit Pension and Postretirement Plans |
Foreign Currency Translation Adjustments |
Total | |||||||||||||||||||
| Beginning balance |
$ | (65 | ) | $ | 245 | $ | 180 | $ | (46 | ) | $ | 274 | $ | 228 | ||||||||||
| Other comprehensive income (loss) before reclassifications, net of tax |
23 | (6 | ) | 17 | (19 | ) | (29 | ) | (48 | ) | ||||||||||||||
| Amounts reclassified from Accumulated other comprehensive income, net of tax(1) |
5 | — | 5 | — | — | — | ||||||||||||||||||
|
|
|
|
|
|
|
|
|
|
|
|
|
|||||||||||||
| Net other comprehensive income (loss) |
28 | (6 | ) | 22 | (19 | ) | (29 | ) | (48 | ) | ||||||||||||||
|
|
|
|
|
|
|
|
|
|
|
|
|
|||||||||||||
| Ending balance |
$ | (37 | ) | $ | 239 | $ | 202 | $ | (65 | ) | $ | 245 | $ | 180 | ||||||||||
|
|
|
|
|
|
|
|
|
|
|
|
|
|||||||||||||
F-43
Table of Contents
| Amortization of defined benefit pension and other |
Amount Reclassified From Accumulated Other Comprehensive Loss for the Year Ended December 31: |
Location of Reclassified Amount in Income | ||||||||
| 2013 | 2012 | |||||||||
| Prior service costs |
$ | 3 | $ | — | (1) | |||||
| Actuarial losses |
2 | — | (1) | |||||||
|
|
|
|
|
|||||||
| Total before income tax |
5 | — | ||||||||
| Income tax benefit |
— | — | Income tax expense | |||||||
|
|
|
|
|
|||||||
| Total |
$ | 5 | $ | — | ||||||
|
|
|
|
|
|||||||
| (1) | These accumulated other comprehensive income components are included in the computation of net pension and postretirement benefit expense (see Note 12). |
15. Guarantor/Non-Guarantor Subsidiary Financial Information
As of December 31, 2013, the Company had $1,100 in aggregate principal amount of First-Priority Senior Secured Notes, $250 in aggregate principal amount of Senior Secured Notes, $1,161 in aggregate principal amount of Springing Lien Dollar Notes, €133 in aggregate principal amount of Springing Lien Euro Notes and $382 in aggregate principal amount of Senior Subordinated Notes outstanding. The notes are fully, jointly, severally and unconditionally guaranteed by the Company’s domestic subsidiaries (the guarantor subsidiaries). The following condensed consolidated financial information presents the Condensed Consolidated Balance Sheets as of December 31, 2013 and 2012, the Condensed Consolidated Statements of Operations for the fiscal years ended December 31, 2013, 2012 and 2011 and Condensed Consolidated Statements of Cash Flows for the fiscal years ended December 31, 2013, 2012 and 2011 of (i) Momentive Performance Materials Inc. (Parent); (ii) the guarantor subsidiaries; (iii) the non-guarantor subsidiaries; and (iv) the Company on a consolidated basis.
These financial statements are prepared on the same basis as the consolidated financial statements of the Company except that investments in subsidiaries are accounted for using the equity method for purposes of the consolidating presentation. The principal elimination entries relate to investments in subsidiaries and intercompany balances and transactions. The guarantor subsidiaries are 100% owned by Parent and all guarantees are full and unconditional, subject to certain customary release provisions set forth in the applicable Indenture. Additionally, substantially all of the assets of the guarantor subsidiaries and certain non-guarantor subsidiaries are subject to first-priority liens under the senior secured credit facility. There are no significant restrictions on the ability of Parent to obtain funds from its domestic subsidiaries by dividend or loan.
F-44
Table of Contents
MOMENTIVE PERFORMANCE MATERIALS INC.
CONDENSED CONSOLIDATING BALANCE SHEET DECEMBER 31, 2013
| Parent | Guarantor Subsidiaries |
Non-Guarantor Subsidiaries |
Eliminations | Consolidated | ||||||||||||||||
| Assets |
||||||||||||||||||||
| Current assets: |
||||||||||||||||||||
| Cash and cash equivalents (including restricted cash of $0 and $5, respectively) |
$ | 2 | $ | — | $ | 92 | $ | — | $ | 94 | ||||||||||
| Accounts receivable |
— | 88 | 238 | — | 326 | |||||||||||||||
| Due from affiliates |
— | 66 | 99 | (160 | ) | 5 | ||||||||||||||
| Inventories: |
— | |||||||||||||||||||
| Raw materials |
— | 50 | 78 | — | 128 | |||||||||||||||
| Finished and in-process goods |
— | 114 | 126 | — | 240 | |||||||||||||||
| Deferred income taxes |
— | — | 6 | — | 6 | |||||||||||||||
| Other current assets |
2 | 14 | 45 | — | 61 | |||||||||||||||
|
|
|
|
|
|
|
|
|
|
|
|||||||||||
| Total current assets |
4 | 332 | 684 | (160 | ) | 860 | ||||||||||||||
| Investment in unconsolidated entities |
1,983 | — | 8 | (1,983 | ) | 8 | ||||||||||||||
| Deferred income taxes |
— | — | 3 | — | 3 | |||||||||||||||
| Other long-term assets |
— | 13 | 20 | — | 33 | |||||||||||||||
| Intercompany loans receivable |
100 | 1,939 | 422 | (2,461 | ) | — | ||||||||||||||
| Property and equipment, net |
— | 444 | 510 | — | 954 | |||||||||||||||
| Goodwill |
— | — | 381 | — | 381 | |||||||||||||||
| Other intangible assets, net |
— | 78 | 377 | — | 455 | |||||||||||||||
|
|
|
|
|
|
|
|
|
|
|
|||||||||||
| Total assets |
$ | 2,087 | $ | 2,806 | $ | 2,405 | $ | (4,604 | ) | $ | 2,694 | |||||||||
|
|
|
|
|
|
|
|
|
|
|
|||||||||||
| Liabilities and (Deficit) Equity |
||||||||||||||||||||
| Current liabilities: |
||||||||||||||||||||
| Accounts payables |
$ | — | $ | 70 | $ | 180 | $ | — | $ | 250 | ||||||||||
| Due to affiliates |
4 | 101 | 64 | (160 | ) | 9 | ||||||||||||||
| Debt payable within one year |
3,076 | 88 | 86 | — | 3,250 | |||||||||||||||
| Interest payable |
87 | 1 | — | — | 88 | |||||||||||||||
| Income taxes payable |
— | — | 6 | — | 6 | |||||||||||||||
| Deferred income taxes |
— | — | 12 | — | 12 | |||||||||||||||
| Accrued payroll and incentive compensation |
— | 23 | 21 | — | 44 | |||||||||||||||
| Other current liabilities |
— | 26 | 59 | — | 85 | |||||||||||||||
|
|
|
|
|
|
|
|
|
|
|
|||||||||||
| Total current liabilities |
3,167 | 309 | 428 | (160 | ) | 3,744 | ||||||||||||||
| Long-term liabilities: |
||||||||||||||||||||
| Long-term debt |
— | — | 7 | — | 7 | |||||||||||||||
| Intercompany loans payable |
397 | 101 | 1,963 | (2,461 | ) | — | ||||||||||||||
| Accumulated losses of unconsolidated subsidiaries in excess of investment |
— | 261 | — | (261 | ) | — | ||||||||||||||
| Pension liabilities |
— | 141 | 139 | — | 280 | |||||||||||||||
| Deferred income taxes |
— | — | 77 | — | 77 | |||||||||||||||
| Other long-term liabilities |
3 | 11 | 52 | — | 66 | |||||||||||||||
|
|
|
|
|
|
|
|
|
|
|
|||||||||||
| Total liabilities |
3,567 | 823 | 2,666 | (2,882 | ) | 4,174 | ||||||||||||||
|
|
|
|
|
|
|
|
|
|
|
|||||||||||
| Total (deficit) equity |
(1,480 | ) | 1,983 | (261 | ) | (1,722 | ) | (1,480 | ) | |||||||||||
|
|
|
|
|
|
|
|
|
|
|
|||||||||||
| Total liabilities and (deficit) equity |
$ | 2,087 | $ | 2,806 | $ | 2,405 | $ | (4,604 | ) | $ | 2,694 | |||||||||
|
|
|
|
|
|
|
|
|
|
|
|||||||||||
F-45
Table of Contents
MOMENTIVE PERFORMANCE MATERIALS INC.
CONDENSED CONSOLIDATING BALANCE SHEET
DECEMBER 31, 2012
| Parent | Guarantor Subsidiaries |
Non-Guarantor Subsidiaries |
Eliminations | Consolidated | ||||||||||||||||
| Assets |
||||||||||||||||||||
| Current assets: |
||||||||||||||||||||
| Cash and cash equivalents |
$ | 1 | $ | 2 | $ | 107 | $ | — | $ | 110 | ||||||||||
| Accounts receivable |
— | 74 | 219 | — | 293 | |||||||||||||||
| Due from affiliates |
2 | 70 | 38 | (104 | ) | 6 | ||||||||||||||
| Inventories: |
||||||||||||||||||||
| Raw materials |
— | 42 | 65 | — | 107 | |||||||||||||||
| Finished and in-process goods |
— | 122 | 145 | — | 267 | |||||||||||||||
| Deferred income taxes |
— | — | 6 | — | 6 | |||||||||||||||
| Other current assets |
— | 17 | 41 | — | 58 | |||||||||||||||
|
|
|
|
|
|
|
|
|
|
|
|||||||||||
| Total current assets |
3 | 327 | 621 | (104 | ) | 847 | ||||||||||||||
| Investment in unconsolidated entities |
2,005 | — | 5 | (2,005 | ) | 5 | ||||||||||||||
| Deferred income taxes |
— | — | 27 | — | 27 | |||||||||||||||
| Other long-term assets |
77 | 10 | 17 | — | 104 | |||||||||||||||
| Intercompany loans receivable |
171 | 1,726 | 28 | (1,925 | ) | — | ||||||||||||||
| Property and equipment, net |
— | 463 | 553 | — | 1,016 | |||||||||||||||
| Goodwill |
— | — | 412 | — | 412 | |||||||||||||||
| Other intangible assets, net |
— | 77 | 416 | — | 493 | |||||||||||||||
|
|
|
|
|
|
|
|
|
|
|
|||||||||||
| Total assets |
$ | 2,256 | $ | 2,603 | $ | 2,079 | $ | (4,034 | ) | $ | 2,904 | |||||||||
|
|
|
|
|
|
|
|
|
|
|
|||||||||||
| Liabilities and (Deficit) Equity |
||||||||||||||||||||
| Current liabilities: |
||||||||||||||||||||
| Accounts payables |
$ | 1 | $ | 56 | $ | 197 | $ | — | $ | 254 | ||||||||||
| Due to affiliates |
— | 29 | 78 | (104 | ) | 3 | ||||||||||||||
| Debt payable within one year |
— | — | 35 | — | 35 | |||||||||||||||
| Interest payable |
83 | — | — | — | 83 | |||||||||||||||
| Income taxes payable |
— | — | 6 | — | 6 | |||||||||||||||
| Deferred income taxes |
— | — | 19 | — | 19 | |||||||||||||||
| Accrued payroll and incentive compensation |
— | 30 | 21 | — | 51 | |||||||||||||||
| Other current liabilities |
2 | 35 | 69 | — | 106 | |||||||||||||||
|
|
|
|
|
|
|
|
|
|
|
|||||||||||
| Total current liabilities |
86 | 150 | 425 | (104 | ) | 557 | ||||||||||||||
| Long-term liabilities: |
||||||||||||||||||||
| Long-term debt |
3,065 | — | 16 | — | 3,081 | |||||||||||||||
| Intercompany loans payable |
252 | 106 | 1,567 | (1,925 | ) | — | ||||||||||||||
| Accumulated losses from unconsolidated subsidiaries in excess of investment |
— | 160 | — | (160 | ) | — | ||||||||||||||
| Pension liabilities |
— | 175 | 136 | — | 311 | |||||||||||||||
| Deferred income taxes |
— | — | 47 | — | 47 | |||||||||||||||
| Other liabilities |
1 | 7 | 48 | — | 56 | |||||||||||||||
|
|
|
|
|
|
|
|
|
|
|
|||||||||||
| Total liabilities |
3,404 | 598 | 2,239 | (2,189 | ) | 4,052 | ||||||||||||||
|
|
|
|
|
|
|
|
|
|
|
|||||||||||
| Total (deficit) equity |
(1,148 | ) | 2,005 | (160 | ) | (1,845 | ) | (1,148 | ) | |||||||||||
|
|
|
|
|
|
|
|
|
|
|
|||||||||||
| Total liabilities and (deficit) equity |
$ | 2,256 | $ | 2,603 | $ | 2,079 | $ | (4,034 | ) | $ | 2,904 | |||||||||
|
|
|
|
|
|
|
|
|
|
|
|||||||||||
F-46
Table of Contents
MOMENTIVE PERFORMANCE MATERIALS INC.
CONDENSED CONSOLIDATING STATEMENT OF OPERATIONS
YEAR ENDED DECEMBER 31, 2013
| Parent | Guarantor Subsidiaries |
Non-Guarantor Subsidiaries |
Eliminations | Consolidated | ||||||||||||||||
| Net sales |
$ | — | $ | 1,076 | $ | 1,827 | $ | (505 | ) | $ | 2,398 | |||||||||
| Costs and expenses: |
||||||||||||||||||||
| Cost of sales, excluding depreciation and amortization |
— | 757 | 1,480 | (505 | ) | 1,732 | ||||||||||||||
| Selling, general and administrative expense |
31 | 185 | 157 | — | 373 | |||||||||||||||
| Depreciation and amortization expense |
— | 69 | 102 | — | 171 | |||||||||||||||
| Research and development expense |
— | 43 | 27 | — | 70 | |||||||||||||||
| Restructuring and other costs |
5 | 10 | 6 | — | 21 | |||||||||||||||
|
|
|
|
|
|
|
|
|
|
|
|||||||||||
| Operating (loss) income |
(36 | ) | 12 | 55 | — | 31 | ||||||||||||||
| Interest income |
(5 | ) | (164 | ) | (4 | ) | 171 | (2 | ) | |||||||||||
| Interest expense |
389 | 6 | 172 | (171 | ) | 396 | ||||||||||||||
| Other expense (income), net |
1 | — | (1 | ) | — | — | ||||||||||||||
|
|
|
|
|
|
|
|
|
|
|
|||||||||||
| (Loss) income before income taxes and (losses) earnings from unconsolidated entities |
(421 | ) | 170 | (112 | ) | — | (363 | ) | ||||||||||||
| Income tax (benefit) expense |
— | (15 | ) | 119 | — | 104 | ||||||||||||||
|
|
|
|
|
|
|
|
|
|
|
|||||||||||
| (Loss) income before (losses) earnings from unconsolidated entities |
(421 | ) | 185 | (231 | ) | — | (467 | ) | ||||||||||||
| (Losses) earnings from unconsolidated entities, net of taxes |
(43 | ) | (228 | ) | 3 | 271 | 3 | |||||||||||||
|
|
|
|
|
|
|
|
|
|
|
|||||||||||
| Net loss |
$ | (464 | ) | $ | (43 | ) | $ | (228 | ) | $ | 271 | $ | (464 | ) | ||||||
|
|
|
|
|
|
|
|
|
|
|
|||||||||||
| Comprehensive loss |
$ | (442 | ) | $ | (21 | ) | $ | (258 | ) | $ | 279 | $ | (442 | ) | ||||||
|
|
|
|
|
|
|
|
|
|
|
|||||||||||
F-47
Table of Contents
MOMENTIVE PERFORMANCE MATERIALS INC.
CONDENSED CONSOLIDATING STATEMENT OF OPERATIONS YEAR ENDED DECEMBER 31, 2012
| Parent | Guarantor Subsidiaries |
Non-Guarantor Subsidiaries |
Eliminations | Consolidated | ||||||||||||||||
| Net sales |
$ | — | $ | 1,002 | $ | 1,811 | $ | (456 | ) | $ | 2,357 | |||||||||
| Costs and expenses: |
||||||||||||||||||||
| Cost of sales, excluding depreciation and amortization |
— | 735 | 1,426 | (456 | ) | 1,705 | ||||||||||||||
| Selling, general and administrative expense |
20 | 183 | 189 | — | 392 | |||||||||||||||
| Depreciation and amortization expense |
— | 77 | 110 | — | 187 | |||||||||||||||
| Research and development expense |
— | 46 | 23 | — | 69 | |||||||||||||||
| Restructuring and other costs |
6 | 31 | 6 | — | 43 | |||||||||||||||
|
|
|
|
|
|
|
|
|
|
|
|||||||||||
| Operating (loss) income |
(26 | ) | (70 | ) | 57 | — | (39 | ) | ||||||||||||
| Interest income |
— | (132 | ) | (7 | ) | 138 | (1 | ) | ||||||||||||
| Interest expense |
237 | 34 | 145 | (138 | ) | 278 | ||||||||||||||
| Loss (gain) on extinguishment and exchange of debt |
20 | (5 | ) | 42 | — | 57 | ||||||||||||||
| Other non-operating income, net |
— | — | (11 | ) | — | (11 | ) | |||||||||||||
|
|
|
|
|
|
|
|
|
|
|
|||||||||||
| (Loss) income before income taxes and (losses) earnings from unconsolidated entities |
(283 | ) | 33 | (112 | ) | — | (362 | ) | ||||||||||||
| Income tax (benefit) expense |
— | (8 | ) | 16 | — | 8 | ||||||||||||||
|
|
|
|
|
|
|
|
|
|
|
|||||||||||
| (Loss) income before (losses) earnings from unconsolidated entities, net of taxes |
(283 | ) | 41 | (128 | ) | — | (370 | ) | ||||||||||||
| (Losses) earnings from unconsolidated entities |
(82 | ) | (123 | ) | 5 | 205 | 5 | |||||||||||||
|
|
|
|
|
|
|
|
|
|
|
|||||||||||
| $ | (365 | ) | $ | (82 | ) | $ | (123 | ) | $ | 205 | $ | (365 | ) | |||||||
|
|
|
|
|
|
|
|
|
|
|
|||||||||||
| Comprehensive loss |
$ | (413 | ) | $ | (130 | ) | $ | (207 | ) | $ | 337 | $ | (413 | ) | ||||||
|
|
|
|
|
|
|
|
|
|
|
|||||||||||
F-48
Table of Contents
MOMENTIVE PERFORMANCE MATERIALS INC.
CONDENSED CONSOLIDATING STATEMENT OF OPERATIONS
YEAR ENDED DECEMBER 31, 2011
| Parent | Guarantor Subsidiaries |
Non-Guarantor Subsidiaries |
Eliminations | Consolidated | ||||||||||||||||
| Net sales |
$ | — | $ | 1,145 | $ | 2,023 | $ | (531 | ) | $ | 2,637 | |||||||||
| Costs and expenses: |
||||||||||||||||||||
| Cost of sales, excluding depreciation and amortization |
— | 808 | 1,521 | (531 | ) | 1,798 | ||||||||||||||
| Selling, general and administrative expense |
— | 178 | 211 | — | 389 | |||||||||||||||
| Depreciation and amortization expense |
— | 79 | 118 | — | 197 | |||||||||||||||
| Research and development expense |
— | 54 | 24 | — | 78 | |||||||||||||||
| Restructuring and other costs |
4 | 17 | 12 | — | 33 | |||||||||||||||
|
|
|
|
|
|
|
|
|
|
|
|||||||||||
| Operating (loss) income |
(4 | ) | 9 | 137 | — | 142 | ||||||||||||||
| Interest income |
— | (103 | ) | (8 | ) | 110 | (1 | ) | ||||||||||||
| Interest expense |
211 | 12 | 144 | (110 | ) | 257 | ||||||||||||||
| Gain on extinguishment of debt |
(7 | ) | — | — | — | (7 | ) | |||||||||||||
| Other non-operating (income) expense, net |
(3 | ) | 1 | 2 | — | — | ||||||||||||||
|
|
|
|
|
|
|
|
|
|
|
|||||||||||
| (Loss) income before income taxes and earnings (losses) from unconsolidated entities |
(205 | ) | 99 | (1 | ) | — | (107 | ) | ||||||||||||
| Income tax expense |
— | — | 27 | — | 27 | |||||||||||||||
|
|
|
|
|
|
|
|
|
|
|
|||||||||||
| (Loss) income before earnings (losses) from unconsolidated entities |
(205 | ) | 99 | (28 | ) | — | (134 | ) | ||||||||||||
| Earnings (losses) from unconsolidated entities, net of taxes |
64 | (35 | ) | (6 | ) | (29 | ) | (6 | ) | |||||||||||
|
|
|
|
|
|
|
|
|
|
|
|||||||||||
| Net (loss) income |
(141 | ) | 64 | (34 | ) | (29 | ) | (140 | ) | |||||||||||
| Net income attributable to noncontrolling interest |
— | — | (1 | ) | — | (1 | ) | |||||||||||||
|
|
|
|
|
|
|
|
|
|
|
|||||||||||
| Net (loss) income attributable to Momentive Performance Materials Inc. |
$ | (141 | ) | $ | 64 | $ | (35 | ) | $ | (29 | ) | $ | (141 | ) | ||||||
|
|
|
|
|
|
|
|
|
|
|
|||||||||||
| Comprehensive (loss) income attributable to Momentive Performance Materials Inc. |
$ | (130 | ) | $ | 75 | $ | 4 | $ | (79 | ) | $ | (130 | ) | |||||||
|
|
|
|
|
|
|
|
|
|
|
|||||||||||
F-49
Table of Contents
MOMENTIVE PERFORMANCE MATERIALS INC.
CONDENSED CONSOLIDATING STATEMENT OF CASH FLOWS
YEAR ENDED DECEMBER 31, 2013
| Parent | Guarantor Subsidiaries |
Non- Guarantor Subsidiaries |
Eliminations | Consolidated | ||||||||||||||||
| Cash flows (used in) provided by operating activities |
$ | (135 | ) | $ | 62 | $ | 20 | $ | (97 | ) | $ | (150 | ) | |||||||
|
|
|
|
|
|
|
|
|
|
|
|||||||||||
| Cash flows used in investing activities: |
||||||||||||||||||||
| Capital expenditures |
— | (37 | ) | (42 | ) | — | (79 | ) | ||||||||||||
| Capitalized interest |
— | (1 | ) | (1 | ) | — | (2 | ) | ||||||||||||
| Purchases of intangible assets |
— | (3 | ) | — | — | (3 | ) | |||||||||||||
| Change in restricted cash |
— | — | (5 | ) | — | (5 | ) | |||||||||||||
| Proceeds from sale of assets |
— | 1 | — | — | 1 | |||||||||||||||
| Capital contribution to subsidiary |
— | (16 | ) | — | 16 | — | ||||||||||||||
| Return of capital from subsidiary from sales of accounts receivable |
— | 53 | — | (53 | ) | — | ||||||||||||||
|
|
|
|
|
|
|
|
|
|
|
|||||||||||
| — | (3 | ) | (48 | ) | (37 | ) | (88 | ) | ||||||||||||
|
|
|
|
|
|
|
|
|
|
|
|||||||||||
| Cash flows provided by financing activities: |
||||||||||||||||||||
| Net short-term debt repayments |
— | — | (2 | ) | — | (2 | ) | |||||||||||||
| Borrowings of long-term debt |
163 | 120 | 136 | — | 419 | |||||||||||||||
| Repayments of long-term debt |
(75 | ) | (120 | ) | (92 | ) | — | (287 | ) | |||||||||||
| Net intercompany loan (repayments) borrowings |
(42 | ) | 36 | 6 | — | — | ||||||||||||||
| Proceeds from capital contributions |
102 | — | 16 | (16 | ) | 102 | ||||||||||||||
| Long-term debt financing fees |
(12 | ) | — | — | — | (12 | ) | |||||||||||||
| Common stock dividends paid |
— | (97 | ) | — | 97 | — | ||||||||||||||
| Return of capital to parent from sales of accounts receivable |
— | — | (53 | ) | 53 | — | ||||||||||||||
|
|
|
|
|
|
|
|
|
|
|
|||||||||||
| 136 | (61 | ) | 11 | 134 | 220 | |||||||||||||||
|
|
|
|
|
|
|
|
|
|
|
|||||||||||
| Increase (decrease) in cash and cash equivalents |
1 | (2 | ) | (17 | ) | — | (18 | ) | ||||||||||||
| Effect of exchange rate changes on cash |
— | — | (3 | ) | — | (3 | ) | |||||||||||||
| Cash and cash equivalents (unrestricted), beginning of year |
1 | 2 | 107 | — | 110 | |||||||||||||||
|
|
|
|
|
|
|
|
|
|
|
|||||||||||
| Cash and cash equivalents (unrestricted), end of year |
$ | 2 | $ | — | $ | 87 | $ | — | $ | 89 | ||||||||||
|
|
|
|
|
|
|
|
|
|
|
|||||||||||
F-50
Table of Contents
MOMENTIVE PERFORMANCE MATERIALS INC.
CONDENSED CONSOLIDATING STATEMENT OF CASH FLOWS
YEAR ENDED DECEMBER 31, 2012
| Parent | Guarantor Subsidiaries |
Non-Guarantor Subsidiaries |
Eliminations | Consolidated | ||||||||||||||||
| Cash flows (used in) provided by operating activities |
$ | (155 | ) | $ | 122 | $ | 34 | $ | (96 | ) | $ | (95 | ) | |||||||
|
|
|
|
|
|
|
|
|
|
|
|||||||||||
| Cash flows used in investing activities: |
||||||||||||||||||||
| Capital expenditures |
— | (45 | ) | (62 | ) | — | (107 | ) | ||||||||||||
| Purchases of intangible assets |
— | (2 | ) | — | — | (2 | ) | |||||||||||||
| Proceeds from sale of assets |
— | — | 7 | — | 7 | |||||||||||||||
| Capital contribution to subsidiary |
(740 | ) | (155 | ) | — | 895 | — | |||||||||||||
| Return of capital from subsidiary from sales of accounts receivable |
— | 48 | — | (48 | ) | — | ||||||||||||||
|
|
|
|
|
|
|
|
|
|
|
|||||||||||
| (740 | ) | (154 | ) | (55 | ) | 847 | (102 | ) | ||||||||||||
|
|
|
|
|
|
|
|
|
|
|
|||||||||||
| Cash flows provided by (used in) financing activities: |
||||||||||||||||||||
| Net short-term debt borrowings |
— | — | 3 | — | 3 | |||||||||||||||
| Borrowings of long-term debt |
1,350 | 237 | 138 | — | 1,725 | |||||||||||||||
| Repayments of long-term debt |
(164 | ) | (237 | ) | (1,132 | ) | — | (1,533 | ) | |||||||||||
| Net intercompany loan (repayments) borrowings |
(257 | ) | (610 | ) | 867 | — | — | |||||||||||||
| Capital contribution from parent |
— | 740 | 155 | (895 | ) | — | ||||||||||||||
| Long-term debt financing fees |
(30 | ) | — | (3 | ) | — | (33 | ) | ||||||||||||
| Payments of original issue discounts and tender premiums |
(43 | ) | — | (8 | ) | — | (51 | ) | ||||||||||||
| Common stock dividends paid |
— | (96 | ) | — | 96 | — | ||||||||||||||
| Return of capital to parent from sales of accounts receivable |
— | — | (48 | ) | 48 | — | ||||||||||||||
|
|
|
|
|
|
|
|
|
|
|
|||||||||||
| 856 | 34 | (28 | ) | (751 | ) | 111 | ||||||||||||||
|
|
|
|
|
|
|
|
|
|
|
|||||||||||
| (Decrease) increase in cash and cash equivalents |
(39 | ) | 2 | (49 | ) | — | (86 | ) | ||||||||||||
| Effect of exchange rate changes on cash |
— | — | (3 | ) | — | (3 | ) | |||||||||||||
| Cash and cash equivalents (unrestricted), beginning of year |
40 | — | 159 | — | 199 | |||||||||||||||
|
|
|
|
|
|
|
|
|
|
|
|||||||||||
| Cash and cash equivalents (unrestricted), end of year |
$ | 1 | $ | 2 | $ | 107 | $ | — | $ | 110 | ||||||||||
|
|
|
|
|
|
|
|
|
|
|
|||||||||||
F-51
Table of Contents
MOMENTIVE PERFORMANCE MATERIALS INC.
CONDENSED CONSOLIDATING STATEMENT OF CASH FLOWS
YEAR ENDED DECEMBER 31, 2011
| Parent | Guarantor Subsidiaries |
Non-Guarantor Subsidiaries |
Eliminations | Consolidated | ||||||||||||||||
| Cash flows (used in) provided by operating activities |
$ | (60 | ) | $ | 187 | $ | 79 | $ | (100 | ) | $ | 106 | ||||||||
|
|
|
|
|
|
|
|
|
|
|
|||||||||||
| Cash flows used in investing activities: |
||||||||||||||||||||
| Capital expenditures |
— | (58 | ) | (54 | ) | — | (112 | ) | ||||||||||||
| Purchase of intangible assets |
— | (2 | ) | — | — | (2 | ) | |||||||||||||
| Capital contribution to subsidiary |
— | (8 | ) | — | 8 | — | ||||||||||||||
| Investment in unconsolidated affiliate |
— | — | (6 | ) | — | (6 | ) | |||||||||||||
| Return of capital from subsidiary from sales of accounts receivable |
— | 25 | — | (25 | ) | — | ||||||||||||||
|
|
|
|
|
|
|
|
|
|
|
|||||||||||
| — | (43 | ) | (60 | ) | (17 | ) | (120 | ) | ||||||||||||
|
|
|
|
|
|
|
|
|
|
|
|||||||||||
| Cash flows provided by (used in) financing activities: |
||||||||||||||||||||
| Net short-term debt borrowings |
1 | — | — | — | 1 | |||||||||||||||
| Borrowings of long-term debt |
— | — | 52 | — | 52 | |||||||||||||||
| Repayments of long-term debt |
(16 | ) | — | (72 | ) | — | (88 | ) | ||||||||||||
| Net intercompany loan borrowings (repayments) |
93 | (47 | ) | (46 | ) | — | — | |||||||||||||
| Long-term debt financing fees |
(5 | ) | — | — | — | (5 | ) | |||||||||||||
| Capital contribution from parent |
— | — | 8 | (8 | ) | — | ||||||||||||||
| Common stock dividends paid |
(1 | ) | (97 | ) | (3 | ) | 100 | (1 | ) | |||||||||||
| Return of capital to parent from sales of accounts receivable |
— | — | (25 | ) | 25 | — | ||||||||||||||
|
|
|
|
|
|
|
|
|
|
|
|||||||||||
| 72 | (144 | ) | (86 | ) | 117 | (41 | ) | |||||||||||||
|
|
|
|
|
|
|
|
|
|
|
|||||||||||
| Increase (decrease) in cash and cash equivalents |
12 | — | (67 | ) | — | (55 | ) | |||||||||||||
| Effect of exchange rate changes on cash |
— | — | 4 | — | 4 | |||||||||||||||
| Cash and cash equivalents (unrestricted), beginning of year |
28 | — | 222 | — | 250 | |||||||||||||||
|
|
|
|
|
|
|
|
|
|
|
|||||||||||
| Cash and cash equivalents (unrestricted), end of year |
$ | 40 | $ | — | $ | 159 | $ | — | $ | 199 | ||||||||||
|
|
|
|
|
|
|
|
|
|
|
|||||||||||
F-52
Table of Contents
Schedule II—Valuation and Qualifying Accounts
| Column A |
Column B | Column C | Column D | Column E | ||||||||||||
| Description |
Balance at Beginning of Period |
Additions(1) | Deductions | Balance at End of Period |
||||||||||||
| Deferred Tax Asset Valuation Allowance: |
||||||||||||||||
| Year ended December 31, 2013 |
$ | 812 | $ | 162 | $ | (2 | ) | $ | 972 | |||||||
| Year ended December 31, 2012 |
$ | 719 | $ | 94 | $ | (1 | ) | $ | 812 | |||||||
| Year ended December 31, 2011 |
$ | 652 | $ | 77 | $ | (10 | ) | $ | 719 | |||||||
| (1) | Charged to cost and expenses. Includes the impact of foreign currency translation |
F-53
Table of Contents
MOMENTIVE PERFORMANCE MATERIALS INC.
(DEBTOR-IN-POSSESSION)
CONDENSED CONSOLIDATED BALANCE SHEETS (Unaudited)
| (In millions, except share data) |
September 30, 2014 |
December 31, 2013 |
||||||
| Assets |
||||||||
| Current assets: |
||||||||
| Cash and cash equivalents (including restricted cash of $5) |
$ | 139 | $ | 94 | ||||
| Accounts receivable (net of allowance for doubtful accounts of $4) |
340 | 331 | ||||||
| Inventories: |
||||||||
| Raw materials |
156 | 128 | ||||||
| Finished and in-process goods |
273 | 240 | ||||||
| Deferred income taxes |
5 | 6 | ||||||
| Other current assets |
76 | 61 | ||||||
|
|
|
|
|
|||||
| Total current assets |
989 | 860 | ||||||
| Investment in unconsolidated entities |
10 | 8 | ||||||
| Deferred income taxes |
3 | 3 | ||||||
| Other long-term assets |
24 | 33 | ||||||
| Property and equipment: |
||||||||
| Land |
72 | 77 | ||||||
| Buildings |
371 | 377 | ||||||
| Machinery and equipment |
1,477 | 1,582 | ||||||
|
|
|
|
|
|||||
| 1,920 | 2,036 | |||||||
| Less accumulated depreciation |
(1,048 | ) | (1,082 | ) | ||||
|
|
|
|
|
|||||
| 872 | 954 | |||||||
| Goodwill |
362 | 381 | ||||||
| Other intangible assets, net |
404 | 455 | ||||||
|
|
|
|
|
|||||
| Total assets |
$ | 2,664 | $ | 2,694 | ||||
|
|
|
|
|
|||||
| Liabilities and Deficit |
||||||||
| Current liabilities: |
||||||||
| Accounts payable |
$ | 222 | $ | 259 | ||||
| Debt payable within one year |
1,770 | 3,250 | ||||||
| Interest payable |
59 | 88 | ||||||
| Income taxes payable |
6 | 6 | ||||||
| Deferred income taxes |
13 | 12 | ||||||
| Accrued payroll and incentive compensation |
44 | 44 | ||||||
| Other current liabilities |
96 | 85 | ||||||
|
|
|
|
|
|||||
| Total current liabilities |
2,210 | 3,744 | ||||||
| Long-term liabilities: |
||||||||
| Long-term debt |
7 | 7 | ||||||
| Pension and post employment benefit obligations |
134 | 280 | ||||||
| Deferred income taxes |
63 | 77 | ||||||
| Other long-term liabilities |
51 | 66 | ||||||
| Liabilities subject to compromise |
2,026 | — | ||||||
|
|
|
|
|
|||||
| Total liabilities |
4,491 | 4,174 | ||||||
|
|
|
|
|
|||||
| Commitments and contingencies (See Note 10) |
||||||||
| Deficit |
||||||||
| Common stock—$0.01 par value; 100 shares authorized, issued and outstanding at September 30, 2014 and December 31, 2013 |
— | — | ||||||
| Additional paid-in capital |
713 | 716 | ||||||
| Accumulated other comprehensive income |
219 | 202 | ||||||
| Accumulated deficit |
(2,759 | ) | (2,398 | ) | ||||
|
|
|
|
|
|||||
| Total deficit |
(1,827 | ) | (1,480 | ) | ||||
|
|
|
|
|
|||||
| Total liabilities and deficit |
$ | 2,664 | $ | 2,694 | ||||
|
|
|
|
|
|||||
See Notes to Condensed Consolidated Financial Statements
F-54
Table of Contents
MOMENTIVE PERFORMANCE MATERIALS INC.
(DEBTOR-IN-POSSESSION)
CONDENSED CONSOLIDATED STATEMENTS OF OPERATIONS (Unaudited)
| Three Months Ended September 30, |
Nine Months Ended September 30, |
|||||||||||||||
| (In millions, except share and per share data) |
2014 | 2013 | 2014 | 2013 | ||||||||||||
| Net sales |
$ | 631 | $ | 604 | $ | 1,873 | $ | 1,784 | ||||||||
| Costs and expenses: |
||||||||||||||||
| Cost of sales, excluding depreciation and amortization |
445 | 444 | 1,339 | 1,277 | ||||||||||||
| Selling, general and administrative expense |
249 | 84 | 417 | 276 | ||||||||||||
| Depreciation and amortization expense |
54 | 42 | 137 | 129 | ||||||||||||
| Research and development expense |
19 | 18 | 58 | 51 | ||||||||||||
| Restructuring and other costs |
6 | 9 | 20 | 17 | ||||||||||||
|
|
|
|
|
|
|
|
|
|||||||||
| Operating (loss) income |
(142 | ) | 7 | (98 | ) | 34 | ||||||||||
| Interest expense, net (contractual interest of $76 and $230 for the three and nine months ended September 30, 2014, respectively) |
36 | 77 | 153 | 234 | ||||||||||||
| Other non-operating expense, net |
— | 1 | — | — | ||||||||||||
| Reorganization items, net |
44 | — | 114 | — | ||||||||||||
|
|
|
|
|
|
|
|
|
|||||||||
| Loss before income taxes and (losses) earnings from unconsolidated entities |
(222 | ) | (71 | ) | (365 | ) | (200 | ) | ||||||||
| Income tax benefit |
(23 | ) | (5 | ) | (2 | ) | — | |||||||||
|
|
|
|
|
|
|
|
|
|||||||||
| Loss before (losses) earnings from unconsolidated entities |
(199 | ) | (66 | ) | (363 | ) | (200 | ) | ||||||||
| (Losses) earnings from unconsolidated entities, net of taxes |
— | (1 | ) | 2 | 2 | |||||||||||
|
|
|
|
|
|
|
|
|
|||||||||
| Net loss |
$ | (199 | ) | $ | (67 | ) | $ | (361 | ) | $ | (198 | ) | ||||
|
|
|
|
|
|
|
|
|
|||||||||
| Weighted average common shares outstanding—basic and diluted |
100 | 100 | 100 | 100 | ||||||||||||
| Loss per share—basic and diluted |
$ | (1,990,000 | ) | $ | (670,000 | ) | $ | (3,610,000 | ) | $ | (1,980,000 | ) | ||||
See Notes to Condensed Consolidated Financial Statements
F-55
Table of Contents
MOMENTIVE PERFORMANCE MATERIALS INC.
(DEBTOR-IN-POSSESSION)
CONDENSED CONSOLIDATED STATEMENTS OF COMPREHENSIVE LOSS (Unaudited)
| Three Months Ended September 30, |
Nine Months Ended September 30, |
|||||||||||||||
| (In millions) |
2014 | 2013 | 2014 | 2013 | ||||||||||||
| Net loss |
$ | (199 | ) | $ | (67 | ) | $ | (361 | ) | $ | (198 | ) | ||||
| Other comprehensive income (loss), net of tax: |
||||||||||||||||
| Foreign currency translation |
52 | 20 | 38 | (44 | ) | |||||||||||
| (Loss) gain recognized from pension and postretirement benefits |
(22 | ) | 14 | (21 | ) | 12 | ||||||||||
|
|
|
|
|
|
|
|
|
|||||||||
| Other comprehensive income (loss) |
30 | 34 | 17 | (32 | ) | |||||||||||
|
|
|
|
|
|
|
|
|
|||||||||
| Comprehensive loss |
$ | (169 | ) | $ | (33 | ) | $ | (344 | ) | $ | (230 | ) | ||||
|
|
|
|
|
|
|
|
|
|||||||||
See Notes to Condensed Consolidated Financial Statements
F-56
Table of Contents
MOMENTIVE PERFORMANCE MATERIALS INC.
(DEBTOR-IN-POSSESSION)
CONDENSED CONSOLIDATED STATEMENTS OF CASH FLOWS (Unaudited)
| Nine Months Ended September 30, | ||||||||
| (In millions) |
2014 | 2013 | ||||||
| Cash flows used in operating activities |
||||||||
| Net loss |
$ | (361 | ) | $ | (198 | ) | ||
| Adjustments to reconcile net loss to net cash used in operating activities: |
||||||||
| Depreciation and amortization |
137 | 129 | ||||||
| Non-cash BCA Commitment Premium (see Note 2) |
30 | — | ||||||
| Deferred income tax benefit |
(15 | ) | (10 | ) | ||||
| Unrealized foreign currency losses |
109 | 5 | ||||||
| Amortization of debt discount and issuance costs |
— | 7 | ||||||
| DIP Facility financing fees included in net loss |
19 | — | ||||||
| Other non-cash adjustments |
5 | 2 | ||||||
| Net change in assets and liabilities: |
||||||||
| Accounts receivable |
(28 | ) | (37 | ) | ||||
| Inventories |
(75 | ) | (37 | ) | ||||
| Accounts payable |
44 | 10 | ||||||
| Due to/from affiliates |
9 | 3 | ||||||
| Income taxes payable |
(2 | ) | 1 | |||||
| Other assets, current and non-current |
(8 | ) | (16 | ) | ||||
| Other liabilities, current and non-current |
11 | 12 | ||||||
|
|
|
|
|
|||||
| Net cash used in operating activities |
(125 | ) | (129 | ) | ||||
|
|
|
|
|
|||||
| Cash flows used in investing activities |
||||||||
| Capital expenditures |
(70 | ) | (56 | ) | ||||
| Capitalized interest |
— | (1 | ) | |||||
| Purchases of intangible assets |
(2 | ) | (2 | ) | ||||
| Consolidation of variable interest entity |
50 | — | ||||||
| Proceeds from sale of business |
12 | — | ||||||
| Change in restricted cash |
— | (5 | ) | |||||
| Proceeds from sale of assets |
1 | 1 | ||||||
|
|
|
|
|
|||||
| Net cash used in investing activities |
(9 | ) | (63 | ) | ||||
|
|
|
|
|
|||||
| Cash flows provided by financing activities |
||||||||
| Net short-term debt borrowings (repayments) |
305 | (1 | ) | |||||
| Borrowings of long-term debt |
208 | 344 | ||||||
| Repayments of long-term debt |
(260 | ) | (258 | ) | ||||
| Repayment of affiliated debt |
(50 | ) | — | |||||
| Long-term debt financing fees |
— | (11 | ) | |||||
| DIP Facility financing fees |
(19 | ) | — | |||||
| Proceeds from capital contribution |
— | 102 | ||||||
|
|
|
|
|
|||||
| Net cash provided by financing activities |
184 | 176 | ||||||
|
|
|
|
|
|||||
| Increase (decrease) in cash and cash equivalents |
50 | (16 | ) | |||||
| Effect of exchange rate changes on cash and cash equivalents |
(5 | ) | (2 | ) | ||||
| Cash and cash equivalents (unrestricted), beginning of period |
89 | 110 | ||||||
|
|
|
|
|
|||||
| Cash and cash equivalents (unrestricted), end of period |
$ | 134 | $ | 92 | ||||
|
|
|
|
|
|||||
| Supplemental disclosures of cash flow information |
||||||||
| Cash paid for: |
||||||||
| Interest |
$ | 136 | $ | 210 | ||||
| Income taxes, net of refunds |
11 | 9 | ||||||
| Professional fees related to reorganization items |
21 | — | ||||||
| Non-cash operating activity: |
||||||||
| Reorganization items included in accounts payable |
$ | 44 | $ | — | ||||
| Non-cash investing activity: |
||||||||
| Capital expenditures included in accounts payable |
$ | 12 | $ | 12 | ||||
| Non-cash financing activity: |
||||||||
| Capital contribution from parent |
$ | — | $ | 7 | ||||
See Notes to Condensed Consolidated Financial Statements
F-57
Table of Contents
MOMENTIVE PERFORMANCE MATERIALS INC.
(DEBTOR-IN-POSSESSION)
CONDENSED CONSOLIDATED STATEMENT OF DEFICIT (Unaudited)
| (In millions) |
Common Stock |
Additional Paid-in Capital |
Accumulated
Other Comprehensive Income |
Accumulated Deficit |
Total Deficit |
|||||||||||||||
| Balance as of December 31, 2013 |
$ | — | $ | 716 | $ | 202 | $ | (2,398 | ) | $ | (1,480 | ) | ||||||||
| Net loss |
— | — | — | (361 | ) | (361 | ) | |||||||||||||
| Other comprehensive loss |
— | — | 17 | — | 17 | |||||||||||||||
| Sale of business to related party (see Note 7) |
— | (3 | ) | — | — | (3 | ) | |||||||||||||
|
|
|
|
|
|
|
|
|
|
|
|||||||||||
| Balance as of September 30, 2014 |
$ | — | $ | 713 | $ | 219 | $ | (2,759 | ) | $ | (1,827 | ) | ||||||||
|
|
|
|
|
|
|
|
|
|
|
|||||||||||
See Notes to Condensed Consolidated Financial Statements
F-58
Table of Contents
MOMENTIVE PERFORMANCE MATERIALS INC.
(DEBTOR-IN-POSSESSION)
NOTES TO CONDENSED CONSOLIDATED FINANCIAL STATEMENTS (Unaudited)
(In millions, except share date)
1. Business and Basis of Presentation
Based in Waterford, New York, Momentive Performance Materials Inc. (the “Company” or “MPM”), is comprised of two businesses: Silicones and Quartz. Silicones is a global business engaged in the manufacture, sale and distribution of silanes, specialty silicones and urethane additives. Quartz, also a global business, is engaged in the manufacture, sale and distribution of high-purity fused quartz and ceramic materials.
As a result of the Company’s reorganization and emergence from Chapter 11 bankruptcy on October 24, 2014, the Company’s direct parent is MPM Intermediate Holdings Inc., a holding company and wholly owned subsidiary of MPM Holdings Inc., the ultimate parent entity of MPM (“New MPM Holdings”). Prior to its reorganization, the Company, through a series of intermediate holding companies, was controlled by investment funds managed by affiliates of Apollo Management Holdings, L.P. (together with Apollo Global Management, LLC and subsidiaries, “Apollo”).
The unaudited Condensed Consolidated Financial Statements include the accounts of the Company, its majority-owned subsidiaries in which minority shareholders hold no substantive participating rights and variable interest entities (“VIEs”) in which the Company is the primary beneficiary. Intercompany accounts and transactions are eliminated in consolidation. In the opinion of management, all adjustments consisting of normal, recurring adjustments considered necessary for a fair statement have been included. Results for the interim periods are not necessarily indicative of results for the entire year.
Year-end condensed consolidated balance sheet data was derived from audited financial statements, but does not include all disclosures required by accounting principles generally accepted in the United States of America (“U.S. GAAP”).
Pursuant to the rules and regulations of the Securities and Exchange Commission, certain information and disclosures normally included in financial statements prepared in accordance with U.S. GAAP have been condensed or omitted. These unaudited Condensed Consolidated Financial Statements should be read in conjunction with the audited Consolidated Financial Statements and the accompanying notes included in the Company’s most recent Annual Report on Form 10-K.
Going Concern
At September 30, 2014, prior to its emergence from Chapter 11, the Company believed that, under its current capital structure, there was significant doubt about its ability to continue as a going concern for the next 12 months. The unaudited Condensed Consolidated Financial Statements have been prepared assuming that the Company will continue as a going concern. The Company’s ability to continue as a going concern was contingent upon the Company’s ability to comply with the financial and other covenants contained in the DIP Facilities (see Note 2) and the Company’s ability to successfully implement the Plan (see Note 2), among other factors.
The unaudited Condensed Consolidated Financial Statements do not include any adjustments related to the recoverability and classification of recorded assets, the satisfaction and classification of liabilities or any other adjustments that might be necessary should the Company be unable to continue as a going concern or as a consequence of the Bankruptcy Filing (see Note 2).
F-59
Table of Contents
2. Chapter 11 Bankruptcy Filing
Bankruptcy Filing
On April 13, 2014 (the “Petition Date”), Momentive Performance Materials Holdings Inc. (the Company’s direct parent prior to October 24, 2014) (“Old MPM Holdings”), the Company and certain of its U.S. subsidiaries (collectively, the “Debtors”) filed voluntary petitions for reorganization (the “Bankruptcy Filing”) under Chapter 11 (“Chapter 11”) of the U.S. Bankruptcy Code (the “Bankruptcy Code”) in the United States Bankruptcy Court for the Southern District of New York (the “Court”). The Chapter 11 proceedings are being jointly administered under the caption In re MPM Silicones, LLC, et al., Case No. 14-22503. The Debtors continued to operate their businesses as “debtors-in-possession” under the jurisdiction of the Court and in accordance with the applicable provisions of the Bankruptcy Code and orders of the Court through the Effective Date (defined below).
Subsequent to the Petition Date, the Company received approval from the Court to pay or otherwise honor certain pre-petition obligations generally designed to stabilize the Company’s operations, such as certain employee wages, salaries and benefits, certain taxes and fees, certain customer obligations, obligations to certain logistics providers and pre-petition amounts owed to certain critical vendors. The Company has also honored payments to vendors and other providers in the ordinary course of business for goods and services received after the Petition Date. The Company has retained legal, financial and tax professionals to advise the Company in connection with the Bankruptcy Filing and certain other professionals to provide services and advice in the ordinary course of business.
Debtor-in-Possession Financing
DIP ABL Facility
In connection with the Bankruptcy Filing, on April 15, 2014, the Debtors entered into an amended and restated senior secured debtor-in-possession and exit asset-based revolving credit agreement (the “DIP ABL Facility”), which amended and restated the Company’s existing asset-based revolving loan facility (the “ABL Facility”).
The DIP ABL Facility was terminated upon consummation of the Plan by the Company on October 24, 2014, at which time the Company exercised its option to convert the DIP ABL Facility into an exit asset-based revolving facility (the “Exit ABL Facility”).
Prior to its termination, the DIP ABL Facility had a 12 month term unless, prior to the end of such 12 month period, a reorganization plan was confirmed pursuant to an order entered by the Court and subsequently consummated, in which case, the DIP ABL Facility would terminate on the date of such consummation, unless the Company exercised its option to convert the DIP ABL Facility into the Exit ABL Facility, in which case, upon the effectiveness of the Exit ABL Facility, the term would be five years after such effective date. The maximum availability under the DIP ABL Facility was $270. The DIP ABL Facility was also subject to a borrowing base that was based on a specified percentage of eligible accounts receivable and inventory and, in certain foreign jurisdictions, machinery and equipment.
The DIP ABL Facility bore interest based on, at the Company’s option, an adjusted LIBOR rate plus an applicable margin of 2.75% or an alternate base rate plus an applicable margin of 1.75%. In addition to paying interest on outstanding principal under the DIP ABL Facility, the Company was required to pay a commitment fee to the lenders in respect of the unutilized commitments at an initial rate equal to 0.375% per annum, subject to adjustment depending on the usage. The DIP ABL Facility had a minimum EBITDA covenant calculated on a cumulative basis beginning with May 1, 2014 and tested monthly commencing as of August 31, 2014 and a minimum liquidity covenant of $50 tested at the close of each business day. The Exit ABL Facility does not have any financial maintenance covenants, other than a minimum fixed charge coverage ratio of 1.0 to 1.0 that would only apply if availability is less than the greater of (a) 12.5% of the lesser of the borrowing base and the total Exit ABL Facility commitments at such time and (b) $27. The fixed charge coverage ratio under the agreement
F-60
Table of Contents
governing the Exit ABL Facility is defined as the ratio of (a) Adjusted EBITDA minus non-financed capital expenditures and cash taxes to (b) debt service plus cash interest expense plus certain restricted payments, each measured on a last twelve months basis.
The DIP ABL Facility was secured by, among other things, first-priority liens on most of the inventory and accounts receivable and related assets of the Company, its domestic subsidiaries and certain of its foreign subsidiaries, and, in the case of certain foreign subsidiaries, machinery and equipment (the “DIP ABL Priority Collateral”), and second-priority liens on certain collateral that generally included most of the Company’s, its domestic subsidiaries’ and certain of its foreign subsidiaries’ assets other than DIP ABL Priority Collateral (the “DIP Term Loan Priority Collateral”), in each case subject to certain exceptions and permitted liens.
As of September 30, 2014, $63 was outstanding under the DIP ABL Facility.
DIP Term Loan Facility
In connection with the Bankruptcy Filing, on April 15, 2014, the Company entered into a senior secured debtor-in-possession term loan agreement, as amended (the “DIP Term Loan Facility”) (collectively with the DIP ABL Facility, the “DIP Facilities”). The DIP Term Loan Facility was used in part to repay in full the outstanding obligations under the Company’s existing ABL Facility.
The DIP Term Loan Facility was terminated upon consummation of the Plan by the Company on October 24, 2014. All amounts outstanding under the DIP Term Loan Facility as of such date were repaid in full.
Prior to its termination, the DIP Term Loan Facility had a 12 month term unless, prior to the end of such 12 month period, a reorganization plan was confirmed pursuant to an order entered by the Court and subsequently consummated, in which case, the DIP Term Loan Facility would terminate on the date of such consummation. The amount committed and made available under the DIP Term Loan Facility was $300. The DIP Term Loan Facility bore interest based on, at the Company’s option, an adjusted LIBOR rate plus an applicable margin of 3.25% or an alternate base rate plus an applicable margin of 2.25%.
Like the DIP ABL Facility, the DIP Term Loan Facility had a minimum EBITDA covenant calculated on a cumulative basis beginning with May 1, 2014 and tested monthly commencing as of August 31, 2014 and a minimum liquidity covenant of $50 tested at the close of each business day.
The security arrangements for the DIP Term Loan Facility included first-priority liens on the DIP Term Loan Priority Collateral owned by the Company and its domestic subsidiaries and second-priority liens on the DIP ABL Priority Collateral owned by the Company and its domestic subsidiaries, which were junior to the DIP ABL Facility, in each case subject to certain exceptions and permitted liens.
As of September 30, 2014, $300 was outstanding under the DIP Term Loan Facility.
Reorganization Plan and Restructuring Support Agreement
In order for the Company to emerge successfully from Chapter 11, it needed to obtain the Court’s confirmation of a Chapter 11 plan of reorganization proposed by the Debtors (as amended, supplemented or modified, the “Plan”), which has enabled the Company to transition from Chapter 11 into ordinary course operations outside of bankruptcy.
On June 23, 2014, the Company filed with the Court an amended version of the Plan (as further amended on September 24, 2014) and accompanying disclosure statement (the “Disclosure Statement”), both of which were originally filed with the Court on May 12, 2014. The Plan provided, among other things, mechanisms for settlement of claims against the Debtors’ estates, treatment of the Company’s existing equity and debt holders,
F-61
Table of Contents
and certain corporate governance and administrative matters pertaining to the reorganized Company, each consistent with the terms set forth in the Support Agreement (defined below) which are further described below. The Plan was intended to enable the Debtors to continue business operations without the likelihood of need for further financial reorganization.
On June 23, 2014, the Court issued an order (the “Disclosure Statement Order”) (a) approving the Disclosure Statement; (b) establishing August 18, 2014 as the date of commencement of the hearing to approve the Plan (the “Confirmation Hearing”); (c) establishing the procedures for solicitation and tabulation to accept or reject the Plan, including setting July 28, 2014 as the voting deadline (the “Voting Deadline”); (d) establishing the deadline, July 28, 2014, and the procedures for filing objections to confirmation of the Plan; (e) approving the rights offering procedures (see Restructuring Support Agreement below) and (f) granting related relief necessary to the Company to implement the order.
Pursuant to the Disclosure Statement Order, the Voting Deadline has passed. Pursuant to the Plan, only four classes of holders of claims against the Debtors were entitled to vote to accept or reject the Plan. Two classes of holders of claims (including holders of the Springing Lien Notes) voted unanimously to approve the Plan whereas two classes of holders of claims voted to reject the Plan (including holders of the First Lien Notes and the Senior Secured Notes). The two classes of holders of claims that rejected the Plan received, pursuant to the Plan, certain replacement notes in satisfaction of their claims against the Debtors (see Note 9). Four of the remaining classes of holders of claims against the Debtors are unimpaired by the Plan and thus deemed to have accepted the Plan. In addition, three classes of holders of claims will not receive any distributions under the Plan and are deemed to have rejected the Plan. Despite the rejection or deemed rejection of the Plan by certain classes of holders of claims, the Bankruptcy Code provided for the Plan to be approved if it met certain requirements.
Restructuring Support Agreement
In connection with the Bankruptcy Filing, the Debtors entered into a Restructuring Support Agreement, dated as of April 13, 2014, (as amended, supplemented or otherwise modified, the “Support Agreement”), among the Debtors, certain affiliates of Apollo Global Management, LLC (the “Apollo Entities”) and certain holders of the Company’s 9.0% Second-Priority Springing Lien Notes due 2021 and 9.5% Second-Priority Springing Lien Notes due 2021 (collectively, the “Second Lien Notes”) that are not Apollo Entities (the “Consenting Noteholders” and, together with the Apollo Entities, the “Plan Support Parties”) providing that the Plan Support Parties, which held approximately 90% in dollar amount of the Second Lien Notes, would support, and vote in favor of the Plan.
Pursuant to the terms of the Support Agreement, the Plan Support Parties were required to not only vote in favor of the Plan, but were also prohibited, from among other things, opposing confirmation of the Plan. The Debtors, in turn, agreed to propose the Plan which provides for (a) payment in full in cash to the Debtors’ general unsecured trade creditors and holders of claims arising from the Company’s $75 revolving credit facility, (b) either payment in full in cash or by delivery of replacement notes to holders of 8.875% First-Priority Senior Secured Notes due 2020 and 10% Senior Secured Notes due 2020, (c) conversion of the Second Lien Notes into the new equity of the reorganized Debtors (subject to dilution by a management incentive plan and the new equity to be issued by the rights offerings described below), (d) subscription rights to holders of Second Lien Notes in the $600 rights offerings (the “Rights Offerings”), giving such holders the opportunity to purchase a percentage of the new equity of the reorganized Debtors at a price per share determined by using the pro forma capital structure and an enterprise value of $2.2 billion and applying a 15% discount to the equity value thereto, (e) a recovery to holders of the 11% Senior Discount Note, due June 4, 2017 of Old MPM Holdings in the amount of the cash available at Old MPM Holdings as of the effective date of the Plan, after taking into account administrative expenses, and (f) no recovery to the holders of 11 1/2% Senior Subordinated Notes due 2016 (the “Senior Subordinated Notes”) on account of the subordination provisions set forth in the indenture governing the Senior Subordinated Notes. The Plan also provided that the reorganized Debtors will select a chief executive officer, chief financial officer and general counsel who are acceptable to the Requisite Investors (as defined in
F-62
Table of Contents
the Support Agreement) and the costs for whom will not be shared with Momentive Specialty Chemicals Inc. (“MSC”), an affiliate, under the Shared Services Agreement between the Company and MSC. Under the Plan, the Shared Services Agreement was amended to, among other things, (i) exclude the services of certain executive officers, (ii) provide for a transition assistance period at the election of the recipient following termination of the Shared Services Agreement of up to 12 months, subject to one successive renewal period of an additional 60 days and (iii) provide for the use of an independent third-party audit firm to assist the Steering Committee with its annual review of billings and allocations.
On June 23, 2014, the Court found that the terms and conditions of the Support Agreement were fair, reasonable and the best available to the Debtors under the circumstances and issued an order authorizing and directing the Debtors to assume the Support Agreement.
On September 11, 2014, the Court entered an order (the “Confirmation Order”) confirming the Plan, and on October 24, 2014, the Debtors successfully emerged from Chapter 11 bankruptcy.
Backstop Commitment Agreement
On May 9, 2014, the Company entered into the Backstop Commitment Agreement, as subsequently amended (the “BCA”), among the Company, Old MPM Holdings, and the commitment parties party thereto (the “Commitment Parties,” and each individually, a “Commitment Party”). The BCA provided that upon the satisfaction of certain terms and conditions, including the confirmation of the Plan, the Company would have the option to require each Commitment Party to purchase from the Company (on a several and not joint basis) its pro rata portion, based on such Commitment Party’s backstop commitment percentage, of the common stock of the reorganized Company (the “New Common Stock”) that is not otherwise purchased in connection with the Rights Offerings which were made in connection with the Plan (the “Unsubscribed Shares”). In consideration for their commitment to purchase the Unsubscribed Shares, the Commitment Parties received a commitment premium equal to $30 (the “BCA Commitment Premium”). The BCA Commitment Premium was payable in shares of New Common Stock; provided, that, if the BCA was terminated under certain circumstances, the BCA Commitment Premium would have been payable in cash. Pursuant to the terms of the BCA, the BCA Commitment Premium was deemed earned, nonrefundable and non-avoidable upon entry of the approval order by the Court. The Company has recognized a $30 liability for the BCA Commitment Premium as of September 30, 2014 under the guidance for accounting for liability instruments. This amount is included in “Reorganization items, net” in the unaudited Condensed Consolidated Statements of Operations and “Other current liabilities” in the unaudited Condensed Consolidated Balance Sheets. The Company has agreed to reimburse the Commitment Parties for all reasonable fees and expenses incurred in connection with, among other things, the negotiation, preparation and implementation of the Rights Offerings, the Plan and any related efforts. In addition, the BCA requires that the Company and the other Debtors indemnify the Commitment Parties for certain losses, claims, damages, liabilities, costs and expenses arising out of or in connection with the BCA, the Plan and the related transactions. On June 23, 2014, the Court found that the terms and conditions of the Support Agreement were fair, reasonable and the best available to the Debtors under the circumstances, and issued an order authorizing and directing the Debtors to enter into, execute, deliver and implement the BCA.
Upon application of fresh-start accounting (see Note 3), on October 24, 2014, the BCA Commitment Premium will be converted to equity in the unaudited Condensed Consolidated Balance Sheets.
Pre-Petition Claims
On June 4, 2014, the Debtors filed schedules of assets and liabilities and statements of financial affairs with the Court, which were amended on July 15, 2014. On June 6, 2014, the Court entered an order establishing July 17, 2014 as the bar date for potential non-governmental creditors and October 10, 2014 for governmental creditors to file proofs of claims and establishing the required procedures with respect to filing such claims. A bar date is the date by which pre-petition claims against the Debtors must be filed if the claimants wish to receive any distribution in the Chapter 11 proceedings.
F-63
Table of Contents
Pre-petition claims will be disposed of in accordance with the Plan. As the Company had not emerged from Chapter 11 bankruptcy as of September 30, 2014, all such amounts are classified as “Liabilities subject to compromise” in the unaudited Condensed Consolidated Balance Sheets.
Subsequent Events
Emergence from Chapter 11 Bankruptcy
On October 24, 2014 (the “Effective Date”), the Plan became effective and the Debtors emerged from the Chapter 11 proceedings.
On or following the Effective Date, and pursuant to the terms of the Plan, the following occurred or is in the process of occurring:
| • | payment in full in cash to general unsecured creditors (including trade creditors) and holders of claims arising from the Cash Flow Facility and the DIP Term Loan Facility; |
| • | payment in full by way of replacement notes to holders of the First Lien Notes and the Senior Secured Notes; |
| • | conversion of the Springing Lien Notes into the new equity of the post-Effective Date Company (the “Successor Company”) (resulting in the issuance of 11,791,126 shares of New Common Stock) (the “Second Lien Notes Equity Distribution”), subject to dilution by the management incentive plan and the Rights Offerings Stock; |
| • | subscription rights to holders of the Springing Lien Notes in the Rights Offerings (resulting in the issuance of 36,197,874 shares of New Common Stock (including shares issued in connection with the Backstop Commitment)); |
| • | a recovery to the holders of Old MPM Holdings’ PIK notes in the amount of the cash available at Old MPM Holdings as of the Effective Date, after taking into account administrative expenses; |
| • | cancellation of the Senior Subordinated Notes on account of the subordination provisions set forth in the indenture to the Senior Subordinated Notes; |
| • | cancellation of the equity of the pre-Effective Date Company (the “Predecessor Company”); |
| • | entry into the $270 Exit ABL Facility (see Note 9); and |
| • | appointment of a new chief executive officer, chief financial officer and general counsel. |
Issuance of New Common Stock
On the Effective Date, all previously issued and outstanding shares of the Company’s common stock were canceled, as were all other previously issued and outstanding equity interests. On the Effective Date, the Company issued 7,475,000 shares (the “1145 Rights Offering Stock”) of a new class of common stock, par value $0.01 per share, of the Company (the “New Common Stock”) pursuant to the rights offering under Section 1145 of the Bankruptcy Code (the “Section 1145 Rights Offering”) and 26,662,690 shares (the “4(a)(2) Rights Offering Stock”) of New Common Stock pursuant to the rights offering under section 4(a)(2) (the “4(a)(2) Rights Offering”) of the Securities Act of 1933, as amended (the “Securities Act). Additionally, the Company issued 2,060,184 shares of New Common Stock pursuant to the Backstop Commitment, including 1,475,652 shares of New Common Stock issued as consideration for the BCA Commitment Premium. A portion of the 1145 Rights Offering Stock issued to the Commitment Parties, and all of the 4(a)(2) Rights Offering Stock, are restricted securities under the Securities Act, and may not be offered, sold or otherwise transferred except in accordance with applicable restrictions. In addition, upon effectiveness of the Plan, the Company issued 11,791,126 shares of New Common Stock to holders of the Second Lien Notes pursuant to the Second Lien Notes Equity Distribution.
F-64
Table of Contents
In accordance with the Plan, all shares of New Common Stock were automatically exchanged for one share of common stock, par value $0.01 per share, of New MPM Holdings, which contributed the shares of New Common Stock to its wholly-owned subsidiary, MPM Intermediate Holdings Inc. As a result, the Company is a wholly owned subsidiary of MPM Intermediate Holdings Inc.
The shares of New Common Stock described above were exempt from registration under the Securities Act pursuant to (i) Section 1145 of the Bankruptcy Code, which generally exempts from such registration requirements the issuance of securities under a plan of reorganization, and/or (ii) Section 4(a)(2) of the Securities Act because the issuance did not involve any public offering.
On November 7, 2014, the Company effected a reverse stock split and, as a result, 48 shares of the New Common Stock remained outstanding.
Under the indentures governing our notes, there are significant restrictions over MPM Holdings Inc.’s ability to obtain funds from its subsidiary, MPM, through dividends, loans or advances.
3. Fresh Start Accounting Subsequent Event
In connection with the Company’s emergence from Chapter 11, the Company will apply the provisions of fresh start accounting to its financial statements as (i) the holders of existing voting shares of the Predecessor Company received less than 50% of the voting shares of the emerging entity and (ii) the reorganization value of the Company’s assets immediately prior to confirmation was less than the post-petition liabilities and allowed claims. The Company will apply fresh start accounting as of October 24, 2014.
Upon the application of fresh start accounting, the Company will allocate the reorganization value to its individual assets based on their estimated fair values. Reorganization value represents the fair value of the Successor Company’s assets before considering liabilities. The excess reorganization value over the fair value of identified tangible and intangible assets will be reported as goodwill.
Reorganization Value
In support of the Plan, the enterprise value of the Successor Company was estimated to be in the range of $2.0 billion to $2.4 billion as of the Effective Date. Based on the estimates and assumptions used in determining the enterprise value, as further discussed below, the Company estimated the enterprise value to be $2.2 billion, which was approved by the Court.
The Company estimated the enterprise value of the Successor Company utilizing the discounted cash flow method. To estimate fair value utilizing the discounted cash flow method, the Company established an estimate of future cash flows based on the financial projections and assumptions utilized in the Company’s disclosure statement, which were derived from earnings forecasts and assumptions regarding growth and margin projections. A terminal value was included, and was calculated using the constant growth method based on the projected cash flows of the final year of the forecast period.
Pro Forma Consolidated Statement of Financial Position
The pro forma adjustments set forth in the following consolidated Balance Sheet reflect the preliminary estimated effect of the consummation of the transactions contemplated by the Plan (reflected in the column “Reorganization Adjustments”) as well as fair value adjustments as a result of the adoption of fresh-start accounting (reflected in the column “Fresh Start Adjustments”) on the Company’s unaudited Condensed Consolidated Balance Sheet as of September 30, 2014, had the Plan been effective on that date.
The Reorganization Adjustments reflect the estimated effect of the consummation of the transactions contemplated by the Plan, including the settlement of various liabilities, issuance of securities, repayment of certain debt and other cash payments. These adjustments reflect preliminary estimates, and actual amounts to be recorded as of the Effective Date may be materially different from these estimates.
F-65
Table of Contents
The Fresh Start Adjustments are based upon asset appraisals which are preliminary and subject to change. As a result, changes in values and assumptions from those reflected below may materially affect the reported value of assets and liabilities, as well as goodwill. Additionally, amounts will differ due to the results of operations between September 30, 2014 and the Effective Date.
The pro forma effects of the consummation of the Plan and fresh-start accounting on the Company’s unaudited Condensed Consolidated Balance Sheet as of September 30, 2014 are as follows:
| Predecessor Company |
Reorganization Adjustments(1) |
Fresh Start Adjustments(2) |
Successor Company |
|||||||||||||
| Assets |
||||||||||||||||
| Current assets: |
||||||||||||||||
| Cash and cash equivalents |
$ | 139 | $ | 120 | $ | — | $ | 259 | ||||||||
| Accounts receivable |
340 | — | — | 340 | ||||||||||||
| Inventories |
429 | — | 9 | 438 | ||||||||||||
| Deferred income taxes |
5 | 75 | (3 | ) | 77 | |||||||||||
| Other current assets |
76 | — | — | 76 | ||||||||||||
|
|
|
|
|
|
|
|
|
|||||||||
| Total current assets |
989 | 195 | 6 | 1,190 | ||||||||||||
| Investment in unconsolidated entities |
10 | — | 8 | 18 | ||||||||||||
| Deferred income taxes |
3 | 25 | 14 | 42 | ||||||||||||
| Other long-term assets |
24 | 3 | — | 27 | ||||||||||||
| Property and equipment, net |
872 | — | 246 | 1,118 | ||||||||||||
| Goodwill |
362 | — | (73 | ) | 289 | |||||||||||
| Other intangible assets, net |
404 | — | 11 | 415 | ||||||||||||
|
|
|
|
|
|
|
|
|
|||||||||
| Total assets |
$ | 2,664 | $ | 223 | $ | 212 | $ | 3,099 | ||||||||
|
|
|
|
|
|
|
|
|
|||||||||
| Liabilities and Deficit |
||||||||||||||||
| Current liabilities: |
||||||||||||||||
| Accounts payable |
$ | 222 | $ | 38 | $ | — | $ | 260 | ||||||||
| Debt payable within one year |
1,770 | (1,733 | ) | — | 37 | |||||||||||
| Interest payable |
59 | (58 | ) | — | 1 | |||||||||||
| Income taxes payable |
6 | — | — | 6 | ||||||||||||
| Deferred income taxes |
13 | — | — | 13 | ||||||||||||
| Accrued payroll and incentive compensation |
44 | 12 | — | 56 | ||||||||||||
| Other current liabilities |
96 | (25 | ) | — | 71 | |||||||||||
|
|
|
|
|
|
|
|
|
|||||||||
| Total current liabilities |
2,210 | (1,766 | ) | — | 444 | |||||||||||
| Long-term liabilities: |
||||||||||||||||
| Long-term debt |
7 | 1,159 | — | 1,166 | ||||||||||||
| Pension and post employment benefit obligations |
134 | 164 | 45 | 343 | ||||||||||||
| Deferred income taxes |
63 | (65 | ) | 190 | 188 | |||||||||||
| Other long-term liabilities |
51 | 8 | 11 | 70 | ||||||||||||
| Liabilities subject to compromise |
2,026 | (2,026 | ) | — | — | |||||||||||
|
|
|
|
|
|
|
|
|
|||||||||
| Total liabilities |
4,491 | (2,526 | ) | 246 | 2,211 | |||||||||||
|
|
|
|
|
|
|
|
|
|||||||||
| (Deficit) Equity |
||||||||||||||||
| Common stock (Successor) |
— | — | — | — | ||||||||||||
| Additional paid-in capital (Successor) |
— | 888 | — | 888 | ||||||||||||
| Common stock (Predecessor) |
— | — | — | — | ||||||||||||
| Additional paid-in capital (Predecessor) |
713 | (713 | ) | — | — | |||||||||||
| Accumulated other comprehensive income |
219 | — | (219 | ) | — | |||||||||||
| Accumulated deficit |
(2,759 | ) | 2,574 | 185 | — | |||||||||||
|
|
|
|
|
|
|
|
|
|||||||||
| Total (deficit) equity |
(1,827 | ) | 2,749 | (34 | ) | 888 | ||||||||||
|
|
|
|
|
|
|
|
|
|||||||||
| Total liabilities and (deficit) equity |
$ | 2,664 | $ | 223 | $ | 212 | $ | 3,099 | ||||||||
|
|
|
|
|
|
|
|
|
|||||||||
F-66
Table of Contents
| (1) | Reflects adjustments related to the consummation of the Plan, including the settlement of liabilities subject to compromise and related payments, other distributions of cash, issuance of new shares of common stock and the cancellation of the common equity of the Predecessor Company, as discussed in Note 2. |
| (2) | Reflects adjustments related to fresh-start accounting, including the write-up of inventory and the adjustment of property, plant and equipment to its appraised fair value. Adjustments for other intangible assets and deficit are also included and are based on third party valuations performed by certain valuation specialists. The fresh-start adjustments also include the elimination of the accumulated deficit and accumulated other comprehensive income of the Predecessor Company. These adjustments reflect preliminary estimates, and actual amounts to be recorded as of the Effective Date may be materially different from these estimates. |
The reorganization value of each of our reporting units was allocated to the individual assets and liabilities based upon their estimated fair market values. Allocations were first made to current assets and liabilities and long-term monetary assets and liabilities. The remainder of the reorganization value was allocated to long-term assets such as property, plant and equipment, equity method investments and intangible assets. The excess of reorganization value over the estimated fair value of the Company’s assets is estimated to be $289, and is reflected as goodwill.
4. Liabilities Subject to Compromise
Liabilities subject to compromise represent unsecured liabilities that have been accounted for under the Company’s Plan. As a result of the Bankruptcy Filing, actions to enforce or otherwise effect payment of pre-petition liabilities are generally stayed. These liabilities represent the amounts which have been allowed on known claims which were resolved through the Chapter 11 process, and have been approved by the Court as a result of the Confirmation Order.
Subsequent to the Petition Date, the Company received approval from the Court to pay or otherwise honor certain pre-petition obligations generally designed to stabilize the Company’s operations, such as certain employee wages, salaries and benefits, certain taxes and fees, customer obligations, obligations to logistics providers and pre-petition amounts owed to certain critical vendors. The Company has honored payments to vendors and other providers in the ordinary course of business for goods and services received after the Petition Date.
The following table summarizes pre-petition liabilities that are classified as “Liabilities subject to compromise” in the unaudited Condensed Consolidated Balance Sheets:
| As of September 30, 2014 |
||||
| Accounts payable |
$ | 65 | ||
| Debt |
1,727 | |||
| Interest payable |
46 | |||
| Pension and other post employment benefit obligations |
163 | |||
| Other |
25 | |||
|
|
|
|||
| Total |
$ | 2,026 | ||
|
|
|
|||
The Bankruptcy Filing was an event of default under the ABL Facility, the Cash Flow Facility and the indentures that govern the Company’s notes (see Note 9). Interest payable reflects pre-petition accrued interest related to the Debtor’s unsecured debt. Other liabilities subject to compromise primarily include accrued liabilities for incentive compensation, environmental and legal items.
These liabilities were disposed of in accordance with the Plan, as applicable, on or shortly after the Company emerged from Chapter 11 bankruptcy on October 24, 2014.
F-67
Table of Contents
5. Reorganization Items, Net
Incremental costs incurred directly as a result of the Bankruptcy Filing and adjustments to the expected amount of allowed claims for liabilities subject to compromise are classified as “Reorganization items, net” in the unaudited Condensed Consolidated Statements of Operations. The following table summarizes reorganization items, net for the three and nine months ended September 30, 2014:
| Three Months Ended September 30, 2014 |
Nine Months Ended September 30, 2014 |
|||||||
| Professional fees |
$ | 41 | $ | 62 | ||||
| DIP Facility financing costs |
— | 19 | ||||||
| BCA Commitment Premium |
— | 30 | ||||||
| Other |
3 | 3 | ||||||
|
|
|
|
|
|||||
| Total |
$ | 44 | $ | 114 | ||||
|
|
|
|
|
|||||
6. Summary of Significant Accounting Policies
Use of Estimates—The preparation of financial statements in conformity with accounting principles generally accepted in the United States of America requires management to make estimates and assumptions that affect the reported amounts of assets and liabilities, and also requires the disclosure of contingent assets and liabilities at the date of the financial statements. In addition, it requires management to make estimates and assumptions that affect the reported amounts of revenues and expenses during the reporting period. Actual results could differ from these estimates.
Subsequent Events—The Company has evaluated events and transactions subsequent to September 30, 2014 through November 14, 2014, the date of issuance of its unaudited Condensed Consolidated Financial Statements, and updated the evaluation of subsequent events through December 31, 2014.
Recently Issued Accounting Standards
In May, 2014, the Financial Accounting Standards Board (“FASB”) issued Accounting Standards Board Update No. 2014-09: Revenue from Contracts with Customers (Topic 606) (“ASU 2014-09”). ASU 2014-09 supersedes the existing revenue recognition guidance and most industry-specific guidance applicable to revenue recognition. According to the new guidance, an entity will apply a principles-based five step model to recognize revenue upon the transfer of promised goods or services to customers and in an amount that reflects the consideration for which the entity expects to be entitled in exchange for those goods or services. The guidance is effective for annual periods beginning after December 15, 2016, including interim periods within that reporting period and early application is not permitted. The Company is currently assessing the potential impact of ASU 2014-09 on its financial statements.
In August 2014, the FASB issued Accounting Standards Board Update No. 2014-15: Presentation of Financial Statements—Going Concern—Disclosures of Uncertainties about an entity’s Ability to Continue as a Going Concern (“ASU 2014-15”). ASU 2014-15 provides new guidance related to management’s responsibility to evaluate whether there is substantial doubt about an entity’s ability to continue as a going concern by incorporating and expanding upon certain principles that are currently in U.S. auditing standards and to provide related footnote disclosures. This new guidance is effective for the annual period ending after December 15, 2016, and for annual periods and interim periods thereafter. The requirements of ASU 2014-15 are not expected to have a significant impact on the Company’s financial statements.
7. Related Party Transactions
Administrative Services, Management and Consulting Agreement
The Company was subject to a management consulting and advisory services agreement with Apollo and its affiliates for the provision of management and advisory services for an initial term of up to twelve years. The
F-68
Table of Contents
Company had also agreed to indemnify Apollo and its affiliates and their directors, officers and representatives for potential losses relating to the services contemplated under these agreements. Terms of the agreement provided for annual fees of $4 plus out of pocket expenses, payable in one lump sum annually, and provided for a lump-sum settlement equal to the net present value of the remaining annual management fees payable under the remaining term of the agreement in connection with a sale or initial public offering by the Company. This annual management fee was waived for 2014.
In connection with the Company’s emergence from Chapter 11, the management agreement was terminated pursuant to the Confirmation Order, effective as of the Petition Date.
Transactions with MSC
Shared Services Agreement
On October 1, 2010, the Company entered into a shared services agreement with MSC (which, from October 1, 2010 through October 24, 2014, was a subsidiary under a common parent) (the “Shared Services Agreement”). Under this agreement, the Company provides to MSC, and MSC provides to the Company, certain services, including, but not limited to, executive and senior management, administrative support, human resources, information technology support, accounting, finance, technology development, legal and procurement services. The Shared Services Agreement is subject to termination by either the Company or MSC, without cause, on not less than 30 days’ written notice, and expires in October 2015 (subject to one-year renewals every year thereafter; absent contrary notice from either party). The Shared Services Agreement establishes certain criteria upon which the costs of such services are allocated between the Company and MSC. Pursuant to this agreement, during the nine months ended September 30, 2014 and 2013, the Company incurred approximately $76 and $67, respectively, of net costs for shared services and MSC incurred approximately $100 and $90, respectively, of net costs for shared services. Included in the net costs incurred during the nine months ended September 30, 2014 and 2013, were net billings from MSC to the Company of $31 and $21, respectively, to bring the percentage of total net incurred costs for shared services under the Shared Services Agreement to the applicable allocation percentage. The allocation percentage for 2014 remains unchanged from 2013, which was 57% for MSC and 43% for the Company. The Company had accounts receivable from MSC of less than $1 as of December 31, 2013, and accounts payable to MSC of $14 and $4 at September 30, 2014 and December 31, 2013, respectively.
In conjunction with the consummation of the Plan, the Shared Services Agreement was amended to, among other things, (i) exclude the services of certain executive officers, (ii) provide for a transition assistance period at the election of the recipient following termination of the Shared Services Agreement of up to 12 months, subject to one successive renewal period of an additional 60 days and (iii) provide for the use of an independent third-party audit firm to assist the Steering Committee with its annual review of billings and allocations.
Purchases and Sales of Products and Services with MSC
The Company also sells products to, and purchases products from MSC, pursuant to a Master Buy/Sell Agreement dated as of September 6, 2012 (the “Master Buy/Sell Agreement”). Prices under the agreement are determined by a formula based upon certain third party sales of the applicable product, or in the event that no qualifying third party sales have taken place, based upon the average contribution margin generated by certain third party sales of products in the same or a similar industry. The standard terms and conditions of the seller in the applicable jurisdiction apply to transactions under the Master Buy/Sell Agreement. A subsidiary of the Company also acts as a non-exclusive distributor in India for certain of MSC’s subsidiaries pursuant to Distribution Agreements dated as of September 6, 2012 (the “Distribution Agreements”). Prices under the Distribution Agreements are determined by a formula based on the weighted average sales price of the applicable product less a margin. The Master Buy/Sell Agreement and Distribution Agreements have initial terms of three years and may be terminated for convenience by either party thereunder upon 30 days’ prior notice in the case of the Master/Buy Sell Agreement and upon 90 days’ prior notice in the case of the Distribution Agreements.
F-69
Table of Contents
Pursuant to these agreements and other purchase orders, during the three months ended September 30, 2014 and 2013, the Company sold $2 of products to MSC and purchased less than $1 and $1, respectively. During the nine months ended September 30, 2014 and 2013, the Company sold $6 and $4, respectively, of products to MSC and purchased less than $1 and $1, respectively. As of both September 30, 2014 and December 31, 2013, the Company had $1 of accounts receivable from MSC and less than $1 of accounts payable to MSC related to these agreements.
Other Transactions with MSC
In March 2014, the Company entered into a ground lease with a Brazilian subsidiary of MSC to lease a portion of the Company’s manufacturing site in Itatiba, Brazil, where the subsidiary of MSC will construct and operate an epoxy production facility. In conjunction with the ground lease, the Company also entered into a site services agreement whereby it will provide to the subsidiary of MSC various services such as environmental, health and safety, security, maintenance and accounting, amongst others, to support the operation of this new facility. The Company received less than $1 from MSC under this agreement during both the three and nine months ended September 30, 2014.
In April 2014, the Company sold 100% of its interest in its Canadian subsidiary to a subsidiary of MSC for a purchase price of $12. As a part of the transaction the Company also entered into a non-exclusive distribution agreement with a subsidiary of MSC, whereby the subsidiary of MSC will act as a distributor of certain of the Company’s products in Canada. The agreement has a term of 10 years, and is cancelable by either party with 180 days’ notice. The Company compensates the subsidiary of MSC for acting as distributor at a rate of 2% of the net selling price of the related products sold. During the three and nine months ended September 30, 2014, the Company sold approximately $10 and $20, respectively, of products to MSC under this distribution agreement, and paid less than $1 to MSC as compensation for acting as distributor of the products. As of September 30, 2014, the Company had $3 of accounts receivable from MSC related to the distribution agreement.
As both the Company and MSC shared a common ultimate parent at the time of the transaction, this sale was accounted for as a transaction under common control, as defined in the accounting guidance for business combinations. As such, the loss on the sale of $3 was accounted for as a capital distribution, and is reflected in “Paid-in-Capital” in the unaudited Condensed Consolidated Balance Sheets.
Transactions with Affiliates Other Than MSC
Purchases and Sales of Products and Services
The Company sells products to various affiliates other than MSC. These sales were $3 and $2 for the three months ended September 30, 2014 and 2013, respectively, and $9 and $7 for the nine months ended September 30, 2014 and 2013, respectively. Receivables from these affiliates were $2 and $1 at September 30, 2014 and December 31, 2013, respectively. The Company also purchases products and services from various affiliates other than MSC. These purchases were $5 and $4 the three months ended September 30, 2014 and 2013, respectively, and $12 and $13 for the nine months ended September 30, 2014 and 2013, respectively. The Company had accounts payable to these affiliates of $1 and $2 as of September 30, 2014 and December 31, 2013, respectively.
ASM Off-Take Agreement
Through May 17, 2013, the Company was a party to an (i) off-take agreement (the “Old Off-Take Agreement”) with Asia Silicones Monomer Limited (“ASM”), which was 50% owned by GE Monomer (Holdings) Pte Ltd. up until such date, and (ii) a long-term supply agreement with General Electric Company (“GE”) and GE Monomer (Holdings) Pte. Ltd. (the “Old GE Supply Agreement”), which was entered into at the closing of the GE Advanced Materials Acquisition. Under the Old Off-Take Agreement, ASM was obligated to provide siloxane and certain related products to the Company through 2014 (or until certain ASM financing
F-70
Table of Contents
obligations were satisfied). Under the Old GE Supply Agreement, GE and GE Monomer (Holdings) Pte. Ltd. agreed to ensure the Company a minimum annual supply of siloxane and certain related products from ASM or an alternative source in certain circumstances through December 2026. Under the Old Off-Take Agreement, the Company purchased approximately $35 of siloxane and certain related products from ASM for the nine months ended September 30, 2013. Subsequent to May 17, 2013, the Company continues to purchase siloxane and certain related products from ASM under a new agreement whereby ASM is not a considered a related party.
Revolving Credit Facility
In April 2013, the Company entered into a $75 revolving credit facility with an affiliate of GE (the “Cash Flow Facility”) (see Note 9). Prior to entry into the Cash Flow Facility, an affiliate of GE was one of the lenders under the Company’s prior senior secured revolving credit facility, representing approximately $160 of the lenders’ $300 revolving credit facility commitment. As of September 30, 2014, $20 was outstanding under the Cash Flow Facility.
Transactions and Arrangements with Parent and its Subsidiaries
Prior to June 30, 2014, Momentive Performance Materials Holdings LLC (the Company’s ultimate parent prior to October 24, 2014) (“Momentive Holdings”) purchased insurance policies which also covered the Company and MSC. Amounts were billed to the Company annually based on the Company’s relative share of the insurance premiums and amortized over the term of the policy. There were no billings to the Company for both the three and nine months ended September 30, 2014 and $9 for both the three and nine months ended September 30, 2013. The Company had accounts payable to Momentive Holdings of $3 under these arrangements at December 31, 2013.
In March 2014, the Company entered into an Employee Services Agreement with Momentive Holdings, MSC and Momentive Performance Materials Holdings Employee Corporation (“Employee Corp.”), a subsidiary of Momentive Holdings (the “Services Agreement”). The Services Agreement provides for the executive services of Mr. Jack Boss, an employee of Employee Corp., to be made available to the Company and sets forth the terms with respect to payment for the cost of such services. Mr. Boss was elected Executive Vice President and President, Silicones and Quartz Division of the Company effective March 31, 2014. Pursuant to the Services Agreement, the Company agrees to pay 100% of Mr. Boss’s costs of employment which are comprised of “Covered Costs” including an annual base salary of $585 thousand, a sign-on bonus of $1.3 payable between 2014 and 2015, annual incentive compensation, relocation costs, severance and benefits and other standard reasonable business expenses. The Company paid less than $1 under this agreement during both the three and nine months ended September 30, 2014.
In April 2014, the Company entered into an accounts receivable purchase and sale agreement with Superholdco Finance Corp (“Finco”), a newly formed subsidiary of Momentive Holdings. The agreement contains customary terms and conditions associated with such arrangements. On April 7, 2014, under this agreement, the Company sold approximately $51 of accounts receivable to Finco, and received 95% of the proceeds in cash, with the remaining 5% received in cash once the sold receivables were fully collected by Finco. The agreement also appointed the Company to act as the servicer of the receivables on behalf of Finco.
Finco was deemed to be a VIE, and the 5% holdback of cash by Finco represented the Company’s variable interest in Finco. The power to direct the activities that most significantly impact the VIE is shared between the Company and the other related party variable interest entity holder. The 5% holdback of cash by Finco previously resulted in the Company absorbing the majority of the risk from potential losses or the majority of the gains from potential returns of the VIE and, therefore, the Company had consolidated Finco in its unaudited Condensed Consolidated Financial Statements during a portion of the nine months ended September 30, 2014. As a result, the Company consolidated $50 of cash and cash equivalents and a $50 affiliated loan payable. During the three months ended September 30, 2014, the affiliated loan payable was repaid in full and the 5% holdback of
F-71
Table of Contents
cash was received from Finco. As such, as of September 30, 2014, the Company does not absorb the majority of risk from the potential losses or the majority of the gains from potential returns of the VIE, and therefore, as of September 30, 2014, the Company does not consolidate Finco.
8. Fair Value Measurements
Fair value is the exchange price that would be received for an asset or paid to transfer a liability (an exit price) in the principal or most advantageous market for the asset or liability in an orderly transaction between market participants on the measurement date. A fair value hierarchy exists, which requires an entity to maximize the use of observable inputs and minimize the use of unobservable inputs when measuring fair value. The three levels of inputs that may be used to measure fair value are:
| • | Level 1: Inputs are quoted prices (unadjusted) for identical assets or liabilities in active markets. |
| • | Level 2: Pricing inputs are other than quoted prices in active markets included in Level 1, which are either directly or indirectly observable as of the reported date. |
| • | Level 3: Unobservable inputs, that are supported by little or no market activity and are developed based on the best information available in the circumstances. For example, inputs derived through extrapolation or interpolation that cannot be corroborated by observable market data. |
Recurring Fair Value Measurements
At both September 30, 2014 and December 31, 2013, the Company had less than $1 of natural gas derivative contracts, which are measured using Level 2 inputs, and are included in “Other current assets” in the unaudited Condensed Consolidated Balance Sheets. The fair value of the natural gas derivative contracts generally reflects the estimated amounts that the Company would receive or pay, on a pre-tax basis, to terminate the contracts at the reporting date based on broker quotes for the same or similar instruments. Counterparties to these contracts are highly rated financial institutions, none of which experienced any significant downgrades that would reduce the fair value receivable amount owed, if any, to the Company. There were no transfers between Level 1, Level 2 or Level 3 measurements during the three or nine months ended September 30, 2014
Non-derivative Financial Instruments
The following table summarizes the carrying amount and fair value of the Company’s non-derivative financial instruments:
| Carrying Amount |
Fair Value | |||||||||||||||||||
| Level 1 | Level 2 | Level 3 | Total | |||||||||||||||||
| September 30, 2014 |
||||||||||||||||||||
| Debt |
$ | 3,504 | $ | — | $ | 2,735 | $ | — | $ | 2,735 | ||||||||||
| December 31, 2013 |
||||||||||||||||||||
| Debt |
$ | 3,257 | $ | — | $ | 3,029 | $ | — | $ | 3,029 | ||||||||||
Fair values of debt classified as Level 2 are determined based on other similar financial instruments, or based upon interest rates that are currently available to the Company for the issuance of debt with similar terms and maturities. The carrying amount of cash and cash equivalents, accounts receivable, accounts payable and other accrued liabilities are considered reasonable estimates of their fair values due to the short-term maturity of these financial instruments.
9. Debt Obligations
As of September 30, 2014, the Company had $63 of outstanding borrowings under the DIP ABL Facility and $20 of outstanding borrowings under the Cash Flow Facility. The outstanding letters of credit under the DIP ABL Facility at September 30, 2014 were $74, leaving an unused borrowing capacity of $133.
F-72
Table of Contents
Debt outstanding at September 30, 2014 and December 31, 2013 is as follows:
| September 30, 2014 | December 31, 2013 | |||||||||||||||||||
| Liabilities Subject to Compromise |
Long- Term |
Due Within One Year |
Long- Term |
Due Within One Year |
||||||||||||||||
| Senior Secured Credit Facilities: |
||||||||||||||||||||
| ABL Facility |
$ | — | $ | — | $ | — | $ | — | $ | 135 | ||||||||||
| Cash Flow Facility |
— | — | 20 | — | — | |||||||||||||||
| DIP Facilities: |
||||||||||||||||||||
| DIP ABL Facility |
— | — | 63 | — | — | |||||||||||||||
| DIP Term Loan Facility |
— | — | 300 | — | — | |||||||||||||||
| First Lien and Senior Secured Notes: |
||||||||||||||||||||
| 8.875% First Lien Notes due 2020 |
— | — | 1,100 | — | 1,100 | |||||||||||||||
| 10.00% Senior Secured Notes due 2020 |
— | — | 250 | — | 250 | |||||||||||||||
| Springing Lien Notes: |
||||||||||||||||||||
| 9.00% Springing Lien Dollar Notes due 2021 |
1,161 | — | — | — | 1,161 | |||||||||||||||
| 9.50% Springing Lien Euro Notes due 2021 |
184 | — | — | — | 183 | |||||||||||||||
| Other Borrowings: |
||||||||||||||||||||
| 11.50% Senior Subordinated Notes due 2016 |
382 | — | — | — | 382 | |||||||||||||||
| China bank loans |
— | 7 | 30 | 7 | 33 | |||||||||||||||
| Other |
— | — | 7 | — | 6 | |||||||||||||||
|
|
|
|
|
|
|
|
|
|
|
|||||||||||
| Total debt |
$ | 1,727 | $ | 7 | $ | 1,770 | $ | 7 | $ | 3,250 | ||||||||||
|
|
|
|
|
|
|
|
|
|
|
|||||||||||
The Bankruptcy Filing, was an event of default under the ABL Facility, the Cash Flow Facility and the indentures that govern the Company’s notes. As such, all outstanding debt as of December 31, 2013 related to the ABL Facility, the Cash Flow Facility, the First Lien Notes, the Senior Secured Notes, the Springing Lien Notes and the Senior Subordinated Notes were classified as “Debt payable within one year” in the unaudited Condensed Consolidated Balance Sheets and related footnote disclosures. As of September 30, 2014, all outstanding debt related to the DIP Term Loan Facility, the Cash Flow Facility, the First Lien Notes and the Senior Secured Notes has been classified as “Debt payable within one year” in the unaudited Condensed Consolidated Balance Sheets, as these obligations are fully collateralized. As of September 30, 2014, all amounts related to the Debtor’s unsecured debt are classified in “Liabilities subject to compromise” in the unaudited Condensed Consolidated Balance Sheets. Additionally, as a result of the Bankruptcy Filing, the Company ceased accruing interest on the Debtor’s unsecured debt in April 2014.
In their opinion to the Consolidated Financial Statements included in our Annual Report on Form 10-K for the year ended December 31, 2013, the Company’s auditors, PricewaterhouseCoopers LLP, concluded that there was substantial doubt about the Company’s ability to continue as a going concern for the next 12 months. Additionally, the Company did not furnish its financial statements for the fiscal year ended December 31, 2013 to the lenders under the ABL Facility and Cash Flow Facility within the required time frame of 95 days from such fiscal year end. Both of these events, as well as the Bankruptcy Filing described in Note 2, triggered a violation of the covenants under the ABL Facility and Cash Flow Facility. The Company obtained waivers of these covenant violations from its lenders under the ABL Facility and Cash Flow Facility, which violations, if not waived or cured within a specified cure period, may have given rise to an acceleration under the ABL Facility and Cash Flow Facility and triggered cross-acceleration clauses under the indentures that govern the Company’s notes. Pursuant to such waivers, the lenders also agreed, subject to certain conditions and/or ongoing covenants and termination events, to waive any defaults or events of default arising under the ABL Facility or the Cash Flow Facility as a result of the commencement of a Chapter 11 filing.
The Bankruptcy Filing also constituted an event of default that accelerated the Company’s obligations under its First Lien Notes, Senior Secured Notes, Springing Lien Notes and Senior Subordinated Notes (collectively,
F-73
Table of Contents
the “Notes”). The Notes provide that as a result of the Bankruptcy Filing the principal and interest due thereunder shall be immediately due and payable; however, any efforts to enforce such payment obligations under the Notes are automatically stayed as a result of the Bankruptcy Filing and the creditors’ rights of enforcement in respect of the Notes are subject to the applicable provisions of the U.S. Bankruptcy Code.
Debtor-in-Possession Financing
DIP ABL Facility and Exit ABL Facility
In connection with the Bankruptcy Filing, in April 2014, Old MPM Holdings, the Company and certain of its subsidiaries entered into the DIP ABL Facility and the DIP Term Loan Facility, as further described in Note 2. During the nine months ended September 30, 2014, the Company borrowed $300 under the DIP Term Loan Facility, the proceeds of which were used in part to repay the outstanding balance under the ABL Facility.
Upon consummation of the Plan by the Company on October 24, 2014, the Company exercised its option to convert the DIP ABL Facility into an exit asset-based revolving facility (the “Exit ABL Facility”). The Exit ABL Facility has a five year term and a maximum availability of $270. The Exit ABL Facility is also subject to a borrowing base that is based on a specified percentage of eligible accounts receivable and inventory and, in certain foreign jurisdictions, machinery and equipment.
The Exit ABL Facility bears interest based on, at the Company’s option, (a) with respect to Tranche A Revolving Facility Commitments (as defined in the credit agreement governing the Exit ABL Facility), an adjusted LIBOR rate plus an applicable margin of 2.00% or an alternate base rate plus an applicable margin of 1.00% and (b) with respect to Tranche B Revolving Facility Commitments (as defined in the credit agreement governing the Exit ABL Facility), an adjusted LIBOR rate plus an applicable margin of 2.75% or an alternative base rate plus an applicable margin of 1.75%, in each case, subject to adjustment depending on usage. In addition to paying interest on outstanding principal under the Exit ABL Facility, the Company will be required to pay a commitment fee to the lenders in respect of the unutilized commitments at an initial rate equal to 0.375% per annum, subject to adjustment depending on the usage. The Exit ABL Facility does not have any financial maintenance covenants, other than a minimum fixed charge coverage ratio of 1.0 to 1.0 that only applies if availability is less than the greater of (a) 12.5% of the lesser of the borrowing base and the total Exit ABL Facility commitments at such time and (b) $27. The fixed charge coverage ratio under the agreement governing the Exit ABL Facility is defined as the ratio of (a) Adjusted EBITDA minus non-financed capital expenditures and cash taxes to (b) debt service plus cash interest expense plus certain restricted payments, each measured on a last twelve months basis.
The Exit ABL Facility is secured by, among other things, first-priority liens on most of the inventory and accounts receivable and related assets of the Company, its domestic subsidiaries and certain of its foreign subsidiaries, and, in the case of certain foreign subsidiaries, machinery and equipment (the “Exit ABL Priority Collateral”), and second-priority liens on certain collateral that generally includes most of the Company’s, its domestic subsidiaries’ and certain of its foreign subsidiaries’ assets other than Exit ABL Priority Collateral (the “DIP Term Loan Priority Collateral”), in each case subject to certain exceptions and permitted liens.
DIP Term Loan Facility
In connection with the Bankruptcy Filing, on April 15, 2014, the Company entered into a senior secured debtor-in-possession term loan agreement, as amended (the “DIP Term Loan Facility”) (collectively with the DIP ABL Facility, the “DIP Facilities”). Proceeds from the DIP Term Loan Facility were used in part to repay in full the outstanding obligations under the Company’s existing ABL Facility. The amount committed and made available under the DIP Term Loan Facility was $300. The DIP Term Loan Facility bore interest based on, at the Company’s option, an adjusted LIBOR rate plus an applicable margin of 3.25% or an alternate base rate plus an applicable margin of 2.25%. The DIP Term Loan Facility was terminated upon consummation of the Plan by the Company on October 24, 2014. All amounts outstanding under the DIP Term Loan Facility as of such date were repaid in full.
F-74
Table of Contents
Subsequent Events
Cash Flow Facility
In connection with the consummation of the Plan, on October 24, 2014, the Company repaid in full all outstanding amounts under the Cash Flow Facility. Upon making these payments, the Company’s obligations under the Cash Flow Facility were satisfied in full and the Cash Flow Facility was immediately terminated.
New First Lien and Second Lien Notes
New First Lien Notes
Additionally, upon consummation of the Plan, on October 24, 2014, the Company issued $1,100 aggregate principal amount of 3.88% First-Priority Senior Secured Notes due 2021 (the “New First Lien Notes”). The New First Lien Notes were issued as replacement for the Company’s existing $1,100 outstanding principal amount of 8.875% First Lien Notes due 2020.
The New First Lien Notes are fully and unconditionally guaranteed on a senior secured basis by each of the Company’s existing U.S. subsidiaries that is a guarantor under the Company’s Exit ABL Facility and the Company’s future U.S. subsidiaries (other than receivables subsidiaries and U.S. subsidiaries of foreign subsidiaries) that guarantee any debt of the Company or any of the guarantor subsidiaries of the Company under the related indenture (the “Note Guarantors”). Pursuant to customary release provisions in the indenture governing the New First Lien Notes, the Note Guarantors may be released form their guarantee of the New First Lien Notes (the “New First Lien Note Guarantees”). The New First Lien Notes are not guaranteed by MPM Intermediate Holdings Inc.
The New First Lien Notes and New First Lien Note Guarantees are senior indebtedness of the Company and the Note Guarantors, respectively, and rank equal in right of payment with all existing and future senior indebtedness of the Company and the Note Guarantors, respectively; senior in right of payment to all existing and future subordinated indebtedness of the Company and the Note Guarantors and guarantees thereof; and structurally subordinated to all existing and future indebtedness and other liabilities of any of the Company’s subsidiaries that do not guarantee the New First Lien Notes.
The New First Lien Notes and New First Lien Note Guarantees have the benefit of first-priority liens on the collateral of the Company and the Note Guarantors other than the Exit ABL Priority Collateral, with respect to which the New First Lien Notes and New First Lien Note Guarantees have the benefit of second-priority liens. Consequently, the New First Lien Notes rank effectively junior in priority to the Company’s obligations under the Exit ABL Facility to the extent of the value of the Exit ABL Priority Collateral; equal with holders of other obligations secured pari passu with the New First Lien Notes including other first priority obligations (to the extent of the value of such collateral); effectively senior to any junior priority obligations (to the extent of the value of such collateral) including the New Second Lien Notes (further described below) and the Company’s obligations under the Exit ABL Facility to the extent of the value of the collateral that is not Exit ABL Priority Collateral; and effectively senior to any senior unsecured obligations (to the extent of the value of such collateral).
Interest on the New First Lien Notes is payable at 3.88% per annum, semiannually to holders of record at the close of business on April 1 or October 1 immediately preceding the interest payment date on April 15 and October 15 of each year, commencing on April 15, 2015. The Company may redeem some or all of the New First Lien Notes at any time at a redemption price of 100% of the principal amount plus accrued and unpaid interest.
F-75
Table of Contents
New Second Lien Notes
Additionally, upon consummation of the Plan, on October 24, 2014, the Company issued $250 aggregate principal amount of 4.69% Second Lien Notes due 2022 (the “New Second Lien Notes”). The New Second Lien Notes were issued as replacement for the Company’s existing $250 outstanding principal amount of 10% Senior Secured Notes due 2020.
The New Second Lien Notes are fully and unconditionally guaranteed on a senior secured basis by each of the Company’s existing U.S. subsidiaries that is a guarantor under the Company’s Exit ABL Facility and the Company’s future U.S. subsidiaries (other than receivables subsidiaries and U.S. subsidiaries of foreign subsidiaries) that guarantee any debt of the Company or any Note Guarantor. Pursuant to customary release provisions in the indenture governing the New Second Lien Notes, the Note Guarantors may be released form their guarantee of the New Second Lien Notes (the “New Second Lien Note Guarantees”). The New Second Lien Notes are not guaranteed by MPM Intermediate Holdings Inc.
The New Second Lien Notes and New Second Lien Note Guarantees are senior indebtedness of the Company and the Note Guarantors, respectively, and rank equal in right of payment with all existing and future senior indebtedness of the Company and the Note Guarantors, respectively; senior in right of payment to all existing and future subordinated indebtedness of the Company and the Note Guarantors and guarantees thereof; and structurally subordinated to all existing and future indebtedness and other liabilities of any of the Company’s subsidiaries that do not guarantee the New Second Lien Notes.
The New Second Lien Notes and New Second Lien Note Guarantees have the benefit of second-priority liens on the collateral of the Company and the Note Guarantors. Consequently, the New Second Lien Notes rank effectively junior in priority to the Company’s obligations under the Exit ABL Facility, the New First Lien Notes and other first priority obligations (to the extent of the value of such collateral); equal with holders of other obligations secured pari passu with the New Second Lien Notes (to the extent of the value of such collateral); effectively senior to any junior priority obligations (to the extent of the value of such collateral); and effectively senior to any senior unsecured obligations (to the extent of the value of such collateral).
Interest on the New Second Lien Notes is payable at 4.69% per annum, semiannually to holders of record at the close of business on April 1 or October 1 immediately preceding the interest payment date on April 15 and October 15 of each year, commencing on April 15, 2015. The Company may redeem some or all of the New Second Lien Notes at any time at a redemption price of 100% of the principal amount plus accrued and unpaid interest.
General
The New First Lien Notes Indenture and the New Second Lien Notes Indenture contains covenants that, among other things, limit the Company’s ability and the ability of certain of the Company’s subsidiaries to (i) incur or guarantee additional indebtedness or issue preferred stock; (ii) grant liens on assets; (iii) pay dividends or make distributions to the Company’s stockholders; (iv) repurchase or redeem capital stock or subordinated indebtedness; (v) make investments or acquisitions; (vi) enter into sale/leaseback transactions; (vii) incur restrictions on the ability of the Company’s subsidiaries to pay dividends or to make other payments to us; (viii) enter into transactions with the Company’s affiliates; (ix) merge or consolidate with other companies or transfer all or substantially all of the Company’s assets; and (x) transfer or sell assets.
Springing Lien Notes
In connection with the consummation of the Plan, the Company’s existing 9.00% Springing Lien Dollar Notes due 2021 and 9.50% Springing Lien Euro Notes due 2021 were converted into the new equity of the Successor Company (resulting in the issuance of 11,791,126 shares of New Common Stock), subject to dilution
F-76
Table of Contents
by the management incentive plan and the Rights Offering Stock. Additionally, holders of the Springing Lien Notes were given subscription rights in the Rights Offerings (resulting in the issuance of 36,197,874 shares of New Common Stock (including shares issued in connection with the Backstop Commitment)).
Senior Subordinated Notes
In connection with the consummation of the Plan, the Company’s Senior Subordinated Notes were canceled on account of the subordination provisions set forth in the indenture to the Senior Subordinated Notes.
Pro Forma Debt Obligations
The components of debt outstanding at September 30, 2014, as adjusted for the pro forma effects of the consummation of the Plan and fresh-start accounting, is as follows:
| Pro Forma as of September 30, 2014 |
||||||||
| Long-Term | Due Within One Year |
|||||||
| Senior Secured Credit Facilities: |
||||||||
| Exit ABL Facility |
$ | — | $ | — | ||||
| First Lien and Second Lien Notes: |
||||||||
| 3.88% First Lien Notes due 2021 |
957 | — | ||||||
| 4.69% Second Lien Notes due 2022 |
202 | — | ||||||
| Other Borrowings: |
||||||||
| China bank loans |
7 | 30 | ||||||
| Other |
— | 7 | ||||||
|
|
|
|
|
|||||
| Total debt |
$ | 1,166 | $ | 37 | ||||
|
|
|
|
|
|||||
10. Commitments and Contingencies
Non-Environmental Legal Matters
The Company is involved in various legal proceedings in the ordinary course of business and had reserves of $4 at both September 30, 2014 and December 31, 2013 for all non-environmental legal defense costs incurred and settlement costs that it believes are probable and estimable, all of which are included in “Other current liabilities” in the unaudited Condensed Consolidated Balance Sheets.
Italian Tax Claim
On June 17, 2014, an Italian tax court of appeals (the “Italian Court of Appeals”) decided against the Company related to its 2003 income tax position resulting from the acquisition by General Electric Company (“GE”) of an Italian company in the same year. GE subsequently sold this Italian subsidiary to the Company as part of the acquisition of GE Advanced Materials in 2006 (the “GE Advanced Materials Acquisition”). Having considered the use of debt financing and other characteristics of the acquisition by GE, the Italian Court of Appeals determined that the goodwill amortization and interest expense related to the acquisition by GE were not deductible for tax purposes. Prior to this decision, the Company had received favorable rulings by lower level Italian trial courts in a series of similar cases regarding the same matter.
On August 7, 2014, the Italian Court of Appeals affirmed the prior decisions of the Italian tax trial courts in the Company’s favor regarding the deductions made in the years 2004 through 2007. The Company is currently preparing to appeal the adverse decision related to the 2003 tax year before the Italian Supreme Court and
F-77
Table of Contents
believes it has a considerable likelihood of obtaining a favorable outcome. As of September 30, 2014, the total potential assessment, including penalties and interest, is €45, or approximately $57, of which €30, or approximately $38, relates to the period of ownership subsequent to the GE Advanced Materials Acquisition.
The Company continues to believe its tax filing position is appropriate and that it is more likely than not this position will prevail upon appeal to the Italian Supreme Court. As a result, the Company has not recorded any income tax liability related to this matter as of September 30, 2014. Additionally, in conjunction with the GE Advanced Materials Acquisition, the Company and GE entered into an agreement providing for the indemnification by GE for tax matters related to the GE Advanced Materials Acquisition. The Company is currently evaluating the impact of this agreement on its potential exposure.
Backstop Commitment Agreement Premium
On June 23, 2014, the Court found that the terms and conditions of the Support Agreement were fair, reasonable and the best available to the Debtors under the circumstances, and issued an order authorizing and directing the Debtors to enter into, execute, deliver and implement the BCA. As a result, the Company is obligated to pay all fees and expenses related to the BCA, including, among other things, the payment of the BCA Commitment Premium to the Commitment Parties (see Note 2). Pursuant to the terms of the BCA, the BCA Commitment Premium was deemed earned, nonrefundable and non-avoidable upon entry of the approval order by the Court. The Company recognized a $30 liability for the BCA Commitment Premium as of September 30, 2014 under the guidance for accounting for liability instruments. This amount is included in “Reorganization items, net” in the unaudited Condensed Consolidated Statements of Operations and “Other current liabilities” in the unaudited Condensed Consolidated Balance Sheets. Upon application of fresh-start accounting, on October 24, 2014, the BCA Commitment Premium will be converted to equity in the unaudited Condensed Consolidated Balance Sheets.
Environmental Matters
The Company is involved in certain remediation actions to clean up hazardous wastes as required by federal and state laws. Liabilities for remediation costs at each site are based on the Company’s best estimate of discounted future costs. As of both September 30, 2014 and December 31, 2013, the Company had recognized obligations of $6 for remediation costs at the Company’s manufacturing facilities and offsite landfills. These amounts are included in “Other long-term liabilities” in the unaudited Condensed Consolidated Balance Sheets.
Waterford, NY Site
The Company currently owns and operates a manufacturing site in Waterford, NY. In 1988, a consent decree was signed with the State of New York which requires recovery of groundwater at the site to contain migration of specified contaminants in the groundwater. A groundwater pump and treat system and groundwater monitoring program are currently operational to implement the requirements of this consent decree.
Due to the long-term nature of the project and the uncertainty inherent in estimating future costs of implementing this program, this liability was recorded at its net present value of $3, which assumes a 9% discount rate and a time period of 50 years. The undiscounted obligations, which are expected to be paid over the next 50 years, are approximately $15. Over the next five years the Company expects to make ratable payments totaling $2.
F-78
Table of Contents
11. Pension and Postretirement Benefit Plans
The following are the components of the Company’s net pension and postretirement benefit expense for the three and nine months ended September 30, 2014 and 2013:
| Pension Benefits | Non-Pension Postretirement Benefits | |||||||||||||||||||||||||||||||
| Three Months Ended September 30, | Three Months Ended September 30, | |||||||||||||||||||||||||||||||
| 2014 | 2013 | 2014 | 2013 | |||||||||||||||||||||||||||||
| U.S. Plans |
Non-U.S. Plans |
U.S. Plans |
Non-U.S. Plans |
U.S. Plans |
Non-U.S. Plans |
U.S. Plans |
Non-U.S. Plans |
|||||||||||||||||||||||||
| Service cost |
$ | 2 | $ | 1 | $ | 2 | $ | 1 | $ | 1 | $ | — | $ | — | $ | — | ||||||||||||||||
| Interest cost on projected benefit obligation |
2 | 1 | 2 | 1 | 1 | — | 1 | — | ||||||||||||||||||||||||
| Expected return on assets |
(2 | ) | — | (1 | ) | — | — | — | — | — | ||||||||||||||||||||||
| Curtailment gain(1) |
— | — | (3 | ) | — | — | — | — | — | |||||||||||||||||||||||
| Amortization of prior service cost |
— | — | — | — | 1 | — | — | — | ||||||||||||||||||||||||
| Amortization of net losses (gains) |
— | — | — | 1 | (1 | ) | — | — | — | |||||||||||||||||||||||
|
|
|
|
|
|
|
|
|
|
|
|
|
|
|
|
|
|||||||||||||||||
| Net expense |
$ | 2 | $ | 2 | $ | — | $ | 3 | $ | 2 | $ | — | $ | 1 | $ | — | ||||||||||||||||
|
|
|
|
|
|
|
|
|
|
|
|
|
|
|
|
|
|||||||||||||||||
| Pension Benefits | Non-Pension Postretirement Benefits | |||||||||||||||||||||||||||||||
| Nine Months Ended September 30, | Nine Months Ended September 30, | |||||||||||||||||||||||||||||||
| 2014 | 2013 | 2014 | 2013 | |||||||||||||||||||||||||||||
| U.S. Plans |
Non-U.S. Plans |
U.S. Plans |
Non-U.S. Plans |
U.S. Plans |
Non-U.S. Plans |
U.S. Plans |
Non-U.S. Plans |
|||||||||||||||||||||||||
| Service cost |
$ | 6 | $ | 5 | $ | 7 | $ | 5 | $ | 2 | $ | — | $ | 2 | $ | — | ||||||||||||||||
| Interest cost on projected benefit obligation |
6 | 3 | 6 | 3 | 3 | — | 3 | — | ||||||||||||||||||||||||
| Expected return on assets |
(6 | ) | — | (5 | ) | (1 | ) | — | — | — | — | |||||||||||||||||||||
| Curtailment gain(1) |
— | — | (3 | ) | — | — | — | — | — | |||||||||||||||||||||||
| Amortization of prior service cost |
— | — | — | — | 1 | — | 1 | — | ||||||||||||||||||||||||
| Amortization of net losses (gains) |
— | 1 | — | 1 | (1 | ) | — | — | — | |||||||||||||||||||||||
|
|
|
|
|
|
|
|
|
|
|
|
|
|
|
|
|
|||||||||||||||||
| Net expense |
$ | 6 | $ | 9 | $ | 5 | $ | 8 | $ | 5 | $ | — | $ | 6 | $ | — | ||||||||||||||||
|
|
|
|
|
|
|
|
|
|
|
|
|
|
|
|
|
|||||||||||||||||
| (1) | The curtailment gain recognized on pension benefits during the three and nine months ended September 30, 2013 relates to the remeasurement of the pension benefit obligation in conjunction with the ratification of the new collective bargaining agreement in July 2013. |
12. Segment Information
The Company’s businesses are based on the products that the Company offers and the markets that it serves. At September 30, 2014, the Company’s two businesses are managed as one reportable segment; however, given the differing technology and marketing strategies, the Company reports the results for the Silicones and Quartz businesses separately.
The Silicones business is engaged in the manufacture, sale and distribution of silanes, specialty silicones and urethane additives. The Quartz business is engaged in the manufacture, sale and distribution of high-purity fused quartz and ceramic materials. The Company’s businesses are organized based on the nature of the products they produce.
The Company’s organizational structure continues to evolve. It is also continuing to refine its business and operating structure to better align its services to its customers and improve its cost position, while continuing to invest in global growth opportunities.
F-79
Table of Contents
Following are net sales and Segment EBITDA (earnings before interest, income taxes, depreciation and amortization) by business. Segment EBITDA is defined as EBITDA adjusted for certain non-cash items and certain other income and expenses. Segment EBITDA is the primary performance measure used by the Company’s senior management, the chief operating decision-maker and the board of directors to evaluate operating results and allocate capital resources among businesses. Segment EBITDA is also the profitability measure used to set management and executive incentive compensation goals. Other is primarily general and administrative expenses that are not allocated to the businesses, such as shared service and administrative functions.
Net Sales(1):
| Three Months Ended September 30, |
Nine Months Ended September 30, |
|||||||||||||||
| 2014 | 2013 | 2014 | 2013 | |||||||||||||
| Silicones |
$ | 587 | $ | 549 | $ | 1,736 | $ | 1,636 | ||||||||
| Quartz |
44 | 55 | 137 | 148 | ||||||||||||
|
|
|
|
|
|
|
|
|
|||||||||
| Total |
$ | 631 | $ | 604 | $ | 1,873 | $ | 1,784 | ||||||||
|
|
|
|
|
|
|
|
|
|||||||||
| (1) | Inter-business sales are not significant and, as such, are eliminated within the selling business. |
Segment EBITDA:
| Three Months Ended September 30, |
Nine Months Ended September 30, |
|||||||||||||||
| 2014 | 2013 | 2014 | 2013 | |||||||||||||
| Silicones |
$ | 75 | $ | 55 | $ | 206 | $ | 193 | ||||||||
| Quartz |
5 | 11 | 19 | 27 | ||||||||||||
| Other |
(17 | ) | (11 | ) | (48 | ) | (34 | ) | ||||||||
Reconciliation of Segment EBITDA to Net Loss:
| Three Months Ended September 30, |
Nine Months Ended September 30, |
|||||||||||||||
| 2014 | 2013 | 2014 | 2013 | |||||||||||||
| Segment EBITDA: |
||||||||||||||||
| Silicones |
$ | 75 | $ | 55 | $ | 206 | $ | 193 | ||||||||
| Quartz |
5 | 11 | 19 | 27 | ||||||||||||
| Other |
(17 | ) | (11 | ) | (48 | ) | (34 | ) | ||||||||
| Reconciliation: |
||||||||||||||||
| Items not included in Segment EBITDA: |
||||||||||||||||
| Non-cash charges |
(145 | ) | 1 | (116 | ) | (4 | ) | |||||||||
| Restructuring and other costs |
(6 | ) | (9 | ) | (20 | ) | (17 | ) | ||||||||
| Reorganization items, net |
(44 | ) | — | (114 | ) | — | ||||||||||
|
|
|
|
|
|
|
|
|
|||||||||
| Total adjustments |
(195 | ) | (8 | ) | (250 | ) | (21 | ) | ||||||||
| Interest expense, net |
(36 | ) | (77 | ) | (153 | ) | (234 | ) | ||||||||
| Income tax benefit |
23 | 5 | 2 | — | ||||||||||||
| Depreciation and amortization |
(54 | ) | (42 | ) | (137 | ) | (129 | ) | ||||||||
|
|
|
|
|
|
|
|
|
|||||||||
| Net loss |
$ | (199 | ) | $ | (67 | ) | $ | (361 | ) | $ | (198 | ) | ||||
|
|
|
|
|
|
|
|
|
|||||||||
F-80
Table of Contents
Items Not Included in Segment EBITDA
Not included in Segment EBITDA are certain non-cash items and other income and expenses. For the three and nine months ended September 30, 2014, non-cash charges primarily included net unrealized foreign exchange transaction losses related to certain intercompany arrangements and losses on the disposal of certain assets. For the three and nine months ended September 30, 2013, non-cash charges primarily included net foreign exchange transaction gains and losses and asset disposal gains and losses. For the three and nine months ended September 30, 2014 and 2013, restructuring and other costs primarily included expenses from our restructuring and cost optimization programs. For the nine months ended September 30, 2014, restructuring and other costs also included costs associated with restructuring our capital structure incurred prior to the Bankruptcy Filing. For the nine months ended September 30, 2014, these costs were partially offset by a gain related to a claim settlement. For the three and nine months ended September 30, 2014, reorganization items, net represented incremental costs incurred directly as a result of the Bankruptcy Filing, including certain professional fees, the BCA Commitment Premium and financing fees related to our DIP Facilities.
13. Changes in Other Comprehensive Income
Following is a summary of changes in “Accumulated other comprehensive income” for the three and nine months ended September 30, 2014 and 2013:
| Three Months Ended September 30, 2014 | Three Months Ended September 30, 2013 | |||||||||||||||||||||||
| Defined Benefit Pension and Postretirement Plans |
Foreign Currency Translation Adjustments |
Total | Defined Benefit Pension and Postretirement Plans |
Foreign Currency Translation Adjustments |
Total | |||||||||||||||||||
| Beginning balance |
$ | (36 | ) | $ | 225 | $ | 189 | $ | (67 | ) | $ | 181 | $ | 114 | ||||||||||
| Other comprehensive (loss) income before reclassifications, net of tax |
(22 | )(1) | 52 | 30 | 13 | 20 | 33 | |||||||||||||||||
| Amounts reclassified from Accumulated other comprehensive income, net of tax |
— | — | — | 1 | — | 1 | ||||||||||||||||||
|
|
|
|
|
|
|
|
|
|
|
|
|
|||||||||||||
| Net other comprehensive (loss) income |
(22 | ) | 52 | 30 | 14 | 20 | 34 | |||||||||||||||||
|
|
|
|
|
|
|
|
|
|
|
|
|
|||||||||||||
| Ending balance |
$ | (58 | ) | $ | 277 | $ | 219 | $ | (53 | ) | $ | 201 | $ | 148 | ||||||||||
|
|
|
|
|
|
|
|
|
|
|
|
|
|||||||||||||
| Nine Months Ended September 30, 2014 | Nine Months Ended September 30, 2013 | |||||||||||||||||||||||
| Defined Benefit Pension and Postretirement Plans |
Foreign Currency Translation Adjustments |
Total | Defined Benefit Pension and Postretirement Plans |
Foreign Currency Translation Adjustments |
Total | |||||||||||||||||||
| Beginning balance |
$ | (37 | ) | $ | 239 | $ | 202 | $ | (65 | ) | $ | 245 | $ | 180 | ||||||||||
| Other comprehensive (loss) income before reclassifications, net of tax |
(22 | )(1) | 38 | 16 | 10 | (44 | ) | (34 | ) | |||||||||||||||
| Amounts reclassified from Accumulated other comprehensive income, net of tax |
1 | — | 1 | 2 | — | 2 | ||||||||||||||||||
|
|
|
|
|
|
|
|
|
|
|
|
|
|||||||||||||
| Net other comprehensive (loss) income |
(21 | ) | 38 | 17 | 12 | (44 | ) | (32 | ) | |||||||||||||||
|
|
|
|
|
|
|
|
|
|
|
|
|
|||||||||||||
| Ending balance |
$ | (58 | ) | $ | 277 | $ | 219 | $ | (53 | ) | $ | 201 | $ | 148 | ||||||||||
|
|
|
|
|
|
|
|
|
|
|
|
|
|||||||||||||
F-81
Table of Contents
| (1) | This amount relates to unrecognized losses recorded in conjunction with the remeasurement of certain defined benefit pension obligations due to the renegotiation of certain collective bargaining agreements. |
| Amortization of defined benefit pension |
Amount Reclassified
From Accumulated Other Comprehensive Income for the Three Months Ended: |
Location of Reclassified Amount in Income | ||||||||
| September 30, 2014 | September 30, 2013 | |||||||||
| Prior service costs |
$ | 1 | $ | — | (2) | |||||
| Actuarial (gains) losses |
(1 | ) | 1 | (2) | ||||||
|
|
|
|
|
|||||||
| Total before income tax |
— | 1 | ||||||||
| Income tax benefit |
— | — | Income tax expense | |||||||
|
|
|
|
|
|||||||
| Total |
$ | — | $ | 1 | ||||||
|
|
|
|
|
|||||||
| Amortization of defined benefit pension |
Amount Reclassified From Accumulated Other Comprehensive Income for the Nine Months Ended: |
Location of Reclassified Amount in Income | ||||||||
| September 30, 2014 | September 30, 2013 | |||||||||
| Prior service costs |
$ | 1 | $ | 1 | (2) | |||||
| Actuarial losses |
— | 1 | (2) | |||||||
|
|
|
|
|
|||||||
| Total before income tax |
1 | 2 | ||||||||
| Income tax benefit |
— | — | Income tax expense | |||||||
|
|
|
|
|
|||||||
| Total |
$ | 1 | $ | 2 | ||||||
|
|
|
|
|
|||||||
| (2) | These accumulated other comprehensive income components are included in the computation of net pension and postretirement benefit expense (see Note 11). |
14. Income Taxes
The effective tax rate was 10% and 7% for the three months ended September 30, 2014 and 2013, respectively. The effective tax rate was 1% and 0% for the nine months ended September 30, 2014 and 2013, respectively. The change in the effective tax rate was primarily attributable to the amount and distribution of income and loss among the various jurisdictions in which the Company operates. The effective tax rates were also impacted by operating losses generated in jurisdictions where no tax benefit was recognized due to the maintenance of a full valuation allowance.
For the three and nine months ended September 30, 2014, income taxes included favorable discrete tax adjustments of $23 and $9, respectively, pertaining to unrealized losses on intercompany transactions and the resolution of certain tax matters in U.S. and non-U.S. jurisdictions. For both the three and nine months ended September 30, 2013, income taxes included favorable discrete tax adjustments of $9 pertaining to pension curtailment, adjustments made to prior year intercompany transactions and the resolution of certain tax matters in U.S. and non-U.S. jurisdictions.
The Company is recognizing the earnings of non-U.S. operations currently in its U.S. consolidated income tax return as of September 30, 2014, and is expecting that all earnings will be repatriated to the United States. The Company has accrued the incremental tax expense expected to be incurred upon the repatriation of these earnings.
As a result of the conditions related to the Company’s ability to continue as a going concern described in Note 1, beginning in the fourth quarter of 2013, the Company was no longer able to assert permanent reinvestment with respect to certain intercompany arrangements previously considered indefinite, and is now recording deferred taxes on the foreign currency translation impact.
F-82
Table of Contents
15. Guarantor/Non-Guarantor Subsidiary Financial Information
As of September 30, 2014, the Company had outstanding $1,100 in aggregate principal amount of first-lien notes and $250 in aggregate principal amount of senior secured notes, $1,161 in aggregate principal amount of springing lien Dollar notes €133 ($184) in aggregate principal amount of springing lien Euro notes and $382 in aggregate principal amount of senior subordinated notes. The notes are fully, jointly, severally and unconditionally guaranteed by the Company’s domestic subsidiaries (the guarantor subsidiaries). The following condensed consolidated financial information presents the Condensed Consolidated Balance Sheets as of September 30, 2014 and December 31, 2013, the Condensed Consolidated Statements of Operations for the three and nine months ended September 30, 2014 and 2013 and the Condensed Consolidated Statements of Cash Flows for the nine months ended September 30, 2014 and 2013 of (i) Momentive Performance Materials Inc. (Parent); (ii) the guarantor subsidiaries; (iii) the non-guarantor subsidiaries; and (iv) the Company on a consolidated basis.
These financial statements are prepared on the same basis as the consolidated financial statements of the Company except that investments in subsidiaries are accounted for using the equity method for purposes of the consolidating presentation. The principal elimination entries relate to investments in subsidiaries and intercompany balances and transactions. The guarantor subsidiaries are 100% owned by Parent and all guarantees are full and unconditional, subject to certain customary release provisions set forth in the applicable Indenture. Additionally, the secured credit facilities are secured by, among other things, most of the assets of the Parent, the guarantor subsidiaries and certain non-guarantor subsidiaries, subject to certain exceptions and permitted liens. There are no significant restrictions on the ability of Parent to obtain funds from its domestic subsidiaries by dividend or loan.
F-83
Table of Contents
MOMENTIVE PERFORMANCE MATERIALS INC.
(DEBTOR-IN-POSSESSION)
SEPTEMBER 30, 2014
CONDENSED CONSOLIDATING BALANCE SHEET (Unaudited)
| Parent | Combined Guarantor Subsidiaries |
Combined Non- Guarantor Subsidiaries |
Eliminations | Consolidated | ||||||||||||||||
| Assets |
||||||||||||||||||||
| Current assets: |
||||||||||||||||||||
| Cash and cash equivalents (including restricted cash of $0, $0 and $5, respectively) |
$ | 7 | $ | 6 | $ | 126 | $ | — | $ | 139 | ||||||||||
| Accounts receivable |
— | 104 | 236 | — | 340 | |||||||||||||||
| Due from affiliates |
1 | 134 | 179 | (314 | ) | — | ||||||||||||||
| Inventories: |
||||||||||||||||||||
| Raw materials |
— | 73 | 83 | — | 156 | |||||||||||||||
| Finished and in-process goods |
— | 130 | 143 | — | 273 | |||||||||||||||
| Deferred income taxes |
— | — | 5 | — | 5 | |||||||||||||||
| Other current assets |
— | 38 | 38 | — | 76 | |||||||||||||||
|
|
|
|
|
|
|
|
|
|
|
|||||||||||
| Total current assets |
8 | 485 | 810 | (314 | ) | 989 | ||||||||||||||
| Investment in unconsolidated entities |
1,826 | — | 10 | (1,826 | ) | 10 | ||||||||||||||
| Deferred income taxes |
— | — | 3 | — | 3 | |||||||||||||||
| Other long-term assets |
— | 6 | 18 | — | 24 | |||||||||||||||
| Intercompany loans receivable |
53 | 1,981 | 415 | (2,449 | ) | — | ||||||||||||||
| Property and equipment, net |
— | 420 | 452 | — | 872 | |||||||||||||||
| Goodwill |
— | 17 | 345 | — | 362 | |||||||||||||||
| Other intangible assets, net |
— | 74 | 330 | — | 404 | |||||||||||||||
|
|
|
|
|
|
|
|
|
|
|
|||||||||||
| Total assets |
$ | 1,887 | $ | 2,983 | $ | 2,383 | $ | (4,589 | ) | $ | 2,664 | |||||||||
|
|
|
|
|
|
|
|
|
|
|
|||||||||||
| Liabilities and (Deficit) Equity |
||||||||||||||||||||
| Current liabilities: |
||||||||||||||||||||
| Accounts payable |
$ | 3 | $ | 87 | $ | 132 | $ | — | $ | 222 | ||||||||||
| Due to affiliates |
— | 87 | 227 | (314 | ) | — | ||||||||||||||
| Debt payable within one year |
1,654 | 53 | 63 | — | 1,770 | |||||||||||||||
| Interest payable |
59 | — | — | — | 59 | |||||||||||||||
| Income taxes payable |
— | — | 6 | — | 6 | |||||||||||||||
| Deferred income taxes |
— | — | 13 | — | 13 | |||||||||||||||
| Accrued payroll and incentive compensation |
— | 19 | 25 | — | 44 | |||||||||||||||
| Other current liabilities |
1 | 47 | 48 | — | 96 | |||||||||||||||
|
|
|
|
|
|
|
|
|
|
|
|||||||||||
| Total current liabilities |
1,717 | 293 | 514 | (314 | ) | 2,210 | ||||||||||||||
| Long-term liabilities: |
||||||||||||||||||||
| Long-term debt |
— | — | 7 | — | 7 | |||||||||||||||
| Intercompany loans payable |
221 | 109 | 1,925 | (2,255 | ) | — | ||||||||||||||
| Accumulated losses from unconsolidated subsidiaries in excess of investment |
— | 307 | — | (307 | ) | — | ||||||||||||||
| Pension liabilities |
— | — | 134 | — | 134 | |||||||||||||||
| Deferred income taxes |
— | — | 63 | — | 63 | |||||||||||||||
| Other long-term liabilities |
2 | 2 | 47 | — | 51 | |||||||||||||||
| Liabilities subject to compromise |
1,774 | 446 | — | (194 | ) | 2,026 | ||||||||||||||
|
|
|
|
|
|
|
|
|
|
|
|||||||||||
| Total liabilities |
3,714 | 1,157 | 2,690 | (3,070 | ) | 4,491 | ||||||||||||||
|
|
|
|
|
|
|
|
|
|
|
|||||||||||
| Total (deficit) equity |
(1,827 | ) | 1,826 | (307 | ) | (1,519 | ) | (1,827 | ) | |||||||||||
|
|
|
|
|
|
|
|
|
|
|
|||||||||||
| Total liabilities and (deficit) equity |
$ | 1,887 | $ | 2,983 | $ | 2,383 | $ | (4,589 | ) | $ | 2,664 | |||||||||
|
|
|
|
|
|
|
|
|
|
|
|||||||||||
F-84
Table of Contents
MOMENTIVE PERFORMANCE MATERIALS INC.
(DEBTOR-IN-POSSESSION)
DECEMBER 31, 2013
CONDENSED CONSOLIDATING BALANCE SHEET (Unaudited)
| Parent | Combined Guarantor Subsidiaries |
Combined Non- Guarantor Subsidiaries |
Eliminations | Consolidated | ||||||||||||||||
| Assets |
||||||||||||||||||||
| Current assets: |
||||||||||||||||||||
| Cash and cash equivalents (including restricted cash of $0 and $5, respectively) |
$ | 2 | $ | — | $ | 92 | $ | — | $ | 94 | ||||||||||
| Accounts receivable |
— | 91 | 240 | — | 331 | |||||||||||||||
| Due from affiliates |
— | 63 | 97 | (160 | ) | — | ||||||||||||||
| Inventories: |
||||||||||||||||||||
| Raw materials |
— | 50 | 78 | — | 128 | |||||||||||||||
| Finished and in-process goods |
— | 114 | 126 | — | 240 | |||||||||||||||
| Deferred income taxes |
— | — | 6 | — | 6 | |||||||||||||||
| Other current assets |
2 | 14 | 45 | — | 61 | |||||||||||||||
|
|
|
|
|
|
|
|
|
|
|
|||||||||||
| Total current assets |
4 | 332 | 684 | (160 | ) | 860 | ||||||||||||||
| Investment in unconsolidated entities |
1,983 | — | 8 | (1,983 | ) | 8 | ||||||||||||||
| Deferred income taxes |
— | — | 3 | — | 3 | |||||||||||||||
| Other long-term assets |
— | 13 | 20 | — | 33 | |||||||||||||||
| Intercompany loans receivable |
100 | 1,939 | 422 | (2,461 | ) | — | ||||||||||||||
| Property and equipment, net |
— | 444 | 510 | — | 954 | |||||||||||||||
| Goodwill |
— | — | 381 | — | 381 | |||||||||||||||
| Other intangible assets, net |
— | 78 | 377 | — | 455 | |||||||||||||||
|
|
|
|
|
|
|
|
|
|
|
|||||||||||
| Total assets |
$ | 2,087 | $ | 2,806 | $ | 2,405 | $ | (4,604 | ) | $ | 2,694 | |||||||||
|
|
|
|
|
|
|
|
|
|
|
|||||||||||
| Liabilities and (Deficit) Equity |
||||||||||||||||||||
| Current liabilities: |
||||||||||||||||||||
| Accounts payable |
$ | 4 | $ | 75 | $ | 180 | $ | — | $ | 259 | ||||||||||
| Due to affiliates |
— | 96 | 64 | (160 | ) | — | ||||||||||||||
| Debt payable within one year |
3,076 | 88 | 86 | — | 3,250 | |||||||||||||||
| Interest payable |
87 | 1 | — | — | 88 | |||||||||||||||
| Income taxes payable |
— | — | 6 | — | 6 | |||||||||||||||
| Deferred income taxes |
— | — | 12 | — | 12 | |||||||||||||||
| Accrued payroll and incentive compensation |
— | 23 | 21 | — | 44 | |||||||||||||||
| Other current liabilities |
— | 26 | 59 | — | 85 | |||||||||||||||
|
|
|
|
|
|
|
|
|
|
|
|||||||||||
| Total current liabilities |
3,167 | 309 | 428 | (160 | ) | 3,744 | ||||||||||||||
| Long-term liabilities: |
||||||||||||||||||||
| Long-term debt |
— | — | 7 | — | 7 | |||||||||||||||
| Intercompany loans payable |
397 | 101 | 1,963 | (2,461 | ) | — | ||||||||||||||
| Accumulated losses from unconsolidated subsidiaries in excess of investment |
— | 261 | — | (261 | ) | — | ||||||||||||||
| Pension liabilities |
— | 141 | 139 | — | 280 | |||||||||||||||
| Deferred income taxes |
— | — | 77 | — | 77 | |||||||||||||||
| Other long-term liabilities |
3 | 11 | 52 | — | 66 | |||||||||||||||
|
|
|
|
|
|
|
|
|
|
|
|||||||||||
| Total liabilities |
3,567 | 823 | 2,666 | (2,882 | ) | 4,174 | ||||||||||||||
|
|
|
|
|
|
|
|
|
|
|
|||||||||||
| Total (deficit) equity |
(1,480 | ) | 1,983 | (261 | ) | (1,722 | ) | (1,480 | ) | |||||||||||
|
|
|
|
|
|
|
|
|
|
|
|||||||||||
| Total liabilities and (deficit) equity |
$ | 2,087 | $ | 2,806 | $ | 2,405 | $ | (4,604 | ) | $ | 2,694 | |||||||||
|
|
|
|
|
|
|
|
|
|
|
|||||||||||
F-85
Table of Contents
MOMENTIVE PERFORMANCE MATERIALS INC.
(DEBTOR-IN-POSSESSION)
THREE MONTHS ENDED SEPTEMBER 30, 2014
CONDENSED CONSOLIDATING STATEMENT OF OPERATIONS (Unaudited)
| Parent | Combined Guarantor Subsidiaries |
Combined Non- Guarantor Subsidiaries |
Eliminations | Consolidated | ||||||||||||||||
| Net sales |
$ | — | $ | 291 | $ | 494 | $ | (154 | ) | $ | 631 | |||||||||
| Costs and expenses: |
||||||||||||||||||||
| Cost of sales, excluding depreciation |
— | 202 | 397 | (154 | ) | 445 | ||||||||||||||
| Selling, general and administrative expense |
10 | 112 | 127 | — | 249 | |||||||||||||||
| Depreciation and amortization expense |
— | 17 | 37 | — | 54 | |||||||||||||||
| Research and development expense |
— | 11 | 8 | — | 19 | |||||||||||||||
| Restructuring and other costs |
3 | 4 | (1 | ) | — | 6 | ||||||||||||||
|
|
|
|
|
|
|
|
|
|
|
|||||||||||
| Operating loss |
(13 | ) | (55 | ) | (74 | ) | — | (142 | ) | |||||||||||
| Interest income (contractual interest income of $1, $27 and $1, respectively) |
(1 | ) | (26 | ) | — | 26 | (1 | ) | ||||||||||||
| Interest expense (contractual interest expense of $76, $1 and $28, respectively) |
35 | — | 28 | (26 | ) | 37 | ||||||||||||||
| Reorganization items, net |
— | 44 | — | — | 44 | |||||||||||||||
|
|
|
|
|
|
|
|
|
|
|
|||||||||||
| Loss before income taxes and losses from unconsolidated entities |
(47 | ) | (73 | ) | (102 | ) | — | (222 | ) | |||||||||||
| Income tax benefit |
— | — | (23 | ) | — | (23 | ) | |||||||||||||
|
|
|
|
|
|
|
|
|
|
|
|||||||||||
| Loss before losses from unconsolidated entities |
(47 | ) | (73 | ) | (79 | ) | — | (199 | ) | |||||||||||
| Losses from unconsolidated entities, net of taxes |
(152 | ) | (79 | ) | — | 231 | — | |||||||||||||
|
|
|
|
|
|
|
|
|
|
|
|||||||||||
| Net loss |
$ | (199 | ) | $ | (152 | ) | $ | (79 | ) | $ | 231 | $ | (199 | ) | ||||||
|
|
|
|
|
|
|
|
|
|
|
|||||||||||
| Comprehensive loss |
$ | (169 | ) | $ | (122 | ) | $ | (27 | ) | $ | 149 | $ | (169 | ) | ||||||
|
|
|
|
|
|
|
|
|
|
|
|||||||||||
F-86
Table of Contents
MOMENTIVE PERFORMANCE MATERIALS INC.
(DEBTOR-IN-POSSESSION)
THREE MONTHS ENDED SEPTEMBER 30, 2013
CONDENSED CONSOLIDATING STATEMENT OF OPERATIONS (Unaudited)
| Parent | Combined Guarantor Subsidiaries |
Combined Non- Guarantor Subsidiaries |
Eliminations | Consolidated | ||||||||||||||||
| Net sales |
$ | — | $ | 288 | $ | 456 | $ | (140 | ) | $ | 604 | |||||||||
| Costs and expenses: |
||||||||||||||||||||
| Cost of sales, excluding depreciation |
— | 208 | 376 | (140 | ) | 444 | ||||||||||||||
| Selling, general and administrative expense |
8 | 33 | 43 | — | 84 | |||||||||||||||
| Depreciation and amortization expense |
— | 17 | 25 | — | 42 | |||||||||||||||
| Research and development expense |
— | 10 | 8 | — | 18 | |||||||||||||||
| Restructuring and other costs |
2 | 6 | 1 | — | 9 | |||||||||||||||
|
|
|
|
|
|
|
|
|
|
|
|||||||||||
| Operating (loss) income |
(10 | ) | 14 | 3 | — | 7 | ||||||||||||||
| Interest income |
— | (40 | ) | (3 | ) | 42 | (1 | ) | ||||||||||||
| Interest expense |
75 | — | 45 | (42 | ) | 78 | ||||||||||||||
| Other expense, net |
— | 1 | — | — | 1 | |||||||||||||||
|
|
|
|
|
|
|
|
|
|
|
|||||||||||
| (Loss) income before income taxes and earnings (losses) from unconsolidated entities |
(85 | ) | 53 | (39 | ) | — | (71 | ) | ||||||||||||
| Income tax (benefit) expense |
— | (8 | ) | 3 | — | (5 | ) | |||||||||||||
|
|
|
|
|
|
|
|
|
|
|
|||||||||||
| (Loss) income before earnings (losses) from unconsolidated entities |
(85 | ) | 61 | (42 | ) | — | (66 | ) | ||||||||||||
| Earnings (losses) from unconsolidated entities, net of taxes |
18 | (43 | ) | (1 | ) | 25 | (1 | ) | ||||||||||||
|
|
|
|
|
|
|
|
|
|
|
|||||||||||
| Net (loss) income |
$ | (67 | ) | $ | 18 | $ | (43 | ) | $ | 25 | $ | (67 | ) | |||||||
|
|
|
|
|
|
|
|
|
|
|
|||||||||||
| Comprehensive (loss) income |
$ | (33 | ) | $ | 53 | $ | (50 | ) | $ | (3 | ) | $ | (33 | ) | ||||||
|
|
|
|
|
|
|
|
|
|
|
|||||||||||
F-87
Table of Contents
MOMENTIVE PERFORMANCE MATERIALS INC.
(DEBTOR-IN-POSSESSION)
NINE MONTHS ENDED SEPTEMBER 30, 2014
CONDENSED CONSOLIDATING STATEMENT OF OPERATIONS (Unaudited)
| Parent | Combined Guarantor Subsidiaries |
Combined Non- Guarantor Subsidiaries |
Eliminations | Consolidated | ||||||||||||||||
| Net sales |
$ | — | $ | 850 | $ | 1,480 | $ | (457 | ) | $ | 1,873 | |||||||||
| Costs and expenses: |
||||||||||||||||||||
| Cost of sales, excluding depreciation |
— | 610 | 1,186 | (457 | ) | 1,339 | ||||||||||||||
| Selling, general and administrative expense |
30 | 201 | 186 | — | 417 | |||||||||||||||
| Depreciation and amortization expense |
— | 51 | 86 | — | 137 | |||||||||||||||
| Research and development expense |
— | 35 | 23 | — | 58 | |||||||||||||||
| Restructuring and other costs |
5 | 14 | 1 | — | 20 | |||||||||||||||
|
|
|
|
|
|
|
|
|
|
|
|||||||||||
| Operating loss |
(35 | ) | (61 | ) | (2 | ) | — | (98 | ) | |||||||||||
| Interest income (contractual interest income of $2, $106 and $3, respectively) |
(1 | ) | (105 | ) | (2 | ) | 107 | (1 | ) | |||||||||||
| Interest expense (contractual interest expense of $225, $15 and $101, respectively) |
148 | 13 | 100 | (107 | ) | 154 | ||||||||||||||
| Reorganization items, net |
17 | 97 | — | — | 114 | |||||||||||||||
|
|
|
|
|
|
|
|
|
|
|
|||||||||||
| Loss before income taxes and (losses) earnings from unconsolidated entities |
(199 | ) | (66 | ) | (100 | ) | — | (365 | ) | |||||||||||
| Income tax expense (benefit) |
— | 2 | (4 | ) | — | (2 | ) | |||||||||||||
|
|
|
|
|
|
|
|
|
|
|
|||||||||||
| Loss before (losses) earnings from unconsolidated entities |
(199 | ) | (68 | ) | (96 | ) | — | (363 | ) | |||||||||||
| (Losses) earnings from unconsolidated entities, net of taxes |
(162 | ) | (94 | ) | 2 | 256 | 2 | |||||||||||||
|
|
|
|
|
|
|
|
|
|
|
|||||||||||
| Net loss |
$ | (361 | ) | $ | (162 | ) | $ | (94 | ) | $ | 256 | $ | (361 | ) | ||||||
|
|
|
|
|
|
|
|
|
|
|
|||||||||||
| Comprehensive loss |
$ | (344 | ) | $ | (145 | ) | $ | (54 | ) | $ | 199 | $ | (344 | ) | ||||||
|
|
|
|
|
|
|
|
|
|
|
|||||||||||
F-88
Table of Contents
MOMENTIVE PERFORMANCE MATERIALS INC.
(DEBTOR-IN-POSSESSION)
NINE MONTHS ENDED SEPTEMBER 30, 2013
CONDENSED CONSOLIDATING STATEMENT OF OPERATIONS (Unaudited)
| Parent | Combined Guarantor Subsidiaries |
Combined Non- Guarantor Subsidiaries |
Eliminations | Consolidated | ||||||||||||||||
| Net sales |
$ | — | $ | 815 | $ | 1,354 | $ | (385 | ) | $ | 1,784 | |||||||||
| Costs and expenses: |
||||||||||||||||||||
| Cost of sales, excluding depreciation |
— | 566 | 1,096 | (385 | ) | 1,277 | ||||||||||||||
| Selling, general and administrative expense |
19 | 107 | 150 | — | 276 | |||||||||||||||
| Depreciation and amortization expense |
— | 53 | 76 | — | 129 | |||||||||||||||
| Research and development expense |
— | 31 | 20 | — | 51 | |||||||||||||||
| Restructuring and other costs |
4 | 9 | 4 | — | 17 | |||||||||||||||
|
|
|
|
|
|
|
|
|
|
|
|||||||||||
| Operating (loss) income |
(23 | ) | 49 | 8 | — | 34 | ||||||||||||||
| Interest income |
— | (120 | ) | (3 | ) | 121 | (2 | ) | ||||||||||||
| Interest expense |
227 | 3 | 127 | (121 | ) | 236 | ||||||||||||||
| Other expense (income), net |
— | 1 | (1 | ) | — | — | ||||||||||||||
|
|
|
|
|
|
|
|
|
|
|
|||||||||||
| (Loss) income before income taxes and earnings (losses) from unconsolidated entities |
(250 | ) | 165 | (115 | ) | — | (200 | ) | ||||||||||||
| Income tax (benefit) expense |
— | (7 | ) | 7 | — | — | ||||||||||||||
|
|
|
|
|
|
|
|
|
|
|
|||||||||||
| (Loss) income before earnings (losses) from unconsolidated entities |
(250 | ) | 172 | (122 | ) | — | (200 | ) | ||||||||||||
| Earnings (losses) from unconsolidated entities, net of taxes |
52 | (120 | ) | 2 | 68 | 2 | ||||||||||||||
|
|
|
|
|
|
|
|
|
|
|
|||||||||||
| Net (loss) income |
$ | (198 | ) | $ | 52 | $ | (120 | ) | $ | 68 | $ | (198 | ) | |||||||
|
|
|
|
|
|
|
|
|
|
|
|||||||||||
| Comprehensive (loss) income |
$ | (230 | ) | $ | 20 | $ | (179 | ) | $ | 159 | $ | (230 | ) | |||||||
|
|
|
|
|
|
|
|
|
|
|
|||||||||||
F-89
Table of Contents
MOMENTIVE PERFORMANCE MATERIALS INC.
NINE MONTHS ENDED SEPTEMBER 30, 2014
CONDENSED CONSOLIDATING STATEMENT OF CASH FLOWS (Unaudited)
| Parent | Combined Guarantor Subsidiaries |
Combined Non- Guarantor Subsidiaries |
Eliminations | Consolidated | ||||||||||||||||
| Cash flows (used in) provided by operating activities |
$ | (23 | ) | $ | (153 | ) | $ | 56 | $ | (5 | ) | $ | (125 | ) | ||||||
|
|
|
|
|
|
|
|
|
|
|
|||||||||||
| Cash flows provided by (used in) investing activities: |
||||||||||||||||||||
| Capital expenditures |
— | (32 | ) | (38 | ) | — | (70 | ) | ||||||||||||
| Consolidation of variable interest entity |
— | — | 50 | — | 50 | |||||||||||||||
| Proceeds from sale of business |
— | — | 12 | — | 12 | |||||||||||||||
| Purchases of intangible assets |
— | (2 | ) | — | — | (2 | ) | |||||||||||||
| Proceeds from sale of assets |
— | 1 | — | — | 1 | |||||||||||||||
| Return of capital from subsidiary from sales of accounts receivable |
— | 41 | (a) | — | (41 | ) | — | |||||||||||||
|
|
|
|
|
|
|
|
|
|
|
|||||||||||
| — | 8 | 24 | (41 | ) | (9 | ) | ||||||||||||||
|
|
|
|
|
|
|
|
|
|
|
|||||||||||
| Cash flows provided by (used in) financing activities: |
||||||||||||||||||||
| Net short-term debt borrowings |
305 | — | — | — | 305 | |||||||||||||||
| Borrowings of long-term debt |
— | 118 | 90 | — | 208 | |||||||||||||||
| Repayments of long-term debt |
— | (153 | ) | (107 | ) | — | (260 | ) | ||||||||||||
| Repayment of affiliated debt |
— | — | (50 | ) | — | (50 | ) | |||||||||||||
| DIP Facility financing fees |
(19 | ) | — | — | — | (19 | ) | |||||||||||||
| Net intercompany loan (repayments) borrowings |
(258 | ) | 191 | 67 | — | — | ||||||||||||||
| Common stock dividends paid |
— | (5 | ) | — | 5 | — | ||||||||||||||
| Return of capital to parent from sales of accounts receivable |
(41 | )(a) | 41 | — | ||||||||||||||||
|
|
|
|
|
|
|
|
|
|
|
|||||||||||
| 28 | 151 | (41 | ) | 46 | 184 | |||||||||||||||
|
|
|
|
|
|
|
|
|
|
|
|||||||||||
| Increase in cash and cash equivalents |
5 | 6 | 39 | — | 50 | |||||||||||||||
| Effect of exchange rate changes on cash and cash equivalents |
— | — | (5 | ) | — | (5 | ) | |||||||||||||
| Cash and cash equivalents (unrestricted), beginning of period |
2 | — | 87 | — | 89 | |||||||||||||||
|
|
|
|
|
|
|
|
|
|
|
|||||||||||
| Cash and cash equivalents (unrestricted), end of period |
$ | 7 | $ | 6 | $ | 121 | $ | — | $ | 134 | ||||||||||
|
|
|
|
|
|
|
|
|
|
|
|||||||||||
| (a) | During the nine months ended September 30, 2014, Momentive Performance Materials USA Inc. contributed receivables of $41 to a non-guarantor subsidiary as capital contributions, resulting in a non-cash transaction. During the nine months ended September 30, 2014, the non-guarantor subsidiary sold the contributed receivables to certain banks under various supplier financing agreements. The cash proceeds were returned to Momentive Performance Materials USA Inc. by the non-guarantor subsidiary as a return of capital. The sale of receivables has been included within cash flows from operating activities on the Combined non-guarantor subsidiaries. The return of the cash proceeds from the sale of receivables has been included as a financing outflow and an investing inflow on the Combined Non-Guarantor Subsidiaries and the Combined Guarantor Subsidiaries, respectively. |
F-90
Table of Contents
MOMENTIVE PERFORMANCE MATERIALS INC.
NINE MONTHS ENDED SEPTEMBER 30, 2013
CONDENSED CONSOLIDATING STATEMENT OF CASH FLOWS (Unaudited)
| Parent | Combined Guarantor Subsidiaries |
Combined Non- Guarantor Subsidiaries |
Eliminations | Consolidated | ||||||||||||||||
| Cash flows (used in) provided by operating activities |
$ | (51 | ) | $ | (60 | ) | $ | 30 | $ | (48 | ) | $ | (129 | ) | ||||||
|
|
|
|
|
|
|
|
|
|
|
|||||||||||
| Cash flows provided by (used in) investing activities: |
||||||||||||||||||||
| Capital expenditures |
— | (25 | ) | (31 | ) | — | (56 | ) | ||||||||||||
| Capitalized interest |
— | — | (1 | ) | — | (1 | ) | |||||||||||||
| Purchase of intangible assets |
— | (2 | ) | — | — | (2 | ) | |||||||||||||
| Change in restricted cash |
— | — | (5 | ) | — | (5 | ) | |||||||||||||
| Return of capital from subsidiary from sales of accounts receivable |
— | 42 | (a) | — | (42 | ) | — | |||||||||||||
| Proceeds from sale of assets |
— | 1 | — | — | 1 | |||||||||||||||
|
|
|
|
|
|
|
|
|
|
|
|||||||||||
| — | 16 | (37 | ) | (42 | ) | (63 | ) | |||||||||||||
|
|
|
|
|
|
|
|
|
|
|
|||||||||||
| Cash flows provided by (used in) financing activities: |
||||||||||||||||||||
| Net short-term debt repayments |
— | — | (1 | ) | — | (1 | ) | |||||||||||||
| Borrowings of long-term debt |
— | 239 | 105 | — | 344 | |||||||||||||||
| Payments of long-term debt |
(1 | ) | (175 | ) | (82 | ) | — | (258 | ) | |||||||||||
| Proceeds from capital contribution |
102 | — | — | — | 102 | |||||||||||||||
| Net intercompany loan (repayments) borrowings |
(34 | ) | 28 | 6 | — | — | ||||||||||||||
| Long-term debt financing fees |
(11 | ) | — | — | — | (11 | ) | |||||||||||||
| Common stock dividends paid |
— | (48 | ) | — | 48 | — | ||||||||||||||
| Return of capital to parent from sales of accounts receivable |
— | — | (42 | )(a) | 42 | — | ||||||||||||||
|
|
|
|
|
|
|
|
|
|
|
|||||||||||
| 56 | 44 | (14 | ) | 90 | 176 | |||||||||||||||
|
|
|
|
|
|
|
|
|
|
|
|||||||||||
| Increase (decrease) in cash and cash equivalents |
5 | — | (21 | ) | — | (16 | ) | |||||||||||||
| Effect of exchange rate changes on cash and cash equivalents |
— | — | (2 | ) | — | (2 | ) | |||||||||||||
| Cash and cash equivalents (unrestricted), beginning of period |
1 | 2 | 107 | — | 110 | |||||||||||||||
|
|
|
|
|
|
|
|
|
|
|
|||||||||||
| Cash and cash equivalents (unrestricted), end of period |
$ | 6 | $ | 2 | $ | 84 | $ | — | $ | 92 | ||||||||||
|
|
|
|
|
|
|
|
|
|
|
|||||||||||
| (a) | During the nine months ended September 30, 2013, Momentive Performance Materials USA Inc. contributed receivables of $42 to a non-guarantor subsidiary as capital contributions, resulting in a non-cash transaction. During the nine months ended September 30, 2013, the non-guarantor subsidiary sold the contributed receivables to certain banks under various supplier financing agreements. The cash proceeds were returned to Momentive Performance Materials USA Inc. by the non-guarantor subsidiary as a return of capital. The sale of receivables has been included within cash flows from operating activities on the Combined non-guarantor subsidiaries. The return of the cash proceeds from the sale of receivables has been included as a financing outflow and an investing inflow on the Combined Non-Guarantor Subsidiaries and the Combined Guarantor Subsidiaries, respectively. |
F-91
Table of Contents
16. Condensed Combined Debtor-in-Possession Financial Information
The following condensed combined financial information presents the Debtor’s Balance Sheet as of September 30, 2014, the Debtor’s Statement of Operations for the three months ended September 30, 2014 and the Debtor’s Statement of Cash Flows for the nine months ended September 30, 2014. Effective April 13, 2014, the Company’s Non-Filing Entities are accounted for as unconsolidated subsidiaries in these financial statements and, as such, their net loss is included as “Losses from unconsolidated entities, net of taxes” in the Debtors’ Statement of Operations and their net assets are included as “Accumulated Losses from unconsolidated subsidiaries in excess of investment” in the Debtors’ Balance Sheet.
Intercompany transactions between the Debtors have been eliminated in the financial statements contained herein. Intercompany transactions between the Debtors and the Non-Filing Entities have not been eliminated in the Debtors’ financial statements.
DEBTORS’ BALANCE SHEET (Unaudited)
| September 30, 2014 | ||||
| Assets |
||||
| Current assets: |
||||
| Cash and cash equivalents |
$ | 13 | ||
| Accounts receivable (net of allowance for doubtful accounts of $4) |
104 | |||
| Due from affiliates |
79 | |||
| Inventories: |
||||
| Raw materials |
73 | |||
| Finished and in-process goods |
130 | |||
| Other current assets |
38 | |||
|
|
|
|||
| Total current assets |
437 | |||
| Other long-term assets |
6 | |||
| Intercompany loans receivable |
1,630 | |||
| Property and equipment, net |
420 | |||
| Goodwill |
17 | |||
| Other intangible assets, net |
74 | |||
|
|
|
|||
| Total assets |
$ | 2,584 | ||
|
|
|
|||
| Liabilities and Deficit |
||||
| Current liabilities: |
||||
| Accounts payable |
$ | 90 | ||
| Due to affiliates |
31 | |||
| Debt payable within one year |
1,707 | |||
| Interest payable |
59 | |||
| Accrued payroll and incentive compensation |
19 | |||
| Other current liabilities |
48 | |||
|
|
|
|||
| Total current liabilities |
1,954 | |||
| Long-term liabilities: |
||||
| Intercompany loans payable |
120 | |||
| Accumulated losses from unconsolidated subsidiaries in excess of investment |
307 | |||
| Other long-term liabilities |
4 | |||
| Liabilities subject to compromise |
2,026 | |||
|
|
|
|||
| Total liabilities |
4,411 | |||
|
|
|
|||
| Total deficit |
(1,827 | ) | ||
|
|
|
|||
| Total liabilities and deficit |
$ | 2,584 | ||
|
|
|
|||
F-92
Table of Contents
DEBTORS’ STATEMENT OF OPERATIONS (Unaudited)
| Three
Months Ended September 30, 2014 |
||||
| Net sales |
$ | 291 | ||
| Costs and expenses: |
||||
| Cost of sales, excluding depreciation |
202 | |||
| Selling, general and administrative expense |
122 | |||
| Depreciation and amortization expense |
17 | |||
| Research and development expense |
11 | |||
| Restructuring and other costs |
7 | |||
|
|
|
|||
| Operating loss |
(68 | ) | ||
| Interest expense, net |
8 | |||
| Reorganization items, net |
44 | |||
|
|
|
|||
| Loss before income taxes and earnings from unconsolidated entities |
(120 | ) | ||
| Income tax expense |
— | |||
|
|
|
|||
| Loss before losses from unconsolidated entities |
(120 | ) | ||
| Losses from unconsolidated entities, net of taxes |
(79 | ) | ||
|
|
|
|||
| Net loss |
$ | (199 | ) | |
|
|
|
|||
| Comprehensive loss |
$ | (169 | ) | |
|
|
|
|||
F-93
Table of Contents
DEBTORS’ STATEMENT OF CASH FLOWS (Unaudited)
| Nine Months Ended September 30, 2014 |
||||
| Cash flows used in operating activities |
$ | (176 | ) | |
|
|
|
|||
| Cash flows provided by investing activities |
||||
| Capital expenditures |
(32 | ) | ||
| Purchases of intangible assets |
(2 | ) | ||
| Proceeds from sale of assets |
1 | |||
| Return of capital from subsidiary from sales of accounts receivable |
41 | |||
|
|
|
|||
| Net cash provided by investing activities |
8 | |||
|
|
|
|||
| Cash flows provided by financing activities |
||||
| Net short-term debt borrowings |
305 | |||
| Borrowings of long-term debt |
118 | |||
| Repayments of long-term debt |
(153 | ) | ||
| DIP Facility financing fees |
(19 | ) | ||
| Net intercompany loan repayments |
(67 | ) | ||
| Common stock dividends paid |
(5 | ) | ||
|
|
|
|||
| Net cash provided by financing activities |
179 | |||
|
|
|
|||
| Increase in cash and cash equivalents |
11 | |||
| Cash and cash equivalents, beginning of period |
2 | |||
|
|
|
|||
| Cash and cash equivalents, end of period |
$ | 13 | ||
|
|
|
|||
F-94
Table of Contents
39,305,466 Shares
MPM Holdings Inc.
COMMON STOCK
PROSPECTUS
, 2015
Table of Contents
PART II
INFORMATION NOT REQUIRED IN PROSPECTUS
| Item 13. | Other Expenses of Issuance and Distribution. |
Set forth below is a table of the registration fee for the Securities and Exchange Commission and estimates of all other expenses to be paid by the registrant in connection with the issuance and distribution of the securities described in the registration statement:
| SEC registration fee |
$ | 92,854 | ||
| Printing fees and expenses |
* | |||
| Legal fees and expenses |
* | |||
| Accounting fees and expenses |
* | |||
| Miscellaneous |
* | |||
|
|
|
|||
| Total |
$ | * |
| * | To be filed by amendment. |
| Item 14. | Indemnification of Directors and Officers. |
MPM Holdings Inc. (“MPM Holdings”) is a Delaware Corporation. Section 145(a) of the General Corporation Law of the State of Delaware (the “DGCL”), provides that a Delaware corporation may indemnify any person who was or is a party or is threatened to be made a party to any threatened, pending or completed action, suit or proceeding, whether civil, criminal, administrative or investigative (other than an action by or in the right of the corporation) by reason of the fact that he is or was a director, officer, employee or agent of the corporation or is or was serving at the request of the corporation as a director, officer, employee or agent of another corporation, partnership, joint venture, trust or other enterprise, against expenses, including attorneys’ fees, judgments, fines and amounts paid in settlement actually and reasonably incurred by him in connection with such action, suit or proceeding if he acted in good faith and in a manner he reasonably believed to be in or not opposed to the best interests of the corporation, and, with respect to any criminal action or proceeding, had no cause to believe his conduct was unlawful.
Section 145(b) of the DGCL provides that a Delaware corporation may indemnify any person who was or is a party or is threatened to be made a party to any threatened, pending or completed action or suit by or in the right of the corporation to procure a judgment in its favor by reason of the fact that such person acted in any of the capacities set forth above, including attorneys’ fees actually and reasonably incurred by him in connection with the defense or settlement of such action or suit if he acted under similar standards set forth above, except that no indemnification may be made in respect of any claim, issue or matter as to which such person shall have been adjudged to be liable to the corporation unless and only to the extent that a court of appropriate jurisdiction in which such action or suit was brought shall determine that despite the adjudication of liability, such person is fairly and reasonably entitled to be indemnified for such expenses which such court shall deem proper.
Article VIII of MPM Holdings’ Certificate of Incorporation provides for the indemnification of directors, officers, employees or agents to the fullest extent authorized by the DGCL. Article VIII also provides that, in any action initiated by a person seeking indemnification, MPM Holdings shall bear the burden of proof that the person is not entitled to indemnification.
Section 102(b)(7) of the DGCL provides that a Delaware corporation may, with certain limitations, set forth in its certificate of incorporation a provision eliminating or limiting the personal liability of a director to the corporation or its stockholders for monetary damages for breach of a fiduciary duty as a director, provided that such provision shall not eliminate or limit the liability of a director (i) for any breach of the director’s duty of loyalty to the registrant or its stockholders, (ii) for acts or omissions not in good faith or which involve intentional misconduct or a knowing violation of law, (iii) under Section 174 of the DGCL or (iv) for any transaction from which the director derived an improper personal benefit. Article VIII of MPM Holdings’ Certificate of Incorporation includes such a provision.
II-1
Table of Contents
Section 145(g) of the DGCL provides that a Delaware corporation has the power to purchase and maintain insurance on behalf of any director, officer, employee or other agent of the corporation or, if serving in such capacity at the request of the corporation, of another enterprise, against any liability asserted against such person and incurred by such person in any such capacity, or arising out of such person’s status as such, whether or not the corporation has the power to indemnify such person against such liability under the DGCL. Article VIII of MPM Holdings’ Certificate of Incorporation permits the corporation to maintain insurance, at the corporation’s expense, to protect itself or any of its directors, officers, employees or agents or another corporation, partnership, joint venture, trust or other enterprise against any such expense, liability or loss, whether or not the corporation would have the power to indemnify such person against such expense, liability or loss under the DGCL.
In addition, our directors intend to enter into separate contractual indemnity arrangements with MPM Holdings. These arrangements will provide for indemnification and the advancement of expenses to our directors in circumstances and subject to limitations substantially similar to those described above.
Insurance
MPM Holdings currently maintains an insurance policy which, within the limits and subject to the terms and conditions thereof, covers certain expenses and liabilities that may be incurred by directors and officers in connection with proceedings that may be brought against them as a result of an act or omission committed or suffered while acting as a director or officer of this Registrant.
| Item 15. | Recent Sales of Unregistered Securities |
In connection with the emergence of Momentive Performance Materials Inc. (“MPM”) and certain of its domestic subsidiaries from Chapter 11, on October 24, 2014, we issued 47,989,000 shares of our common stock in exchange of shares of common stock of MPM pursuant to the Plan of Reorganization in transactions exempt from registration under Section 4(a)(2) of the Securities Act and Section 1145(a)(1) of the Bankruptcy Code.
| Item 16. | Exhibits and Financial Statement Schedules. |
(a) Exhibits
See the Exhibit Index immediately following the signature pages included in this Registration Statement.
(b) Financial Statement Schedules
Schedule II – Valuation and Qualifying Accounts
| Column A |
Column B | Column C | Column D | Column E | ||||||||||||
| Description |
Balance at Beginning of Period |
Additions(1) | Deductions | Balance at End of Period |
||||||||||||
| Deferred Tax Asset Valuation Allowance: |
||||||||||||||||
| Year ended December 31, 2013 |
$ | 812 | $ | 162 | $ | (2 | ) | $ | 972 | |||||||
| Year ended December 31, 2012 |
$ | 719 | $ | 94 | $ | (1 | ) | $ | 812 | |||||||
| Year ended December 31, 2011 |
$ | 652 | $ | 77 | $ | (10 | ) | $ | 719 | |||||||
| (1) | Charged to cost and expenses. Includes the impact of foreign currency translation. |
| Item 17. | Undertakings. |
The undersigned registrant hereby undertakes:
(1) To file, during any period in which offers or sales are being made, a post-effective amendment to this registration statement:
(i) To include any prospectus required by Section 10(a)(3) of the Securities Act of 1933;
II-2
Table of Contents
(ii) To reflect in the prospectus any facts or events arising after the effective date of the registration statement (or the most recent post-effective amendment thereof) which, individually of in the aggregate, represent a fundamental change in the information set forth in the registration statement. Notwithstanding the foregoing, any increase or decrease in volume of securities offered (if the total dollar value of securities offered would not exceed that which was registered) and any deviation from the low or high end of the estimated maximum offering range may be reflected in the form of prospectus filed with the Commission pursuant to Rule 424(b) if, in the aggregate, the changes in volume and price represent no more than 20% change in the maximum aggregate offering price set forth in the “Calculation of Registration Fee” table in the effective registration statement;
(iii) To include any material information with respect to the plan of distribution not previously disclosed in the registration statement or any material change to such information in the registration statement;
(2) That, for the purpose of determining any liability under the Securities Act of 1933, each such post-effective amendment shall be deemed to be a new registration statement relating to the securities offered therein, and the offering of such securities at that time shall be deemed to be the initial bona fide offering thereof.
(3) To remove from registration by means of a post-effective amendment any of the securities being registered which remain unsold at the termination of the offering.
(4) That, for purposes of determining liability under the Securities Act of 1933 to any purchaser:
(i) Each prospectus filed pursuant to Rule 424(b) as part of the registration statement relating to an offering, other than registration statements relying on Rule 430B or other than prospectuses filed in reliance on Rule 430A, shall be deemed to be part of and included in the registration statement as of the date it is first used after effectiveness. Provided, however, that no statement made in a registration statement or prospectus that is part of the registration statement or made in a document incorporated or deemed incorporated by reference into the registration statement or prospectus that is part of the registration statement will, as to a purchaser with a time of contract of sale prior to such first use, supersede or modify any statement that was made in the registration statement or prospectus that was part of the registration statement or made in any such document immediately prior to such date of first use.
Insofar as indemnification for liabilities arising under the Securities Act of 1933 may be permitted to directors, officers and controlling persons of the registrant pursuant to the foregoing provisions, or otherwise, the registrant has been advised that in the opinion of the Securities and Exchange Commission such indemnification is against public policy as expressed in the Act and is, therefore, unenforceable. In the event that a claim for indemnification against such liabilities (other than the payment by the registrant of expenses incurred or paid by a director, officer or controlling person of the registrant in the successful defense of any action, suit or proceeding) is asserted by such director, officer or controlling person in connection with the securities being registered, the registrant will, unless in the opinion of its counsel the matter has been settled by controlling precedent, submit to a court of appropriate jurisdiction the question whether such indemnification by it is against public policy as expressed in the act and will be governed by the final adjudication of such issue.
II-3
Table of Contents
SIGNATURES
Pursuant to the requirements of the Securities Act of 1933, MPM Holdings Inc. has duly caused this Registration Statement to be signed on its behalf by the undersigned, thereunto duly authorized, in the City of Waterford, State of New York, on the 13th day of February, 2015.
| MPM HOLDINGS INC. | ||
| By: | * | |
| John G. Boss Chief Executive Officer and President | ||
Pursuant to the requirements of the Securities Act of 1933, this Registration Statement has been signed by the following persons in the capacities and on the dates indicated.
| Signature |
Capacity |
Date | ||
| * John G. Boss |
Chief Executive Officer and President; Director (Principal Executive Officer) | February 13, 2015 | ||
| * Brian D. Berger |
Interim Chief Financial Officer (Principal Financial Officer and Principal Accounting Officer) |
February 13, 2015 | ||
| * Mahesh Balakrishnan |
Director | February 13, 2015 | ||
| * Bradley Bell |
Director | February 13, 2015 | ||
| * John D. Dionne |
Director | February 13, 2015 | ||
| * Robert Kalsow-Ramos |
Director | February 13, 2015 | ||
| * Scott Kleinman |
Director | February 13, 2015 | ||
| * Julian Markby |
Director | February 13, 2015 | ||
| * Daniel C. Murphy |
Director | February 13, 2015 | ||
| * Jason New |
Director | February 13, 2015 | ||
| * David Sambur |
Director | February 13, 2015 | ||
| * Marvin Schlanger |
Director | February 13, 2015 | ||
| *By: | /S/ STEPHEN J. PSUTKA | |
| Stephen J. Psutka Attorney-in-Fact | ||
II-4
Table of Contents
EXHIBIT INDEX
| Exhibit Number |
Exhibit Description |
Filed Herewith |
Incorporated by Reference | |||||||||||||||||
| Form | File Number | Exhibit | Filing Date | |||||||||||||||||
| 2.1 | Joint Chapter 11 Plan of Reorganization for Momentive Performance Materials Inc. and its Affiliated Debtors, dated September 24, 2014. | 8-K | 333-146093 | 2.1 | 10/28/14 | |||||||||||||||
| 3.1 | Amended and Restated Certificate of Incorporation of MPM Holdings Inc. | S-1 | 333-201338 | 3.1 | 12/31/14 | |||||||||||||||
| 3.2 | Amended and Restated By-laws of MPM Holdings Inc. | S-1 | 333-201338 | 3.2 | 12/31/14 | |||||||||||||||
| 4.1 | Indenture, dated as of October 24, 2014, among Momentive Performance Materials Inc., the Note Guarantors party thereto, The Bank of New York Mellon Trust Company, N.A., as trustee and collateral agent, relating to the $1,100,000,000 First-Priority Senior Secured Notes due 2021. | 8-K | 333-146093 | 4.1 | 10/28/14 | |||||||||||||||
| 4.2 | Indenture, dated as of October 24, 2014, among Momentive Performance Materials Inc., the Note Guarantors party thereto, The Bank of New York Mellon Trust Company, N.A., as trustee and collateral agent, relating to the $250,000,000 Second-Priority Senior Secured Notes due 2022. | 8-K | 333-146093 | 4.2 | 10/28/14 | |||||||||||||||
| 4.3 | First Lien Collateral Agreement, dated and effective as of October 24, 2014, among Momentive Performance Materials Inc., each Subsidiary Guarantor party thereto and The Bank of New York Mellon Trust Company, N.A., as Collateral Agent. | 8-K | 333-146093 | 4.3 | 10/28/14 | |||||||||||||||
| 4.4 | Second Lien Collateral Agreement, dated and effective as of October 24, 2014, among Momentive Performance Materials Inc., each Subsidiary Guarantor party thereto and The Bank of New York Mellon Trust Company, N.A., as Collateral Agent. | 8-K | 333-146093 | 4.4 | 10/28/14 | |||||||||||||||
| 4.5 | ABL Intercreditor Agreement, dated as of October 24, 2014, among JPMorgan Chase Bank, N.A., as ABL Facility Collateral Agent, The Bank of New York Mellon Trust Company, N.A., as Applicable First-Lien Agent and First-Lien Collateral Agent, Momentive Performance Materials Inc., Momentive Performance Materials USA Inc. and the Subsidiaries of Momentive Performance Materials Inc. named therein. | 8-K | 333-146093 | 4.5 | 10/28/14 | |||||||||||||||
II-5
Table of Contents
| Exhibit Number |
Exhibit Description |
Filed Herewith |
Incorporated by Reference | |||||||||||||||||
| Form | File Number | Exhibit | Filing Date | |||||||||||||||||
| 4.6 | Intercreditor Agreement, dated as of October 24, 2014, among JPMorgan Chase Bank, N.A., as ABL Credit Agreement Agent and as Intercreditor Agent, The Bank of New York Mellon Trust Company, N.A., as First-Lien Notes Agent, The Bank of New York Mellon Trust Company, N.A., as Trustee and as Collateral Agent, Momentive Performance Materials Inc. and the Subsidiaries of Momentive Performance Materials Inc. named therein. | 8-K | 333-146093 | 4.6 | 10/28/14 | |||||||||||||||
| 5.1 | Opinion of Paul, Weiss, Rifkind, Wharton & Garrison LLP | S-1 | 333-201338 | 5.1 | 12/31/14 | |||||||||||||||
| 10.1* | Intellectual Property Cross License Agreement, dated as of December 3, 2006, by and between General Electric Company and Momentive Performance Materials Holdings Inc. | S-4 | 333-146093 | 10.3 | 10/11/07 | |||||||||||||||
| 10.2* | Trademark License Agreement (GE Name and Marks), dated as of December 3, 2006, by and between GE Monogram Licensing International and Momentive Performance Materials Holdings Inc. | S-4 | 333-146093 | 10.4 | 10/11/07 | |||||||||||||||
| 10.3 | Land Lease Agreement, as amended, dated as of July 1, 1998, by and among Bayer AG and Momentive Performance Materials GmbH (formerly known as Bayer Silicones GmbH & Co. KG) | S-4 | 333-146093 | 10.5 | 9/14/07 | |||||||||||||||
| 10.4† | 2007 Long-Term Incentive Plan | S-4 | 333-146093 | 10.7 | 9/14/07 | |||||||||||||||
| 10.5† | Form of Non-Qualified Stock Option Agreement | S-4 | 333-146093 | 10.8 | 9/14/07 | |||||||||||||||
| 10.6† | Form of Management Equity Investment and Incentive Term Sheet | S-4 | 333-146093 | 10.9 | 9/14/07 | |||||||||||||||
| 10.7† | Form of Subscription Agreement | S-4 | 333-146093 | 10.10 | 9/14/07 | |||||||||||||||
| 10.8† | Annual Cash Bonus Plan | 10-Q | 333-146093 | 10.1 | 5/14/08 | |||||||||||||||
| 10.9† | Form of Management Equity Investment and Incentive Acknowledgement | 10-K | 333-146093 | 10.24 | 3/8/10 | |||||||||||||||
| 10.10† | Form of Global Amendment to Nonqualified Stock Option Agreement | 10-K | 333-146093 | 10.25 | 3/8/10 | |||||||||||||||
| 10.11† | Offer Letter Agreement, dated February 1, 2010, between Momentive Performance Materials Inc. and John Dandolph | 10-K | 333-146093 | 10.30 | 2/25/11 | |||||||||||||||
II-6
Table of Contents
| Exhibit Number |
Exhibit Description |
Filed Herewith |
Incorporated by Reference | |||||||||||||||||
| Form | File Number | Exhibit | Filing Date | |||||||||||||||||
| 10.12† | Summary of Terms of Severance Benefits Amendment for Douglas Johns effective October 1, 2010 | 10-K | 333-146093 | 10.29 | 2/25/11 | |||||||||||||||
| 10.13† | Momentive Performance Materials Holdings LLC 2011 Equity Plan | S-4 | 333-172938 | 10.32 | 3/18/11 | |||||||||||||||
| 10.14† | Form of Restricted Deferred Unit Award Agreement of Momentive Performance Materials Holdings LLC | S-4 | 333-172938 | 10.33 | 3/18/11 | |||||||||||||||
| 10.15† | Form of Unit Option Agreement of Momentive Performance Materials Holdings LLC | S-4 | 333-172938 | 10.34 | 3/18/11 | |||||||||||||||
| 10.16† | Form of Director Unit Option Agreement of Momentive Performance Materials Holdings LLC | S-4 | 333-172938 | 10.35 | 3/18/11 | |||||||||||||||
| 10.17† | Management Investor Rights Agreements, dated as of February 23, 2011 by and among Momentive Performance Materials Holdings LLC and the Holders | S-4 | 333-172938 | 10.36 | 3/18/11 | |||||||||||||||
| 10.18 | Amended and Restated Shared Services Agreement dated March 17, 2011 by and among Momentive Performance Materials Inc., its subsidiaries and Momentive Specialty Chemicals Inc. | 8-K | 333-146093 | 10.1 | 3/17/11 | |||||||||||||||
| 10.19 | Master Confidentiality and Joint Development Agreement entered into on March 17, 2011 by and between Momentive Performance Materials Inc. and Momentive Specialty Chemicals Inc. | 8-K | 333-146093 | 10.2 | 3/17/11 | |||||||||||||||
| 10.20† | Amended and Restated Momentive Performance Materials Inc. Supplementary Pension Plan, effective December 31, 2011 | 8-K | 333-146093 | 99.1 | 1/6/12 | |||||||||||||||
| 10.21† | Momentive Performance Materials Inc. Supplemental Executive Retirement Plan, effective January 1, 2012 | 8-K | 333-146093 | 99.1 | 1/6/12 | |||||||||||||||
| 10.22† | Severance Pay Agreement and Release of All Claims, effective as of February 23, 2012, among Mike Modak, Momentive Performance Materials Inc. and Momentive Performance Materials Holdings Inc. | S-1/A | 333-175800 | 10.34 | 4/13/12 | |||||||||||||||
| 10.23† | Severance Pay Agreement and Release of All Claims, effective as of February 27, 2012, among Steve Delarge, Momentive Performance Materials Inc., Momentive Performance Materials Holdings Inc. and Momentive Performance Materials Holdings LLC | S-1/A | 333-175800 | 10.35 | 4/13/12 | |||||||||||||||
II-7
Table of Contents
| Exhibit Number |
Exhibit Description |
Filed Herewith |
Incorporated by Reference | |||||||||||||||||
| Form | File Number | Exhibit | Filing Date | |||||||||||||||||
| 10.24† | Momentive Performance Materials Holdings LLC 2012 Incentive Compensation Plan | 10-Q | 333-146093 | 10.4 | 8/8/12 | |||||||||||||||
| 10.25† | Amendment No. 1 to the Momentive Performance Materials Holdings LLC 2011 Equity Incentive Plan | 8-K | 333-146093 | 10.1 | 3/6/13 | |||||||||||||||
| 10.26† | Form of Restricted Deferred Unit Agreement of Momentive Performance Materials Holdings LLC | 8-K | 333-146093 | 10.2 | 3/6/13 | |||||||||||||||
| 10.27† | Form of Unit Option Agreement of Momentive Performance Materials Holdings LLC | 8-K | 333-146093 | 10.3 | 3/6/13 | |||||||||||||||
| 10.28† | Momentive Holdings LLC 2012 Long-Term Cash Incentive Plan | 10-K | 333-146093 | 10.38 | 4/1/13 | |||||||||||||||
| 10.29† | Momentive Performance Materials Holdings LLC 2013 Incentive Compensation Plan | 10-K | 333-146093 | 10.39 | 4/1/13 | |||||||||||||||
| 10.30 | Collateral Agreement, dated as of April 24, 2013, by and among Momentive Performance Materials Holdings Inc., Momentive Performance Materials Inc., subsidiaries of Momentive Performance Materials Inc. party thereto and JPMorgan Chase Bank, N.A., as collateral agent | 8-K | 333-146093 | 4.1 | 4/30/13 | |||||||||||||||
| 10.31 | ABL Intercreditor Agreement, dated as of April 24, 2013, by and among JPMorgan Chase Bank, N.A., as ABL facility collateral agent, applicable first-lien agent and first-lien collateral agent, Momentive Performance Materials Holdings Inc., Momentive Performance Materials Inc., Momentive Performance Materials USA Inc. and subsidiaries of Momentive Performance Materials Inc. party thereto | 8-K | 333-146093 | 4.3 | 4/30/13 | |||||||||||||||
| 10.32* | Amendment No. 1 to Trademark License Agreement dated December 3, 2006 by and among GE Monogram Licensing International, Momentive Performance Materials Inc. and General Electric Company, effective as of May 17, 2013 | 10-Q | 333-146093 | 10.1 | 8/13/13 | |||||||||||||||
| 10.33† | Momentive Performance Materials Holdings LLC 2014 Incentive Compensation Plan | 10-K | 333-146093 | 10.46 | 4/11/14 | |||||||||||||||
| 10.34† | Offer Letter Agreement, dated March 14, 2014, between Momentive Performance Materials Holdings LLC and Jack Boss | 10-K | 333-146093 | 10.47 | 4/11/14 | |||||||||||||||
II-8
Table of Contents
| Exhibit Number |
Exhibit Description |
Filed Herewith |
Incorporated by Reference | |||||||||||||||||
| Form | File Number | Exhibit | Filing Date | |||||||||||||||||
| 10.35 | Employee Services Agreement, dated as of March 25, 2014, among Momentive Performance Materials Holdings LLC, Momentive Performance Materials Holdings Employee Corporation, Momentive Performance Materials Inc. and Momentive Specialty Chemicals Inc. | 10-K | 333-146093 | 10.48 | 4/11/14 | |||||||||||||||
| 10.36 | Waiver, dated as of April 11, 2014, with respect to the Asset-Based Revolving Credit Agreement, dated as of April 24, 2013, among Momentive Performance Materials Holdings Inc., Momentive Performance Materials Inc., Momentive Performance Materials USA Inc., as U.S. borrower, Momentive Performance Materials GmbH and Momentive Performance Materials Quartz GmbH, as German borrowers, Momentive Performance Materials Nova Scotia ULC, as Canadian borrower, the lenders party thereto, JPMorgan Chase Bank, N.A., as administrative agent for the lenders, and the other parties named therein. | 8-K | 333-146093 | 10.1 | 4/15/14 | |||||||||||||||
| 10.37 | Waiver and Consent, dated April 10, 2014, among Momentive Performance Materials Holdings Inc., Momentive Performance Materials Inc., Momentive Performance Materials USA Inc., as U.S. borrower, Momentive Performance Materials GmbH, as German borrower, Momentive Performance Materials Nova Scotia ULC, as Canadian borrower, the lenders party thereto, JPMorgan Chase Bank, N.A., as administrative agent and collateral agent. | 8-K | 333-146093 | 10.2 | 4/15/14 | |||||||||||||||
| 10.38 | Restructuring Support Agreement, dated as of April 13, 2014, among Momentive Performance Materials Holdings Inc., Momentive Performance Materials Inc., each of their direct and indirect domestic subsidiaries party thereto and certain holders of the Second Lien Notes party thereto. | 8-K | 333-146093 | 10.1 | 4/17/14 | |||||||||||||||
| 10.39 | First Amendment to Restructuring Support Agreement, dated as of April 16, 2014, among Momentive Performance Materials Holdings Inc., Momentive Performance Materials Inc., each of their direct and indirect domestic subsidiaries party thereto and certain holders of the Second Lien Notes party thereto. | 8-K | 333-146093 | 10.2 | 4/17/14 | |||||||||||||||
II-9
Table of Contents
| Exhibit Number |
Exhibit Description |
Filed Herewith |
Incorporated by Reference | |||||||||||||||||
| Form | File Number | Exhibit | Filing Date | |||||||||||||||||
| 10.40 | Amended and Restated Senior Secured Debtor-in-Possession and Exit Asset-Based Revolving Credit Agreement, dated as of April 15, 2014, among Momentive Performance Materials Holdings Inc., Momentive Performance Materials Inc., Momentive Performance Materials USA Inc., as U.S. borrower, Momentive Performance Materials GmbH and Momentive Performance Materials Quartz GmbH, as German borrowers, Momentive Performance Materials Nova Scotia ULC, as Canadian borrower, the lenders party thereto, JPMorgan Chase Bank, N.A., as administrative agent for the lenders, and the other parties named therein. | 8-K | 333-146093 | 10.3 | 4/17/14 | |||||||||||||||
| 10.41 | Reaffirmation Agreement, dated as of April 15, 2014, among Momentive Performance Materials Holdings Inc., Momentive Performance Materials Inc., Momentive Performance Materials USA Inc., as U.S. borrower, Momentive Performance Materials GmbH and Momentive Performance Materials Quartz GmbH, as German borrowers, Momentive Performance Materials Nova Scotia ULC, as Canadian borrower, and JPMorgan Chase Bank, N.A., as administrative and collateral agent. | 8-K | 333-146093 | 10.4 | 4/17/14 | |||||||||||||||
| 10.42 | First Amendment to Backstop Commitment Agreement, dated as of June 21, 2014, among Momentive Performance Materials Holdings Inc., Momentive Performance Materials Inc. and the Commitment Parties party thereto. | 8-K | 333-146093 | 10.1 | 6/26/14 | |||||||||||||||
| 10.43 | Eighth Amendment to Restructuring Support Agreement, dated as of June 21, 2014, among Momentive Performance Materials Holdings Inc., Momentive Performance Materials Inc., each of their direct and indirect domestic subsidiaries party thereto and certain holders of the Second Lien Notes party thereto. | 8-K | 333-146093 | 10.2 | 6/26/14 | |||||||||||||||
| 10.44 | Backstop Commitment Agreement, dated as of May 9, 2014, among Momentive Performance Materials Holdings Inc., Momentive Performance Materials Inc. and the Commitment Parties party thereto. | 10-Q | 333-146093 | 10.12 | 8/13/14 | |||||||||||||||
II-10
Table of Contents
| Exhibit Number |
Exhibit Description |
Filed Herewith |
Incorporated by Reference | |||||||||||||||||||
| Form | File Number | Exhibit | Filing Date | |||||||||||||||||||
| 10.45 | First Amendment to Senior Secured Debtor-in-Possession and Exit Asset-Based Revolving Credit Agreement, dated as of May 12, 2014, among the Company, MPM Holdings, Momentive Performance Materials USA Inc., Momentive Performance Materials GmbH, Momentive Performance Materials Quartz GmbH, Momentive Performance Materials Nova Scotia ULC, the lenders party thereto and JPMorgan Chase Bank, N.A., as administrative agent for the lenders under the Amended and Restated Senior Secured Debtor-in-Possession and Exit Asset-Based Revolving Credit Agreement, dated as of April 15, 2014. | 10-Q | 333-146093 | 10.13 | 8/13/14 | |||||||||||||||||
| 10.46 | Waiver, dated as of October 24, 2014 with respect to the Amended and Restated Senior Secured Debtor-in-Possession and Exit Asset-Based Revolving Credit Agreement dated as of April 15, 2014, among Momentive Performance Materials Holdings Inc., Momentive Performance Materials Inc., Momentive Performance Materials USA Inc., as U.S. borrower, Momentive Performance Materials GmbH and Momentive Performance Materials Quartz GmbH, as German borrowers, Momentive Performance Materials Nova Scotia ULC, as Canadian borrower, the lenders party thereto, JPMorgan Chase Bank, N.A., as administrative agent for the lenders, and the other parties named therein. | 8-K | 333-146093 | 10.1 | 10/28/14 | |||||||||||||||||
| 10.47 | Second Amended and Restated Shared Services Agreement, dated as of October 24, 2014, by and among Momentive Specialty Chemicals Inc., Momentive Performance Materials Inc. and the subsidiaries of Momentive Performance Materials Inc. party thereto. | X | ||||||||||||||||||||
| 10.48 | Registration Rights Agreement, dated as of October 24, 2014, by and among MPM Holdings Inc. and the stockholders of MPM Holdings Inc. party thereto. | S-1 | 333-201338 | 10.48 | 12/31/14 | |||||||||||||||||
| 21.1 | List of Subsidiaries of MPM Holdings Inc. | S-1 | 333-201338 | 21.1 | 12/31/14 | |||||||||||||||||
| 23.1 | Consent of PricewaterhouseCoopers LLP, an independent registered public accounting firm | X | ||||||||||||||||||||
| 23.2 | Consent of Paul, Weiss, Rifkind, Wharton & Garrison LLP (included in Exhibit 5.1) | S-1 | 333-201338 | 23.2 | 12/31/14 | |||||||||||||||||
II-11
Table of Contents
| Exhibit Number |
Exhibit Description |
Filed Herewith |
Incorporated by Reference | |||||||||||||||
| Form | File Number | Exhibit | Filing Date | |||||||||||||||
| 24.1 | Powers of Attorney of the Directors and Officers of the Registrant (included in signature pages) | S-1 | 333-201338 | 24.1 | 12/31/14 | |||||||||||||
| * | Certain portions of this document have been omitted pursuant to an order granting confidential treatment by the SEC. |
| † | Indicates a management contract or compensatory plan or arrangement. |
II-12