Attached files
| file | filename |
|---|---|
| EX-31.2 - EX-31.2 - IQVIA HOLDINGS INC. | d831296dex312.htm |
| EX-10.34 - EX-10.34 - IQVIA HOLDINGS INC. | d831296dex1034.htm |
| EX-32.2 - EX-32.2 - IQVIA HOLDINGS INC. | d831296dex322.htm |
| EX-32.1 - EX-32.1 - IQVIA HOLDINGS INC. | d831296dex321.htm |
| EX-21.1 - EX-21.1 - IQVIA HOLDINGS INC. | d831296dex211.htm |
| EX-23.1 - EX-23.1 - IQVIA HOLDINGS INC. | d831296dex231.htm |
| EX-31.1 - EX-31.1 - IQVIA HOLDINGS INC. | d831296dex311.htm |
| EX-10.35 - EX-10.35 - IQVIA HOLDINGS INC. | d831296dex1035.htm |
| EX-10.63 - EX-10.63 - IQVIA HOLDINGS INC. | d831296dex1063.htm |
| EX-10.37 - EX-10.37 - IQVIA HOLDINGS INC. | d831296dex1037.htm |
| EXCEL - IDEA: XBRL DOCUMENT - IQVIA HOLDINGS INC. | Financial_Report.xls |
UNITED STATES
SECURITIES AND EXCHANGE COMMISSION
Washington, D.C. 20549
FORM 10-K
(Mark One)
| x | ANNUAL REPORT PURSUANT TO SECTION 13 OR 15(d) OF THE SECURITIES EXCHANGE ACT OF 1934 |
For the fiscal year ended December 31, 2014
or
| ¨ | TRANSITION REPORT PURSUANT TO SECTION 13 OR 15(d) OF THE SECURITIES EXCHANGE ACT OF 1934 |
For the transition period from to .
Commission File Number: 001-35907
QUINTILES TRANSNATIONAL HOLDINGS INC.
(Exact name of registrant as specified in its charter)
| North Carolina | 27-1341991 | |
| (State or other jurisdiction of incorporation or organization) |
(I.R.S. Employer Identification Number) |
4820 Emperor Blvd., Durham, North Carolina 27703
(Address of principal executive offices and Zip Code)
(919) 998-2000
(Registrant’s telephone number, including area code)
Securities registered pursuant to Section 12(b) of the Act:
| Title of Each Class: |
Name of Each Exchange on which Registered | |
| Common Stock, par value $0.01 per share | New York Stock Exchange |
Securities registered pursuant to Section 12(g) of the Act: None
Indicate by check mark if the registrant is a well-known seasoned issuer, as defined in Rule 405 of the Securities Act. Yes x No ¨
Indicate by check mark if the registrant is not required to file reports pursuant to Section 13 or section 15(d) of the Exchange Act. Yes ¨ No x
Indicate by check mark whether the registrant (1) has filed all reports required to be filed by Section 13 or 15(d) of the Securities Exchange Act of 1934 during the preceding twelve months (or for such shorter period that the registrant was required to file such reports), and (2) has been subject to such filing requirements for the past 90 days. Yes x No ¨
Indicate by check mark whether the registrant has submitted electronically and posted on its corporate Web site, if any, every Interactive Data File required to be submitted and posted pursuant to Rule 405 of Regulation S-T during the preceding 12 months (or for such shorter period that the registrant was required to submit and post such files). Yes x No ¨
Indicate by check mark if disclosure of delinquent filers pursuant to Item 405 of Regulation S-K is not contained herein, and will not be contained, to the best of registrant’s knowledge, in definitive proxy or information statements incorporated by reference in Part III of this Form 10-K or any amendment to this Form 10-K. x
Indicate by check mark whether the registrant is a large accelerated filer, an accelerated filer, a non-accelerated filer, or a smaller reporting company. See the definitions of “large accelerated filer,” “accelerated filer” and “smaller reporting company” in Rule 12b-2 of the Exchange Act.
| Large accelerated filer | x | Accelerated filer | ¨ | |||
| Non-accelerated filer | ¨ (Do not check if a smaller reporting company) | Smaller reporting company | ¨ | |||
Indicate by check mark whether the registrant is a shell company (as defined in Rule 12b-2 of the Exchange Act). Yes ¨ No x
The aggregate market value of the voting and non-voting common stock held by non-affiliates of the registrant, based upon the closing sale price as reported on the New York Stock Exchange on June 30, 2014, the last business day of the registrant’s most recently completed second quarter, was approximately $3,275,274,595.
Indicate the number of shares outstanding of each of the issuer’s classes of Common Stock, as of the latest practicable date.
| Class |
Number of Shares Outstanding | |
| Common Stock $0.01 par value | 124,315,113 shares outstanding as of February 5, 2015 |
Portions of the registrant’s Proxy Statement for the 2015 Annual Meeting of Shareholders are incorporated herein by reference in Part III of this Annual Report on Form 10-K to the extent stated herein. Such proxy statement will be filed with the Securities and Exchange Commission within 120 days of the registrant’s fiscal year ended December 31, 2014.
QUINTILES TRANSNATIONAL HOLDINGS INC.
FORM 10-K
TABLE OF CONTENTS
| Item |
Page |
|||||
| PART I | ||||||
| 1. |
Business | 4 | ||||
| 1A. |
Risk Factors | 21 | ||||
| 1B. |
Unresolved Staff Comments | 38 | ||||
| 2. |
Properties | 38 | ||||
| 3. |
Legal Proceedings | 39 | ||||
| 4. |
Mine Safety Disclosures | 39 | ||||
| PART II | ||||||
| 5. |
40 | |||||
| 6. |
Selected Financial Data | 43 | ||||
| 7. |
Management’s Discussion and Analysis of Financial Condition and Results of Operations | 45 | ||||
| 7A. |
Quantitative and Qualitative Disclosures About Market Risk | 65 | ||||
| 8. |
Financial Statements and Supplementary Data | 67 | ||||
| 9. |
Changes in and Disagreements with Accountants on Accounting and Financial Disclosure | 114 | ||||
| 9A. |
Controls and Procedures | 114 | ||||
| 9B. |
Other Information | 114 | ||||
| PART III | ||||||
| 10. |
Directors, Executive Officers and Corporate Governance | 115 | ||||
| 11. |
Executive Compensation | 115 | ||||
| 12. |
Security Ownership of Certain Beneficial Owners and Management and Related Stockholder Matters |
115 | ||||
| 13. |
Certain Relationships and Related Transactions and Director Independence | 115 | ||||
| 14. |
Principal Accountant Fees and Services | 115 | ||||
| PART IV | ||||||
| 15. |
Exhibits and Financial Statement Schedules | 116 | ||||
| Signatures | 117 | |||||
| Exhibit Index | 125 | |||||
2
FORWARD-LOOKING STATEMENTS
This Annual Report on Form 10-K contains forward-looking statements within the meaning of Section 27A of the Securities Act of 1933, as amended, or the Securities Act, and Section 21E of the Securities Exchange Act of 1934, as amended, or the Exchange Act. Such forward-looking statements reflect, among other things, our current expectations and anticipated results of operations, all of which are subject to known and unknown risks, uncertainties and other factors that may cause our actual results, performance or achievements, market trends, or industry results to differ materially from those expressed or implied by such forward-looking statements. Therefore, any statements contained herein that are not statements of historical fact may be forward-looking statements and should be evaluated as such. Without limiting the foregoing, the words “anticipates,” “believes,” “estimates,” “expects,” “intends,” “may,” “plans,” “projects,” “should,” “targets,” “will” and the negative thereof and similar words and expressions are intended to identify forward-looking statements. These forward-looking statements are subject to a number of risks, uncertainties and assumptions, including those described in Part I, Item 1A, “Risk Factors.” Unless legally required, we assume no obligation to update any such forward-looking information to reflect actual results or changes in the factors affecting such forward-looking information.
3
PART I
Overview
We are the world’s largest provider of biopharmaceutical development services and commercial outsourcing services. We are positioned at the intersection of business services and healthcare and generated $4.2 billion of service revenues in 2014, conduct business in approximately 100 countries and have approximately 32,600 employees. We use the breadth and depth of our service offerings, our global footprint and our therapeutic, scientific and analytics expertise to help our biopharmaceutical customers, as well as other healthcare customers, to be more successful in an increasingly complex healthcare environment.
Since our founding in 1982, we have grown to become a leader in the development and commercialization of new pharmaceutical therapies. Our Product Development segment is the world’s largest contract research organization, or CRO, based upon the most recently available public information of reported service revenues, and is focused primarily on Phase II-IV clinical trials and associated laboratory and analytical activities. Our Integrated Healthcare Services segment includes one of the leading global commercial pharmaceutical sales and service organizations. Integrated Healthcare Services provides a broad array of services, including commercial services, such as contract pharmaceutical sales forces, and healthcare business services for the broader healthcare sector, such as real-world and late phase research, market access and consulting, health information analytics and technology consulting, and other healthcare solutions. Product Development contributed approximately 74% and Integrated Healthcare Services contributed approximately 26% to our 2014 service revenues. Additional information regarding our segments is presented in Note 20 to our audited consolidated financial statements included elsewhere in this Annual Report on Form 10-K.
Our global scale and capabilities enable us to work with the leading companies in the biopharmaceutical sector. During each of the last 12 years, we have worked with the 20 largest biopharmaceutical companies ranked by 2013 reported revenues. We have provided services in connection with the development or commercialization of the top 100 best-selling biopharmaceutical products and the top 50 best-selling biologic products, from 2013 as measured by reported sales. Of the new molecular entities, or NMEs, and new biological license applications, or BLAs, approved by the United States Food and Drug Administration, or FDA, from 2004 through 2013, we helped develop or commercialize 100% of the central nervous system drugs, 92% of the oncology drugs and 87% of the cardiovascular drugs.
In 2014, our service revenues were $4.2 billion and our net income attributable to our shareholders was $356.4 million. In addition, our 2014 net new business was $5.6 billion, and we ended the year with $11.2 billion in backlog. Our backlog is diversified with 37% from top 10 biopharmaceutical companies, 22% representing contracts with biopharmaceutical companies ranked as 11-20, 19% representing contracts with biopharmaceutical companies ranked as 21-50, and 22% representing contracts with biopharmaceutical companies outside the top 50, in each case, as ranked by 2013 sales. See Part I, Item 1, “Business—Net New Business Reporting and Backlog” for more detail. During each of the last seven years, we have had at least eight customers from whom we earned more than $100 million in service revenues. No single customer represented more than 10% of our 2014 revenues.
Our Markets
The market served by Product Development consists primarily of biopharmaceutical companies, including medical device and diagnostics companies, that outsource services associated with the development of pharmaceutical products, such as clinical trials. We estimate that total research and development, or R&D, spending was approximately $140 billion in 2014 of which biopharmaceutical spending on drug development was approximately $95 billion, and we estimate that our addressable market (clinical development spending excluding preclinical spending) was approximately $52 billion. The portion of this $52 billion that was outsourced in 2014, based on our estimates, was approximately $21 billion. We estimate that the potential market for Product Development’s services will experience a compound annual growth rate, or CAGR, of 6%-8% from 2014 through 2017 as a result of increased R&D spending by biopharmaceutical companies and the increased outsourcing of this spending as compared to 2013.
4
Integrated Healthcare Services primarily addresses markets related to the use of approved biopharmaceutical products. We estimate that total spending related to approved drugs, including biopharmaceutical spending on commercialization of these drugs and expenditures by participants in the broader healthcare market on real-world research, healthcare technology implementation analytics, and evidence-based medicine, exceeded $98 billion in 2014. Integrated Healthcare Services links product development to healthcare delivery. This segment’s services include commercial services such as recruiting, training, deploying and managing a global sales force, channel management, patient engagement services, market access consulting, brand communication, consulting, and health information analytics and technology consulting. In addition, Integrated Healthcare Services offers real-world late phase services such as observational studies, comparative effectiveness studies and product and disease registry services, which are intended to help increase the quality and cost-effectiveness of healthcare and payer provider solutions. We believe that a combination of cost pressure in healthcare systems around the world and the increasing focus on the value and efficacy of pharmaceutical therapy provide us many opportunities to grow our revenues and expand our service offerings by improving the cost-effectiveness of drug therapies.
We believe that we are well-positioned to benefit from current trends in the biopharmaceutical and healthcare industries that affect our markets, including:
Trends in R&D Spending. We estimate that R&D spending was approximately $140 billion in 2014 and will grow to approximately $150 billion in 2017, with drug development accounting for approximately 68% of total expenditures. R&D spending trends are impacted as a result of several factors, including major biopharmaceutical companies’ efforts to replenish revenues lost from the so-called “patent cliff” of recent years, increased access to capital by the small and midcap biotechnology industry, and recent increases in pharmaceutical approvals by regulatory authorities. In 2014, there were approximately 4,620 drugs in the Phase I-III development pipeline, an increase of 35% since 2008, and there were 41 NME approvals by the FDA in 2014 which was the highest number of approvals in any of the past 18 years. We believe that further R&D spending, combined with the continued need for cost efficiency across the healthcare landscape, will continue to create opportunities for biopharmaceutical services companies, particularly those with a global reach and broad service offerings, to help biopharmaceutical companies with their pre- and post-launch product development and commercialization needs.
Growth in Outsourcing. We estimate that clinical development spending outsourced to CROs in Phases I-IV in 2014 was approximately $21 billion and will grow to approximately $26 billion by 2017. We expect outsourced clinical development to CROs to grow 6%-8% annually during this period. Of this annual growth, we believe that up to 2% will be derived from increased R&D expenditures, with the remainder coming from increased outsourcing penetration. We estimate that overall outsourcing penetration in 2014 was 39%. The market served by Integrated Healthcare Services is diverse, which makes it difficult to estimate the current amount of outsourced integrated healthcare services and the expected growth in such services. However, based on our knowledge of these markets we believe that, while the rate of outsourcing penetration varies by market within Integrated Healthcare Services, the current outsourcing penetration of the estimated $98 billion addressable market is approximately 23%. As business models continue to evolve in the healthcare sector, we believe that the growth rate for outsourcing across the Integrated Healthcare Services markets will be similar to the growth in clinical development.
We believe that we are well positioned for the future evolution of the healthcare sector as increasing demand from governments and other payers around the world for quality, accountability and value for money drive biopharmaceutical companies, providers and other healthcare organizations to transform their value chain away from a vertically integrated model to one that is more focused on their core competencies. In particular, we believe that the following trends will result in increased outsourcing to global biopharmaceutical services companies:
| • | Maximizing Productivity and Lowering Costs. Declining R&D productivity, increased development costs and diminished returns on marketing and sales have negatively impacted biopharmaceutical companies. We believe that the need for biopharmaceutical companies to maximize productivity and |
5
| lower costs in their product development and commercial operations will cause them to look to partners as they enter into outsourcing arrangements to improve efficiency, increase sales force utilization and effectiveness, improve clinical success rates and turn fixed costs into variable costs across their R&D and commercial operations. |
| • | Managing Complexity. Biopharmaceutical companies face environments in which it has become increasingly difficult to operate. Improved standards of care in many therapeutic areas and the emergence of new types of therapies, such as biologics, genetically targeted therapies, gene and stem cell therapies, and other treatment modalities have led to more complex development and regulatory pathways, such as recently released guidelines in the United States and Europe for the development of “biosimilar” products. We believe that our global clinical development capabilities, including our expertise in biomarkers and genomics and our global laboratory network, position us well to help biopharmaceutical companies manage the complexities inherent in an environment where this type of expertise is important. |
| • | Providing Enhanced Value for Patients. As healthcare costs rise globally, governments and third-party payers have looked for ways both to control healthcare expenditures and increase the quality, safety and effectiveness of drug therapies. Governments and regulatory bodies have adopted, and may continue to adopt, healthcare legislation and regulations that may significantly impact the healthcare industry by demanding more value for money spent and financial accountability for patient outcomes. Such legislation and regulations may tie reimbursement to the demonstrated clinical efficacy of a therapy, require payers and providers to demonstrate efficacy in the delivery of healthcare services and require more evidence-based decisions, all of which we believe will increase the demand for innovative and cost-effective commercialization strategies and outcome research and data analytics services. |
| • | Increased Importance of Product Development in Local Markets. Increasingly, regulators require trials involving local populations as part of the process for approving new pharmaceutical products, especially in certain Asian and emerging markets. Understanding the epidemiological and physiological differences in different ethnic populations and being able to conduct trials locally in certain geographies will be important to pharmaceutical product growth strategies, both for multinational and local/regional biopharmaceutical companies. We believe that our global clinical development capabilities and unmatched presence in Asia and other emerging markets make us a strong partner for biopharmaceutical companies managing the complexities of international drug development. |
| • | Increasing Number of Phase II-IV Clinical Trials. Based on the current and expected composition of the global drug development pipeline, we believe that spending on Phase II-IV clinical trials will continue to increase. As the complexity and cost of Phase II-IV trials grow, trial sponsors will continue to seek to recruit patients on a global basis. We believe that this increased spending and the demand for global patient recruitment will favor the limited number of biopharmaceutical services companies that have both the capabilities to administer large, complex global clinical trials and relationships with thought-leading investigators and trial sites. In addition, as these drugs come to market, we believe that biopharmaceutical companies will also seek to outsource an increasing amount of the commercial and other integrated healthcare services necessary to effectively launch and market these drugs. |
| • | Increase in Strategic Collaborations. Larger CROs are able to provide a greater variety of services and therapeutic expertise to the biopharmaceutical community. Biopharmaceutical companies continue to enter into long-term strategic collaborations with global service providers. We believe that biopharmaceutical companies have historically preferred, and will continue to prefer, financially sound, global service providers with broad therapeutic and functional expertise such as our company when selecting strategic providers. |
6
Our Strategy
We believe that we are positioned to be the partner of choice to biopharmaceutical companies worldwide and a key resource to other healthcare industry participants who are looking to improve operational, therapeutic and patient outcomes. We differentiate ourselves from others in our industry through our competitive strengths and strategies, which include:
Global Scale and Leadership. We offer global capabilities in the biopharmaceutical services industry, with a presence in all of the major biopharmaceutical markets, including the United States, Japan, and Europe in addition to Brazil, Russia, India and China, or the BRIC countries. Our extensive global footprint provides us substantial local expertise in multinational patient populations and regulatory schemes that allows us to effectively serve customers worldwide. We believe that our industry leading size, global scale and significant technology and process capabilities differentiate us by enabling us to effectively manage increasingly complex and global clinical trials with continuous clinical data monitoring and niche pools of patients from around the world. Based on the most recent publicly available information, our service revenues were nearly 1.6 times the size of our closest public CRO competitor. We have earned a reputation as an industry and thought leader, which is reflected in our financial and operational performance. We believe we have the largest share of the outsourced global clinical and commercialization markets. Our broad geographic diversification is represented by operations in approximately 100 countries. Based on our public competitors’ most recently available information of reported service revenues, we believe we are the market leader in the United States, Japan and Europe, the three largest biopharmaceutical markets in the world. In addition, as of December 31, 2014, we had approximately 32,600 employees with the majority located outside the United States, including significant numbers in Japan and Europe. For more information regarding the geographic scope of our business, see Note 19 to our audited consolidated financial statements included elsewhere in this Annual Report on Form 10-K. For more information regarding our employee base, see “Employees” below.
Broad, Deep and Diverse Relationships. We believe that the breadth and depth of our service offerings allow us to establish and develop relationships with key decision makers throughout our customers’ organizations. During each of the last 12 years, we have worked with the 20 largest biopharmaceutical companies, as measured by their respective 2013 reported revenues. In 2014, we had 14 customers from whom we earned at least $100 million in service revenues. We also work with over 550 small, mid-size and other biopharmaceutical companies outside the 20 largest by revenues. These customers accounted for approximately 36% of our net new business in 2014. We also have broad, deep and diverse relationships with clinics, large hospitals and health systems through which we have access to thousands of investigators and other providers worldwide. We intend to leverage our strong relationships to assist our customers as they seek to reduce and variabilize their cost structures while increasing their probability of product success.
Therapeutic and Scientific Expertise. We believe our deep scientific, therapeutic and domain expertise enables us to help customers solve the complex challenges inherent in drug development and commercialization. We also believe that the breadth of our expertise, from expert consulting to data-driven planning and design, enables us to help biopharmaceutical companies improve operational efficiency and outcomes. We have continued to invest in developing world-class scientific capabilities underpinned with a focus on delivering consistent, high-quality services to our customers throughout the world. We have a strong therapeutic focus on oncology, cardiovascular, central nervous system, diabetes and internal medicine as these five therapeutic areas represent more than 70% of the total biopharmaceutical product pipeline in 2014 and are generally highly complex and require significant scientific expertise and global scale. Our employees have substantial scientific, quantitative, analytical and applied technology skills and substantial expertise in numerous therapeutic areas, with over 2,750 Ph.D.s, medical doctors, statisticians and statistical programmers on our staff worldwide.
Integrated Services to Enable Better Decision-making in the Broader Healthcare Market. We believe that sustainable and growing revenue can be achieved through differentiation of services, coupled with deeper and broader relationships and a commitment to structuring flexible and innovative solutions to meet the diversified and changing needs of the healthcare industry. We use our extensive scope of services to design innovative and
7
flexible solutions tailored for our customers’ needs in an increasingly complex environment. Our core market is product development, and we have deep and global expertise across the phases of this market from first-in-man trials through post-marketing studies. Our services are designed to provide integrated solutions that address the complex challenges faced by a broad range of healthcare industry participants. We believe that our significant capabilities in analytics, clinical science and real-world data, combined with our broad commercial, consulting and post-launch expertise, will enable us to meet the research and analytical needs of healthcare industry participants from the development and commercialization organizations within traditional and emerging biopharmaceutical companies to the broader healthcare market, including the needs of payers and providers to measure the value of various treatments and patient outcomes.
Experienced, Highly Trained Management and Staff. Our senior management team includes executives with experience from inside and outside the biopharmaceutical and biopharmaceutical services industries who use their decades of experience to serve our customers and grow our company. Each of our executive officers has more than 25 years of experience in large, multinational organizations. Our management and staff are comprised of approximately 32,600 employees worldwide, of whom nearly 950 are medical doctors and more than 1,000 possess a Ph.D. or equivalent. Our employees contribute to a company-wide culture focused on delivering services and information that meet or exceed the quality standards demanded by customers, doctors, patients and regulatory authorities. At this time, we have over 7,100 contract medical sales representatives, a sales force that is comparable in size to the sales forces of many large biopharmaceutical companies. We strive to maintain a culture that reinforces collaboration, motivation and innovation which is consistent with our core values and Code of Conduct: Doing the Right Thing.
Technology Solutions and Process/Data Capabilities. For over 32 years, we have been devoted to advancing state of the art technology, processes and analytics to optimize our service offerings and provide our customers with the information they need to quickly make critical decisions regarding the development and commercialization of their products. We have focused on investment in quality data, including de-identified electronic health records, or EHR. Because data are only as good as the analytics used to analyze them, we have also invested heavily in data analytics products, services and professionals. As part of this investment, we created our proprietary data integration tool, the Quintiles Infosario® platform, which is a suite of modules that integrates data from across multiple source systems to provide us and our customers with current, quality and comprehensive information regarding clinical trials, allowing decisions to be made quickly and efficiently. In addition, we have developed a planning and design platform and other software solutions to enable improvements to the drug development process and to demonstrate the value of biopharmaceutical products in the real world.
Our History
We were founded in 1982 by Dennis B. Gillings, CBE, Ph.D., who was a biostatistics professor at the University of North Carolina at Chapel Hill. Dr. Gillings and his cofounder pioneered the use of sophisticated statistical algorithms to improve the quality of data used to determine the efficacy of various drug therapies. We expanded internationally into Europe in 1987 and into Asia in 1993. In 1994, we completed an initial public offering, or IPO, and in 2003 we exited the public markets through a going private transaction. In May 2013, we returned to the public markets by completing an IPO on the New York Stock Exchange, or NYSE.
Services
We address the needs of the healthcare industry by providing product development and integrated healthcare services to help our customers navigate the complex healthcare environment and improve outcomes. The broad scope of our services allows us to help our customers rapidly assess the viability of a growing number of potential new therapies, cost-effectively accelerate development of the most promising ones, launch new products to the market quickly, and evaluate their impact and appropriate use on patients.
8
We offer our services through two reportable segments: Product Development and Integrated Healthcare Services. The figure below displays the range of our services across both of our segments.
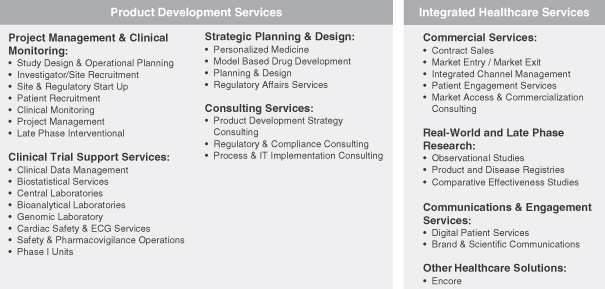
Product Development
Product Development provides services and expertise that enable biopharmaceutical companies to outsource the clinical development process from first-in-man trials to post-launch monitoring. Product Development is comprised of Clinical Solutions & Services and Consulting. Clinical Solutions & Services provides services necessary to develop biopharmaceutical products, including project management and clinical monitoring functions for conducting multi-site trials (generally Phase II-IV) and clinical trial support services that improve clinical trial decision making and data management and strategic planning and design services that improve decisions and performance. Consulting provides strategy and management consulting services based on deep life science expertise and advanced analytics as well as regulatory and compliance consulting services.
Clinical Solutions & Services
Project Management and Clinical Monitoring
Drawing upon our years of experience, our site databases, our site relationships and our highly trained staff, Clinical Solutions & Services enables the efficient conduct and coordination of multi-site trials (generally Phase II-IV). Clinical Solutions & Services’ service offerings include protocol design, feasibility and operational planning, site start up, patient recruitment, project management and monitoring of the investigator sites and data from patient visits.
Study Design and Operational Planning. We assist our customers in preparing the study protocol, designing clinical report forms and identifying appropriate patients, sites and the optimal country mix to meet their objectives, among other key upfront decisions. The study protocol defines the medical hypotheses to be examined, the number of patients required to produce statistically valid results, the period of time over which they must be tracked, the frequency and dosage of drug administration and the study procedures.
Investigator/Site Recruitment. During clinical trials, the drug is administered to patients by physicians, referred to as investigators, at hospitals, clinics or other sites. The quality of a clinical trial is dependent on the
9
quality of the investigators who perform the trials. Through our global prime site and partner programs, we have established relationships with thousands of investigators who conduct our clinical trials worldwide. We provide our investigators the resources and tools they need to effectively conduct the trials.
Site and Regulatory Start Up. The process of identifying, training and contracting with sites while also securing regulatory and ethics approval is a complex and time-consuming aspect of clinical trials. We have a dedicated unit that draws upon our experience from participating in trials globally across multiple therapeutic areas for over 30 years. We utilize technology and analytics to simplify and streamline this process, reducing time to first patient in and laying the groundwork for successful trial execution.
Patient Recruitment. We assist our customers in recruiting patients for clinical trials through investigator relationships, media advertising, use of web-based techniques and other methods. We also help to ensure patients are retained for the duration of the trials. We use informatics tools and media-based recruitment methods to identify, reach and recruit the appropriate patients. Our patient recruitment system includes informatics tools and media-based recruitment methods to provide broad pools of prescreened patients as well as an efficient enrollment process and a call center. Through our global patient recruitment programs, we have enrolled on average over 100,000 patients in Phase I-III trials annually during the last six years.
Clinical Monitoring. We deploy and manage clinical research associates, or CRAs, to work with and monitor sites to assure the quality of the data, which we gather according to Good Clinical Practice, or GCP, and International Conference on Harmonisation, or ICH, regulations and guidelines, and to meet the customers’ and regulatory authorities’ requirements according to the study protocol. CRAs also assist with site initiation, training, patient enrollment and retention. Regulatory authorities are encouraging the use of innovative approaches in trial monitoring, and we have deployed targeted, data-driven, risk-based, monitoring techniques to improve monitoring efficiency and effectiveness, focusing on the areas most likely to impact the quality of the data and safety of the patients in their particular trial.
Project Management. Our project managers help customers navigate the complexity of the clinical trial process and coordinate all of the various activities, data streams and timelines associated therewith. Aligned by therapeutic experience, our project managers highlight risks before they become issues, while managing budgets and timelines. As trials become more complex, project managers are becoming increasingly important in ensuring trials are completed successfully.
Clinical Trial Support Services
Each clinical trial requires a number of concurrent services and data streams. We offer a broad range of functional services and consultation to support clinical trials through specialized expertise that help customers efficiently collect, analyze and report the quality data and evidence they need to gain regulatory approval. Our clinical trial support services include:
Clinical Data Management. Our data management services provide support for the collection, organization, validation and analysis of clinical data. Data used can be captured via electronic data capture, or EDC, or from paper. These databases include customized databases to meet customer-specific formats, integrated databases to support regulatory submissions to numerous regulatory authorities around the world, including, for example, to the FDA to support new drug applications, or NDAs, BLAs, and premarket approval applications, or PMAs, for medical devices.
Biostatistical Services. We provide statistical analyses of scientific databases for all phases of the drug development process. Biostatistics is at the core of every clinical trial, and we have been pioneering the use of biostatistics since our founding in 1982. We have nearly 800 biostatisticians and statistical programmers around the world, of whom more than 60% have advanced degrees. We use biostatistics to assist our customers in speeding drug development, staying current with evolving best practices, navigating regulatory requirements and developing and qualifying biomarkers.
10
Central Laboratories. We support the laboratory testing and reporting needs inherent in all phases of clinical trials, offering globally harmonized safety and efficacy biomarker testing through the world’s largest, wholly owned network of central laboratories with individual College of American Pathologists accreditations. Services include assay development and validation, the provision of protocol-specific trial materials, customized lab report design, and specimen management and archival. We support trials anywhere in the world through wholly owned facilities in the United States, the United Kingdom, South Africa, India, China, Singapore and Japan, and a tightly coordinated network of affiliated laboratories in Argentina and Brazil. Our global processes and harmonization scheme are designed to help ensure the standardization of laboratory test results and integrated, comparable data collection, management and transfer, including providing direct electronic integration of laboratory data into safety and efficacy reports for NDA submissions.
Genomic Laboratory. We provide a broad range of solutions in support of our customers’ clinical trial and research efforts, including experiment design, sample analysis, nucleic acid isolation, gene expression profiling, genotyping, next generation sequencing and advanced bioinformatics. Our services include whole genome to focused set gene expression profiling and genotyping assays along with DNA and RNA sequencings services, sequence enrichment technologies and bioinformatics support. Our quality system is designed to adhere to Clinical and Laboratory Standards Institute guidelines, and our Clinical Laboratory Improvements Amendments, or CLIA, certified laboratory supports good laboratory practice, or GLP, compliance.
Bioanalytical Laboratories. We offer our customers a broad range of GLP and non-GLP bioanalytical testing to support pharmacokinetic/pharmacodynamic, or PK/PD, studies, and absorption, distribution, metabolism and elimination studies in the early phases of clinical testing. Utilizing our global Phase I network, we can provide our customers with a rapid turnaround of bioanalytical/PK data to support the efficient completion of Phase I trials. By combining our global central laboratories and our Phase I networks, we believe that we can help biopharmaceutical companies make better decisions faster.
Cardiac Safety and ECG Laboratory Services. Our centralized electrocardiogram, or ECG, laboratory in India provides continuous global collection and analysis of ECGs by trained cardiologists as part of clinical trials. Our laboratory logs, tracks and analyzes ECGs from around the world, and stores and transmits reports in near real time. We believe that integrating our ECG laboratory capabilities into clinical trials helps customers identify and adjust to cardiac safety signals earlier in the drug development process.
Safety and Pharmacovigilance Operations. Conducting clinical trials requires a dedicated, separate process to collect, analyze and report safety events. We have extensive experience, scale and geographic coverage for case management services. Our safety management system combines our expertise, standard operating procedures and best practices derived from thousands of projects. Underpinned by our technology, we help customers efficiently manage fluctuating case loads, streamline global operations and compliance, and gain better insights into clinical trial operations. We customize our lifecycle safety suite of services to monitor drug safety, including managing case reports, performing safety risk profiling and improving operation efficiency, quality and regulatory compliance.
Phase I Clinical Pharmacology Services. Phase I trials often involve testing a new drug on a limited number of healthy volunteers and patients. For such Phase I trials, we own and operate three clinical pharmacology units (Phase I clinics) where we perform the core clinical functions related to these trials, with support from the specialized expertise and functions from other members of Clinical Solutions & Services. Our Phase I trial capabilities include dose ranging, bioavailability/bioequivalence studies, PK/PD modeling, first administration to humans, multiple dose tolerance, dose effect relationship and metabolism studies. Our global Phase I network includes 190 beds with operations in Overland Park, Kansas (United States) and London, United Kingdom.
Strategic Planning and Design
Through our strategic planning and design services, we offer consultation services to improve decisions and performance including portfolio, program and protocol planning and design, biomarker consultation, benefit-risk management, regulatory affairs, biostatistics, modeling and simulation, and personalized medicine.
11
Biomarkers, Genomics and Personalized Medicine. Personalized medicine is an emerging practice of medicine that uses information about a person’s genes, proteins and environment to prevent, diagnose and treat disease. We support biopharmaceutical companies with deep expertise in the complex and groundbreaking efforts in the area of biomarker and genomics research, testing and analysis with a comprehensive suite of services, including biomarker discovery and development, assay development and validation, genomics, digital pathology and consultation on the use of biomarkers to improve patient selection for clinical trials.
Model-Based Drug Development. We have extensive capabilities in the development and use of modeling and simulation techniques to improve decision-making through scenario analysis at key points in the drug development process. Services include population PK/PD modeling and simulation to identify the concentration-response relationship and best doses to pursue in later testing, and clinical trial simulation to test various trial design options simulated on computers before performing the actual trial.
Planning and Design. Our Center for Integrated Drug Development has developed an innovative approach to strategic clinical research planning with a design platform that includes a modeling and simulation process for scenario planning and risk assessment to support portfolio, program development and protocol planning.
Regulatory Affairs Services. We provide comprehensive medical and regulatory affairs services for our biopharmaceutical customers. Our medical services include medical oversight of trials, review and interpretation of adverse experiences, medical writing of reports and trial protocols and strategic planning of drug development programs. Regulatory services for product registration include regulatory strategy design, document preparation, publishing, consultation and liaison with various regulatory authorities.
Consulting Services
We offer our customers consulting services based on our experience with the product life cycle. By operating at the intersection of three core capabilities—strategy, data and analytics—and by providing access to the deep domain expertise offered by our various service lines, we can develop pragmatic solutions that help biopharmaceutical companies anticipate and address their myriad challenges and opportunities.
Product Development Strategy Consulting. Our expert consultants support biopharmaceutical customers to improve the effectiveness and efficiency of their product development operations. We provide objective, industry vetted recommendations to help customers bring safer, differentiated products to market faster and more cost effectively. We begin in the conceptualization phase of development with strategic market research to bring a commercially minded approach to clinical design. Through a combination of secondary data and clinical analytics, we support customers in making informed development decisions.
Regulatory and Compliance Consulting. We supply regulatory and compliance consulting services to the biopharmaceutical industry related to Good Manufacturing Practice, or GMP, GCP and GLP, global regulatory affairs, and quality systems engineering and validation. We assist customers in preparing for interactions with the FDA and foreign regulatory authorities or agencies, including inspections and resolution of enforcement actions, and complying with current GMP, and quality systems regulations, meeting process and software validation requirements and bringing new medical devices to market.
Process and IT Implementation Consulting. Realizing that strategy is only as good as how effectively it is implemented, we both design highly executable strategies and help implement them. Our consultants help customers optimize clinical and business processes to accelerate timelines and eliminate waste. Change management experts help implement new processes and organizational initiatives. Finally, we develop technology and information technology, or IT, strategies and help ensure their successful implementation.
12
Integrated Healthcare Services
Integrated Healthcare Services provides the healthcare industry with both broad geographic presence and commercial capabilities. Our customized commercialization services are designed to accelerate the commercial success of biopharmaceutical and other health-related products by promoting, delivering and proving value. When integrated with our product development services, our commercialization services enable solutions across the full lifecycle of a product.
Commercial Services
Contract Sales. Skilled primary care, specialty and multi-channel integrated sales teams provide our customers with a flexible resource that is able to respond quickly and effectively to the changing marketplace. We provide our customers with a variety of staffing options, including direct hire, flexible work arrangements, leave of absence and “strike force” arrangements (in which a team is deployed to a particular territory to capitalize on a market niche opportunity) in both full-time and flex-time solutions. We can supplement our sales forces with remote e-detailing capabilities. Our training and development services integrate traditional, distance-learning and web-based services. Our contract sales unit helps customers design or revamp their existing sales training programs to meet marketplace demands.
Market Entry/Market Exit. Market entry services help biopharmaceutical companies quickly and successfully launch products before or in lieu of establishing a long-term commercial infrastructure. Market exit services help biopharmaceutical companies manage the regulatory, quality and governance issues that arise when exiting unprofitable or less profitable markets. Market entry and market exit services are integrated solutions that can include assistance with regulatory compliance, market access, brand strategy, import and distribution logistics, and sales and marketing programs.
Integrated Multichannel Management. Integrated multichannel solutions leverage market-based analytics to help biopharmaceutical companies optimize channel mix (including sales force mix) so that the sales and marketing strategy for individual drugs can be effectively executed across multiple channels, including the use of sales representatives, e-detailing, video, mail, call center, webinars and online portals. Our integrated multichannel management services allow our customers to access key healthcare stakeholders and tailor the channels used to optimize results.
Patient Engagement Services. Our health management services professionals offer customized clinical and educational solutions to bridge the gap between the clinical and commercial phases of product development and provide expertise across a broad range of pre-launch, launch and post-launch opportunities. We provide customers with solutions in a broad-based spectrum, from patient adherence programs to clinical trial educators that assist in recruitment, education and retention of patients in clinical trials. We assist biopharmaceutical companies in evaluating the therapy from the perspective of the patient, not just the prescriber, supporting patient compliance and product dosing compliance therapy adherence and patient retention, which we believe can increase commercial success. Our professionals assist in the process of developing patient-centric strategies and implementing them for or side by side with customers.
Market Access and Commercialization Consulting. Market access services support biopharmaceutical customers in the development and execution of a strategy for bringing products into the market based on value. Once a product proceeds from large scale clinical trials to commercialization, our consultants help customers create product positioning, pricing and formulary access and reimbursement strategies based on extensive primary research with providers, patients, payers and other decision-makers.
Real-World and Late Phase Research
Since 2011, our Real World and Late Phase Research group has designed and implemented nearly 400 patient registries and post-approval programs with expertise across approximately 100 countries and numerous therapeutic areas. We provide real-world and late phase research to monitor safety and evaluate benefit-risk,
13
demonstrate effectiveness, gain market access and expand labeling and approved indications. Services offered include observational studies, product and disease registries, safety and surveillance, risk management and risk evaluation and mitigation strategies, comparative and cost effectiveness, expanded labeling, health economics and outcomes, patient-reported outcomes, quality of life, medical record review, and electronic medical record and EHR studies.
Communication and Health Engagement Services
Digital Patient Services. Our digital patient services are designed to find and mobilize patients into clinical research, observational studies and disease management programs, retain patients through engagement strategies, and generate evidence such as patient reported outcomes, laboratory data and device diagnostics directly from patients.
Brand and Scientific Communications. Our communications group offers a range of pre-launch, launch and post-launch services, beginning in the early stages of product development and continuing until the product reaches peak penetration. Services include communications strategies and planning, product positioning and branding, opinion leader development, faculty training, symposia, promotional programs, sponsored publications, new media-based programs, patient education and clinical experience programs (either standalone or supporting their health management services). As early as Phase I and Phase II clinical trials, we can begin to develop and disseminate scientific information, and develop and present educational forums to help gain opinion leader support for a new drug.
Other Healthcare Solutions
We utilize our global integrated health service platform, together with our scientific and clinical expertise, to offer a range of specialized services to organizations and users across the care continuum, including governments, hospitals, physician offices and pharmacies. These services include comparative and cost-effectiveness research capabilities, clinical management analytics, decision support services, medication adherence and health outcome optimization services, and web-based systems for measuring quality improvement. Our July 2014 acquisition of Encore Health Resources, or Encore, enhanced our EHR expertise, which is becoming increasingly important as biopharmaceutical customers, payers, and providers focus on measuring outcomes based on real-world performance in terms of clinical effectiveness and value.
Customers and Marketing
To provide and coordinate service offerings to our customers, we have business development efforts across our service offerings and within many individual service offerings, and we also maintain an integrated business development group. To foster accountability in key service offering areas, each offering area has a designated leader who drives the financial contribution of that offering area. These two axes of business development direct the selling and business development personnel in each of our major locations in the United States and throughout Europe, Asia, Japan, Canada and Latin America, providing coverage of both multi-national and regional/domestic biopharmaceutical companies.
We take a holistic customer-oriented view toward business development. Our integrated business development group is responsible for assessing our customers’ current and future needs and helping to define the right service offerings to be delivered at the right time. This group includes dedicated customer teams that deliver customized solutions from the full breadth and depth of our service offerings for the world’s leading biopharmaceutical companies. In addition, we continue to evolve our relationships with our small, mid-size and other biopharmaceutical customers outside the 20 largest biopharmaceutical companies based on 2013 reported revenues.
In 2014, we earned service revenues of over $100 million each in seven countries in North America, Europe and Asia. Please refer to Note 19 to our audited consolidated financial statements included elsewhere in this Annual Report on Form 10-K for further details regarding our foreign and domestic operations in 2014, 2013 and
14
2012. For a discussion of risks attendant to our foreign operations, see “Risk Factors—Our business is subject to international economic, political and other risks that could negatively affect our results of operations and financial condition.”
Our service revenues were attributed to our segments as follows:
| Year Ended December 31, |
||||||||||||
| 2014 | 2013 | 2012 | ||||||||||
| Product Development |
74.4 | % | 76.7 | % | 73.9 | % | ||||||
| Integrated Healthcare Services |
25.6 | 23.3 | 26.1 | |||||||||
|
|
|
|
|
|
|
|||||||
| Total |
100.0 | % | 100.0 | % | 100.0 | % | ||||||
|
|
|
|
|
|
|
|||||||
Additional information regarding our segments is presented in Note 20 to our audited consolidated financial statements included elsewhere in this Annual Report on Form 10-K.
No single customer accounted for 10% or more of our consolidated service revenues in 2014, 2013 or 2012. In the past, we have derived, and may in the future derive, a significant portion of our service revenues from a relatively limited number of major projects or customers. As biopharmaceutical companies continue to outsource large projects and/or functions to fewer providers, this concentration of business could increase.
Competition
The market for our product development services is highly competitive, and we compete against traditional CROs, the in-house R&D departments of biopharmaceutical companies, universities and teaching hospitals. Among the traditional CROs, there are several-hundred small, limited-service providers, several medium-sized firms and only a few full-service companies with global capabilities. Consolidation among CROs likely will result in greater competition among the larger CROs for customers, clinical personnel and acquisition candidates. Product Development’s primary competitors include Pharmaceutical Product Development, Inc., PAREXEL International Corporation, ICON plc, inVentiv Health, Inc., or inVentiv, INC Research, PRA International, and Covance, Inc., which has entered into a merger agreement with Laboratory Corporation of America Holdings, or LabCorp, that is expected to close in February 2015, among others. Competitive factors for product development services include:
| • | previous experience and relationships; |
| • | medical and scientific experience in specific therapeutic areas; |
| • | the quality of contract research; |
| • | speed to completion; |
| • | the ability to organize and manage large scale trials on a global basis; |
| • | the ability to manage large and complex medical databases; |
| • | the ability to provide statistical, regulatory and consulting services; |
| • | the ability to recruit investigators and patients expeditiously; |
| • | the ability to deploy and integrate IT systems to improve the efficiency of contract research; |
| • | risk and reward sharing; |
| • | the ability to form strategic alliances; |
| • | a global presence with strategically located facilities and breadth of service offerings; |
| • | financial strength and stability; and |
| • | price. |
15
Integrated Healthcare Services competes in the post-approval and commercialization arenas. In the post-approval arena our solutions compete against real-world and late phase research providers including boutique firms, divisions of biopharmaceutical companies and divisions of traditional CRO’s (noted above). Our commercial solutions compete against the in-house sales and marketing departments of biopharmaceutical companies, other contract pharmaceutical sales and service organizations and consulting firms. Integrated Healthcare Services’ primary commercial competitors in the United States include inVentiv, PDI, Inc. and Publicis Selling Solutions. Outside of the United States, Integrated Healthcare Services commercial teams typically compete against single country or more regionally focused commercial service providers, such as United Drug plc, inVentiv, EPS Corporation and CMIC HOLDINGS Co., Ltd in Japan. The primary competitive factors affecting Integrated Healthcare Services are breadth of service offering and ability to deploy in an integrated manner, quality and track record, i.e. the proven ability to quickly assemble, train and manage large qualified commercial teams on a global footprint and price.
Notwithstanding these competitive factors, we believe that the synergies arising from integrating product development services with commercial services, supported by global operations, data analysis and the ability to form long term strategic alliances with biopharmaceutical companies, differentiate us from our competitors.
Government Regulation
Good Clinical Practice
GCP regulations and guidelines contain the industry standards for the conduct of clinical trials with respect to the integrity of the data and safety of the research subjects. The FDA, the European Medicines Agency, or EMA, Japan’s Ministry of Health, Labour and Welfare and many other regulatory authorities require that study results and data submitted to such authorities be based on trials conducted in accordance with GCP provisions. Records for clinical trials must be maintained for specified periods for inspection by the FDA and other regulators. Significant non-compliance with GCP requirements can result in the disqualification by regulators of data collected during the clinical trial.
Our standard operating procedures related to clinical trials are written in accordance with regulations and guidelines appropriate to the region where they are used, thus helping to ensure compliance with GCP. FDA regulations and guidelines serve as a basis for our North American standard operating procedures. Within Europe, we perform our work subject to the EMA’s Note for Guidance “Good Clinical Practice for Trials on Medicinal Products in the European Community.” All clinical trials (other than those defined as non-interventional) to be submitted to the EMA must meet the requirements of the ICH’s GCP standards. Our offices in Asia and in Latin America have developed standard operating procedures in accordance with their local requirements and in harmony with our North American and European operations.
Regulation of Drugs, Biologics and Medical Devices
In the United States, pharmaceutical, biological and medical device products are subject to extensive regulation by the FDA. The Federal Food, Drug, and Cosmetic Act, or the FDC Act, the Public Health Service Act, or the PHS Act, and other federal and state statutes and regulations, govern, among other things, the research, development, testing, manufacture, storage, recordkeeping, approval, labeling, promotion and marketing, distribution, post-approval monitoring and reporting, sampling, and import and export of pharmaceutical, biological and medical device products. Failure to comply with applicable United States requirements may subject a company to a variety of administrative or judicial sanctions, such as FDA refusal to approve a pending NDA for a new drug, a BLA for a new biological product, or PMA or clearance for a new medical device, warning or untitled letters, product recalls, product seizures, total or partial suspension of production or distribution, injunctions, fines, civil penalties, and criminal prosecution.
16
Before a new drug or biologic may be marketed, it must undergo extensive testing and regulatory review to determine that it is safe and effective and be approved by the FDA or other regulatory authority. Even after approval, a new PMA or PMA supplement may be required in the event of a modification to the device, its labeling or its manufacturing process.
Regulation of Patient Information
Our information management services relate to the diagnosis and treatment of disease and are, therefore, subject to substantial governmental regulation. In addition, the confidentiality of patient-specific information and the circumstances under which such patient-specific records may be released for inclusion in our databases or used in other aspects of our business is heavily regulated. Federal, state and foreign governments are contemplating or have proposed or adopted additional legislation governing the possession, use and dissemination of personal data, such as personal health information and personal financial data, as well as security breach notification rules for loss or theft of such data. Additional legislation or regulation of this type might, among other things, require us to implement new security measures and processes or bring within the legislation or regulation de-identified health or other personal data, each of which may require substantial expenditures or limit our ability to offer some of our services.
In particular, personal health-related information is recognized in many countries such as the United States, the European Union, and several countries in Asia, as a special, sensitive category of personal information, subject to additional mandatory protections. Violations of data protection regulations are subject to administrative penalties, civil money penalties and criminal prosecution, including corporate fines and personal liability.
In order to comply with these evolving laws and regulations, we may need to implement new data protection, privacy and data security measures, which may require us to make substantial expenditures or cause us to discontinue or limit the products and services we offer. In addition, if we violate applicable laws, regulations, contractual commitments or other duties relating to the use, privacy or security of health information, we could be subject to regulatory sanctions, civil liability or criminal prosecution or suffer reputational harm, and it may be necessary to modify our business practices.
Regulation of Promotion, Marketing and Distribution of Pharmaceutical Products and Medical Devices
Our integrated healthcare services are subject to detailed and comprehensive regulation in each geographic market in which we operate. Such regulation relates, among other things, to the distribution of drug samples, the marketing and promotion of approved products, the qualifications of sales representatives and the use of healthcare professionals in sales functions.
In the United States, our integrated healthcare services are subject to numerous federal and state laws pertaining to promotional activities involving pharmaceutical products and medical devices, such as the FDA’s regulations against “off-label promotion,” which require sales representatives to restrict promotion of the approved product they are detailing to the approved labeling for the product, and the Prescription Drug Marketing Act which imposes licensing, personnel record keeping, packaging, labeling, product handling and facility storage and security requirements. Other federal and state laws prohibit manufacturers, suppliers and providers from offering, giving or receiving kickbacks or other remuneration in connection with ordering or recommending the purchase or rental of healthcare items and services. The sale or distribution of pharmaceutical products and devices is also governed by the United States Federal Trade Commission Act and state consumer protection laws. We are subject to similar regulations currently in effect in the other countries where we offer integrated healthcare services.
We are also subject to various laws and regulations that may apply to certain drug and device promotional practices, including, among others, various aspects of the Medicare program. Violations of these laws and regulations may result in criminal and/or civil penalties, including possibly as an “aider and abettor.”
17
Regulation of Laboratories
Our United States laboratories are subject to licensing and regulation under federal, state and local laws relating to hazard communication and employee right-to-know regulations, and the safety and health of laboratory employees. Additionally, our United States laboratories are subject to applicable federal and state laws and regulations and licensing requirements relating to the handling, storage and disposal of hazardous waste, radioactive materials and laboratory specimens, including the regulations of the Environmental Protection Agency, the Nuclear Regulatory Commission, the Department of Transportation, the National Fire Protection Agency and the United States Drug Enforcement Administration, or DEA. The use of controlled substances in testing for drugs with a potential for abuse is regulated in the United States by the DEA and by similar regulatory bodies in other parts of the world. Our United States laboratories using controlled substances for testing purposes are licensed by the DEA. The regulations of the United States Department of Transportation, Public Health Service and Postal Service apply to the surface and air transportation of laboratory specimens. Our laboratories also are subject to International Air Transport Association regulations, which govern international shipments of laboratory specimens. Furthermore, when the materials are sent to a foreign country, the transportation of such materials becomes subject to the laws, rules and regulations of such foreign country. Our laboratories outside the United States are subject to applicable national laws governing matters such as licensing, the handling and disposal of medical specimens, hazardous waste and radioactive materials, as well as the health and safety of laboratory employees.
In addition to its comprehensive regulation of safety in the workplace, the United States Occupational Safety and Health Administration has established extensive requirements relating to workplace safety for healthcare employers whose workers may be exposed to blood-borne pathogens such as HIV and the hepatitis B virus. Although we believe that we are currently in compliance in all material respects with such federal, state and local laws, failure to comply with such laws could subject us to denial of the right to conduct business, fines, criminal penalties and other enforcement actions.
Further, laboratories that analyze human blood or other biological samples for the diagnosis and treatment of clinical trial subjects must comply with CLIA, as well as requirements established by various states. The failure to meet these requirements may result in civil penalties and suspension or revocation of the CLIA certification.
Intellectual Property
We develop and use a number of proprietary methodologies, analytics, systems, technologies and other intellectual property in the conduct of our business. We rely upon a combination of confidentiality policies, nondisclosure agreements, invention assignments and other contractual arrangements to protect our trade secrets, and patent, copyright and trademark laws to protect other intellectual property rights. We have also registered or applied for trademarks and service marks in the United States and a number of foreign countries, and our trademark “Quintiles®” is of material importance to us. Although the duration of trademark and service mark registrations varies from country to country, trademarks and service marks generally may be renewed indefinitely so long as they are in use and/or their registrations are properly maintained, and so long as they have not been found to have become generic. Although we believe the ownership of our patents, trademarks and service marks is an important factor in our business and that our success does depend in part on the ownership thereof, we rely primarily on the innovative skills, technical competence and marketing abilities of our employees. Other than our Quintiles® trademark, we do not have any material patents, trademarks, service marks, licenses, franchises or concessions.
Net New Business Reporting and Backlog
Net new business is the expected service revenues awarded during the period from projects under signed contracts, letters of intent and, in some cases, written pre-contract commitments, and adjustments on contracts modified or canceled during the period. Net new business under sole provider arrangements is recorded over the life of the arrangement as projects are awarded.
18
Consistent with our methodology for calculating net new business during a particular period, backlog represents, at a particular point in time, future service revenues from work not yet completed or performed under signed contracts, letters of intent and, in some cases, pre-contract commitments that are supported by written communications. Once work begins on a project, service revenues are recognized over the duration of the project. Included within backlog at December 31, 2014 is approximately $7,593 million of backlog that we do not expect to generate revenue in the next 12 months.
Backlog was as follows:
| December 31, | ||||||||
| 2014 | 2013 | |||||||
| (in millions) | ||||||||
| Backlog |
$ | 11,244 | $ | 9,855 | ||||
Net new business was as follows:
| Year Ended December 31, | ||||||||||||
| 2014 | 2013 | 2012 | ||||||||||
| (in millions) | ||||||||||||
| Product Development |
$ | 4,374 | $ | 3,772 | $ | 3,474 | ||||||
| Integrated Healthcare Services |
1,228 | 1,127 | 1,027 | |||||||||
|
|
|
|
|
|
|
|||||||
| Total |
$ | 5,602 | $ | 4,899 | $ | 4,501 | ||||||
|
|
|
|
|
|
|
|||||||
We believe that backlog and net new business may not be consistent indicators of future revenues because they have been and likely will be affected by a number of factors, including the variable size and duration of projects, many of which are performed over several years, cancellations, and changes to the scope of work during the course of projects. Projects that have been delayed remain in backlog, but the timing of the revenue generated may differ from the timing originally expected. Additionally, projects may be terminated or delayed by the customer or delayed by regulatory authorities. If a customer cancels an order, we may be reimbursed for the costs we have incurred. However, we typically do not have a contractual right to the full amount of the revenue reflected in our backlog or net new business contracts in the event of cancellation. For more details regarding risks related to our backlog, see “Risk Factors—The relationship of backlog to revenues varies over time.”
Employees
As of December 31, 2014, we had approximately 32,600 full-time equivalent employees in approximately 60 countries, comprised approximately of 12,300 in the Americas region, 10,100 in the Europe and Africa region and 10,200 in the Asia-Pacific region, with at least 500 employees in 10 countries around the world. As of December 31, 2014, Product Development and Integrated Healthcare Services had approximately 21,400 and 9,500 full-time equivalent employees, respectively. In addition, our centralized operations/corporate office had approximately 1,700 full-time equivalent employees.
The success of our business depends upon our ability to attract and retain qualified professional, scientific and technical staff. The level of competition among employers in the United States and overseas for skilled personnel, particularly those with Ph.D., M.D. or equivalent degrees or training, is high. We believe that our brand recognition and our multinational presence, are an advantage in attracting qualified candidates. In addition, we believe that the wide range of clinical trials in which we participate allows us to offer broad experience to clinical researchers. None of our employees are covered by a collective bargaining agreement or are represented by a labor union. Employees in some of our non-United States locations are represented by works councils as required by local laws. We believe that our relations with our employees are good.
19
Available Information
Our website address is www.quintiles.com, and our investor relations website is located at http://investor.quintiles.com. Information on our website is not incorporated by reference herein. Copies of our annual reports on Form 10-K, quarterly reports on Form 10-Q, current reports on Form 8-K and our Proxy Statements for our annual meetings of shareholders, and any amendments to those reports, as well as Section 16 reports filed by our insiders, are available free of charge on our website as soon as reasonably practicable after we file the reports with, or furnish the reports to, the Securities and Exchange Commission, or the SEC. Our SEC filings are also available for reading and copying at the SEC’s Public Reference Room at 100 F Street, NE, Washington, D.C. 20549. Information on the operation of the Public Reference Room may be obtained by calling the SEC at 1-800-SEC-0330. In addition, the SEC maintains an Internet site (http://www.sec.gov) containing reports, proxy and information statements, and other information regarding issuers that file electronically with the SEC.
20
RISK FACTORS
We operate in a rapidly changing environment that involves a number of risks, some of which are beyond our control. You should consider carefully the risks and uncertainties described below together with the other information included in this Annual Report on Form 10-K, including our consolidated financial statements and related notes included elsewhere in this Annual Report on Form 10-K, in evaluating our company. The occurrence of any of the following risks may materially and adversely affect our business, financial condition, results of operations and future prospects.
Risks Relating to Our Business
The potential loss or delay of our large contracts or of multiple contracts could adversely affect our results.
Most of our customers can terminate our contracts upon 30 to 90 days notice. Our customers may delay, terminate or reduce the scope of our contracts for a variety of reasons beyond our control, including but not limited to:
| • | decisions to forego or terminate a particular trial; |
| • | lack of available financing, budgetary limits or changing priorities; |
| • | actions by regulatory authorities; |
| • | production problems resulting in shortages of the drug being tested; |
| • | failure of products being tested to satisfy safety requirements or efficacy criteria; |
| • | unexpected or undesired clinical results for products; |
| • | insufficient patient enrollment in a trial; |
| • | insufficient investigator recruitment; |
| • | shift of business to a competitor or internal resources; |
| • | product withdrawal following market launch; or |
| • | shut down of manufacturing facilities. |
As a result, contract terminations, delays and alterations are a regular part of our business. In the event of termination, our contracts often provide for fees for winding down the project, but these fees may not be sufficient for us to maintain our margins, and termination may result in lower resource utilization rates. In addition, we may not realize the full benefits of our backlog of contractually committed services if our customers cancel, delay or reduce their commitments under our contracts with them, which may occur if, among other things, a customer decides to shift its business to a competitor or revoke our status as a preferred provider. Thus, the loss or delay of a large contract or the loss or delay of multiple contracts could adversely affect our service revenues and profitability. We believe the risk of loss or delay of multiple contracts potentially has greater effect where we are party to broader partnering arrangements with global biopharmaceutical companies.
Our financial results may be adversely affected if we underprice our contracts, overrun our cost estimates or fail to receive approval for or experience delays in documenting change orders.
Most of our contracts are either fee for service contracts or fixed-fee contracts. Our past financial results have been, and our future financial results may be, adversely impacted if we initially underprice our contracts or otherwise overrun our cost estimates and are unable to successfully negotiate a change order. Change orders typically occur when the scope of work we perform needs to be modified from that originally contemplated by
21
our contract with the customer. Modifications can occur, for example, when there is a change in a key trial assumption or parameter or a significant change in timing. Where we are not successful in converting out-of-scope work into change orders under our current contracts, we bear the cost of the additional work. Such underpricing, significant cost overruns or delay in documentation of change orders could have a material adverse effect on our business, results of operations, financial condition or cash flows.
The relationship of backlog to revenues varies over time.
Backlog represents future service revenues from work not yet completed or performed under signed contracts, letters of intent and, in some cases, written pre-contract commitments. Once work begins on a project, revenue is recognized over the duration of the project. Projects may be terminated or delayed by the customer or delayed by regulatory authorities for reasons beyond our control. To the extent projects are delayed, the timing of our revenue could be affected. In the event that a customer cancels a contract, we typically would be entitled to receive payment for all services performed up to the cancellation date and subsequent customer-authorized services related to terminating the canceled project. Typically, however, we have no contractual right to the full amount of the revenue reflected in our backlog in the event of a contract cancellation. The duration of the projects included in our backlog, and the related revenue recognition, range from a few weeks to many years. Our backlog may not be indicative of our future revenues, and we may not realize all the anticipated future revenue reflected in our backlog. A number of factors may affect backlog, including:
| • | the size, complexity and duration of the projects; |
| • | the cancellation or delay of projects; and |
| • | change in the scope of work during the course of a project. |
Our backlog at December 31, 2014 was $11,244 million compared to backlog of $9,855 million at December 31, 2013. Although an increase in backlog will generally result in an increase in revenues to be recognized over time (depending on the level of cancellations), an increase in backlog at a particular point in time does not necessarily correspond directly to an increase in revenues during a particular period. The extent to which contracts in backlog will result in revenue depends on many factors, including but not limited to delivery against projected schedules, the need for scope changes (change orders), contract cancellations and the nature, duration, size, complexity and phase of the contracts, each of which factors can vary significantly from time to time. Our $11,244 million of backlog at December 31, 2014 included approximately $7,593 million of backlog that we do not expect to generate revenue in 2015 as compared to our $9,855 million of backlog at December 31, 2013, which included approximately $6,342 million of backlog that we did not expect to generate revenue in 2014.
The rate at which our backlog converts to revenue may vary over time for a variety of reasons. The revenue recognition on larger, more global projects could be slower than on smaller, less global projects for a variety of reasons, including but not limited to an extended period of negotiation between the time the project is awarded to us and the actual execution of the contract, as well as an increased timeframe for obtaining the necessary regulatory approvals. Additionally, the increased complexity of trials and the need to enroll precise patient populations could extend the length of trials causing revenue to be recognized over a longer period of time. Further, delayed projects will remain in backlog, unless otherwise canceled by the customer, and will not generate revenue at the rate originally expected. Thus, the relationship of backlog to realized revenues may vary over time.
Our business depends on the continued effectiveness and availability of our information systems, including the information systems we use to provide our services to our customers, and failures of these systems may materially limit our operations.
Due to the global nature of our business and our reliance on information systems to provide our services, we intend to increase our use of web-enabled and other integrated information systems in delivering our services. We also provide access to similar information systems to certain of our customers in connection with the services
22
we provide them. As the breadth and complexity of our information systems continue to grow, we will increasingly be exposed to the risks inherent in the development, integration and ongoing operation of evolving information systems, including:
| • | disruption, impairment or failure of data centers, telecommunications facilities or other key infrastructure platforms; |
| • | security breaches of, cyber attacks on and other failures or malfunctions in our critical application systems or their associated hardware; and |
| • | excessive costs, excessive delays or other deficiencies in systems development and deployment. |
The materialization of any of these risks may impede the processing of data, the delivery of databases and services, and the day-to-day management of our business and could result in the corruption, loss or unauthorized disclosure of proprietary, confidential or other data. While we have disaster recovery plans in place, they might not adequately protect us in the event of a system failure. Despite any precautions we take, damage from fire, floods, hurricanes, power loss, telecommunications failures, computer viruses, break-ins and similar events at our various computer facilities could result in interruptions in the flow of data to our servers and from our servers to our customers. Corruption or loss of data may result in the need to repeat a trial at no cost to the customer, but at significant cost to us, the termination of a contract or damage to our reputation. Additionally, significant delays in system enhancements or inadequate performance of new or upgraded systems once completed could damage our reputation and harm our business. Finally, long-term disruptions in the infrastructure caused by events such as natural disasters, the outbreak of war, the escalation of hostilities and acts of terrorism, particularly involving cities in which we have offices, could adversely affect our businesses. Although we carry property and business interruption insurance, our coverage might not be adequate to compensate us for all losses that may occur.
Unauthorized disclosure of sensitive or confidential data, whether through systems failure or employee negligence, fraud or misappropriation, could damage our reputation and cause us to lose customers. Similarly, we have been and expect that we will continue to be subject to attempts to gain unauthorized access to or through our information systems or those we develop for our customers, whether by our employees or third parties, including a cyber attack by computer programmers and hackers who may develop and deploy viruses, worms or other malicious software programs. To date these attacks have not had a material impact on our operations or financial results. Nonetheless, successful attacks in the future could result in negative publicity, significant remediation costs, legal liability and damage to our reputation and could have a material adverse effect on our results of operations. In addition, our liability insurance might not be sufficient in type or amount to cover us against claims related to security breaches, cyber attacks and other related breaches.
We may be adversely affected by customer or therapeutic concentration.
Although we did not have any customer that represented 10% or more of our service revenues in 2014, 2013, or 2012, we derive the majority of our revenues from a number of large customers. If any large customer decreases or terminates its relationship with us, our business, results of operations or financial condition could be materially adversely affected.
Additionally, conducting multiple clinical trials for different customers in a single therapeutic class involving drugs with the same or similar chemical action has in the past and may in the future adversely affect our business if some or all of the trials are canceled because of new scientific information or regulatory judgments that affect the drugs as a class or if industry consolidation results in the rationalization of drug development pipelines. Similarly, marketing and selling drugs for different biopharmaceutical companies with similar chemical actions subjects us to risk if new scientific information or regulatory judgment prejudices the drugs as a class, which may lead to compelled or voluntary prescription limitations or withdrawal of some or all of such drugs from the market.
23
Our business is subject to international economic, political and other risks that could negatively affect our results of operations and financial condition.
We have significant operations in foreign countries that may require complex arrangements to deliver services on global contracts for our customers. Additionally, we have established operations in locations remote from our most developed business centers. As a result, we are subject to heightened risks inherent in conducting business internationally, including the following:
| • | conducting a single trial across multiple countries is complex, and issues in one country, such as a failure to comply with local regulations or restrictions, may affect the progress of the trial in the other countries, for example, by limiting the amount of data necessary for a trial to proceed, resulting in delays or potential cancellation of contracts, which in turn may result in loss of revenue; |
| • | the United States or foreign countries could enact legislation or impose regulations or other restrictions, including unfavorable labor regulations, tax policies or economic sanctions, which could have an adverse effect on our ability to conduct business in or expatriate profits from the countries in which we operate; |
| • | foreign countries are expanding or may expand their regulatory framework with respect to patient informed consent, protection and compensation in clinical trials, which could delay or inhibit our ability to conduct trials in such jurisdictions; |
| • | the regulatory or judicial authorities of foreign countries may not enforce legal rights and recognize business procedures in a manner in which we are accustomed or would reasonably expect; |
| • | changes in political and economic conditions may lead to changes in the business environment in which we operate, as well as changes in foreign currency exchange rates; |
| • | potential violations of local laws or anti-bribery laws, such as the United States Foreign Corrupt Practices Act, or the FCPA, and the UK Bribery Act, may cause difficulty in staffing and managing foreign operations, as well as significant consequences to us if those laws are violated; |
| • | customers in foreign jurisdictions may have longer payment cycles, and it may be more difficult to collect receivables in foreign jurisdictions; and |
| • | natural disasters, pandemics or international conflict, including terrorist acts, could interrupt our services, endanger our personnel or cause project delays or loss of trial materials or results. |
These risks and uncertainties could negatively impact our ability to, among other things, perform large, global projects for our customers. Furthermore, our ability to deal with these issues could be affected by applicable United States laws and the need to protect our assets. Any such risks could have an adverse impact on our financial condition and results of operations.
Due to the global nature of our business, we may be exposed to liabilities under the United States Foreign Corrupt Practices Act and various non-U.S. anti-corruption laws, and any allegation or determination that we violated these laws could have a material adverse effect on our business.
We are required to comply with the United States Foreign Corrupt Practices Act, or the FCPA, and other U.S. and non-U.S. anti-corruption laws, which prohibit companies from engaging in bribery including corruptly or improperly offering, promising, or providing money or anything else of value to non-U.S. officials and certain other recipients. In addition, the FCPA imposes certain books, records, and accounting control obligations on public companies and other issuers. We operate in parts of the world in which corruption can be common and compliance with anti-bribery laws may conflict with local customs and practices. Our global operations face the risk of unauthorized payments or offers being made by employees, consultants, sales agents, and other business partners outside of our control or without our authorization. It is our policy to implement safeguards to prohibit these practices by our employees and business partners with respect to our operations. However, irrespective of these safeguards, or as a result of monitoring compliance with such safeguards, it is possible that we or certain
24
other parties may discover or receive information at some point that certain employees, consultants, sales agents, or other business partners may have engaged in corrupt conduct for which we might be held responsible. Violations of the FCPA or other non-U.S. anti-corruption laws may result in restatements of, or irregularities in, our financial statements as well as severe criminal or civil sanctions, and we may be subject to other liabilities, which could negatively affect our business, operating results and financial condition. In some cases, companies that violate the FCPA may be debarred by the U.S. government and/or lose their U.S. export privileges. Changes in anti-corruption laws or enforcement priorities could also result in increased compliance requirements and related costs which could adversely affect our business, financial condition and results of operations. In addition, the U.S. or other governments may seek to hold us liable for successor liability FCPA violations or violations of other anti-corruption laws committed by companies in which we invest or that we acquired or will acquire.
If we are unable to successfully develop and market new services or enter new markets, our growth, results of operations or financial condition could be adversely affected.
A key element of our growth strategy is the successful development and marketing of new services or entering new markets that complement or expand our existing business. As we develop new services or enter new markets, including services targeted at participants in the broader healthcare industry, we may not have or adequately build the competencies necessary to perform such services satisfactorily, may not receive market acceptance for such services or may face increased competition. If we are unable to succeed in developing new services, entering new markets or attracting a customer base for our new services or in new markets, we will be unable to implement this element of our growth strategy, and our future business, reputation, results of operations and financial condition could be adversely affected.
Upgrading the information systems that support our operating processes and evolving the technology platform for our services pose risks to our business.
Continued efficient operation of our business requires that we implement standardized global business processes and evolve our information systems to enable this implementation. We have continued to undertake significant programs to optimize business processes with respect to our services. Our inability to effectively manage the implementation and adapt to new processes designed into these new or upgraded systems in a timely and cost-effective manner may result in disruption to our business and negatively affect our operations.
We have entered into agreements with certain vendors to provide systems development and integration services that develop or license to us the IT platform for programs to optimize our business processes. If such vendors fail to perform as required or if there are substantial delays in developing, implementing and updating the IT platform, our customer delivery may be impaired, and we may have to make substantial further investments, internally or with third parties, to achieve our objectives. Additionally, our progress may be limited by parties with existing or claimed patents who seek to enjoin us from using preferred technology or seek license payments from us.
Meeting our objectives is dependent on a number of factors which may not take place as we anticipate, including obtaining adequate technology-enabled services, creating IT-enabled services that our customers will find desirable and implementing our business model with respect to these services. Also, increased IT-related expenditures may negatively impact our profitability.
If we fail to perform our services in accordance with contractual requirements, regulatory standards and ethical considerations, we could be subject to significant costs or liability and our reputation could be harmed.
We contract with biopharmaceutical companies to perform a wide range of services to assist them in bringing new drugs to market. Our services include monitoring clinical trials, data and laboratory analysis, EDC, patient recruitment and other related services. Such services are complex and subject to contractual requirements, regulatory standards and ethical considerations. For example, we must adhere to regulatory requirements such as the FDA and current GCP, GLP and GMP requirements. If we fail to perform our services in accordance with
25
these requirements, regulatory agencies may take action against us for failure to comply with applicable regulations governing clinical trials or sales and marketing practices. Such actions may include sanctions, such as injunctions or failure of such regulatory authorities to grant marketing approval of products, delay, suspension or withdrawal of approvals, license revocation, product seizures or recalls, operational restrictions, civil or criminal penalties or prosecutions, damages or fines. Customers may also bring claims against us for breach of our contractual obligations and patients in the clinical trials and patients taking drugs approved on the basis of those trials may bring personal injury claims against us for negligence. Any such action could have a material adverse effect on our results of operations, financial condition and reputation.
Such consequences could arise if, among other things, the following occur:
Improper performance of our services. The performance of clinical development services is complex and time-consuming. For example, we may make mistakes in conducting a clinical trial that could negatively impact or obviate the usefulness of the trial or cause the results of the trial to be reported improperly. If the trial results are compromised, we could be subject to significant costs or liability, which could have an adverse impact on our ability to perform our services. As examples:
| • | non-compliance generally could result in the termination of ongoing clinical trials or sales and marketing projects or the disqualification of data for submission to regulatory authorities; |
| • | compromise of data from a particular trial, such as failure to verify that informed consent was obtained from patients, could require us to repeat the trial under the terms of our contract at no further cost to our customer, but at a substantial cost to us; and |
| • | breach of a contractual term could result in liability for damages or termination of the contract. |
Large clinical trials can cost hundreds of millions of dollars, and while we endeavor to contractually limit our exposure to such risks, improper performance of our services could have an adverse effect on our financial condition, damage our reputation and result in the cancellation of current contracts by or failure to obtain future contracts from the affected customer or other customers.
Investigation of customers. From time to time, one or more of our customers are audited or investigated by regulatory authorities or enforcement agencies with respect to regulatory compliance of their clinical trials, programs or the marketing and sale of their drugs. In these situations, we have often provided services to our customers with respect to the clinical trials, programs or activities being audited or investigated, and we are called upon to respond to requests for information by the authorities and agencies. There is a risk that either our customers or regulatory authorities could claim that we performed our services improperly or that we are responsible for clinical trial or program compliance. If our customers or regulatory authorities make such claims against us and prove them, we could be subject to damages, fines or penalties. In addition, negative publicity regarding regulatory compliance of our customers’ clinical trials, programs or drugs could have an adverse effect on our business and reputation.
Insufficient customer funding to complete a clinical trial. As noted above, clinical trials can cost hundreds of millions of dollars. There is a risk that we may initiate a clinical trial for a customer, and then the customer becomes unwilling or unable to fund the completion of the trial. In such a situation, notwithstanding the customer’s ability or willingness to pay for or otherwise facilitate the completion of the trial, we may be ethically bound to complete or wind down the trial at our own expense.
Our research and development services could subject us to potential liability that may adversely affect our results of operations and financial condition.
Our business involves the testing of new drugs on patients in clinical trials and, if marketing approval is granted, the availability of these drugs to be prescribed to patients. Our involvement in the clinical trials and development process creates a risk of liability for personal injury to or death of patients, particularly those with life-threatening illnesses, resulting from adverse reactions to the drugs administered during testing or after product launch, respectively. For example, we have from time to time been sued and may be sued in the future by
26
individuals alleging personal injury due to their participation in clinical trials and seeking damages from us under a variety of legal theories. Although we maintain the types and amounts of insurance customary in the industries and countries in which we operate, if we are required to pay damages or incur defense costs in connection with any personal injury claim that is outside the scope of indemnification agreements we have with our customers, if any indemnification agreement is not performed in accordance with its terms or if our liability exceeds the amount of any applicable indemnification limits or available insurance coverage, our financial condition, results of operations and reputation could be materially and adversely affected. Currently, we maintain professional liability insurance, including products liability for completed operations coverage, with annual aggregate limits in excess of $50.0 million. In the future, we may not be able to get adequate insurance for these types of risks at reasonable rates.
We also contract with physicians to serve as investigators in conducting clinical trials. If the investigators commit errors or make omissions during a clinical trial that result in harm to trial patients or after a clinical trial to a patient using the drug after it has received regulatory approval, claims for personal injury or products liability damages may result. Additionally, if the investigators engage in fraudulent behavior, trial data may be compromised, which may require us to repeat the clinical trial or subject us to liability. We do not believe we are legally responsible for the medical care rendered by such third-party investigators, and we would vigorously defend any claims brought against us. However, it is possible we could be found liable for claims with respect to the actions of third-party investigators.
Some of our services involve direct interaction with clinical trial subjects or volunteers and operation of Phase I clinical facilities, which could create potential liability that may adversely affect our results of operations and financial condition.
We operate two facilities where Phase I clinical trials are conducted, which ordinarily involve testing an investigational drug on a limited number of healthy individuals, typically 20 to 80 persons, to determine such drug’s basic safety. Failure to operate such a facility in accordance with applicable regulations could result in that facility being shut down, which could disrupt our operations. Additionally, we face risks associated with adverse events resulting from the administration of such drugs to healthy volunteers and the professional malpractice of medical care providers. Occasionally, physicians employed at our Phase I clinical facilities act as principal investigators in later-phase trials at those same facilities. We also directly employ nurses and other trained employees who assist in implementing the testing involved in our clinical trials, such as drawing blood from healthy volunteers. Any professional malpractice or negligence by such investigators, nurses or other employees could potentially result in liability to us in the event of personal injury to or death of a healthy volunteer in clinical trials. This liability, particularly if it were to exceed the limits of any indemnification agreements and insurance coverage we may have, may adversely affect our financial condition, results of operations and reputation.
Our commercial services could result in liability to us if a drug causes harm to a patient. While we are generally indemnified and insured against such risks, we may still suffer financial losses.
When we market drugs under contract for a biopharmaceutical company, we could suffer liability for harm allegedly caused by those drugs, either as a result of a lawsuit against the biopharmaceutical company to which we are joined, a lawsuit naming us or any of our subsidiaries or an action launched by a regulatory body. While we are indemnified by the biopharmaceutical company for the action of the drugs we market on its behalf, and we carry insurance to cover harm caused by our negligence in performing services, it is possible that we could nonetheless incur financial losses, regulatory penalties or both. In particular, any claim could result in potential liability for us if the claim is outside the scope of the indemnification agreement we have with the biopharmaceutical company, the biopharmaceutical company does not abide by the indemnification agreement as required or the liability exceeds the amount of any applicable indemnification limits or available insurance coverage. Such a finding could have an adverse impact on our financial condition, results of operations and reputation. Furthermore, negative publicity associated with harm caused by drugs we helped to market could have an adverse effect on our business and reputation.
27
Our insurance may not cover all of our indemnification obligations and other liabilities associated with our operations.
We maintain insurance designed to provide coverage for ordinary risks associated with our operations and our ordinary indemnification obligations with annual aggregate limits in excess of $50.0 million. The coverage provided by such insurance may not be adequate for all claims we may make or may be contested by our insurance carriers. If our insurance is not adequate or available to pay liabilities associated with our operations, or if we are unable to purchase adequate insurance at reasonable rates in the future, our profitability may be adversely impacted.
If we are unable to attract suitable investigators and patients for our clinical trials, our clinical development business might suffer.
The recruitment of investigators and patients for clinical trials is essential to our business. Investigators are typically located at hospitals, clinics or other sites and supervise the administration of the investigational drug to patients during the course of a clinical trial. Patients generally include people from the communities in which the clinical trials are conducted. Our clinical development business could be adversely affected if we are unable to attract suitable and willing investigators or patients for clinical trials on a consistent basis. For example, if we are unable to engage investigators to conduct clinical trials as planned or enroll sufficient patients in clinical trials, we might need to expend additional funds to obtain access to resources or else be compelled to delay or modify the clinical trial plans, which may result in additional costs to us.
If we lose the services of key personnel or are unable to recruit experienced personnel, our business could be adversely affected.
Our success substantially depends on the collective performance, contributions and expertise of our senior management team and other key personnel including qualified management, professional, scientific and technical operating staff and qualified sales representatives for our contract sales services. There is significant competition for qualified personnel, particularly those with higher educational degrees, such as a medical degree, a Ph.D. or an equivalent degree, in the biopharmaceutical and biopharmaceutical services industries. The departure of any key executive, or our inability to continue to identify, attract and retain qualified personnel or replace any departed personnel in a timely fashion, may impact our ability to grow our business and compete effectively in our industry and may negatively affect our ability to meet financial and operational goals.
Exchange rate fluctuations may affect our results of operations and financial condition.
In 2014, approximately 38% of our service revenues were denominated in currencies other than the United States dollar. Because a large portion of our service revenues and expenses are denominated in currencies other than the United States dollar and our financial statements are reported in United States dollars, changes in foreign currency exchange rates could significantly affect our results of operations and financial condition. Exchange rate fluctuations between local currencies and the United States dollar create risk in several ways, including:
Foreign Currency Translation Risk. The revenue and expenses of our foreign operations are generally denominated in local currencies and translated into United States dollars for financial reporting purposes. Accordingly, exchange rate fluctuations will affect the translation of foreign results into United States dollars for purposes of reporting our consolidated results.
Foreign Currency Transaction Risk. We are subject to foreign currency transaction risk for fluctuations in exchange rates during the period of time between the consummation and cash settlement of a transaction. We earn revenue from our service contracts over a period of several months and, in some cases, over several years. Accordingly, exchange rate fluctuations during this period may affect our profitability with respect to such contracts.
28
We may limit these risks through exchange rate fluctuation provisions stated in our service contracts, or we may hedge our transaction risk with foreign currency exchange contracts or options. We have not, however, hedged 100% of our foreign currency transaction risk, and we may experience fluctuations in financial results from our operations outside the United States and foreign currency transaction risk associated with our service contracts.
Disruptions in the credit and capital markets and unfavorable general economic conditions could negatively affect our business, results of operations and financial condition.
Disruptions in the credit and capital markets could have negative effects on our business that may be difficult to predict or anticipate, including the ability of our customers, vendors, contractors and financing sources to meet their contractual obligations. Although we are unable to quantify the impact it has had on us, we are aware of a limited number of instances during the past several years where cancellations, changes in scope and failure to pay timely were attributable, at least in part, to difficulty in our customers’ ability to obtain financing. In the future such actions by our customers could, if they involve a significant amount of business with us, have a material adverse effect on our results of operations.
Our effective income tax rate may fluctuate, which may adversely affect our operations, earnings and earnings per share.
Our effective income tax rate is influenced by our projected profitability in the various taxing jurisdictions in which we operate. Changes in the distribution of profits and losses among taxing jurisdictions may have a significant impact on our effective income tax rate, which in turn could have an adverse effect on our net income and earnings per share. Factors that may affect our effective income tax rate include, but are not limited to:
| • | the requirement to exclude from our quarterly worldwide effective income tax calculations losses in jurisdictions where no income tax benefit can be recognized; |
| • | actual and projected full year pre-tax income; |
| • | the repatriation of foreign earnings to the United States; |
| • | changes in tax laws in various taxing jurisdictions; |
| • | audits by taxing authorities; and |
| • | the establishment of valuation allowances against deferred income tax assets if we determined that it is more likely than not that future income tax benefits will not be realized. |
These changes may cause fluctuations in our effective income tax rate that could adversely affect our results of operations and cause fluctuations in our earnings and earnings per share.
We have only a limited ability to protect our intellectual property rights, and these rights are important to our success.
Our success depends, in part, upon our ability to develop, use and protect our proprietary methodologies, analytics, systems, technologies and other intellectual property. Existing laws of the various countries in which we provide services or solutions offer only limited protection of our intellectual property rights, and the protection in some countries may be very limited. We rely upon a combination of trade secrets, confidentiality policies, nondisclosure, invention assignment and other contractual arrangements, and patent, copyright and trademark laws, to protect our intellectual property rights. These laws are subject to change at any time and certain agreements may not be fully enforceable, which could further restrict our ability to protect our innovations. Our intellectual property rights may not prevent competitors from independently developing services similar to or duplicative of ours. Further, the steps we take in this regard might not be adequate to prevent or deter infringement or other misappropriation of our intellectual property by competitors, former
29
employees or other third parties, and we might not be able to detect unauthorized use of, or take appropriate and timely steps to enforce, our intellectual property rights. Enforcing our rights might also require considerable time, money and oversight, and we may not be successful in enforcing our rights.
Depending on the circumstances, we might need to grant a specific customer greater rights in intellectual property developed in connection with a contract than we otherwise generally do. In certain situations, we might forego all rights to the use of intellectual property we create, which would limit our ability to reuse that intellectual property for other customers. Any limitation on our ability to provide a service or solution could cause us to lose revenue-generating opportunities and require us to incur additional expenses to develop or license new or modified solutions for future projects.
Our relationships with existing or potential customers who are in competition with each other may adversely impact the degree to which other customers or potential customers use our services, which may adversely affect our results of operations.
The biopharmaceutical industry is highly competitive, with biopharmaceutical companies each seeking to persuade payers, providers and patients that their drug therapies are better and more cost-effective than competing therapies marketed or being developed by competing firms. In addition to the adverse competitive interests that biopharmaceutical companies have with each other, biopharmaceutical companies also have adverse interests with respect to drug selection and reimbursement with other participants in the healthcare industry, including payers and providers. Biopharmaceutical companies also compete to be first to market with new drug therapies. We regularly provide services to biopharmaceutical companies who compete with each other, and we sometimes provide services or funding to such customers regarding competing drugs in development. Our existing or future relationships with our biopharmaceutical customers may therefore deter other biopharmaceutical customers from using our services or may result in our customers seeking to place limits on our ability to serve other biopharmaceutical industry participants. In addition, our further expansion into the broader healthcare market may adversely impact our relationships with biopharmaceutical customers, and such customers may elect not to use our services, reduce the scope of services that we provide to them or seek to place restrictions on our ability to serve customers in the broader healthcare market with interests that are adverse to theirs. Any loss of customers or reductions in the level of revenues from a customer could have a material adverse effect on our results of operations, business and prospects.
If we are unable to successfully identify, acquire and integrate existing businesses, services and technologies, our business, results of operations and financial condition could be adversely impacted.
We anticipate that a portion of our future growth may come from acquiring existing businesses, services or technologies. The success of any acquisition will depend upon, among other things, our ability to effectively integrate acquired personnel, operations, products and technologies into our business and to retain the key personnel and customers of our acquired businesses. In addition, we may be unable to identify suitable acquisition opportunities or obtain any necessary financing on commercially acceptable terms. We may also spend time and money investigating and negotiating with potential acquisition targets but not complete the transaction. Any future acquisition could involve other risks, including, among others, the assumption of additional liabilities and expenses, difficulties and expenses in connection with integrating the acquired companies and achieving the expected benefits, issuances of potentially dilutive securities or interest-bearing debt, loss of key employees of the acquired companies, transaction costs, diversion of management’s attention from other business concerns and, with respect to the acquisition of foreign companies, the inability to overcome differences in foreign business practices, language and customs. Our failure to identify potential acquisitions, complete targeted acquisitions and integrate completed acquisitions could have a material adverse effect on our business, financial condition and results of operations.
30
Investments in our customers’ businesses or drugs and our related commercial rights strategies could have a negative impact on our financial performance.
We may enter into arrangements with our customers or other drug companies in which we take on some of the risk of the potential success or failure of their businesses or drugs, including making strategic investments in our customers or other drug companies, providing financing to customers or other drug companies or acquiring an interest in the revenues from customers’ drugs or in entities developing a limited number of drugs. As of December 31, 2014, we had approximately $38.0 million of such arrangements, and we were also committed to invest an additional $25.0 million in the NovaQuest Pharma Opportunities Fund III, L.P., a private equity fund that seeks to enter into similar risk-based arrangements. Our financial results would be adversely affected if these investments or the underlying drugs result in losses or do not achieve the level of success that we anticipate and/or our return or payment from the drug investment or financing is less than our direct and indirect costs with respect to these arrangements.
Our results of operations may be adversely affected if we fail to realize the full value of our goodwill and intangible assets.
As of December 31, 2014, we had goodwill and net intangible assets of $744.7 million, which constituted approximately 22.5% of our total assets at the end of this period. We assess the realizability of our indefinite-lived intangible assets and goodwill annually and conduct an interim evaluation whenever events or changes in circumstances, such as operating losses or a significant decline in earnings associated with the acquired business or asset, indicate that these assets may be impaired. Our ability to realize the value of the goodwill and indefinite-lived intangible assets will depend on the future cash flows of the businesses we have acquired, which in turn depend in part on how well we have integrated these businesses into our own business. If we are not able to realize the value of the goodwill and indefinite-lived intangible assets, we may be required to incur material charges relating to the impairment of those assets. Such impairment charges could materially and adversely affect our operating results and financial condition.
We face risks arising from the restructuring of our operations.
From time to time, we have adopted restructuring plans to improve our operating efficiency through various means such as reduction of overcapacity, elimination of non-billable support roles or other realignment of resources. For example, in 2014, our Board approved restructuring plans of up to $13 million which resulted in a reduction of approximately 250 positions. In February 2013, our Board approved a restructuring plan of up to $15 million which resulted in a reduction of approximately 400 positions. Restructuring presents significant potential risks of events occurring that could adversely affect us, including a decrease in employee morale, the failure to achieve targeted cost savings and the failure to meet operational targets and customer requirements due to the loss of employees and any work stoppages that might occur.
We depend on third parties for critical support services.
We depend on third parties for support services vital to our business. Such support services include, but are not limited to, third-party transportation providers, suppliers of drugs for patients participating in clinical trials, suppliers of kits for use in our central laboratory business, suppliers of reagents for use in our testing equipment and providers of maintenance contracts for our equipment. The failure of any of these third parties to adequately provide the critical support services could have a material adverse effect on our business.
Risks Relating to Our Industry
The biopharmaceutical services industry is highly competitive.
The biopharmaceutical services industry is highly competitive. We often compete for business with other biopharmaceutical services companies, internal discovery departments, development departments, and sales and marketing departments within our customers, some of which could be considered large biopharmaceutical services companies in their own right with greater resources than ours. We also compete with universities and
31
teaching hospitals. If we do not compete successfully, our business will suffer. The industry is highly fragmented, with numerous smaller specialized companies and a handful of full-service companies with global capabilities similar to ours. Increased competition has led to price and other forms of competition, such as acceptance of less favorable contract terms, that could adversely affect our operating results. There are few barriers to entry for smaller specialized companies considering entering the industry. Because of their size and focus, these companies might compete effectively against larger companies such as us, which could have a material adverse impact on our business.
Outsourcing trends in the biopharmaceutical industry and changes in aggregate spending and R&D budgets could adversely affect our operating results and growth rate.
Economic factors and industry trends that affect biopharmaceutical companies affect our business. Biopharmaceutical companies continue to seek long-term strategic collaborations with global CROs with favorable pricing terms. Competition for these collaborations is intense and we may decide to forego an opportunity or we may not be selected, in which case a competitor may enter into the collaboration and our business with the customer, if any, may be limited. In addition, if the biopharmaceutical industry reduces its outsourcing of clinical trials and sales and marketing projects or such outsourcing fails to grow at projected rates, our operations and financial condition could be materially and adversely affected. We may also be negatively impacted by consolidation and other factors in the biopharmaceutical industry, which may slow decision making by our customers or result in the delay or cancellation of clinical trials. Our commercial services may be affected by reductions in new drug launches and increases in the number of drugs losing patent protection. All of these events could adversely affect our business, results of operations or financial condition.
We may be affected by healthcare reform and potential additional reforms.
The United States Congress continues to consider healthcare reform legislation and impose health industry cost containment measures, which may significantly impact the biopharmaceutical industry. In addition, numerous government bodies are considering or have adopted various healthcare reforms and may undertake, or are in the process of undertaking, efforts to control growing healthcare costs through legislation, regulation and voluntary agreements with medical care providers and biopharmaceutical companies. We are uncertain as to the effects of these recent reforms on our business and are unable to predict what legislative proposals, if any, will be adopted in the future. If regulatory cost containment efforts limit the profitability of new drugs, our customers may reduce their R&D spending or promotional, marketing and sales expenditures, which could reduce the business they outsource to us. Similarly, if regulatory requirements are relaxed or simplified drug approval procedures are adopted, the demand for our services could decrease.
Government bodies may also adopt healthcare legislation or regulations that are more burdensome than existing regulations. For example, product safety concerns and recommendations by the Drug Safety Oversight Board could change the regulatory environment for drug products, and new or heightened regulatory requirements may increase our expenses or limit our ability to offer some of our services. Additionally, new or heightened regulatory requirements may have a negative impact on the ability of our customers to conduct industry-sponsored clinical trials, which could reduce the need for our services.
Actions by government regulators or customers to limit a prescription’s scope or withdraw an approved drug from the market could adversely affect our business and result in a loss of revenues.
Government regulators have the authority, after approving a drug, to limit its scope of prescription or withdraw it from the market completely based on safety concerns. Similarly, customers may act to voluntarily limit the scope of prescription of drugs or withdraw them from the market. In the past, we have provided services with respect to drugs that have been limited and/or withdrawn. If we are providing services to customers for drugs that are limited or withdrawn, we may be required to narrow the scope of or terminate our services with respect to such drugs, which would prevent us from earning the full amount of service revenues anticipated under the related service contracts with negative impacts to our financial results.
32
Current and proposed laws and regulations regarding the protection of personal data could result in increased risks of liability or increased cost to us or could limit our service offerings.
The confidentiality, collection, use and disclosure of personal data, including clinical trial patient-specific information, are subject to governmental regulation generally in the country that the personal data were collected or used. For example, United States federal regulations under the Health Insurance Portability and Accountability Act of 1996, or HIPAA, and as amended in 2014 by the Health Information Technology for Economic and Clinical Health (“HITECH”) Act, require individuals’ written authorization, in addition to any required informed consent, before Protected Health Information may be used for research. Such regulations specify standards for deidentifications and for limited data sets. We are both directly and indirectly affected by the privacy provisions surrounding individual authorizations because many investigators with whom we are involved in clinical trials are directly subject to them as a HIPAA “covered entity” and because we obtain identifiable health information from third parties that are subject to such regulations. As there are some instances where we are a HIPAA “business associate” of a “covered entity,” we can also be directly liable for mishandling protected health information. Under HIPAA’s enforcement scheme, we can be subject to up to $1.5 million in annual civil penalties for each HIPAA violation.
In the European Union, or EU, personal data includes any information that relates to an identified or identifiable natural person with health information carrying additional obligations, including obtaining the explicit consent from the individual for collection, use or disclosure of the information. In addition, we are subject to EU rules with respect to cross-border transfers of such data out of the EU. The United States, the EU and its member states, and other countries where we have operations, such as Japan, South Korea, Malaysia, the Philippines, Russia and Singapore, continue to issue new privacy and data protection rules and regulations that relate to personal data and health information. Failure to comply with certain certification/registration and annual re-certification/registration provisions associated with these data protection and privacy regulations and rules in various jurisdictions, or to resolve any serious privacy complaints, could subject us to regulatory sanctions, criminal prosecution or civil liability. Federal, state and foreign governments are contemplating or have proposed or adopted additional legislation governing the collection, possession, use or dissemination of personal data, such as personal health information, and personal financial data as well as security breach notification rules for loss or theft of such data. Additional legislation or regulation of this type might, among other things, require us to implement new security measures and processes or bring within the legislation or regulation de-identified health or other personal data, each of which may require substantial expenditures or limit our ability to offer some of our services. Additionally, if we violate applicable laws, regulations or duties relating to the use, privacy or security of personal data, we could be subject to civil liability or criminal prosecution, be forced to alter our business practices and suffer reputational harm. In the next few years, the European data protection framework may be revised as a generally applicable data regulation. The text has not yet been finalized, but it contains new provisions specifically directed at the processing of health information, sanctions of up to 5% of worldwide gross revenue and extra-territoriality measures intended to bring non-EU companies under the proposed regulation.
If we do not keep pace with rapid technological changes, our services may become less competitive or obsolete.
The biopharmaceutical industry generally, and drug development and clinical research more specifically, are subject to rapid technological changes. Our current competitors or other businesses might develop technologies or services that are more effective or commercially attractive than, or render obsolete, our current or future technologies and services. If our competitors introduce superior technologies or services and if we cannot make enhancements to remain competitive, our competitive position would be harmed. If we are unable to compete successfully, we may lose customers or be unable to attract new customers, which could lead to a decrease in our revenue and financial condition.
33
The biopharmaceutical industry has a history of patent and other intellectual property litigation, and we might be involved in costly intellectual property lawsuits.
The biopharmaceutical industry has a history of intellectual property litigation, and these lawsuits will likely continue in the future. Accordingly, we may face patent infringement suits by companies that have patents for similar business processes or other suits alleging infringement of their intellectual property rights. Legal proceedings relating to intellectual property could be expensive, take significant time and divert management’s attention from other business concerns, regardless of the outcome of the litigation. If we do not prevail in an infringement lawsuit brought against us, we might have to pay substantial damages, and we could be required to stop the infringing activity or obtain a license to use technology on unfavorable terms.
Risks Relating to Our Indebtedness
Our substantial debt could adversely affect our financial condition.
As of December 31, 2014, we had $3.306 billion in total assets, $4.010 billion in total liabilities and a shareholders’ deficit of $704 million. Included within total liabilities was $2.293 billion of total indebtedness, excluding $400.0 million of additional available borrowings under our revolving credit facility and $25.0 million of additional available borrowings under our receivables financing facility. Our substantial indebtedness could adversely affect our financial condition and thus make it more difficult for us to satisfy our obligations with respect to our credit facilities. If our cash flow is not sufficient to service our debt and adequately fund our business, we may be required to seek further additional financing or refinancing or dispose of assets. We may not be able to influence any of these alternatives on satisfactory terms or at all. Our substantial indebtedness could also:
| • | increase our vulnerability to adverse general economic and industry conditions; |
| • | require us to dedicate a substantial portion of our cash flows from operations to payments on our indebtedness, thereby reducing the availability of our cash flows to fund working capital, investments, acquisitions, capital expenditures, R&D efforts and other general corporate purposes; |
| • | limit our ability to make required payments under our existing contractual commitments, including our existing long-term indebtedness; |
| • | limit our flexibility in planning for, or reacting to, changes in our business and the industry in which we operate; |
| • | place us at a competitive disadvantage compared to our competitors that have less debt; |
| • | cause us to incur substantial fees from time to time in connection with debt amendments or refinancings; |
| • | increase our exposure to rising interest rates because a portion of our borrowings is at variable interest rates; and |
| • | limit our ability to borrow additional funds or to borrow on terms that are satisfactory to us. |
Despite our level of indebtedness, we are able to incur more debt and undertake additional obligations. Incurring such debt or undertaking such additional obligations could further exacerbate the risks to our financial condition.
Although our credit agreement, which governs the senior credit facilities of our wholly owned subsidiary through which we conduct our operations, Quintiles Transnational Corp., or Quintiles Transnational, contain restrictions on the incurrence of additional indebtedness, these restrictions are subject to a number of qualifications and exceptions and the indebtedness incurred in compliance with these restrictions could increase. In addition, the receivables financing agreement for our special purpose subsidiary, Quintiles Funding, LLC, or Quintiles Funding, limits borrowing based on the amount of receivables purchased by Quintiles Funding from certain of our other subsidiaries, but when supported by the value of such purchased receivables, the debt under
34
our receivables financing facility can increase. We have $400.0 million available for borrowing under our senior secured revolving credit facility and $25.0 million of additional available borrowings under our receivables financing facility.
While the credit agreement also contains restrictions on our and our restricted subsidiaries’ ability to make loans and investments, these restrictions are subject to a number of qualifications and exceptions, and the investments incurred in compliance with these restrictions could be substantial.
If we do not comply with the covenants governing our credit facilities, we may not have the funds necessary to pay all of our indebtedness that could become due.
The credit agreement governing our senior secured credit facilities requires us to comply with certain covenants. In particular, our credit agreement prohibits us from incurring any additional indebtedness, except in specified circumstances, or amending the terms of agreements relating to certain existing junior indebtedness, if any, in a manner materially adverse to the lenders under our credit agreement, without lender approval. Further, our credit agreement contains customary covenants, including covenants that restrict our ability to acquire and dispose of assets, engage in mergers or reorganizations, pay dividends or make investments. In addition, our credit agreement requires us to make mandatory principal prepayments in certain circumstances, including with a portion of our excess cash flow if Quintiles Transnational’s total leverage ratio (as defined in the credit agreement) exceeds certain levels. A violation of any of these covenants could cause an event of default under our credit agreement.
The receivables financing agreement for our receivables financing facility requires certain of our subsidiaries to transfer receivables with adequate value to the lender under that facility to support repayment of amounts outstanding. In the event such transferred receivables are insufficient to support such outstanding amounts, we will be required to make prepayments under the receivables financing agreement. Failure to make such prepayments or violations of the covenants in the receivables financing agreement could cause an event of default under the receivables financing agreement.
If we default on our senior secured credit agreement or our receivables financing agreement as a result of our failure to pay principal or interest when due, our material breach of any representation, warranty or covenant, or any other reason, all outstanding amounts could become immediately due and payable under either or both of such agreements. In such case, we may not have sufficient funds to repay all the outstanding amounts. In addition, or in the alternative, the lenders under our senior secured credit agreement could exercise their rights under the security documents entered into in connection with the senior secured credit agreement. Any acceleration of amounts due under the credit agreement governing our outstanding indebtedness or the substantial exercise by the lenders under our senior secured credit agreement of their rights under the security documents would likely have a material adverse effect on us.
Interest rate fluctuations may affect our results of operations and financial condition.
Because we have variable rate debt, fluctuations in interest rates affect our business. We attempt to minimize interest rate risk and lower our overall borrowing costs through the utilization of derivative financial instruments, primarily interest rate swaps. We have entered into interest rate swaps with financial institutions that have reset dates and critical terms that match those of our senior secured term loan credit facility. Accordingly, any change in market value associated with the interest rate swaps is offset by the opposite market impact on the related debt. As of December 31, 2014, we had approximately $2.0 billion of total indebtedness with variable interest at the greater of the three month LIBOR or 1.25%, plus 2.50%, or 3.75% at December 31, 2014, of which $910.0 million, or 44.8%, was hedged at a fixed rate of 2.57%, leaving approximately $1.1 billion of unhedged variable rate debt. As of December 31, 2014, we also had $275.0 million of total indebtedness under our receivables financing facility with variable interest at LIBOR plus 1.05%, or 1.22% at December 31, 2014. Because we do not attempt to hedge all of our variable rate debt, we may incur higher interest costs for the
35
portion of our variable rate debt which is not hedged. Each quarter-point increase or decrease in the variable interest rate would result in our interest expense changing by approximately $3.5 million per year under our unhedged variable rate debt.
Risks Relating to Ownership of Our Common Stock
Although we are no longer a “controlled company” within the meaning of the NYSE rules, we are relying on exemptions from certain corporate governance requirements during a one year transition period.
We are no longer a “controlled company” within the meaning of the corporate governance standards contained in Section 303A of the NYSE Listed Company Manual. Consequently, as of November 10, 2014 the NYSE rules require that we:
| • | appoint at least a majority of independent directors to our compensation and nominating and governance committees within 90 days; |
| • | appoint a majority of independent directors to our Board within one year; and |
| • | appoint compensation and nominating and governance committees composed entirely of independent directors within one year. |
We intend to utilize the transition periods described above to achieve full compliance with these NYSE requirements. As a result, at this time, we do not have a majority of independent directors, and our compensation and nominating and governance committees do not consist entirely of independent directors. Accordingly, you do not, and during these transition periods you will not, have the same protections afforded to shareholders of companies that are subject to all of the corporate governance requirements of the NYSE. In addition, if we are unable to comply with the heightened corporate governance requirements prior to the prescribed NYSE deadlines, we may incur penalties or our shares could be delisted.
Provisions of our corporate governance documents could make an acquisition of our company more difficult and may prevent attempts by our shareholders to replace or remove our current management, even if beneficial to our shareholders.
Provisions of our articles of incorporation and our bylaws may discourage, delay or prevent a merger, acquisition or other change in control of our company that shareholders may consider favorable, including transactions in which you might otherwise receive a premium for your shares. These provisions could also limit the price that investors might be willing to pay in the future for shares of our common stock, thereby depressing the market price of our common stock. In addition, these provisions may frustrate or prevent any attempts by our shareholders to replace or remove members of our Board. Because our Board is responsible for appointing the members of our management team, these provisions could in turn frustrate or prevent any attempt to replace or remove current members of our management team. Among others, these provisions include (1) our ability to issue preferred stock without shareholder approval, (2) the requirement that our shareholders may not act without a meeting, (3) requirements for advance notification of shareholder nominations and proposals contained in our bylaws, (4) the absence of cumulative voting for our directors, (5) requirements for shareholder approval of certain business combinations and (6) the limitations on director nominations contained in our Shareholders Agreement.
Our operating results and share price may be volatile, which could cause the value of our shareholders’ investments to decline.
Our quarterly and annual operating results may fluctuate in the future, and such fluctuations may be significant. In addition, securities markets worldwide have experienced, and are likely to continue to experience, significant price and volume fluctuations. This market volatility, as well as general economic, market or political conditions, could subject the market price of our shares to wide price fluctuations regardless of our operating performance. Our operating results and the trading price of our shares may fluctuate in response to various factors, including:
| • | market conditions in the broader stock market; |
| • | actual or anticipated fluctuations in our quarterly and annual financial and operating results; |
36
| • | introduction of new products or services by us or our competitors; |
| • | issuance of new or changed securities analysts’ reports or recommendations; |
| • | sales, or anticipated sales, of large blocks of our stock; |
| • | additions or departures of key personnel; |
| • | regulatory or political developments; |
| • | litigation and governmental investigations; |
| • | changing economic conditions; and |
| • | exchange rate fluctuations. |
These and other factors, many of which are beyond our control, may cause our operating results and the market price for our shares to fluctuate substantially. While we believe that operating results for any particular quarter are not necessarily a meaningful indication of future results, fluctuations in our quarterly operating results could limit or prevent investors from readily selling their shares and may otherwise negatively affect the market price and liquidity of our shares. In addition, in the past, when the market price of a stock has been volatile, holders of that stock have sometimes instituted securities class action litigation against the company that issued the stock. If any of our shareholders brought a lawsuit against us, we could incur substantial costs defending the lawsuit. Such a lawsuit could also divert the time and attention of our management from our business, which could significantly harm our profitability and reputation.
There may be sales of a substantial amount of our common stock by our current shareholders, and these sales could cause the price of our common stock to fall.
As of February 5, 2015, there were 124,315,113 shares of common stock outstanding. Approximately 41.5% of our outstanding common stock is held by parties to the Shareholders Agreement.
Sales of substantial amounts of our common stock in the public market, or the perception that such sales will occur, could adversely affect the market price of our common stock and make it difficult for us to raise funds through securities offerings in the future.
Shareholders that are a party to an amended and restated registration rights agreement, or the Registration Rights Agreement, may require us to register their shares for resale under the federal securities laws. Under the Registration Rights Agreement, we are required to pay the registration expenses associated with the registration of such shares, not including the underwriting discounts, commissions and transfer taxes. Registration of those shares would allow those shareholders to immediately resell their shares in the public market. Any such sales or the anticipation of such sales may cause the market price of our common stock to decline.
Since we have no current plans to pay regular cash dividends on our common stock, shareholders may not receive any return on investment unless they sell their common stock for a price greater than that which they paid for it.
Although we have previously declared dividends to our shareholders, we do not currently anticipate paying any regular cash dividends on our common stock. Any decision to declare and pay dividends in the future will be made at the discretion of our Board and will depend on, among other things, our results of operations, financial condition, cash requirements, contractual restrictions and other factors that our Board may deem relevant. In addition, our ability to pay dividends is, and may be, limited by covenants of existing and any future outstanding indebtedness we or our subsidiaries incur, including under our existing credit facilities. Therefore, any return on investment in our common stock is solely dependent upon the appreciation of the price of our common stock on the open market, which may not occur. See Part II, Item 5 “Market for Registrant’s Common Equity, Related Stockholder Matters and Issuer Purchases of Equity Securities—Policy” for more detail.
37
The parties to the Shareholders Agreement have significant influence over us, including decisions that require the approval of our shareholders, which could limit your ability to influence the outcome of matters submitted to shareholders for a vote.
The parties to the Shareholders Agreement own approximately 41.5% of the outstanding shares of our common stock. Among other things, the Shareholders Agreement requires such shareholders to vote in favor of certain nominees to our Board. As a result, this group potentially has the ability to influence, or in some situations, possibly control our decisions to enter into any corporate transaction (and the terms thereof) and the ability to prevent any change in the composition of our Board and any transaction that requires shareholder approval regardless of whether others believe that such change or transaction is in our best interests. Additionally, the parties to the Shareholders Agreement are in the business of making investments in companies and may from time to time acquire and hold interests in businesses that compete directly or indirectly with us. One or more of the parties to the Shareholders Agreement may also pursue acquisition opportunities that may be complementary to our business and, as a result, those acquisition opportunities may not be available to us. So long as the parties to the Shareholders Agreement continue to own a significant amount of our equity, if they exercise their shareholder rights collectively, they will be able to significantly influence our decisions.
Our amended and restated articles of incorporation contain a provision renouncing any interest and expectancy in certain corporate opportunities identified by certain of our affiliates, even if such corporate opportunities are ones that we might reasonably be deemed to have pursued or had the ability or desire to pursue.
Our amended and restated articles of incorporation provide for the allocation of certain corporate opportunities between us, on the one hand, and certain of our shareholders, on the other hand. As set forth in our amended and restated articles of incorporation, neither such shareholders, nor any director, officer, shareholder, member, manager, or employee of such shareholders, have any fiduciary duty or any other duty to refrain from engaging, directly or indirectly, in the same business activities or similar business activities or lines of business in which we operate. To the full extent permitted by applicable law, we have renounced any interest or expectancy in, or in being offered an opportunity to participate in, business opportunities that are from time to time presented to certain of our shareholders, even if the opportunity is one that we might reasonably deem to have pursued or had the ability or desire to pursue, if granted, the opportunity to do so, and each such shareholders shall have no duty to communicate or offer such business opportunity to us and, to the fullest extent permitted by applicable law, shall not be liable to us or, to the extent applicable, any of its or their shareholders, for breach of any fiduciary or other duty, as a director or officer or otherwise, by reason of the fact that such shareholders pursues or acquires such business opportunity, directs such business opportunity to another person or fails to present such business opportunity, or information regarding such business opportunity, to us. Therefore, a director or officer of our company who also serves as a director, officer, member, manager, or employee of such shareholders may pursue certain business opportunities, including acquisitions, that may be complementary to our business and, as a result, such opportunities may not be available to us. These potential conflicts of interest could have a material adverse effect on our business, financial condition, results of operations, or prospects if attractive corporate opportunities are allocated by such shareholders to themselves or their other affiliates instead of to us.
Item 1B. Unresolved Staff Comments
None.
As of December 31, 2014, we had approximately 120 offices located in approximately 60 countries. Our executive headquarters is located adjacent to Research Triangle Park, North Carolina. We maintain substantial offices serving Product Development in Durham, North Carolina; Marietta, Georgia; Overland Park, Kansas; Reading, England; West Lothian, Scotland; Centurion, South Africa; Tokyo, Japan; Bangalore, India; and Singapore. We also maintain substantial offices serving Integrated Healthcare Services in Parsippany, New
38
Jersey; Mannheim, Germany; Reading, England; and Tokyo, Japan. We own facilities in Gotemba City, Japan and Barcelona, Spain that serve Product Development and Integrated Healthcare Services. All of our other offices are leased. None of our leases is individually material to our business operations. Many of our leases have an option to renew, and we believe that we will be able to successfully renew expiring leases on terms satisfactory to us. We believe that our facilities are adequate for our operations and that suitable additional space will be available if needed.
We are party to legal proceedings incidental to our business. While the outcome of these matters could differ from management’s expectations, we do not believe that the resolution of these matters is reasonably likely to have a material adverse effect on our financial statements.
Item 4. Mine Safety Disclosures
Not applicable.
39
PART II
Item 5. Market for Registrant’s Common Equity, Related Stockholder Matters and Issuer Purchases of Equity Securities
Market Information for Common Stock
On May 9, 2013, our common stock began trading on the NYSE under the symbol “Q.” Prior to that time, there was no public market for our common stock. The following table sets forth the high and low sales prices per share of our common stock as reported by the NYSE for the periods indicated.
| High | Low | |||||||
| Fiscal Year 2014 |
||||||||
| Fourth Quarter |
$ | 60.79 | $ | 51.09 | ||||
| Third Quarter |
$ | 58.89 | $ | 53.03 | ||||
| Second Quarter |
$ | 53.55 | $ | 46.27 | ||||
| First Quarter |
$ | 55.00 | $ | 45.25 | ||||
| High | Low | |||||||
| Fiscal Year 2013 |
||||||||
| Fourth Quarter |
$ | 46.75 | $ | 40.10 | ||||
| Third Quarter |
$ | 47.50 | $ | 42.25 | ||||
| Second Quarter (from May 9, 2013) |
$ | 46.50 | $ | 41.50 | ||||
Holders of Record
On February 5, 2015, we had approximately 45 shareholders of record. This number does not include beneficial owners for whom shares are held by nominees in street name.
Dividend Policy
We do not currently intend to pay dividends on our common stock, and no dividends were declared or paid in 2014 or 2013. However, we expect to reevaluate our dividend policy on a regular basis and may, subject to compliance with the covenants contained in our credit facilities and other considerations, determine to pay dividends in the future. The declaration, amount and payment of any future dividends on shares of our common stock will be at the sole discretion of our Board, which may take into account general and economic conditions, our financial condition and results of operations, our available cash and current and anticipated cash needs, capital requirements, contractual, legal, tax and regulatory restrictions, the implications of the payment of dividends by us to our shareholders or by our subsidiaries to us, and any other factors that our Board may deem relevant. Our long-term debt arrangements contain usual and customary restrictive covenants that, among other things, place limitations on our ability to declare dividends. For additional information regarding these restrictive covenants, see Part II, Item 7 “Management’s Discussion and Analysis of Financial Condition and Results of Operations—Liquidity and Capital Resources” and Note 10 to our audited consolidated financial statements included elsewhere in this Annual Report on Form 10-K.
Recent Sales of Unregistered Securities
We did not sell any unregistered equity securities in 2014.
40
Purchases of Equity Securities by the Issuer
The following table summarizes the equity repurchase program activity for the three months ended December 31, 2014 and the approximate dollar value of shares that may yet be purchased pursuant to the Repurchase Program (as defined below):
| Period |
Total Number of Shares Purchased |
Average Price Paid per Share |
Total Number of Shares Purchased as Part of Publicly Announced Plans or Programs |
Approximate Dollar Value of Shares That May Yet Be Purchased Under the Plans or Programs(1) |
||||||||||||
| (in thousands, except share and per share data) | ||||||||||||||||
| October 1, 2014 – October 31, 2014 |
— | $ | — | — | $ | 59,486 | ||||||||||
| November 1, 2014 – November 30, 2014 (2) |
4,303,666 | $ | 58.09 | — | $ | 59,486 | ||||||||||
| December 1, 2014 – December 31, 2014 |
— | $ | — | — | $ | 59,486 | ||||||||||
|
|
|
|
|
|||||||||||||
| 4,303,666 | — | |||||||||||||||
|
|
|
|
|
|||||||||||||
| 1. | On October 31, 2013, we announced that on October 30, 2013 our Board approved an equity repurchase program, or the Repurchase Program, authorizing the repurchase of up to $125.0 million of either our common stock or vested in-the-money employee stock options, or a combination thereof. We have used and intend to continue to use cash on hand to fund the Repurchase Program. The Repurchase Program does not obligate us to repurchase any particular amount of common stock or vested in-the-money employee stock options, and it could be modified, suspended or discontinued at any time. The timing and amount of repurchases are determined by our management based on a variety of factors such as the market price of our common stock, our corporate requirements, and overall market conditions. Purchases of our common stock may be made in open market transactions effected through a broker-dealer at prevailing market prices, in block trades, or in privately negotiated transactions. We may also repurchase shares of our common stock pursuant to a trading plan meeting the requirements of Rule 10b5-1 under the Exchange Act, which would permit shares of our common stock to be repurchased when we might otherwise be precluded from doing so by law. Repurchases of vested in-the-money employee stock options were made through transactions between us and our employees (other than our executive officers, who were not eligible to participate in the program), and this aspect of the Repurchase Program expired in November 2013. The Repurchase Program for common stock does not have an end date. |
| 2. | On November 10, 2014, we completed the repurchase of 4,303,666 shares of our common stock for $58.09 per share for an aggregate purchase price of approximately $250.0 million in connection with a secondary offering by certain of our shareholders. We funded this repurchase transaction with a combination of cash on hand and a $150.0 million draw on our revolving credit facility. This repurchase transaction was separate from and in addition to the Repurchase Program. |
Stock Performance Graph
This performance graph shall not be deemed “filed” for purposes of Section 18 of the Exchange Act, or incorporated by reference into any filing of Quintiles Transnational Holdings Inc. under the Exchange Act or under the Securities Act, except as shall be expressly set forth by specific reference in such filing.
41
The following graph shows a comparison from May 9, 2013 (the date our common stock commenced trading on the NYSE) through December 31, 2014 of the cumulative total return for our common stock, the Standard & Poor’s 500 Stock Index, or S&P 500 Index, and the Standard & Poor’s Healthcare Sector Index, or S&P 500 Healthcare. The graph assumes that $100 was invested at the market close on May 9, 2013 in the common stock of Quintiles Transnational Holdings Inc., the S&P 500 Index and the S&P 500 Healthcare, and assumes reinvestments of dividends, if any. The stock price performance of the following graph is not necessarily indicative of future stock price performance.
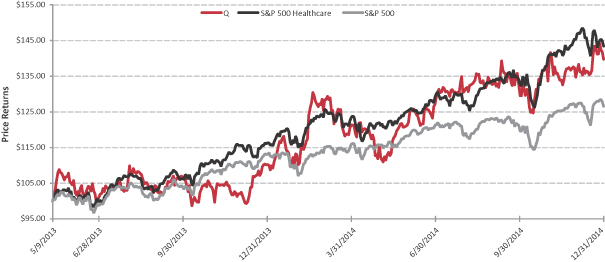
42
Item 6. Selected Financial Data
We have derived the following consolidated statement of income data for 2014, 2013 and 2012 and consolidated balance sheet data as of December 31, 2014 and 2013 from our audited consolidated financial statements included elsewhere in this Annual Report on Form 10-K. We have derived the following consolidated statement of income data for 2011 and 2010 and consolidated balance sheet data as of December 31, 2012, 2011 and 2010 from our audited consolidated financial statements not included in this Annual Report on Form 10-K. You should read the consolidated financial data set forth below in conjunction with our consolidated financial statements and related notes included elsewhere in this Annual Report on Form 10-K and the information under Part II, Item 7, “Management’s Discussion and Analysis of Financial Condition and Results of Operations.” Our historical results are not necessarily indicative of the results we may achieve in any future period.
| Year Ended December 31, | ||||||||||||||||||||
| 2014 | 2013 | 2012 | 2011 | 2010 | ||||||||||||||||
| (in thousands, except per share data) | ||||||||||||||||||||
| Statement of Income Data: |
||||||||||||||||||||
| Service revenues |
$ | 4,165,822 | $ | 3,808,340 | $ | 3,692,298 | $ | 3,294,966 | $ | 3,060,950 | ||||||||||
| Reimbursed expenses |
1,294,176 | 1,291,205 | 1,173,215 | 1,032,782 | 863,070 | |||||||||||||||
|
|
|
|
|
|
|
|
|
|
|
|||||||||||
| Total revenues |
5,459,998 | 5,099,545 | 4,865,513 | 4,327,748 | 3,924,020 | |||||||||||||||
| Costs of revenue, service costs |
2,684,106 | 2,471,426 | 2,459,367 | 2,153,005 | 1,941,767 | |||||||||||||||
| Costs of revenue, reimbursed expenses |
1,294,176 | 1,291,205 | 1,173,215 | 1,032,782 | 863,070 | |||||||||||||||
| Selling, general and administrative |
882,338 | 860,510 | 817,755 | 762,299 | 698,406 | |||||||||||||||
| Restructuring costs |
8,988 | 14,071 | 18,741 | 22,116 | 22,928 | |||||||||||||||
| Impairment charges (1) |
— | — | — | 12,295 | 2,844 | |||||||||||||||
|
|
|
|
|
|
|
|
|
|
|
|||||||||||
| Income from operations |
590,390 | 462,333 | 396,435 | 345,251 | 395,005 | |||||||||||||||
| Interest expense, net |
97,179 | 119,571 | 131,304 | 105,126 | 137,631 | |||||||||||||||
| Loss on extinguishment of debt |
— | 19,831 | 1,275 | 46,377 | — | |||||||||||||||
| Other (income) expense, net |
(8,978 | ) | (185 | ) | (3,572 | ) | 9,073 | 15,647 | ||||||||||||
|
|
|
|
|
|
|
|
|
|
|
|||||||||||
| Income before income taxes and equity in earnings (losses) of unconsolidated affiliates |
502,189 | 323,116 | 267,428 | 184,675 | 241,727 | |||||||||||||||
| Income tax expense |
150,056 | 95,965 | 93,364 | 15,105 | 77,582 | |||||||||||||||
|
|
|
|
|
|
|
|
|
|
|
|||||||||||
| Income before equity in earnings (losses) of unconsolidated affiliates |
352,133 | 227,151 | 174,064 | 169,570 | 164,145 | |||||||||||||||
| Equity in earnings (losses) of unconsolidated affiliates (2) |
4,368 | (1,124 | ) | 2,567 | 70,757 | 1,110 | ||||||||||||||
|
|
|
|
|
|
|
|
|
|
|
|||||||||||
| Net income |
356,501 | 226,027 | 176,631 | 240,327 | 165,255 | |||||||||||||||
| Net (income) loss attributable to noncontrolling interests |
(118 | ) | 564 | 915 | 1,445 | (4,659 | ) | |||||||||||||
|
|
|
|
|
|
|
|
|
|
|
|||||||||||
| Net income attributable to Quintiles Transnational Holdings Inc. |
$ | 356,383 | $ | 226,591 | $ | 177,546 | $ | 241,772 | $ | 160,596 | ||||||||||
|
|
|
|
|
|
|
|
|
|
|
|||||||||||
| Earnings per share attributable to common shareholders: |
||||||||||||||||||||
| Basic |
$ | 2.78 | $ | 1.83 | $ | 1.53 | $ | 2.08 | $ | 1.38 | ||||||||||
| Diluted |
$ | 2.72 | $ | 1.77 | $ | 1.51 | $ | 2.05 | $ | 1.36 | ||||||||||
| Cash dividends declared per common share |
$ | — | $ | — | $ | 4.91 | $ | 2.48 | $ | 0.58 | ||||||||||
| Weighted average common shares outstanding: |
||||||||||||||||||||
| Basic |
127,994 | 124,147 | 115,710 | 116,232 | 116,418 | |||||||||||||||
| Diluted |
131,083 | 127,862 | 117,796 | 117,936 | 118,000 | |||||||||||||||
43
| Year Ended December 31, | ||||||||||||||||||||
| 2014 | 2013 | 2012 | 2011 | 2010 | ||||||||||||||||
| (in thousands) | ||||||||||||||||||||
| Statement of Cash Flow Data: |
||||||||||||||||||||
| Net cash provided by (used in): |
||||||||||||||||||||
| Operating activities |
$ | 431,754 | $ | 393,371 | $ | 335,701 | $ | 160,953 | $ | 378,160 | ||||||||||
| Investing activities |
(173,114 | ) | (236,176 | ) | (132,233 | ) | (224,838 | ) | (141,434 | ) | ||||||||||
| Financing activities |
(130,344 | ) | 70,957 | (146,873 | ) | (59,309 | ) | (153,081 | ) | |||||||||||
| Other Financial Data: |
||||||||||||||||||||
| Capital expenditures |
$ | (82,650 | ) | $ | (88,347 | ) | $ | (71,336 | ) | $ | (75,679 | ) | $ | (80,236 | ) | |||||
| Cash dividends paid to common shareholders |
— | — | (567,851 | ) | (288,322 | ) | (67,493 | ) | ||||||||||||
| Net new business (unaudited) (3) |
5,602,400 | 4,898,900 | 4,501,200 | 4,044,100 | 3,551,500 | |||||||||||||||
| As of December 31, | ||||||||||||||||||||
| 2014 | 2013 | 2012 | 2011 | 2010 | ||||||||||||||||
| (in thousands) | ||||||||||||||||||||
| Balance Sheet Data: |
||||||||||||||||||||
| Cash and cash equivalents |
$ | 867,358 | $ | 778,143 | $ | 567,728 | $ | 516,299 | $ | 646,615 | ||||||||||
| Investments in debt, equity and other securities |
34,503 | 40,349 | 35,951 | 22,106 | 1,557 | |||||||||||||||
| Trade accounts receivable and unbilled services, net |
975,255 | 924,205 | 745,373 | 691,038 | 570,160 | |||||||||||||||
| Property and equipment, net |
190,297 | 199,578 | 193,999 | 185,772 | 184,494 | |||||||||||||||
| Total assets |
3,305,832 | 3,066,797 | 2,499,153 | 2,322,917 | 2,064,887 | |||||||||||||||
| Total long-term liabilities |
2,537,944 | 2,252,035 | 2,549,200 | 2,109,879 | 1,841,537 | |||||||||||||||
| Total debt and capital leases (4) |
2,305,696 | 2,060,994 | 2,444,886 | 1,990,196 | 1,704,896 | |||||||||||||||
| Total shareholders’ deficit |
(704,012 | ) | (667,485 | ) | (1,359,044 | ) | (969,596 | ) | (900,359 | ) | ||||||||||
| Other Financial Data: |
||||||||||||||||||||
| Backlog (unaudited) (3) |
$ | 11,244,400 | $ | 9,855,400 | $ | 8,704,500 | $ | 7,972,900 | $ | 7,115,300 | ||||||||||
| (1) | In 2011, we wrote down $12.2 million related to long-lived assets, and we incurred other than temporary losses of $145,000 related to a non-marketable equity security. In 2010, we incurred other than temporary losses on equity securities of $2.8 million. |
| (2) | In November 2011, we sold our investment in Invida Pharmaceutical Holdings Pte. Ltd. for approximately $103.6 million of net proceeds resulting in a gain of approximately $74.9 million. |
| (3) | Net new business is the value of services awarded during the period from projects under signed contracts, letters of intent and, in some cases, pre-contract commitments that are supported by written communications, adjusted for contracts that were modified or canceled during the period. Consistent with our methodology for calculating net new business during a particular period, backlog represents, at a particular point in time, future service revenues from work not yet completed or performed under signed contracts, letters of intent and, in some cases, pre-contract commitments that are supported by written communications. |
| (4) | Excludes $12.4 million, $15.0 million, $22.9 million, $18.3 million and $8.3 million of unamortized discounts as of December 31, 2014, 2013, 2012, 2011 and 2010, respectively. |
44
Item 7. Management’s Discussion and Analysis of Financial Condition and Results of Operations
You should read the following discussion and analysis of our financial condition and results of operations together with our consolidated financial statements and the related notes included elsewhere in this Annual Report on Form 10-K. Some of the information contained in this discussion and analysis or set forth elsewhere in this Annual Report, including information with respect to our plans and strategy for our business, includes forward-looking statements that involve risks and uncertainties. You should read the “Risk Factors” section of this Annual Report for a discussion of important factors that could cause actual results to differ materially from the results described in or implied by the forward-looking statements contained in the following discussion and analysis.
Overview
Our business is currently organized in two reportable segments, Product Development and Integrated Healthcare Services.
For the year ended December 31, 2014, our service revenues increased $357.5 million, or 9.4%, to $4.2 billion at actual foreign exchange rates compared to 2013. Our growth in service revenues excluding the impact of foreign currency fluctuations (“constant currency”) was $383.2 million, or 10.1%, with $183.2 million, or 6.3%, growth in the Product Development segment and $200.0 million, or 22.5%, growth in the Integrated Healthcare Services segment.
For the year ended December 31, 2014, income from operations was $590.4 million; net income attributable to Quintiles Transnational Holdings Inc. was $356.4 million; and diluted earnings per share was $2.72.
Net new business was $5,602 million for the year ended December 31, 2014. This net new business contributed to an ending backlog of $11,244 million at December 31, 2014. “Net new business” and “backlog” are defined under “Net New Business Reporting and Backlog” in Part I, Item 1, “Business” of this Annual Report on Form 10-K.
Product Development
Product Development provides services and expertise that allow biopharmaceutical companies to outsource the clinical development process from first-in-man trials to post-launch monitoring. Our comprehensive service offerings provide the support and functional expertise necessary at each stage of development, as well as the systems and analytical capabilities to help our customers improve product development efficiency and effectiveness. Product Development is comprised of clinical solutions and services and consulting. Clinical solutions and services provides services necessary to develop biopharmaceutical products. These services include project management and clinical monitoring functions for conducting multi-site trials (generally Phase II-IV) (collectively “core clinical”). These also include clinical trial support services that improve clinical trial decision-making, such as global laboratories, data management, biostatistical, safety and pharmacovigilance, early clinical development trials (generally Phase I), and strategic planning and design services, which help improve decisions and performance. We also provide functional resourcing services that cover a range of areas. Consulting provides strategy and management consulting services based on life science expertise and advanced analytics, as well as regulatory and compliance consulting services.
Integrated Healthcare Services
Integrated Healthcare Services provides a broad array of services including commercial services, such as providing contract pharmaceutical sales forces in key geographic markets, as well as a growing number of healthcare business services for the broader healthcare sector. Our customized commercialization services are designed to accelerate the commercial success of biopharmaceutical and other health-related products. Service offerings include commercial services (sales representatives, strategy, marketing communications and other areas related to commercialization), real-world and late phase research (drug therapy analysis, real-world research and
45
evidence-based medicine, including research studies to prove a drug’s value), other healthcare services (comparative and cost-effectiveness research capabilities, decision support services, medication adherence and health outcome optimization services, and web-based systems for measuring quality improvement), and EHR implementation and advisory services.
On July 1, 2014, we completed the acquisition of Encore for approximately $91.5 million in cash (net of approximately $2.2 million of acquired cash).
Industry Outlook
The potential of the CRO market served by Product Development is primarily a function of two variables: biopharmaceutical R&D spending and the proportion of this spending that is outsourced (outsourcing penetration). We expect outsourced clinical development to CROs to increase 6%-8% annually from 2014 to 2017. Of this annual growth, we believe that up to 2% will be derived from increased R&D expenditures, with the remainder coming from increased outsourcing penetration. We estimate that overall outsourcing penetration in 2014 was 39%. We believe that our customers will continue to outsource a greater part of their activities to transform their value chain away from a vertically integrated model and focus on their core competencies to lower risk and improve return, with a focus on selecting outsourcing partners that are able to demonstrate the ability to provide flexible and efficient delivery models that leverage patient data to help biopharmaceutical companies deliver more effective patient outcomes. We believe that increased demand will create new opportunities for biopharmaceutical services companies, particularly those with a global reach.
Integrated Healthcare Services historically has focused on biopharmaceutical companies seeking to commercialize their products. The total market served by Integrated Healthcare Services is diverse, which makes it difficult to estimate the current amount of outsourced integrated healthcare services and the expected growth in such services. However, based on our knowledge of these markets we believe that, while the rate of outsourcing penetration varies by market within Integrated Healthcare Services, the overall outsourcing penetration of the estimated $98 billion addressable market is approximately 23%. We believe that the market for real-world and late phase research and other healthcare services will evolve and expand, and as a result, there will be opportunities to grow our revenues and expand our service offerings. As business models continue to evolve in the healthcare sector, we believe that the growth rate for outsourcing across the Integrated Healthcare Services markets to increase 6%-8% annually from 2014 to 2017.
Acquisitions
We completed a number of acquisitions in 2012, 2013 and 2014 to enhance our capabilities and offerings in certain areas. In August 2012, we acquired Expression Analysis, Inc. for $39.7 million to enhance our genetic sequencing and advanced bioinformatics expertise. In September 2013, we acquired Novella Clinical Inc., or Novella, for approximately $146.6 million (net of approximately $26.2 million of acquired cash) (with contingent consideration of up to $21.0 million) to complement our clinical service offerings through its focus on emerging companies and by adding expertise in oncology and medical devices. In July 2014, we completed the acquisition of Encore for approximately $91.5 million in cash (net of approximately $2.2 million of acquired cash) to enhance our EHR expertise. See Note 14 to our audited consolidated financial statements found elsewhere in this Annual Report on Form 10-K for additional information with respect to these acquisitions. The results of operations of acquired businesses have been included since the date of acquisition and were not significant to our consolidated results of operations.
Sources of Revenue
Total revenues are comprised of service revenues and revenues from reimbursed expenses. Service revenues primarily include the revenue we earn from providing product development and commercialization services to our customers, with Product Development services representing 74.4% of our 2014 service revenues and
46
Integrated Healthcare Services representing 25.6% of our 2014 service revenues. Reimbursed expenses are comprised principally of payments to physicians (investigators) who oversee clinical trials and travel expenses for our clinical monitors and sales representatives. Reimbursed expenses may fluctuate from period-to-period due, in part, to where we are in the lifecycle of the many contracts that are in progress at a particular point in time. For instance, these pass-through costs tend to be higher during the early phases of clinical trials as a result of patient recruitment efforts. As reimbursed expenses are pass-through costs to our customers with little to no profit and we believe that the fluctuations from period to period are not meaningful to our underlying performance, we do not provide analysis of the fluctuations in these items or their impact on our financial results.
Costs and Expenses
Our costs and expenses are comprised primarily of our costs of revenues and selling, general and administrative expenses.
Our costs of revenues consist of service costs and reimbursed expenses. Service costs include compensation and benefits for billable employees, depreciation of assets used in generating revenue and other expenses directly related to service contracts such as courier fees, laboratory supplies, professional services, travel expenses and the cost of products sold under distribution agreements. As noted above, reimbursed expenses are comprised principally of payments to physicians (investigators) who oversee clinical trials and travel expenses for our clinical monitors and sales representatives.
Selling, general and administrative expenses include costs related to administrative functions including compensation and benefits, travel, professional services, training and expenses for advertising, IT, facilities and depreciation and amortization.
Foreign Currency Fluctuations
The impact from foreign currency fluctuations and constant currency information assumes constant foreign currency exchange rates based on the rates in effect for the comparable prior-year period were used in translation. We believe that providing the impact of fluctuations in foreign currency rates on certain financial results can facilitate analysis of period-to-period comparisons of business performance.
Results of Operations
Year ended December 31, 2014 compared to the year ended December 31, 2013 and the year ended December 31, 2013 compared to the year ended December 31, 2012
Backlog and Net New Business
We began 2014 with backlog of $9,855 million, which was 13% higher than at the beginning of 2013. Backlog at December 31, 2014 was $11,244 million.
Net new business grew 14% in 2014 to $5,602 million from $4,899 million in 2013, driven by growth in both Product Development and Integrated Healthcare Services. Product Development’s net new business increased 16% to $4,374 million in 2014 as compared to $3,772 million in 2013, led by higher growth in net new business for functional resourcing services, which included the renewal of two five-year contracts for clinical services and data management services, growth in net new business for core clinical services in Asia, as well as net new business generated from the Novella acquisition and clinical trial support services, including early clinical development and lifecycle safety. Integrated Healthcare Services’ net new business increased 9% to $1,228 million in 2014 as compared to $1,127 million in 2013, related primarily to growth in commercial services in North America, an increase in new business from real-world and late phase research services, and net new business from the Encore acquisition.
47
Net new business grew 9% in 2013 to $4,899 million from $4,501 million in 2012, driven by growth in both Product Development and Integrated Healthcare Services. Product Development’s net new business increased 9% to $3,772 million in 2013 as compared to $3,474 million in 2012, led by increases in core clinical in North America and Europe (including projects awarded under two sole provider arrangements signed in 2013) and data management services (which benefited from functional resourcing and the sole provider arrangements signed during 2013). Integrated Healthcare Services’ net new business grew 10% in 2013 to $1,127 million from $1,027 million in 2012 due to an increase in North America and Europe.
Our backlog at December 31, 2014 was $11,244 million compared to backlog of $9,855 million at December 31, 2013. Although an increase in backlog will generally result in an increase in revenues to be recognized over time (depending on the level of contract modifications), an increase in backlog at a particular point in time does not necessarily correspond directly to an increase in revenues during a particular period. The extent to which contracts in backlog will result in revenue depends on many factors, including but not limited to delivery against projected schedules, the need for scope changes (change orders), contract cancellations and the nature, duration, size, complexity and phase of the contracts, each of which factors can vary significantly from time to time. Revenue recognition occurs over extended periods of time and is subject to unanticipated delays. Fluctuations in our reported backlog and net new business levels may result from the fact that we may receive a small number of relatively large orders in any given reporting period that may be included in our backlog and net new business. Because of these large orders, our backlog and net new business in that reporting period may reach levels that may not be sustained in subsequent reporting periods. As we increasingly compete for and enter into large contracts that are more global in nature, we expect the rate at which our backlog and net new business convert into revenue to increase, or lengthen. Our $11,244 million of backlog at December 31, 2014 included approximately $7,593 million of backlog that we do not expect to generate revenue in 2015 as compared to our $9,855 million of backlog at December 31, 2013, which included approximately $6,342 million of backlog that we did not expect to generate revenue in 2014. Our ability to grow revenues in the near term at rates comparable to our recent historical results will depend on many factors, including but not limited to the factors affecting the rate at which revenues are derived from backlog, continued growth in net new business that will generate revenue and factors not within our control such as economic conditions and trends in the industry in which we do business.
Service Revenues
| Change | ||||||||||||||||||||||||||||
| Year Ended December 31, | 2014 vs. 2013 | 2013 vs. 2012 | ||||||||||||||||||||||||||
| 2014 | 2013 | 2012 | $ | % | $ | % | ||||||||||||||||||||||
| (dollars in millions) | ||||||||||||||||||||||||||||
| Service revenues |
$ | 4,165.8 | $ | 3,808.3 | $ | 3,692.3 | $ | 357.5 | 9.4 | % | $ | 116.0 | 3.1 | % | ||||||||||||||
In 2014, our service revenues increased $357.5 million, or 9.4%, as compared to 2013. This increase is comprised of constant currency revenue growth of approximately $383.2 million, or 10.1%, offset by a negative impact of approximately $25.7 million from the effects of foreign currency fluctuations. The constant currency service revenue growth, which includes the impact from the Novella and Encore acquisitions, is comprised of a $183.2 million increase in Product Development and a $200.0 million increase in Integrated Healthcare Services.
In 2013, our service revenues increased $116.0 million, or 3.1%, as compared to 2012. This increase is comprised of constant currency revenue growth of approximately $186.6 million, or 5.1%, partially offset by a negative impact of approximately $70.6 million from the effects of foreign currency fluctuations. The constant currency revenue growth, which includes the impact from business combinations completed in 2012 and 2013, is comprised of a $214.6 million increase in Product Development, partially offset by a decrease of $28.0 million in Integrated Healthcare Services.
48
Costs of Revenue, Service Costs
| Year Ended December 31, | ||||||||||||
| 2014 | 2013 | 2012 | ||||||||||
| (dollars in millions) | ||||||||||||
| Costs of revenue, service costs |
$ | 2,684.1 | $ | 2,471.4 | $ | 2,459.4 | ||||||
| % of service revenues |
64.4 | % | 64.9 | % | 66.6 | % | ||||||
When compared to 2013, service costs in 2014 increased $212.7 million. The increase included a constant currency increase in expenses of approximately $253.5 million, or 10.3%, partially offset by a positive impact of approximately $40.8 million from the effects of foreign currency fluctuations. The constant currency service costs growth was due to incremental costs resulting from the Novella and Encore acquisitions and increases in compensation and related expenses due to (1) an increase in billable headcount needed to support our higher volume of revenue, (2) annual merit increases, and (3) a reduction of an accrual for statutory profit sharing of approximately $5.4 million in 2013 as a result of guidance handed down by an administrative court in France. These increases in compensation and related expenses were partially offset by a $10.6 million increase in the benefit from research and development grants primarily from France and Austria as well as efficiencies gained from restructuring activities taken in prior years.
When compared to 2012, service costs in 2013 increased $12.0 million. The increase included a constant currency increase in expenses of approximately $85.0 million, or 3.5%, partially offset by a positive impact of approximately $73.0 million from the effects of foreign currency fluctuations. The constant currency service costs growth was due to annual merit increases in compensation and related expenses, partially offset by cost efficiencies gained from restructuring actions taken in prior years, as well as incremental costs resulting from the business combinations completed in 2012 and 2013. These increases were partially offset by a decline in other expenses directly related to our service contracts, as well as by a reduction of an accrual for statutory profit sharing of approximately $5.4 million in 2013 as a result of guidance handed down by an administrative court in France.
Selling, General and Administrative
| Year Ended December 31, | ||||||||||||
| 2014 | 2013 | 2012 | ||||||||||
| (dollars in millions) | ||||||||||||
| Selling, general and administrative |
$ | 882.3 | $ | 860.5 | $ | 817.8 | ||||||
| % of service revenues |
21.2 | % | 22.6 | % | 22.1 | % | ||||||
The $21.8 million increase in selling, general and administrative expenses in 2014 was due to a constant currency increase of $29.3 million, or 3.4%, partially offset by a decrease of $7.5 million from a positive foreign currency impact. The constant currency increase was primarily due to (1) incremental costs from the Novella and Encore acquisitions, (2) an increase in share-based compensation and (3) increases in compensation and related expenses resulting primarily from annual merit increases and an increase in headcount. These increases were partially offset by expenses incurred in 2013 that did not recur in 2014 including a $25.0 million fee paid in connection with the termination of our management agreement with affiliates of certain of our shareholders, $10.0 million of severance expense associated with cost reduction programs, executive separation costs of approximately $5.3 million, and a $1.5 million fee paid in connection with the modification of an agreement for the business usage of an airplane owned by GF Management Company, LLC, or GFM, a company controlled by our Executive Chairman.
The $42.7 million increase in selling, general and administrative expenses in 2013 was due to a constant currency increase of $59.0 million, or 7.2%, partially offset by a decrease of $16.3 million from a positive foreign currency impact. The constant currency increase was primarily due to (1) expenses incurred related to a
49
$25.0 million fee paid in connection with the termination of our management agreement with affiliates of certain of our shareholders, and a $1.5 million fee paid in connection with the modification of an agreement for the business usage of an airplane owned by GFM, (2) severance accruals of approximately $10.0 million related to overhead cost reduction programs to be carried out in 2014, (3) executive separation costs of approximately $5.3 million, (4) the impact from the business combinations completed in 2012 and 2013, (5) increases in compensation and related expenses resulting primarily from annual merit increases, and (6) growth related increases in facilities costs and depreciation and amortization. These increases were partially offset by lower travel costs, lower share-based compensation and the fact that 2012 included expenses related to a bonus paid to certain option holders in connection with dividends paid to our shareholders (totaling $11.3 million), which did not recur in 2013. The lower share-based compensation was as a result of the fact that expense from recent stock option grants was more than offset by a $13.6 million decline in expense related to the repricing of certain stock options in 2012 that did not recur in 2013.
Restructuring Costs
| Year Ended December 31, | ||||||||||||
| 2014 | 2013 | 2012 | ||||||||||
| (in millions) | ||||||||||||
| Restructuring costs |
$ | 9.0 | $ | 14.1 | $ | 18.7 | ||||||
During 2014, we recognized $9.0 million of restructuring charges, net of reversals for changes in estimates which was primarily related to our 2014 restructuring plans to better align our resources with our strategic direction, which resulted in a reduction of approximately 250 positions. We believe that these plans will result in annualized cost savings of approximately $20.0 to $25.0 million.
During 2013, we recognized $14.1 million of restructuring charges, net of reversals for changes in estimates which was primarily related to our February 2013 restructuring plan to migrate the delivery of services and to reduce anticipated overcapacity in selected areas, which resulted in a reduction of approximately 400 positions. We believe that this plan has resulted in annual cost savings of approximately $15.0 to $20.0 million.
During 2012, we recognized $18.7 million of restructuring charges, net of reversals for changes in estimates which was primarily related to our May 2012 restructuring plan to reduce staffing overcapacity and to rationalize non-billable support roles, which resulted in a reduction of approximately 280 positions, primarily in Europe. We believe that this plan has resulted in annual cost savings of approximately $15.0 to $25.0 million.
Interest Income and Interest Expense
| Year Ended December 31, | ||||||||||||
| 2014 | 2013 | 2012 | ||||||||||
| (in millions) | ||||||||||||
| Interest income |
$ | (3.4 | ) | $ | (3.9 | ) | $ | (3.1 | ) | |||
| Interest expense |
$ | 100.6 | $ | 123.5 | $ | 134.4 | ||||||
Interest income includes interest received from bank balances and investments.
Interest expense during 2014 was lower than 2013 in part due to a decrease in the average rate of interest. The average rate of interest on the term loan under our senior secured credit facility during 2014 was lower than it was during 2013 due to a reduction in the interest rate pursuant to the terms and conditions in the credit agreement as well as from the refinancing transaction we completed in the fourth quarter of 2013. In addition to the lower average rate of interest, interest expense during 2014 also benefited from a decrease in the average debt outstanding as a result of the repayment of the $300.0 million term loan, which Quintiles Transnational Holdings
50
Inc. obtained in February 2012 and paid in full in May 2013, the pay down of $50.0 million of outstanding indebtedness under our senior secured credit facilities in May 2013, the mandatory prepayment of $33.8 million of outstanding indebtedness under our senior secured credit facilities in the first quarter of 2013, and the $25.0 million prepayment of outstanding indebtedness under our senior secured credit facilities in December 2014. These repayments more than offset the impact on the average debt outstanding of the $275.0 million term loan issued under the receivables financing facility in December 2014 and the $150.0 million draw on our line of credit in 2014, which was repaid with the proceeds of the receivables financing facility term loan.
Interest expense for 2013 was lower than 2012 primarily due to a decrease in the average debt outstanding in 2013 compared to 2012 resulting from the repayment of the $300.0 million term loan, which Quintiles Transnational Holdings Inc. obtained in February 2012 and paid in full in May 2013, the pay down of $50.0 million of outstanding indebtedness under our senior secured credit facilities in May 2013, and the mandatory prepayment of $33.8 million of outstanding indebtedness under our senior secured credit facilities in the first quarter of 2013, offset by the increase that resulted from the $175.0 million Term Loan B-1, which our wholly-owned subsidiary, Quintiles Transnational, obtained under the credit agreement governing our senior secured credit facilities in October 2012. In addition, the average rate of interest in 2013 on the term loans under our senior secured credit facilities was lower than it was in 2012 due to (1) a 50 basis point decrease in the interest rate on the Term Loan B-2 beginning in August 2013, pursuant to the terms and conditions in the credit agreement, and (2) the reductions in the interest rate that resulted from the refinancing transactions in the fourth quarters of 2012 and 2013.
Loss on Extinguishment of Debt
| Year Ended December 31, | ||||||||||||
| 2014 | 2013 | 2012 | ||||||||||
| (in millions) | ||||||||||||
| Loss on extinguishment of debt |
$ | — | $ | 19.8 | $ | 1.3 | ||||||
In December 2013, we recognized a $3.3 million loss on extinguishment of debt on a portion of the debt retired related to the refinancing of our senior secured credit facilities. The loss on extinguishment of debt included $1.6 million of unamortized debt issuance costs, $1.6 million of unamortized discount and $25,000 of fees and expenses.
In May 2013, we recognized a $16.5 million loss on extinguishment of debt related to payment of all amounts outstanding under the $300.0 million term loan and a $50.0 million pay down of outstanding indebtedness under our senior secured credit facilities. The loss on extinguishment of debt included $5.6 million of unamortized debt issuance costs, $4.8 million of unamortized discount and $6.1 million of fees and expenses.
In 2012, we recognized a $1.3 million loss on extinguishment of debt on a portion of the debt retired related to our 2012 refinancing. The loss on extinguishment of debt included $634,000 of unamortized debt issuance costs, $631,000 of unamortized discount and $10,000 of fees and expenses.
See “—Liquidity and Capital Resources” for more information on these transactions.
Other (Income) Expense, Net
| Year Ended December 31, | ||||||||||||
| 2014 | 2013 | 2012 | ||||||||||
| (in millions) | ||||||||||||
| Other (income) expense, net |
$ | (9.0 | ) | $ | (0.2 | ) | $ | (3.6 | ) | |||
51
Other (income) expense, net for 2014 included income of approximately $8.6 million due to changes in the estimated fair value of contingent consideration from an acquisition as well as a gain from the sale of marketable equity securities of approximately $5.0 million, partially offset by other expenses, primarily consisting of $4.9 million of foreign currency net losses.
Other (income) expense, net for 2013 included income of approximately $3.5 million due to changes in the estimated fair value of contingent consideration for two of our acquisitions completed in 2011. In addition, 2013 included approximately $4.0 million of foreign currency net losses.
Other (income) expense, net for 2012 included income of approximately $4.6 million due to changes in the estimated fair value of contingent consideration for two of our acquisitions completed in 2011. In addition, 2012 included approximately $1.1 million of foreign currency net losses.
Income Tax Expense
| Year Ended December 31, | ||||||||||||
| 2014 | 2013 | 2012 | ||||||||||
| (dollars in millions) | ||||||||||||
| Income tax expense |
$ | 150.1 | $ | 96.0 | $ | 93.4 | ||||||
| Effective income tax rate |
29.9 | % | 29.7 | % | 34.9 | % | ||||||
The effective income tax rate for 2013 was negatively impacted by the settlement of certain intercompany notes in 2013 that had previously been considered long-term investments, which resulted in $11.1 million of income tax expense. This negative impact was primarily offset by our change in assertion regarding the undistributed earnings of most of our foreign subsidiaries that are considered to be indefinitely reinvested outside of the United States. Prior to June 2013, we had not considered the majority of the undistributed earnings of our foreign subsidiaries to be indefinitely reinvested. Accordingly, 2012 was negatively impacted by income taxes provided on most of the earnings of the foreign subsidiaries, as a deferred income tax liability was recorded for the anticipated income tax costs of repatriating those earnings in the future. We reevaluated this assertion following the IPO, as a portion of the IPO proceeds were used to pay down debt held in the United States as well as the fact we do not anticipate paying dividends in the foreseeable future, which had been significant in the past. Given our current debt balance, and related interest expense and the change in approach related to payment of dividends, we expect to be able to support the cash needs of our domestic subsidiaries without repatriating cash from the affected foreign subsidiaries. We expect to utilize the cash generated outside of the United States to fund growth outside of the United States. As a result of the assertion change, we recorded an $8.1 million income tax benefit in the second quarter of 2013 to reverse the deferred income tax liability previously recorded on undistributed foreign earnings prior to 2013 that are now considered indefinitely reinvested outside of the United States.
Equity in Earnings (Losses) of Unconsolidated Affiliates
| Year Ended December 31, | ||||||||||||
| 2014 | 2013 | 2012 | ||||||||||
| (in millions) | ||||||||||||
| Equity in earnings (losses) of unconsolidated affiliates |
$ | 4.4 | $ | (1.1 | ) | $ | 2.6 | |||||
Equity in earnings (losses) of unconsolidated affiliates in 2014 increased as compared to 2013 primarily due to gains from our investment in the NovaQuest Pharma Opportunities Fund III, L.P., partially offset by losses and write-downs incurred on another equity method investment.
52
Segments
Service revenues and income from operations by segment are as follows (dollars in millions):
| Service Revenues | Income from Operations | Operating Profit Margin | ||||||||||||||||||||||||||||||||||
| 2014 | 2013 | 2012 | 2014 | 2013 | 2012 | 2014 | 2013 | 2012 | ||||||||||||||||||||||||||||
| Product Development |
$ | 3,097.8 | $ | 2,919.7 | $ | 2,728.7 | $ | 645.2 | $ | 562.3 | $ | 477.9 | 20.8 | % | 19.3 | % | 17.5 | % | ||||||||||||||||||
| Integrated Healthcare Services |
1,068.0 | 888.6 | 963.6 | 64.8 | 42.1 | 60.5 | 6.1 | 4.7 | 6.3 | |||||||||||||||||||||||||||
|
|
|
|
|
|
|
|
|
|
|
|
|
|||||||||||||||||||||||||
| Total segments |
4,165.8 | 3,808.3 | 3,692.3 | 710.0 | 604.4 | 538.4 | 17.0 | % | 15.9 | % | 14.6 | % | ||||||||||||||||||||||||
| General corporate and unallocated |
(110.6 | ) | (128.0 | ) | (123.3 | ) | ||||||||||||||||||||||||||||||
| Restructuring costs |
(9.0 | ) | (14.1 | ) | (18.7 | ) | ||||||||||||||||||||||||||||||
|
|
|
|
|
|
|
|
|
|
|
|
|
|||||||||||||||||||||||||
| Consolidated |
$ | 4,165.8 | $ | 3,808.3 | $ | 3,692.3 | $ | 590.4 | $ | 462.3 | $ | 396.4 | ||||||||||||||||||||||||
|
|
|
|
|
|
|
|
|
|
|
|
|
|||||||||||||||||||||||||
Certain costs are not allocated to our segments and are reported as general corporate and unallocated expenses. These costs primarily consist of share-based compensation and expenses for corporate office functions such as senior leadership, finance, human resources, IT, facilities and legal, as well as certain expenses incurred in the second quarter of 2013 including the $25.0 million fee incurred in connection with the termination of the management agreement with affiliates of certain shareholders and the $1.5 million fee paid in connection with the modification of an agreement for the business usage of an airplane owned by GFM. We do not allocate restructuring or impairment charges to our segments.
Product Development
| Change | ||||||||||||||||||||||||||||
| 2014 | 2013 | 2012 | 2014 vs. 2013 | 2013 vs. 2012 | ||||||||||||||||||||||||
| (dollars in millions) | ||||||||||||||||||||||||||||
| Service revenues |
$ | 3,097.8 | $ | 2,919.7 | $ | 2,728.7 | $ | 178.1 | 6.1 | % | $ | 191.0 | 7.0 | % | ||||||||||||||
| Costs of revenue, service costs |
1,820.9 | 1,752.8 | 1,683.3 | 68.1 | 3.9 | 69.5 | 4.1 | |||||||||||||||||||||
| as a percentage of service revenues |
58.8 | % | 60.0 | % | 61.7 | % | ||||||||||||||||||||||
| Selling, general and administrative |
631.7 | 604.6 | 567.5 | 27.1 | 4.5 | 37.1 | 6.5 | |||||||||||||||||||||
| as a percentage of service revenues |
20.4 | % | 20.7 | % | 20.8 | % | ||||||||||||||||||||||
|
|
|
|
|
|
|
|
|
|
|
|
|
|
|
|||||||||||||||
| Segment income from operations |
$ | 645.2 | $ | 562.3 | $ | 477.9 | $ | 82.9 | 14.8 | % | $ | 84.4 | 17.7 | % | ||||||||||||||
|
|
|
|
|
|
|
|
|
|
|
|
|
|
|
|||||||||||||||
| as a percentage of service revenues |
20.8 | % | 19.3 | % | 17.5 | % | ||||||||||||||||||||||
Service Revenues
2014 compared to 2013
Product Development’s service revenues were $3.1 billion in 2014, an increase of $178.1 million, or 6.1%, over 2013. This increase was comprised of constant currency service revenue growth of $183.2 million, or 6.3%, offset by a negative impact of approximately $5.1 million from the effects of foreign currency fluctuations. The constant currency service revenue growth was primarily a result of a volume-related increase of $100.2 million in clinical solutions and services and $89.6 million from the Novella acquisition, which were partially offset by a decrease of $6.6 from consulting services.
The volume-related service revenue growth was primarily from clinical solutions and services and was related to an increase in clinical solutions provided on a functional resource basis, clinical trial support services, core clinical services in Asia and Japan, and global laboratories services. This growth was due largely to execution on the higher backlog in place as we entered 2014. The rate of year-over-year revenue growth was negatively impacted by the wind-down of a large clinical solutions project delivered throughout 2013.
53
2013 compared to 2012
Product Development’s service revenues were $2.9 billion in 2013, an increase of $191.0 million, or 7.0%, over 2012. This increase is comprised of constant currency service revenue growth of $214.6 million, or 7.9%, partially offset by a negative impact of approximately $23.6 million due to the effect of foreign currency fluctuations. The constant currency service revenue growth was primarily a result of a volume-related increase of $191.4 million in clinical solutions and services and $52.4 million from businesses acquired in the third quarters of 2012 and 2013, which were partially offset by a decrease of $29.2 million from consulting services.
Our clinical solutions and services growth for 2013 was concentrated in Europe and the Americas. This growth was due largely to growth in the overall market as well as a consistent history of year-over-year growth in net new business, including strong inflow of net new business in 2013. This growth was tempered by a decrease in service revenues from consulting services resulting primarily from the winding down of a project assisting a customer on a regulatory compliance matter, and from a large clinical solutions project on which we were executing in 2012 and 2013, but that was winding down in 2013.
Costs of Revenue, Service Costs
2014 compared to 2013
Product Development’s service costs increased approximately $68.1 million in 2014 over 2013. This increase was comprised of a $94.0 million constant currency increase, or 5.4%, partially offset by a reduction of $25.9 million from the positive effect of foreign currency fluctuations. The constant currency service costs growth was due to (1) incremental costs resulting from the Novella acquisition, (2) an increase in billable headcount and other expenses directly related to our service contracts to support our higher volume of revenue, and (3) a reduction of an accrual for statutory profit sharing of approximately $5.4 million in 2013 as a result of guidance handed down by an administrative court in France. These increases in service costs were partially offset by a $10.6 million increase in the benefit from research and development grants primarily from France and Austria as well as efficiencies gained from restructuring activities taken in prior years. As a percent of service revenues, Product Development’s service costs were 58.8% and 60.0% in 2014 and 2013, respectively. The decrease in service costs as a percentage of service revenues was primarily a result of a closer alignment of resources with project requirements, including cost efficiencies gained from restructuring actions taken in prior years.
2013 compared to 2012
Product Development’s service costs were higher by approximately $69.5 million in 2013, which was comprised of a $105.9 million constant currency increase, or 6.3%, partially offset by a reduction of $36.4 million from the positive effect of foreign currency fluctuations. The constant currency service costs growth was due to increases in compensation and related expenses resulting from an increase in billable headcount needed to support our higher volume of revenue as well as annual merit increases in compensation, partially offset by cost efficiencies gained from restructuring actions taken in prior years and incremental costs resulting from the business combinations completed in 2012 and 2013. The increase in compensation and related expenses was partially offset by a reduction of an accrual for statutory profit sharing of approximately $5.4 million in 2013 as a result of guidance handed down by an administrative court in France and lower third party and travel costs. As a percent of service revenues, Product Development’s service costs were 60.0% and 61.7% in 2013 and 2012, respectively. The decrease in service costs as a percentage of service revenues was primarily a result of a closer alignment of resources with project requirements, including cost efficiencies gained from restructuring actions taken in prior years, as well as the impact related to the profit sharing accrual reversal in Europe.
Selling, General and Administrative
2014 compared to 2013
As a percent of service revenues, Product Development’s selling, general and administrative expenses were 20.4% and 20.7% in 2014 and 2013, respectively. Product Development’s selling, general and administrative
54
expenses increased approximately $27.1 million, or 4.5%, in 2014 as compared to 2013. This increase was primarily caused by the impact from the Novella acquisition, increases in compensation and related expenses resulting from annual merit increases and an increase in headcount, and a growth related increase in IT costs. These increases were partially offset by $8.4 million of costs incurred in 2013 that did not recur in 2014 for severance associated with cost reduction programs as well as a positive impact of approximately $6.5 million from the effects of foreign currency fluctuations.
2013 compared to 2012
As a percent of service revenues, Product Development’s selling, general and administrative expenses were 20.7% and 20.8% in 2013 and 2012, respectively. Product Development’s selling, general and administrative expenses increased approximately $37.1 million in 2013 as compared to 2012. This increase was primarily caused by increases in compensation and related expenses resulting from annual merit increases, facilities costs, depreciation and amortization, incremental costs for severance accruals of approximately $8.4 million related to overhead cost reduction programs, and the impact from the business combinations completed in 2012 and 2013. These increases were partially offset by a positive foreign currency impact of approximately $11.2 million.
Integrated Healthcare Services
| Change | ||||||||||||||||||||||||||||
| 2014 | 2013 | 2012 | 2014 vs. 2013 | 2013 vs. 2012 | ||||||||||||||||||||||||
| (dollars in millions) | ||||||||||||||||||||||||||||
| Service revenues |
$ | 1,068.0 | $ | 888.6 | $ | 963.6 | $ | 179.4 | 20.2 | % | $ | (75.0 | ) | (7.8 | %) | |||||||||||||
| Costs of revenue, service costs |
863.2 | 718.6 | 776.0 | 144.6 | 20.1 | (57.4 | ) | (7.4 | ) | |||||||||||||||||||
| as a percentage of service revenues |
80.8 | % | 80.9 | % | 80.5 | % | ||||||||||||||||||||||
| Selling, general and administrative |
140.0 | 127.9 | 127.1 | 12.1 | 9.5 | 0.8 | 0.6 | |||||||||||||||||||||
| as a percentage of service revenues |
13.1 | % | 14.4 | % | 13.2 | % | ||||||||||||||||||||||
|
|
|
|
|
|
|
|
|
|
|
|
|
|
|
|||||||||||||||
| Segment income from operations |
$ | 64.8 | $ | 42.1 | $ | 60.5 | $ | 22.7 | 53.8 | % | $ | (18.4 | ) | (30.4 | %) | |||||||||||||
|
|
|
|
|
|
|
|
|
|
|
|
|
|
|
|||||||||||||||
| as a percentage of service revenues |
6.1 | % | 4.7 | % | 6.3 | % | ||||||||||||||||||||||
Service Revenues
2014 compared to 2013
Integrated Healthcare Services’ service revenues were $1.1 billion in 2014, an increase of $179.4 million, or 20.2%, compared to 2013. This increase is comprised of constant currency service revenue growth of $200.0 million, or 22.5%, partially offset by a negative impact of approximately $20.6 million due to the effect of foreign currency fluctuations. The increase in constant currency service revenues was driven by $35.4 million from the Encore acquisition and an increase in commercial services in North America and Japan, as well as growth in real-world and late phase research services. These increases were partially offset by a decline in Europe due to lower revenue from an agreement to distribute pharmaceutical products in Italy as well as lower commercial services revenues. The agreement to distribute pharmaceutical products in Italy ended in the fourth quarter of 2014.
2013 compared to 2012
Integrated Healthcare Services’ service revenues were $888.6 million in 2013, a decrease of $75.0 million, or 7.8%, compared to 2012. This decrease was primarily due to a negative impact of approximately $47.0 million due to the effect of foreign currency fluctuations coupled with a constant currency service revenue decrease of $28.0 million, or 2.9%. The decline in constant currency service revenues occurred primarily in commercial services in North America as revenues generated from strong new business in 2013 had not yet reached a level sufficient to offset the impact from scope reductions and cancellations that occurred in prior periods.
55
Costs of Revenue, Service Costs
2014 compared to 2013
Integrated Healthcare Services’ service costs in 2014 increased approximately $144.6 million as compared to 2013. This increase was comprised of a $159.5 million constant currency increase, or 22.2%, partially offset by a reduction of $14.9 million from the positive effect of foreign currency fluctuations. The constant currency increase was primarily due to the impact from the Encore acquisition and increases in compensation and related expenses resulting from an increase in billable headcount needed to support the higher volume of revenue and annual merit compensation increases. These increases in compensation and related expenses were partially offset by a decline in other expenses directly related to the agreement to distribute pharmaceutical products in Italy, which ended in the fourth quarter of 2014.
2013 compared to 2012
Integrated Healthcare Services’ service costs in 2013 were lower by approximately $57.4 million as compared to 2012. This decrease was comprised of a reduction of $36.6 million from a positive impact of foreign currency fluctuations and a $20.8 million constant currency decrease. The constant currency decrease was primarily related to a decrease in compensation and related expenses driven mainly by a decrease in billable headcount.
Selling, General and Administrative
2014 compared to 2013
Integrated Healthcare Services’ selling, general and administrative expenses in 2014 were higher as compared to 2013 primarily caused by the impact from the Encore acquisition and higher compensation and related expenses. The increase in compensation and related expenses resulted from annual merit increases and an increase in headcount. These increases were partially offset by $1.6 million of costs incurred in 2013 that did not recur in 2014 for severance associated with cost reduction programs as well as a positive impact of approximately $900,000 from the effects of foreign currency fluctuations.
2013 compared to 2012
Integrated Healthcare Services’ selling, general and administrative expenses in 2013 were slightly higher as compared to 2012 primarily due to higher compensation and related expenses, IT costs, and facility costs as well as severance of approximately $1.6 million related to overhead cost reduction programs. These increases were mostly offset by lower depreciation and amortization expense and a reduction of approximately $4.1 million from the positive effect of foreign currency fluctuations.
Liquidity and Capital Resources
Overview
We assess our liquidity in terms of our ability to generate cash to fund our operating, investing and financing activities. Our principal source of liquidity is operating cash flows. In addition to operating cash flows, other significant factors that affect our overall management of liquidity include: capital expenditures, acquisitions, investments, debt service requirements, dividends, equity repurchases, adequacy of our revolving credit facility and access to the capital markets.
We manage our worldwide cash requirements by monitoring the funds available among our subsidiaries and determining the extent to which those funds can be accessed on a cost effective basis. The repatriation of cash balances from certain of our subsidiaries could have adverse income tax consequences. In 2013, we changed our assertion regarding the earnings of most of our foreign subsidiaries and now consider them indefinitely reinvested outside of the United States. Making this assertion limits our ability to repatriate cash from our foreign
56
subsidiaries for the foreseeable future. In making this assertion, we determined that the cash flows expected to be generated in the United States should be sufficient to fund our operating requirements and debt service obligations in the United States and that we intend to use the cash generated by the affected foreign subsidiaries to fund growth outside of the United States. A future distribution or change in this assertion could result in additional tax liability.
We had a cash balance of $867.4 million at December 31, 2014 ($210.9 million of which was in the United States), an increase from $778.1 million at December 31, 2013.
On May 14, 2013, we completed the IPO of our common stock at a price to the public of $40.00 per share. We issued and sold 13,125,000 shares of common stock in the IPO and received proceeds of approximately $489.6 million, after deducting underwriting discounts, commissions and related expenses. We used the net proceeds from the IPO as follows: (1) we repaid approximately $358.9 million of debt, including accrued interest and related fees and expenses, (2) we paid a one-time fee of $25.0 million to terminate our management agreement with our private equity sponsors, and (3) we used the remaining portion of the net proceeds, together with cash on hand, to complete the acquisition of Novella for approximately $146.6 million in cash (net of approximately $26.2 million of acquired cash).
On October 30, 2013, our Board approved the Repurchase Program authorizing the repurchase of up to $125.0 million of either our common stock or vested in-the-money employee stock options, or a combination thereof. Through December 31, 2014, we have used $65.5 million of cash to purchase $59.1 million of stock options and $6.4 million of common stock under the Repurchase Program. We have used and intend to continue to use cash on hand to fund the Repurchase Program. The Repurchase Program does not obligate us to repurchase any particular amount of common stock or vested in-the-money employee stock options and it can be modified, suspended or discontinued at any time. Repurchases of vested in-the-money employee stock options were made through transactions between us and our employees (other than our executive officers, who were not eligible to participate in the program) and this aspect of the Repurchase Program expired in November 2013. The Repurchase Program for common stock does not have an end date. Additional information regarding the Repurchase Program is presented in Part II, Item 5 “Market for Registrant’s Common Equity, Related Stockholder Matters and Issuer Purchases of Equity Securities” and Note 12 to our audited consolidated financial statements included elsewhere in this Annual Report on Form 10-K.
On May 28, 2014, we completed the repurchase of 3,287,209 shares of our common stock for $50.23 per share from TPG Quintiles Holdco, L.P., one of our existing shareholders, in a private transaction for an aggregate purchase price of approximately $165.1 million. The repurchase price per share of common stock was equal to 98% of the closing market price of our common stock on the NYSE on May 27, 2014 (which was $51.26). We funded this private repurchase transaction with cash on hand. This private repurchase transaction was separate from and in addition to the Repurchase Program.
On July 1, 2014, we completed the acquisition of Encore for approximately $91.5 million in cash (net of approximately $2.2 million of acquired cash). Encore has operations in the United States, and its business is primarily focused on providing EHR implementation and advisory services to healthcare providers.
On November 10, 2014, we completed the repurchase of 4,303,666 shares of our common stock for $58.09 per share for an aggregate purchase price of approximately $250.0 million. We funded this repurchase transaction with a combination of cash on hand and a $150.0 million draw on our revolving credit facility. This repurchase transaction was separate from and in addition to the Repurchase Program.
Based on our current operating plan, we believe that our available cash and cash equivalents, future cash flows from operations and our ability to access funds under our revolving credit and receivables financing facility will enable us to fund our operating requirements and capital expenditures and meet debt obligations for at least the next 12 months. We regularly evaluate our debt arrangements, as well as market conditions, and from time to time we may explore opportunities to modify our existing debt arrangements or pursue additional financing arrangements that could result in the issuance of new debt securities by us or our affiliates. We may use our existing cash, cash generated from operations or dispositions of assets or businesses and/or proceeds from any
57
new financing arrangements or issuances of debt or equity securities to repay or reduce some of our outstanding obligations, to repurchase shares from our shareholders or for other purposes. As part of our ongoing business strategy, we also are continually evaluating new acquisition, expansion and investment possibilities or other strategic growth opportunities, as well as potential dispositions of assets or businesses, as appropriate, including dispositions that may cause us to recognize a loss on certain assets. Should we elect to pursue any such transaction, we may seek to obtain debt or equity financing to facilitate those activities. Our ability to enter into any such potential transactions and our use of cash or proceeds is limited to varying degrees by the terms and restrictions contained in our senior secured credit facilities. We cannot provide assurances that we will be able to complete any such alternative financing arrangements or other transactions on favorable terms or at all.
Senior Secured Credit Agreement
On December 20, 2013, we entered into an amendment to our senior secured credit agreement to provide a new Term Loan B-3 with a syndicate of banks for an aggregate principal amount of $2.061 billion due in 2018. The proceeds from the Term Loan B-3 were used to repay the then outstanding balances of the Term Loan B-1 and Term Loan B-2 and related fees and expenses. The Term Loan B-3 bears interest at the greater of LIBOR or 1.25% plus 2.5%, which is 75 and 25 basis points lower than the interest rates that were in effect on the retired Term Loan B-1 and Term Loan B-2, respectively. Quarterly principal payments on the Term Loan B-3 are $5.15 million, which commenced on September 30, 2014 and continue through March 31, 2018, with the balance of the Term Loan B-3 to be repaid at final maturity on June 8, 2018. Optional prepayments of the Term Loan B-3 are applied to reduce principal payments in direct order of maturity. The credit facility arrangements are collateralized by substantially all of the assets of Quintiles Transnational and the assets of Quintiles Transnational’s domestic subsidiaries including 100% of the equity interests of substantially all of Quintiles Transnational’s domestic subsidiaries and 65% of the equity interests of substantially all of the first-tier foreign subsidiaries of Quintiles Transnational and its domestic subsidiaries (in each case other than certain excluded subsidiaries as defined in the credit agreement). Beginning with fiscal year ending December 31, 2014, we are required to apply 50% of excess cash flow (as defined in the credit agreement), subject to a reduction to 25% or 0% depending upon Quintiles Transnational’s total leverage ratio, for prepayment of the Term Loan B-3, with any such prepayment to be applied, first, in direct order of maturities, to reduce the Term Loan B-3 principal payments due within eight quarters of such prepayment, then on a pro rata basis to reduce the other principal payments due prior to the maturity date, and then to reduce the principal payments due on the maturity date. The amendment also provided additional flexibility for us to enter into certain securitization financing transactions such as the receivables financing facility transaction we entered into in December 2014. Other terms and covenants of the Term Loan B-3 are the same as the terms and covenants of our Term Loan B-1 and Term Loan B-2 prior to the amendment. In connection with this amendment to the credit agreement, in 2013 we recognized a $3.3 million loss on extinguishment of debt which included approximately $1.6 million of unamortized debt issuance costs, approximately $1.6 million of unamortized discount and approximately $25,000 of related fees and expenses.
On November 7, 2014, we entered into an amendment to our senior secured credit agreement that increased our first lien revolving credit facility from $300.0 million to $400.0 million and extended the maturity date for most of the first lien revolving credit facility by six months. The $100.0 million increase will mature in December 2017 along with $282.5 million of the existing $300.0 million first lien revolving credit facility. In addition, the maturity date for the aggregate of $382.5 million of the first lien revolving credit facility may be further extended to June 2019 without lender consent in connection with certain extensions of the maturity date of the Term Loan B-3 under the senior secured credit facilities. The maturity date for the remaining $17.5 million of the existing $300.0 million first lien revolving credit facility was not altered and continues to be June 2017. The other terms of the senior secured credit agreement were not altered by the amendment.
Receivables Financing Facility
On December 5, 2014, we entered into a four-year arrangement to securitize certain of our accounts receivable. Under the receivables financing facility, certain of our accounts receivable are sold on a non-recourse
58
basis by certain of our consolidated subsidiaries to another of our consolidated subsidiaries, a bankruptcy-remote special purpose entity, or SPE. The SPE obtained a term loan and revolving loan commitment from a third party lender, secured by liens on the assets of the SPE, to finance the purchase of the accounts receivable, which included a $275.0 million term loan and a $25.0 million revolving loan commitment. The revolving loan commitment may be increased by an additional $35.0 million as amounts are repaid under the term loan. Quintiles Transnational has guaranteed the performance of the obligations of existing and future subsidiaries that sell and service the accounts receivable under the receivables financing facility. The assets of the SPE are not available to satisfy any of our obligations or any obligations of our subsidiaries. The interest rate under the receivables financing facility is a reserve-adjusted LIBOR rate for amounts outstanding on the term loan and a reserve-adjusted LIBOR market index rate for amounts outstanding on the revolving loan. Interest is payable monthly. As of December 31, 2014, the full $25.0 million of revolving loan commitment was available under the receivables financing facility. We used the proceeds from the term loan under the receivables financing facility to repay in full the amount outstanding on the revolving credit facility under our senior secured credit agreement ($150.0 million), to repay $25.0 million of the Term Loan B-3 under our senior secured credit agreement, to pay related fees and expenses and the remainder was used for general working capital purposes.
Restrictive Covenants
The credit agreement governing the Quintiles Transnational senior secured credit facilities contains usual and customary restrictive covenants (subject to significant exceptions) that place limitations on Quintiles Transnational’s ability, and the ability of Quintiles Transnational’s restricted subsidiaries, to incur liens; engage in acquisitions, loans and other investments; incur additional indebtedness; merge, dissolve, liquidate or consolidate with or into other persons; sell or otherwise dispose of assets; declare dividends, including to Quintiles Holdings, and make other restricted payments; engage in businesses that are not related to Quintiles Transnational’s and its restricted subsidiaries’ existing business; transact with affiliates; enter into agreements that restrict subsidiaries from paying intercompany dividends or completing intercompany property transfers or that restrict the ability to create liens in favor of Quintiles Transnational’s lenders; amend or otherwise modify organizational documents or terms and conditions of junior financing documents, if any; change the fiscal year of Quintiles Transnational; prepay, redeem or purchase junior financing, if any; designate any other indebtedness as “designated senior indebtedness” or “senior secured financing”; and engage in sale and leaseback transactions. The credit agreement also contains one financial covenant, which is a total leverage ratio financial covenant that provides for a maximum ratio of consolidated debt, as defined in the credit agreement, to consolidated EBITDA, as defined in the credit agreement, for any period of four consecutive fiscal quarters, measured as of the end of such period, of 5.50 to 1.00 in 2013, 5.25 to 1.00 in 2014, 5.00 to 1.00 in 2015, and 4.75 to 1.00 in 2016 and thereafter, and applies at any time Quintiles Transnational makes a revolving loan borrowing, a swingline loan borrowing or issues a letter of credit, and for so long as any revolving loan, swingline loan, unreimbursed drawing under any letter of credit or undrawn letter of credit remains outstanding. In 2014, 2013 and 2012, we believe we were in compliance with our debt covenants.
The agreement governing the receivables financing facility contains certain usual and customary covenants and termination events for a securitization transaction, including certain financial reporting covenants and requirements to maintain the existence of the SPE separate from Quintiles Transnational and its other affiliates. An occurrence of an event of default or a termination event under this facility may give rise to the right of the third party lender to terminate this facility.
See Note 10 to our audited consolidated financial statements included elsewhere in this Annual Report on Form 10-K for additional details regarding our credit arrangements.
59
Years ended December 31, 2014, 2013 and 2012
Cash Flow from Operating Activities
| Year Ended December 31, | ||||||||||||
| 2014 | 2013 | 2012 | ||||||||||
| (in millions) | ||||||||||||
| Net cash provided by operating activities |
$ | 431.8 | $ | 393.4 | $ | 335.7 | ||||||
2014 compared to 2013
Cash provided by operating activities increased by $38.4 million in 2014 as compared to 2013. The increase in operating cash flow reflects an increase in net income, lower payments for interest ($21.6 million), and lower cash used in days sales outstanding, or DSO, ($21.1 million) in 2014 as compared to 2013. This lower cash used in DSO reflects a two-day increase in DSO in 2014 compared to a five-day increase in 2013. DSO can shift significantly at each reporting period depending on the timing of cash receipts under contractual payment terms relative to the recognition of revenue over a project lifecycle. In addition, net income for 2013 included cash expenses totaling $32.5 million for a fee paid in connection with the termination of our management agreement with affiliates of certain of our shareholders ($25.0 million), a fee paid in connection with the modification of an agreement for the business usage of an airplane owned by GFM ($1.5 million), and a termination fee for the repayment of the $300.0 million term loan ($6.0 million), which did not recur in 2014. These increases in operating cash flow were partially offset by higher payments for income taxes ($67.9 million) and higher cash used for incentive compensation.
2013 compared to 2012
Cash provided by operating activities increased by $57.7 million in 2013 as compared to 2012. The increase in operating cash flow reflects lower payments for income taxes ($33.0 million) and interest ($11.6 million) in 2013. In addition, net income increased despite including cash expenses totaling $32.5 million for a fee paid in connection with the termination of our management agreement with affiliates of certain of our shareholders ($25.0 million), a fee paid in connection with the modification of an agreement for the business usage of an airplane owned by GFM ($1.5 million), and a termination fee for the repayment of the $300.0 million term loan ($6.0 million). These improvements in operating cash flow were partially offset by higher cash used in DSO ($74.1 million). This higher cash used reflected a five-day increase in DSO in 2013. The net impact on cash from the increase in DSO resulted from the fact that we have continued to experience a trend toward longer payment terms on our contracts.
Cash Flow from Investing Activities
| Year Ended December 31, | ||||||||||||
| 2014 | 2013 | 2012 | ||||||||||
| (in millions) | ||||||||||||
| Net cash used in investing activities |
$ | (173.1 | ) | $ | (236.2 | ) | $ | (132.2 | ) | |||
2014 compared to 2013
Cash used in investing activities decreased by $63.1 million to $173.1 million in 2014, as compared to $236.2 million in 2013. This decline in the use of cash in 2014 was primarily related to lower cash used for the acquisition of businesses. Cash used to acquire businesses in 2014 was $92.2 million, consisting primarily of the acquisition of Encore, as compared to 2013 which included the acquisition of Novella for approximately $145.0 million. Also contributing to the decline was lower cash used to acquire property, equipment and software and an increase in proceeds from the sale of equity securities.
60
2013 compared to 2012
Cash used in investing activities increased by $104.0 million to $236.2 million in 2013, as compared to $132.2 million in 2012. The uses of cash in 2013 consisted primarily of the acquisition of Novella for approximately $145.0 million, acquisitions of property, equipment and software and cash used to fund investments in unconsolidated affiliates.
Cash Flow from Financing Activities
| Year Ended December 31, | ||||||||||||
| 2014 | 2013 | 2012 | ||||||||||
| (in millions) | ||||||||||||
| Net cash (used in) provided by financing activities |
$ | (130.3 | ) | $ | 71.0 | $ | (146.9 | ) | ||||
2014 compared to 2013
Net cash used in financing activities was $130.3 million in 2014, as compared to cash provided by financing activities of $71.0 million in 2013. The cash used in financing activities in 2014 was primarily related to the repurchase of common stock ($415.1 million), partially offset by the proceeds from issuance of debt ($275.0 million) and the proceeds from stock issued under employee stock purchase and option plans ($35.2 million). The repurchase of common stock was funded, in part, by a $150.0 million draw on our line of credit under our senior secured credit facility. This line of credit draw was repaid in full in 2014 from the proceeds of a $275.0 million term loan under our receivables financing facility, which closed in December 2014. The proceeds from the $275.0 million term loan were also used to repay $25.0 million of outstanding indebtedness on the Term Loan B-3 under our senior secured credit facility.
2013 compared to 2012
Net cash provided by financing activities increased by $217.9 million to $71.0 million in 2013, as compared to cash used of $146.9 million in 2012. The increase in cash provided by financing activities in 2013 was primarily related to (1) the net proceeds of our IPO ($489.6 million), (2) lower cash used for dividends (zero paid in 2013 as compared to $567.9 million paid in 2012) and (3) cash received upon the exercise of stock options ($12.2 million). These increases in financing cash flows were partially offset by $822.3 million higher net use of cash for debt (cash used to pay debt and debt issue costs, less proceeds from the issuance of debt), which was a use of cash of $386.5 million in 2013, as compared to cash provided of $435.8 million in 2012, and $57.1 million of cash used to repurchase common stock and stock options in 2013 under the Repurchase Program. The increase in net cash used for debt in 2013 was primarily as a result of repayment of all amounts outstanding under the $300.0 million term loan (which was issued in 2012) and $83.8 million of repayments on our senior secured credit facilities, which included a voluntary pay down of $50.0 million and a mandatory prepayment of $33.8 million as a result of excess cash flow (as defined in the credit agreement).
Contractual Obligations and Commitments
Below is a summary of our future payment commitments by year under contractual obligations as of December 31, 2014 (in millions):
| 2015 | 2016-2017 | 2018-2019 | Thereafter | Total | ||||||||||||||||
| Long-term debt, including interest (1) |
$ | 83.5 | $ | 204.9 | $ | 2,300.2 | $ | — | $ | 2,588.6 | ||||||||||
| Obligations under capital leases |
0.1 | — | — | — | 0.1 | |||||||||||||||
| Operating leases |
91.1 | 125.1 | 54.1 | 80.8 | 351.1 | |||||||||||||||
| Purchase obligations (2) |
3.4 | 1.3 | — | — | 4.7 | |||||||||||||||
| Commitments to unconsolidated affiliates (3) |
2.5 | — | — | — | 2.5 | |||||||||||||||
| Defined benefit plans (4) |
5.6 | — | — | — | 5.6 | |||||||||||||||
| Uncertain income tax positions (5) |
1.6 | — | — | — | 1.6 | |||||||||||||||
| Contingent consideration (6) |
1.5 | — | — | — | 1.5 | |||||||||||||||
|
|
|
|
|
|
|
|
|
|
|
|||||||||||
| Total |
$ | 189.3 | $ | 331.3 | $ | 2,354.3 | $ | 80.8 | $ | 2,955.7 | ||||||||||
|
|
|
|
|
|
|
|
|
|
|
|||||||||||
61
| (1) | Interest payments on floating rate debt for the senior secured credit agreement and receivables financing facility are based on the interest rates in effect on December 31, 2014. |
| (2) | Purchase obligations are defined as agreements to purchase goods or services that are enforceable and legally binding and that specify all significant terms, including fixed or minimum quantities to be purchased, fixed, minimum or variable pricing provisions and the approximate timing of the transactions. |
| (3) | We are currently committed to invest $50.0 million in the NovaQuest Pharma Opportunities Fund III, L.P. As of December 31, 2014, we have funded approximately $25.0 million of this commitment and we have approximately $25.0 million remaining to be funded. In February 2015, we committed to invest up to $20.0 million in a new private equity fund, NovaQuest Pharma Opportunities Fund IV, L.P. |
| (4) | We made cash contributions totaling approximately $8.6 million to our defined benefit plans in 2014, and we estimate that we will make contributions totaling approximately $5.6 million in 2015. Due to the potential impact of future plan investment performance, changes in interest rates, changes in other economic and demographic assumptions and changes in legislation in foreign jurisdictions, we are not able to reasonably estimate the timing and amount of contributions that may be required to fund our defined benefit plans for periods beyond 2015. |
| (5) | As of December 31, 2014, our liability related to uncertain income tax positions was approximately $44.6 million, $43.0 million of which has not been included in the above table as we are unable to predict when these liabilities will be paid due to the uncertainties in the timing of the settlement of the income tax positions. |
| (6) | Contingent consideration payable in connection with acquisitions. |
Application of Critical Accounting Policies
Note 1 to the consolidated financial statements provided elsewhere in this Annual Report on Form 10-K describes the significant accounting policies used in the preparation of the consolidated financial statements. The preparation of our consolidated financial statements requires management to make estimates and assumptions that affect the reported amounts of assets and liabilities, and the disclosure of contingent assets and liabilities at the date of the financial statements, as well as the reported amounts of revenues and expenses during the period. Our estimates are based on historical experience and various other assumptions we believe are reasonable under the circumstances. We evaluate our estimates on an ongoing basis and make changes to the estimates and related disclosures as experience develops or new information becomes known. Actual results may differ from those estimates.
We believe the following critical accounting policies affect our more significant judgments and estimates used in the preparation of our consolidated financial statements.
Revenue Recognition
We recognize revenue when all of the following conditions are satisfied: (1) there is persuasive evidence of an arrangement, (2) the service offering has been delivered to the customer, (3) the collection of fees is probable and (4) the arrangement consideration is fixed or determinable. We do not recognize revenue with respect to start-up activities including contract and scope negotiation, feasibility analysis and conflict of interest review associated with contracts. The costs for these activities are expensed as incurred. For contracts in which portions of revenue are contingent upon the occurrence of uncertain future events we recognize the revenue only after it has been earned and the contingency has been resolved.
The majority of our revenue is recognized based on objective contractual criteria and does not require significant estimates or judgments. However, at any point in time we are working on thousands of active customer projects, which are governed by individual contracts. Most projects are customized based on the needs of the customer, the type of services being provided, therapeutic indication of the drug, geographic locations and other variables. Project specific terms related to pricing, billing terms and the scope and type of services to be provided are generally negotiated and contracted on a project-by-project basis. Changes in the scope of work are common, especially under long-term contracts, and generally result in a change in contract value. In such situations, we enter into negotiations for a contract amendment to reflect the change in scope and the related
62
price. Depending on the complexity of the amendment, the negotiation process can take from a few weeks for a simple adjustment to several months for a complex amendment. Management may authorize the project team to commence work on activities outside the contract scope while we negotiate and finalize the contract amendment. In these limited cases, if we are not able to obtain a contract amendment from the customer, our profit margin on the arrangement may be impacted. This result occurs because our costs of delivery are expensed as they are incurred, while revenue is not recognized unless the customer has agreed to the changes in scope and renegotiated pricing terms, the contract value is amended and all other revenue recognition criteria are met.
For arrangements that include multiple elements, arrangement consideration is allocated to units of accounting based on the relative selling price. The best evidence of selling price of a unit of accounting is vendor-specific objective evidence, or VSOE, which is the price we charge when the deliverable is sold separately. When VSOE is not available to determine selling price, we use relevant third-party evidence, or TPE, of selling price, if available. When neither VSOE nor TPE of selling price exists, we use our best estimate of selling price considering all relevant information that is available without undue cost and effort.
Most contracts are terminable upon 30 to 90 days notice by the customer. Our risk of material loss in these situations is mitigated as these contracts generally require payment to us for expenses to wind down the trial or project, fees earned to date and, in some cases, a termination fee or a payment of some portion of the fees or profits that could have been earned under the contract if it had not been terminated early. In addition, our contract terms provide for payment terms that generally correspond with performance of the services. Termination fees are included in service revenues when realization is assured.
Accounts Receivable and Unbilled Services
Accounts receivable represents amounts billed to customers. Revenues recognized in excess of billings are classified as unbilled services. The realization of these amounts is based on the customer’s willingness and ability to pay us. We have an allowance for doubtful accounts based on management’s estimate of probable losses we expect to incur resulting from a customer failing to pay us. Our allowance for doubtful accounts, and losses from customers failing to pay us, have not been material to our results of operations. If any of these estimates change or actual results differs from expected results, then an adjustment is recorded in the period in which the amounts become reasonably estimable. These adjustments could have a material effect on our results of operations.
Investments in Unconsolidated Affiliates—Equity Method Investments
We have investments in unconsolidated affiliates that are accounted for under the equity method of accounting. Periodically, we review our investments for a decline in value which we believe may be other than temporary. Should we identify such a decline, we will record a loss through earnings to establish a new cost basis for the investment. These losses could have a material adverse effect on our results of operations.
Income Taxes
Certain items of income and expense are not recognized on our income tax returns and financial statements in the same year, which creates timing differences. The income tax effect of these timing differences results in (1) deferred income tax assets that create a reduction in future income taxes and (2) deferred income tax liabilities that create an increase in future income taxes. Recognition of deferred income tax assets is based on management’s belief that it is more likely than not that the income tax benefit associated with certain temporary differences, income tax operating loss and capital loss carryforwards and income tax credits, would be realized. We recorded a valuation allowance to reduce our deferred income tax assets for those deferred income tax items for which it was more likely than not that realization would not occur. We determined the amount of the valuation allowance based, in part, on our assessment of future taxable income and in light of our ongoing income tax strategies. If our estimate of future taxable income or tax strategies changes at any time in the future, we would record an adjustment to our valuation allowance. Recording such an adjustment could have a material effect on our financial position.
63
Income tax expense is based on the distribution of profit before income tax among the various taxing jurisdictions in which we operate, adjusted as required by the income tax laws of each taxing jurisdiction. Changes in the distribution of profits and losses among taxing jurisdictions may have a significant impact on our effective income tax rate. Beginning in 2013, we consider the undistributed earnings of most of our foreign subsidiaries to be indefinitely reinvested outside of the United States. Accordingly, we have not provided a deferred income tax liability related to those undistributed earnings.
Business Combinations
We use the acquisition method to account for business combinations, and accordingly, the identifiable assets acquired, the liabilities assumed and any noncontrolling interest in the acquiree are recorded at their estimated fair values on the date of the acquisition. We use significant judgments, estimates and assumptions in determining the estimated fair value of assets acquired, liabilities assumed and noncontrolling interest including expected future cash flows; discount rates that reflect the risk associated with the expected future cash flows; and estimated useful lives.
When a business combination involves contingent consideration, we recognize a liability equal to the estimated fair value of the contingent consideration obligation at the date of the acquisition. The estimate of fair value of a contingent consideration liability requires subjective assumptions to be made regarding future business results including revenues and net new business, discount rates that reflect the risk associated with the expected future cash flows and probabilities assigned to various potential business result scenarios. We periodically reassess the estimated fair value of the contingent consideration over the term of the arrangement. Any resulting changes are recognized in earnings and could have a material effect on our results of operations.
Goodwill, Tangible and Identifiable Intangible Assets
We have recorded and allocated to our reporting units the excess of the cost over the fair value of the net assets acquired, known as goodwill. The recoverability of the goodwill and indefinite-lived intangible assets are evaluated annually for impairment, or if and when events or circumstances indicate a possible impairment. Goodwill and indefinite-lived intangible assets are not amortized. We review the carrying values of other identifiable intangible assets if the facts and circumstances indicate a possible impairment. Based upon our 2014 annual testing, we believe that the risk of a significant impairment to goodwill or indefinite-lived intangible assets is currently very low. Other identifiable intangible assets are amortized over their estimated useful lives.
For goodwill, we perform a qualitative analysis to determine whether it is more likely than not that the estimated fair value of a reporting unit is less than its book value. This includes a qualitative analysis of macroeconomic conditions, industry and market considerations, internal cost factors, financial performance, fair value history and other company specific events. If this qualitative analysis indicates that it is more likely than not that estimated fair value is less than the book value for the respective reporting unit, we apply a two-step impairment test in which we determine whether the estimated fair value of the reporting unit is in excess of its carrying value. If the carrying value of the net assets assigned to the reporting unit exceeds the estimated fair value of the reporting unit, we perform the second step of the impairment test to determine the implied estimated fair value of the reporting unit’s goodwill. We determine the implied estimated fair value of goodwill by determining the present value of the estimated future cash flows for each reporting unit and comparing the reporting unit’s risk profile and growth prospects to selected, reasonably similar publicly traded companies. The inherent subjectivity of applying a discounted cash flow and market comparables approach to valuing our assets and liabilities could have a significant impact on our analysis. Any future impairment could have a material adverse effect on our financial condition or results of operations.
For indefinite-lived intangible assets, we perform a qualitative analysis to determine whether it is more likely than not that the estimated fair value of the indefinite-lived intangible asset is less than its carrying value. If this qualitative analysis indicates that it is more likely than not that the estimated fair value is less than the
64
carrying value of the indefinite-lived intangible asset, we determine the estimated fair value of the indefinite-lived intangible asset (trade name) by determining the present value of the estimated royalty payments on an after-tax basis that it would be required to pay the owner for the right to use such trade name. If the carrying amount exceeds the estimated fair value, an impairment loss is recognized in an amount equal to the excess. Any future impairment could have a material adverse effect on our financial condition or results of operations.
We review the carrying values of property and equipment if the facts and circumstances suggest that a potential impairment may have occurred. If this review indicates that carrying values will not be recoverable, as determined based on undiscounted cash flows over the remaining depreciation or amortization period, we will reduce carrying values to estimated fair value. The inherent subjectivity of our estimates of future cash flows could have a significant impact on our analysis. Any future write-offs of long-lived assets could have a material adverse effect on our financial condition or results of operations.
Share-based Compensation
We measure compensation cost for most share-based payment awards (stock options and stock appreciation rights) granted to employees and non-employee directors at fair value using the Black-Scholes-Merton option-pricing model. Share-based compensation expense includes share-based awards granted to employees and non-employee directors and has been reported in selling, general and administrative expenses in our consolidated statements of income based upon the classification of the individuals who were granted share-based awards.
The Black-Scholes-Merton option-pricing model requires the use of subjective assumptions, including share price volatility, the expected life of the award, risk-free interest rate and the fair value of the underlying common shares on the date of grant. In developing our assumptions, we take into account the following:
| • | As a result of our status as a private company prior to our IPO, we do not have sufficient history to estimate the volatility of our common share price. We calculate expected volatility based on reported data for selected reasonably similar publicly traded companies for which the historical information is available. We plan to continue to use the guideline peer group volatility information until the historical volatility of our common shares is relevant to measure expected volatility for future award grants; |
| • | We determine the risk-free interest rate by reference to implied yields available from United States Treasury securities with a remaining term equal to the expected life assumed at the date of grant; |
| • | We estimate the dividend yield to be zero as we do not currently anticipate paying any future dividends; |
| • | We estimate the average expected life of the award based on our historical experience; and |
| • | We estimate forfeitures based on our historical analysis of actual forfeitures. |
Item 7A. Quantitative and Qualitative Disclosures About Market Risk
Market risk is the potential loss arising from adverse changes in market rates and prices, such as foreign currency exchange rates, interest rates and other relevant market rate or price changes. In the ordinary course of business, we are exposed to various market risks, including changes in foreign currency exchange rates, interest rates and equity price changes, and we regularly evaluate our exposure to such changes. Our overall risk management strategy seeks to balance the magnitude of the exposure and the cost and availability of appropriate financial instruments. From time to time, we have utilized forward exchange contracts to manage our foreign currency exchange rate risk. The following analyses present the sensitivity of our financial instruments to hypothetical changes in interest rates and equity prices that are reasonably possible over a one-year period.
Foreign Currency Exchange Rates
Approximately 38% of our service revenues for both years ended December 31, 2014 and 2013 were denominated in currencies other than the United States dollar. Our financial statements are reported in United
65
States dollars and, accordingly, fluctuations in exchange rates will affect the translation of our revenues and expenses denominated in foreign currencies into United States dollars for purposes of reporting our consolidated financial results. In 2014 and 2013, the most significant currency exchange rate exposures were the Euro, British pound, Singapore dollar and Indian rupee. Excluding the impacts from any outstanding or future hedging transactions, a hypothetical change of 10% in average exchange rates used to translate all foreign currencies to United States dollars would have impacted income before income taxes for 2014 by approximately $40.5 million. Accumulated currency translation adjustments recorded as a separate component of shareholders’ deficit were ($55.7) million and ($5.8) million at December 31, 2014 and 2013, respectively. We do not have significant operations in countries in which the economy is considered to be highly-inflationary.
We are subject to foreign currency transaction risk for fluctuations in exchange rates during the period of time between the consummation and cash settlement of a transaction. We earn revenue from our service contracts over a period of several months and, in some cases, over a period of several years. Accordingly, exchange rate fluctuations during this period may affect our profitability with respect to such contracts. We limit our foreign currency transaction risk through exchange rate fluctuation provisions stated in our contracts with customers, or we may hedge our transaction risk with foreign currency exchange contracts. At December 31, 2014, we had 13 open foreign exchange forward contracts relating to service contracts with various amounts maturing monthly through September 2015 with a notional value totaling approximately $76.0 million. At December 31, 2013, we had 12 open foreign exchange forward contracts relating to service contracts with various amounts maturing monthly through September 2014 with a notional value totaling approximately $60.8 million.
Interest Rates
Because we have variable rate debt, fluctuations in interest rates affect our business. We attempt to minimize interest rate risk and lower our overall borrowing costs through the utilization of derivative financial instruments, primarily interest rate swaps. We have entered into interest rate swaps with financial institutions that have reset dates and critical terms that match those of our term loan credit facility. Accordingly, any change in market value associated with the interest rate swaps is offset by the opposite market impact on the related debt. As of December 31, 2014, we had approximately $2.0 billion of total indebtedness with variable interest at the greater of the three month LIBOR or 1.25%, plus 2.50%, or 3.75% at December 31, 2014, of which $910.0 million, or 44.8%, was hedged at a fixed rate of 2.57%, leaving approximately $1.1 billion of unhedged variable rate debt. As of December 31, 2014, we also had $275.0 million of total indebtedness under our receivables financing facility with variable interest at LIBOR plus 1.05%, or 1.22% at December 31, 2014. Because we do not attempt to hedge all of our variable rate debt, we may incur higher interest costs for the portion of our variable rate debt which is not hedged. Each quarter-point increase or decrease in the variable interest rate would result in our interest expense changing by approximately $3.5 million per year under our unhedged variable rate debt.
Equity Prices
At December 31, 2014 and 2013, we held investments in marketable equity securities. These investments are classified as available-for-sale and are recorded at fair value in the financial statements. These securities are subject to equity price risk. As of December 31, 2014 and 2013, the fair value of these investments was $831,000 and $7.7 million, respectively, based on quoted equity prices. The potential loss in fair value resulting from a hypothetical decrease of 10% in quoted equity price was approximately $83,000 and $767,000 at December 31, 2014 and 2013, respectively.
66
Item 8. Financial Statements and Supplementary Data
MANAGEMENT’S REPORT ON INTERNAL CONTROL OVER FINANCIAL REPORTING
The management of Quintiles Transnational Holdings Inc. (the “Company”) is responsible for establishing and maintaining adequate internal control over financial reporting. Internal control over financial reporting is a process designed to provide reasonable assurance regarding the reliability of financial reporting and the preparation of financial statements for external purposes in accordance with generally accepted accounting principles. A company’s internal control over financial reporting includes those policies and procedures that pertain to the maintenance of records that, in reasonable detail, accurately and fairly reflect the transactions and dispositions of the assets of the company; provide reasonable assurance that transactions are recorded as necessary to permit preparation of financial statements in accordance with generally accepted accounting principles, and that receipts and expenditures of the company are being made only in accordance with authorizations of management and directors of the company; and provide reasonable assurance regarding prevention or timely detection of unauthorized acquisition, use, or disposition of the company’s assets that could have a material effect on the financial statements.
Because of its inherent limitations, internal control over financial reporting may not prevent or detect misstatements. Also, projections of any evaluation of effectiveness to future periods are subject to the risk that controls may become inadequate because of changes in conditions, or that the degree of compliance with the policies or procedures may deteriorate.
Management assessed the effectiveness of the Company’s internal control over financial reporting as of December 31, 2014. In making this assessment, management used the framework established in Internal Control—Integrated Framework (2013) issued by the Committee of Sponsoring Organizations of the Treadway Commission (COSO). As a result of this assessment and based on the criteria in the COSO framework, management has concluded that, as of December 31, 2014, the Company’s internal control over financial reporting was effective.
The effectiveness of the Company’s internal control over financial reporting as of December 31, 2014 has been audited by PricewaterhouseCoopers LLP, an independent registered public accounting firm, as stated in their report which appears herein.
| /s/ Thomas H. Pike |
/s/ Kevin K. Gordon | |
| Thomas H. Pike | Kevin K. Gordon | |
| Chief Executive Officer | Executive Vice President and Chief Financial Officer | |
| (Principal Executive Officer) | (Principal Financial Officer) |
February 12, 2015
67
REPORT OF INDEPENDENT REGISTERED PUBLIC ACCOUNTING FIRM
To the Board of Directors and Shareholders of
Quintiles Transnational Holdings Inc.:
In our opinion, the consolidated financial statements listed in the index appearing under Item 15(a)(1) present fairly, in all material respects, the financial position of Quintiles Transnational Holdings Inc. and its subsidiaries at December 31, 2014 and 2013, and the results of their operations and their cash flows for each of the three years in the period ended December 31, 2014 in conformity with accounting principles generally accepted in the United States of America. In addition, in our opinion, the financial statement schedules listed in the index appearing under Item 15(a)(2) present fairly, in all material respects, the information set forth therein when read in conjunction with the related consolidated financial statements. Also in our opinion, the Company maintained, in all material respects, effective internal control over financial reporting as of December 31, 2014, based on criteria established in Internal Control—Integrated Framework (2013) issued by the Committee of Sponsoring Organizations of the Treadway Commission (COSO). The Company’s management is responsible for these financial statements and financial statement schedules, for maintaining effective internal control over financial reporting and for its assessment of the effectiveness of internal control over financial reporting, included in the accompanying Management’s Report on Internal Control over Financial Reporting. Our responsibility is to express opinions on these financial statements, on the financial statement schedules, and on the Company’s internal control over financial reporting based on our audits (which was an integrated audit in 2014). We conducted our audits in accordance with the standards of the Public Company Accounting Oversight Board (United States). Those standards require that we plan and perform the audits to obtain reasonable assurance about whether the financial statements are free of material misstatement and whether effective internal control over financial reporting was maintained in all material respects. Our audits of the financial statements included examining, on a test basis, evidence supporting the amounts and disclosures in the financial statements, assessing the accounting principles used and significant estimates made by management, and evaluating the overall financial statement presentation. Our audit of internal control over financial reporting included obtaining an understanding of internal control over financial reporting, assessing the risk that a material weakness exists, and testing and evaluating the design and operating effectiveness of internal control based on the assessed risk. Our audits also included performing such other procedures as we considered necessary in the circumstances. We believe that our audits provide a reasonable basis for our opinions.
A company’s internal control over financial reporting is a process designed to provide reasonable assurance regarding the reliability of financial reporting and the preparation of financial statements for external purposes in accordance with generally accepted accounting principles. A company’s internal control over financial reporting includes those policies and procedures that (i) pertain to the maintenance of records that, in reasonable detail, accurately and fairly reflect the transactions and dispositions of the assets of the company; (ii) provide reasonable assurance that transactions are recorded as necessary to permit preparation of financial statements in accordance with generally accepted accounting principles, and that receipts and expenditures of the company are being made only in accordance with authorizations of management and directors of the company; and (iii) provide reasonable assurance regarding prevention or timely detection of unauthorized acquisition, use, or disposition of the company’s assets that could have a material effect on the financial statements.
Because of its inherent limitations, internal control over financial reporting may not prevent or detect misstatements. Also, projections of any evaluation of effectiveness to future periods are subject to the risk that controls may become inadequate because of changes in conditions, or that the degree of compliance with the policies or procedures may deteriorate.
/s/ PricewaterhouseCoopers LLP
Raleigh, North Carolina
February 12, 2015
68
QUINTILES TRANSNATIONAL HOLDINGS INC. AND SUBSIDIARIES
CONSOLIDATED STATEMENTS OF INCOME
| Year Ended December 31, | ||||||||||||
| 2014 | 2013 | 2012 | ||||||||||
| (in thousands, except per share data) | ||||||||||||
| Service revenues |
$ | 4,165,822 | $ | 3,808,340 | $ | 3,692,298 | ||||||
| Reimbursed expenses |
1,294,176 | 1,291,205 | 1,173,215 | |||||||||
|
|
|
|
|
|
|
|||||||
| Total revenues |
5,459,998 | 5,099,545 | 4,865,513 | |||||||||
| Costs of revenue, service costs |
2,684,106 | 2,471,426 | 2,459,367 | |||||||||
| Costs of revenue, reimbursed expenses |
1,294,176 | 1,291,205 | 1,173,215 | |||||||||
| Selling, general and administrative |
882,338 | 860,510 | 817,755 | |||||||||
| Restructuring costs |
8,988 | 14,071 | 18,741 | |||||||||
|
|
|
|
|
|
|
|||||||
| Income from operations |
590,390 | 462,333 | 396,435 | |||||||||
| Interest income |
(3,410 | ) | (3,937 | ) | (3,067 | ) | ||||||
| Interest expense |
100,589 | 123,508 | 134,371 | |||||||||
| Loss on extinguishment of debt |
— | 19,831 | 1,275 | |||||||||
| Other (income) expense, net |
(8,978 | ) | (185 | ) | (3,572 | ) | ||||||
|
|
|
|
|
|
|
|||||||
| Income before income taxes and equity in earnings (losses) of unconsolidated affiliates |
502,189 | 323,116 | 267,428 | |||||||||
| Income tax expense |
150,056 | 95,965 | 93,364 | |||||||||
|
|
|
|
|
|
|
|||||||
| Income before equity in earnings (losses) of unconsolidated affiliates |
352,133 | 227,151 | 174,064 | |||||||||
| Equity in earnings (losses) of unconsolidated affiliates |
4,368 | (1,124 | ) | 2,567 | ||||||||
|
|
|
|
|
|
|
|||||||
| Net income |
356,501 | 226,027 | 176,631 | |||||||||
| Net (income) loss attributable to noncontrolling interests |
(118 | ) | 564 | 915 | ||||||||
|
|
|
|
|
|
|
|||||||
| Net income attributable to Quintiles Transnational Holdings Inc. |
$ | 356,383 | $ | 226,591 | $ | 177,546 | ||||||
|
|
|
|
|
|
|
|||||||
| Earnings per share attributable to common shareholders: |
||||||||||||
| Basic |
$ | 2.78 | $ | 1.83 | $ | 1.53 | ||||||
| Diluted |
$ | 2.72 | $ | 1.77 | $ | 1.51 | ||||||
| Weighted average common shares outstanding: |
||||||||||||
| Basic |
127,994 | 124,147 | 115,710 | |||||||||
| Diluted |
131,083 | 127,862 | 117,796 | |||||||||
The accompanying notes are an integral part of these consolidated financial statements.
69
QUINTILES TRANSNATIONAL HOLDINGS INC. AND SUBSIDIARIES
CONSOLIDATED STATEMENTS OF COMPREHENSIVE INCOME
| Year Ended December 31, | ||||||||||||
| 2014 | 2013 | 2012 | ||||||||||
| (in thousands) | ||||||||||||
| Net income |
$ | 356,501 | $ | 226,027 | $ | 176,631 | ||||||
| Unrealized (losses) gains on marketable securities, net of income taxes of ($376), $2,016 and $258 |
(600 | ) | 3,225 | 400 | ||||||||
| Unrealized (losses) gains on derivative instruments, net of income taxes of ($1,767), ($751) and ($4,392) |
(5,067 | ) | 358 | (6,306 | ) | |||||||
| Foreign currency translation, net of income taxes of ($2,101), ($2,465) and $2,964 |
(47,807 | ) | (22,663 | ) | (8,983 | ) | ||||||
| Defined benefit plan adjustments, net of income taxes of ($2,981), ($131) and ($1,444) |
(7,237 | ) | 2,278 | (3,172 | ) | |||||||
| Reclassification adjustments: |
||||||||||||
| Gains on marketable securities included in net income, net of income taxes of ($1,927) |
(3,077 | ) | — | — | ||||||||
| Losses on derivative instruments included in net income, net of income taxes of $4,022, $4,991 and $1,313 |
4,608 | 8,089 | 2,188 | |||||||||
| Amortization of prior service costs and losses included in net income, net of income taxes of $275, $389 and $446 |
468 | 655 | 723 | |||||||||
|
|
|
|
|
|
|
|||||||
| Comprehensive income |
297,789 | 217,969 | 161,481 | |||||||||
| Comprehensive (income) loss attributable to noncontrolling interests |
(121 | ) | 551 | 889 | ||||||||
|
|
|
|
|
|
|
|||||||
| Comprehensive income attributable to Quintiles Transnational Holdings Inc. |
$ | 297,668 | $ | 218,520 | $ | 162,370 | ||||||
|
|
|
|
|
|
|
|||||||
The accompanying notes are an integral part of these consolidated financial statements.
70
QUINTILES TRANSNATIONAL HOLDINGS INC. AND SUBSIDIARIES
| December 31, | ||||||||
| 2014 | 2013 | |||||||
| (in thousands, except per share data) | ||||||||
| ASSETS | ||||||||
| Current assets: |
||||||||
| Cash and cash equivalents |
$ | 867,358 | $ | 778,143 | ||||
| Restricted cash |
2,882 | 2,712 | ||||||
| Trade accounts receivable and unbilled services, net |
975,255 | 924,205 | ||||||
| Prepaid expenses |
44,628 | 42,801 | ||||||
| Deferred income taxes |
118,515 | 92,115 | ||||||
| Income taxes receivable |
45,357 | 16,171 | ||||||
| Other current assets and receivables |
92,088 | 89,541 | ||||||
|
|
|
|
|
|||||
| Total current assets |
2,146,083 | 1,945,688 | ||||||
|
|
|
|
|
|||||
| Property and equipment, net |
190,297 | 199,578 | ||||||
| Investments in debt, equity and other securities |
34,503 | 40,349 | ||||||
| Investments in and advances to unconsolidated affiliates |
31,508 | 22,927 | ||||||
| Goodwill |
464,434 | 409,626 | ||||||
| Other identifiable intangibles, net |
280,243 | 298,054 | ||||||
| Deferred income taxes |
35,972 | 32,864 | ||||||
| Deposits and other assets |
122,792 | 117,711 | ||||||
|
|
|
|
|
|||||
| Total assets |
$ | 3,305,832 | $ | 3,066,797 | ||||
|
|
|
|
|
|||||
| LIABILITIES AND SHAREHOLDERS’ DEFICIT | ||||||||
| Current liabilities: |
||||||||
| Accounts payable |
$ | 108,743 | $ | 100,616 | ||||
| Accrued expenses |
733,644 | 761,189 | ||||||
| Unearned income |
543,305 | 538,585 | ||||||
| Income taxes payable |
55,694 | 35,778 | ||||||
| Current portion of long-term debt and obligations held under capital leases |
826 | 10,433 | ||||||
| Other current liabilities |
29,688 | 35,646 | ||||||
|
|
|
|
|
|||||
| Total current liabilities |
1,471,900 | 1,482,247 | ||||||
| Long-term debt and obligations held under capital leases, less current portion |
2,292,491 | 2,035,586 | ||||||
| Deferred income taxes |
61,797 | 37,541 | ||||||
| Other liabilities |
183,656 | 178,908 | ||||||
|
|
|
|
|
|||||
| Total liabilities |
4,009,844 | 3,734,282 | ||||||
|
|
|
|
|
|||||
| Commitments and contingencies (Note 1) |
||||||||
| Shareholders’ deficit: |
||||||||
| Common stock and additional paid-in capital, 300,000 shares authorized, $0.01 par value, 124,129 and 129,652 shares issued and outstanding at December 31, 2014 and 2013, respectively |
143,828 | 478,144 | ||||||
| Accumulated deficit |
(788,798 | ) | (1,145,181 | ) | ||||
| Accumulated other comprehensive loss |
(59,091 | ) | (376 | ) | ||||
|
|
|
|
|
|||||
| Deficit attributable to Quintiles Transnational Holdings Inc.’s shareholders |
(704,061 | ) | (667,413 | ) | ||||
| Noncontrolling interests |
49 | (72 | ) | |||||
|
|
|
|
|
|||||
| Total shareholders’ deficit |
(704,012 | ) | (667,485 | ) | ||||
|
|
|
|
|
|||||
| Total liabilities and shareholders’ deficit |
$ | 3,305,832 | $ | 3,066,797 | ||||
|
|
|
|
|
|||||
The accompanying notes are an integral part of these consolidated financial statements.
71
QUINTILES TRANSNATIONAL HOLDINGS INC. AND SUBSIDIARIES
CONSOLIDATED STATEMENTS OF CASH FLOWS
| Year Ended December 31, | ||||||||||||
| 2014 | 2013 | 2012 | ||||||||||
| (in thousands) | ||||||||||||
| Operating activities: |
||||||||||||
| Net income |
$ | 356,501 | $ | 226,027 | $ | 176,631 | ||||||
| Adjustments to reconcile net income to cash provided by operating activities: |
||||||||||||
| Depreciation and amortization |
121,013 | 107,504 | 98,288 | |||||||||
| Amortization of debt issuance costs and discount |
6,688 | 21,825 | 9,237 | |||||||||
| Share-based compensation |
30,001 | 22,826 | 25,926 | |||||||||
| Gain on disposals of property and equipment, net |
(975 | ) | (1,153 | ) | (541 | ) | ||||||
| (Earnings) loss from unconsolidated affiliates |
(4,346 | ) | 1,004 | (2,499 | ) | |||||||
| (Gain) loss on investments, net |
(4,797 | ) | (183 | ) | 70 | |||||||
| (Benefit from) provision for deferred income taxes |
(6,168 | ) | (24,236 | ) | 16,595 | |||||||
| Excess income tax benefits from share-based award activities |
(20,303 | ) | (16,204 | ) | (465 | ) | ||||||
| Change in operating assets and liabilities: |
||||||||||||
| Accounts receivable and unbilled services |
(78,630 | ) | (151,681 | ) | (60,255 | ) | ||||||
| Prepaid expenses and other assets |
(40,832 | ) | (18,576 | ) | (27,013 | ) | ||||||
| Accounts payable and accrued expenses |
45,804 | 107,047 | 58,345 | |||||||||
| Unearned income |
19,943 | 71,852 | 54,502 | |||||||||
| Income taxes payable and other liabilities |
7,855 | 47,319 | (13,120 | ) | ||||||||
|
|
|
|
|
|
|
|||||||
| Net cash provided by operating activities |
431,754 | 393,371 | 335,701 | |||||||||
| Investing activities: |
||||||||||||
| Acquisition of property, equipment and software |
(82,650 | ) | (88,347 | ) | (71,336 | ) | ||||||
| Acquisition of businesses, net of cash acquired |
(92,201 | ) | (144,970 | ) | (43,197 | ) | ||||||
| Proceeds from disposition of property and equipment |
1,611 | 2,021 | 2,729 | |||||||||
| Purchase of equity securities |
— | — | (13,204 | ) | ||||||||
| Proceeds from sale of equity securities |
5,861 | 60 | 70 | |||||||||
| Investments in and advances to unconsolidated affiliates, net of payments received |
(4,472 | ) | (7,353 | ) | (3,646 | ) | ||||||
| Proceeds from (payments made for) sale of investment in unconsolidated affiliates |
— | 2,335 | (577 | ) | ||||||||
| Other |
(1,263 | ) | 78 | (3,072 | ) | |||||||
|
|
|
|
|
|
|
|||||||
| Net cash used in investing activities |
(173,114 | ) | (236,176 | ) | (132,233 | ) | ||||||
| Financing activities: |
||||||||||||
| Proceeds from issuance of debt |
275,000 | 2,060,755 | 2,441,017 | |||||||||
| Payment of debt issuance costs |
(1,455 | ) | (2,607 | ) | (9,728 | ) | ||||||
| Repayment of debt |
(30,157 | ) | (2,444,600 | ) | (1,995,472 | ) | ||||||
| Proceeds from revolving credit facility |
150,000 | — | — | |||||||||
| Repayment of revolving credit facility |
(150,000 | ) | — | — | ||||||||
| Principal payments on capital lease obligations |
(2,612 | ) | (3,812 | ) | (5,407 | ) | ||||||
| Contingent consideration paid |
(3,000 | ) | — | — | ||||||||
| Issuance of common stock |
— | 525,000 | 3,116 | |||||||||
| Payment of common stock issuance costs |
(105 | ) | (35,439 | ) | — | |||||||
| Stock issued under employee stock purchase and option plans |
35,228 | 12,539 | 350 | |||||||||
| Repurchase of common stock |
(415,131 | ) | (6,434 | ) | (13,363 | ) | ||||||
| Repurchase of stock options |
(8,415 | ) | (50,649 | ) | — | |||||||
| Excess income tax benefits from share-based award activities |
20,303 | 16,204 | 465 | |||||||||
| Dividends paid to common shareholders |
— | — | (567,851 | ) | ||||||||
|
|
|
|
|
|
|
|||||||
| Net cash (used in) provided by financing activities |
(130,344 | ) | 70,957 | (146,873 | ) | |||||||
| Effect of foreign currency exchange rate changes on cash |
(39,081 | ) | (17,737 | ) | (5,166 | ) | ||||||
|
|
|
|
|
|
|
|||||||
| Increase in cash and cash equivalents |
89,215 | 210,415 | 51,429 | |||||||||
| Cash and cash equivalents at beginning of period |
778,143 | 567,728 | 516,299 | |||||||||
|
|
|
|
|
|
|
|||||||
| Cash and cash equivalents at end of period |
$ | 867,358 | $ | 778,143 | $ | 567,728 | ||||||
|
|
|
|
|
|
|
|||||||
The accompanying notes are an integral part of these consolidated financial statements.
72
QUINTILES TRANSNATIONAL HOLDINGS INC. AND SUBSIDIARIES
CONSOLIDATED STATEMENTS OF SHAREHOLDERS’ DEFICIT
| (Accumulated Deficit) |
Accumulated Other Comprehensive (Loss) Income |
Common Stock |
Additional Paid-In Capital |
Noncontrolling Interests |
Total | |||||||||||||||||||
| (in thousands, except share data) | ||||||||||||||||||||||||
| Balance, December 31, 2011 (115,966,141 shares) |
$ | (994,415 | ) | $ | 22,871 | $ | 1,160 | $ | — | $ | 788 | $ | (969,596 | ) | ||||||||||
| Issuance of common stock (306,025 shares) |
— | — | 3 | 3,463 | — | 3,466 | ||||||||||||||||||
| Repurchase of common stock (508,656 shares) |
— | — | (5 | ) | (13,358 | ) | — | (13,363 | ) | |||||||||||||||
| Share-based compensation |
— | — | — | 25,774 | — | 25,774 | ||||||||||||||||||
| Income tax benefits from share-based award activities |
— | — | — | 465 | — | 465 | ||||||||||||||||||
| Cash dividends paid to common shareholders |
(554,903 | ) | — | — | (12,948 | ) | — | (567,851 | ) | |||||||||||||||
| Investment by noncontrolling interest |
— | — | — | — | 580 | 580 | ||||||||||||||||||
| Net income |
177,546 | — | — | — | (915 | ) | 176,631 | |||||||||||||||||
| Unrealized gain on marketable securities, net of tax |
— | 400 | — | — | — | 400 | ||||||||||||||||||
| Unrealized loss on derivative instruments, net of tax |
— | (6,306 | ) | — | — | — | (6,306 | ) | ||||||||||||||||
| Reclassification adjustments, net of tax |
— | 2,911 | — | — | — | 2,911 | ||||||||||||||||||
| Defined benefit plan adjustments, net of tax |
— | (3,172 | ) | — | — | — | (3,172 | ) | ||||||||||||||||
| Foreign currency translation, net of tax |
— | (9,009 | ) | — | — | 26 | (8,983 | ) | ||||||||||||||||
|
|
|
|
|
|
|
|
|
|
|
|
|
|||||||||||||
| Balance, December 31, 2012 (115,763,510 shares) |
(1,371,772 | ) | 7,695 | 1,158 | 3,396 | 479 | (1,359,044 | ) | ||||||||||||||||
| Issuance of common stock (14,041,620 shares) |
— | — | 141 | 537,398 | — | 537,539 | ||||||||||||||||||
| Stock issuance costs |
— | — | — | (35,439 | ) | — | (35,439 | ) | ||||||||||||||||
| Repurchase of common stock (153,223 shares) |
— | — | (2 | ) | (6,432 | ) | — | (6,434 | ) | |||||||||||||||
| Repurchase of stock options |
— | — | — | (59,064 | ) | — | (59,064 | ) | ||||||||||||||||
| Share-based compensation |
— | — | — | 20,784 | — | 20,784 | ||||||||||||||||||
| Income tax benefits from share-based award activities |
— | — | — | 16,204 | — | 16,204 | ||||||||||||||||||
| Net income |
226,591 | — | — | — | (564 | ) | 226,027 | |||||||||||||||||
| Unrealized gain on marketable securities, net of tax |
— | 3,225 | — | — | — | 3,225 | ||||||||||||||||||
| Unrealized gain on derivative instruments, net of tax |
— | 358 | — | — | — | 358 | ||||||||||||||||||
| Reclassification adjustments, net of tax |
— | 8,744 | — | — | — | 8,744 | ||||||||||||||||||
| Defined benefit plan adjustments, net of tax |
— | 2,278 | — | — | — | 2,278 | ||||||||||||||||||
| Foreign currency translation, net of tax |
— | (22,676 | ) | — | — | 13 | (22,663 | ) | ||||||||||||||||
|
|
|
|
|
|
|
|
|
|
|
|
|
|||||||||||||
| Balance, December 31, 2013 (129,651,907 shares) |
(1,145,181 | ) | (376 | ) | 1,297 | 476,847 | (72 | ) | (667,485 | ) | ||||||||||||||
| Issuance of common stock (2,068,608 shares) |
— | — | 21 | 35,281 | — | 35,302 | ||||||||||||||||||
| Stock issuance costs |
— | — | — | (105 | ) | — | (105 | ) | ||||||||||||||||
| Repurchase of common stock (7,591,175 shares) |
— | — | (76 | ) | (415,055 | ) | — | (415,131 | ) | |||||||||||||||
| Share-based compensation |
— | — | — | 25,315 | — | 25,315 | ||||||||||||||||||
| Income tax benefits from share-based award activities |
— | — | — | 20,303 | — | 20,303 | ||||||||||||||||||
| Net income |
356,383 | — | — | — | 118 | 356,501 | ||||||||||||||||||
| Unrealized loss on marketable securities, net of tax |
— | (600 | ) | — | — | — | (600 | ) | ||||||||||||||||
| Unrealized loss on derivative instruments, net of tax |
— | (5,067 | ) | — | — | — | (5,067 | ) | ||||||||||||||||
| Reclassification adjustments, net of tax |
— | 1,999 | — | — | — | 1,999 | ||||||||||||||||||
| Defined benefit plan adjustments, net of tax |
— | (7,237 | ) | — | — | — | (7,237 | ) | ||||||||||||||||
| Foreign currency translation, net of tax |
— | (47,810 | ) | — | — | 3 | (47,807 | ) | ||||||||||||||||
|
|
|
|
|
|
|
|
|
|
|
|
|
|||||||||||||
| Balance, December 31, 2014 (124,129,340 shares) |
$ | (788,798 | ) | $ | (59,091 | ) | $ | 1,242 | $ | 142,586 | $ | 49 | $ | (704,012 | ) | |||||||||
|
|
|
|
|
|
|
|
|
|
|
|
|
|||||||||||||
The accompanying notes are an integral part of these consolidated financial statements.
73
QUINTILES TRANSNATIONAL HOLDINGS INC. AND SUBSIDIARIES
Notes to Consolidated Financial Statements
1. Summary of Significant Accounting Policies
The Company
Conducting business in approximately 100 countries with approximately 32,600 employees, Quintiles Transnational Holdings Inc. (together with its subsidiaries, the “Company”) is a provider of pharmaceutical development services and commercial outsourcing services that helps its biopharmaceutical customers, as well as customers in the broader healthcare industry, to make decisions regarding drug development, commercialization and drug therapy choices. The Company also offers a number of services designed to address the outcomes and analytical needs of the broader healthcare industry.
Reclassifications
Certain immaterial prior period amounts have been reclassified to conform to the current period presentation. These changes had no effect on previously reported total revenues, net income, comprehensive income or shareholders’ deficit.
Principles of Consolidation
The accompanying consolidated financial statements include the accounts and operations of the Company and its subsidiaries. Amounts pertaining to the noncontrolling ownership interests held in third parties in the operating results and financial position of the Company’s majority-owned subsidiaries are reported as noncontrolling interests. Intercompany accounts and transactions have been eliminated in consolidation.
Use of Estimates
The preparation of financial statements in accordance with generally accepted accounting principles in the United States of America (“GAAP”) requires management to make estimates and assumptions that affect the reported amounts of assets and liabilities, and the disclosure of contingent assets and liabilities, at the date of the financial statements, as well as the reported amounts of revenues and expenses during the period. These estimates are based on historical experience and various other assumptions believed reasonable under the circumstances. The Company evaluates its estimates on an ongoing basis and makes changes to the estimates and related disclosures as experience develops or new information becomes known. Actual results may differ from those estimates.
Foreign Currencies
The Company’s financial statements are reported in United States dollars and, accordingly, fluctuations in exchange rates will affect the translation of its revenues and expenses denominated in foreign currencies into United States dollars for purposes of reporting its consolidated financial results. Assets and liabilities recorded in foreign currencies on the books of foreign subsidiaries are translated at the exchange rate on the balance sheet date. Revenues, costs and expenses are translated at average rates of exchange during the year. Translation adjustments resulting from this process are charged or credited to the accumulated other comprehensive income (loss) (“AOCI”) component of shareholders’ deficit. The Company is subject to foreign currency transaction risk for fluctuations in exchange rates during the period of time between the consummation and cash settlement of a transaction. The Company earns revenue from its service contracts over a period of several months and, in some cases, over a period of several years. Accordingly, exchange rate fluctuations during this period may affect the Company’s profitability with respect to such contracts. Other (income) expense, net includes foreign currency net losses for 2014, 2013 and 2012 of approximately $4.9 million, $4.0 million and $1.1 million, respectively.
74
Cash Equivalents, Restricted Cash and Investments
The Company considers all highly liquid investments with an initial maturity of three months or less when purchased to be cash equivalents. The Company’s restricted cash primarily consisted of amounts collateralizing standby letters of credit issued in favor of certain suppliers and health insurance funds. Investments in marketable equity securities are classified as available-for-sale and measured at fair market value with net unrealized gains and losses recorded in the AOCI component of shareholders’ deficit until realized. The fair market value is based on the closing price as quoted by the respective stock exchange. In addition, the Company has investments in equity securities of companies for which there are not readily available market values and for which the Company does not exercise significant influence or control; such investments are accounted for using the cost method. Any gains or losses from the sales of investments or other-than-temporary declines in fair value are computed by specific identification.
Equity Method Investments
The Company’s investments in and advances to unconsolidated affiliates are accounted for under the equity method if the Company exercises significant influence or has an investment in a limited partnership that is considered to be greater than minor. These investments and advances are classified as investments in and advances to unconsolidated affiliates on the accompanying consolidated balance sheets. The Company records its pro rata share of the earnings, adjusted for accretion of basis difference, of these investments in equity in earnings of unconsolidated affiliates on the accompanying consolidated statements of income. The Company reviews its investments in and advances to unconsolidated affiliates for impairment whenever events or changes in circumstances indicate that the carrying amounts may not be recoverable.
Derivatives
The Company uses derivative instruments to manage exposures to interest rates and foreign currencies. The Company also holds freestanding warrants. Derivatives are recorded on the balance sheet at fair value at each balance sheet date utilizing pricing models for non-exchange-traded contracts. At inception, the Company designates whether or not the derivative instrument is an effective hedge of an asset, liability or firm commitment which is then classified as either a cash flow hedge or a fair value hedge. If determined to be an effective cash flow hedge, changes in the fair value of the derivative instrument are recorded as a component of AOCI until realized. We include the impact from these hedges in the same line item as the hedged item on the consolidated statements of cash flows. Changes in fair value of effective fair value hedges are recorded in earnings as an offset to the changes in the fair value of the related hedged item. Hedge ineffectiveness, if any, is immediately recognized in earnings. Changes in the fair values of derivative instruments that are not an effective hedge are recognized in earnings. The Company has entered, and may in the future enter, into derivative contracts (swaps, forwards, calls or puts, warrants, for example) related to its debt, investments in marketable equity securities and forecasted foreign currency transactions.
Billed and Unbilled Services and Unearned Income
In general, prerequisites for billings and payments are established by contractual provisions including predetermined payment schedules, which may or may not correspond to the timing of the performance of services under the contract. Unbilled services arise when services have been rendered for which revenue has been recognized but the customers have not been billed.
In some cases, payments received are in excess of revenue recognized. Payments received in advance of services being provided are deferred as unearned income on the consolidated balance sheet. As the contracted services are subsequently performed and the associated revenue is recognized, the unearned income balance is reduced by the amount of the revenue recognized during the period.
75
Allowance for Doubtful Accounts
The Company’s allowance for doubtful accounts is determined based on a variety of factors that affect the potential collectability of the related receivables, including length of time the receivables are past due, customer credit ratings, financial stability of the customer, specific one-time events and past customer history. In addition, in circumstances where the Company is made aware of a specific customer’s inability to meet its financial obligations, a specific allowance is established. The accounts are individually evaluated on a regular basis and appropriate reserves are established as deemed appropriate based on the above criteria.
Receivables Financing Facility
Advances received under the Company’s receivables financing facility are accounted for as borrowings secured by the receivables and included in net cash provided by financing activities. The Company services the collateralized accounts receivable and the cash flows for the underlying receivables are included in cash provided by operating activities. The collateralized accounts receivable are included in trade accounts receivable and unbilled services, net.
Business Combinations
Business combinations are accounted for using the acquisition method, and accordingly, the identifiable assets acquired, the liabilities assumed, and any noncontrolling interest in the acquiree are recorded at their estimated fair values on the date of the acquisition. Goodwill represents the excess of the purchase price over the estimated fair value of the net assets acquired, including the amount assigned to identifiable intangible assets. When a business combination involves contingent consideration, the Company recognizes a liability equal to the estimated fair value of the contingent consideration obligation at the date of the acquisition. Subsequent changes in the estimated fair value of the contingent consideration are recognized in earnings in the period of the change.
Long-Lived Assets
Property and equipment are stated at cost and are depreciated using the straight-line method over the shorter of the asset’s estimated useful life or the lease term, if related to leased property, as follows:
| Buildings and leasehold improvements |
3 - 40 years | |||
| Equipment |
3 - 10 years | |||
| Furniture and fixtures |
5 - 10 years | |||
| Motor vehicles |
3 - 5 years |
Definite-lived identifiable intangible assets are amortized primarily using an accelerated method that reflects the pattern in which the Company expects to benefit from the use of the asset over its estimated remaining useful life as follows:
| Trademarks and trade names |
3 - 7 years | |||
| Product licensing and distribution rights |
1 year | |||
| Non-compete agreements |
1 - 4 years | |||
| Contract backlog and customer relationships |
1 - 11 years | |||
| Software and related assets |
3 - 10 years |
Goodwill and indefinite-lived identifiable intangible assets, which consist of certain trade names, are not amortized but evaluated for impairment annually, or more frequently if events or changes in circumstances indicate an impairment.
76
Included in software and related items is the capitalized cost of internal-use software used in supporting the Company’s business. Qualifying costs incurred during the application development stage are capitalized and amortized over their estimated useful lives. The Company recognized $33.1 million, $32.2 million and $27.4 million of amortization expense in 2014, 2013 and 2012, respectively, related to software and related assets.
The carrying values of property, equipment and intangible and other long-lived assets are reviewed for recoverability if the facts and circumstances suggest that a potential impairment may have occurred. If this review indicates that carrying values will not be recoverable, as determined based on undiscounted cash flow projections, the Company will record an impairment charge to reduce carrying values to estimated fair value. There were no events, facts or circumstances in 2014, 2013 and 2012 that resulted in any impairment charges to the Company’s property, equipment, intangible or other long-lived assets.
Revenue Recognition
The Company recognizes revenue when all of the following conditions are satisfied: (1) there is persuasive evidence of an arrangement; (2) the service offering has been delivered to the customer; (3) the collection of the fees is probable; and (4) the arrangement consideration is fixed or determinable. The Company’s arrangements are primarily service contracts that range in duration from a few months to several years. Most contracts may be terminated upon 30 to 90 days notice by the customer, however, in the event of termination, contract provisions typically require payment for services rendered through the date of termination, as well as for subsequent services rendered to close out the contract.
In some cases, contracts provide for consideration that is contingent upon the occurrence of uncertain future events. The Company recognizes contingent revenue when the contingency has been resolved and all other criteria for revenue recognition have been met. The Company treats cash payments to customers as incentives to induce the customers to enter into such a service agreement with the Company. The related asset is amortized as a reduction of revenue over the period the services are performed. The Company records revenues net of any tax assessments by governmental authorities, such as value added taxes, that are imposed on and concurrent with specific revenue generating transactions. The Company does not recognize revenue with respect to start-up activities including contract and scope negotiation, feasibility analysis and conflict of interest review associated with contracts. The costs for these activities are expensed as incurred.
For the arrangements that include multiple elements, arrangement consideration is allocated to units of accounting based on the relative selling price. The best evidence of selling price of a unit of accounting is vendor-specific objective evidence (“VSOE”), which is the price the Company charges when the deliverable is sold separately. When VSOE is not available to determine selling price, management uses relevant third-party evidence (“TPE”) of selling price, if available. When neither VSOE nor TPE of selling price exists, management uses its best estimate of selling price considering all relevant information that is available without undue cost and effort.
The majority of the Company’s contracts within the Product Development segment are service contracts for clinical research that represent a single unit of accounting. The Company recognizes revenue on its clinical research services contracts as services are performed primarily on a proportional-performance basis, generally using output measures that are specific to the service provided. Examples of output measures include among others, number of investigators enrolled, number of site initiation visits and number of monitoring visits completed. Revenue is determined by dividing the actual units of work completed by the total units of work required under the contract and multiplying that ratio by the total contract value. The total contract value, or total contractual payments, represents the aggregate contracted price for each of the agreed upon services to be provided. Changes in the scope of work are common, especially under long-term contracts, and generally result in a change in contract value. Once the customer has agreed to the changes in scope and renegotiated pricing terms, the contract value is amended and revenue is recognized, as described above. To the extent that contracts involve multiple elements, the Company follows the allocation methodology described above and recognizes revenue for each unit of accounting on a proportional performance basis.
77
The Company derives the majority of its revenues in its Integrated Healthcare Services segment from providing commercialization services on a fee-for-service basis to customers within the biopharmaceutical industry. Fees on these arrangements are billed based on a contractual per-diem or hourly rate basis. The Company recognizes revenue on commercialization services contracts primarily on a time and materials basis. Some of the Company’s commercialization contracts are multiple element arrangements, with elements including recruiting, training and deployment of sales representatives. The nature of the terms of these multiple element arrangements will vary based on the customized needs of the Company’s customers. For contracts that have multiple elements, the Company follows the allocation methodology described above and recognizes revenue for each unit of accounting on a time and materials basis. The Company’s commercialization contracts sometimes include variable fees that are based on a percentage of product sales (royalty payments). The Company recognizes revenue on royalty payments when the variable components become fixed or determinable and all other revenue recognition criteria have been met, which generally only occurs upon the sale of the underlying product(s) and upon the Company’s receipt of information necessary to make a reasonable estimate.
Reimbursed Expenses
The Company includes reimbursed expenses in total revenues and costs of revenue as the Company is deemed to be the primary obligor in the applicable arrangements. These costs include such items as payments to investigators and travel expenses for the Company’s clinical monitors and sales representatives.
Expenses
Costs of revenue include reimbursed expenses, compensation and benefits for billable employees, depreciation of assets used in generating revenue and other expenses directly related to service contracts such as courier fees and laboratory supplies for the Company’s laboratory services, professional services and travel expenses. Selling, general and administrative expenses primarily include costs related to administrative functions such as compensation and benefits, travel, professional services, training and expenses for advertising, information technology, facilities and depreciation and amortization.
Concentration of Credit Risk
Financial instruments that subject the Company to credit risk primarily consist of cash and cash equivalents, marketable securities and accounts receivable. The Company maintains its cash and cash equivalent balances with high-quality financial institutions and, consequently, the Company believes that such funds are subject to minimal credit risk. Investment policies have been implemented that limit purchases of marketable securities to investment grade securities. Substantially all service revenues for Product Development and Integrated Healthcare Services are earned by performing services under contracts with various pharmaceutical, biotechnology, medical device and healthcare companies. The concentration of credit risk is equal to the outstanding accounts receivable and unbilled services balances, less the unearned income related thereto, and such risk is subject to the financial and industry conditions of the Company’s customers. The Company does not require collateral or other securities to support customer receivables. Credit losses have been immaterial and reasonably within management’s expectations. No customer accounted for 10.0% or more of consolidated service revenues in 2014, 2013 or 2012.
Research and Development Costs
Research and development costs consist primarily of employee compensation and related expenses and information technology contract services. The following is a summary of the research and development expenses (in thousands):
| Year Ended December 31, | ||||||||||||
| 2014 | 2013 | 2012 | ||||||||||
| Internally developed software applications and computer technology |
$ | 4,980 | $ | 3,955 | $ | 9,907 | ||||||
| Funding of customer’s research and development activity |
811 | 1,000 | — | |||||||||
| Collaboration agreement with HUYA |
— | — | 519 | |||||||||
|
|
|
|
|
|
|
|||||||
| $ | 5,791 | $ | 4,955 | $ | 10,426 | |||||||
|
|
|
|
|
|
|
|||||||
78
In January 2010, the Company entered into a collaboration agreement with a related party, HUYA Bioscience International, LLC (“HUYA”), to fund up to $2.3 million of its research and development activity for a specific compound. The funding consisted of $1.0 million in cash which was paid and expensed in 2010 and $1.3 million of services provided by the Company, which have been fully provided. In return for the $2.3 million in funding, the Company had the potential to receive additional consideration which contractually may not exceed $16.5 million excluding interest if certain events were to occur. In February 2015, the Company and HUYA agreed to terminate the collaboration agreement. In connection with the termination, HUYA agreed to pay the Company $5.0 million to satisfy all of HUYA’s various payment obligations under the collaboration agreement.
Advertising Costs
Advertising costs, which include the development and production of advertising materials and the communication of these materials, are charged to expense as incurred. The Company incurred approximately $16.0 million, $14.8 million and $14.5 million in advertising expense in 2014, 2013 and 2012, respectively.
Restructuring Costs
Restructuring costs, which primarily include termination benefits and facility closure costs, are recorded at estimated fair value. Key assumptions in determining the restructuring costs include the terms and payments that may be negotiated to terminate certain contractual obligations and the timing of employees leaving the Company.
Contingencies
The Company records accruals for claims, suits, investigations and proceedings when it is probable that a liability has been incurred and the amount of the loss can be reasonably estimated. The Company reviews claims, suits, investigations and proceedings at least quarterly and records or adjusts accruals related to such matters to reflect the impact and status of any settlements, rulings, advice of counsel or other information pertinent to a particular matter. Legal costs associated with contingencies are charged to expense as incurred.
The Company is party to legal proceedings incidental to its business. While the outcome of these matters could differ from management’s expectations, the Company does not believe the resolution of these matters has a reasonable possibility of having a material adverse effect to the Company’s financial statements.
Income Taxes
Income tax expense includes United States federal, state and international income taxes. Certain items of income and expense are not reported in income tax returns and financial statements in the same year. The income tax effects of these differences are reported as deferred income taxes. Valuation allowances are provided to reduce the related deferred income tax assets to an amount which will, more likely than not, be realized. Beginning in 2013, the undistributed earnings of most of the Company’s foreign subsidiaries are considered to be indefinitely reinvested outside of the United States. Accordingly, a deferred income tax liability has not been provided related to those undistributed earnings. Interest and penalties related to unrecognized income tax benefits are recognized as a component of income tax expense as discussed further in Note 16.
Employee Stock Compensation
The Company accounts for share-based compensation for stock options and stock appreciation rights (“SARs”) under the fair value method and uses the Black-Scholes-Merton model to estimate the value of such share-based awards granted to its employees and non-executive directors. Expected volatility is based upon the historical volatility of a peer group for a period equal to the expected term, as the Company does not have adequate history to calculate its own volatility and believes the expected volatility will approximate the historical volatility of the peer group. Prior to the completion of the Company’s initial public offering (“IPO”) on May 14, 2013, the expected dividends were based on the historical dividends paid by the Company, excluding dividends that resulted from activities that the Company deemed to be one-time in nature. Following the IPO, the Company
79
does not currently anticipate paying dividends. The expected term represents the period of time the grants are expected to be outstanding. The risk-free interest rate is based on the United States Treasury yield curve in effect at the time of the grant.
The Company accounts for its share-based compensation for restricted stock units (“RSUs”) based on the closing market price of the Company’s common stock on the date of grant.
The Company recognized share-based compensation expense of $30.0 million, $22.8 million and $25.9 million in 2014, 2013 and 2012, respectively. Share-based compensation expense is included in selling, general and administrative expenses on the accompanying consolidated statements of income based upon the classification of the employees who were granted the share-based awards. The associated future income tax benefit recognized was $7.6 million, $8.1 million and $6.9 million in 2014, 2013 and 2012, respectively. As of December 31, 2014, there was approximately $38.4 million of total unrecognized share-based compensation expense related to outstanding non-vested share-based compensation arrangements, which the Company expects to recognize over a weighted average period of 1.5 years.
Earnings Per Share
The calculation of earnings per share is based on the weighted average number of common shares or common stock equivalents outstanding during the applicable period. The dilutive effect of common stock equivalents is excluded from basic earnings per share and is included in the calculation of diluted earnings per share. Potentially dilutive securities include outstanding stock options, shares to be purchased under the Company’s employee stock purchase plan (see Note 17) and unvested RSUs.
Recently Issued Accounting Standards
In May 2014, the United States Financial Accounting Standards Board and the International Accounting Standards Board issued a converged standard on the recognition of revenue from contracts with customers. The objective of the new standard is to establish a single comprehensive revenue recognition model that is designed to create greater comparability of financial statements across industries and jurisdictions. Under the new standard, companies will recognize revenue to depict the transfer of goods or services to customers in amounts that reflect the consideration to which the company expects to be entitled in exchange for those goods or services. The new standard also will require expanded disclosures on revenue recognition and changes in assets and liabilities that result from contracts with customers. The Company will adopt the new standard on January 1, 2017, as required. Early adoption is not permitted. The Company is currently evaluating the impact of this new standard on its consolidated financial statements.
2. Accounts Receivable and Unbilled Services
Accounts receivable and unbilled services consist of the following (in thousands):
| December 31, | ||||||||
| 2014 | 2013 | |||||||
| Trade: |
||||||||
| Billed |
$ | 444,941 | $ | 408,959 | ||||
| Unbilled services |
532,312 | 516,942 | ||||||
|
|
|
|
|
|||||
| 977,253 | 925,901 | |||||||
| Allowance for doubtful accounts |
(1,998 | ) | (1,696 | ) | ||||
|
|
|
|
|
|||||
| $ | 975,255 | $ | 924,205 | |||||
|
|
|
|
|
|||||
80
Substantially all of the Company’s trade accounts receivable and unbilled services are due from companies in the pharmaceutical, biotechnology, medical device and healthcare industries and are a result of contract research, sales, marketing, healthcare consulting and health information management services provided by the Company on a global basis. The percentage of accounts receivable and unbilled services by region is as follows:
| December 31, | ||||||||
| 2014 | 2013 | |||||||
| Americas: |
||||||||
| United States |
55 | % | 53 | % | ||||
| Other |
2 | 2 | ||||||
|
|
|
|
|
|||||
| Americas |
57 | 55 | ||||||
| Europe and Africa: |
||||||||
| United Kingdom |
23 | 25 | ||||||
| Other |
11 | 12 | ||||||
|
|
|
|
|
|||||
| Europe and Africa |
34 | 37 | ||||||
| Asia-Pacific: |
||||||||
| Japan |
4 | 4 | ||||||
| Other |
5 | 4 | ||||||
|
|
|
|
|
|||||
| Asia-Pacific |
9 | 8 | ||||||
|
|
|
|
|
|||||
| 100 | % | 100 | % | |||||
|
|
|
|
|
|||||
3. Investments—Debt, Equity and Other Securities
The following is a summary of the Company’s debt, equity and other securities (in thousands):
| December 31, | ||||||||
| 2014 | 2013 | |||||||
| Marketable securities |
$ | 831 | $ | 7,668 | ||||
| Cost method |
33,672 | 32,681 | ||||||
|
|
|
|
|
|||||
| $ | 34,503 | $ | 40,349 | |||||
|
|
|
|
|
|||||
Investments in Marketable Securities:
The following is a summary of available-for-sale securities (in thousands):
| December 31, 2014 | December 31, 2013 | |||||||||||||||||||||||
| Available-for-Sale Securities |
Amortized Cost | Gross Unrealized Loss |
Market Value | Amortized Cost | Gross Unrealized Gains |
Market Value | ||||||||||||||||||
| Marketable equity |
$ | 1,103 | $ | (272 | ) | $ | 831 | $ | 1,960 | $ | 5,708 | $ | 7,668 | |||||||||||
The Company recognized a $5.0 million gain from the sale of marketable equity securities in 2014. The Company did not recognize any gains from the sale of marketable equity securities in 2013 and 2012. The Company did not recognize any losses from the sale of marketable equity securities in 2014, 2013 and 2012.
The net after-tax adjustment to unrealized holding gains (losses) on available-for-sale securities included in the AOCI component of shareholders’ deficit was ($170,000), $3.5 million and $284,000 in 2014, 2013 and 2012, respectively.
The Company’s policy is to continually review declines in fair value of marketable equity securities for declines that may be other than temporary. As part of this review, the Company considers the financial statements of the investee, analysts’ reports, duration of the decline in fair value and general market factors. The
81
Company did not recognize any such losses in 2014, 2013 and 2012. At December 31, 2014, the marketable equity security was in an unrealized loss position. This investment has been in an unrealized loss position for less than one year as of December 31, 2014 and is expected to recover its value.
Investments—Cost Method
The Company has investments in equity securities of companies for which there are not readily available market values and for which the Company does not exercise significant influence or control. These investments are accounted for using the cost method. Below is a summary of the Company’s portfolio of cost method investments (in thousands):
| December 31, | ||||||||
| 2014 | 2013 | |||||||
| Equity investments |
$ | 32,516 | $ | 32,516 | ||||
| Convertible notes |
1,156 | 165 | ||||||
|
|
|
|
|
|||||
| $ | 33,672 | $ | 32,681 | |||||
|
|
|
|
|
|||||
On February 25, 2011, the Company and the Samsung Group entered into an agreement to form a joint venture intended to provide biopharmaceutical contract manufacturing services in South Korea. The Company committed to invest up to $30.0 million for a noncontrolling interest and has funded all of this commitment. As of December 31, 2014 and 2013, the Company has an approximately 3.0% and 5.1%, respectively, ownership interest in the joint venture.
In December 2011, the Company and Intarcia Therapeutics (“Intarcia”) entered into an alliance to develop a new therapy for type 2 diabetes whereby Intarcia will use the Company to conduct Phase III pivotal trials and a cardiovascular outcomes trial. Under the alliance, the Company provided Intarcia a customer incentive of $12.5 million and acquired $5.0 million of preferred stock of Intarcia. The customer incentive is being amortized in proportion to the revenues earned as a reduction of revenue recorded under the service arrangements. As of December 31, 2014 and 2013, the customer incentive of $7.1 million and $10.7 million, respectively, was recorded in deposits and other assets on the accompanying consolidated balance sheets. The $5.0 million investment in preferred stock of Intarcia is recorded in “investments—debt, equity and other securities” on the accompanying consolidated balance sheets.
The Company reviews the carrying value of each individual investment at each balance sheet date to determine whether or not an other-than-temporary decline in fair value has occurred. The Company employs alternative valuation techniques including the following: (i) the review of financial statements including assessments of liquidity, (ii) the review of valuations available to the Company prepared by independent third parties used in raising capital, (iii) the review of publicly available information including press releases and (iv) direct communications with the investee’s management, as appropriate. If the review indicates that such a decline in fair value has occurred, the Company adjusts the carrying value to the estimated fair value of the investment and recognizes a loss for the amount of the adjustment.
82
4. Investments in and Advances to Unconsolidated Affiliates
The Company accounts for its investments in and advances to unconsolidated affiliates under the equity method of accounting and records its pro rata share of its losses or earnings from these investments in equity in (losses) earnings of unconsolidated affiliates. The following is a summary of the Company’s investments in and advances to unconsolidated affiliates (in thousands):
| December 31, | ||||||||
| 2014 | 2013 | |||||||
| NovaQuest Pharma Opportunities Fund III, L.P. |
$ | 22,633 | $ | 11,792 | ||||
| Oxford Cancer Biomarkers |
— | 4,141 | ||||||
| Cenduit™ |
8,271 | 6,431 | ||||||
| Other |
604 | 563 | ||||||
|
|
|
|
|
|||||
| $ | 31,508 | $ | 22,927 | |||||
|
|
|
|
|
|||||
NovaQuest Pharma Opportunities Funds
In November 2010, the Company committed to invest up to $60 million as a limited partner in NovaQuest Pharma Opportunities Fund III, L.P. (“the Fund”). In November 2013, the Company sold $10.0 million of this commitment, thus, reducing the total commitment to $50.0 million. The Company had funded approximately $2.9 million of this commitment which had a carrying value of approximately $2.2 million. The Company received approximately $2.3 million for the funded portion of the commitment it sold. As of December 31, 2014, the Company has approximately $25.0 million of remaining funding commitments to the Fund. As of December 31, 2014 and 2013, the Company has a 10.9% ownership interest in the Fund.
In February 2015, the Company committed to invest up to $20 million as a limited partner in a new private equity fund, NovaQuest Pharma Opportunities Fund IV, L.P.
Oxford Cancer Biomarkers
In January 2012, the Company invested approximately $4.7 million in Oxford Cancer Biomarkers (“OCB”). The Company has a 30.0% ownership interest in Oxford Cancer Biomarkers. During 2014, the Company recognized a loss of $3.5 million due to a decline in fair value of OCB that was deemed by management to be other than temporary.
Cenduit™
In May 2007, the Company and Thermo Fisher Scientific Inc. (“Thermo Fisher”) completed the formation of a joint venture, Cenduit™. The Company contributed its Interactive Response Technology operations in India and the United States. Thermo Fisher contributed its Fisher Clinical Services Interactive Response Technology operations in three locations—the United Kingdom, the United States and Switzerland. Additionally, each company contributed $3.5 million in initial capital. The Company and Thermo Fisher each own 50% of Cenduit™.
5. Derivatives
As of December 31, 2014, the Company held the following derivative positions: (i) freestanding warrants to purchase shares of common stock of third parties, (ii) forward exchange contracts to protect against foreign exchange movements for certain forecasted foreign currency cash flows related to service contracts and (iii) interest rate swaps to hedge the exposure to variability in interest payments on variable interest rate debt. The Company does not use derivative financial instruments for speculative or trading purposes.
As of December 31, 2014, the Company had freestanding warrants to purchase shares of third parties’ common stock. No quoted price is available for the warrants. Accordingly, the Company uses various valuation techniques to value the warrants, including the present value of estimated expected future cash flows, option-
83
pricing models and fundamental analysis. Factors affecting the valuation include the current price of the underlying common stock, the exercise price of the warrants, the expected time to exercise the warrants, the estimated price volatility of the underlying common stock over the life of the warrants and the restrictions on the transferability of or ability to exercise the warrants. The Company did not sell any warrants in 2014, 2013 or 2012.
As of December 31, 2014, the Company had 13 open foreign exchange forward contracts to hedge certain forecasted foreign currency cash flow transactions occurring in 2015 with notional amounts totaling $76.0 million. As of December 31, 2013, the Company had 12 open foreign exchange forward contracts to hedge certain forecasted foreign currency transactions which occurred in 2014 with notional amounts totaling $60.8 million. As these contracts were executed to hedge the risk of the potential volatility in the cash flows resulting from fluctuations in currency exchange rates during the first nine months of 2015, these transactions are accounted for as cash flow hedges. As such, the effective portion of the gain or loss on the contracts is recorded as unrealized gains (losses) on derivatives included in the AOCI component of shareholders’ deficit. These hedges are highly effective. As of December 31, 2014 and 2013, the Company had recorded gross unrealized losses of $4.6 million and gains of $3.95 million, respectively, related to foreign exchange forward contracts. Upon expiration of the hedge instruments in 2015, the Company will reclassify the unrealized holding gains and losses on the derivative instruments included in AOCI into earnings. The unrealized losses are included in other current liabilities and the unrealized gains are included in other current assets on the accompanying consolidated balance sheets as of December 31, 2014 and 2013, respectively.
As of December 31, 2011, the Company, through its acquired subsidiary, Outcome Sciences, Inc. (“Outcome”), had open foreign exchange forward contracts to protect against the effects of foreign currency fluctuations on certain foreign currency cash flow transactions occurring in 2012. The derivative instruments that matured in 2012 had not been designated as hedges and, as a result, changes in the fair value were recorded as other (income) expense, net. The Company recognized $588,000 of losses related to these foreign exchange forward contracts as other (income) expense, net on the accompanying consolidated statement of income for the year ended December 31, 2012. All of these contracts matured in 2012.
On June 9, 2011, the Company entered into six interest rate swaps effective September 28, 2012 and expiring between September 30, 2013 and March 31, 2016 in an effort to limit its exposure to changes in the variable interest rate on its senior secured credit facilities. The critical terms of the interest rate swaps were substantially the same as those of the Company’s senior secured credit facilities, including quarterly interest settlements. These interest rate swaps are being accounted for as cash flow hedges as these transactions were executed to hedge the Company’s interest payments, and these hedges are deemed to be highly effective. As such, changes in the fair value of these derivative instruments are recorded as unrealized gains (losses) on derivatives included in the AOCI component of shareholders’ deficit. As of December 31, 2014 and 2013, the unrealized losses included in AOCI were $14.4 million and $24.8 million, respectively. The fair value of these interest rate swaps represents the present value of the anticipated net payments the Company will make to the counterparty, which, when they occur, are reflected as interest expense on the consolidated statements of income. These payments, together with the variable rate of interest incurred on the underlying debt, result in a fixed rate of interest of 2.57% plus the applicable margin on the affected borrowings ($910.0 million or 44.8% of the Company’s variable rate debt under its senior secured credit facilities at December 31, 2014). The Company expects that $12.2 million of unrealized losses will be reclassified out of AOCI and will form the interest rate swap component of the 2.57% fixed rate of interest to be incurred over the next 12 months as the underlying net payments are settled.
84
The fair values of the Company’s derivative instruments designated as hedging instruments and the line items on the accompanying consolidated balance sheets to which they were recorded are summarized in the following table (in thousands):
| December 31, | ||||||||||
| Balance Sheet Classification | 2014 | 2013 | ||||||||
| Foreign exchange forward contracts |
Other current assets | $ | — | $ | 3,950 | |||||
| Foreign exchange forward contracts |
Other current liabilities | $ | 4,635 | $ | — | |||||
| Interest rate swaps |
Other current liabilities | $ | 14,424 | $ | 24,805 | |||||
The effect of the Company’s cash flow hedging instruments on other comprehensive income (loss) is summarized in the following table (in thousands):
| Year Ended December 31, | ||||||||||||
| 2014 | 2013 | 2012 | ||||||||||
| Foreign exchange forward contracts |
$ | (8,585 | ) | $ | 3,485 | $ | 2,327 | |||||
| Interest rate swaps |
10,381 | 9,202 | (9,524 | ) | ||||||||
|
|
|
|
|
|
|
|||||||
| Total |
$ | 1,796 | $ | 12,687 | $ | (7,197 | ) | |||||
|
|
|
|
|
|
|
|||||||
6. Fair Value Measurements
The Company records certain assets and liabilities at fair value. Fair value is defined as the price that would be received to sell an asset or paid to transfer a liability in the principal or most advantageous market for the asset or liability in an orderly transaction between market participants at the measurement date. A three-level fair value hierarchy that prioritizes the inputs used to measure fair value is described below. This hierarchy requires entities to maximize the use of observable inputs and minimize the use of unobservable inputs. The three levels of inputs used to measure fair value are as follows:
| • | Level 1—Quoted prices in active markets for identical assets or liabilities. |
| • | Level 2—Observable inputs other than quoted prices included in Level 1, such as quoted prices for similar assets and liabilities in active markets; quoted prices for identical or similar assets and liabilities in markets that are not active; or other inputs that are observable or can be corroborated by observable market data. |
| • | Level 3—Unobservable inputs that are supported by little or no market activity. This includes certain pricing models, discounted cash flow methodologies and similar techniques that use significant unobservable inputs. |
Recurring Fair Value Measurements
The following table summarizes the fair value of the Company’s financial assets and liabilities that are measured on a recurring basis as of December 31, 2014 (in thousands):
| Level 1 | Level 2 | Level 3 | Total | |||||||||||||
| Assets: |
||||||||||||||||
| Marketable equity securities |
$ | 831 | $ | — | $ | — | $ | 831 | ||||||||
| Warrants |
— | — | 4 | 4 | ||||||||||||
|
|
|
|
|
|
|
|
|
|||||||||
| Total |
$ | 831 | $ | — | $ | 4 | $ | 835 | ||||||||
|
|
|
|
|
|
|
|
|
|||||||||
| Liabilities: |
||||||||||||||||
| Foreign exchange forward contracts |
$ | — | $ | 4,635 | $ | — | $ | 4,635 | ||||||||
| Interest rate swaps |
— | 14,424 | — | 14,424 | ||||||||||||
| Contingent consideration |
— | — | 1,452 | 1,452 | ||||||||||||
|
|
|
|
|
|
|
|
|
|||||||||
| Total |
$ | — | $ | 19,059 | $ | 1,452 | $ | 20,511 | ||||||||
|
|
|
|
|
|
|
|
|
|||||||||
85
The following table summarizes the fair value of the Company’s financial assets and liabilities that are measured on a recurring basis as of December 31, 2013 (in thousands):
| Level 1 | Level 2 | Level 3 | Total | |||||||||||||
| Assets: |
||||||||||||||||
| Marketable equity securities |
$ | 7,668 | $ | — | $ | — | $ | 7,668 | ||||||||
| Foreign exchange forward contracts |
— | 3,950 | — | 3,950 | ||||||||||||
| Warrants |
— | — | 211 | 211 | ||||||||||||
|
|
|
|
|
|
|
|
|
|||||||||
| Total |
$ | 7,668 | $ | 3,950 | $ | 211 | $ | 11,829 | ||||||||
|
|
|
|
|
|
|
|
|
|||||||||
| Liabilities: |
||||||||||||||||
| Interest rate swaps |
$ | — | $ | 24,805 | $ | — | $ | 24,805 | ||||||||
| Contingent consideration |
— | — | 13,014 | 13,014 | ||||||||||||
|
|
|
|
|
|
|
|
|
|||||||||
| Total |
$ | — | $ | 24,805 | $ | 13,014 | $ | 37,819 | ||||||||
|
|
|
|
|
|
|
|
|
|||||||||
Below is a summary of the valuation techniques used in determining fair value:
Marketable equity securities—The Company values marketable equity securities utilizing quoted market prices.
Foreign exchange forward contracts—The Company values foreign exchange forward contracts using quoted market prices for identical instruments in less active markets or using other observable inputs.
Warrants—The Company values warrants utilizing the Black-Scholes-Merton model.
Interest rate swaps—The Company values interest rate swaps using market inputs with mid-market pricing as a practical expedient for bid-ask spread.
Contingent consideration—The Company values contingent consideration related to business combinations using a weighted probability calculation of potential payment scenarios discounted at rates reflective of the risks associated with the expected future cash flows. Key assumptions used to estimate the fair value of contingent consideration include revenue, net new business and operating forecasts and the probability of achieving the specific targets.
The following table summarizes the changes in Level 3 financial assets and liabilities measured on a recurring basis for the year ended December 31 (in thousands):
| Warrants—Deposits and Other Assets |
Contingent Consideration—Accrued Expenses and Other Liabilities |
|||||||||||||||||||||||
| 2014 | 2013 | 2012 | 2014 | 2013 | 2012 | |||||||||||||||||||
| Balance as of January 1 |
$ | 211 | $ | 29 | $ | 12 | $ | 13,014 | $ | 3,521 | $ | 6,165 | ||||||||||||
| Initial estimate of contingent consideration |
— | — | — | — | 14,300 | 1,990 | ||||||||||||||||||
| Contingent consideration paid |
— | — | — | (3,000 | ) | — | — | |||||||||||||||||
| Revaluations included in earnings |
(207 | ) | 182 | 17 | (8,562 | ) | (4,807 | ) | (4,634 | ) | ||||||||||||||
|
|
|
|
|
|
|
|
|
|
|
|
|
|||||||||||||
| Balance as of December 31 |
$ | 4 | $ | 211 | $ | 29 | $ | 1,452 | $ | 13,014 | $ | 3,521 | ||||||||||||
|
|
|
|
|
|
|
|
|
|
|
|
|
|||||||||||||
The revaluations for the warrants and the contingent consideration are recognized in other (income) expense, net on the accompanying consolidated statements of income.
86
Non-recurring Fair Value Measurements
Certain assets are carried on the accompanying consolidated balance sheets at cost and are not remeasured to fair value on a recurring basis. These assets include cost and equity method investments and loans that are written down to fair value for declines which are deemed to be other-than-temporary, and goodwill and identifiable intangible assets which are tested for impairment annually and when a triggering event occurs.
As of December 31, 2014, assets carried on the balance sheet and not remeasured to fair value on a recurring basis totaling approximately $809.8 million were identified as Level 3. These assets are comprised of cost and equity method investments of $65.2 million, goodwill of $464.4 million and other identifiable intangibles, net of $280.2 million.
The Company has unfunded cash commitments totaling approximately $25.0 million related to its cost and equity method investments as of December 31, 2014.
Cost and Equity Method Investments—The inputs available for valuing investments in non-public portfolio companies are generally not easily observable. The valuation of non-public investments requires significant judgment by the Company due to the absence of quoted market values, inherent lack of liquidity and the long-term nature of such assets. When a triggering event occurs, the Company considers a wide range of available market data when assessing the estimated fair value. Such market data includes observations of the trading multiples of public companies considered comparable to the private companies being valued as well as publicly disclosed merger transactions involving comparable private companies. In addition, valuations are adjusted to account for company-specific issues, the lack of liquidity inherent in a non-public investment and the fact that comparable public companies are not identical to the companies being valued. Such valuation adjustments are necessary because in the absence of a committed buyer and completion of due diligence similar to that performed in an actual negotiated sale process, there may be company-specific issues that are not fully known that may affect value. Further, a variety of additional factors are reviewed by the Company, including, but not limited to, financing and sales transactions with third parties, current operating performance and future expectations of the particular investment, changes in market outlook and the third party financing environment. Because of the inherent uncertainty of valuations, estimated valuations may differ significantly from the values that would have been used had a ready market for the securities existed, and the differences could be material.
Goodwill—Goodwill represents the difference between the purchase price and the fair value of the identifiable tangible and intangible net assets resulting from business combinations. The Company performs a qualitative analysis to determine whether it is more likely than not that the estimated fair value of a reporting unit is less than its book value. This includes a qualitative analysis of macroeconomic conditions, industry and market considerations, internal cost factors, financial performance, fair value history and other company specific events. If this qualitative analysis indicates that it is more likely than not that the estimated fair value is less than the book value for the respective reporting unit, the Company applies a two-step impairment test in which the Company determines whether the estimated fair value of the reporting unit is in excess of its carrying value. If the carrying value of the net assets assigned to the reporting unit exceeds the estimated fair value of the reporting unit, the Company performs the second step of the impairment test to determine the implied estimated fair value of the reporting unit’s goodwill. The Company determines the implied estimated fair value of goodwill by determining the present value of the estimated future cash flows for each reporting unit and comparing the reporting unit’s risk profile and growth prospects to selected, reasonably similar publicly traded companies. No indication of impairment was identified during the Company’s annual review.
Definite-lived Intangible Assets—If a triggering event occurs, the Company determines the estimated fair value of definite-lived intangible assets by determining the present value of the expected cash flows.
Indefinite-lived Intangible Asset—The Company performs a qualitative analysis to determine whether it is more likely than not that the estimated fair value of the indefinite-lived intangible asset is less than its carrying value. If this qualitative analysis indicates that it is more likely than not that the estimated fair value is less than the carrying value of the indefinite-lived intangible asset, the Company determines the estimated fair value of the
87
indefinite-lived intangible asset (trade name) by determining the present value of the estimated royalty payments on an after-tax basis that it would be required to pay the owner for the right to use such trade name. If the carrying amount exceeds the estimated fair value, an impairment loss is recognized in an amount equal to the excess. No indication of impairment was identified during the Company’s annual review.
7. Property and Equipment
The major classes of property and equipment were as follows (in thousands):
| December 31, | ||||||||
| 2014 | 2013 | |||||||
| Land, buildings and leasehold improvements |
$ | 185,940 | $ | 184,726 | ||||
| Equipment |
240,227 | 222,858 | ||||||
| Furniture and fixtures |
54,615 | 55,741 | ||||||
| Motor vehicles |
15,443 | 17,801 | ||||||
|
|
|
|
|
|||||
| 496,225 | 481,126 | |||||||
| Less accumulated depreciation |
(305,928 | ) | (281,548 | ) | ||||
|
|
|
|
|
|||||
| $ | 190,297 | $ | 199,578 | |||||
|
|
|
|
|
|||||
8. Goodwill and Identifiable Intangible Assets
As of December 31, 2014, the Company has approximately $280.2 million of identifiable intangible assets, of which approximately $109.7 million, relating to a trade name, is deemed to be indefinite-lived and, accordingly, is not being amortized. Amortization expense associated with identifiable definite-lived intangible assets was as follows (in thousands):
| Year Ended December 31, | ||||||||||||
| 2014 | 2013 | 2012 | ||||||||||
| Amortization expense |
$ | 58,457 | $ | 51,450 | $ | 46,440 | ||||||
Estimated amortization expense for existing identifiable intangible assets is expected to be approximately $57.5 million, $41.8 million, $28.7 million, $17.9 million and $12.2 million for the years ending December 31, 2015, 2016, 2017, 2018 and 2019, respectively. Estimated amortization expense can be affected by various factors, including future acquisitions or divestitures of product and/or licensing and distribution rights or impairments.
The following is a summary of identifiable intangible assets (in thousands):
| As of December 31, 2014 | As of December 31, 2013 | |||||||||||||||||||||||
| Gross Amount |
Accumulated Amortization |
Net Amount |
Gross Amount |
Accumulated Amortization |
Net Amount |
|||||||||||||||||||
| Definite-lived identifiable intangible assets: |
||||||||||||||||||||||||
| Product licensing and distribution rights and customer relationships |
$ | 123,227 | $ | (54,413 | ) | $ | 68,814 | $ | 115,895 | $ | (35,027 | ) | $ | 80,868 | ||||||||||
| Trademarks, trade names and other |
18,571 | (6,399 | ) | 12,172 | 52,053 | (37,450 | ) | 14,603 | ||||||||||||||||
| Software and related assets |
260,052 | (170,471 | ) | 89,581 | 232,468 | (139,561 | ) | 92,907 | ||||||||||||||||
|
|
|
|
|
|
|
|
|
|
|
|
|
|||||||||||||
| $ | 401,850 | $ | (231,283 | ) | $ | 170,567 | $ | 400,416 | $ | (212,038 | ) | $ | 188,378 | |||||||||||
|
|
|
|
|
|
|
|
|
|
|
|
|
|||||||||||||
| Indefinite-lived identifiable intangible assets: |
||||||||||||||||||||||||
|
|
|
|
|
|
|
|
|
|
|
|
|
|||||||||||||
| Trade name |
$ | 109,676 | $ | — | $ | 109,676 | $ | 109,676 | $ | — | $ | 109,676 | ||||||||||||
|
|
|
|
|
|
|
|
|
|
|
|
|
|||||||||||||
Accumulated amortization of identifiable intangible assets includes the impact of amortization expense, foreign exchange fluctuations and disposals of software and related assets.
88
The following is a summary of goodwill by segment for the years ended December 31, 2014 and 2013 (in thousands):
| Product Development |
Integrated Healthcare Services |
Consolidated | ||||||||||
| Balance as of December 31, 2012 |
$ | 237,757 | $ | 64,672 | $ | 302,429 | ||||||
| Acquisition |
116,542 | — | 116,542 | |||||||||
| Impact of foreign currency fluctuations |
(3,155 | ) | (6,190 | ) | (9,345 | ) | ||||||
|
|
|
|
|
|
|
|||||||
| Balance as of December 31, 2013 |
351,144 | 58,482 | 409,626 | |||||||||
| Acquisition |
— | 62,778 | 62,778 | |||||||||
| Impact of foreign currency fluctuations and other |
(4,536 | ) | (3,434 | ) | (7,970 | ) | ||||||
|
|
|
|
|
|
|
|||||||
| Balance as of December 31, 2014 |
$ | 346,608 | $ | 117,826 | $ | 464,434 | ||||||
|
|
|
|
|
|
|
|||||||
9. Accrued Expenses
Accrued expenses consist of the following (in thousands):
| December 31, | ||||||||
| 2014 | 2013 | |||||||
| Compensation, including bonuses, fringe benefits and payroll taxes |
$ | 403,250 | $ | 437,138 | ||||
| Restructuring |
6,083 | 5,474 | ||||||
| Interest |
274 | 278 | ||||||
| Contract related |
255,530 | 240,548 | ||||||
| Other |
68,507 | 77,751 | ||||||
|
|
|
|
|
|||||
| $ | 733,644 | $ | 761,189 | |||||
|
|
|
|
|
|||||
10. Credit Arrangements
The following is a summary of the Company’s revolving credit facilities at December 31, 2014:
| Facility |
Interest Rates | |
| $400.0 million (first lien revolving credit facility) |
One month London Interbank Offer Rate (“LIBOR”), (0.17% at December 31, 2014) plus 2.50% to 2.75% depending upon the Company’s total leverage ratio | |
| $25.0 million (receivables financing facility) |
LIBOR Market Index Rate, (0.17% at December 31, 2014) plus 0.85% to 1.35% depending upon the Company’s debt rating | |
| £10.0 million (approximately $15.6 million) general banking facility with a European headquartered bank | Bank’s base rate (0.5% at December 31, 2014) plus 1% | |
During 2014, the Company borrowed and repaid $150.0 million from its first lien revolving credit facility. The Company did not have any outstanding borrowings under any of the revolving credit facilities at December 31, 2014 or 2013. At December 31, 2014, there were bank guarantees totaling approximately £4.2 million (approximately $6.5 million) issued against the availability of the general banking facility with a European headquartered bank through their operations in the United Kingdom.
89
Long-term debt consists of the following (in thousands):
| December 31, | ||||||||
| 2014 | 2013 | |||||||
| Term Loan B-3 due 2018 ((the greater of three month LIBOR or 1.25%) plus 2.50%, or 3.75% at December 31, 2014) |
$ | 2,030,606 | $ | 2,060,756 | ||||
| Receivables financing facility due 2018 ((LIBOR 0.17%) plus 1.05%, or 1.22% at December 31, 2014) |
275,000 | — | ||||||
| Other notes payable |
— | 7 | ||||||
|
|
|
|
|
|||||
| 2,305,606 | 2,060,763 | |||||||
| Less: unamortized discount |
(12,379 | ) | (14,975 | ) | ||||
| Less: current portion |
(750 | ) | (10,307 | ) | ||||
|
|
|
|
|
|||||
| $ | 2,292,477 | $ | 2,035,481 | |||||
|
|
|
|
|
|||||
Contractual maturities of long-term debt at December 31, 2014 are as follows (in thousands):
| 2015 |
$ | 750 | ||
| 2016 |
20,600 | |||
| 2017 |
20,600 | |||
| 2018 |
2,263,656 | |||
|
|
|
|||
| $ | 2,305,606 | |||
|
|
|
The estimated fair value of the long-term debt, which is primarily based on rates in which the debt is traded among banks, was approximately $2.3 billion and $2.1 billion at December 31, 2014 and 2013, respectively.
Senior Secured Credit Agreement
On June 8, 2011, the Company, through its wholly owned subsidiary, Quintiles Transnational Corp. (“Quintiles Transnational”), entered into the initial credit agreement governing the Quintiles Transnational senior secured credit facilities under which the Company was permitted to borrow up to $2.225 billion. The credit facility arrangements were amended in October 2012, December 2012, December 2013 and November 2014, as described below, and initially consisted of two components: a $225.0 million first lien revolving credit facility due in 2016 and a $2.0 billion first lien Term Loan B due in 2018 (the “Term Loan B”).
On December 20, 2012, the Term Loan B was repaid with the proceeds of a new Term Loan B-2 (see below), together with cash on hand.
October 2012 Debt Issuance
On October 22, 2012, the Company entered into an amendment to the credit agreement to provide (i) a new Term Loan B-1 (the “Term Loan B-1”) with a syndicate of banks for an aggregate principal amount of $175.0 million due 2018, (ii) a one-year extension of the maturity date of its existing $225.0 million senior secured revolving credit facility (to 2017) and (iii) a $75.0 million increase in its existing $225.0 million senior secured revolving credit facility (the “Increased Revolving Facility”), which would also mature in 2017. Annual maturities on the Term Loan B-1 were 1% of the original principal amount until December 31, 2017, with the balance of the Term Loan B-1 to be repaid at final maturity on June 8, 2018. In the fourth quarter of 2012, the proceeds from the Term Loan B-1, together with approximately $73 million of cash on hand, were used to (i) pay a dividend to the Company’s shareholders totaling approximately $241.7 million, (ii) pay a bonus to certain option holders totaling approximately $2.4 million and (iii) pay approximately $4.0 million of fees and related expenses. Other terms and covenants of the Term Loan B-1 and the Increased Revolving Facility were and are the same as the terms and covenants of the Company’s Term Loan B and the senior secured revolving credit facility prior to the amendment.
90
In May 2013, the Company used $50.0 million of cash to pay down indebtedness under the Term Loan B-1. In connection with the pay down of indebtedness, the Company recognized a $1.0 million loss on extinguishment of debt which included approximately $930,000 of unamortized debt issuance costs and $112,000 of unamortized discount.
On December 20, 2013, the Term Loan B-1 was repaid with the proceeds of a new Term Loan B-3 (see below).
2012 Refinancing Transaction
On December 20, 2012, the Company entered into an amendment to the credit agreement to provide a new Term Loan B-2 (the “Term Loan B-2”) with a syndicate of banks for an aggregate principal amount of $1.975 billion due in 2018. Annual maturities on the Term Loan B-2 were $20.0 million through December 31, 2017 with the balance of the Term Loan B-2 to be repaid at final maturity on June 8, 2018. Other terms and covenants of the Term Loan B-2 were the same as the terms and covenants of our Term Loan B prior to the amendment.
The Company used the proceeds from the Term Loan B-2, together with cash on hand, to repay the remaining outstanding balance on the Company’s then-existing Term Loan B and related fees and expenses. In 2012, the Company recognized a $1.3 million loss on extinguishment of debt which included approximately $634,000 of unamortized debt issuance costs, approximately $631,000 of unamortized discount and approximately $10,000 of related fees and expenses.
On December 20, 2013, the Term Loan B-2 was repaid with the proceeds of a new Term Loan B-3 (see below).
2013 Refinancing Transaction
On December 20, 2013, the Company entered into an amendment to its senior secured credit agreement to provide a new Term Loan B-3 (the “Term Loan B-3”) with a syndicate of banks for an aggregate principal amount of $2.061 billion due in 2018. The proceeds from the Term Loan B-3 were used to repay the then outstanding balances of the Term Loan B-1 and Term Loan B-2 and related fees and expenses. Quarterly principal payments on the Term Loan B-3 are $5.15 million, which commenced on September 30, 2014 and continue through March 31, 2018, with the balance of the Term Loan B-3 to be repaid at final maturity on June 8, 2018. Optional prepayments of the Term Loan B-3 are applied to reduce principal payments in direct order of maturity. The credit facility arrangements are collateralized by substantially all of the assets of Quintiles Transnational and the assets of Quintiles Transnational’s domestic subsidiaries, including 100% of the equity interests of substantially all of Quintiles Transnational’s domestic subsidiaries, and 65% of the equity interests of substantially all of the first-tier foreign subsidiaries of Quintiles Transnational and its domestic subsidiaries (in each case other than certain excluded subsidiaries as defined in the credit agreement). Beginning with fiscal year ending December 31, 2014, the Company is required to apply 50% of excess cash flow (as defined in the credit agreement), subject to a reduction to 25% or 0% depending upon Quintiles Transnational’s total leverage ratio, for prepayment of the Term Loan B-3, with any such prepayment to be applied, first, in direct order of maturities, to reduce the Term Loan B-3 principal payments due within eight quarters of such prepayment, then on a pro rata basis to reduce the other principal payments due prior to the maturity date, and then to reduce the principal payments due on the maturity date. The amendment also provided additional flexibility for the Company to enter into certain securitization financing transactions such as the receivables financing facility transaction we entered into in December 2014. Other than a lower interest rate, other terms and covenants of the Term Loan B-3 are the same as the terms and covenants of our Term Loan B-1 and Term Loan B-2 prior to the amendment.
In connection with this amendment to the credit agreement, in 2013 the Company recognized a $3.3 million loss on extinguishment of debt which included approximately $1.6 million of unamortized debt issuance costs, approximately $1.6 million of unamortized discount and approximately $25,000 of related fees and expenses.
91
2014 Revolving Credit Facility Amendment
On November 7, 2014, the Company entered into an amendment to its senior secured credit agreement that increased its first lien revolving credit facility from $300.0 million to $400.0 million and extended the maturity date for most of the first lien revolving credit facility by six months. The $100.0 million increase will mature in December 2017 along with $282.5 million of the existing $300.0 million first lien revolving credit facility. In addition, the maturity date for the aggregate of $382.5 million of the first lien revolving credit facility may be further extended to June 2019 without lender consent in connection with certain extensions of the maturity date of the Term Loan B-3 under the senior secured credit facilities. The maturity date for the remaining $17.5 million of the existing $300.0 million first lien revolving credit facility was not altered and continues to be June 2017. The other terms of the senior secured credit agreement were not altered by the amendment.
Receivables Financing Facility
On December 5, 2014, the Company entered into a four-year arrangement to securitize certain of its accounts receivable. Under the receivables financing facility, certain of the Company’s accounts receivable are sold on a non-recourse basis by certain of its consolidated subsidiaries to another of its consolidated subsidiaries, a bankruptcy-remote special purpose entity (“SPE”). The SPE obtained a term loan and revolving loan commitment from a third party lender, secured by liens on the assets of the SPE, to finance the purchase of the accounts receivable, which included a $275.0 million term loan and a $25.0 million revolving loan commitment. The revolving loan commitment may be increased by an additional $35.0 million as amounts are repaid under the term loan. Quintiles Transnational has guaranteed the performance of the obligations of existing and future subsidiaries that sell and service the accounts receivable under the receivables financing facility. The assets of the SPE are not available to satisfy any of the Company’s obligations or any obligations of its subsidiaries. As of December 31, 2014, $25.0 million of revolving loans were available under the receivables financing facility.
The Company used the proceeds from the term loan under the receivables financing facility to repay in full the amount outstanding on the revolving credit facility under its senior secured credit agreement ($150.0 million), to repay $25.0 million of the Term Loan B-3 under its senior secured credit agreement, to pay related fees and expenses and the remainder was used for general working capital purposes.
Other Long-Term Debt
In February 2012, the Company executed a new term loan facility with a syndicate of banks for an aggregate principal amount of $300.0 million due February 26, 2017 (the “Holdings Term Loan”). The Company used the proceeds from the Holdings Term Loan, together with cash on hand, to (1) pay a dividend to its shareholders in March 2012 totaling approximately $326.1 million, (2) pay a bonus to certain option holders totaling approximately $8.9 million and (3) pay related expenses.
In May 2013, the Company used $308.9 million of cash to pay all amounts outstanding under the $300.0 million Holdings Term Loan (including accrued interest and related fees and expenses). In connection with the repayment of debt, the Company recognized a $15.5 million loss on extinguishment of debt which included approximately $4.7 million of unamortized debt issuance costs, $4.7 million of unamortized discount and $6.1 million of related fees and expenses.
Debt Issuance Costs and Covenants
In connection with the long-term debt agreements, the Company had net debt issuance costs of approximately $10.2 million and $12.6 million as of December 31, 2014 and 2013, respectively, included in deposits and other assets in the accompanying consolidated balance sheets. The debt issuance costs are being amortized as a component of interest expense using the effective interest method over the term of the related debt arrangements, which range from five years to seven years.
92
The Company’s long-term debt agreements contain usual and customary restrictive covenants that, among other things, place limitations on its ability to declare dividends and make other restricted payments; prepay, redeem or purchase debt; incur liens; make loans and investments; incur additional indebtedness; amend or otherwise alter debt and other material documents; engage in mergers, acquisitions and asset sales; transact with affiliates; and engage in businesses that are not related to the Company’s existing business. In 2014, 2013 and 2012, the Company was in compliance with its debt covenants.
11. Leases
The Company leases facilities under operating leases, many of which contain renewal and escalation clauses. The Company also leases certain equipment under operating leases. The leases expire at various dates through 2029 with options to cancel certain leases at various intervals. Rental expenses under these agreements were $114.6 million, $125.6 million and $117.6 million in 2014, 2013 and 2012, respectively. The Company leases certain assets, primarily vehicles, under capital leases. Capital lease amortization is included with costs of revenues and accumulated depreciation on the accompanying financial statements.
The following is a summary of future minimum payments under capital and operating leases that have initial or remaining non-cancelable lease terms in excess of one year at December 31, 2014 (in thousands):
| Capital Leases |
Operating Leases |
|||||||
| 2015 |
$ | 80 | $ | 91,129 | ||||
| 2016 |
16 | 71,992 | ||||||
| 2017 |
— | 53,043 | ||||||
| 2018 |
— | 34,183 | ||||||
| 2019 |
— | 19,916 | ||||||
| Thereafter |
— | 80,839 | ||||||
|
|
|
|
|
|||||
| Total minimum lease payments |
96 | $ | 351,102 | |||||
|
|
|
|||||||
| Amounts representing interest |
(6 | ) | ||||||
|
|
|
|||||||
| Present value of net minimum payments |
90 | |||||||
| Current portion |
(76 | ) | ||||||
|
|
|
|||||||
| Long-term capital lease obligations |
$ | 14 | ||||||
|
|
|
|||||||
12. Shareholders’ Deficit
Initial Public Offering
On May 9, 2013, the Company’s common stock began trading on the New York Stock Exchange (“NYSE”) under the symbol “Q.” On May 14, 2013, the Company completed its IPO of its common stock at a price to the public of $40.00 per share. The Company issued and sold 13,125,000 shares of common stock in the IPO. The selling shareholders offered and sold 14,111,841 shares of common stock in the IPO, including 3,552,631 shares that were offered and sold by the selling shareholders pursuant to the full exercise of the underwriters’ option to purchase additional shares. The IPO raised proceeds to the Company of approximately $489.5 million, after deducting underwriting discounts, commissions and related expenses. The Company did not receive any of the proceeds from the sale of the shares sold by the selling shareholders.
Preferred Stock
The Company is authorized to issue 1.0 million shares of preferred stock, $0.01 per share par value. No shares of preferred stock were issued and outstanding as of December 31, 2014 or 2013.
93
Equity Repurchase Program
On October 30, 2013, the Company’s Board of Directors (the “Board”) approved an equity repurchase program (the “Repurchase Program”) authorizing the repurchase of up to $125.0 million of either the Company’s common stock or vested in-the-money employee stock options, or a combination thereof. The Company has used and intends to continue to use cash on hand to fund the Repurchase Program. The Repurchase Program does not obligate the Company to repurchase any particular amount of common stock or vested in-the-money employee stock options, and it could be modified, suspended or discontinued at any time. The timing and amount of repurchases are determined by the Company’s management based on a variety of factors such as the market price of the Company’s common stock, the Company’s corporate requirements, and overall market conditions. Purchases of the Company’s common stock may be made in open market transactions effected through a broker-dealer at prevailing market prices, in block trades, or in privately negotiated transactions. The Company may also repurchase shares of its common stock pursuant to a trading plan meeting the requirements of Rule 10b5-1 under the Exchange Act, which would permit shares of the Company’s common stock to be repurchased when the Company might otherwise be precluded from doing so by law. Repurchases of vested in-the-money employee stock options were made through transactions between the Company and its employees (other than its executive officers, who were not eligible to participate in the program), and this aspect of the Repurchase Program expired in November 2013. The Repurchase Program for common stock does not have an end date.
In 2013, repurchases under the Repurchase Program resulted in a $65.5 million charge to equity consisting of (i) the repurchase of approximately 153,200 shares of common stock for an aggregate purchase price of $6.4 million (representing an average price per share of $42.01), and (ii) the repurchase of 2.0 million vested in-the-money employee stock options at fair value for an aggregate purchase price of $59.1 million (representing an average market price per share of $43.42 and an average exercise price per option of $13.74). The Company repurchased 300 shares of its common stock for $47.51 per share for an aggregate purchase price of approximately $14,000 in 2014 under the Repurchase Program. As of December 31, 2014, the Company has remaining authorization under the Repurchase Program to repurchase up to $59.5 million of its common stock.
Other Equity Repurchases
On May 28, 2014, the Company completed the repurchase of 3,287,209 shares of its common stock for $50.23 per share from TPG Quintiles Holdco, L.P., one of its existing shareholders, in a private transaction for an aggregate purchase price of approximately $165.1 million. The repurchase price per share of common stock was equal to 98% of the closing market price of the Company’s common stock on the NYSE on May 27, 2014 (which was $51.26). The repurchase of shares from its existing shareholder was authorized in compliance with the Company’s related party transactions approval policy. The Company funded this private repurchase transaction with cash on hand. This private repurchase transaction was separate from and in addition to the Repurchase Program.
On November 10, 2014, the Company completed the repurchase of 4,303,666 shares of its common stock for $58.09 per share, which was the price per share the underwriter paid to selling shareholders, for an aggregate purchase price of approximately $250.0 million. The Company funded this repurchase transaction with a combination of cash on hand and a $150.0 million draw on its revolving credit facility. This repurchase transaction was separate from and in addition to the Repurchase Program.
Dividends
In October 2012, the Board declared a $2.09 per share dividend to shareholders of record on October 24, 2012. The dividend totaled approximately $241.7 million and was paid on November 1, 2012.
In February 2012, the Board declared a $2.82 per share dividend to shareholders of record on February 29, 2012. The dividend totaled approximately $326.1 million and was paid on March 9, 2012.
94
13. Management Fees
In January 2008, pursuant to a management agreement with affiliates of certain of the Company’s shareholders, the Company agreed to pay an annual management service fee of $5.0 million in the aggregate to (i) GF Management Company, LLC (“GFM”); (ii) Bain Capital Partners, LLC; (iii) TPG Capital, LP; (iv) 3i Corporation; (v) Cassia Fund Management Pte Ltd; and (vi) Aisling Capital, LLC (“Aisling Capital”). Of this amount, Aisling Capital received $150,000 annually for so long as the Company’s Investment Committee included a member nominated by Aisling Capital. The remaining approximately $4.9 million of the annual management service fee was paid to the other managers each year, in advance and in equal quarterly installments, in proportion to each manager’s (or such manager’s affiliates’) respective share ownership in the Company. The annual management service fee was subject to upward adjustment each year effective as of March 31 based on any increase in the Consumer Price Index for the preceding calendar year. The initial term of the management agreement extended through December 31, 2010, after which it automatically renewed for an additional year unless written notice was provided or other conditions were met. In 2013, the management agreement was terminated, and the Company paid a $25.0 million fee in connection with the termination. In 2013 and 2012, the Company expensed $27.7 million and $5.3 million, respectively, in management fees under this agreement.
14. Business Combinations
Encore Health Resources
On July 1, 2014, the Company completed the acquisition of Encore Health Resources, LLC (“Encore”) effected through a merger for approximately $91.5 million in cash (net of approximately $2.2 million of acquired cash). Encore has operations in the United States, and its business is primarily focused on providing electronic health records (“EHR”) implementation and advisory services to healthcare providers. As part of its Integrated Healthcare Services segment, the Company expects that Encore will enhance its EHR expertise.
Novella Clinical Inc.
On September 16, 2013, the Company completed the acquisition of Novella Clinical Inc. (“Novella”) through the purchase of 100% of Novella’s outstanding stock for approximately $146.6 million in cash (net of approximately $26.2 million of acquired cash) plus potential annual earn-out payments totaling up to $21.0 million contingent upon the achievement of certain revenue and net new business targets for approximately three years following closing. The Company initially recognized a liability of approximately $14.3 million as the estimated acquisition date fair value of the earn-out. Changes in the fair value of the earn-out subsequent to the acquisition date are recognized in earnings in the period of the change. Novella has operations primarily in the United States and Europe and is a clinical research organization focused primarily on emerging oncology customers as well as those in the medical device and diagnostics sectors. As part of its Product Development segment, the Company acquired Novella to complement its clinical service offerings through its focus on emerging companies and by adding expertise in oncology and medical devices.
Expression Analysis, Inc.
On August 10, 2012, the Company completed the acquisition of Expression Analysis, Inc. (“EA”) through the purchase of 100% of EA’s outstanding stock for $39.7 million in cash and contingent consideration in the form of a potential earn-out payment of up to $3.5 million. The earn-out payment was contingent upon the achievement of certain revenue and earnings targets during the 24 month period following closing. The Company initially recognized a liability of approximately $2.0 million as the estimated acquisition date fair value of the earn-out. Changes in the fair value of the earn-out subsequent to the acquisition date were recognized in earnings in the period of the change. EA, based in the United States, provides genomic sequencing, gene expression, genotyping and bioinformatics services to biopharmaceutical companies, diagnostic test developers, government agencies and academic laboratories. The Company acquired EA to complement its current laboratory services by adding expertise in genetic sequencing and advanced bioinformatics.
95
Accounting for Acquisitions
Acquisitions are accounted for as business combinations and, accordingly, the assets acquired and the liabilities assumed have been recorded at their respective estimated fair values as of the acquisition date. In connection with the Encore acquisition, the Company recorded goodwill, primarily attributable to the assembled workforce of Encore and expected synergies, which was assigned to the Integrated Healthcare Services segment and is deductible for income tax purposes. In connection with the Novella and EA acquisitions, the Company recorded goodwill, primarily attributable to the assembled workforce of Novella and EA and expected synergies, which was assigned to the Product Development segment and is not deductible for income tax purposes. Pro forma information is not presented as the operations of the acquired businesses are not significant to the overall operations of the Company. Acquisition-related expenses were immaterial and are also not presented. The following table summarizes the estimated fair value of the net assets acquired at the date of the acquisitions (in thousands):
| Encore | Novella | EA | ||||||||||
| Assets acquired: |
||||||||||||
| Cash and cash equivalents |
$ | 2,223 | $ | 26,190 | $ | 441 | ||||||
| Accounts receivable and unbilled services |
17,714 | 28,644 | 1,920 | |||||||||
| Other current assets |
443 | 1,441 | 2,952 | |||||||||
| Property and equipment |
289 | 9,616 | 4,731 | |||||||||
| Goodwill |
62,778 | 116,542 | 28,201 | |||||||||
| Other identifiable intangibles |
14,150 | 42,740 | 9,460 | |||||||||
| Deferred income tax asset—long-term |
396 | — | — | |||||||||
| Other long-term assets |
— | 2,203 | — | |||||||||
| Liabilities assumed: |
||||||||||||
| Accounts payable and accrued expenses |
(4,206 | ) | (12,716 | ) | (3,574 | ) | ||||||
| Unearned income |
(31 | ) | (7,782 | ) | (411 | ) | ||||||
| Other current liabilities |
— | (132 | ) | (101 | ) | |||||||
| Deferred income tax liability—long-term |
— | (18,364 | ) | (1,707 | ) | |||||||
| Other long-term liabilities |
— | (1,334 | ) | (226 | ) | |||||||
|
|
|
|
|
|
|
|||||||
| Net assets acquired |
$ | 93,756 | $ | 187,048 | $ | 41,686 | ||||||
|
|
|
|
|
|
|
|||||||
The other identifiable intangible assets consisted of the following (in thousands):
| Encore | Novella | EA | ||||||||||
| Other identifiable intangibles |
||||||||||||
| Customer relationships |
$ | 8,800 | $ | 20,800 | $ | 9,000 | ||||||
| Acquired backlog |
800 | 14,000 | 170 | |||||||||
| Trade names |
1,100 | 7,500 | 290 | |||||||||
| Non-compete agreements |
450 | 440 | — | |||||||||
| Software |
3,000 | — | — | |||||||||
|
|
|
|
|
|
|
|||||||
| Total other identifiable intangibles |
$ | 14,150 | $ | 42,740 | $ | 9,460 | ||||||
|
|
|
|
|
|
|
|||||||
| Amortized over a weighted average useful life (in years) |
8 | 7 | 11 | |||||||||
15. Restructuring
2014 Plan
In 2014, the Board approved restructuring plans of approximately $13 million to better align resources with the Company’s strategic direction, which resulted in a reduction of approximately 250 positions. During 2014, the Company recognized approximately $10.3 million of restructuring costs related to these plans including reversals. All of the restructuring costs are related to severance and lease costs. Of the $10.3 million in total restructuring costs recognized for these plans, approximately $7.3 million and $3.0 were related to activities in the Product Development and Integrated Healthcare Services segments, respectively.
96
2013 Plan
In February 2013, the Board approved a restructuring plan of up to $15.0 million to migrate the delivery of services, primarily in the Product Development segment, and to reduce anticipated overcapacity in selected areas, primarily in the Integrated Healthcare Services segment, which resulted in a reduction of approximately 400 positions. Since February 2013, the Company has recognized approximately $13.6 million of restructuring costs related to this plan including reversals. All of the restructuring costs are related to severance costs. Of the $13.6 million in total restructuring costs recognized for this plan, approximately $8.4 million, $4.7 million and $500,000 were related to activities in the Product Development segment, Integrated Healthcare Services segment and corporate activities, respectively.
2012 Plan
In May 2012, the Board approved a restructuring plan of up to $20.0 million to reduce anticipated overcapacity and to rationalize the number of non-billable support roles, which resulted in a reduction of approximately 280 positions, primarily in Europe. Since May 2012, the Company has recognized approximately $19.6 million of restructuring costs related to this plan including reversals. Of the $19.6 million in total restructuring costs recognized for this plan, $19.2 million and $400,000 were related to severance costs and lease costs, respectively. Of the $19.6 million in total restructuring costs recognized for this plan, approximately $11.8 million, $3.8 million and $4.0 million were related to activities in the Product Development segment, Integrated Healthcare Services segment and corporate activities, respectively.
The following amounts were recorded for the 2014 restructuring plan and the restructuring plans initiated in prior years (in thousands):
| Severance and Related Costs |
Exit Costs | Total | ||||||||||
| Balance at December 31, 2012 |
$ | 12,784 | $ | — | $ | 12,784 | ||||||
| Expense, net of reversals |
13,718 | 353 | 14,071 | |||||||||
| Payments |
(21,324 | ) | (154 | ) | (21,478 | ) | ||||||
| Foreign currency translation |
98 | (1 | ) | 97 | ||||||||
|
|
|
|
|
|
|
|||||||
| Balance at December 31, 2013 |
5,276 | 198 | 5,474 | |||||||||
| Expense, net of reversals |
8,421 | 567 | 8,988 | |||||||||
| Payments |
(7,998 | ) | (160 | ) | (8,158 | ) | ||||||
| Foreign currency translation |
(221 | ) | — | (221 | ) | |||||||
|
|
|
|
|
|
|
|||||||
| Balance at December 31, 2014 |
$ | 5,478 | $ | 605 | $ | 6,083 | ||||||
|
|
|
|
|
|
|
|||||||
The reversals were due to changes in estimates primarily resulting from the redeployment of staff and higher than expected voluntary terminations. Restructuring costs are not allocated to the Company’s reportable segments as they are not part of the segment performance measures regularly reviewed by management. The Company expects the majority of the restructuring accruals at December 31, 2014 will be paid in 2015.
16. Income Taxes
The components of income before income taxes and equity in earnings of unconsolidated affiliates are as follows (in thousands):
| Year Ended December 31, | ||||||||||||
| 2014 | 2013 | 2012 | ||||||||||
| Domestic |
$ | 96,917 | $ | 68,425 | $ | 31,204 | ||||||
| Foreign |
405,272 | 254,691 | 236,224 | |||||||||
|
|
|
|
|
|
|
|||||||
| $ | 502,189 | $ | 323,116 | $ | 267,428 | |||||||
|
|
|
|
|
|
|
|||||||
97
The components of income tax expense attributable to continuing operations are as follows (in thousands):
| Year Ended December 31, | ||||||||||||
| 2014 | 2013 | 2012 | ||||||||||
| Current expense (benefit): |
||||||||||||
| Federal |
$ | 58,403 | $ | 38,573 | $ | 18,236 | ||||||
| State |
4,618 | (4,309 | ) | 1,384 | ||||||||
| Foreign |
95,010 | 83,744 | 58,712 | |||||||||
|
|
|
|
|
|
|
|||||||
| 158,031 | 118,008 | 78,332 | ||||||||||
|
|
|
|
|
|
|
|||||||
| Deferred (benefit) expense: |
||||||||||||
| Federal and state |
(4,549 | ) | (15,807 | ) | 16,023 | |||||||
| Foreign |
(3,426 | ) | (6,236 | ) | (991 | ) | ||||||
|
|
|
|
|
|
|
|||||||
| (7,975 | ) | (22,043 | ) | 15,032 | ||||||||
|
|
|
|
|
|
|
|||||||
| $ | 150,056 | $ | 95,965 | $ | 93,364 | |||||||
|
|
|
|
|
|
|
|||||||
The differences between the Company’s consolidated income tax expense attributable to continuing operations and the expense computed at the 35% United States statutory income tax rate were as follows (in thousands):
| Year Ended December 31, | ||||||||||||
| 2014 | 2013 | 2012 | ||||||||||
| Federal income tax expense at statutory rate |
$ | 175,766 | $ | 113,091 | $ | 93,600 | ||||||
| State and local income taxes, net of federal benefit |
2,312 | (1,088 | ) | (914 | ) | |||||||
| Research and development |
(16,765 | ) | (12,788 | ) | (17,096 | ) | ||||||
| Foreign nontaxable interest income |
(10,217 | ) | (9,751 | ) | (7,864 | ) | ||||||
| Gain on note settlement |
— | 10,794 | — | |||||||||
| United States taxes recorded on foreign earnings |
18,631 | (1,616 | ) | 23,236 | ||||||||
| Foreign rate differential |
(30,734 | ) | (10,753 | ) | (8,396 | ) | ||||||
| Increase/(decrease) in valuation allowance |
1,713 | (178 | ) | 401 | ||||||||
| Effect of changes in apportionment and tax rates |
536 | (492 | ) | 1,872 | ||||||||
| Other |
8,814 | 8,746 | 8,525 | |||||||||
|
|
|
|
|
|
|
|||||||
| $ | 150,056 | $ | 95,965 | $ | 93,364 | |||||||
|
|
|
|
|
|
|
|||||||
Prior to June 2013, the Company had not considered the majority of the undistributed earnings of its foreign subsidiaries to be indefinitely reinvested. Management reevaluated this assertion following the IPO, as a portion of the IPO proceeds were used to pay down debt held in the United States as well as the fact the Company does not anticipate paying dividends in the foreseeable future, which had been significant in the past. Given the Company’s current debt balance, and related interest expense and the change in approach related to payment of dividends, the Company expects to be able to support the cash needs of the domestic subsidiaries without repatriating cash from the affected foreign subsidiaries. The Company expects to utilize the cash generated outside of the United States to fund growth outside of the United States. As a result of the assertion change, the Company recorded an $8.1 million income tax benefit in the second quarter of 2013 to reverse the deferred income tax liability previously recorded on undistributed foreign earnings prior to 2013 that are now considered indefinitely reinvested outside of the United States. Undistributed earnings of the Company’s foreign subsidiaries amounted to approximately $696.9 million at December 31, 2014. Approximately $244.2 million of this total is not considered to be indefinitely reinvested and would be taxable upon repatriation. The Company has recorded a deferred income tax liability, net of foreign income tax credits that would be generated upon repatriation, of $27.7 million as of December 31, 2014 associated with those earnings based upon the United States federal income tax rate. Upon distribution of those earnings in the form of dividends or otherwise, the Company would
98
be subject to both United States income taxes (subject to an adjustment for foreign tax credits, if available) and withholding taxes payable to the various countries in which the Company’s foreign subsidiaries are located. If the approximately $452.7 million of indefinitely reinvested earnings were repatriated to the United States, it would generate an estimated $61.2 million of additional tax liability for the Company.
The income tax effects of temporary differences from continuing operations that give rise to significant portions of deferred income tax (liabilities) assets are presented below (in thousands):
| December 31, | ||||||||
| 2014 | 2013 | |||||||
| Deferred income tax liabilities: |
||||||||
| Undistributed foreign earnings |
$ | (27,717 | ) | $ | (18,393 | ) | ||
| Depreciation and amortization |
(65,614 | ) | (78,486 | ) | ||||
| Other |
(15,346 | ) | (12,700 | ) | ||||
|
|
|
|
|
|||||
| Total deferred income tax liabilities |
(108,677 | ) | (109,579 | ) | ||||
| Deferred income tax assets: |
||||||||
| Net operating loss, capital loss and tax credit carryforwards |
43,535 | 49,308 | ||||||
| Accrued expenses and unearned income |
34,048 | 31,067 | ||||||
| Employee benefits |
130,217 | 124,688 | ||||||
| Other |
17,784 | 20,215 | ||||||
|
|
|
|
|
|||||
| 225,584 | 225,278 | |||||||
| Valuation allowance for deferred income tax assets |
(24,695 | ) | (29,501 | ) | ||||
|
|
|
|
|
|||||
| Total deferred income tax assets |
200,889 | 195,777 | ||||||
|
|
|
|
|
|||||
| Net deferred income tax assets |
$ | 92,212 | $ | 86,198 | ||||
|
|
|
|
|
|||||
The Company has net operating loss and capital loss carryforwards of approximately $46.0 million in various entities within the United Kingdom which have no expiration date and has $40.3 million of net operating loss and capital loss carryforwards from various foreign jurisdictions which have different expiration periods. The Company has United States net operating loss carryforwards of $20.0 million, which were obtained through the acquisitions of Novella, EA, and Advion BioSciences, Inc. in 2013, 2012, and 2011, respectively, and expire through 2023. These losses are subject to IRC Section 382 limitations; however, management expects all losses to be utilized during the carryforward periods. In addition, the Company has approximately $43.1 million of United States state operating loss carryforwards which expire through 2034.
In 2014, the Company decreased its valuation allowance $4.8 million to $24.7 million at December 31, 2014 from $29.5 million at December 31, 2013. The valuation allowance is primarily related to loss carryforwards in various foreign and state jurisdictions.
A reconciliation of the beginning and ending amount of gross unrecognized income tax benefits is presented below (in thousands):
| December 31, | ||||||||||||
| 2014 | 2013 | 2012 | ||||||||||
| Balance at January 1 |
$ | 54,936 | $ | 43,393 | $ | 41,371 | ||||||
| Additions based on tax positions related to the current year |
2,807 | 4,493 | 891 | |||||||||
| Additions for income tax positions of prior years |
1,588 | 12,854 | 2,230 | |||||||||
| Impact of changes in exchange rates |
(376 | ) | (71 | ) | 118 | |||||||
| Settlements with tax authorities |
(135 | ) | (1,052 | ) | (179 | ) | ||||||
| Reductions for income tax positions of prior years |
(6,023 | ) | (3,520 | ) | (63 | ) | ||||||
| Reductions due to the lapse of the applicable statute of limitations |
(11,976 | ) | (1,161 | ) | (975 | ) | ||||||
|
|
|
|
|
|
|
|||||||
| Balance at December 31 |
$ | 40,821 | $ | 54,936 | $ | 43,393 | ||||||
|
|
|
|
|
|
|
|||||||
99
As of December 31, 2014, the Company had total gross unrecognized income tax benefits of $40.8 million associated with over 50 jurisdictions in which the Company conducts business. This amount includes $40.4 million of unrecognized benefits that, if recognized, would reduce the Company’s effective income tax rate. This amount excludes $4.8 million of accrued interest and penalties.
The Company’s policy for recording interest and penalties relating to uncertain income tax positions is to record them as a component of income tax expense in the accompanying consolidated statements of income. In 2014, 2013 and 2012, the amount of interest and penalties recorded as an addition to income tax expense in the accompanying consolidated statements of income was $1.3 million, $843,000 and $796,000, respectively. As of December 31, 2014 and 2013, the Company accrued approximately $4.8 million and $3.6 million, respectively, of interest and penalties.
The Company believes that it is reasonably possible that a decrease of up to $19.1 million in gross unrecognized income tax benefits for federal, state and foreign exposure items may be necessary within the next 12 months due to lapse of statutes of limitations or uncertain tax positions being effectively settled. The Company believes that it is reasonably possible that a decrease of up to $1.1 million in gross unrecognized benefits for foreign items may be necessary within the next 12 months due to payments. For the remaining uncertain income tax positions, it is difficult at this time to estimate the timing of the resolution.
The Company conducts business globally and, as a result, files income tax returns in the United States federal jurisdiction and various state and foreign jurisdictions. In the normal course of business, the Company is subject to examination by taxing authorities throughout the world. The following table summarizes the tax years that remain open for examination by tax authorities in the most significant jurisdictions in which the Company operates:
| United States |
2001-2013 | |
| India |
2006-2014 | |
| Japan |
2008-2013 | |
| United Kingdom |
2013 |
In certain of the jurisdictions noted above, the Company operates through more than one legal entity, each of which has different open years subject to examination. The table above presents the open years subject to examination for the most material of the legal entities in each jurisdiction. Additionally, it is important to note that tax years are technically not closed until the statute of limitations in each jurisdiction expires. In the jurisdictions noted above, the statute of limitations can extend beyond the open years subject to examination.
Due to the geographic breadth of the Company’s operations, numerous tax audits may be ongoing throughout the world at any point in time. Income tax liabilities are recorded based on estimates of additional income taxes which will be due upon the conclusion of these audits. Estimates of these income tax liabilities are made based upon prior experience and are updated in light of changes in facts and circumstances. However, due to the uncertain and complex application of income tax regulations, it is possible that the ultimate resolution of audits may result in liabilities which could be materially different from these estimates. In such an event, the Company will record additional income tax expense or income tax benefit in the period in which such resolution occurs.
The Company has a tax holiday for Quintiles East Asia Pte. Ltd. in Singapore through June 2015, provided the Company maintains specific levels of spending and employment. The income tax benefit of this holiday was approximately $2.4 million, $798,000 and $343,000 in 2014, 2013 and 2012, respectively. The Company also had a tax holiday for Outcome Europe Sarl in Switzerland for 2013 and 2012. The income tax benefit of this holiday was approximately $64,000 and $28,000 in 2013 and 2012 respectively. The tax holiday in 2014 increased earnings per share by approximately $0.02. The tax holidays in 2013 and 2012 did not have a notable impact on earnings per share.
100
17. Employee Benefit Plans
The Company has numerous employee retirement benefit plans, which cover substantially all eligible employees in the countries where the plans are offered either voluntarily or statutorily. Contributions are primarily discretionary, except in some countries where contributions are contractually required.
Defined Contribution Plans
Defined contribution or profit sharing style plans are offered in Austria, Belgium, Bulgaria, Canada, the Czech Republic, Denmark, Finland, France, Germany, Hungary, India, Ireland, Israel, Malaysia, the Netherlands, Poland, Slovakia, South Africa, Sweden, Switzerland, Thailand, the United States and the United Kingdom. In some cases these plans are required by local laws or regulations.
In the United States, the Company has a 401(k) Plan under which the Company matches employee deferrals at varying percentages, set at the discretion of the Board. In 2014, 2013 and 2012, the Company expensed $31.2 million, $26.1 million and $24.3 million, respectively, related to matching contributions.
Defined Benefit Plans
Defined benefit plans are offered in Austria, France, Germany, Greece, India, Israel, Japan, Mexico, Philippines, Poland, Turkey and the United Kingdom. The following table summarizes the components of pension expense related to these defined benefit plans (in thousands):
| Year Ended December 31, | ||||||||||||
| 2014 | 2013 | 2012 | ||||||||||
| Service cost |
$ | 12,944 | $ | 13,227 | $ | 13,839 | ||||||
| Interest cost |
3,821 | 3,684 | 3,775 | |||||||||
| Expected return on plan assets |
(4,277 | ) | (3,442 | ) | (2,822 | ) | ||||||
| Amortization of prior service costs |
107 | 336 | 411 | |||||||||
| Amortization of actuarial losses |
636 | 708 | 758 | |||||||||
|
|
|
|
|
|
|
|||||||
| $ | 13,231 | $ | 14,513 | $ | 15,961 | |||||||
|
|
|
|
|
|
|
|||||||
The Company expects to recognize approximately $996,000 in its pension expense in 2015 related to the amortization of net actuarial losses.
The weighted average assumptions used in determining pension expense were as follows:
| Year Ended December 31, | ||||||||||||
| 2014 | 2013 | 2012 | ||||||||||
| Discount rate |
3.01 | % | 3.06 | % | 3.32 | % | ||||||
| Rate of compensation increases |
4.36 | % | 4.74 | % | 4.96 | % | ||||||
| Expected return on plan assets |
5.21 | % | 5.33 | % | 5.23 | % | ||||||
101
The following table summarizes financial information about the Company’s defined benefit plans as measured on December 31 (in thousands):
| 2014 | 2013 | |||||||
| Projected benefit obligation January 1 |
$ | 135,110 | $ | 130,323 | ||||
| Service costs |
12,944 | 13,227 | ||||||
| Interest cost |
3,821 | 3,684 | ||||||
| Expected return on plan assets |
(4,277 | ) | (3,442 | ) | ||||
| Actuarial losses |
16,396 | 1,890 | ||||||
| Benefits paid |
(7,409 | ) | (5,917 | ) | ||||
| Foreign currency fluctuations and other |
(9,458 | ) | (4,655 | ) | ||||
|
|
|
|
|
|||||
| Projected benefit obligation December 31 |
$ | 147,127 | $ | 135,110 | ||||
|
|
|
|
|
|||||
| Plan assets at fair value, January 1 |
$ | 82,787 | $ | 68,258 | ||||
| Actual return on plan assets |
10,004 | 5,928 | ||||||
| Contributions |
8,594 | 8,620 | ||||||
| Benefits paid |
(7,409 | ) | (5,917 | ) | ||||
| Foreign currency fluctuations and other |
(5,556 | ) | 5,898 | |||||
|
|
|
|
|
|||||
| Plan assets at fair value, December 31 |
$ | 88,420 | $ | 82,787 | ||||
|
|
|
|
|
|||||
| Unfunded balance |
$ | 58,707 | $ | 52,323 | ||||
|
|
|
|
|
|||||
The accumulated benefit obligation for all defined benefit plans was approximately $127.9 million and $118.4 million as of December 31, 2014 and 2013, respectively.
As of December 31, 2014, the projected benefit obligation and accumulated benefit obligation for the defined benefit plans with accumulated benefit obligations in excess of plan assets were $83.4 million and $66.4 million, respectively, and were primarily related to unfunded plans. As of December 31, 2013, the projected benefit obligation and accumulated benefit obligation for the defined benefit plans with accumulated benefit obligations in excess of plan assets were $77.7 million and $63.6 million, respectively, and were primarily related to unfunded plans. As of December 31, 2014 and 2013, the projected benefit obligation exceeded the fair value of the plan assets for each defined benefit plan except for the defined benefit plan in the United Kingdom.
The following table summarizes the amounts recognized in the consolidated balance sheets related to the defined benefit plans as of December 31 (in thousands):
| 2014 | 2013 | |||||||
| Deposits and other assets |
$ | 18,690 | $ | 18,835 | ||||
| Accrued expenses |
6,075 | 8,622 | ||||||
| Other long-term liabilities |
71,322 | 62,536 | ||||||
| AOCI |
$ | (14,519 | ) | $ | (5,044 | ) | ||
102
The following table summarizes the amounts recognized in AOCI related to the defined benefit plans (in thousands):
| Prior Service Costs |
Actuarial Net (Gain) Loss |
Deferred Income Taxes |
Total | |||||||||||||
| Balance as of December 31, 2012 |
$ | (443 | ) | $ | (7,792 | ) | $ | 3,214 | $ | (5,021 | ) | |||||
| Reclassification adjustments included in pension expense: |
||||||||||||||||
| Amortization |
336 | 708 | (389 | ) | 655 | |||||||||||
| Amounts arising during the period: |
||||||||||||||||
| Tax rate adjustments |
— | — | (26 | ) | (26 | ) | ||||||||||
| Actuarial changes in benefit obligation |
— | 2,147 | 157 | 2,304 | ||||||||||||
|
|
|
|
|
|
|
|
|
|||||||||
| Balance as of December 31, 2013 |
(107 | ) | (4,937 | ) | 2,956 | (2,088 | ) | |||||||||
| Reclassification adjustments included in pension expense: |
||||||||||||||||
| Amortization |
107 | 636 | (275 | ) | 468 | |||||||||||
| Amounts arising during the period: |
||||||||||||||||
| Actuarial changes in benefit obligation |
— | (10,218 | ) | 2,981 | (7,237 | ) | ||||||||||
|
|
|
|
|
|
|
|
|
|||||||||
| Balance as of December 31, 2014 |
$ | — | $ | (14,519 | ) | $ | 5,662 | $ | (8,857 | ) | ||||||
|
|
|
|
|
|
|
|
|
|||||||||
The following table summarizes the weighted average assumptions used in determining the pension obligations as of December 31:
| 2014 | 2013 | |||||||
| Discount rate |
2.46 | % | 3.01 | % | ||||
| Rate of compensation increases |
4.32 | % | 4.36 | % | ||||
The discount rate represents the interest rate used to determine the present value of the future cash flows currently expected to be required to settle the Company’s defined benefit plan obligations. The discount rates are derived using weighted average yield curves on AA-rated corporate bonds. The cash flows from the Company’s expected benefit obligation payments are then matched to the yield curve to derive the discount rates.
The Company’s assumption for the expected return on plan assets was determined by the weighted average of the long-term expected rate of return on each of the asset classes invested as of the balance sheet date. For plan assets invested in government bonds, the expected return was based on the yields on the relevant indices as of the balance sheet date. There is considerable uncertainty for the expected return on plan assets invested in equity and diversified growth funds. The expected return on these plan assets was based on the expected return on long-term fixed interest rate government bonds as of the balance sheet date with a premium of 3% to 4% added to reflect the expected long-term returns expected from these types of investments.
The investment objective for defined benefit plan assets is to meet the plan’s benefit obligations and maintaining adequate funding, while minimizing the potential for future required Company contributions. The defined benefit plans in the United Kingdom, India and Israel are funded. The plan assets of the defined benefit plans in India and Israel are held in a fund which holds debt investments, primarily government bonds in accordance with local laws and regulations. The plan assets of the defined benefit plan in the United Kingdom, which are held in a trust, are primarily held in funds which hold investments in government bonds, equity investments and diversified growth funds. The equity investments are diversified to include domestic (United Kingdom) and global equity investments. A “horizon based” approach is used to determine the asset allocation. Funds intended to meet the plan’s benefit obligation payments in a horizon period are invested in low risk assets such as bond investments. Funds intended to meet the plan’s benefit obligation payments outside of the horizon period are invested in more volatile assets which are expected to provide a higher return such as equity investments and diversified growth funds. The target allocation percentage for 2015 is approximately 40-50% in bond investments, 35-45% in equity investments and 15-25% in diversified growth funds. However, the trustees may reallocate the plan assets between equity investments and bond investments depending upon the actual investment performances.
103
The Company’s plan assets have been identified within the fair value hierarchy as Level 2. Funds are valued using the net asset value reported by the managers of the funds. The following table summarizes the fair value of the Company’s defined benefit plans assets as of December 31, 2014 and 2013 (in thousands):
| 2014 | 2013 | |||||||
| Funds that hold debt investments primarily government bonds |
$ | 47,473 | $ | 42,738 | ||||
| Funds that hold United Kingdom equity investments |
19,547 | 19,826 | ||||||
| Funds that hold global equity investments |
8,255 | 8,393 | ||||||
| Diversified growth fund |
12,569 | 11,169 | ||||||
| Other |
576 | 661 | ||||||
|
|
|
|
|
|||||
| Total |
$ | 88,420 | $ | 82,787 | ||||
|
|
|
|
|
|||||
The Company estimates that it will make contributions totaling approximately $5.6 million to the defined benefit plans in 2015.
The following table summarizes the Company’s expected benefit payments under the defined benefit plans for each of the next five years and the aggregate of the five years thereafter (in thousands):
| 2015 |
$ | 4,810 | ||
| 2016 |
4,541 | |||
| 2017 |
5,188 | |||
| 2018 |
5,884 | |||
| 2019 |
6,175 | |||
| Years 2020 through 2024 |
36,360 | |||
|
|
|
|||
| $ | 62,958 | |||
|
|
|
Stock Incentive Plans
The stock incentive plans provide incentives to eligible employees, officers and directors in the form of non-qualified stock options, incentive stock options, SARs, restricted stock, RSUs, performance shares, performance units, covered annual incentive awards, cash-based awards and other share-based awards, in each case subject to the terms of the stock incentive plans. As of December 31, 2014, there were 8,369,995 shares available for future grants under the stock incentive plans.
The following assumptions were used to estimate the fair value of stock options and SARs:
| Year Ended December 31, | ||||||
| 2014 | 2013 | 2012 | ||||
| Expected volatility |
26 – 43% | 18 – 47% | 33 – 53% | |||
| Weighted average expected volatility |
36% | 40% | 40% | |||
| Expected dividends |
0.0% | 0.0 – 5.45% | 4.82% | |||
| Expected term (in years) |
1.5 – 6.7 | 0.25 – 6.4 | 2.0 – 7.0 | |||
| Risk-free interest rate |
0.28 – 2.21% | 0.04 – 2.24% | 0.29 – 1.31% | |||
Stock Options
The option price is determined by the Board at the date of grant and the options expire 10 years from the date of grant. The vesting schedule for options granted to employees is either (i) 20% per year beginning on the first anniversary of the date of grant; (ii) 25% per year beginning on the first anniversary of the date of grant; or (iii) 33% on the third anniversary of the date of grant and 67% on the fourth anniversary of the date of grant. In addition, an option to acquire 38,580 shares of the Company’s common stock was granted to the Company’s Chief Executive Officer on May 31, 2012 which vests monthly over three years. Options granted to our non-employee directors vest 34% on the first anniversary of the date of grant and 33% on the second and third anniversaries of the date of grant.
104
The Company’s stock option activity in 2014 is as follows:
| Year Ended December 31, | ||||||||||||
| Number of Options |
Weighted Average Exercise Price |
Aggregate Intrinsic Value |
||||||||||
| (in thousands) | ||||||||||||
| Outstanding at December 31, 2013 |
10,100,160 | $ | 23.00 | $ | 235,729 | |||||||
| Granted |
1,622,000 | $ | 52.82 | |||||||||
| Exercised |
(2,022,576 | ) | $ | 16.37 | ||||||||
| Canceled |
(574,630 | ) | $ | 32.91 | ||||||||
|
|
|
|||||||||||
| Outstanding at December 31, 2014 |
9,124,954 | $ | 29.15 | $ | 271,216 | |||||||
|
|
|
|||||||||||
The weighted average fair value per share of the options granted in 2014, 2013 and 2012 was $18.72, $14.39 and $6.34, respectively. The total intrinsic value of options exercised was approximately $77.3 million, $27.1 million and $4.6 million in 2014, 2013 and 2012, respectively. The Company received cash of approximately $33.1 million, $12.5 million and $2.5 million in 2014, 2013 and 2012, respectively, from options exercised.
Under the Repurchase Program discussed further in Note 12, in 2013 the Company repurchased 1,990,540 vested in-the-money employee stock options with an intrinsic value of $59.1 million.
Selected information regarding the Company’s stock options as of December 31, 2014 is as follows:
| Options Outstanding | Options Exercisable | |||||||||||||||||||||
| Number of Options |
Exercise Price Range | Weighted Average Exercise Price |
Weighted Average Remaining Life (in Years) |
Number of Options | Weighted Average Exercise Price |
|||||||||||||||||
| 2,122,427 | $ | 4.70 - $15.88 | $ | 13.37 | 2.90 | 2,122,427 | $ | 13.37 | ||||||||||||||
| 2,290,827 | $ | 17.11 - $23.83 | $ | 21.42 | 6.60 | 1,220,640 | $ | 20.84 | ||||||||||||||
| 1,373,850 | $ | 24.59 - $30.07 | $ | 24.93 | 7.36 | 592,500 | $ | 24.80 | ||||||||||||||
| 1,523,750 | $ | 40.00 - $40.00 | $ | 40.00 | 8.15 | 282,000 | $ | 40.00 | ||||||||||||||
| 1,551,700 | $ | 42.74 - $53.26 | $ | 50.45 | 9.10 | 65,750 | $ | 43.54 | ||||||||||||||
| 262,400 | $ | 57.00 - $57.95 | $ | 57.42 | 9.91 | — | $ | — | ||||||||||||||
The weighted average remaining contractual life of the options outstanding and exercisable as of December 31, 2014 is 6.63 years and 4.86 years, respectively. The total aggregate intrinsic value of the exercisable stock options and the stock options expected to vest as of December 31, 2014 was approximately $267.3 million.
In connection with the November 2012 per share dividend discussed further in Note 12, the Board authorized a $2.09 per share reduction in the exercise price of certain non-vested and vested options outstanding on October 24, 2012. As such, the Company repriced 10,166,820 options previously granted to 228 employees and directors. The other terms, including the vesting schedules, remained unchanged. The aggregate incremental share-based compensation expense resulting from the modification of these outstanding stock options was approximately $11.4 million, of which approximately $9.2 million was recognized during the three months ended December 31, 2012, and the remaining $2.2 million is being recognized over the remaining vesting periods of the respective stock options.
In connection with the February 2012 per share dividend discussed further in Note 12, the Board authorized a $2.82 per share reduction in the exercise price of all non-vested options and certain vested options outstanding on February 29, 2012. As such, the Company repriced 5,561,700 options previously granted to 222 employees and directors. The other terms, including the vesting schedules, remained unchanged. The aggregate incremental share-based compensation expense resulting from the modification of these outstanding stock options was
105
approximately $7.1 million, of which approximately $4.5 million was recognized during the three months ended March 31, 2012, and the remaining $2.6 million is being recognized over the remaining vesting periods of the respective stock options.
Stock Appreciation Rights
The Company’s SARs require the Company to settle in cash an amount equal to the difference between the fair value of the Company’s common stock on the date of exercise and the grant price, multiplied by the number of SARs being exercised. These awards either (i) vest 25% per year or (ii) vest 33% on the third anniversary of the date of grant and 67% on the fourth anniversary of the date of grant.
The Company’s SAR activity in 2014 is as follows:
| Year Ended December 31, | ||||||||||||
| Number of SARs |
Weighted Average Exercise Price |
Aggregate Intrinsic Value |
||||||||||
| (in thousands) | ||||||||||||
| Outstanding at December 31, 2013 |
258,025 | $ | 35.26 | $ | 2,858 | |||||||
| Granted |
186,300 | $ | 53.50 | |||||||||
| Exercised |
(15,349 | ) | $ | 28.76 | ||||||||
| Canceled |
(10,175 | ) | $ | 37.96 | ||||||||
|
|
|
|||||||||||
| Outstanding at December 31, 2014 |
418,801 | $ | 43.55 | $ | 6,417 | |||||||
|
|
|
|||||||||||
As of December 31, 2014, 2013 and 2012, the weighted average fair value per share of the SARs granted was $27.17, $19.07 and $8.16, respectively. The Company paid approximately $408,000 and $83,000 to settle exercised SARs in 2014 and 2013, respectively. There were no SARs exercised in 2012.
The weighted average remaining contractual life of the SARs outstanding and exercisable as of December 31, 2014 is 8.6 years and 8.0 years, respectively. The total aggregate intrinsic value of the exercisable SARs and the SARs expected to vest as of December 31, 2014 was approximately $6.2 million.
In connection with the November 2012 per share dividend discussed further in Note 12, the Company’s Board authorized a $2.09 per share reduction in the exercise price of all non-vested cash-settled SARs outstanding on October 24, 2012.
Restricted Stock Units
The Company’s RSUs will settle in shares of the Company’s common stock within 45 days of the applicable vesting date. RSUs granted to employees vest 33% on the third anniversary of the date of grant and 67% on the fourth anniversary of the date of grant. RSUs granted to our non-employee directors vest 34% on the first anniversary of the date of grant and 33% on the second and third anniversaries of the date of grant.
The Company’s RSU activity in 2014 is as follows:
| Year Ended December 31, | ||||||||
| Number of RSUs |
Weighted Average Grant-Date Fair Value |
|||||||
| Non-vested at December 31, 2013 |
57,167 | $ | 44.62 | |||||
| Granted |
36,500 | $ | 47.87 | |||||
|
|
|
|||||||
| Non-vested at December 31, 2014 |
93,667 | $ | 45.89 | |||||
|
|
|
|||||||
As of December 31, 2014, there are 93,667 RSUs outstanding with an intrinsic value of approximately $5.5 million.
106
Employee Stock Purchase Plan
In November 2013, the Board approved an Employee Stock Purchase Plan (“ESPP”) which was approved by the Company’s shareholders in May 2014. Beginning in 2014, the ESPP allows eligible employees to authorize payroll deductions of up to 10% of their base salary to be applied toward the purchase of full shares of the Company’s common stock on the last day of the offering period. Offering periods under the ESPP are six months in duration. During 2014, the offering periods under the ESPP began on March 1 and September 1. In November 2014, the ESPP was amended to change the start of the offering periods to begin on April 1 and October 1 of each year, beginning April 1, 2015. Participating employees purchase shares on the last day of each offering period at a discount of 15% of the closing price of the common stock on such date as reported on the NYSE. The aggregate number of shares of the Company’s common stock that may be issued under the ESPP may not exceed 2,500,000 shares and no one employee may purchase any shares under the ESPP having a collective fair market value greater than $25,000 in any one calendar year. The shares available for purchase under the ESPP will be drawn from authorized but unissued shares of common stock. During 2014, the Company issued 46,032 shares of common stock for purchases under the ESPP.
Other
The Company sponsors a supplemental non-qualified deferred compensation plan, covering certain management employees, and maintains other statutory indemnity plans as required by local laws or regulations.
As of December 31, 2014 and 2013, the Company has a severance accrual included in accrued expenses on the accompanying consolidated balance sheets of $6.3 million and $14.1 million, respectively. The Company recognizes obligations associated with severance related to contractual termination benefits at fair value on the date that it is probable that the affected employees will be entitled to the benefit and the amount can reasonably be estimated. The severance accrual is related to cost reduction programs that will result in severance for approximately 270 positions, which are expected to lower operating costs and improve profitability by reducing excess capacity. In 2014, the Company recognized approximately $1.7 million of net reversals related to these cost reduction programs, primarily as a result of affected individuals transferring into other positions within the Company. Of the $1.7 million decrease from net reversals recognized for these cost reduction programs, approximately ($1.8) million, $100,000 and ($16,000) were related to activities in the Product Development segment, Integrated Healthcare Services segment and corporate activities, respectively. The Company expects the majority of the severance accruals at December 31, 2014 will be paid in 2015.
The following amounts were recorded for the severance associated with cost reduction programs (in thousands):
| Balance at December 31, 2013 |
$ | 14,056 | ||
| Expense, net of reversals |
(1,665 | ) | ||
| Payments |
(6,036 | ) | ||
| Foreign currency translation |
(81 | ) | ||
|
|
|
|||
| Balance at December 31, 2014 |
$ | 6,274 | ||
|
|
|
18. Related Party Transactions
As the Company has done in prior years, the Company reimburses its Executive Chairman for business-related travel services he provides for himself and other Company employees with the use of his own airplane. In 2014, 2013 and 2012, the Company expensed approximately $1.8 million, $2.7 million and $4.2 million, respectively, for such business-related travel expenses. In the second quarter of 2013, the Company paid a $1.5 million fee in connection with the modification of the agreement for the business usage of the airplane that limits reimbursements to $2.5 million per year.
107
During 2014 and 2013, the Company entered into a number of contracts with HUYA, primarily in Asia, in which the Company will provide up to approximately $416,000 and $19.2 million, respectively, of services on a fee for services basis at arm’s length and at market rates. In 2014 and 2013, the Company provided approximately $2.3 million and $772,000, respectively, of services under these agreements.
During 2014, HUYA subleased office space in Japan from the Company. The nine month sublease ended in September 2014 and the Company recognized $76,000 in sublease income during 2014.
The Company has entered into other transactions with related parties including the funding of research and development costs for HUYA which is discussed in Note 1; investments in and advances to unconsolidated affiliates which are discussed in Note 4; and management fees which are discussed in Note 13.
19. Operations by Geographic Location
The table below presents the Company’s operations by geographical location. The Company attributes revenues to geographical locations based upon where the services are performed. The Company’s operations within each geographical region are further broken down to show each country which accounts for 10% or more of the totals (in thousands):
| Year Ended December 31, | ||||||||||||
| 2014 | 2013 | 2012 | ||||||||||
| Service revenues: |
||||||||||||
| Americas: |
||||||||||||
| United States |
$ | 1,589,402 | $ | 1,351,160 | $ | 1,288,990 | ||||||
| Other |
194,597 | 181,814 | 180,568 | |||||||||
|
|
|
|
|
|
|
|||||||
| Americas |
1,783,999 | 1,532,974 | 1,469,558 | |||||||||
| Europe and Africa: |
||||||||||||
| United Kingdom |
402,184 | 362,242 | 344,852 | |||||||||
| Other |
1,121,354 | 1,139,262 | 1,086,065 | |||||||||
|
|
|
|
|
|
|
|||||||
| Europe and Africa |
1,523,538 | 1,501,504 | 1,430,917 | |||||||||
| Asia-Pacific: |
||||||||||||
| Japan |
471,831 | 438,882 | 500,280 | |||||||||
| Other |
386,454 | 334,980 | 291,543 | |||||||||
|
|
|
|
|
|
|
|||||||
| Asia-Pacific |
858,285 | 773,862 | 791,823 | |||||||||
|
|
|
|
|
|
|
|||||||
| Total service revenues |
4,165,822 | 3,808,340 | 3,692,298 | |||||||||
| Reimbursed expenses |
1,294,176 | 1,291,205 | 1,173,215 | |||||||||
|
|
|
|
|
|
|
|||||||
| Total revenues |
$ | 5,459,998 | $ | 5,099,545 | $ | 4,865,513 | ||||||
|
|
|
|
|
|
|
|||||||
| As of December 31, | ||||||||
| 2014 | 2013 | |||||||
| Property, equipment and software, net: |
||||||||
| Americas: |
||||||||
| United States |
$ | 167,890 | $ | 168,380 | ||||
| Other |
1,774 | 2,146 | ||||||
|
|
|
|
|
|||||
| Americas |
169,664 | 170,526 | ||||||
| Europe and Africa: |
||||||||
| United Kingdom |
48,409 | 50,043 | ||||||
| Other |
15,782 | 18,246 | ||||||
|
|
|
|
|
|||||
| Europe and Africa |
64,191 | 68,289 | ||||||
| Asia-Pacific: |
||||||||
| Japan |
20,752 | 26,096 | ||||||
| Other |
25,271 | 27,574 | ||||||
|
|
|
|
|
|||||
| Asia-Pacific |
46,023 | 53,670 | ||||||
|
|
|
|
|
|||||
| Total property, equipment and software, net |
$ | 279,878 | $ | 292,485 | ||||
|
|
|
|
|
|||||
108
20. Segments
The following table presents the Company’s operations by reportable segment. The Company is managed through two reportable segments, Product Development and Integrated Healthcare Services. Product Development, which primarily serves biopharmaceutical customers engaged in research and development, provides clinical research and clinical trial services. Integrated Healthcare Services provides commercialization services to biopharmaceutical customers and research, analytics, real-world and late phase research, and other services to both biopharmaceutical customers and the broader healthcare market.
Certain costs are not allocated to the Company’s segments and are reported as general corporate and unallocated expenses. These costs primarily consist of share-based compensation and expenses for corporate overhead functions such as finance, human resources, information technology, facilities and legal, as well as certain expenses incurred during the second quarter of 2013, including the $25.0 million fee incurred in connection with the termination of the management agreement with affiliates of certain shareholders and the $1.5 million fee paid in connection with the modification of an agreement for the business usage of an airplane owned by GFM, a company owned by the Company’s Executive Chairman. The Company does not allocate restructuring or impairment charges to its segments.
109
Information presented below is in thousands:
| Year Ended December 31, | ||||||||||||
| 2014 | 2013 | 2012 | ||||||||||
| Service revenues |
||||||||||||
| Product Development |
$ | 3,097,831 | $ | 2,919,730 | $ | 2,728,695 | ||||||
| Integrated Healthcare Services |
1,067,991 | 888,610 | 963,603 | |||||||||
|
|
|
|
|
|
|
|||||||
| Total service revenues |
4,165,822 | 3,808,340 | 3,692,298 | |||||||||
| Costs of revenue, service costs |
||||||||||||
| Product Development |
1,820,937 | 1,752,800 | 1,683,340 | |||||||||
| Integrated Healthcare Services |
863,169 | 718,626 | 776,027 | |||||||||
|
|
|
|
|
|
|
|||||||
| Total costs of revenue, service costs |
2,684,106 | 2,471,426 | 2,459,367 | |||||||||
| Selling, general and administrative |
||||||||||||
| Product Development |
631,678 | 604,663 | 567,500 | |||||||||
| Integrated Healthcare Services |
140,019 | 127,860 | 127,067 | |||||||||
| General corporate and unallocated |
110,641 | 127,987 | 123,188 | |||||||||
|
|
|
|
|
|
|
|||||||
| Total selling, general and administrative |
882,338 | 860,510 | 817,755 | |||||||||
| Income from operations |
||||||||||||
| Product Development |
645,216 | 562,267 | 477,855 | |||||||||
| Integrated Healthcare Services |
64,803 | 42,124 | 60,509 | |||||||||
| General corporate and unallocated |
(110,641 | ) | (127,987 | ) | (123,188 | ) | ||||||
| Restructuring costs |
(8,988 | ) | (14,071 | ) | (18,741 | ) | ||||||
|
|
|
|
|
|
|
|||||||
| Total income from operations |
$ | 590,390 | $ | 462,333 | $ | 396,435 | ||||||
|
|
|
|
|
|
|
|||||||
| As of December 31, | ||||||||||||
| 2014 | 2013 | 2012 | ||||||||||
| Assets |
||||||||||||
| Product Development |
$ | 2,786,692 | $ | 2,571,502 | $ | 2,016,605 | ||||||
| Integrated Healthcare Services |
330,689 | 299,284 | 351,656 | |||||||||
| General corporate and unallocated |
188,451 | 196,011 | 130,892 | |||||||||
|
|
|
|
|
|
|
|||||||
| Total assets |
$ | 3,305,832 | $ | 3,066,797 | $ | 2,499,153 | ||||||
|
|
|
|
|
|
|
|||||||
| Year Ended December 31, | ||||||||||||
| 2014 | 2013 | 2012 | ||||||||||
| Expenditures to acquire long-lived assets |
||||||||||||
| Product Development |
$ | 68,187 | $ | 69,375 | $ | 61,097 | ||||||
| Integrated Healthcare Services |
8,279 | 17,398 | 8,181 | |||||||||
| General corporate and unallocated |
6,184 | 1,574 | 2,058 | |||||||||
|
|
|
|
|
|
|
|||||||
| Total expenditures to acquire long-lived assets |
$ | 82,650 | $ | 88,347 | $ | 71,336 | ||||||
|
|
|
|
|
|
|
|||||||
| Year Ended December 31, | ||||||||||||
| 2014 | 2013 | 2012 | ||||||||||
| Depreciation and amortization expense |
||||||||||||
| Product Development |
$ | 95,168 | $ | 82,047 | $ | 68,825 | ||||||
| Integrated Healthcare Services |
20,821 | 20,475 | 24,366 | |||||||||
| General corporate and unallocated |
5,024 | 4,982 | 5,097 | |||||||||
|
|
|
|
|
|
|
|||||||
| Total depreciation and amortization expense |
$ | 121,013 | $ | 107,504 | $ | 98,288 | ||||||
|
|
|
|
|
|
|
|||||||
110
21. Earnings Per Share
The following table reconciles the basic to diluted weighted average shares outstanding (in thousands):
| Year Ended December 31, | ||||||||||||
| 2014 | 2013 | 2012 | ||||||||||
| Basic weighted average common shares outstanding |
127,994 | 124,147 | 115,710 | |||||||||
| Effect of dilutive stock options and share awards |
3,089 | 3,715 | 2,086 | |||||||||
|
|
|
|
|
|
|
|||||||
| Diluted weighted average common shares outstanding |
131,083 | 127,862 | 117,796 | |||||||||
|
|
|
|
|
|
|
|||||||
The following table shows the weighted average number of outstanding share-based awards not included in the computation of diluted earnings per share as the effect of including such share-based awards in the computation would be anti-dilutive (in thousands):
| Year Ended December 31, | ||||||||||||
| 2014 | 2013 | 2012 | ||||||||||
| Weighted average shares subject to anti-dilutive share-based awards |
1,241 | 1,765 | 2,363 | |||||||||
Share-based awards will have a dilutive effect under the treasury method only when the respective period’s average market value of the Company’s common stock exceeds the exercise proceeds.
22. Comprehensive Income
Below is a summary of the components of AOCI (in thousands):
| Foreign Currency Translation |
Marketable Securities |
Derivative Instrument |
Defined Benefit Plan |
Income Taxes |
AOCI | |||||||||||||||||||
| Balance at December 31, 2011 |
$ | 25,357 | $ | (191 | ) | $ | (26,345 | ) | $ | (4,788 | ) | $ | 28,838 | $ | 22,871 | |||||||||
| Other comprehensive (loss) income before reclassifications |
(6,045 | ) | 658 | (10,698 | ) | (4,616 | ) | 2,614 | (18,087 | ) | ||||||||||||||
| Reclassification adjustments |
— | — | 3,501 | 1,169 | (1,759 | ) | 2,911 | |||||||||||||||||
|
|
|
|
|
|
|
|
|
|
|
|
|
|||||||||||||
| Balance at December 31, 2012 |
19,312 | 467 | (33,542 | ) | (8,235 | ) | 29,693 | 7,695 | ||||||||||||||||
| Other comprehensive (loss) income before reclassifications |
(25,141 | ) | 5,241 | (393 | ) | 2,147 | 1,331 | (16,815 | ) | |||||||||||||||
| Reclassification adjustments |
— | — | 13,080 | 1,044 | (5,380 | ) | 8,744 | |||||||||||||||||
|
|
|
|
|
|
|
|
|
|
|
|
|
|||||||||||||
| Balance at December 31, 2013 |
(5,829 | ) | 5,708 | (20,855 | ) | (5,044 | ) | 25,644 | (376 | ) | ||||||||||||||
| Other comprehensive (loss) income before reclassifications |
(49,911 | ) | (976 | ) | (6,834 | ) | (10,218 | ) | 7,225 | (60,714 | ) | |||||||||||||
| Reclassification adjustments |
— | (5,004 | ) | 8,630 | 743 | (2,370 | ) | 1,999 | ||||||||||||||||
|
|
|
|
|
|
|
|
|
|
|
|
|
|||||||||||||
| Balance at December 31, 2014 |
$ | (55,740 | ) | $ | (272 | ) | $ | (19,059 | ) | $ | (14,519 | ) | $ | 30,499 | $ | (59,091 | ) | |||||||
|
|
|
|
|
|
|
|
|
|
|
|
|
|||||||||||||
111
Below is a summary of the (gains) losses reclassified from AOCI into the consolidated statements of income and the affected financial statement line item (in thousands):
| Reclassification Adjustments |
Affected Financial Statement Line Item |
Year Ended December 31, | ||||||||||||
| 2014 | 2013 | 2012 | ||||||||||||
| Marketable securities: |
||||||||||||||
| Marketable securities |
Other (income) expense, net | $ | (5,004 | ) | $ | — | $ | — | ||||||
|
|
|
|
|
|
|
|||||||||
| Total before income taxes |
(5,004 | ) | — | — | ||||||||||
| Income tax expense |
(1,927 | ) | — | — | ||||||||||
|
|
|
|
|
|
|
|||||||||
| Total net of income taxes |
$ | (3,077 | ) | $ | — | $ | — | |||||||
|
|
|
|
|
|
|
|||||||||
| Derivative instruments: |
||||||||||||||
| Interest rate swaps |
Interest expense | $ | 12,424 | $ | 12,582 | $ | 3,248 | |||||||
| Foreign exchange forward contracts |
Service revenues | (3,794 | ) | 498 | 253 | |||||||||
|
|
|
|
|
|
|
|||||||||
| Total before income taxes |
8,630 | 13,080 | 3,501 | |||||||||||
| Income tax benefit |
4,022 | 4,991 | 1,313 | |||||||||||
|
|
|
|
|
|
|
|||||||||
| Total net of income taxes |
$ | 4,608 | $ | 8,089 | $ | 2,188 | ||||||||
|
|
|
|
|
|
|
|||||||||
| Defined benefit plans: |
||||||||||||||
| Amortization of prior service costs |
See Note 17 | $ | 107 | $ | 336 | $ | 411 | |||||||
| Amortization of actuarial losses |
See Note 17 | 636 | 708 | 758 | ||||||||||
|
|
|
|
|
|
|
|||||||||
| Total before income taxes |
743 | 1,044 | 1,169 | |||||||||||
| Income tax benefit |
275 | 389 | 446 | |||||||||||
|
|
|
|
|
|
|
|||||||||
| Total net of income taxes |
$ | 468 | $ | 655 | $ | 723 | ||||||||
|
|
|
|
|
|
|
|||||||||
23. Supplemental Cash Flow Information
The following table presents the Company’s supplemental cash flow information (in thousands):
| Year Ended December 31, | ||||||||||||
| 2014 | 2013 | 2012 | ||||||||||
| Supplemental Cash Flow Information: |
||||||||||||
| Interest paid |
$ | 93,912 | $ | 115,494 | $ | 127,133 | ||||||
| Income taxes paid, net of refunds |
138,931 | 70,983 | 103,976 | |||||||||
| Non-cash Investing Activities: |
||||||||||||
| Acquisition of property and equipment utilizing capital leases |
$ | 2,476 | $ | 3,761 | $ | 5,267 | ||||||
| Fair value of contingent consideration payable in connection with acquisitions |
— | 14,300 | 1,990 | |||||||||
24. Quarterly Financial Data (Unaudited)
The following table summarizes the Company’s unaudited quarterly results of operations (in thousands, except per share data):
| 2014 | ||||||||||||||||
| First Quarter | Second Quarter | Third Quarter | Fourth Quarter | |||||||||||||
| Service revenues |
$ | 1,005,288 | $ | 1,035,476 | $ | 1,061,013 | $ | 1,064,045 | ||||||||
| Income from operations |
141,316 | 141,000 | 149,142 | 158,932 | ||||||||||||
| Net income |
90,214 | 85,110 | 92,733 | 88,444 | ||||||||||||
| Net (income) loss attributable to noncontrolling interests |
(31 | ) | 10 | (79 | ) | (18 | ) | |||||||||
| Net income attributable to Quintiles Transnational Holdings Inc |
$ | 90,183 | $ | 85,120 | $ | 92,654 | $ | 88,426 | ||||||||
|
|
|
|
|
|
|
|
|
|||||||||
| Basic earnings per share (1) |
$ | 0.69 | $ | 0.66 | $ | 0.73 | $ | 0.70 | ||||||||
|
|
|
|
|
|
|
|
|
|||||||||
| Diluted earnings per share (1) |
$ | 0.68 | $ | 0.64 | $ | 0.71 | $ | 0.69 | ||||||||
|
|
|
|
|
|
|
|
|
|||||||||
112
| 2013 | ||||||||||||||||
| First Quarter | Second Quarter | Third Quarter | Fourth Quarter | |||||||||||||
| Service revenues |
$ | 927,435 | $ | 944,238 | $ | 932,727 | $ | 1,003,940 | ||||||||
| Income from operations |
115,165 | 94,897 | 125,259 | 127,012 | ||||||||||||
| Net income |
48,156 | 38,353 | 66,584 | 72,934 | ||||||||||||
| Net loss attributable to noncontrolling interests |
153 | 164 | 185 | 62 | ||||||||||||
| Net income attributable to Quintiles Transnational Holdings Inc |
$ | 48,309 | $ | 38,517 | $ | 66,769 | $ | 72,996 | ||||||||
|
|
|
|
|
|
|
|
|
|||||||||
| Basic earnings per share (1) |
$ | 0.42 | $ | 0.31 | $ | 0.52 | $ | 0.57 | ||||||||
|
|
|
|
|
|
|
|
|
|||||||||
| Diluted earnings per share (1) |
$ | 0.41 | $ | 0.30 | $ | 0.50 | $ | 0.55 | ||||||||
|
|
|
|
|
|
|
|
|
|||||||||
| (1) | The sum of the quarterly per share amounts may not equal per share amounts reported for year-to-date periods. This is due to changes in the number of weighted average shares outstanding and the effects of rounding for each period. |
25. Subsequent Event
In February 2015, the Board approved a restructuring plan for approximately $30.0 million to align its resources and reduce overcapacity. These actions are expected to occur throughout 2015 and 2016, and are expected to consist of severance, facility closure and other exit related costs.
113
Item 9. Changes in and Disagreements with Accountants on Accounting and Financial Disclosure
None.
Item 9A. Controls and Procedures
Evaluation of Disclosure Controls and Procedures
As required by Rule 13a-15 under the Exchange Act, as amended, we carried out an evaluation of the effectiveness of the design and operation of our disclosure controls and procedures under the supervision and with the participation of our management, including the Chief Executive Officer, or CEO, and Chief Financial Officer, or CFO. There are inherent limitations to the effectiveness of any system of disclosure controls and procedures, including the possibility of human error and the circumvention or overriding of the controls and procedures. Accordingly, even effective disclosure controls and procedures can only provide reasonable assurance of achieving their control objectives. Based upon our evaluation, our CEO and CFO concluded that our disclosure controls and procedures were effective to provide reasonable assurance that information required to be disclosed by us in the reports that we file or submit under the Exchange Act, as amended, is recorded, processed, summarized and reported within the time periods specified in the applicable rules and forms, and that it is accumulated and communicated to our management, including our CEO and CFO, as appropriate, to allow timely decisions regarding required disclosure.
Management’s Report on Internal Control over Financial Reporting
Our management’s report on internal control over financial reporting is set forth in Part II, Item 8 of this Annual Report on Form 10-K and is incorporated herein by reference.
Changes in Internal Control over Financial Reporting
There were no changes in our internal control over financial reporting during the quarter ended December 31, 2014 that materially affected, or are reasonably likely to materially affect, our internal control over financial reporting.
None.
114
PART III
Item 10. Directors, Executive Officers and Corporate Governance
The information required by this item is incorporated by reference to our proxy statement to be filed with the SEC within 120 days of the end of our fiscal year ended December 31, 2014 for the 2015 Annual Meeting of Shareholders, or the “2015 Proxy Statement.”
Item 11. Executive Compensation
The information required by this item is incorporated by reference to the 2015 Proxy Statement.
Item 12. Security Ownership of Certain Beneficial Owners and Management and Related Stockholder Matters
The information required by this item is incorporated by reference to the 2015 Proxy Statement.
Item 13. Certain Relationships and Related Transactions and Director Independence
The information required by this item is incorporated by reference to the 2015 Proxy Statement.
Item 14. Principal Accountant Fees and Services
The information required by this item is incorporated by reference to the 2015 Proxy Statement.
115
PART IV
Item 15. Exhibits and Financial Statement Schedules
| (a) | The following documents are filed as part of this report: |
(1) Financial Statements
The following consolidated financial statements of Quintiles Transnational Holdings Inc. and its subsidiaries, and the independent registered public accounting firm’s report thereon, are included in Part II, Item 8 of this report:
| Page | ||||
| Management’s Report on Internal Control over Financial Reporting |
67 | |||
| 68 | ||||
| 69 | ||||
| 70 | ||||
| 71 | ||||
| 72 | ||||
| 73 | ||||
| 74 | ||||
(2) Financial Statement Schedules
| Schedule I—Condensed Financial Information of Registrant (Parent Company Only) |
119 | |||
| 124 |
All other schedules are omitted, since the required information is not applicable or is not present in amounts sufficient to require submission of the schedule, or because the information required is included in the consolidated financial statements and notes thereto.
(3) Exhibits
The exhibits in the accompanying Exhibit Index following the signature page are filed or furnished as a part of this report and are incorporated herein by reference.
116
Pursuant to the requirements of Section 13 or 15(d) of the Securities Exchange Act of 1934, the registrant has duly caused this report to be signed on its behalf by the undersigned, thereunto duly authorized.
QUINTILES TRANSNATIONAL HOLDINGS INC.
| By: |
/s/ Kevin K. Gordon | |
| Name: Kevin K. Gordon | ||
| Title: Executive Vice President and Chief Financial Officer | ||
| Date: |
February 12, 2015 | |
Pursuant to the requirements of the Securities Exchange Act of 1934, this report has been signed below by the following persons on behalf of the registrant in the capacities and on the dates indicated.
| Signature |
Title |
Date | ||
| /s/ Thomas H. Pike Thomas H. Pike |
Chief Executive Officer and Director (Principal Executive Officer) |
February 12, 2015 | ||
| /s/ Kevin K. Gordon Kevin K. Gordon |
Executive Vice President and Chief Financial Officer (Principal Financial Officer) | February 12, 2015 | ||
| /s/ Charles E. Williams Charles E. Williams |
Senior Vice President, Corporate Controller (Principal Accounting Officer) | February 12, 2015 | ||
| /s/ Dennis B. Gillings, CBE Dennis B. Gillings, CBE |
Director |
February 12, 2015 | ||
| /s/ Fred E. Cohen Fred E. Cohen |
Director |
February 12, 2015 | ||
| /s/ John P. Connaughton John P. Connaughton |
Director |
February 12, 2015 | ||
| /s/ Jonathan J. Coslet Jonathan J. Coslet |
Director |
February 12, 2015 | ||
| /s/ Michael J. Evanisko Michael J. Evanisko |
Director |
February 12, 2015 | ||
| /s/ Mireille G. Gillings Mireille G. Gillings |
Director |
February 12, 2015 | ||
| /s/ Christopher R. Gordon Christopher R. Gordon |
Director |
February 12, 2015 | ||
117
| Signature |
Title |
Date | ||
| /s/ Jack M. Greenberg Jack M. Greenberg |
Director |
February 12, 2015 | ||
|
John M. Leonard |
Director |
|||
| /s/ Richard Relyea Richard Relyea |
Director |
February 12, 2015 | ||
| /s/ Leonard D. Schaeffer Leonard D. Schaeffer |
Director |
February 12, 2015 | ||
118
(2) Financial Statement Schedules
Schedule I—Condensed Financial Information of Registrant
QUINTILES TRANSNATIONAL HOLDINGS INC. (PARENT COMPANY ONLY)
CONDENSED STATEMENTS OF INCOME
| Year Ended December 31, | ||||||||||||
| 2014 | 2013 | 2012 | ||||||||||
| (in thousands) | ||||||||||||
| Selling, general and administrative |
$ | 1,509 | $ | 2 | $ | 23 | ||||||
|
|
|
|
|
|
|
|||||||
| Loss from operations |
(1,509 | ) | (2 | ) | (23 | ) | ||||||
| Interest income |
(52 | ) | (6 | ) | (14 | ) | ||||||
| Interest expense |
— | 9,242 | 21,134 | |||||||||
| Loss on extinguishment of debt |
— | 15,501 | — | |||||||||
| Other expense (income), net |
8 | — | — | |||||||||
|
|
|
|
|
|
|
|||||||
| Loss before income taxes and equity in earnings of subsidiary |
(1,465 | ) | (24,739 | ) | (21,143 | ) | ||||||
| Income tax benefit |
(810 | ) | (9,347 | ) | (7,601 | ) | ||||||
|
|
|
|
|
|
|
|||||||
| Loss before equity in earnings of subsidiary |
(655 | ) | (15,392 | ) | (13,542 | ) | ||||||
| Equity in earnings of subsidiary |
357,038 | 241,983 | 191,088 | |||||||||
|
|
|
|
|
|
|
|||||||
| Net income |
$ | 356,383 | $ | 226,591 | $ | 177,546 | ||||||
|
|
|
|
|
|
|
|||||||
119
QUINTILES TRANSNATIONAL HOLDINGS INC. (PARENT COMPANY ONLY)
CONDENSED STATEMENTS OF COMPREHENSIVE INCOME
| Year Ended December 31, | ||||||||||||
| 2014 | 2013 | 2012 | ||||||||||
| (in thousands) | ||||||||||||
| Net income |
$ | 356,383 | $ | 226,591 | $ | 177,546 | ||||||
| Unrealized (losses) gains on marketable securities, net of income taxes of ($376), $2,016 and $258 |
(600 | ) | 3,225 | 400 | ||||||||
| Unrealized (losses) gains on derivative instruments, net of income taxes of ($1,767), ($751) and ($4,392) |
(5,067 | ) | 358 | (6,306 | ) | |||||||
| Foreign currency translation, net of income taxes of ($2,101), ($2,465) and $2,964 |
(47,810 | ) | (22,676 | ) | (9,009 | ) | ||||||
| Defined benefit plan adjustments, net of income taxes of ($2,981), ($131) and ($1,444) |
(7,237 | ) | 2,278 | (3,172 | ) | |||||||
| Reclassification adjustments: |
||||||||||||
| Gains on marketable securities included in net income, net of income taxes of ($1,927) |
(3,077 | ) | — | — | ||||||||
| Losses on derivative instruments included in net income, net of income taxes of $4,022, $4,991 and $1,313 |
4,608 | 8,089 | 2,188 | |||||||||
| Amortization of prior service costs and losses included in net income, net of income taxes of $275, $389 and $446 |
468 | 655 | 723 | |||||||||
|
|
|
|
|
|
|
|||||||
| Comprehensive income |
$ | 297,668 | $ | 218,520 | $ | 162,370 | ||||||
|
|
|
|
|
|
|
|||||||
120
QUINTILES TRANSNATIONAL HOLDINGS INC. (PARENT COMPANY ONLY)
CONDENSED BALANCE SHEETS
| December 31, | ||||||||
| 2014 | 2013 | |||||||
| (in thousands, except per share data) | ||||||||
| ASSETS | ||||||||
| Current assets: |
||||||||
| Cash and cash equivalents |
$ | 11,635 | $ | 71,942 | ||||
| Income taxes receivable |
546 | — | ||||||
| Other current assets and receivables |
114 | 2,995 | ||||||
|
|
|
|
|
|||||
| Total current assets |
12,295 | 74,937 | ||||||
|
|
|
|
|
|||||
| Deferred income taxes |
7 | 44 | ||||||
| Deposits and other assets |
— | 26 | ||||||
|
|
|
|
|
|||||
| Total assets |
$ | 12,302 | $ | 75,007 | ||||
|
|
|
|
|
|||||
| LIABILITIES AND SHAREHOLDERS’ DEFICIT | ||||||||
| Current liabilities: |
||||||||
| Accounts payable |
$ | 21 | $ | — | ||||
| Accrued expenses |
84 | — | ||||||
| Income taxes payable |
— | 302 | ||||||
|
|
|
|
|
|||||
| Total current liabilities |
105 | 302 | ||||||
| Investment in subsidiary |
716,148 | 739,115 | ||||||
| Payable to subsidiary |
110 | 3,003 | ||||||
|
|
|
|
|
|||||
| Total liabilities |
716,363 | 742,420 | ||||||
|
|
|
|
|
|||||
| Commitments and contingencies |
||||||||
| Shareholders’ deficit: |
||||||||
| Common stock and additional paid-in capital, 300,000 shares authorized, $0.01 par value, 124,129 and 129,652 shares issued and outstanding at December 31, 2014 and 2013, respectively |
143,828 | 478,144 | ||||||
| Accumulated deficit |
(788,798 | ) | (1,145,181 | ) | ||||
| Accumulated other comprehensive income |
(59,091 | ) | (376 | ) | ||||
|
|
|
|
|
|||||
| Total shareholders’ deficit |
(704,061 | ) | (667,413 | ) | ||||
|
|
|
|
|
|||||
| Total liabilities and shareholders’ deficit |
$ | 12,302 | $ | 75,007 | ||||
|
|
|
|
|
|||||
121
QUINTILES TRANSNATIONAL HOLDINGS INC. (PARENT COMPANY ONLY)
CONDENSED STATEMENTS OF CASH FLOWS
| Year Ended December 31, | ||||||||||||
| 2014 | 2013 | 2012 | ||||||||||
| (in thousands) | ||||||||||||
| Operating activities: |
||||||||||||
| Net income |
$ | 356,383 | $ | 226,591 | $ | 177,546 | ||||||
| Adjustments to reconcile net income to cash provided by operating activities: |
||||||||||||
| Amortization of debt issuance costs and discount |
— | 10,346 | 1,884 | |||||||||
| Subsidiary income |
(27,623 | ) | (119,998 | ) | — | |||||||
| Provision for (benefit from) deferred income taxes |
37 | 304 | (70 | ) | ||||||||
| Change in operating assets and liabilities: |
||||||||||||
| Accounts receivable and unbilled services |
2,994 | (2,995 | ) | — | ||||||||
| Prepaid expenses and other assets |
— | (21 | ) | (100 | ) | |||||||
| Accounts payable and accrued expenses |
65 | (62 | ) | 63 | ||||||||
| Income taxes payable and other liabilities |
(847 | ) | (9,651 | ) | (7,531 | ) | ||||||
|
|
|
|
|
|
|
|||||||
| Net cash provided by operating activities |
331,009 | 104,514 | 171,792 | |||||||||
| Investing activities: |
||||||||||||
| Investments in subsidiary, net of payments received |
— | (179,847 | ) | 118,712 | ||||||||
|
|
|
|
|
|
|
|||||||
| Net cash provided by (used in) investing activities |
— | (179,847 | ) | 118,712 | ||||||||
| Financing activities: |
||||||||||||
| Proceeds from issuance of debt |
— | — | 293,877 | |||||||||
| Payment of debt issuance costs |
— | — | (5,988 | ) | ||||||||
| Repayment of debt |
— | (300,000 | ) | — | ||||||||
| Issuance of common stock |
— | 525,000 | 3,116 | |||||||||
| Payment of common stock issuance costs |
(105 | ) | (35,439 | ) | — | |||||||
| Stock issued under employee stock purchase and option plans |
35,228 | 12,539 | 350 | |||||||||
| Repurchase of common stock |
(415,131 | ) | (6,434 | ) | (13,363 | ) | ||||||
| Repurchase of stock options |
(8,415 | ) | (50,649 | ) | — | |||||||
| Intercompany with subsidiary |
(2,893 | ) | (153 | ) | 156 | |||||||
| Dividends paid to common shareholders |
— | — | (567,851 | ) | ||||||||
|
|
|
|
|
|
|
|||||||
| Net cash (used in) provided by financing activities |
(391,316 | ) | 144,864 | (289,703 | ) | |||||||
|
|
|
|
|
|
|
|||||||
| (Decrease) increase in cash and cash equivalents |
(60,307 | ) | 69,531 | 801 | ||||||||
| Cash and cash equivalents at beginning of period |
71,942 | 2,411 | 1,610 | |||||||||
|
|
|
|
|
|
|
|||||||
| Cash and cash equivalents at end of period |
$ | 11,635 | $ | 71,942 | $ | 2,411 | ||||||
|
|
|
|
|
|
|
|||||||
122
QUINTILES TRANSNATIONAL HOLDINGS INC. (PARENT COMPANY ONLY)
NOTES TO CONDENSED FINANCIAL STATEMENTS
The condensed parent company financial statements have been prepared in accordance with Rule 12-04, Schedule I of Regulation S-X as the restricted net assets of Quintiles Transnational Holdings Inc.’s (the “Company”) wholly-owned subsidiary, Quintiles Transnational Corp. (“Quintiles Transnational”) exceed 25% of the consolidated net assets of the Company. The ability of Quintiles Transnational to pay dividends may be limited due to the restrictive covenants in the agreements governing its credit arrangements.
These condensed parent company financial statements include the accounts of Quintiles Transnational Holdings, Inc. on a standalone basis (the “Parent”) and the equity method of accounting is used to reflect ownership interest in its subsidiary. Refer to the consolidated financial statements and notes presented elsewhere herein for additional information and disclosures with respect to these financial statements.
Since the Parent is part of a group that files a consolidated income tax return, in accordance with ASC 740, a portion of the consolidated amount of current and deferred income tax expense of the Company has been allocated to the Parent. The income tax benefit of $810,000, $9.3 million and $7.6 million in 2014, 2013 and 2012, respectively, represents the income tax benefit that will be or were already utilized in the Company’s consolidated United States federal and state income tax returns. If the Parent was not part of these consolidated income tax returns, it would not be able to recognize any income tax benefit, as it generates no revenue against which the losses could be used on a separate filer basis.
Below is a summary of the dividends paid to the Parent by Quintiles Transnational in 2014, 2013 and 2012 (in thousands):
| Amount | ||||
| Paid in November 2014 |
$ | 234,000 | ||
| Paid in May 2014 |
87,000 | |||
| Paid in January 2014 |
8,415 | |||
|
|
|
|||
| Total paid in 2014 |
$ | 329,415 | ||
|
|
|
|||
| Paid in November and December 2013 |
$ | 116,585 | ||
| Paid in February 2013 |
5,400 | |||
|
|
|
|||
| Total paid in 2013 |
$ | 121,985 | ||
|
|
|
|||
| Paid in November 2012 |
$ | 6,000 | ||
| Paid in October 2012 |
241,700 | |||
| Paid in August 2012 |
6,300 | |||
| Paid in May 2012 |
4,800 | |||
| Paid in March 2012 |
50,000 | |||
| Paid in February 2012 |
10,000 | |||
|
|
|
|||
| Total paid in 2012 |
$ | 318,800 | ||
|
|
|
|||
123
Schedule II—Valuation and Qualifying Accounts
Deferred Tax Asset Valuation Allowance
Information presented below is in thousands:
| Balance at Beginning of Year |
Additions Charged to Expenses |
Deductions (a) | Balance at End of Year |
|||||||||||||
| December 31, 2014 |
$ | 29,501 | $ | 11,084 | $ | (15,890 | ) | $ | 24,695 | |||||||
| December 31, 2013 |
$ | 32,344 | $ | 3,611 | $ | (6,454 | ) | $ | 29,501 | |||||||
| December 31, 2012 |
$ | 31,669 | $ | 4,173 | $ | (3,498 | ) | $ | 32,344 | |||||||
| (a) | – Impact of reductions recorded to expense and translation adjustments. |
124
| Incorporated by Reference | ||||||||||||||||||
| Exhibit |
Exhibit |
Filed Herewith |
Form |
File No. | Exhibit |
Filing Date | ||||||||||||
| 3.1 | Second Amended and Restated Articles of Incorporation of Quintiles Transnational Holdings Inc. | S-1/A | 333-186708 | 3.1 | May 6, 2013 | |||||||||||||
| 3.3 | Third Amended and Restated Bylaws of Quintiles Transnational Holdings Inc. | S-3 | 333-199843 | 3.2 | November 4, 2014 | |||||||||||||
| 4.1 | Specimen Common Stock Certificate of Quintiles Transnational Holdings Inc. | S-1/A | 333-186708 | 4.1 | April 26, 2013 | |||||||||||||
| 4.2 | Second Amended and Restated Registration Rights Agreement, dated May 14, 2013, among Quintiles Transnational Holdings Inc. and the shareholders identified therein. | 8-K | 001-35907 | 4.1 | May 15, 2013 | |||||||||||||
| 4.3 | Amendment No. 1, dated February 5, 2015, to Second Amended and Restated Registration Rights Agreement, dated May 14, 2013, among Quintiles Transnational Holdings Inc. and the shareholders identified therein. | 8-K | 001-35907 | 4.1 | February 6, 2015 | |||||||||||||
| 10.1 | Credit Agreement, dated June 8, 2011, among Quintiles Transnational Corp., as the Borrower, each lender from time to time party thereto, and JPMorgan Chase Bank, N.A., as Administrative Agent, Swing Line Lender and L/C Issuer. | S-1 | 333-186708 | 10.1 | February 15, 2013 | |||||||||||||
| 10.2 | Amendment No. 1, dated October 22, 2012, to Credit Agreement, dated June 8, 2011, among Quintiles Transnational Corp., as the Borrower, each lender from time to time party thereto, and JPMorgan Chase Bank, N.A., as Administrative Agent, Swing Line Lender and L/C Issuer. | S-1 | 333-186708 | 10.2 | February 15, 2013 | |||||||||||||
| 10.3 | Amendment No. 2, dated December 20, 2012, to Credit Agreement, dated June 8, 2011, among Quintiles Transnational Corp., as the Borrower, each lender from time to time party thereto, and JPMorgan Chase Bank, N.A., as Administrative Agent, Swing Line Lender and L/C Issuer. | S-1 | 333-186708 | 10.3 | February 15, 2013 | |||||||||||||
| 10.4 | Amendment No. 3, dated December 20, 2013, to Credit Agreement, dated June 8, 2011, among Quintiles Transnational Corp., as the Borrower, each lender from time to time party thereto, and JPMorgan Chase Bank, N.A., as Administrative Agent, Swing Line Lender and L/C Issuer. | 8-K | 001-35907 | 10.1 | December 20, 2013 | |||||||||||||
125
| Incorporated by Reference | ||||||||||||||||||
| Exhibit |
Exhibit |
Filed Herewith |
Form |
File No. | Exhibit |
Filing Date | ||||||||||||
| 10.5 | Amendment No. 4, dated November 7, 2014, to Credit Agreement, dated June 8, 2011, among Quintiles Transnational Corp., as the Borrower, each lender from time to time party thereto, and JPMorgan Chase Bank, N.A., as Administrative Agent, Swing Line Lender and L/C Issuer. | 8-K | 001-35907 | 10.1 | November 10, 2014 | |||||||||||||
| 10.6 | Purchase and Sale Agreement, dated December 5, 2014, among Quintiles, Inc., as originator and initial servicer, Quintiles Laboratories, LLC, as originator, Quintiles Commercial US, Inc., as originator, and Quintiles Funding LLC, as buyer. | 8-K | 001-35907 | 10.1 | December 8, 2014 | |||||||||||||
| 10.7 | Receivables Financing Agreement, dated December 5, 2014, among Quintiles Funding LLC, as borrower, Quintiles, Inc., as initial servicer, PNC Bank, N.A., as administrative agent and lender, and the additional persons from time to time party thereto as lenders. | 8-K | 001-35907 | 10.2 | December 8, 2014 | |||||||||||||
| 10.8 | Amended and Restated Shareholders Agreement, dated February 5, 2015, among Quintiles Transnational Holdings Inc. and the shareholders identified therein. | 8-K | 001-35907 | 10.1 | February 6, 2015 | |||||||||||||
| 10.9 | Management Agreement, dated January 22, 2008, among Quintiles Transnational Corp., Bain Capital Partners, LLC, GF Management Company, LLC, TPG Capital, L.P., Cassia Fund Management Pte Ltd., 3i Corporation and Aisling Capital, LLC. | S-1 | 333-186708 | 10.8 | February 15, 2013 | |||||||||||||
| 10.10 | Amendment No. 1, dated May 8, 2013, to Management Agreement, dated January 22, 2008, among Quintiles Transnational Corp., Bain Capital Partners, LLC, GF Management Company, LLC, TPG Capital, L.P., Cassia Fund Management Pte Ltd., 3i Corporation and Aisling Capital, LLC. | 10-Q | 001-35907 | 10.2 | May 14, 2013 | |||||||||||||
| 10.11 | Management Rights Letter from Quintiles Transnational Corp. to Aisling Capital II, L.P. | S-1 | 333-186708 | 10.9 | February 15, 2013 | |||||||||||||
| 10.12 | Amendment, dated May 8, 2013, to Management Rights Letter from Quintiles Transnational Corp. to Aisling Capital II, L.P. | 10-Q | 001-35907 | 10.3 | August 1, 2013 | |||||||||||||
126
| Incorporated by Reference | ||||||||||||||||||
| Exhibit |
Exhibit |
Filed Herewith |
Form |
File No. | Exhibit |
Filing Date | ||||||||||||
| 10.13 | Management Rights Agreement between Quintiles Transnational Corp. and TPG Biotechnology Partners II, L.P. | S-1 | 333-186708 | 10.10 | February 15, 2013 | |||||||||||||
| 10.14 | Management Rights Agreement between Quintiles Transnational Corp. and 3i Growth Healthcare Fund 2008 L.P. | S-1 | 333-186708 | 10.11 | February 15, 2013 | |||||||||||||
| 10.15 | Amendment No. 1, dated May 8, 2013, to Management Rights Agreement between Quintiles Transnational Corp. and 3i Growth Healthcare Fund 2008 L.P. | 10-Q | 001-35907 | 10.4 | August 1, 2013 | |||||||||||||
| 10.16 | Share Repurchase Agreement, dated May 27, 2014, between Quintiles Transnational Holdings Inc. and TPG Quintiles Holdco, L.P. | 8-K | 001-35907 | 10.1 | May 28, 2014 | |||||||||||||
| 10.17 | Assignment and Assumption Agreement, dated December 10, 2009, between Quintiles Transnational Corp. and Quintiles Transnational Holdings Inc. | S-1 | 333-186708 | 10.12 | February 15, 2013 | |||||||||||||
| 10.18† | Form of Director Indemnification Agreement. | S-1/A | 333-186708 | 10.13 | April 19, 2013 | |||||||||||||
| 10.19† | Quintiles Transnational Holdings Inc. Annual Management Incentive Plan. | S-1/A | 333-186708 | 10.57 | April 19, 2013 | |||||||||||||
| 10.20† | Quintiles Transnational Holdings Inc. 2003 Stock Incentive Plan. | S-1 | 333-186708 | 10.14 | February 15, 2013 | |||||||||||||
| 10.21† | Form of Stock Option Award Agreement under the Quintiles Transnational Holdings Inc. 2003 Stock Incentive Plan. | S-1 | 333-186708 | 10.15 | February 15, 2013 | |||||||||||||
| 10.22† | Form of Restricted Stock Purchase Agreement under the Quintiles Transnational Holdings Inc. 2003 Stock Incentive Plan. | S-1 | 333-186708 | 10.16 | February 15, 2013 | |||||||||||||
| 10.23† | Quintiles Transnational Holdings Inc. 2008 Stock Incentive Plan. | S-1 | 333-186708 | 10.17 | February 15, 2013 | |||||||||||||
| 10.24† | Form of Stock Option Award Agreement for Senior Executives under the Quintiles Transnational Holdings Inc. 2008 Stock Incentive Plan. | S-1 | 333-186708 | 10.18 | February 15, 2013 | |||||||||||||
| 10.25† | Form of Stock Option Award Agreement for Non-Employee Directors under the Quintiles Transnational Holdings Inc. 2008 Stock Incentive Plan. | S-1 | 333-186708 | 10.19 | February 15, 2013 | |||||||||||||
127
| Incorporated by Reference | ||||||||||||||||||||
| Exhibit |
Exhibit |
Filed Herewith |
Form |
File No. | Exhibit |
Filing Date | ||||||||||||||
| 10.26† | Quintiles Transnational Corp. Elective Deferred Compensation Plan, as amended and restated. | S-1 | 333-186708 | 10.20 | February 15, 2013 | |||||||||||||||
| 10.27† | Quintiles Transnational Corp. Elective Deferred Compensation Plan (Amended and Restated for Deferrals On and After January 1, 2005). | S-1 | 333-186708 | 10.21 | February 15, 2013 | |||||||||||||||
| 10.28† | Quintiles Transnational Holdings Inc. 2013 Stock Incentive Plan. | S-1/A | 333-186708 | 10.22 | April 19, 2013 | |||||||||||||||
| 10.29† | Form of Award Agreement Awarding Nonqualified Stock Options to Employees under the Quintiles Transnational Holdings Inc. 2013 Stock Incentive Plan. | S-1/A | 333-186708 | 10.23 | April 19, 2013 | |||||||||||||||
| 10.30† | Form of Award Agreement Awarding Incentive Stock Options to Employees under the Quintiles Transnational Holdings Inc. 2013 Stock Incentive Plan. | 10-Q | 001-35907 | 10.2 | May 1, 2014 | |||||||||||||||
| 10.31† | Form of Award Agreement Awarding Nonqualified Stock Options to Non-Employee Directors under the Quintiles Transnational Holdings Inc. 2013 Stock Incentive Plan. | S-1/A | 333-186708 | 10.24 | April 19, 2013 | |||||||||||||||
| 10.32† | Form of Award Agreement Awarding Stock Appreciation Rights under the Quintiles Transnational Holdings Inc. 2013 Stock Incentive Plan. | S-1/A | 333-186708 | 10.56 | April 19, 2013 | |||||||||||||||
| 10.33† | Form of Award Agreement Awarding Restricted Stock Units under the Quintiles Transnational Holdings Inc. 2013 Stock Incentive Plan prior to February 2015. | 8-K | 001-35907 | 10.1 | November 26, 2013 | |||||||||||||||
| 10.34† | Form of Award Agreement Awarding Restricted Stock Units under the Quintiles Transnational Holdings Inc. 2013 Stock Incentive Plan after February 2015. | X | ||||||||||||||||||
| 10.35† | Form of Award Agreement Awarding Performance Units under the Quintiles Transnational Holdings Inc. 2013 Stock Incentive Plan. | X | ||||||||||||||||||
| 10.36† | Quintiles Transnational Holdings Inc. Employee Stock Purchase Plan. | S-8 | 333-193212 | 10.1 | January 6, 2014 | |||||||||||||||
128
| Incorporated by Reference | ||||||||||||||||||||
| Exhibit |
Exhibit |
Filed Herewith |
Form |
File No. | Exhibit |
Filing Date | ||||||||||||||
| 10.37† | First Amendment to Quintiles Transnational Holdings Inc. Employee Stock Purchase Plan. | X | ||||||||||||||||||
| 10.38† | Executive Employment Agreement, dated September 25, 2003, among Dennis B. Gillings, Pharma Services Holding, Inc. and Quintiles Transnational Corp. | S-1 | 333-186708 | 10.26 | February 15, 2013 | |||||||||||||||
| 10.39† | Assignment and Assumption Agreement, dated March 31, 2006, among Pharma Services Holding, Inc., Quintiles Transnational Corp., and Dennis B. Gillings. | S-1 | 333-186708 | 10.27 | February 15, 2013 | |||||||||||||||
| 10.40† | Amendment, dated February 1, 2008, to Executive Employment Agreement, dated September 25, 2003, between Dennis B. Gillings and Quintiles Transnational Corp. | S-1 | 333-186708 | 10.28 | February 15, 2013 | |||||||||||||||
| 10.41† | Agreement and Amendment, effective December 12, 2008, to Executive Employment Agreement, dated September 25, 2003, between Dennis B. Gillings and Quintiles Transnational Corp. | S-1 | 333-186708 | 10.29 | February 15, 2013 | |||||||||||||||
| 10.42† | Third Amendment, dated December 31, 2008, to Executive Employment Agreement, dated September 25, 2003, between Dennis B. Gillings and Quintiles Transnational Corp. | S-1 | 333-186708 | 10.30 | February 15, 2013 | |||||||||||||||
| 10.43† | Fourth Amendment, dated December 14, 2009, to Executive Employment Agreement, dated September 25, 2003, between Dennis B. Gillings and Quintiles Transnational Corp. | S-1 | 333-186708 | 10.31 | February 15, 2013 | |||||||||||||||
| 10.44† | Fifth Amendment, dated April 18, 2013, to Executive Employment Agreement, dated September 25, 2003, between Dennis B. Gillings and Quintiles Transnational Corp. | S-1/A | 333-186708 | 10.32 | April 19, 2013 | |||||||||||||||
| 10.45 | Rollover Agreement, dated August 28, 2003, among Pharma Services Holding, Inc., Dennis B. Gillings, Joan H. Gillings, Susan Ashley Gillings, the Gillings Family Foundation, the Gillings Limited Partnership and the GFEF Limited Partnership. | S-1 | 333-186708 | 10.33 | February 15, 2013 | |||||||||||||||
129
| Incorporated by Reference | ||||||||||||||||||
| Exhibit |
Exhibit |
Filed Herewith |
Form |
File No. | Exhibit |
Filing Date | ||||||||||||
| 10.46 | Amendment No. 1, dated September 23, 2003, to Rollover Agreement, dated August 28, 2003, among Pharma Services Holding, Inc., Dennis B. Gillings, Joan H. Gillings, Susan Ashley Gillings, the Gillings Family Foundation, the Gillings Limited Partnership and the GFEF Limited Partnership. | S-1 | 333-186708 | 10.34 | February 15, 2013 | |||||||||||||
| 10.47† | Stock Option Award Agreement, dated June 30, 2008, between Quintiles Transnational Corp. and Dennis B. Gillings. | S-1 | 333-186708 | 10.35 | February 15, 2013 | |||||||||||||
| 10.48† | Executive Employment Agreement, effective April 30, 2012, between Thomas H. Pike and Quintiles Transnational Corp. | S-1 | 333-186708 | 10.36 | February 15, 2013 | |||||||||||||
| 10.49† | Subscription Agreement, effective May 31, 2012, between Thomas H. Pike and Quintiles Transnational Holdings Inc. | S-1 | 333-186708 | 10.37 | February 15, 2013 | |||||||||||||
| 10.50† | Stock Option Award Agreement, dated May 10, 2012, between Quintiles Transnational Holdings Inc. and Thomas H. Pike. | S-1 | 333-186708 | 10.38 | February 15, 2013 | |||||||||||||
| 10.51† | Stock Option Award Agreement, dated May 31, 2012, between Quintiles Transnational Holdings Inc. and Thomas H. Pike. | S-1 | 333-186708 | 10.39 | February 15, 2013 | |||||||||||||
| 10.52† | Executive Employment Agreement, effective July 30, 2010, between Kevin K. Gordon and Quintiles Transnational Corp. | S-1 | 333-186708 | 10.40 | February 15, 2013 | |||||||||||||
| 10.53† | First Amendment to Employment Agreement, dated November 22, 2010, to Executive Employment Agreement, effective July 30, 2010, between Kevin K. Gordon and Quintiles Transnational Corp. | S-1 | 333-186708 | 10.41 | February 15, 2013 | |||||||||||||
| 10.54† | Executive Employment Agreement, dated June 1, 2003, between Michael I. Mortimer and Quintiles Transnational Corp. | S-1 | 333-186708 | 10.48 | February 15, 2013 | |||||||||||||
| 10.55† | Amendment, dated January 9, 2004, to Executive Employment Agreement, dated June 1, 2003, between Michael I. Mortimer and Quintiles Transnational Corp. | S-1 | 333-186708 | 10.49 | February 15, 2013 | |||||||||||||
130
| Incorporated by Reference | ||||||||||||||||||||
| Exhibit |
Exhibit |
Filed Herewith |
Form |
File No. | Exhibit |
Filing Date | ||||||||||||||
| 10.56† | Second Amendment, dated December 30, 2008, to Executive Employment Agreement, dated June 1, 2003, between Michael I. Mortimer and Quintiles Transnational Corp. | S-1 | 333-186708 | 10.50 | February 15, 2013 | |||||||||||||||
| 10.57† | Letter, dated February 22, 2005, to Michael I. Mortimer from Pharma Services Holding, Inc. re. Purchase of Pharma Shares. | S-1 | 333-186708 | 10.51 | February 15, 2013 | |||||||||||||||
| 10.58† | Letter, dated February 5, 2004, to Michael I. Mortimer from Pharma Services Holding, Inc. re. Opportunity to Purchase Shares. | S-1 | 333-186708 | 10.52 | February 15, 2013 | |||||||||||||||
| 10.59† | Consulting and General Release Agreement, dated May 12, 2014, between Michael I. Mortimer and Quintiles Transnational Corp. | 8-K | 001-35907 | 10.1 | May 12, 2014 | |||||||||||||||
| 10.60† | Amended Executive Employment Agreement, dated July 26, 2005, between Derek Winstanly and Quintiles Transnational Corp. | S-1 | 333-186708 | 10.53 | February 15, 2013 | |||||||||||||||
| 10.61† | First Amendment, dated December 30, 2008, to Amended Executive Employment Agreement, dated July 26, 2005, between Derek Winstanly and Quintiles Transnational Corp. | S-1 | 333-186708 | 10.54 | February 15, 2013 | |||||||||||||||
| 10.62† | Letter, dated October 30, 2003, to Derek Winstanly from Pharma Services Holding, Inc. re. Opportunity to Purchase Shares. | S-1 | 333-186708 | 10.55 | February 15, 2013 | |||||||||||||||
| 10.63† | Executive Employment Agreement, dated November 1, 2012, between James H. Erlinger III and Quintiles Transnational Corp. | X | ||||||||||||||||||
| 10.64† | Description of Independent Director Compensation. | 8-K | 001-35907 | 10.2 | February 6, 2015 | |||||||||||||||
| 21.1 | List of Subsidiaries of Quintiles Transnational Holdings Inc. | X | ||||||||||||||||||
| 23.1 | Consent of PricewaterhouseCoopers LLP. | X | ||||||||||||||||||
| 31.1 | Certification of Chief Executive Officer, pursuant to Rule 13a-14(a)/15d-14(a), as adopted pursuant to Section 302 of the Sarbanes-Oxley Act of 2002. | X | ||||||||||||||||||
131
| Incorporated by Reference | ||||||||||||||
| Exhibit |
Exhibit |
Filed Herewith |
Form |
File No. | Exhibit |
Filing Date | ||||||||
| 31.2 | Certification of Executive Vice President and Chief Financial Officer, pursuant to Rule 13a-14(a)/15d-14(a), as adopted pursuant to Section 302 of the Sarbanes-Oxley Act of 2002. | X | ||||||||||||
| 32.1 | Certification of Chief Executive Officer, pursuant to 18 U.S.C. Section 1350, as adopted pursuant to Section 906 of the Sarbanes-Oxley Act of 2002. | X | ||||||||||||
| 32.2 | Certification of Executive Vice President and Chief Financial Officer, pursuant to 18 U.S.C. Section 1350, as adopted pursuant to Section 906 of the Sarbanes-Oxley Act of 2002. | X | ||||||||||||
| 101 | Interactive Data Files Pursuant to Rule 405 of Regulation S-T: (i) Consolidated Statements of Income, (ii) Consolidated Statements of Comprehensive Income, (iii) Consolidated Balance Sheets, (iv) Consolidated Statements of Cash Flows, and (v) Notes to Consolidated Financial Statements. | X | ||||||||||||
| † | Indicates management contract or compensatory plan or arrangement. |
132