Attached files
| file | filename |
|---|---|
| 8-K - FORM 8-K - LOJACK CORP | a8-k21215.htm |
| EX-99.1 - EXHIBIT 99.1 EARNINGS RELEASE - LOJACK CORP | q4earningsrelease.htm |

February 12, 2015
Forward-looking Statements Statements in this presentation that are not historical fact are forward-looking statements. Such forward-looking statements include, but are not limited to, statements concerning (a) the Company's markets, including the domestic auto market and international markets, (b) the Company's strategic initiatives, investments and plans for growth and future operations, including with respect to the Company's telematics, fleet management, inventory management and other product development initiatives, (c) the Company's pre-install program, (d) the Company’s re-entry into the Brazilian market, (e) expectations for shipments to Argentina and international revenues generally, (f) the expected costs and expenses associated with the battery performance matter, (g) the expected benefits of the ERP system, and (h) the Company's future financial performance and financial condition. Such forward-looking statements are based on a number of assumptions and involve a number of risks and uncertainties, and accordingly, actual results could differ materially. Factors that may cause such differences include, but are not limited to: (1) the continued and future acceptance of the Company's products and services, including the Company's pre- install program and inventory management, fleet management and telematics solutions; (2) the Company's ability to obtain financing from lenders and to satisfy or obtain waivers for covenant requirements under its credit facility; (3) the outcome of ongoing litigation involving the Company; (4) the Company’s ability to enforce the terms of the settlement agreement with Tracker do Brasil LTDA and its impact on the Company's future relationships with Tracker and its affiliates; (5) the rate of growth in the industries of the Company's customers; (6) the presence of competitors with greater technical, marketing, and financial resources; (7) the Company's customers' ability to access the credit markets, including changes in interest rates; (8) the Company's ability to promptly and effectively respond to technological change to meet evolving customer needs; (9) the Company's ability to successfully expand its operations, including through the introduction of new products and services; (10) changes in general economic or geopolitical conditions; (11) conditions in the automotive retail market and the Company's relationships with dealers, licensees, partners, agents and local law enforcement; (12) delays or other changes in the timing of purchases by the Company's customers; (13) the Company's ability to achieve the expected benefits of its strategic alliances with TomTom and Trackunit; (14) financial and reputational risks related to product quality and liability issues; (15) the Company's ability to re-enter the Brazilian market in a timely manner and/or on favorable terms; and (16) trade tensions and governmental regulations and restrictions in Argentina, Brazil and the Company's other international markets. For a further discussion of these and other significant factors to consider in connection with forward- looking statements concerning the Company, reference is made to the Company's Annual Report on Form 10-K for the year ended December 31, 2013 and the Company's other filings with the Securities and Exchange Commission. Readers should not place undue reliance on any forward-looking statements, which only speak as of the date made. Except as required by law, the Company undertakes no obligation to release publicly the result of any revision to the forward-looking statements that may be made to reflect events or circumstances after the date hereof or to reflect the occurrence of unanticipated events.
In addition to financial measures prepared in accordance with generally accepted accounting principles (GAAP), this presentation also contains certain non-GAAP financial measures including Adjusted EBITDA and non-GAAP gross profit (and the corresponding gross margin percentages.) LoJack management believes that the inclusion of these non-GAAP financial measures in this presentation helps investors to gain a meaningful understanding of changes in the Company's core operating results, and can also help investors who wish to make comparisons between LoJack and other companies on both a GAAP and a non-GAAP basis. Management uses these non-GAAP measures, in addition to GAAP financial measures, as the basis for measuring its core operating performance and comparing such performance to that of prior periods and to the performance of its competitors. These measures are also used by management to assist with their financial and operating decision making. The non-GAAP financial measures included in this presentation are not meant to be considered superior to or a substitute for the comparable measurement that is prepared in accordance with GAAP. In addition, the non-GAAP financial measures included in this presentation may be different from, and therefore may not be comparable to, similar measures used by other companies. Reconciliations of the non-GAAP financial measures used in this presentation to the most directly comparable GAAP financial measures are set forth in the accompanying tables to, this presentation. Use of Non-GAAP Financial Measures
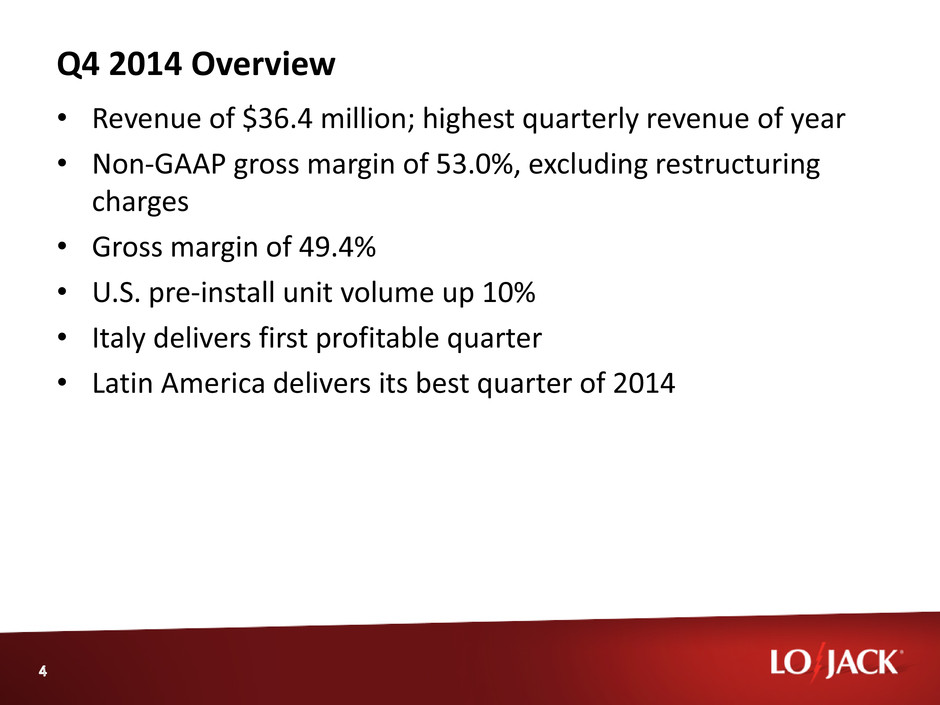
Q4 2014 Overview • Revenue of $36.4 million; highest quarterly revenue of year • Non-GAAP gross margin of 53.0%, excluding restructuring charges • Gross margin of 49.4% • U.S. pre-install unit volume up 10% • Italy delivers first profitable quarter • Latin America delivers its best quarter of 2014

Enterprise Resource and Planning (ERP) • NetSuite has been implemented in the US after 2 years of planning and development • Better manage current Stolen Vehicle Recovery business • Required to support move into recurring revenue model • Real time sales reporting • Simplified ordering process • Enhanced account management • More precise inventory management
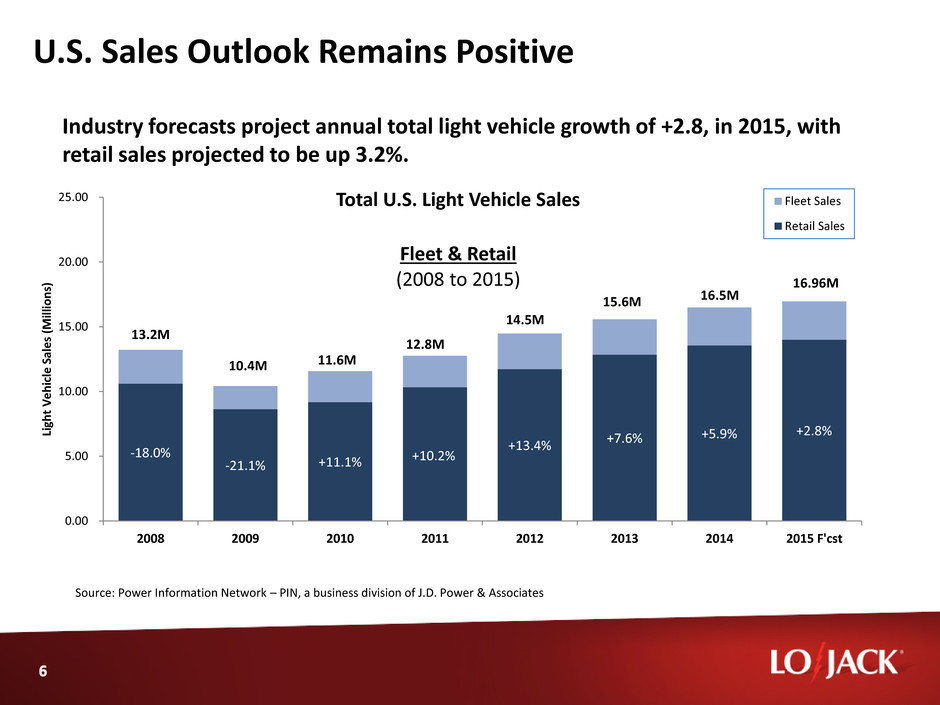
U.S. Sales Outlook Remains Positive Industry forecasts project annual total light vehicle growth of +2.8, in 2015, with retail sales projected to be up 3.2%. -18.0% -21.1% +11.1% +10.2% +13.4% +7.6% +5.9% +2.8% 0.00 5.00 10.00 15.00 20.00 25.00 2008 2009 2010 2011 2012 2013 2014 2015 F'cst Li gh t Ve h icle Sa les ( M ill io n s) Total U.S. Light Vehicle Sales Fleet & Retail (2008 to 2015) Fleet Sales Retail Sales 13.2M 10.4M 12.8M 14.5M 15.6M 16.5M 16.96M 11.6M Source: Power Information Network – PIN, a business division of J.D. Power & Associates

Advancing the Pre-Install Strategy Pre-Install Program Sales Mix % Share of Dealer Channel Volume LoJack continues to lay the foundation for stable recurring revenue 31% 32% 34% 43% 44% 45% 46% 51% 52% 55% 54% 61% 0% 10% 20% 30% 40% 50% 60% 70% Q1 2012 Q2 2012 Q3 2012 Q4 2012 Q1 2013 Q2 2013 Q3 2013 Q4 2013 Q1 2014 Q2 2014 Q3 2014 Q4 2014
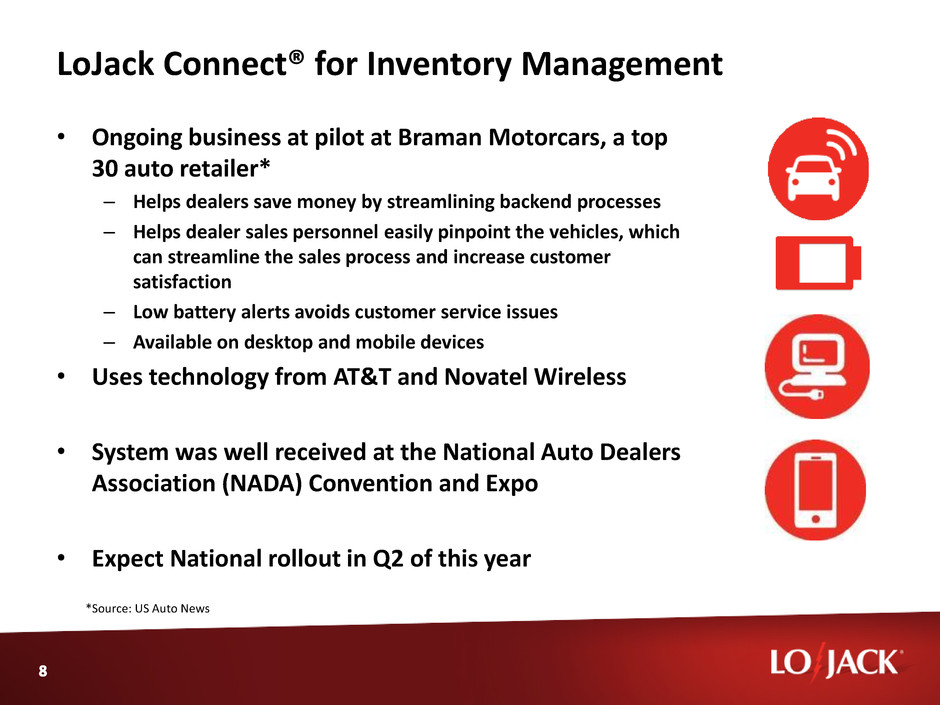
LoJack Connect® for Inventory Management • Ongoing business at pilot at Braman Motorcars, a top 30 auto retailer* – Helps dealers save money by streamlining backend processes – Helps dealer sales personnel easily pinpoint the vehicles, which can streamline the sales process and increase customer satisfaction – Low battery alerts avoids customer service issues – Available on desktop and mobile devices • Uses technology from AT&T and Novatel Wireless • System was well received at the National Auto Dealers Association (NADA) Convention and Expo • Expect National rollout in Q2 of this year *Source: US Auto News
Telematics Update LoJack® Connect for Equipment • LoJack® Connect for Equipment announced last quarter for off-road use • Selling process has started targeting large rental companies • Shipments have already occurred to construction companies LoJack® Fleet Management Lite • Introduced a lower cost product targeting businesses with smaller fleets • Easy to self-install • Lower hardware costs • Simplified sales and fulfillment process • Expands access in the market with high quality offering

International Markets Brazil Litigation Update • Recent settlement will allow LoJack to move beyond this case • One of the worst theft situations in the world (400k cars stolen in 2012) – Brazil had the highest car theft rates among 34 countries in 2012, with 140 of every 10,000 vehicles stolen* • Currently vetting options and potential licensees to re-access the Stolen Vehicle Recovery market Italy • Delivers first profitable quarter • Subscription portfolio nearing 50,000 *SOURCE: Secured By Design Ltd., a consultancy specializing in vehicle security based in the U.K.
Outlook for 2015 • Preinstall program as a platform for stolen vehicle recovery growth • Leveraging existing relationships to grow telematics and build recurring revenue model • Complete market representations actions to grow South American business • Remain focused on controlling expenses and managing balance sheet Expected to result in: Top-line growth, increased EBIDTA, positive cash flows


Q4 Revenues ($ in millions) Q4 2014 Q4 2013 % change Consolidated revenues $ 36.4 $ 40.5 (10%) U.S. revenues 20.3 23.0 (9%) International licensees 11.5 13.6 (15%) Canada 1.1 1.7 (35%) Italy 1.7 1.0 74% All other 1.2 1.2 (10%)

Q4 Consolidated Results Highlights $ in millions, except per share data Q414 Q413 Revenue $ 36,352 $ 40,511 Y/Y change (10.3%) Gross profit 17,951 23,307 Y/Y change (23%) Gross profit margin 49.4% 57.5% Non-GAAP gross profit* 19,251 23,307 Non-GAAP gross profit margin* 53.0% 57.5% Operating expenses 18,216 18,004 Adjusted EBITDA* 3,426 6,540 Y/Y change (47.6%) Net (loss) income attributable to LoJack Corp. $ (854) $ 4,548 Net loss (income) per diluted share attributable to LoJack Corp. $ (0.04) $ 0.25 *Please refer to Appendix for reconciliation of non-GAAP items

Full-year Revenues ($ in millions) 2014 2013 % change Consolidated revenues $ 133.6 $ 140.2 (5%) U.S. revenues $ 88.1 $ 92.0 (4%) International licensees $ 29.7 $ 32.6 (9%) Canada $ 5.7 $ 7.3 (22%) Italy $ 5.8 $ 3.7 57% All other $ 4.3 $ 4.5 (4%)

FY 2014 Consolidated Results Highlights $ in millions, except per share data 2014 2013 Revenue $ 133,568 $ 140,207 Y/Y change (4.7%) Gross profit 60,122 77,170 Y/Y change (22%) Gross profit margin 45.0% 55.0% Non-GAAP gross profit* 70,162 77,150 Non-GAAP gross profit margin* 52.5% 55.0% Operating expenses 76,967 76,537 Adjusted EBITDA* 1,422 6,445 Y/Y change (78%) Net (loss) income attributable to LoJack Corp. $ (17,924) $ 3,167 Net (loss) income per share attributable to LoJack Corp. $ (0.99) $ 0.18 *Please refer to Appendix for reconciliation of non-GAAP items

Balance Sheet Highlights ($ in millions) (unaudited) Dec. 31, 2014 Dec. 31, 2013 Cash and cash equivalents $ 17.6 32.0 Accounts receivable, net 24.0 26.5 Inventories 8.3 7.2 Total assets 76.3 86.8 Bank debt 10.0 6.0 Deferred revenue 17.1 20.9 Total liabilities 55.8 50.8 Total equity 20.4 36.0

February 12, 2015

Appendix: GAAP to Pro Forma Non-GAAP Reconciliation Three Months Ended December 31, Year Ended December 31, 2014 2013 2014 2013 Net (loss) income, as reported $ (805) $ 4,633 $ (17,953) $ 3,313 Adjusted for: Provision (benefit) for income taxes 356 724 176 (2,518) Other (expense) income (184) 54 (932) 162 Operating (loss) income $ (265) $ 5,303 $ (16,845) $ 633 Adjusted for: Depreciation and amortization 906 1,033 3,713 4,131 Stock compensation expense 389 204 1,682 1,681 Quality assurance program — — 8,040 — Restructuring charges 2,396 — 4,125 — ICMS tax settlement — — 707 — Adjusted EBITDA $ 3,426 $ 6,540 $ 1,422 $ 6,445 ($ in thousands)
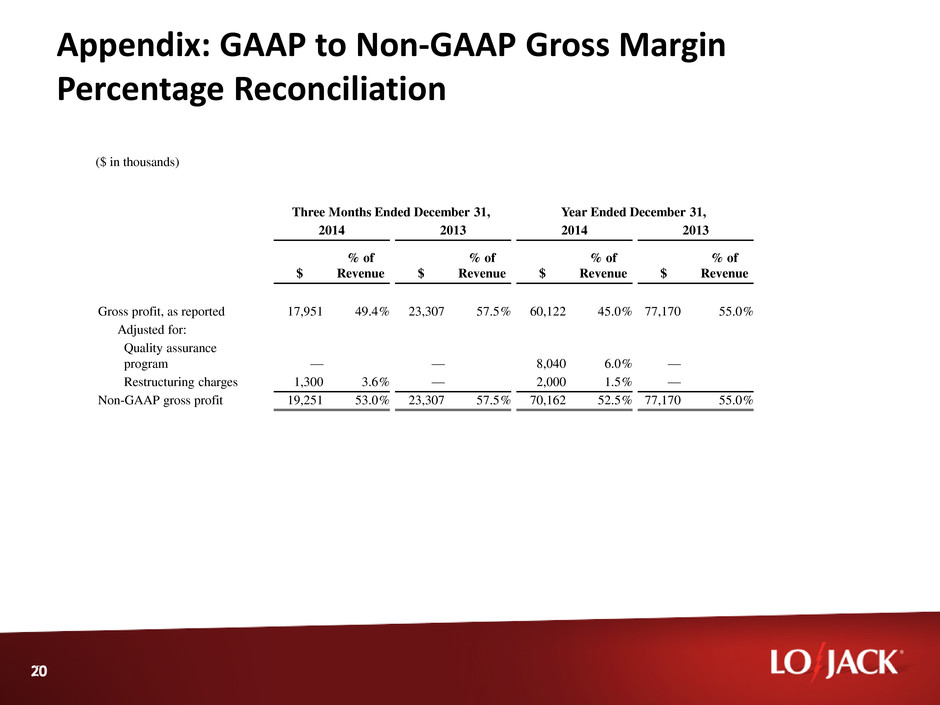
Appendix: GAAP to Non-GAAP Gross Margin Percentage Reconciliation ($ in thousands) Three Months Ended December 31, Year Ended December 31, 2014 2013 2014 2013 $ % of Revenue $ % of Revenue $ % of Revenue $ % of Revenue Gross profit, as reported 17,951 49.4% 23,307 57.5% 60,122 45.0% 77,170 55.0% Adjusted for: Quality assurance program — — 8,040 6.0% — Restructuring charges 1,300 3.6% — 2,000 1.5% — Non-GAAP gross profit 19,251 53.0% 23,307 57.5% 70,162 52.5% 77,170 55.0%
