Attached files
| file | filename |
|---|---|
| 8-K - 8-K - Fox Chase Bancorp Inc | a15-4105_18k.htm |
Exhibit 99.1
|
|
Sterne Agee Conference Investor Presentation February 12-13, 2015 |
|
|
Forward Looking Statements This presentation and the accompanying commentary may contain “forward-looking statements” that may be identified by use of such words as “believe,” “expect,” “anticipate,” “should,” “planned,” “estimated,” and “potential.” Examples of forward-looking statements include, but are not limited to, estimates with respect to our financial condition and results of operation, strategies and business that are subject to various factors that could cause actual results to differ materially from these estimates. These factors include but are not limited to general and local economic conditions; changes in interest rates, deposit flows, demand for loans, real estate values, and competition; changes in accounting principles, policies, or guidelines; changes in legislation or regulation; and other economic, competitive, governmental, regulatory, and technological factors affecting our operations, pricing, products, and services. For discussion of these and other risks that may cause actual results to differ from expectations, refer to our Annual Report on Form 10-K, dated March 7, 2014 and our Quarterly Reports on Form 10-Q on file with the Securities and Exchange Commission, including the sections entitled “Risk Factors”. These risks and uncertainties should be considered in evaluating forward-looking statements and undue reliance should not be placed on such statements. Except as required by applicable law or regulation, the Company does not undertake, and specifically disclaims any obligation, to release publicly the result of any revisions that may be made to any forward-looking statements to reflect events or circumstances after the date of the statements or to reflect the occurrence of anticipated or unanticipated events. |
|
|
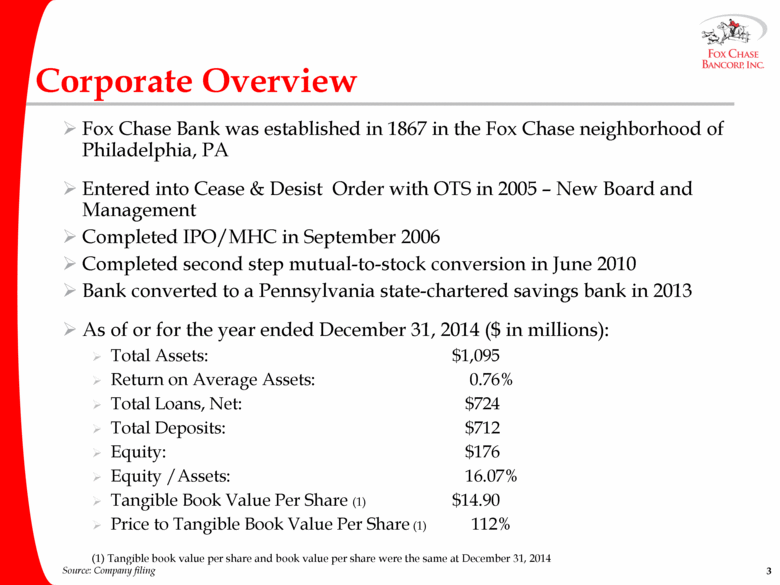
Corporate Overview Fox Chase Bank was established in 1867 in the Fox Chase neighborhood of Philadelphia, PA Entered into Cease & Desist Order with OTS in 2005 – New Board and Management Completed IPO/MHC in September 2006 Completed second step mutual-to-stock conversion in June 2010 Bank converted to a Pennsylvania state-chartered savings bank in 2013 As of or for the year ended December 31, 2014 ($ in millions): Total Assets: $1,095 Return on Average Assets: 0.76% Total Loans, Net: $724 Total Deposits: $712 Equity: $176 Equity /Assets: 16.07% Tangible Book Value Per Share (1) $14.90 Price to Tangible Book Value Per Share (1) 112% (1) Tangible book value per share and book value per share were the same at December 31, 2014 Source: Company filing |
|
|
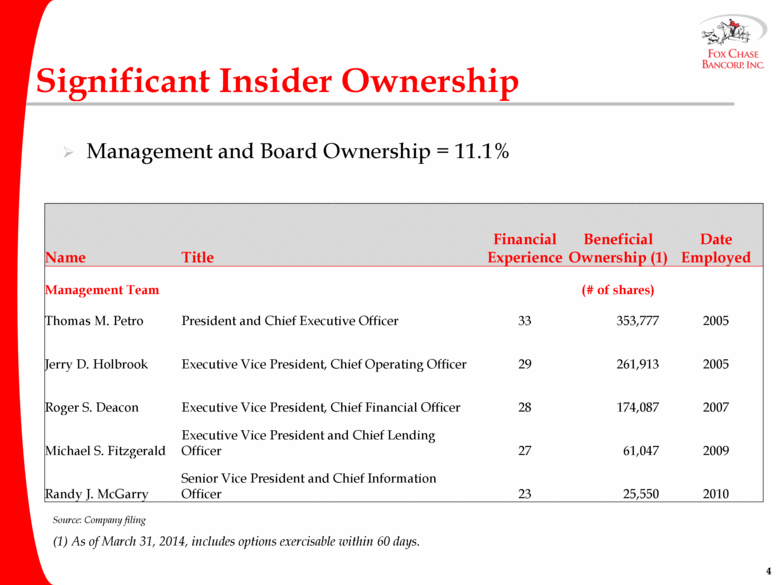
Significant Insider Ownership Management and Board Ownership = 11.1% Source: Company filing (1) As of March 31, 2014, includes options exercisable within 60 days. Name Title Financial Experience Beneficial Ownership (1) Date Employed Management Team (# of shares) Thomas M. Petro President and Chief Executive Officer 33 353,777 2005 Jerry D. Holbrook Executive Vice President, Chief Operating Officer 29 261,913 2005 Roger S. Deacon Executive Vice President, Chief Financial Officer 28 174,087 2007 Michael S. Fitzgerald Executive Vice President and Chief Lending Officer 27 61,047 2009 Randy J. McGarry Senior Vice President and Chief Information Officer 23 25,550 2010 |
|
|
Operate 10 branches in Philadelphia and Southern New Jersey markets; Philadelphia represents the seventh largest MSA in the United States; Bucks, Montgomery and Chester Counties are the three highest median income counties in Pennsylvania; Region characterized by highly diversified service industries Attractive Market Area Source: SNL Financial as of June 30, 2014 Median Projected HH HH Income Deposit Income Change Deposits Market 2014 2014-2019 County Rank Branches ($M) Share (%) ($) (%) Philadelphia 16 1 214.4 0.52 35,735 7.1 Montgomery 16 2 307.9 1.25 78,454 7.2 Bucks 22 3 152.3 0.96 72,932 4.0 Chester 32 1 10.9 0.10 80,383 2.1 PA Totals 7 685.5 Atlantic 15 1 25.6 0.5 51,071 1.8 Cape May 12 2 13.9 0.5 53,428 (0.6) NJ Totals 3 39.5 Aggregate: Entire State of New Jersey 69,176 3.6 Aggregate: Entire State of Pennsylvania 51,961 7.9 Aggregate: National 51,579 4.6 |
|
|
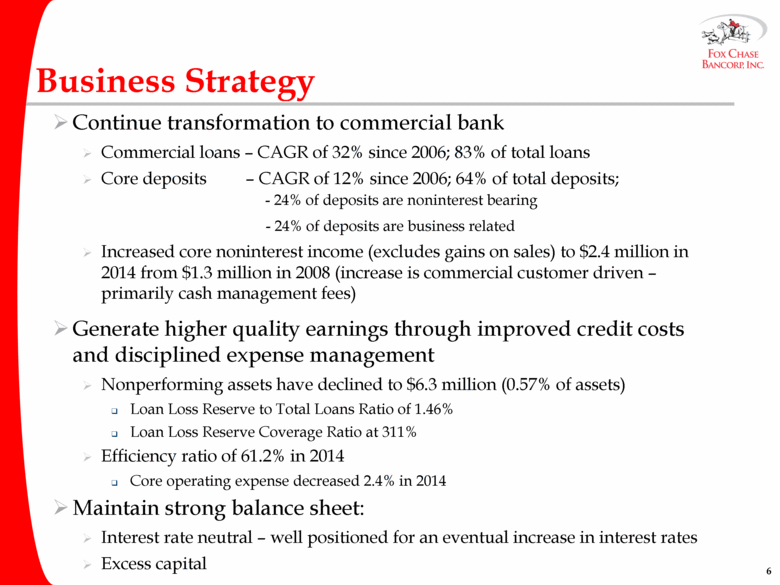
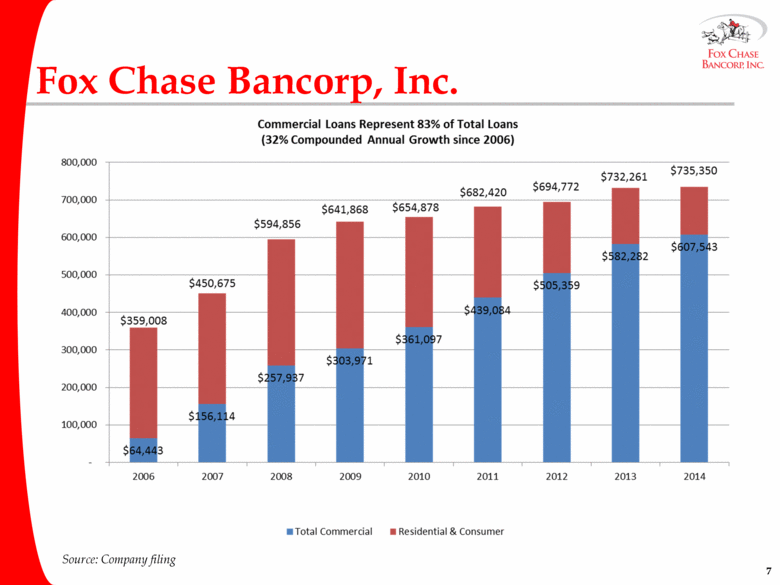
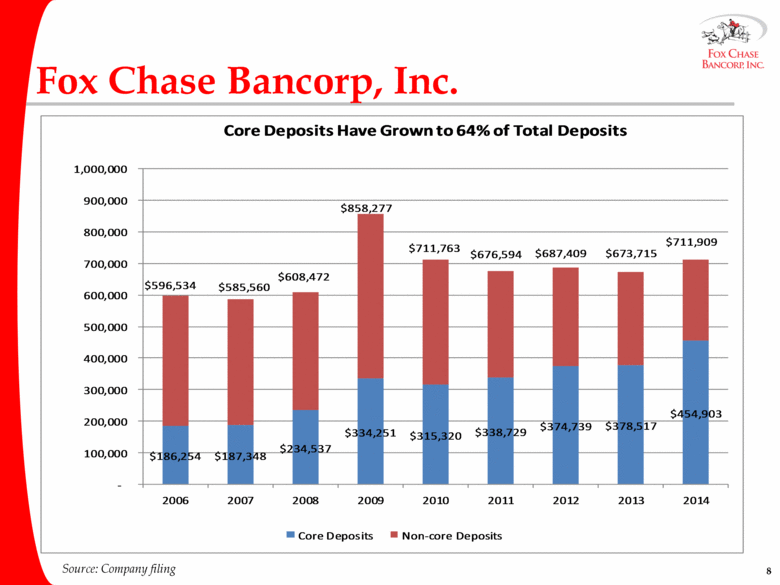
Business Strategy Continue transformation to commercial bank Commercial loans – CAGR of 32% since 2006; 83% of total loans Core deposits – CAGR of 12% since 2006; 64% of total deposits; - 24% of deposits are noninterest bearing - 24% of deposits are business related Increased core noninterest income (excludes gains on sales) to $2.4 million in 2014 from $1.3 million in 2008 (increase is commercial customer driven – primarily cash management fees) Generate higher quality earnings through improved credit costs and disciplined expense management Nonperforming assets have declined to $6.3 million (0.57% of assets) Loan Loss Reserve to Total Loans Ratio of 1.46% Loan Loss Reserve Coverage Ratio at 311% Efficiency ratio of 61.2% in 2014 Core operating expense decreased 2.4% in 2014 Maintain strong balance sheet: Interest rate neutral – well positioned for an eventual increase in interest rates Excess capital |
|
|
Fox Chase Bancorp, Inc. Source: Company filing |
|
|
Fox Chase Bancorp, Inc. Source: Company filing $186,254 $187,348 $234,537 $334,251 $315,320 $338,729 $374,739 $378,517 $454,903 - 100,000 200,000 300,000 400,000 500,000 600,000 700,000 800,000 900,000 1,000,000 2006 2007 2008 2009 2010 2011 2012 2013 2014 Core Deposits Non-core Deposits Core Deposits Have Grown to 64% of Total Deposits $596,534 $585,560 $608,472 $858,277 $711,763 $676,594 $687,409 $673,715 $711,909 |
|
|
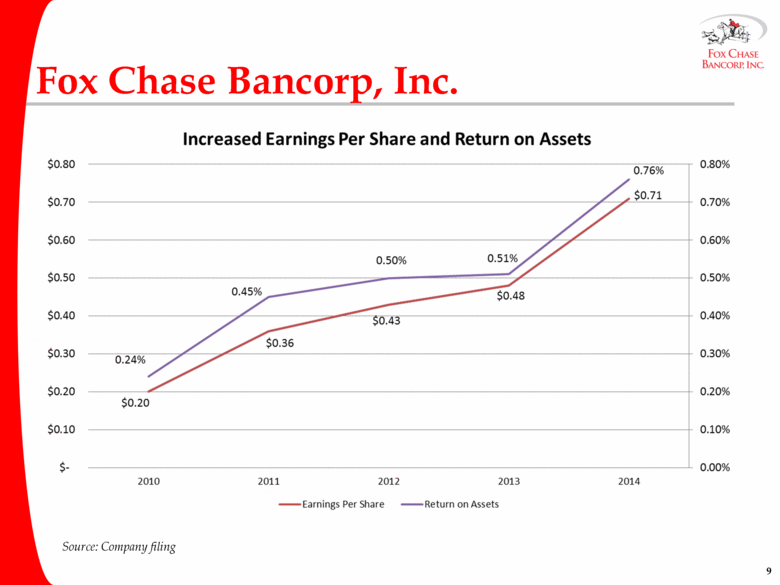
Fox Chase Bancorp, Inc. Source: Company filing |
|
|
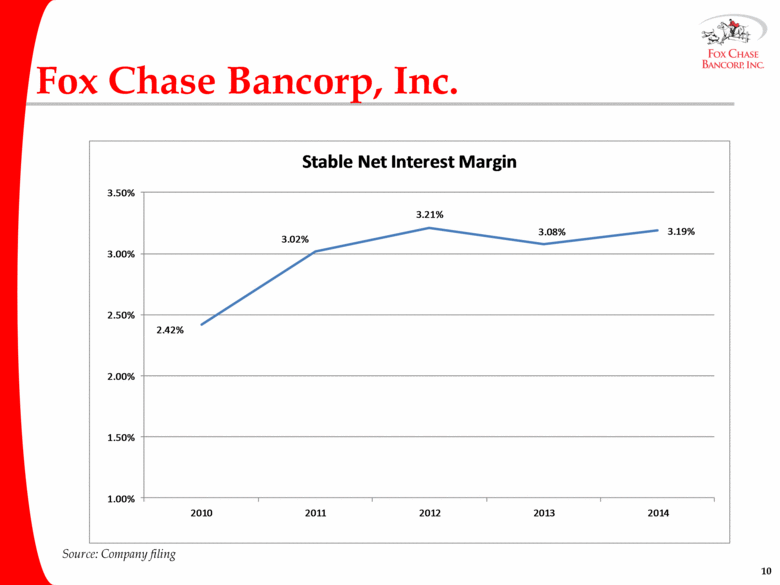
Fox Chase Bancorp, Inc. Source: Company filing 2.42% 3.02% 3.21% 3.08% 3.19% 1.00% 1.50% 2.00% 2.50% 3.00% 3.50% 2010 2011 2012 2013 2014 Stable Net Interest Margin |
|
|
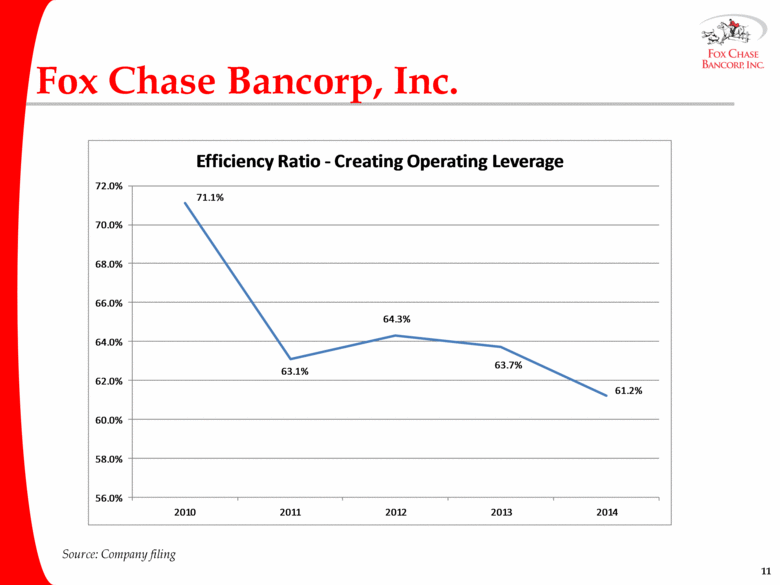
Fox Chase Bancorp, Inc. Source: Company filing 71.1% 63.1% 64.3% 63.7% 61.2% 56.0% 58.0% 60.0% 62.0% 64.0% 66.0% 68.0% 70.0% 72.0% 2010 2011 2012 2013 2014 Efficiency Ratio - Creating Operating Leverage |
|
|
Capital Management Strategies Organic balance sheet growth Primary focus has been Commercial Real Estate and C&I Lending Commercial loan CAGR of 32% since December 31, 2006 Repurchase stock Total stock repurchases approximately 20% of post second step shares Holding Company has $20.3 million of cash Selectively repurchasing shares at appropriate price points Announced additional 5% repurchase plan approved in July 2014 527,424 shares available to be purchased, under the July 2014 plan as of December 31, 2014 Cash dividends Paid 85% of 2014 Earnings = $0.60 per share (3.6% yield) Increased dividend in 2015 and on target to pay out significant portion of current year Earnings |
|
|
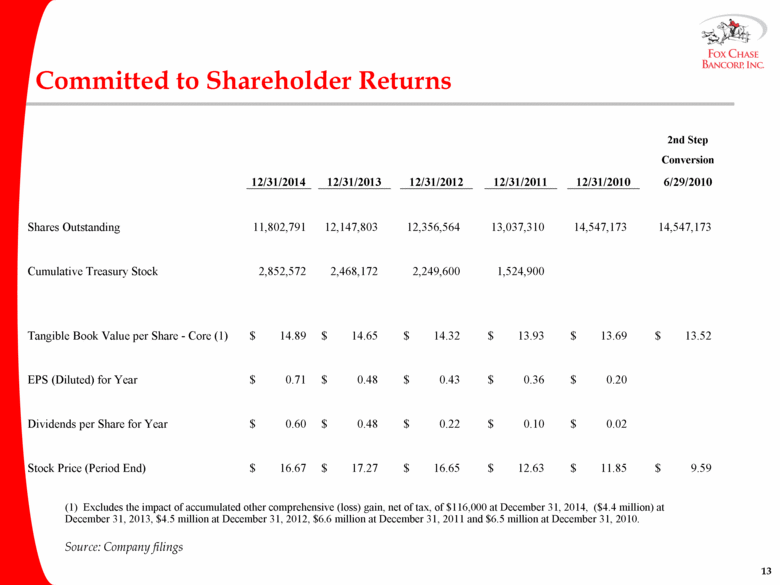
Committed to Shareholder Returns Source: Company filings (1) Excludes the impact of accumulated other comprehensive (loss) gain, net of tax, of $116,000 at December 31, 2014, ($4.4 million) at December 31, 2013, $4.5 million at December 31, 2012, $6.6 million at December 31, 2011 and $6.5 million at December 31, 2010. 2nd Step Conversion 12/31/2014 12/31/2013 12/31/2012 12/31/2011 12/31/2010 6/29/2010 Shares Outstanding 11,802,791 12,147,803 12,356,564 13,037,310 14,547,173 14,547,173 Cumulative Treasury Stock 2,852,572 2,468,172 2,249,600 1,524,900 Tangible Book Value per Share - Core (1) $ 14.89 $ 14.65 $ 14.32 $ 13.93 $ 13.69 $ 13.52 EPS (Diluted) for Year $ 0.71 $ 0.48 $ 0.43 $ 0.36 $ 0.20 Dividends per Share for Year $ 0.60 $ 0.48 $ 0.22 $ 0.10 $ 0.02 Stock Price (Period End) $ 16.67 $ 17.27 $ 16.65 $ 12.63 $ 11.85 $ 9.59 |
|
|
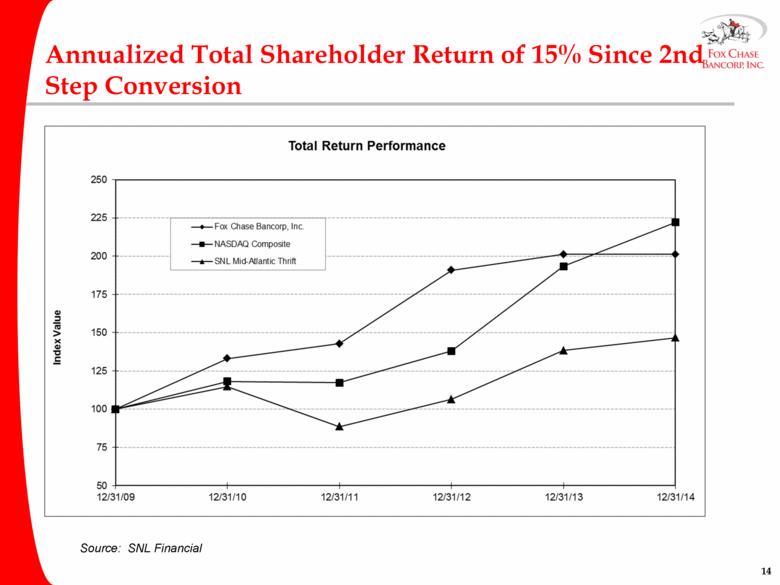
Annualized Total Shareholder Return of 15% Since 2nd Step Conversion Source: SNL Financial |
|
|
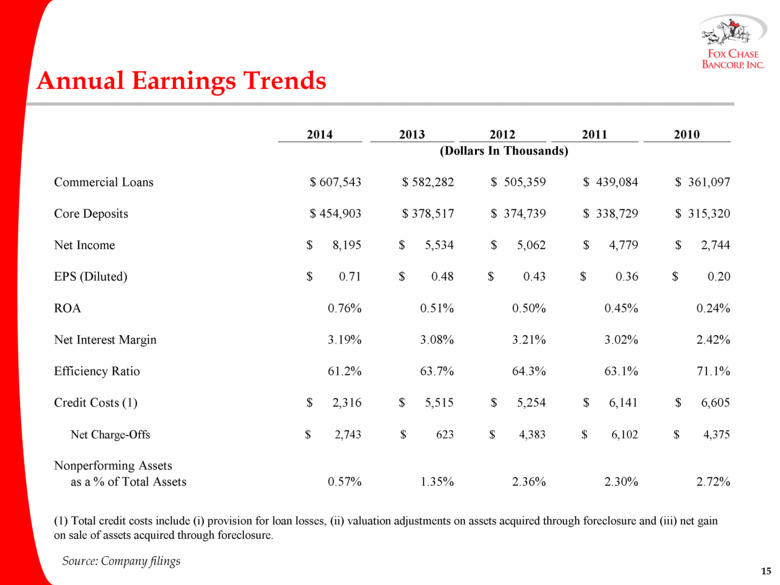
Annual Earnings Trends Source: Company filings 2014 2013 2012 2011 2010 (Dollars In Thousands) Commercial Loans $ 607,543 $ 582,282 $ 505,359 $ 439,084 $ 361,097 Core Deposits $ 454,903 $ 378,517 $ 374,739 $ 338,729 $ 315,320 Net Income $ 8,195 $ 5,534 $ 5,062 $ 4,779 $ 2,744 EPS (Diluted) $ 0.71 $ 0.48 $ 0.43 $ 0.36 $ 0.20 ROA 0.76% 0.51% 0.50% 0.45% 0.24% Net Interest Margin 3.19% 3.08% 3.21% 3.02% 2.42% Efficiency Ratio 61.2% 63.7% 64.3% 63.1% 71.1% Credit Costs (1) $ 2,316 $ 5,515 $ 5,254 $ 6,141 $ 6,605 Net Charge-Offs $ 2,743 $ 623 $ 4,383 $ 6,102 $ 4,375 Nonperforming Assets as a % of Total Assets 0.57% 1.35% 2.36% 2.30% 2.72% (1) Total credit costs include (i) provision for loan losses, (ii) valuation adjustments on assets acquired through foreclosure and (iii) net gain on sale of assets acquired through foreclosure. |
|
|
Fox Chase Bancorp, Inc. Questions and Answers |

