Attached files
| file | filename |
|---|---|
| 8-K - CURRENT REPORT - ENTERPRISE FINANCIAL SERVICES CORP | a2014-128kinvestorpresenta.htm |

Enterprise Financial Services Corp Investor Presentation PETER F. BENOIST, PRESIDENT & CEO KEENE S. TURNER, EXECUTIVE VICE PRESIDENT & CFO ACCELERATING QUALITY GROWTH

1 Some of the information in this report contains “forward-looking statements” within the meaning of and are intended to be covered by the safe harbor provisions of the Private Securities Litigation Reform Act of 1995. Forward-looking statements typically are identified with use of terms such as “may,” “might,” “will,” “should,” “expect,” “plan,” “anticipate,” “believe,” “estimate,” “predict,” “potential,” “could,” “continue” and the negative of these terms and similar words, although some forward-looking statements are expressed differently. Our ability to predict results or the actual effect of future plans or strategies is inherently uncertain. You should be aware that our actual results could differ materially from those contained in the forward-looking statements due to a number of factors, including, but not limited to: credit risk; changes in the appraised valuation of real estate securing impaired loans; outcomes of litigation and other contingencies; exposure to general and local economic conditions; risks associated with rapid increases or decreases in prevailing interest rates; consolidation within the banking industry; competition from banks and other financial institutions; our ability to attract and retain relationship officers and other key personnel; burdens imposed by federal and state regulation; changes in regulatory requirements; changes in accounting regulation or standards applicable to banks; and other risks discussed under the caption “Risk Factors” of our most recently filed Form 10-K and in Part II, 1A of our most recently filed Form 10-Q, all of which could cause the Company’s actual results to differ from those set forth in the forward-looking statements. Readers are cautioned not to place undue reliance on our forward-looking statements, which reflect management’s analysis and expectations only as of the date of such statements. Forward-looking statements speak only as of the date they are made, and the Company does not intend, and undertakes no obligation, to publicly revise or update forward- looking statements after the date of this report, whether as a result of new information, future events or otherwise, except as required by federal securities law. You should understand that it is not possible to predict or identify all risk factors. Readers should carefully review all disclosures we file from time to time with the Securities and Exchange Commission which are available on our website at www.enterprisebank.com. Forward-Looking Statement
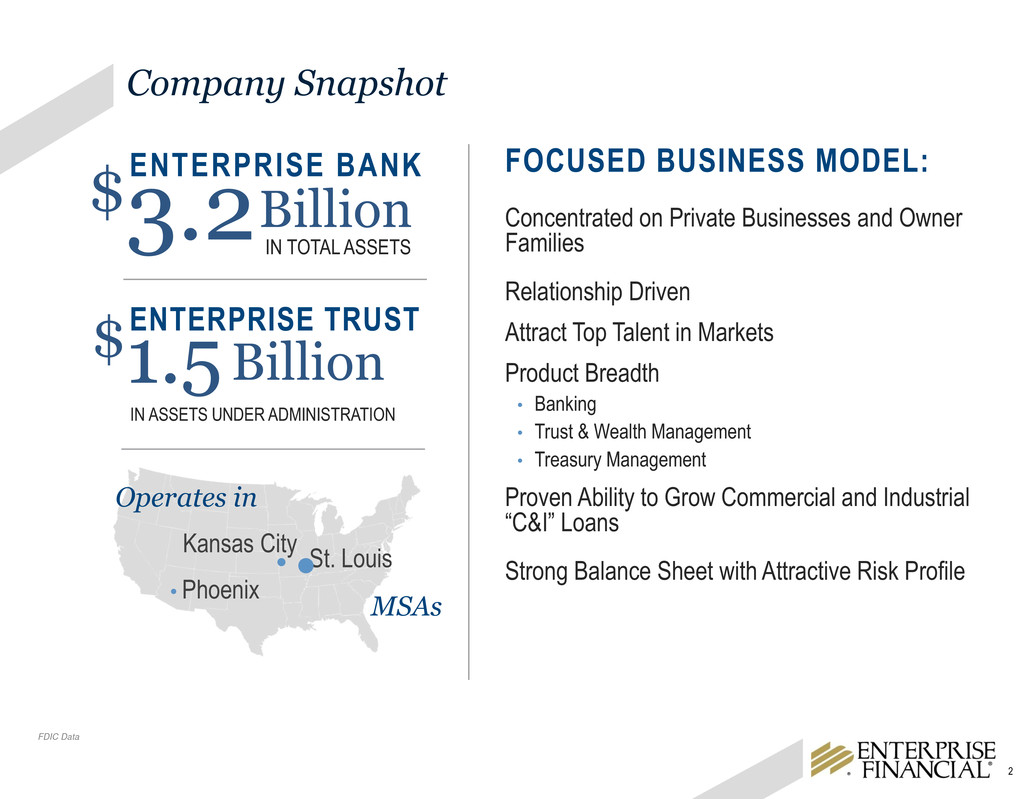
2 Company Snapshot FDIC Data ENTERPRISE BANK $3.2 Billion IN TOTAL ASSETS ENTERPRISE TRUST $1.5 Billion IN ASSETS UNDER ADMINISTRATION Concentrated on Private Businesses and Owner Families Relationship Driven Attract Top Talent in Markets Product Breadth • Banking • Trust & Wealth Management • Treasury Management Proven Ability to Grow Commercial and Industrial “C&I” Loans Strong Balance Sheet with Attractive Risk Profile FOCUSED BUSINESS MODEL: Operates in MSAs St. Louis Kansas City Phoenix

3 Differentiated Business Model: Built for Quality Earnings Growth Focused and Well-Defined Strategy Aimed at Business Owners, Executives and Professionals Targeted Array of Banking and Wealth Management Services to Meet our Clients’ Needs Experienced Bankers and Advisors Enterprise Bank Financial & Estate Planning Tax Credit Brokerage Business & Succession Planning Trust Administration Enterprise Trust Investment Management Enterprise University Treasury Management Personal & Private Banking Commercial & Business Banking PRIVATE BUSINESSES & OWNER FAMILIES Mortgage Banking
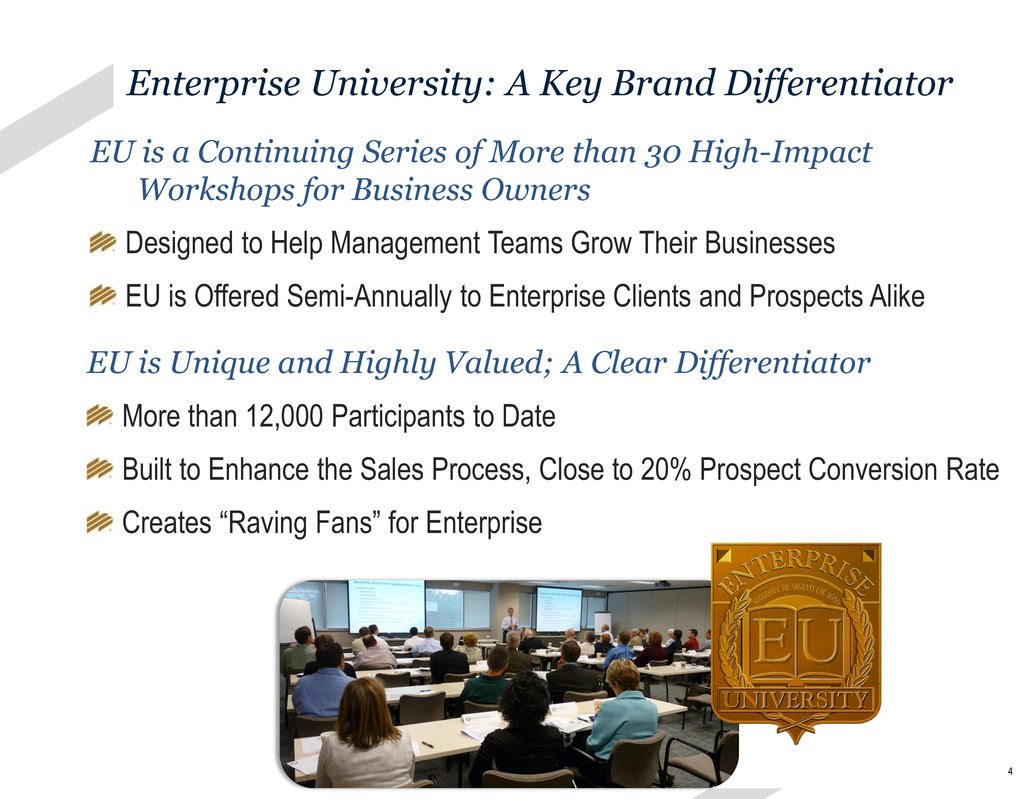
4 EU is a Continuing Series of More than 30 High-Impact Workshops for Business Owners Designed to Help Management Teams Grow Their Businesses EU is Offered Semi-Annually to Enterprise Clients and Prospects Alike Enterprise University: A Key Brand Differentiator EU is Unique and Highly Valued; A Clear Differentiator More than 12,000 Participants to Date Built to Enhance the Sales Process, Close to 20% Prospect Conversion Rate Creates “Raving Fans” for Enterprise
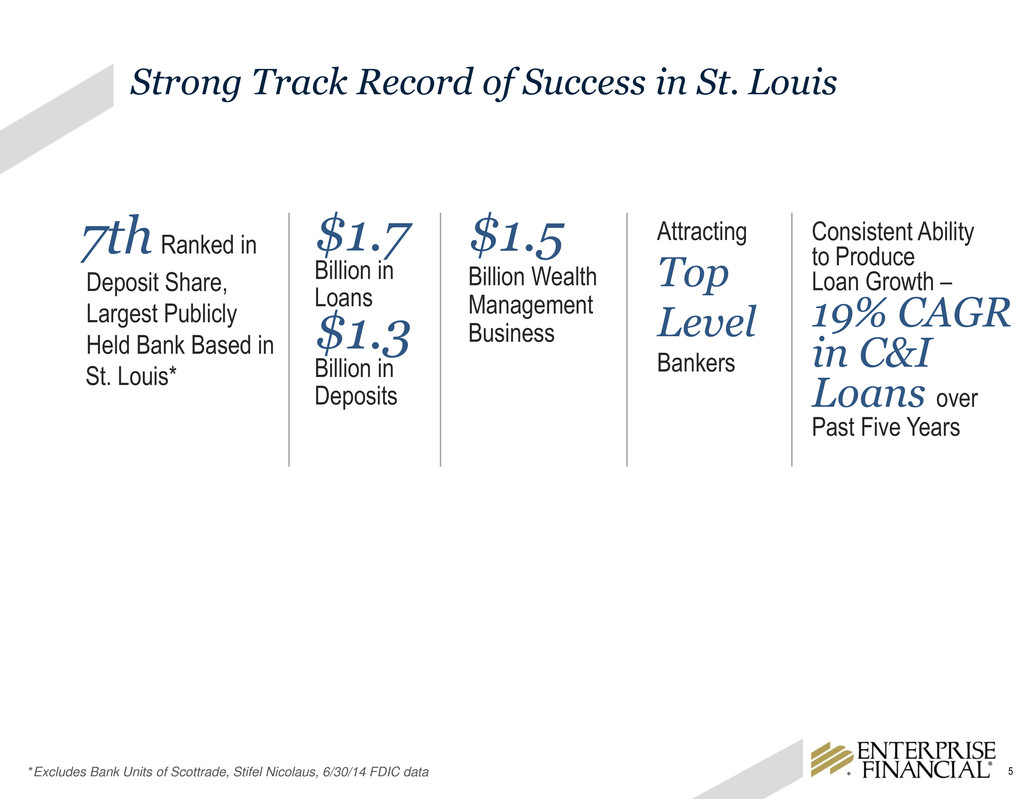
5 7th Ranked in Deposit Share, Largest Publicly Held Bank Based in St. Louis* Strong Track Record of Success in St. Louis *Excludes Bank Units of Scottrade, Stifel Nicolaus, 6/30/14 FDIC data $1.5 Billion Wealth Management Business $1.7 Billion in Loans $1.3 Billion in Deposits Consistent Ability to Produce Loan Growth – 19% CAGR in C&I Loans over Past Five Years Attracting Top Level Bankers

6 56% 60% 45% 43% 80% National Bank A National Bank B Regional Bank C Regional Bank D EFSC Market-Leading Client Satisfaction Source: Greenwich Research Associates 2013; Businesses with $1 – 50 million in sales located in St. Louis, percent “excellent” satisfaction ratings CLIENT SATISFACTION COMPARED TO FOUR LARGEST COMPETITORS

7 Entered Market in 2000 $5840 Million in Loans $597 Million in Deposits Additional Growth Opportunities Source: 6/30/13 FDIC data, SNL Financial Strong Footprint in Desirable Johnson County Similarity to St. Louis’ Stable and Diverse Economic Profile Enables Similar Market Strategies Kansas City

8 Additional Growth Opportunities Source: 6/30/14 FDIC data, SNL Financial Established presence in 2009 $139 Million in Loans $92 Million in Deposits Phoenix-Mesa-Scottsdale, AZ Rebounding Economy with Strong Growth potential. Ranked 10 of 100 Largest Metro Areas in Overall Economic Performance post-recession. Highly Concentrated Banking Market Favorable for EFSC’s Business Focused, High Service Model Phoenix Institution (ST) 2014 Number of Branches 2014 Total Deposits in Market ($000) 2014 Total Market Share (%) JPMorga Chase & Co. (NY) 196 19,220,930 26.80 Wells Farg & Co. (CA) 176 18,727,096 26.11 73% Ba k of America Corp. (NC) 107 14,539,161 20.27 Western Alliance Bancorp (AZ) 7 2,495,220 3.48 BBVA 50 2,348,020 3.27 Bank f Montreal 42 2,085,989 2.91 Zions Bancorp. (UT) 24 1,521,345 2.12 U.S. Bancorp (MN) 66 1,240,437 1.73 Midland Financial Co. (OK) 26 1,120,835 1.56 New York Community Bancorp (NY) 14 903,084 1.26 Enterprise Financial Services (MO) 2 93,206 0.13 Total For Institutions In Market 893 71,727,760
9 Cross-Selling and Business Banking Initiatives Complement Primary Commercial Strategy High Client Satisfaction Paves Way for Add-on Product Sales Treasury Management Product Implementations Rose 18% in 2014; 40% of All New Implementations were Cross-Sells to Current Clients Business Banking Initiative Targeting $1-10 Million Revenue Businesses, Produced 17% Increase in Banking Relationships in 2014; Average Cross-Sell Ratio 4.3 Branch Organization Mobilized to Cross-Sell Personal Banking Services to Commercial and Business Banking Clients Established Distinct Sales and Relationship Management Models to Efficiently Penetrate and Service the Market

10 26% 34% 20% 20% Attractive Deposit Mix CD Interest Bearing Transaction Accts DDA MMA & Savings As of 12/31/14 Cost of Deposits 0.43% 2014 $2,492MM Significant DDA Base Declining Cost of Deposits Improving Core Funding 80% of Core Deposits are Commercial Customers

11 History of Strong C&I Growth $- $200 $400 $600 $800 $1,000 $1,200 $1,400 2009 2010 2011 2012 2013 2014 $594 In millions $554 $763 $963 $1,042 $1,270

12 Tax Credit Programs. $130 Million in Loans Outstanding Related to Federal New Markets, Historic and Missouri Affordable Housing Tax Credits. $143 Million in Federal & State New Markets Tax Credits Awarded To Date. Enterprise Value Lending. $203 Million in M&A Related Loans Outstanding, Partnering with PE and VC Firms Life Insurance Premium Financing. $221 Million in Loans Outstanding Related to High Net Worth Estate Planning Focused Loan Growth Strategies 5.3% 8.3% 9.1% Total Portfolio Loans Specialized Market Segments have Grown to 23% of Total Portfolio Loans, Offering Competitive Advantages, Risk Adjusted Pricing and Fee Income Opportunities. Expectations for Future Growth Include Continued Focus in these Specialized Market Segments.

13 Robust 2014 Portfolio Loan Growth $2,137 $2,174 $2,251 $2,294 $2,434 12/31/2013 3/31/2014 6/30/2014 9/30/2014 12/31/2014 In Millions
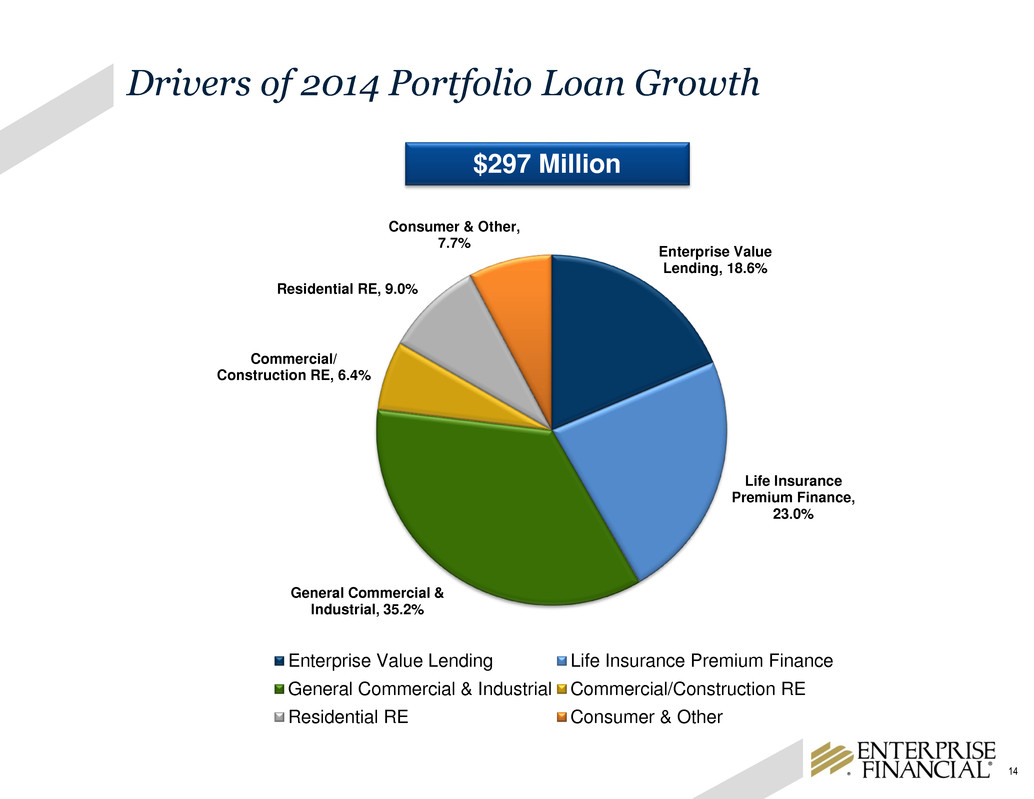
14 Drivers of 2014 Portfolio Loan Growth Enterprise Value Lending, 18.6% Life Insurance Premium Finance, 23.0% General Commercial & Industrial, 35.2% Commercial/ Construction RE, 6.4% Residential RE, 9.0% Consumer & Other, 7.7% Enterprise Value Lending Life Insurance Premium Finance General Commercial & Industrial Commercial/Construction RE Residential RE Consumer & Other $297 Million
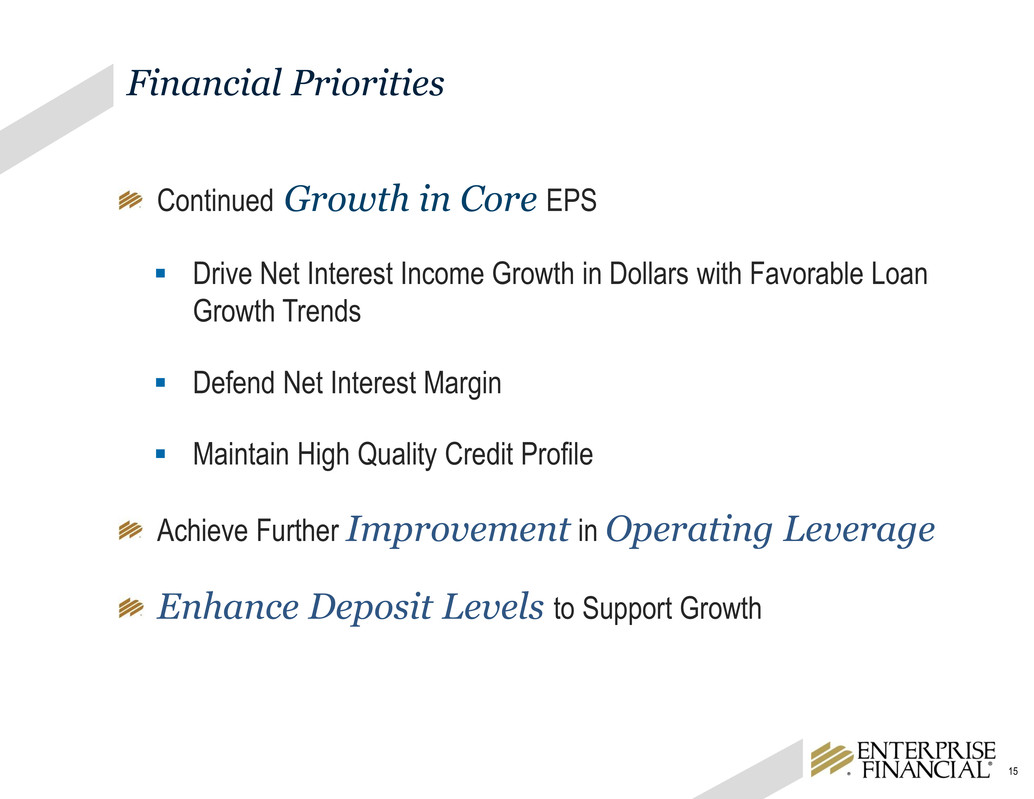
15 Continued Growth in Core EPS Drive Net Interest Income Growth in Dollars with Favorable Loan Growth Trends Defend Net Interest Margin Maintain High Quality Credit Profile Achieve Further Improvement in Operating Leverage Enhance Deposit Levels to Support Growth Financial Priorities

16 Full Year Earnings Per Share Trends $1.47 < $0.13> $0.06 < $0.17 > < $0.02 > $0.08 $1.29 2013 PCI Loan NII Core Asset NII Portfolio Loan Loss Provision Non-Interest Income Operating Expenses 2014 In Millions Changes in Core EPS* * A Non GAAP Measure, Refer to Appendix for Reconciliation Improving Earnings “Quality”

17 Positive Momentum in Core* Earnings Per Share $0.28 $0.31 $0.37 $0.33 Q1 '14 Q2 '14 Q3 '14 Q4 '14 Note: * A Non-GAAP Measure, Refer to Appendix for Reconciliation
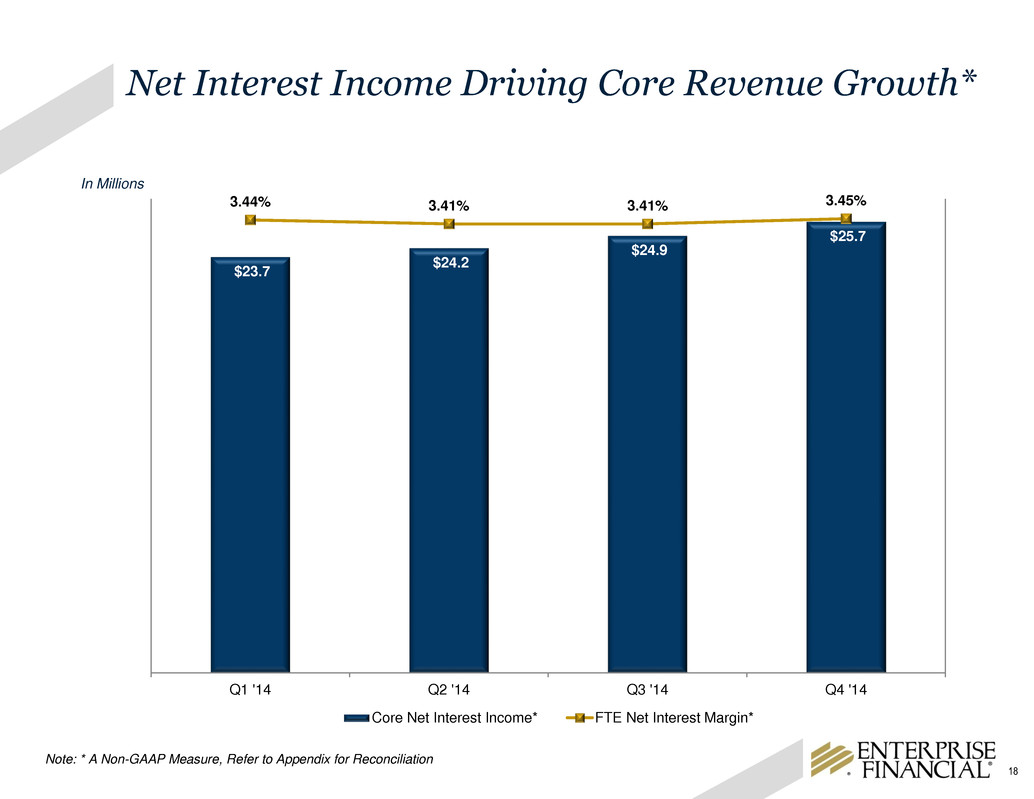
18 Net Interest Income Driving Core Revenue Growth* In Millions Note: * A Non-GAAP Measure, Refer to Appendix for Reconciliation $23.7 $24.2 $24.9 $25.7 3.44% 3.41% 3.41% 3.45% 0.00% 0.50% 1.00% 1.50% 2.00% 2.50% 3.00% 3.50% $- $1.0 $2.0 $3.0 $4.0 $5.0 $6.0 $7.0 $8.0 $9.0 $10.0 $11.0 $12.0 $13.0 $14.0 $15.0 $16.0 $17.0 $18.0 $19.0 $20.0 $21.0 $22.0 $23.0 $24.0 $25.0 $26.0 $27.0 Q1 '14 Q2 '14 Q3 '14 Q4 '14 Core Net Interest Income* FTE Net Interest Margin*

19 Favorable Credit Trends for Portfolio Loans 8 bps 15 bps -5 bps 10 bps Q1 '14 Q2 '14 Q3 '14 Q4 '14 0 Net Charge-offs (1) 2014 NCO = 7 bps 2013 NCO = 31 bps (1) Portfolio loans only, excludes PCI loans $36.7 $77.1 $43.8 $139.1 0 20 40 60 80 100 120 140 160 Q1 '14 Q2 '14 Q3 '14 Q4 '14 Portfolio Loan Growth $1.0 $1.3 $0.1 $2.0 $- $0.6 $1.2 $1.8 $2.4 Q1 '14 Q2 '14 Q3 '14 Q4 '14 Provision for Portfolio Loans 12/31/14 EFSC Peer(2) NPA’s/Assets = 0.74% 1.01% NPL’s/Loans = 0.91% 1.13% ALLL/NPL’s = 135% 120% ALLL/Loans = 1.24% 1.35% (2) Peer data is 2014 Proxy LTIP Peer Group – median values as of 9/30/2014 (source: SNL Financial) In Millions In Millions

20 Managed Operating Expenses* Improving Efficiency In Millions Note: * A Non-GAAP Measure, Refer to Appendix for Reconciliation $20.4 $19.5 $19.3 $20.2 68.2% 64.5% 62.8% 62.8% 0.0% 10.0% 20.0% 30.0% 40.0% 50.0% 60.0% 70.0% 0 6 12 18 24 Q1 '14 Q2 '14 Q3 '14 Q4 '14 Operating Expenses* Core Efficiency Ratio*

21 Balance Sheet Positioned for Growth Modest Asset Sensitivity (200 BPS Rate Shock Increases NII By 7.1%) 63% Floating Rate Loans, with Three-Year Average Duration High-quality, Cash-flowing Securities Portfolio with Four Year Average Duration 26% DDA to Total Deposits 8.7% Tangible Common Equity/Tangible Assets

22 Highly Focused, Proven Business Model Strong Track Record of Commercial Loan Growth Differentiated Competitive Lending Expertise Replicating St. Louis Model in Kansas City and Phoenix Demonstrated Progress Toward Increased Returns and Enhancing Shareholder Value 177% 94% 0% 50% 100% 150% 200% EFSC Index 5-Year Total Shareholder Return Note: Index = SNL U.S. Bank $1B - $5B Source: SNL

Appendix

24 Significant Earnings Contribution (Pre-tax) Significant Contribution to Future Earnings with Estimated Future Accretable Yield of $29 Million Loss Share Agreements Expiration Dates Successful FDIC-Assisted Acquisition Strategy Completed 4 FDIC- Assisted Transactions Since December 2009 Contributed $45 Million in Net Earnings Since Acquisition 2013 2014 $15,459 $10,860 Dollars in Thousands Accretable yield estimate as of 6/30/14 $178 Million of Contractual Cash Flows with $84 Million Carrying Value Valley Capital Home Natl Legacy Bank First Natl Olathe Single Family Dec 2019 Jul 2020 Jan 2021 Aug 2021 Non Single Family Expired Jul 2015 Jan 2016 Aug 2016

25 Use of Non-GAAP Financial Measures The Company's accounting and reporting policies conform to generally accepted accounting principles in the United States (“GAAP”) and the prevailing practices in the banking industry. However, the Company provides other financial measures, such as Core net income margin and other Core performance measures, in this presentation that are considered “non-GAAP financial measures.” Generally, a non-GAAP financial measure is a numerical measure of a company's financial performance, financial position or cash flows that exclude (or include) amounts that are included in (or excluded from) the most directly comparable measure calculated and presented in accordance with GAAP. The Company considers its Core performance measures presented in presentation as important measures of financial performance, even though they are non-GAAP measures, as they provide supplemental information by which to evaluate the impact of PCI loans and related income and expenses, the impact of nonrecurring items, and the Company's operating performance on an ongoing basis. Core performance measures include contractual interest on PCI loans but exclude incremental accretion on these loans. Core performance measures also exclude the Change in FDIC receivable, Gain or loss of other real estate covered under FDIC loss share agreements and expenses directly related to the PCI loans and other assets covered under FDIC loss share agreements. Core performance measures also exclude certain other income and expense items the Company believes to be not indicative of or useful to measure the Company's operating performance on an ongoing basis. The attached tables contain a reconciliation of these Core performance measures to the GAAP measures. The Company believes these non-GAAP measures and ratios, when taken together with the corresponding GAAP measures and ratios, provide meaningful supplemental information regarding the Company's performance and capital strength. The Company's management uses, and believes that investors benefit from referring to, these non-GAAP measures and ratios in assessing the Company's operating results and related trends and when forecasting future periods. However, these non-GAAP measures and ratios should be considered in addition to, and not as a substitute for or preferable to, ratios prepared in accordance with GAAP. In the tables below, the Company has provided a reconciliation of, where applicable, the most comparable GAAP financial measures and ratios to the non-GAAP financial measures and ratios, or a reconciliation of the non-GAAP calculation of the financial measure for the periods indicated.
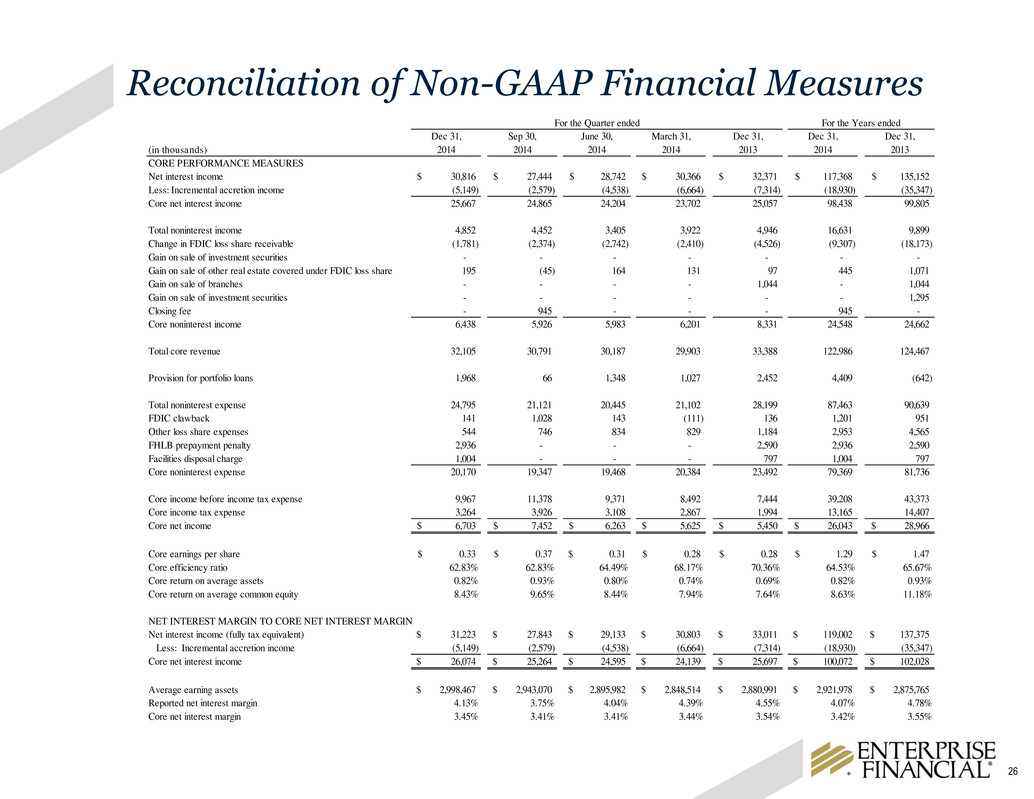
26 Reconciliation of Non-GAAP Financial Measures Dec 31, Sep 30, June 30, March 31, Dec 31, Dec 31, Dec 31, (in thousands) 2014 2014 2014 2014 2013 2014 2013 CORE PERFORMANCE MEASURES Net interest income 30,816$ 27,444$ 28,742$ 30,366$ 32,371$ 117,368$ 135,152$ Less: Incremental accretion income (5,149) (2,579) (4,538) (6,664) (7,314) (18,930) (35,347) Core net interest income 25,667 24,865 24,204 23,702 25,057 98,438 99,805 Total noninterest income 4,852 4,452 3,405 3,922 4,946 16,631 9,899 Change in FDIC loss share receivable (1,781) (2,374) (2,742) (2,410) (4,526) (9,307) (18,173) Gain on sale of investment securities - - - - - - - Gain on sale of other real estate covered under FDIC loss share 195 (45) 164 131 97 445 1,071 Gain on sale of branches - - - - 1,044 - 1,044 Gain on sale of investment securities - - - - - - 1,295 Closing fee - 945 - - - 945 - Core noninterest income 6,438 5,926 5,983 6,201 8,331 24,548 24,662 Total core revenue 32,105 30,791 30,187 29,903 33,388 122,986 124,467 Provision for portfolio loans 1,968 66 1,348 1,027 2,452 4,409 (642) Total noninterest expense 24,795 21,121 20,445 21,102 28,199 87,463 90,639 FDIC clawback 141 1,028 143 (111) 136 1,201 951 Other loss share expenses 544 746 834 829 1,184 2,953 4,565 FHLB prepayment penalty 2,936 - - - 2,590 2,936 2,590 Facilities disposal charge 1,004 - - - 797 1,004 797 Core noninterest expense 20,170 19,347 19,468 20,384 23,492 79,369 81,736 Core income before income tax expense 9,967 11,378 9,371 8,492 7,444 39,208 43,373 Core income tax expense 3,264 3,926 3,108 2,867 1,994 13,165 14,407 Core net income 6,703$ 7,452$ 6,263$ 5,625$ 5,450$ 26,043$ 28,966$ Core earnings per share 0.33$ 0.37$ 0.31$ 0.28$ 0.28$ 1.29$ 1.47$ Core efficiency ratio 62.83% 62.83% 64.49% 68.17% 70.36% 64.53% 65.67% Core return on average assets 0.82% 0.93% 0.80% 0.74% 0.69% 0.82% 0.93% Core return on average common equity 8.43% 9.65% 8.44% 7.94% 7.64% 8.63% 11.18% NET INTEREST MARGIN TO CORE NET INTEREST MARGIN Net interest income (fully tax equivalent) 31,223$ 27,843$ 29,133$ 30,803$ 33,011$ 119,002$ 137,375$ Less: Incremental accretion income (5,149) (2,579) (4,538) (6,664) (7,314) (18,930) (35,347) Core net interest income 26,074$ 25,264$ 24,595$ 24,139$ 25,697$ 100,072$ 102,028$ Average earning assets 2,998,467$ 2,943,070$ 2,895,982$ 2,848,514$ 2,880,991$ 2,921,978$ 2,875,765$ Reported net interest margin 4.13% 3.75% 4.04% 4.39% 4.55% 4.07% 4.78% Core net interest margin 3.45% 3.41% 3.41% 3.44% 3.54% 3.42% 3.55% For the Quarter ended For the Years ended
