Attached files
| file | filename |
|---|---|
| 8-K - FORM 8-K - US BANCORP \DE\ | d869270d8k.htm |
 Credit
Suisse Financial Services Forum 2015
February 11, 2015
Kathy Rogers
Vice Chairman and CFO
P.W. (Bill) Parker
Vice Chairman, Chief Risk Officer
EXTENDING
THE ADVANTAGE
Exhibit 99.1
1 |
 EXTENDING
THE
ADVANTAGE
2
Forward-looking Statements and Additional Information
The
following
information
appears
in
accordance
with
the
Private
Securities
Litigation
Reform
Act
of
1995:
This
presentation
contains
forward-looking
statements
about
U.S.
Bancorp.
Statements
that
are
not
historical
or
current
facts,
including
statements
about beliefs and expectations, are forward-looking statements and are based on
the information available to, and assumptions and estimates made by,
management
as
of
the
date
made.
These
forward-looking
statements
cover,
among
other
things,
anticipated
future
revenue
and
expenses
and
the
future
plans
and
prospects
of
U.S.
Bancorp.
Forward-looking
statements
involve
inherent
risks
and
uncertainties,
and
important
factors
could
cause
actual
results
to
differ
materially
from
those
anticipated.
A
reversal
or
slowing
of
the
current
economic
recovery
or
another
severe
contraction
could
adversely
affect
U.S.
Bancorp’s
revenues
and
the
values
of
its
assets
and
liabilities.
Global
financial
markets
could
experience
a
recurrence
of significant turbulence, which could reduce the availability of funding to
certain financial institutions and lead to a tightening of credit, a reduction of
business activity, and increased market volatility. Stress in the commercial
real estate markets, as well as a downturn in the residential real estate
markets, could cause credit losses and deterioration in asset values. In
addition, U.S. Bancorp’s business and financial performance is likely to be
negatively
impacted
by
recently
enacted
and
future
legislation
and
regulation.
U.S.
Bancorp’s
results
could
also
be
adversely
affected
by
deterioration
in
general
business
and
economic
conditions;
changes
in
interest
rates;
deterioration
in
the
credit
quality
of
its
loan
portfolios
or
in
the
value of the collateral securing those loans; deterioration in the value of
securities held in its investment securities portfolio; legal and regulatory
developments;
increased
competition
from
both
banks
and
non-banks;
changes
in
customer
behavior
and
preferences;
breaches
in
data
security;
effects of mergers and acquisitions and related integration; effects of critical
accounting policies and judgments; and management’s ability to
effectively manage credit risk, residual value risk, market risk, operational risk,
interest rate risk and liquidity risk. For
discussion
of
these
and
other
risks
that
may
cause
actual
results
to
differ
from
expectations,
refer
to
U.S.
Bancorp’s
Annual
Report
on
Form 10-K for the year ended December 31, 2013, on file with the Securities and
Exchange Commission, including the sections entitled “Risk
Factors”
and “Corporate Risk Profile”
contained in Exhibit 13, and all subsequent filings with the Securities and
Exchange Commission under Sections 13(a), 13(c), 14 or 15(d) of the
Securities Exchange Act of 1934. Forward-looking statements speak only as of the date they are made, and
U.S. Bancorp undertakes no obligation to update them in light of
new information or future events.
This
presentation
includes
non-GAAP
financial
measures
to
describe
U.S.
Bancorp’s
performance.
The
calculations
of
these
measures
are
provided
within
or
in
the
appendix
of
the
presentation.
These
disclosures
should
not
be
viewed
as
a
substitute
for
operating
results
determined
in
accordance with GAAP, nor are they necessarily comparable to non-GAAP
performance measures that may be presented by other companies. |
 EXTENDING
THE
ADVANTAGE
3
Agenda
Overview
Financial Management
Capital Management
Loan Growth / Credit Quality
1Q15 Update
Long-term Goals |
 EXTENDING
THE
ADVANTAGE
4
U.S. Bancorp Dimensions
Asset Size
$403 billion
Deposits
$283 billion
Loans
$248 billion
Customers
18.5 million
NYSE Traded
USB
Market Capitalization*
$75 billion
Founded
1863
Bank Branches
3,176
ATMs
5,022
4Q14 Dimensions
* As of 1/30/15 |
 EXTENDING
THE
ADVANTAGE
5
Industry Positions
Source: company reports, SNL and FactSet
Assets and deposits as of 12/31/14, market value as of 1/30/15
U.S.
U.S.
U.S.
Rank
Company
$ Billions
Rank
Company
$ Billions
Rank
Company
$ Billions
1
J.P. Morgan
$2,527
1
J.P. Morgan
$1,363
1
Wells Fargo
$268
2
Bank of America
2,105
2
Wells Fargo
1,168
2
J.P. Morgan
202
3
Citigroup
1,843
3
Bank of America
1,119
3
Bank of America
159
4
Wells Fargo
1,687
4
Citigroup
899
4
Citigroup
142
5
U.S. Bancorp
403
5
U.S. Bancorp
283
5
U.S. Bancorp
75
6
PNC
345
6
PNC
232
6
PNC
44
7
SunTrust
190
7
SunTrust
141
7
BB&T
25
8
BB&T
187
8
BB&T
129
8
SunTrust
20
9
Fifth Third
139
9
Fifth Third
102
9
Fifth Third
14
10
Regions
120
10
Regions
94
10
Regions
12
Assets
Deposits
Market Value |
 EXTENDING
THE
ADVANTAGE
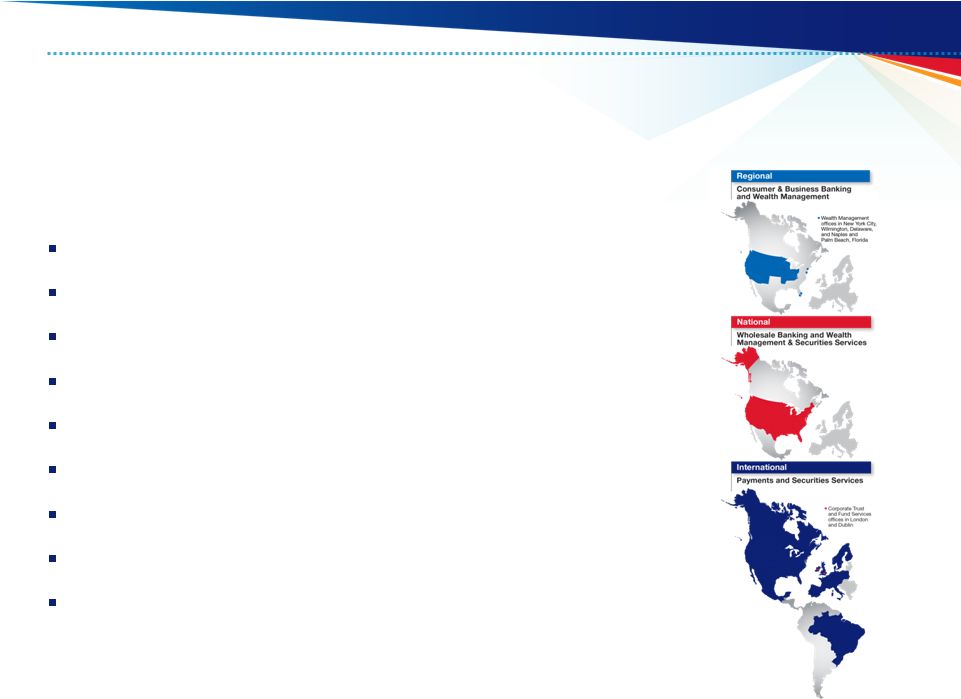
6
Revenue Mix
By Business Line
Consumer and
Small Business
Banking
41%
Payment Services
30%
Wealth Mgmt and
Securities Services
11%
Wholesale
Banking and
Commercial
Real Estate
18%
Fee Income / Total Revenue
Full year 2014, taxable-equivalent basis, excluding securities gains (losses)
net 2014
fee
income
excludes
$214
million
Visa
gain
and
$124
million
Nuveen
gain
Revenue percentages exclude Treasury and Corporate Support, see Appendix for
calculation Diversified Business Mix |
 EXTENDING
THE
ADVANTAGE
7
Agenda
Overview
Financial Management
Capital Management
Loan Growth / Credit Quality
1Q15 Update
Long-term Goals |
 EXTENDING
THE ADVANTAGE
8
Peer Banks
Peer Bank Ticker Symbols
BAC
Bank of America
PNC
PNC
BBT
BB&T
RF
Regions
FITB
Fifth Third
STI
SunTrust
JPM
J.P. Morgan
USB
U.S. Bancorp
KEY
KeyCorp
WFC
Wells Fargo
Bank of America
SunTrust
Wells Fargo
KeyCorp
BBT
Fifth Third
Regions
PNC
J.P. Morgan
U.S. Bancorp |
 EXTENDING
THE ADVANTAGE
9
Source: SNL and company reports; Peer banks: BAC, BBT, FITB, JPM, KEY, PNC, RF, STI
and WFC Efficiency ratio computed as noninterest expense divided by the sum
of net interest income on a taxable-equivalent basis and noninterest income excluding securities gains (losses)
Industry Leading Returns
Return on
Average Assets
Return on Average
Common Equity
Efficiency Ratio
Full Year 2014
4Q14 |
 EXTENDING
THE
ADVANTAGE
10
Efficient Expense Platform
Single processing platforms
Full consolidation of acquisitions
Operating scale in all significant
businesses
Business line monthly review
process
2014 Efficiency Ratio
Source of
Competitive Advantage
Source: SNL and company reports; Peer banks: BAC, BBT, FITB, JPM, KEY, PNC, RF, STI
and WFC Efficiency ratio computed as noninterest expense divided by the sum
of net interest income on a taxable-equivalent basis and noninterest income excluding securities gains (losses) |
 EXTENDING
THE
ADVANTAGE
11
Debt ratings: holding company as of 1/30/15
op=outlook positive
on=outlook negative
s=outlook stable
wn=watch negative
wp=watch positive
Flight to quality
Funding advantage
Advantages
Peer Debt Ratings
Top of Class Debt Ratings
Rating
Outlook
Rating
Outlook
Rating
Outlook
Rating
Outlook
USB
A1
s
A+
s
AA-
s
AA
s
WFC
A2
s
A+
on
AA-
s
AA
s
BBT
A2
on
A-
s
A+
s
A (high)
s
JPM
A3
s
A
on
A+
s
A (high)
s
PNC
A3
s
A-
s
A+
s
A (high)
s
FITB
Baa1
s
BBB+
s
A
s
A (low)
s
BAC
Baa2
s
A-
on
A
on
A (low)
s
STI
Baa1
s
BBB+
s
BBB+
op
A (low)
s
KEY
Baa1
s
BBB+
s
A-
s
BBB (high)
s
RF
Ba1
op
BBB
s
BBB
s
BBB
s
Moody's
S&P
Fitch
DBRS |
 EXTENDING
THE
ADVANTAGE
12
Agenda
Overview
Financial Management
Capital Management
Loan Growth / Credit Quality
1Q15 Update
Long-term Goals |
 EXTENDING
THE
ADVANTAGE
13
Capital Requirement
* Based on the final rules for the Basel III fully implemented standardized
approach Earnings Distribution Target
8.0%
Internal
Buffer
1.0%
2.5%
Capital
Conservation
Buffer
4.5%
Minimum
Capital
Requirement
9.0%*
Common Equity Tier 1
Basel III Target
USB 4Q14
Reported
Capital Management
Reinvest and
Acquisitions
Dividends
Share
Repurchases
20 -
40%
30 -
40%
30 -
40%
Dividends
30%
Reinvestment
30%
Share Repurchases
40%
Assumed ROTCE
20%
Discretionary Distributions
70%
Balance Sheet Growth
6%
Hypothetical Earnings Distribution Example |
 EXTENDING
THE
ADVANTAGE
14
62%
11%
32%
Payout Ratio
71%
Capital Distributions
72%
Comprehensive Capital Analysis
and Review (CCAR) capital plan
was submitted in January
CCAR results expected to be
published by March 31, 2015
PPNR = Pre-Provision Net Revenue
Source: Federal Reserve, estimates in the severely adverse scenario
|
 EXTENDING
THE
ADVANTAGE
15
Agenda
Overview
Financial Management
Capital Management
Loan Growth / Credit Quality
1Q15 Update
Long-term Goals |
 EXTENDING
THE
ADVANTAGE
16
$ in millions
Prior 5 Years
Average Balances
Year-Over-Year Growth
3.9%
4.4%
6.9%
5.6%
6.3%
Prior 5 Quarters
Average Balances
Year-Over-Year Growth
5.7%
6.0%
6.8%
6.3%
5.9%
Loan Growth |
 EXTENDING
THE
ADVANTAGE
17
$ in millions
Net Charge-offs
Net Charge-offs (Left Scale)
NCOs to Avg Loans (Right Scale)
Credit Quality
Nonperforming Assets
Nonperforming Assets (Left Scale)
NPAs to Loans plus ORE (Right Scale) |
 EXTENDING
THE
ADVANTAGE
18
Credit Quality
Source: SNL and company reports
Strong credit culture
•
Lowest net charge-off volatility in peer group from 1Q03 –
4Q14
Minimum/Maximum
NCO%
4Q14 NCO%
NCO Volatility |
 EXTENDING
THE
ADVANTAGE
19
Credit Quality
Source: company reports, reserve release is calculated as net charge-offs less
provision for credit losses Strong credit culture
•
Reserve build was less than peers –
now have modest releases
Reserve Release / Net Income
(Full Year 2014) |
 EXTENDING
THE
ADVANTAGE
20
Small Business
Card Growth
Ongoing benefit of
2009+ Originations
Net Charge-offs -
USB Normalized
•
Overall normalized loss rate 0.95% -
1.00%
•
Actual losses now well below normalized
Credit Risk Management
* Includes commercial and commercial real estate
Normalized
Normalized
Loan Portfolio
NCO%
Loan Portfolio
NCO%
Commercial
0.45%
Commercial
0.45%
Commercial Real Estate
0.50%
Commercial Real Estate
0.50%
Small Business*
1.75%
Small Business*
1.85%
Residential Mortgages
0.60%
Residential Mortgages
0.50%
Credit Cards
5.00%
Credit Cards
5.00%
Other Retail
1.00%
Other Retail
1.00%
Covered Assets
0.25%
Covered Assets
0.25%
Total
1.00%
Total
Investor Day 2Q13
Current |
 EXTENDING
THE
ADVANTAGE
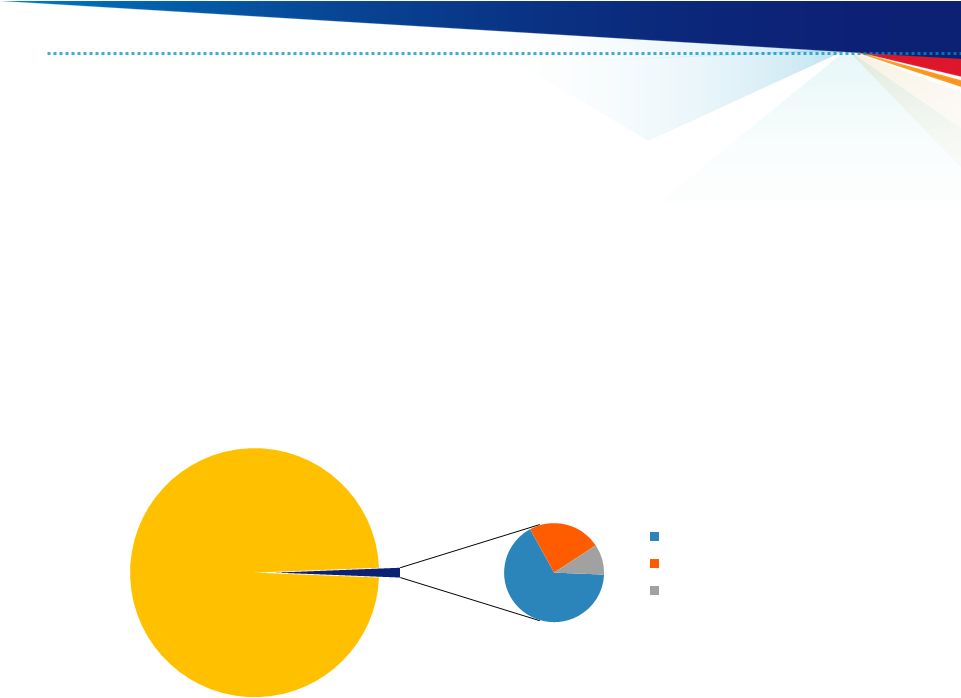
21
Energy Lending
A limited, managed exposure
•
$11.5
billion
in
commitments,
$3.1
billion
funded
(1.3%
of
total
loans)
•
~70% of commitments rated investment grade or equivalent
•
Low energy prices are expected to help consumer spending in areas such
as services and restaurants
Exploration and Production
Midstream
Oil Field Service
Providers and Refiners
Total Loans
($247.9B)
Energy Loans
($3.1B)
66%
24%
10%
Energy |
 EXTENDING
THE
ADVANTAGE
22
Overview
Financial Management
Capital Management
Loan Growth / Credit Quality
1Q15 Update
Long-term Goals
Agenda |
 EXTENDING
THE
ADVANTAGE
23
1Q15 Update
Business Climate
Loan Growth
Net Interest Margin
Credit Quality
Noninterest Income / Expense |
 EXTENDING
THE
ADVANTAGE
24
Overview
Financial Management
Capital Management
Loan Growth / Credit Quality
1Q15 Update
Long-term Goals
Agenda |
 EXTENDING
THE
ADVANTAGE
25
Long-term Goals
Optimal business line mix
Investments generating
positive returns
Profitability:
•
ROE 16-19%
•
ROA 1.60-1.90%
•
Efficiency Ratio low 50s
Capital distributions:
•
Earnings distribution 60-80%
Current Status
Four simple and stable business lines
Mortgage, wealth management, corporate
banking, international payments, branch
technology, internet and mobile channels,
and select acquisitions
2014 Profitability:
•
ROE 14.7%
•
ROA 1.54%
•
Efficiency Ratio 53.2%
2014 Capital distributions:
•
Distributed 72% of earnings
(dividends 31%, share repurchases 41%)
Long-term Goals |
 EXTENDING
THE
ADVANTAGE
26
Appendix |
 EXTENDING
THE
ADVANTAGE
27
Non-GAAP Financial Measures
$ in millions
4Q14
3Q14
2Q14
1Q14
4Q13
Total equity
44,168
$
43,829
$
43,386
$
42,743
$
41,807
$
Preferred stock
(4,756)
(4,756)
(4,756)
(4,756)
(4,756)
Noncontrolling interests
(689)
(688)
(686)
(689)
(694)
Goodwill (net of deferred tax liability) (1)
(8,403)
(8,503)
(8,548)
(8,352)
(8,343)
Intangible assets, other than mortgage servicing rights
(824)
(877)
(925)
(804)
(849)
Tangible common equity (a)
29,496
29,005
28,471
28,142
27,165
Tangible common equity (as calculated above)
29,496
29,005
28,471
28,142
27,165
Adjustments (2)
172
187
224
239
224
Common equity tier 1 capital estimated for the Basel III fully
implemented standardized and advanced approaches (b)
29,668
29,192
28,695
28,381
27,389
Tier 1 capital, determined in accordance with prescribed
regulatory requirements using Basel I definition
33,386
Preferred stock
(4,756)
Noncontrolling interests, less preferred stock not eligible for Tier 1 capital
(688)
Tier 1 common equity using Basel I definition (c)
27,942
(1)
Includes goodwill related to certain investments in unconsolidated financial institutions per
prescribed regulatory requirements beginning March 31, 2014. (2)
Includes net losses on cash flow hedges included in accumulated other comprehensive income and other
adjustments. (3)
2014 amounts calculated under the Basel III transitional standardized approach; December 31, 2013
calculated under Basel I. (4)
Includes higher risk-weighting for unfunded loan commitments, investment securities, residential
mortgages, mortgage servicing rights and other adjustments. (5)
Primarily reflects higher risk-weighting for mortgage servicing rights.
|
 EXTENDING
THE
ADVANTAGE
28
Non-GAAP Financial Measures
$ in millions
4Q14
3Q14
2Q14
1Q14
4Q13
Total assets
402,529
$
391,284
$
389,065
$
371,289
$
364,021
$
Goodwill (net of deferred tax liability) (1)
(8,403)
(8,503)
(8,548)
(8,352)
(8,343)
Intangible assets, other than mortgage servicing rights
(824)
(877)
(925)
(804)
(849)
Tangible assets (d)
393,302
381,904
379,592
362,133
354,829
Risk-weighted assets, determined in accordance with prescribed
regulatory requirements (3)(e)
317,398
*
311,914
309,929
302,841
297,919
Adjustments (4)
11,110
*
12,837
12,753
13,238
13,712
Risk-weighted assets estimated for the Basel III fully implemented
standardized approach (f)
328,508
*
324,751
322,682
316,079
311,631
Risk-weighted assets, determined in accordance with prescribed
transitional advanced approaches regulatory requirements
248,596
*
243,909
241,929
Adjustments (5)
3,270
*
3,443
3,383
Risk-weighted assets estimated for the Basel III fully implemented
251,866
*
247,352
245,312
advanced approaches (g)
Ratios
Tangible common equity to tangible assets (a)/(d)
7.5
%
7.6
%
7.5
%
7.8
%
7.7
%
Tangible common equity to risk-weighted assets (a)/(e)
9.3
9.3
9.2
9.3
9.1
Tier 1 common equity to risk-weighted assets using Basel I definition (c)/(e)
--
--
--
--
9.4
Common equity tier 1 capital to risk-weighted assets estimated for the
Basel III fully implemented standardized approach (b)/(f)
9.0
9.0
8.9
9.0
8.8
Common equity tier 1 capital to risk-weighted assets estimated for the
Basel III fully implemented advanced approaches (b)/(g)
11.8
11.8
11.7
* Preliminary data. Subject to change prior to filings with applicable regulatory
agencies. (1)
Includes goodwill related to certain investments in unconsolidated financial institutions per
prescribed regulatory requirements beginning March 31, 2014. (2)
Includes net losses on cash flow hedges included in accumulated other comprehensive income and other
adjustments. (3)
2014 amounts calculated under the Basel III transitional standardized approach; December 31, 2013
calculated under Basel I. (4)
Includes higher risk-weighting for unfunded loan commitments, investment securities, residential
mortgages, mortgage servicing rights and other adjustments. (5)
Primarily reflects higher risk-weighting for mortgage servicing rights.
|
 EXTENDING
THE
ADVANTAGE
29
Taxable-equivalent basis, excluding securities gains (losses) net
Line of Business Financial Performance
Non-GAAP Financial Measures
$ in millions
Revenue
Line of Business Financial Performance
FY 2014
Wholesale Banking and Commercial Real Estate
3,037
$
Consumer and Small Business Banking
6,915
Wealth Management and Securities Services
1,765
Payment Services
5,032
Treasury and Corporate Support
3,412
Consolidated Company
20,161
Less Treasury and Corporate Support
3,412
Consolidated Company excluding Treasury and Corporate Support
16,749
$
Percent of Total
Wholesale Banking and Commercial Real Estate
15%
Consumer and Small Business Banking
34%
Wealth Management and Securities Services
9%
Payment Services
25%
Treasury and Corporate Support
17%
Total
100%
Percent of Total excluding Treasury and Corporate Support
Wholesale Banking and Commercial Real Estate
18%
Consumer and Small Business Banking
41%
Wealth Management and Securities Services
11%
Payment Services
30%
Total
100% |
 EXTENDING
THE ADVANTAGE
30
Credit Suisse Financial
Services Forum 2015
February 11, 2015 |