Attached files
| file | filename |
|---|---|
| EXCEL - IDEA: XBRL DOCUMENT - Terreno Realty Corp | Financial_Report.xls |
| EX-21 - EX-21 - Terreno Realty Corp | d854283dex21.htm |
| EX-23 - EX-23 - Terreno Realty Corp | d854283dex23.htm |
| EX-32.1 - EX-32.1 - Terreno Realty Corp | d854283dex321.htm |
| EX-31.2 - EX-31.2 - Terreno Realty Corp | d854283dex312.htm |
| EX-31.3 - EX-31.3 - Terreno Realty Corp | d854283dex313.htm |
| EX-12.1 - EX-12.1 - Terreno Realty Corp | d854283dex121.htm |
| EX-32.3 - EX-32.3 - Terreno Realty Corp | d854283dex323.htm |
| EX-31.1 - EX-31.1 - Terreno Realty Corp | d854283dex311.htm |
| EX-32.2 - EX-32.2 - Terreno Realty Corp | d854283dex322.htm |
Table of Contents
UNITED STATES
SECURITIES AND EXCHANGE COMMISSION
Washington, D.C. 20549
Form 10-K
| x | ANNUAL REPORT PURSUANT TO SECTION 13 OR 15(d) OF THE SECURITIES EXCHANGE ACT OF 1934 |
For the fiscal year ended December 31, 2014
OR
| ¨ | TRANSITION REPORT PURSUANT TO SECTION 13 OR 15(d) OF THE SECURITIES EXCHANGE ACT OF 1934 |
For the transition period from to
Commission file number 001-34603
Terreno Realty Corporation
(Exact Name of Registrant as Specified in Its Charter)
| Maryland | 27-1262675 | |
| (State or Other Jurisdiction of Incorporation or Organization) |
(I.R.S. Employer Identification Number) | |
| 101 Montgomery Street, Suite 200 San Francisco, CA |
94104 | |
| (Address of Principal Executive Offices) | (Zip Code) | |
Registrant’s telephone number, including area code: (415) 655-4580
Securities registered pursuant to Section 12(b) of the Act:
| Title of Each Class |
Name of Exchange on Which Registered | |
| Common Stock, $0.01 par value per share 7.75% Series A Cumulative Redeemable Preferred Stock, $0.01 par value per share |
New York Stock Exchange New York Stock Exchange |
Securities registered pursuant to Section 12(g) of the Act:
None
Indicate by check mark if the registrant is a well-known seasoned issuer, as defined in Rule 405 of the Securities Act. Yes x No ¨
Indicate by check mark if the registrant is not required to file reports pursuant to Section 13 or Section 15(d) of the Act. Yes ¨ No x
Indicate by check mark whether the registrant: (1) has filed all reports required to be filed by Section 13 or 15(d) of the Securities Exchange Act of 1934 during the preceding 12 months (or for such shorter period that the registrant was required to file such reports), and (2) has been subject to such filing requirements for the past 90 days. Yes x No ¨
Indicate by check mark whether the registrant has submitted electronically and posted on its corporate Web site, if any, every Interactive Data File required to be submitted and posted pursuant to Rule 405 of Regulation S-T during the preceding 12 months (or for such shorter period that the registrant was required to submit and post such files). Yes x No ¨
Indicate by check mark if disclosure of delinquent filers pursuant to Item 405 of Regulation S-K is not contained herein, and will not be contained, to the best of registrant’s knowledge, in definitive proxy or information statements incorporated by reference in Part III of this Form 10-K or any amendment to this Form 10-K. x
Indicate by check mark whether the registrant is a large accelerated filer, an accelerated filer, a non-accelerated filer, or a smaller reporting company. See the definitions of “large accelerated filer,” “accelerated filer” and “smaller reporting company” in Rule 12b-2 of the Exchange Act. (Check one):
| Large accelerated filer | ¨ | Accelerated filer | x | |||
| Non-accelerated filer | ¨ (Do not check if a smaller reporting company) | Smaller reporting company | ¨ |
Indicate by check mark whether the registrant is a shell company (as defined in Rule 12b-2 of the Exchange Act). Yes ¨ No x
Aggregate market value of the voting and non-voting common equity held by non-affiliates computed by reference to the closing price, as reported by the New York Stock Exchange, at which the common equity was last sold, as of June 30, 2014, the last business day of the Registrant’s most recently completed second fiscal quarter: $622,488,339. (For this computation, the Registrant has excluded the market value of all shares of its common stock reported as beneficially owned by executive officers and directors of the Registrant).
The registrant had 42,869,463 shares of its common stock, $0.01 par value per share, outstanding as of February 10, 2015.
Documents Incorporated by Reference
Part III of this Annual Report on Form 10-K incorporates by reference portions of Terreno Realty Corporation’s Proxy Statement for its 2015 Annual Meeting of Stockholders, which the registrant anticipates will be filed with the Securities and Exchange Commission no later than 120 days after the end of its 2014 fiscal year pursuant to Regulation 14A.
Table of Contents
Terreno Realty Corporation
Annual Report on Form 10-K
for the Year Ended December 31, 2014
| Part I: |
||||||||
| Item 1 |
2 | |||||||
| Item 1A |
7 | |||||||
| Item 1B |
29 | |||||||
| Item 2 |
29 | |||||||
| Item 3 |
32 | |||||||
| Item 4 |
32 | |||||||
| Part II: |
||||||||
| Item 5 |
33 | |||||||
| Item 6 |
36 | |||||||
| Item 7 |
Management’s Discussion and Analysis of Financial Condition and Results of Operations |
37 | ||||||
| Item 7A |
59 | |||||||
| Item 8 |
59 | |||||||
| Item 9 |
Changes in and Disagreements with Accountants on Accounting and Financial Disclosure |
59 | ||||||
| Item 9A |
60 | |||||||
| Item 9B |
62 | |||||||
| Part III: |
||||||||
| Item 10 |
62 | |||||||
| Item 11 |
62 | |||||||
| Item 12 |
Security Ownership of Certain Beneficial Owners and Management and Related Stockholder Matters |
62 | ||||||
| Item 13 |
Certain Relationships and Related Transactions, and Director Independence |
62 | ||||||
| Item 14 |
62 | |||||||
| Part IV: |
||||||||
| Item 15 |
63 | |||||||
| 63 | ||||||||
Table of Contents
FORWARD-LOOKING STATEMENTS
This Annual Report on Form 10-K contains forward-looking statements within the meaning of the Private Securities Litigation Reform Act of 1995, Section 27A of the Securities Act of 1933, as amended (the “Securities Act”) and Section 21E of the Securities Exchange Act of 1934, as amended (the “Exchange Act”). We caution investors that forward-looking statements are based on management’s beliefs and on assumptions made by, and information currently available to, management. When used, the words “anticipate”, “believe”, “estimate”, “expect”, “intend”, “may”, “might”, “plan”, “project”, “result”, “should”, “will”, “seek”, “target”, “see”, “likely”, “position”, “opportunity”, and similar expressions which do not relate solely to historical matters are intended to identify forward-looking statements. These statements are subject to risks, uncertainties, and assumptions and are not guarantees of future performance, which may be affected by known and unknown risks, trends, uncertainties, and factors, that are beyond our control. Should one or more of these risks or uncertainties materialize, or should underlying assumptions prove incorrect, actual results may vary materially from those anticipated, estimated, or projected. We expressly disclaim any responsibility to update our forward-looking statements, whether as a result of new information, future events, or otherwise, except as required by law. Accordingly, investors should use caution in relying on past forward-looking statements, which are based on results and trends at the time they are made, to anticipate future results or trends.
Some of the risks and uncertainties that may cause our actual results, performance, or achievements to differ materially from those expressed or implied by forward-looking statements include, among others, the following:
| • | the factors included in this Annual Report on Form 10-K, including those set forth under the headings “Risk Factors”, and “Management’s Discussion and Analysis of Financial Condition and Results of Operations”; |
| • | our ability to identify and acquire industrial properties on terms favorable to us; |
| • | general volatility of the capital markets and the market price of our common stock; |
| • | adverse economic or real estate conditions or developments in the industrial real estate sector and/or in the markets in which we acquire properties; |
| • | our dependence on key personnel and our reliance on third parties to property manage the majority of our industrial properties; |
| • | our inability to comply with the laws, rules and regulations applicable to companies, and in particular, public companies; |
| • | our ability to manage our growth effectively; |
| • | tenant bankruptcies and defaults on or non-renewal of leases by tenants; |
| • | decreased rental rates or increased vacancy rates; |
| • | increased interest rates and operating costs; |
| • | declining real estate valuations and impairment charges; |
| • | our expected leverage, our failure to obtain necessary outside financing, and future debt service obligations; |
| • | our ability to make distributions to our stockholders; |
| • | our failure to successfully hedge against interest rate increases; |
| • | our failure to successfully operate acquired properties; |
| • | our failure to qualify or maintain our status as a real estate investment trust (“REIT”) and possible adverse changes to tax laws; |
| • | uninsured or underinsured losses relating to our properties; |
| • | environmental uncertainties and risks related to natural disasters; |
1
Table of Contents
| • | financial market fluctuations; and |
| • | changes in real estate and zoning laws and increases in real property tax rates. |
PART I
| Item 1. | Business |
Overview
Terreno Realty Corporation (“Terreno”, and together with its subsidiaries, “we”, “us”, “our”, “our company” or “the company”) acquires, owns and operates industrial real estate in six major coastal U.S. markets: Los Angeles; Northern New Jersey/New York City; San Francisco Bay Area; Seattle; Miami; and Washington, D.C./Baltimore. We invest in several types of industrial real estate, including warehouse/distribution (approximately 88.8% of our total portfolio square footage as of December 31, 2014), flex (including light industrial and research and development, or R&D) (approximately 9.4%) and trans-shipment (approximately 1.8%). We target functional buildings in infill locations that may be shared by multiple tenants and that cater to customer demand within the various submarkets in which we operate. Infill locations are geographic locations surrounded by high concentrations of already developed land and existing buildings. As of December 31, 2014, we owned 126 buildings (including one building held for sale) aggregating approximately 9.3 million square feet and two improved land parcels consisting of 3.5 acres, which we purchased for an aggregate purchase price of approximately $851.5 million, including the assumption of mortgage loans payable of approximately $63.9 million, which includes mortgage premiums of approximately $1.9 million. As of December 31, 2014, our properties were approximately 93.7% leased to 299 customers, the largest of which accounted for approximately 5.3% of our total annualized base rent.
We are an internally managed Maryland Corporation. We were incorporated in November 2009 and on February 16, 2010 we completed our initial public offering of 8,750,000 shares of our common stock and a concurrent private placement of an aggregate of 350,000 shares of our common stock to our executive officers at a price per share of $20.00. The net proceeds of our initial public offering were approximately $162.8 million after deducting the full underwriting discount of approximately $10.5 million and other offering expenses of approximately $1.7 million. We received net proceeds of approximately $7.0 million from our concurrent private placement.
On January 13, 2012, we completed a public follow-on offering of 4,000,000 shares of our common stock, including 93,000 shares purchased by our senior management and directors, at a price per share of $14.25. On February 13, 2012, we sold an additional 61,853 shares of our common stock at a price per share of $14.25 upon the exercise by the underwriters of their option to purchase additional shares. No underwriting discount or commission was paid on the shares sold to such officers and directors. The net proceeds of the offering, after deducting the underwriting discount and offering costs, were approximately $54.7 million. We used approximately $41.0 million of the net proceeds to repay outstanding borrowings under our revolving credit facility on January 13, 2012 and used the remainder of the net proceeds to invest in industrial properties and for general business purposes.
On July 19, 2012, we completed a public offering of 1,840,000 shares of our 7.75% Series A Cumulative Redeemable Preferred Stock (the “Series A Preferred Stock”), including 240,000 shares sold upon the exercise by the underwriters of their option to purchase additional shares, at a price per share of $25.00. The net proceeds of the offering were approximately $44.3 million after deducting the underwriting discount and other offering expenses of approximately $1.7 million. We used the net proceeds to reduce outstanding borrowings under our revolving credit facility.
On February 19, 2013, we completed a public follow-on offering of 5,750,000 shares of our common stock at a price per share of $16.60, including 90,325 shares that were sold in the offering to our executive and senior officers and members of our board of directors. No underwriting discount or commission was paid on the shares
2
Table of Contents
sold to such officers and directors. The net proceeds of the offering, after deducting the underwriting discount and offering costs, were approximately $90.8 million. We used approximately $65.4 million of the net proceeds to repay outstanding borrowings under our revolving credit facility and the remaining net proceeds to invest in industrial properties and for general business purposes.
On July 11, 2013, we completed a public follow-on offering of 5,750,000 shares of our common stock at a price per share of $18.25, including 43,250 shares that were sold in the offering to our executive and senior officers and members of our board of directors. No underwriting discount or commission was paid on the shares sold to such officers and directors. The net proceeds of the offering were approximately $99.9 million after deducting the underwriting discount and offering costs of approximately $5.0 million. We used approximately $6.5 million of the net proceeds to repay outstanding borrowings under our revolving credit facility and the remaining net proceeds to acquire industrial properties and for general business purposes.
On May 22, 2014, we completed a public follow-on offering of 8,050,000 shares of our common stock at a price per share of $17.75. The net proceeds of the follow-on offering were approximately $136.5 million after deducting the underwriting discount and offering costs of approximately $6.4 million. We used approximately $100.0 million of the net proceeds to repay outstanding borrowings under our revolving credit facility and the remaining net proceeds to acquire industrial properties and for general business purposes.
On December 9, 2014, we completed a public follow-on offering of 9,775,000 shares of our common stock at a price per share of $19.60. The net proceeds of the follow-on offering were approximately $183.0 million after deducting the underwriting discount and offering costs of approximately $8.6 million. We intend to use the net proceeds to acquire industrial properties and for general corporate purposes.
We elected to be taxed as a REIT under Sections 856 through 860 of the Internal Revenue Code of 1986, as amended, or the Code, commencing with our taxable year ended December 31, 2010.
Our Investment Strategy
We invest in industrial properties in six major coastal U.S. markets: Los Angeles; Northern New Jersey/New York City; San Francisco Bay Area; Seattle; Miami; and Washington, D.C./Baltimore.
As described in more detail in the table below, we invest in several types of industrial real estate, including warehouse/distribution, flex (including light industrial and R&D) and trans-shipment. We target functional buildings in infill locations that may be shared by multiple tenants and that cater to customer demand within the various submarkets in which we operate.
Industrial Facility General Characteristics
Warehouse / distribution (approximately 88.8% of our total portfolio square footage as of December 31, 2014)
| • | Single and multiple tenant facilities that typically serve tenants greater than 30,000 square feet of space |
| • | Generally less than 20% office space |
| • | Typical clear height from 18 feet to 36 feet |
| • | May include production/manufacturing areas |
| • | Interior access via dock high and/or grade level doors |
| • | Truck court for large and small truck distribution options, possibly including staging for a high volume of truck activity and/or trailer storage |
3
Table of Contents
Flex (including light industrial and R&D, approximately 9.4% of our total portfolio square footage as of December 31, 2014)
| • | Single and multiple tenant facilities that typically serve tenants less than 30,000 square feet of space |
| • | Facilities generally accommodate both office and warehouse/manufacturing activities |
| • | Typically has a larger amount of office space and shallower bay depths than warehouse/distribution facilities |
| • | Parking consistent with increased office use |
| • | Interior access via grade level and/or dock high doors |
| • | Staging for moderate truck activity |
| • | May include a showroom, service center, or assembly/light manufacturing component |
| • | Enhanced landscaping |
Trans-shipment (approximately 1.8% of our total portfolio square footage as of December 31, 2014)
| • | Includes truck terminals and airport on-tarmac facilities, which serve both single and multiple tenants |
| • | Typically has a high number of dock high doors, shallow bay depth and lower clear height |
| • | Staging for a high volume of truck activity and trailer storage |
We selected our target markets by drawing upon the experience of our executive management investing and operating in over 50 global industrial markets located in North America, Europe and Asia, the fundamentals of supply and demand, and in anticipation of trends in logistics patterns resulting from population changes, regulatory and physical constraints, changes in technology, potential long term increases in carbon prices and other factors. We believe that our target markets have attractive long term investment attributes. We target assets with characteristics that include, but are not limited to, the following:
| • | Located in high population coastal markets; |
| • | Close proximity to transportation infrastructure (such as sea ports, airports, highways and railways); |
| • | Situated in supply-constrained submarkets with barriers to new industrial development, as a result of physical and/or regulatory constraints; |
| • | Functional and flexible layout that can be modified to accommodate single and multiple tenants; |
| • | Acquisition price at a discount to the replacement cost of the property; |
| • | Potential for enhanced return through re-tenanting or operational or physical improvements; and |
| • | Opportunity for higher and better use of the property over time. |
In general, we prefer to utilize local third party property managers for day-to-day property management. We believe outsourcing property management is cost effective and provides us with operational flexibility and is a source of acquisition opportunities. We currently manage one of our properties directly and may directly manage other properties in the future if we determine such direct property management is in our best interest.
We have no current intention to acquire undeveloped industrial land or to pursue ground up development. However, we may pursue redevelopment opportunities of properties that we own or acquire adjacent land to expand our existing facilities.
We expect that we will continue to acquire the significant majority of our investments as equity interests in individual properties or portfolios of properties. We may also acquire industrial properties through the acquisition of other corporations or entities that own industrial real estate. We will opportunistically target
4
Table of Contents
investments in debt secured by industrial real estate that would otherwise meet our investment criteria with the intention of ultimately acquiring the underlying real estate. We currently do not intend to target specific percentages of holdings of particular types of industrial properties. This expectation is based upon prevailing market conditions and may change over time in response to different prevailing market conditions.
The properties we acquire may be stabilized (fully leased) or unstabilized (have near term lease expirations or be partially or fully vacant). During the period from February 16, 2010 to December 31, 2014, we acquired 37 unstabilized properties of which 24 have been stabilized.
We may sell properties from time to time when we believe the prospective total return from a property is particularly low relative to its market value or the market value of the property is significantly greater than its estimated replacement cost. Capital from such sales will be reinvested into properties that are expected to provide better prospective returns or returned to shareholders. We have disposed of two properties since inception for a cumulative sales price of approximately $36.0 million and a total gain of approximately $6.8 million.
Competitive Strengths
We believe we distinguish ourselves from our competitors through the following competitive advantages:
| • | Focused Investment Strategy. We invest exclusively in six major coastal U.S. markets and focus on infill locations. We selected our six target markets based upon the experience of our executive management investing and operating in over 50 global industrial markets located in North America, Europe and Asia, the fundamentals of supply and demand, and in anticipation of trends in logistics patterns resulting from population changes, regulatory and physical constraints, changes in technology, potential long term increases in carbon prices and other factors. We have no current intention to acquire undeveloped land or pursue ground up development. |
| • | Highly Aligned Compensation Structure. We believe that executive compensation should be closely aligned with long-term stockholder value creation. As a result, all of the long-term equity incentive compensation of our executive and senior officers is based solely on our total shareholder return exceeding the total shareholder return of the MSCI U.S. REIT Index or the FTSE NAREIT Equity Industrial Index. |
| • | Commitment to Strong Corporate Governance. We are committed to strong corporate governance, as demonstrated by the following: |
| • | all members of our board of directors serve annual terms; |
| • | we have adopted a majority voting standard in non-contested director elections; |
| • | we have opted out of two Maryland anti-takeover provisions and, in the future, we may not opt back in to these provisions without stockholder approval; |
| • | we designed our ownership limits solely to protect our status as a REIT and not for the purpose of serving as an anti-takeover device; and |
| • | we have no stockholder rights plan. In the future, we will not adopt a stockholder rights plan unless our stockholders approve in advance the adoption of such a plan or, if adopted by our board of directors, we will submit the stockholder rights plan to our stockholders for a ratification vote within 12 months of adoption or the plan will terminate. |
Our Financing Strategy
The primary objective of our financing strategy is to maintain financial flexibility with a conservative capital structure using retained cash flows, long-term debt and the issuance of common and perpetual preferred stock to finance our growth. Over the long term, we intend to:
| • | limit the sum of the outstanding principal amount of our consolidated indebtedness and the liquidation preference of any outstanding perpetual preferred stock to less than 40% of our total enterprise value; |
5
Table of Contents
| • | maintain a fixed charge coverage ratio in excess of 2.0x; |
| • | limit the principal amount of our outstanding floating rate debt to less than 20% of our total consolidated indebtedness; and |
| • | have staggered debt maturities that are aligned to our expected average lease term (5-7 years), positioning us to re-price parts of our capital structure as our rental rates change with market conditions. |
We intend to preserve a flexible capital structure with a long-term goal to obtain an investment grade rating and be in a position to issue unsecured debt and additional perpetual preferred stock. Prior to attaining an investment grade rating, we intend to primarily utilize credit facilities, recourse bank term loans, or non-recourse debt secured by individual properties or pools of properties with a targeted maximum loan-to-value of 65% at the time of financing, and perpetual preferred stock. We may also assume debt in connection with property acquisitions which may have a higher loan-to-value.
Our Corporate Structure
We are a Maryland corporation formed on November 6, 2009 and have been publicly held and subject to U.S. Security and Exchange Commission, or SEC, reporting obligations since 2010. We are not structured as an Umbrella Partnership Real Estate Investment Trust, or UPREIT. We currently own our properties indirectly through subsidiaries and may utilize one or more taxable REIT subsidiaries as appropriate.
Our Tax Status
We elected to be taxed as a REIT under Sections 856 through 860 of the Code commencing with our taxable year ended December 31, 2010. We believe that our organization and method of operation has enabled and will continue to enable us to meet the requirements for qualification and taxation as a REIT for federal income tax purposes. To maintain REIT status we must meet a number of organizational and operational requirements, including a requirement that we annually distribute at least 90% of our net taxable income to our stockholders, excluding net capital gains. As a REIT, we generally will not be subject to federal income tax on REIT taxable income we currently distribute to our stockholders. If we fail to qualify as a REIT in any taxable year, we will be subject to federal income tax at regular corporate rates. Even if we qualify for taxation as a REIT, we may be subject to some federal, state and local taxes on our income or property and the income of our taxable REIT subsidiaries, if any, will be subject to taxation at regular corporate rates. We do not currently own any taxable REIT subsidiaries but may in the future.
Competition
We believe the current market for industrial real estate acquisitions to be competitive. We compete for real property investments with pension funds and their advisors, bank and insurance company investment accounts, other public and private real estate investment companies, including other REITs, real estate limited partnerships, owner-users, individuals and other entities engaged in real estate investment activities, some of which have greater financial resources than we do. In addition, we believe the leasing of real estate to be highly competitive. We experience competition for customers from owners and managers of competing properties. As a result, we may have to provide free rental periods, incur charges for tenant improvements or offer other inducements, all of which may have an adverse impact on our results of operations.
Environmental Matters
The industrial properties that we own and will acquire are subject to various federal, state and local environmental laws. Under these laws, courts and government agencies have the authority to require us, as owner of a contaminated property, to clean up the property, even if we did not know of or were not responsible for the
6
Table of Contents
contamination. These laws also apply to persons who owned a property at the time it became contaminated, and therefore it is possible we could incur these costs even after we sell some of our properties. In addition to the costs of cleanup, environmental contamination can affect the value of a property and, therefore, an owner’s ability to borrow using the property as collateral or to sell the property. Under applicable environmental laws, courts and government agencies also have the authority to require that a person who sent waste to a waste disposal facility, such as a landfill or an incinerator, pay for the clean-up of that facility if it becomes contaminated and threatens human health or the environment.
Furthermore, various court decisions have established that third parties may recover damages for injury caused by property contamination. For instance, a person exposed to asbestos at one of our properties may seek to recover damages if he or she suffers injury from the asbestos. Lastly, some of these environmental laws restrict the use of a property or place conditions on various activities. An example would be laws that require a business using chemicals to manage them carefully and to notify local officials that the chemicals are being used.
We could be responsible for any of the costs discussed above. The costs to clean up a contaminated property, to defend against a claim, or to comply with environmental laws could be material and could adversely affect the funds available for distribution to our stockholders. We generally obtain “Phase I environmental site assessments”, or ESAs, on each property prior to acquiring it. However, these ESAs may not reveal all environmental costs that might have a material adverse effect on our business, assets, results of operations or liquidity and may not identify all potential environmental liabilities.
In general, we utilize local third party property managers for day-to-day property management and will rely on these third parties to operate our industrial properties in compliance with applicable federal, state and local environmental laws in their daily operation of the respective properties and to promptly notify us of any environmental contaminations or similar issues. As a result, we may become subject to material environmental liabilities of which we are unaware. We can make no assurances that (1) future laws or regulations will not impose material environmental liabilities on us, or (2) the environmental condition of our industrial properties will not be affected by the condition of the properties in the vicinity of our industrial properties (such as the presence of leaking underground storage tanks) or by third parties unrelated to us. We were not aware of any significant or material exposures as of December 31, 2014 and 2013.
Employees
As of February 11, 2015, we have 18 employees. None of our employees is a member of any union.
Available Information
We maintain an internet website at the following address: http://terreno.com. The information on our website is neither part of nor incorporated by reference in this Annual Report on Form 10-K. We make available, free of charge, on or through our website certain reports and amendments to those reports that we file with or furnish to the SEC in accordance with the Exchange Act. These include our annual reports on Form 10-K, our quarterly reports on Form 10-Q, our current reports on Form 8-K and exhibits and amendments to these reports, and Section 16 filings. Our Code of Business Conduct and Ethics is also available on our website. We intend to disclose any amendments or waivers to our Code of Business Conduct and Ethics that apply to any of our executive officers on our website. We make this information available on our website free of charge as soon as reasonably practicable after we electronically file the information with, or furnish it to, the SEC. You may also obtain our reports by accessing the EDGAR database at the SEC’s website at http://www.sec.gov.
| Item 1A. | Risk Factors. |
The following risk factors and other information included in this Annual Report on Form 10-K should be carefully considered. The risks and uncertainties described below are not the only ones that we face. Additional risks and uncertainties not presently known to us or that we may currently deem immaterial also may impair our
7
Table of Contents
business operations. If any of the following risks occur, our business, financial condition, operating results and cash flows could be adversely affected. Investors should also refer to our quarterly reports on Form 10-Q and current reports on Form 8-K for updates to these risk factors.
Risks Related to Our Business and Our Properties
Our long-term growth will depend upon future acquisitions of properties, and we may be unable to consummate acquisitions on advantageous terms, the acquired properties may not perform as we expect, or we may be unable to quickly and efficiently integrate our new acquisitions into our existing operations.
We intend to continue to acquire industrial properties in our six target markets. The acquisition of properties entails various risks, including the risks that our investments may not perform as well as we had expected, that we may be unable to quickly and efficiently integrate our new acquisitions into our existing operations and that our cost estimates for bringing an acquired property up to market standards may prove inaccurate. In addition, we cannot assure you of the availability of investment opportunities in our targeted markets at attractive pricing levels or at all. In the event that such opportunities are not available in our targeted markets as we expect, our ability to execute our business plan and realize our projections for growth may be materially adversely affected. Further, we face significant competition for attractive investment opportunities from other well-capitalized real estate investors, including pension funds and their advisors, bank and insurance company investment accounts, other public and private real estate investment companies, including other REITs, real estate limited partnerships, owner-users, individuals and other entities engaged in real estate investment activities, some of which have a history of operations, greater financial resources than we do and a greater ability to borrow funds to acquire properties. This competition increases as investments in real estate become increasingly attractive relative to other forms of investment. As a result of competition, we may be unable to acquire properties as we desire or the purchase price may be significantly elevated.
In addition, we expect to finance future acquisitions through a combination of borrowings under our revolving credit facility, term loans, debt secured by individual properties or pools of properties, the use of retained cash flows and the issuance of a combination of long-term debt and common and perpetual preferred stock, which may not be available at all or on advantageous terms and which could adversely affect our cash flows. Any of the above risks could adversely affect our financial condition, results of operations, cash flows and ability to pay distributions on, and the market price of, our common stock and our preferred stock.
We may make acquisitions that pose integration and other risks that could harm our business.
We may be required to incur debt and expenditures and issue additional shares of our common stock or preferred stock to pay for industrial properties that we may acquire, which may dilute our stockholders’ ownership interests and may reduce or eliminate our profitability. These acquisitions may also expose us to risks such as:
| • | the possibility that we may not be able to successfully integrate acquired properties into our operations; |
| • | the possibility that additional capital expenditures may be required; |
| • | the possibility that senior management may be required to spend considerable time negotiating agreements and integrating acquired properties; |
| • | the possible loss or reduction in value of acquired properties; |
| • | the possibility of pre-existing undisclosed liabilities regarding acquired properties, including but not limited to environmental or asbestos liability, of which our insurance may be insufficient or for which we may be unable to secure insurance coverage; |
| • | the possibility that a concentration of our industrial properties in Los Angeles, the San Francisco Bay Area and Seattle may increase our exposure to seismic activity, especially if these industrial properties are located on or near fault zones; and |
8
Table of Contents
| • | the possibility that we may not meet our estimated forecasts related to stabilized cap rates. |
We expect acquisition costs, including capital expenditures required to render industrial properties operational, to increase in the future. If our revenue does not keep pace with these potential acquisition costs, we may not be able to maintain our current or expected earnings as we absorb these additional expenses. There is no assurance we would successfully overcome these risks or any other problems encountered with these acquisitions.
If we cannot obtain additional financing, our growth will be limited.
If adverse conditions in the credit markets — in particular with respect to real estate — materially deteriorate, our business could be materially and adversely affected. Our long-term ability to grow through investments in industrial properties, including our ability to realize our projections for growth will be limited if we cannot obtain additional financing on favorable terms or at all. In the future, we will rely on equity and debt financing, including issuances of common and perpetual preferred stock, borrowings under our revolving credit facility, term loans, issuances of unsecured debt securities and debt secured by individual properties or pools of properties, to finance our acquisition activities and for working capital. If we are unable to obtain equity or debt financing from these or other sources, or to refinance existing indebtedness upon maturity, our financial condition and results of operations would likely be adversely affected. Market conditions may make it difficult to obtain additional financing, and we cannot assure you that we will be able to obtain additional debt or equity financing or that we will be able to obtain it on favorable terms.
In addition, to qualify as a REIT, we are required to distribute at least 90% of our taxable income (determined before the deduction for dividends paid and excluding any net capital gains) each year to our stockholders, and we generally expect to make distributions in excess of such amount. As a result, our ability to retain earnings to fund acquisitions, redevelopment and expansion, if any, or other capital expenditures will be limited. We have a $100.0 million revolving credit facility to finance acquisitions and for working capital requirements. Terreno guarantees the obligations of the borrower (a wholly-owned subsidiary) under the revolving credit facility. The revolving credit facility matures in May 2018 and provides for one 12-month extension option exercisable by us, subject, among other things, to there being an absence of an event of default and to our payment of an extension fee. As of December 31, 2014, there were no borrowings outstanding on the revolving credit facility.
The availability and timing of cash distributions is uncertain.
In 2013 and 2014, we made quarterly distributions (which we also refer to as dividends, in this Report on Form 10-K and in the other documents we file with the Securities and Exchange Commission) to holders of our common stock and preferred stock and we intend to continue to pay regular quarterly distributions. However, we bear all expenses incurred by our operations, and the funds generated by our operations, after deducting these expenses, may not be sufficient to cover desired levels of distributions to our stockholders. In addition, our board of directors, in its discretion, may retain any portion of such cash for working capital. Our ability to make distributions to our stockholders also will depend on our levels of retained cash flows, which we intend to use as a source of investment capital. We cannot assure our stockholders that sufficient funds will be available to pay distributions. Our corporate strategy is to fund the payment of quarterly distributions to our stockholders entirely from distributable cash flows. However, we may fund our quarterly distributions to our stockholders from a combination of available cash flows, net of recurring capital expenditures, and proceeds from borrowings and property dispositions. In the event we are unable to consistently fund future quarterly distributions to our stockholders entirely from distributable cash flows the value of our shares may be negatively impacted.
We depend on key personnel.
Our success depends to a significant degree upon the contributions of certain key personnel including, but not limited to, our chairman and chief executive officer and our president, each of whom would be difficult to replace. If any of our key personnel were to cease employment with us, our operating results could suffer. Our
9
Table of Contents
ability to retain our senior management group or to attract suitable replacements should any members of the senior management group leave is dependent on the competitive nature of the employment market. The loss of services from key members of the management group or a limitation in their availability could adversely impact our financial condition and cash flows. Further, such a loss could be negatively perceived in the capital markets. We have not obtained and do not expect to obtain key man life insurance on any of our key personnel.
We also believe that, as we expand, our future success depends, in large part, upon our ability to hire and retain highly skilled managerial, investment, financial and operational personnel. Competition for such personnel is intense, and we cannot assure our stockholders that we will be successful in attracting and retaining such skilled personnel.
Failure of the projected improvement in industrial operating fundamentals may adversely affect our ability to execute our business plan.
A substantial part of our business plan is based on our belief that industrial operating fundamentals are expected to improve over the next several years. We cannot assure you as to whether or when industrial operating fundamentals will in fact improve or to what extent they improve. In the event conditions in the industry do not improve when and as we expect, or deteriorate, our ability to execute our business plan may be adversely affected.
Our investments are concentrated in the industrial real estate sector, and our business would be adversely affected by an economic downturn in that sector.
Our investments in real estate assets are concentrated in the industrial real estate sector. This concentration may expose us to the risk of economic downturns in this sector to a greater extent than if our business activities included a more significant portion of other sectors of the real estate industry.
Events or occurrences that affect areas in which our properties are located may materially adversely impact our financial results.
In addition to general, regional, national and international economic conditions that may materially adversely affect our business and financial results, our operating performance will be materially adversely impacted by adverse economic conditions in the specific markets in which we operate and particularly in the markets in which we have significant concentrations of properties. Any downturn in the economy in the real estate market or any of our markets and any failure to accurately predict the timing of any economic improvement in these markets could cause our operations and our revenue and cash available for distribution, including cash available to pay distributions to our stockholders, to be materially adversely affected. For example, as of December 31, 2014, approximately 28.1% of our rentable square feet was located in Northern New Jersey / New York City, representing approximately 27.9% of our total annualized base rent. See “Item 2 – Properties” in this Annual Report on Form 10-K for additional information regarding our ownership of properties in our markets.
We may be unable to renew leases, lease vacant space, including vacant space resulting from tenant defaults, or re-lease space as leases expire.
We cannot assure you that leases at our properties will be renewed or that such properties will be re-leased at net effective rental rates equal to or above the then current average net effective rental rates. In addition, we may be required to grant concessions or fund improvements. If the rental rates for our properties decrease, our tenants do not renew their leases or we do not re-lease a significant portion of our available space, including vacant space resulting from tenant defaults, and space for which leases are scheduled to expire, our financial condition, results of operations, cash flows, cash available for distribution to stockholders, per share trading price of our common stock and preferred stock and our ability to satisfy our debt service obligations could be materially adversely affected. In addition, if we are unable to renew leases or re-lease a property, the resale value of that property could be diminished because the market value of a particular property will depend in part upon the value of the leases of such property.
10
Table of Contents
We face potential adverse effects from the bankruptcies or insolvencies of tenants or from tenant defaults generally.
We are dependent on tenants for our revenues, including certain significant tenants. Moreover, certain of our properties are occupied by a single tenant, and the income produced by these properties depends on the financial stability of that tenant. The bankruptcy or insolvency of the tenants at our properties, or tenant defaults generally, may adversely affect the income produced by our properties. The tenants, particularly those that are highly leveraged, could file for bankruptcy protection or become insolvent in the future. Under bankruptcy law, a tenant cannot be evicted solely because of its bankruptcy. On the other hand, a bankrupt tenant may reject and terminate its lease with us. In such case, our claim against the bankrupt tenant for unpaid and future rent would be subject to a statutory cap that might be substantially less than the remaining rent actually owed under the lease, and, even so, our claim for unpaid rent would likely not be paid in full. This shortfall could adversely affect our cash flows and results of operations and could cause us to reduce the amount of distributions to stockholders.
A default by a tenant on its lease payments could force us to find an alternative source of revenues to pay any mortgage loan or operating expenses on the property. In the event of a tenant default, we may experience delays in enforcing our rights as landlord and may incur substantial costs, including litigation and related expenses, in protecting our investment and re-leasing our property.
Declining real estate valuations and impairment charges could adversely affect our earnings and financial condition.
We review the carrying value of our properties when circumstances, such as adverse market conditions, indicate potential impairment may exist. We base our review on an estimate of the future cash flows (excluding interest charges) expected to result from the real estate investment’s use and eventual disposition. We consider factors such as future operating income, trends and prospects, as well as the effects of leasing demand, competition and other factors. If our evaluation indicates that we may be unable to recover the carrying value of a real estate investment, an impairment loss will be recorded to the extent that the carrying value exceeds the estimated fair value of the property. These losses would have a direct impact on our net income because recording an impairment loss results in an immediate negative adjustment to net income. The evaluation of anticipated cash flows is highly subjective and is based in part on assumptions regarding future occupancy, rental rates and capital requirements that could differ materially from actual results in future periods. A worsening real estate market may cause us to reevaluate the assumptions used in our impairment analysis. Impairment charges could adversely affect our financial condition, results of operations, cash available for distribution, including cash available for us to pay distributions to our stockholders and per share trading price of our common stock and preferred stock.
We utilize local third party managers for day-to-day property management for the majority of our properties.
In general, we prefer to utilize local third party managers for day-to-day property management, although we currently manage one of our properties directly and may directly manage more of our properties in the future. To the extent we utilize third party managers, our cash flows from our industrial properties may be adversely affected if our managers fail to provide quality services. In addition, our managers or their affiliates may manage, and in some cases may own, invest in or provide credit support or operating guarantees to industrial properties that compete with our industrial properties, which may result in conflicts of interest and decisions regarding the operation of our industrial properties that are not in our best interests.
Our real estate redevelopment or expansion strategies may not be successful.
In connection with our business strategy, we may pursue redevelopment opportunities or construct expansions or improvements of industrial properties that we own. We will be subject to risks associated with our redevelopment, renovation and expansion activities that could adversely affect our financial condition, results of operations, cash flows and ability to pay distributions on, and the market price of, our common stock and preferred stock.
11
Table of Contents
We may be required to fund future tenant improvements and we may not have funding for those improvements.
When a tenant at one of our properties does not renew its lease or otherwise vacates its space in one of our buildings in the future, it is likely that, in order to attract one or more new tenants, we will be required to expend funds to construct new tenant improvements in the vacated space. We may also be required to fund tenant improvements to retain tenants. Although we intend to manage our cash position or financing availability to pay for any improvements required for re-leasing, we cannot assure our stockholders that we will have adequate sources of funding available to us for such purposes in the future.
Debt service obligations could adversely affect our overall operating results, may require us to sell industrial properties and could adversely affect our ability to make distributions to our stockholders and the market price of our shares of common stock and preferred stock.
Our business strategy contemplates the use of both non-recourse secured debt and unsecured debt to finance long-term growth. As of December 31, 2014, we had total debt outstanding of approximately $304.5 million, which consisted of our $200.0 million of term loans and mortgage loans payable. While over the long-term we intend to limit the sum of the outstanding principal amount of our consolidated indebtedness and the liquidation preference of any outstanding shares of preferred stock to less than 40% of our total enterprise value, our governing documents contain no limitations on the amount of debt that we may incur, and our board of directors may change our financing policy at any time without stockholder approval. Over the long-term, we also intend to maintain a fixed charge coverage ratio in excess of 2.0x and limit the principal amount of our outstanding floating rate debt to less than 20% of our total consolidated indebtedness. Our board of directors may modify or eliminate these limitations at any time without the approval of our stockholders. As a result, we may be able to incur substantial additional debt, including secured debt, in the future. Our existing debt, and the incurrence of additional debt, could subject us to many risks, including the risks that:
| • | our cash flows from operations will be insufficient to make required payments of principal and interest; |
| • | our debt may increase our vulnerability to adverse economic and industry conditions; |
| • | we may be required to dedicate a substantial portion of our cash flows from operations to payments on our debt, thereby reducing cash available for distribution to our stockholders, funds available for operations and capital expenditures, future business opportunities or other purposes; |
| • | the terms of any refinancing will not be as favorable as the terms of the debt being refinanced; and |
| • | the use of leverage could adversely affect our ability to make distributions to our stockholders and the market price of our shares of common stock and preferred stock. |
If we do not have sufficient funds to repay existing or future debt, including debt under our credit facility, it may be necessary to refinance the debt through additional debt or additional equity financings. If, at the time of any refinancing, prevailing interest rates or other factors result in higher interest rates on refinancings, increases in interest expense would adversely affect our cash flows, and, consequently, cash available for distribution to our stockholders. If we are unable to refinance our debt on acceptable terms, we may be forced to dispose of industrial properties on disadvantageous terms, potentially resulting in losses. We may place mortgages on our properties that we own to secure a revolving credit facility or other debt. To the extent we cannot meet any future debt service obligations, we will risk losing some or all of our industrial properties that may be pledged to secure our obligations to foreclosure. Also, covenants applicable to any future debt could impair our planned investment strategy and, if violated, result in a default.
Higher interest rates could increase debt service requirements on any floating rate debt that we incur and could reduce the amounts available for distribution to our stockholders, as well as reduce funds available for our operations, future business opportunities, or other purposes. In addition, an increase in interest rates could decrease the amount third parties are willing to pay for our assets, thereby limiting our ability to change our
12
Table of Contents
portfolio promptly in response to changes in economic or other conditions. Adverse economic conditions could cause the terms on which we borrow to be unfavorable. We could be required to liquidate one or more of our industrial properties in order to meet our debt service obligations at times which may not permit us to receive an attractive return on our investments.
Our revolving credit facility, our $200.0 million of term loans and certain of our existing mortgage loans payable contain, and we expect that our future indebtedness will contain, covenants that could limit our operations and our ability to make distributions to our stockholders.
We have a credit facility, which consists of a $100.0 million revolving credit facility, a five-year $50.0 million term loan, a seven-year $50.0 million term loan and a five-year $100.0 million term loan. We have agreed to guarantee the obligations of the borrower (a wholly-owned subsidiary) under our revolving credit facility and our term loans. Our revolving credit facility and our term loans and certain of our existing mortgage loans payable contain, and we expect that our future indebtedness will contain, financial and operating covenants, such as fixed charge coverage and debt ratios and other limitations that will limit or restrict our ability to make distributions or other payments to our stockholders and may restrict our investment activities. For example, our credit facility restricts distributions if we are in default and otherwise limits our fiscal year distributions to 95% of our funds from operations. The covenants in our debt agreements may restrict our ability to engage in transactions that we believe would otherwise be in the best interests of our stockholders. Failure to meet our financial covenants could result from, among other things, changes in our results of operations, the incurrence of debt or changes in general economic conditions. In addition, the failure of at least one of our chief executive officer and our president or any successors approved by the administrative agent to continue to be active in our day-to-day management constitutes an event of default under our credit facility. We have 120 days under our revolving credit facility to hire a successor executive reasonably satisfactory to the administrative agent in the event that both our chief executive officer and our president or any successors cease to be active in our management. If we violate covenants or if there is an event of default under our credit facility, our existing mortgage loans payable or in our future agreements, we could be required to repay all or a portion of our indebtedness before maturity at a time when we might be unable to arrange financing for such repayment on attractive terms, if at all.
In addition, any unsecured debt agreements we enter into may contain specific cross-default provisions with respect to specified other indebtedness, giving the unsecured lenders the right to declare a default if we are in default under other loans in some circumstances. Defaults under our debt agreements could materially and adversely affect our financial condition and results of operations.
We may acquire outstanding debt secured by an industrial property, which may expose us to risks.
We may acquire outstanding debt secured by an industrial property from lenders and investors if we believe we can acquire ownership of the underlying property in the near-term through foreclosure, deed-in-lieu of foreclosure or other means. However, if we do acquire such debt, borrowers may seek to assert various defenses to our foreclosure or other actions and we may not be successful in acquiring the underlying property on a timely basis, or at all, in which event we could incur significant costs and experience significant delays in acquiring such properties, all of which could adversely affect our financial performance and reduce our expected returns from such investments. In addition, we may not earn a current return on such investments particularly if the loan that we acquire is in default.
Adverse changes in our credit ratings could negatively affect our financing activity.
The credit ratings of the senior unsecured long-term debt that we may incur in the future and preferred stock we may issue in the future will be based on our operating performance, liquidity and leverage ratios, overall financial position and other factors employed by the credit rating agencies in their rating analyses of us. Our credit ratings can affect the amount of capital we can access, as well as the terms and pricing of any debt we may incur. There can be no assurance that we will be able to obtain or maintain our credit ratings, and in the event our
13
Table of Contents
credit ratings are downgraded, we would likely incur higher borrowing costs and may encounter difficulty in obtaining additional financing. Also, a downgrade in our credit ratings may trigger additional payments or other negative consequences under our future credit facilities and debt instruments. For example, if our credit ratings of any future senior unsecured long-term debt are downgraded to below investment grade levels, we may not be able to obtain or maintain extensions on certain of our then existing debt. Adverse changes in our credit ratings could negatively impact our refinancing activities, our ability to manage our debt maturities, our future growth, our financial condition, the market price of our stock, and our acquisition activities.
Failure to hedge effectively against interest rate changes may adversely affect results of operations.
We may seek to manage our exposure to interest rate volatility by using interest rate hedging arrangements, such as cap contracts and swap agreements. For example, we have executed an interest rate cap to hedge the variable cash flows associated with our existing seven-year $50.0 million variable-rate term loan. These agreements have costs and involve the risks that these arrangements may not be effective in reducing our exposure to interest rate changes and that a court could rule that such agreements are not legally enforceable. Hedging may reduce overall returns on our investments. Failure to hedge effectively against interest rate changes may materially adversely affect our results of operations.
Our property taxes could increase due to property tax rate changes or reassessment, which would impact our cash flows.
Even if we qualify as a REIT for federal income tax purposes, we will be required to pay some state and local taxes on our properties. The real property taxes on our properties may increase as property tax rates change or as our properties are assessed or reassessed by taxing authorities. Therefore, the amount of property taxes we pay in the future may increase substantially. If the property taxes we pay increase, our cash flows will be impacted, and our ability to pay expected distributions to our stockholders could be adversely affected.
Actions of our joint venture partners could negatively impact our performance.
We may acquire and/or redevelop properties through joint ventures, limited liability companies and partnerships with other persons or entities when warranted by the circumstances. Such partners may share certain approval rights over major decisions. Such investments may involve risks not otherwise present with other methods of investment in real estate. We generally will seek to maintain sufficient control of our partnerships, limited liability companies and joint ventures to permit us to achieve our business objectives; however, we may not be able to do so, and the occurrence of one or more of the events described above could adversely affect our financial condition, results of operations, cash flows and ability to pay distributions on, and the market price of, our common stock and our preferred stock.
If we invest in a limited partnership as a general partner, we could be responsible for all liabilities of such partnership.
In some joint ventures or other investments we may make, if the entity in which we invest is a limited partnership, we may acquire all or a portion of our interest in such partnership as a general partner. As a general partner, we could be liable for all the liabilities of such partnership. Additionally, we may be required to take our interests in other investments as a non-managing general partner. Consequently, we would be potentially liable for all such liabilities without having the same rights of management or control over the operation of the partnership as the managing general partner or partners may have. Therefore, we may be held responsible for all of the liabilities of an entity in which we do not have full management rights or control, and our liability may far exceed the amount or value of the investment we initially made or then had in the partnership.
The conflict of interest policies we have adopted may not adequately address all of the conflicts of interest that may arise with respect to our activities.
In order to avoid any actual or perceived conflicts of interest with our directors, officers or employees, we have adopted certain policies to specifically address some of the potential conflicts relating to our activities. In
14
Table of Contents
addition, our board of directors is subject to certain provisions of Maryland law, which are also designed to eliminate or minimize conflicts. Although under these policies the approval of a majority of our disinterested directors is required to approve any transaction, agreement or relationship in which any of our directors, officers or employees has an interest, there is no assurance that these policies will be adequate to address all of the conflicts that may arise or will address such conflicts in a manner that is favorable to us.
Our business could be adversely impacted if we have deficiencies in our disclosure controls and procedures or internal controls over financial reporting.
The design and effectiveness of our disclosure controls and procedures and internal controls over financial reporting may not prevent all errors, misstatements or misrepresentations. While management will continue to review the effectiveness of our disclosure controls and procedures and internal controls over financial reporting, there can be no guarantee that our internal controls over financial reporting will be effective in accomplishing all control objectives all of the time. Deficiencies, including any material weakness, in our internal controls over financial reporting which may occur in the future could result in misstatements of our results of operations, restatements of our financial statements, a decline in our stock price, or otherwise materially adversely affect our business, reputation, results of operations, financial condition or liquidity.
Volatility in the capital and credit markets could materially and adversely impact us.
The capital and credit markets have experienced extreme volatility and disruption in recent years, which has at times made it more difficult to borrow money or raise equity capital. Market volatility and disruption could hinder our ability to obtain new debt financing or refinance our maturing debt on favorable terms or at all. In addition, our future access to the equity markets could be limited. Any such financing or refinancing issues could materially and adversely affect us. Market turmoil and tightening of credit which have occurred in recent years, can lead to an increased lack of consumer confidence and widespread reduction of business activity generally, which also could materially and adversely impact us, including our ability to acquire and dispose of assets on favorable terms or at all. Volatility in capital and credit markets may also have a material adverse effect on the market price of our common stock and preferred stock.
We may not acquire or sell the industrial properties that we have entered into agreements to acquire or sell or with respect to which we have entered into non-binding letters of intent.
We have entered into agreements with third-party sellers to acquire five properties containing 641,593 square feet, a non-binding letter of intent with a third-party seller to acquire one industrial property containing 34,200 square feet and an agreement with a third-party purchaser to sell one property containing 84,961 square feet as more fully described under the heading “Contractual Obligations” in this Annual Report on Form 10-K. There is no assurance that we will acquire or sell the properties under contract or non-binding letter of intent because the proposed acquisitions and disposition are subject to the completion of satisfactory due diligence, various closing conditions and with respect to one of the properties, the consent of the mortgage lender, and, in addition, with respect to the property under non-binding letter of intent, our entry into a purchase and sale agreement. There is no assurance that such proposed acquisitions and disposition, if completed, will be completed on the timeframe we expect. If we do not complete the acquisition or disposition of the properties under contract and letter of intent, we will have incurred expenses without our stockholders realizing any benefit from the acquisition or disposition of such properties.
We face risks associated with security breaches through cyber-attacks, cyber intrusions or otherwise, as well as other significant disruptions of our information technology (IT) networks and related systems.
We face risks associated with security breaches, whether through cyber-attacks or cyber intrusions over the Internet, malware, computer viruses, attachments to e-mails, people with access or who gain access to our systems and other significant disruptions of our IT networks and related systems. The risk of a security breach or disruption, particularly through cyber-attack or cyber intrusion, including by computer hackers, foreign
15
Table of Contents
governments and cyber terrorists, has generally increased as the number, intensity and sophistication of attempted attacks and intrusions from around the world have increased. Our IT networks and related systems are essential to the operation of our business and our ability to perform day-to-day operations and, in some cases, may be critical to the operations of certain of our tenants. Although we make efforts to maintain the security and integrity of our IT networks and related systems, and we have implemented various measures to manage the risk of a security breach or disruption, there can be no assurance that our security efforts and measures will be effective or that attempted security breaches or disruptions would not be successful or damaging. Even the most well protected information, networks, systems and facilities remain potentially vulnerable because the techniques used in such attempted security breaches evolve and generally are not recognized until launched against a target, and in some cases are designed to not be detected and, in fact, may not be detected. Accordingly, we may be unable to anticipate these techniques or to implement adequate security barriers or other preventative measures.
A security breach or other significant disruption involving our IT networks and related systems could significantly disrupt the proper functioning of our networks and systems and significantly disrupt our operations, which could ultimately have a material adverse effect on our financial condition, results of operations, cash flows and ability to pay distributions on, and the market price of, our common stock and our preferred stock.
Risks Related to the Real Estate Industry
Our performance and value are subject to general economic conditions and risks associated with our real estate assets.
The investment returns available from equity investments in real estate depend on the amount of income earned and capital appreciation generated by the properties, as well as the expenses incurred in connection with the properties. If our properties do not generate income sufficient to meet operating expenses, including debt service and capital expenditures, then our ability to pay distributions to our stockholders could be adversely affected. In addition, there are significant expenditures associated with an investment in real estate (such as mortgage payments, real estate taxes and maintenance costs) that generally do not decline when circumstances reduce the income from the property. Income from and the value of our properties may be adversely affected by:
| • | downturns in national, regional and local economic conditions (particularly increases in unemployment); |
| • | the attractiveness of our properties to potential tenants and competition from other industrial properties; |
| • | changes in supply of or demand for similar or competing properties in an area; |
| • | bankruptcies, financial difficulties or lease defaults by the tenants of our properties; |
| • | adverse capital and credit market conditions, which may restrict our operating activities; |
| • | changes in interest rates, availability and terms of debt financing; |
| • | changes in operating costs and expenses and our ability to control rents; |
| • | changes in, or increased costs of compliance with, governmental rules, regulations and fiscal policies, including changes in tax, real estate, environmental and zoning laws, and our potential liability thereunder; |
| • | our ability to provide adequate maintenance and insurance; |
| • | changes in the cost or availability of insurance, including coverage for mold or asbestos; |
| • | unanticipated changes in costs associated with known adverse environmental conditions or retained liabilities for such conditions; |
| • | periods of high interest rates; |
| • | tenant turnover; |
16
Table of Contents
| • | re-leasing that may require concessions or reduced rental rates under the new leases due to reduced demand; |
| • | general overbuilding or excess supply in the market area; |
| • | disruptions in the global supply chain caused by political, regulatory or other factors including terrorism; and |
| • | the effects of deflation, including credit market dislocation, weakened consumer demand and a decline in general price levels. |
In addition, periods of economic slowdown or recession, rising interest rates or declining demand for real estate, or public perception that any of these events may occur, would result in a general decrease in rents or an increased occurrence of defaults under existing leases, which would adversely affect our financial condition and results of operations. Future terrorist attacks may result in declining economic activity, which could reduce the demand for, and the value of, our properties. To the extent that future attacks impact the tenants of our properties, their businesses similarly could be adversely affected, including their ability to continue to honor their existing leases. For these and other reasons, we cannot assure our stockholders that we will be profitable or that we will realize growth in the value of our real estate properties.
Actions by our competitors may decrease or prevent increases in the occupancy and rental rates of our properties.
We compete with other developers, owners and operators of real estate, some of which own properties similar to our properties in the same markets and submarkets in which the properties we own are located. If our competitors offer space at rental rates below current market rates or below the rental rates we will charge the tenants of our properties, we may lose existing or potential tenants, and we may be pressured to reduce our rental rates or offer tenant concessions or favorable lease terms in order to retain tenants when such tenants’ leases expire or attract new tenants. In addition, if our competitors sell assets similar to assets we intend to divest in the same markets and/or at valuations below our valuations for comparable assets, we may be unable to divest our assets at all or at favorable pricing or on favorable terms. As a result of these actions by our competitors, our financial condition, cash flows, cash available for distribution, trading price of our common stock and preferred stock and ability to satisfy our debt service obligations could be materially adversely affected.
Real estate investments are not as liquid as other types of assets, which may reduce economic returns to investors.
Real estate investments are not as liquid as other types of investments, and this lack of liquidity may limit our ability to react promptly to changes in economic, financial, investment or other conditions. In addition, significant expenditures associated with real estate investments, such as mortgage payments, real estate taxes and maintenance costs, are generally not reduced when circumstances cause a reduction in income from the investments. In addition, we intend to comply with the safe harbor rules relating to the number of properties that can be disposed of in a year, the tax bases and the costs of improvements made to these properties, and meet other tests which enable a REIT to avoid punitive taxation on the sale of assets. Thus, our ability at any time to sell assets or contribute assets to property funds or other entities in which we have an ownership interest may be restricted. This lack of liquidity may limit our ability to vary our portfolio promptly in response to changes in economic, financial, investment or other conditions and, as a result, could adversely affect our financial condition, results of operations, cash flows and our ability to pay distributions on, and the market price of, our common stock and preferred stock.
Uninsured or underinsured losses relating to real property may adversely affect our returns.
We will attempt to ensure that all of our properties are adequately insured to cover casualty losses. However, there are certain losses, including losses from floods, hurricanes, fires, earthquakes and other natural
17
Table of Contents
disasters, acts of war, acts of terrorism or riots, that are not generally insured against or that are not generally fully insured against because it is not deemed economically feasible or prudent to do so. In addition, changes in the cost or availability of insurance could expose us to uninsured casualty losses. In the event that any of our properties incurs a casualty loss that is not fully covered by insurance, the value of our assets will be reduced by the amount of any such uninsured loss, and we could experience a significant loss of capital invested and potential revenues in these properties and could potentially remain obligated under any recourse debt associated with the property. Inflation, changes in building codes and ordinances, environmental considerations and other factors might also keep us from using insurance proceeds to replace or renovate a property after it has been damaged or destroyed. Under those circumstances, the insurance proceeds we receive might be inadequate to restore our economic position on the damaged or destroyed property. Any such losses could adversely affect our financial condition, results of operations, cash flows and ability to pay distributions on, and the market price of, our common stock. In addition, we may have no source of funding to repair or reconstruct the damaged property, and we cannot assure that any such sources of funding will be available to us for such purposes in the future.
We own properties in Los Angeles, the San Francisco Bay Area and Seattle, which are located in areas that are known to be subject to earthquake activity. Although we carry replacement-cost earthquake insurance on all of our properties located in areas historically subject to seismic activity, subject to coverage limitations and deductibles that we believe are commercially reasonable, we may not be able to obtain coverage to cover all losses with respect to such properties on economically favorable terms, which could expose us to uninsured casualty losses. We intend to evaluate our earthquake insurance coverage annually in light of current industry practice.
We own properties located in areas which are known to be subject to hurricane and/or flood risk. Although we carry replacement-cost hurricane and/or flood hazard insurance on all of our properties located in areas historically subject to such activity, subject to coverage limitations and deductibles that we believe are commercially reasonable, we may not be able to obtain coverage to cover all losses with respect to such properties on economically favorable terms, which could expose us to uninsured casualty losses. We intend to evaluate our insurance coverage annually in light of current industry practice.
Contingent or unknown liabilities could adversely affect our financial condition.
We may own or acquire properties that are subject to liabilities and without any recourse, or with only limited recourse, with respect to unknown liabilities. As a result, if a liability were asserted against us based upon ownership of any of these entities or properties, then we might have to pay substantial sums to settle it, which could adversely affect our cash flows. Unknown liabilities with respect to entities or properties acquired might include:
| • | liabilities for clean-up or remediation of adverse environmental conditions; |
| • | accrued but unpaid liabilities incurred in the ordinary course of business; |
| • | tax liabilities; and |
| • | claims for indemnification by the general partners, officers and directors and others indemnified by the former owners of the properties. |
We may from time to time be subject to litigation that may negatively impact our cash flow, financial condition, results of operations and market price of our common stock.
We may from time to time be a defendant in lawsuits and regulatory proceedings relating to our business. Such litigation and proceedings may result in defense costs, settlements, fines or judgments against us, some of which may not be covered by insurance. Due to the inherent uncertainties of litigation and regulatory proceedings, we cannot accurately predict the ultimate outcome of any such litigation or proceedings. An unfavorable outcome could negatively impact our cash flow, financial condition, results of operations and trading price of our common stock.
18
Table of Contents
Environmentally hazardous conditions may adversely affect our operating results.
Under various federal, state and local environmental laws, a current or previous owner or operator of real property may be liable for the cost of removing or remediating hazardous or toxic substances on such property. Such laws often impose liability whether or not the owner or operator knew of, or was responsible for, the presence of such hazardous or toxic substances. Even if more than one person may have been responsible for the contamination, each person covered by applicable environmental laws may be held responsible for all of the clean-up costs incurred. In addition, third parties may sue the owner or operator of a site for damages based on personal injury, natural resource or property damage or other costs, including investigation and clean-up costs, resulting from the environmental contamination. The presence of hazardous or toxic substances on one of our properties, or the failure to properly remediate a contaminated property, could give rise to a lien in favor of the government for costs it may incur to address the contamination, or otherwise adversely affect our ability to sell or lease the property or borrow using the property as collateral. Environmental laws also may impose restrictions on the manner in which property may be used or businesses may be operated. A property owner who violates environmental laws may be subject to sanctions which may be enforced by governmental agencies or, in certain circumstances, private parties. In connection with the acquisition and ownership of our properties, we may be exposed to such costs. The cost of defending against environmental claims, of compliance with environmental regulatory requirements or of remediating any contaminated property could materially adversely affect our business, assets or results of operations and, consequently, amounts available for distribution to our stockholders.
Environmental laws in the U.S. also require that owners or operators of buildings containing asbestos properly manage and maintain the asbestos, adequately inform or train those who may come into contact with asbestos and undertake special precautions, including removal or other abatement, in the event that asbestos is disturbed during building renovation or demolition. These laws may impose fines and penalties on building owners or operators who fail to comply with these requirements and may allow third parties to seek recovery from owners or operators for personal injury associated with exposure to asbestos. Some of our properties may contain asbestos-containing building materials.
We invest in properties historically used for industrial, manufacturing and commercial purposes. Some of these properties contain, or may have contained, underground storage tanks for the storage of petroleum products and other hazardous or toxic substances. All of these operations create a potential for the release of petroleum products or other hazardous or toxic substances. Some of our properties may be adjacent to or near other properties that have contained or currently contain underground storage tanks used to store petroleum products or other hazardous or toxic substances. In addition, certain of our properties may be on or are adjacent to or near other properties upon which others, including former owners or tenants of such properties, have engaged, or may in the future engage, in activities that may release petroleum products or other hazardous or toxic substances. As needed, we may obtain environmental insurance policies on commercially reasonable terms that provide coverage for potential environmental liabilities, subject to the policy’s coverage conditions and limitations. From time to time, we may acquire properties, or interests in properties, with known adverse environmental conditions where we believe that the environmental liabilities associated with these conditions are quantifiable and that the acquisition will yield a superior risk-adjusted return. In such an instance, we underwrite the costs of environmental investigation, clean-up and monitoring into the cost. Further, in connection with property dispositions, we may agree to remain responsible for, and to bear the cost of, remediating or monitoring certain environmental conditions on the properties.
We generally obtain Phase I environmental site assessments on each property prior to acquiring it and we generally anticipate that the properties that we may acquire in the future may be subject to a Phase I or similar environmental assessment by independent environmental consultants at the time of acquisition. Phase I assessments are intended to discover and evaluate information regarding the environmental condition of the surveyed property and surrounding properties. Phase I assessments generally include a historical review, a public records review, an investigation of the surveyed site and surrounding properties, and preparation and issuance of a written report, but do not include soil sampling or subsurface investigations and typically do not include an
19
Table of Contents
asbestos survey. Even if none of our environmental assessments of our properties reveal an environmental liability that we believe would have a material adverse effect on our business, financial condition or results of operations taken as a whole, we cannot give any assurance that such conditions do not exist or may not arise in the future. Material environmental conditions, liabilities or compliance concerns may arise after the environmental assessment has been completed. Moreover, there can be no assurance that (i) future laws, ordinances or regulations will not impose any material environmental liability or (ii) the environmental condition of our properties will not be affected by tenants, by the condition of land or operations in the vicinity of such properties (such as releases from underground storage tanks), or by third parties unrelated to us.
Costs of complying with governmental laws and regulations with respect to our properties may adversely affect our income and the cash available for any distributions.
All real property and the operations conducted on real property are subject to federal, state and local laws and regulations relating to environmental protection and human health and safety. Tenants’ ability to operate and to generate income to pay their lease obligations may be affected by permitting and compliance obligations arising under such laws and regulations. Some of these laws and regulations may impose joint and several liability on tenants, owners or operators for the costs to investigate or remediate contaminated properties, regardless of fault or whether the acts causing the contamination were legal. Leasing our properties to tenants that engage in industrial, manufacturing, and commercial activities will cause us to be subject to the risk of liabilities under environmental laws and regulations. In addition, the presence of hazardous or toxic substances, or the failure to properly remediate these substances, may adversely affect our ability to sell, rent or pledge such property as collateral for future borrowings.
Some of these laws and regulations have been amended so as to require compliance with new or more stringent standards as of future dates. Compliance with new or more stringent laws or regulations or stricter interpretation of existing laws may require us to incur material expenditures. Future laws, ordinances or regulations may impose material environmental liability. Additionally, the operations of the tenants of our properties, the existing condition of the land, operations in the vicinity of such properties, such as the presence of underground storage tanks, or activities of unrelated third parties may affect such properties. In addition, there are various local, state and federal fire, health, life-safety and similar regulations with which we may be required to comply and which may subject us to liability in the form of fines or damages for noncompliance. Any material expenditures, fines or damages we must pay will reduce our ability to make distributions and may reduce the value of our common stock. In addition, changes in these laws and governmental regulations, or their interpretation by agencies or the courts, could occur.
The impacts of climate-related initiatives at the U.S. federal and state levels remain uncertain at this time but could result in increased operating costs.
Government authorities and various interest groups are promoting laws and regulations that could limit greenhouse gas, or GHG, emissions due to concerns over contributions to climate change. The United States Environmental Protection Agency, or EPA, is moving to regulate GHG emissions from large stationary sources, including electricity producers, and mobile sources, through fuel efficiency and other requirements, using its existing authority under the Clean Air Act. Moreover, certain state and regional programs, such as those adopted by California and the Regional Greenhouse Gas Initiative of various northeastern states, are being implemented to require reductions in GHG emissions. Any additional taxation or regulation of energy use, including as a result of (i) the regulations that EPA has proposed or may propose in the future, (ii) state programs and regulations, or (iii) renewed GHG legislative efforts by future Congresses, could result in increased operating costs that we may not be able to effectively pass on to our tenants. In addition, any increased regulation of GHG emissions could impose substantial costs on our tenants. These costs include, for example, an increase in the cost of the fuel and other energy purchased by our tenants and capital costs associated with updating or replacing their trucks earlier than planned. Any such increased costs could impact the financial condition of our tenants and their ability to meet their lease obligations and to lease or re-lease our properties.
20
Table of Contents
We are exposed to the potential impacts of future climate change and climate-change related risks.
We may be exposed to potential physical risks from possible future changes in climate. Our properties may be exposed to rare catastrophic weather events, such as severe storms or floods. If the frequency of extreme weather events increases due to climate change, our exposure to these events could increase.
Compliance or failure to comply with the Americans with Disabilities Act and other similar regulations could result in substantial costs.
Under the Americans with Disabilities Act, places of public accommodation must meet certain federal requirements related to access and use by disabled persons. Noncompliance could result in the imposition of fines by the federal government or the award of damages to private litigants. If we are required to make unanticipated expenditures to comply with the Americans with Disabilities Act, including removing access barriers, then our cash flows and the amounts available for distributions to our stockholders may be adversely affected. If we are required to make substantial modifications to our properties, whether to comply with the Americans with Disabilities Act or other changes in governmental rules and regulations, our financial condition, cash flows, results of operations, the market price of our shares of common stock and preferred stock and our ability to make distributions to our stockholders could be adversely affected.
We may be unable to sell a property if or when we decide to do so, including as a result of uncertain market conditions, which could adversely affect the return on an investment in our common stock and our preferred stock.
We expect to hold the various real properties in which we invest until such time as we decide that a sale or other disposition is appropriate given our investment objectives. Our ability to dispose of properties on advantageous terms or at all depends on factors beyond our control, including competition from other sellers and the availability of attractive financing for potential buyers of our properties. We cannot predict the various market conditions affecting real estate investments which will exist at any particular time in the future. Due to the uncertainty of market conditions which may affect the future disposition of our properties, we cannot assure our stockholders that we will be able to sell such properties at a profit or at all in the future. Accordingly, the extent to which our stockholders will receive cash distributions and realize potential appreciation on our real estate investments will be dependent upon fluctuating market conditions.
Furthermore, we may be required to expend funds to correct defects or to make improvements before a property can be sold. We cannot assure our stockholders that we will have funds available to correct such defects or to make such improvements. In acquiring a property, we may agree to restrictions that prohibit the sale of that property for a period of time or impose other restrictions, such as a limitation on the amount of debt that can be placed or repaid on that property. These provisions would restrict our ability to sell a property.
If we sell properties and provide financing to purchasers, defaults by the purchasers would adversely affect our cash flows.
If we decide to sell any of our properties, we presently intend to sell them for cash. However, if we provide financing to purchasers, we will bear the risk that the purchaser may default, which could negatively impact our cash distributions to stockholders and result in litigation and related expenses. Even in the absence of a purchaser default, the distribution of the proceeds of sales to our stockholders, or their reinvestment in other assets, will be delayed until the promissory notes or other property we may accept upon a sale are actually paid, sold, refinanced or otherwise disposed of.
Risks Related to Our Organizational Structure
Our board of directors may change significant corporate policies without stockholder approval.
Our investment, financing, borrowing and distribution policies and our policies with respect to all other activities, including growth, debt, capitalization and operations, are determined by our board of directors. These policies may be amended or revised at any time and from time to time at the discretion of the board of directors
21
Table of Contents
without a vote of our stockholders. In addition, the board of directors may change our policies with respect to conflicts of interest provided that such changes are consistent with applicable legal and regulatory requirements, including the listing standards of the NYSE. A change in these policies could have an adverse effect on our financial condition, results of operations, cash flows, per share trading price of our common stock and preferred stock and ability to satisfy our debt service obligations and to pay distributions to our stockholders.
We could increase the number of authorized shares of stock and issue stock without stockholder approval.
Subject to applicable legal and regulatory requirements, our charter authorizes our board of directors, without stockholder approval, to increase the aggregate number of authorized shares of stock or the number of authorized shares of stock of any class or series, to issue authorized but unissued shares of our common stock or preferred stock and to classify or reclassify any unissued shares of our common stock or preferred stock and to set the preferences, rights and other terms of such classified or unclassified shares. Our board of directors could establish a series of preferred stock that could, depending on the terms of such series, delay, defer or prevent a transaction or a change of control that might involve a premium price for our common stock or otherwise be in the best interest of our stockholders.
Certain provisions of Maryland law could inhibit changes in control.
Certain provisions of the Maryland General Corporation Law, or MGCL, may have the effect of inhibiting or deterring a third party from making a proposal to acquire us or of impeding a change of control under circumstances that otherwise could provide the holders of shares of our common stock with the opportunity to realize a premium over the then-prevailing market price of such shares, including:
| • | “Business Combination” provisions that, subject to limitations, prohibit certain business combinations between us and an “interested stockholder” (defined generally as any person who beneficially owns 10% or more of the voting power of our shares or an affiliate or associate of ours who, at any time within the two-year period prior to the date in question, was the beneficial owner of 10% or more of our then outstanding voting shares) or an affiliate of an interested stockholder for five years after the most recent date on which the stockholder becomes an interested stockholder, and thereafter may impose special appraisal rights and special stockholder voting requirements on these combinations; and |
| • | “Control Share” provisions that provide that “control shares” of our company (defined as shares which, when aggregated with other shares controlled by the stockholder, entitle the stockholder to exercise one of three increasing ranges of voting power in electing directors) acquired in a “control share acquisition” (defined as the direct or indirect acquisition of ownership or control of “control shares”) have no voting rights except to the extent approved by our stockholders by the affirmative vote of at least two-thirds of all the votes entitled to be cast on the matter, excluding all interested shares. |
We have opted out of these provisions of the MGCL, in the case of the business combination provisions of the MGCL by resolution of our board of directors, and in the case of the control share provisions of the MGCL pursuant to a provision in our bylaws. However, in the future, only upon the approval of our stockholders, our board of directors may by resolution elect to opt in to the business combination provisions of the MGCL and we may, only upon the approval of our stockholders, by amendment to our bylaws, opt in to the control share provisions of the MGCL.
In addition, the provisions of our charter on removal of directors and the advance notice provisions of our bylaws could delay, defer or prevent a transaction or a change of control of our company that might involve a premium price for holders of our common stock or otherwise be in their best interest. Likewise, if our company’s board of directors were to opt in to the business combination provisions of the MGCL or the provisions of Title 3, Subtitle 8 of the MGCL, or if the provision in our bylaws opting out of the control share acquisition provisions of the MGCL were rescinded by our board of directors and our stockholders, these provisions of the MGCL could have similar anti-takeover effects.
22
Table of Contents
Our rights and the rights of our stockholders to take action against our directors and officers are limited.
Maryland law provides that a director or officer has no liability in that capacity if he or she satisfies his or her duties to us and our stockholders. Our charter limits the liability of our directors and officers to us and our stockholders for money damages, except for liability resulting from:
| • | actual receipt of an improper benefit or profit in money, property or services; or |
| • | a final judgment based upon a finding of active and deliberate dishonesty by the director or officer that was material to the cause of action adjudicated. |
In addition, our charter will authorize us to obligate our company, and our bylaws will require us, to indemnify our directors and officers for actions taken by them in those capacities to the maximum extent permitted by Maryland law. As a result, we and our stockholders may have more limited rights against our directors and officers than might otherwise exist. Accordingly, in the event that actions taken in good faith by any of our directors or officers impede the performance of our company, your ability to recover damages from such director or officer will be limited. In addition, we may be obligated to advance the defense costs incurred by our directors and executive officers, and may, in the discretion of our board of directors, advance the defense costs incurred by our employees and other agents in connection with legal proceedings.
Risks Related to Our Status as a REIT
Failure to qualify as a REIT would cause us to be taxed as a regular corporation, which would substantially reduce funds available for distributions to stockholders.
We believe that our organization and method of operation has enabled and will continue to enable us to meet the requirements for qualification and taxation as a REIT. However, we cannot assure you that we will qualify as such. This is because qualification as a REIT involves the application of highly technical and complex provisions of the Code as to which there are only limited judicial and administrative interpretations and involves the determination of facts and circumstances not entirely within our control. Future legislation, new regulations, administrative interpretations or court decisions may significantly change the tax laws or the application of the tax laws with respect to qualification as a REIT for federal income tax purposes or the federal income tax consequences of such qualification.
If we fail to qualify as a REIT in any taxable year we will face serious tax consequences that will substantially reduce the funds available for distributions to our stockholders because:
| • | we would not be allowed a deduction for distributions paid to stockholders in computing our taxable income and would be subject to federal income tax at regular corporate rates; |
| • | we could be subject to the federal alternative minimum tax and possibly increased state and local taxes; and |
| • | unless we are entitled to relief under statutory provisions, we could not elect to be taxed as a REIT for four taxable years following the year during which we were disqualified. |
In addition, if we fail to qualify as a REIT, we will no longer be required to pay distributions. As a result of all these factors, our failure to qualify as a REIT could impair our ability to expand our business and raise capital, and it could adversely affect the value of our common stock.
Even if we qualify as a REIT, we may face other tax liabilities that reduce our cash flows.
Even if we qualify for taxation as a REIT, we may be subject to certain federal, state and local taxes on our income and assets, including taxes on any undistributed income, tax on income from some activities conducted as a result of a foreclosure, and state or local income, property and transfer taxes. Any of these taxes would decrease cash available for distributions to stockholders.
23
Table of Contents
REIT distribution requirements could adversely affect our liquidity and may force us to borrow funds or sell assets during unfavorable market conditions.
In order to maintain our REIT status and to meet the REIT distribution requirements, we may need to borrow funds on a short-term basis or sell assets, even if the then-prevailing market conditions are not favorable for these borrowings or sales. To qualify as a REIT, we generally must distribute to our stockholders at least 90% of our net taxable income each year, excluding capital gains. In addition, we will be subject to corporate income tax to the extent we distribute less than 100% of our net taxable income including any net capital gain. We intend to make distributions to our stockholders to comply with the requirements of the Code for REITs and to minimize or eliminate our corporate income tax obligation to the extent consistent with our business objectives. Our cash flows from operations may be insufficient to fund required distributions as a result of differences in timing between the actual receipt of income and the recognition of income for federal income tax purposes, or the effect of non-deductible capital expenditures, the creation of reserves or required debt service or amortization payments. The insufficiency of our cash flows to cover our distribution requirements could have an adverse impact on our ability to raise short- and long-term debt or sell equity securities in order to fund distributions required to maintain our REIT status. In addition, we will be subject to a 4% nondeductible excise tax on the amount, if any, by which distributions paid by us in any calendar year are less than the sum of 85% of our ordinary income, 95% of our capital gain net income and 100% of our undistributed income from prior years.
Dividends payable by REITs generally do not qualify for reduced tax rates.
Currently, the maximum tax rate for qualified dividends payable to individual U.S. stockholders is 20%. Dividends payable by REITs, however, are generally not eligible for such reduced rates. However, to the extent such dividends are attributable to certain dividends that we receive from a taxable REIT subsidiary (“TRS”), such dividends generally will be eligible for the reduced rates that apply to qualified dividend income. While we currently do not own any interest in a TRS, we may own any such interest in the future. The more favorable rates applicable to regular corporate dividends could cause investors who are individuals to perceive investments in REITs to be relatively less attractive than investments in the stocks of non-REIT corporations that pay dividends, which could adversely affect the value of the stock of REITs, including our common stock.
We may in the future choose to pay dividends in our stock instead of cash, in which case stockholders may be required to pay income taxes in excess of the cash dividends they receive.
We may, in the future, distribute taxable dividends that are payable in cash and common stock at the election of each stockholder or distribute other forms of taxable stock dividends. Taxable stockholders receiving such dividends or other forms of taxable stock dividends will be required to include the full amount of the dividend as ordinary income to the extent of our current and accumulated earnings and profits for U.S. federal income tax purposes. As a result, stockholders may be required to pay income taxes with respect to such dividends in excess of the cash dividends received. If a U.S. stockholder sells the stock that it receives as a dividend in order to pay this tax, the sales proceeds may be less than the amount included in income with respect to the dividend, depending on the market price of our stock at the time of the sale. Furthermore, with respect to certain non-U.S. stockholders, we may be required to withhold U.S. federal income tax with respect to such dividends, including in respect of all or a portion of such dividend that is payable in stock. In addition, if a significant number of our stockholders determine to sell common stock in order to pay taxes owed on dividends, it may put downward pressure on the trading price of our common stock.
Complying with REIT requirements may cause us to forego otherwise attractive opportunities or to liquidate otherwise attractive investments.
To qualify as a REIT for federal income tax purposes, we must continually satisfy tests concerning, among other things, the sources of our income, the nature and diversification of our assets, the amounts we distribute to our stockholders and the ownership of our capital stock. In order to meet these tests, we may be required to forego investments we might otherwise make. Thus, compliance with the REIT requirements may hinder our performance.
24
Table of Contents
In particular, we must ensure that at the end of each calendar quarter, at least 75% of the value of our assets consists of cash, cash items, government securities and qualified real estate assets. The remainder of our investments in securities (other than government securities and qualified real estate assets) generally cannot include more than 10% of the total voting power of the outstanding securities of any one issuer or more than 10% of the total value of the outstanding securities of any one issuer. In addition, in general, no more than 5% of the value of our assets (other than government securities and qualified real estate assets) can consist of the securities of any one issuer, and no more than 25% of the value of our total assets can be represented by the securities of one or more taxable REIT subsidiaries, or TRSs. If we fail to comply with these requirements at the end of any calendar quarter, we must correct the failure within 30 days after the end of the calendar quarter or qualify for certain statutory relief provisions to avoid losing our REIT qualification and suffering adverse tax consequences. As a result, we may be required to liquidate otherwise attractive investments. These actions could have the effect of reducing our income and amounts available for distribution to our stockholders.
Our relationship with any TRS will be limited, and a failure to comply with the limits would jeopardize our REIT qualification and may result in the application of a 100% excise tax.
A REIT may own up to 100% of the stock of one or more TRSs. While we currently do not own any interest in a TRS, we may own any such interest in the future. A TRS may earn income that would not be qualifying income if earned directly by the parent REIT. Overall, no more than 25% of the value of a REIT’s assets may consist of stock or securities of one or more TRSs. A domestic TRS will pay federal, state and local income tax at regular corporate rates on any income that it earns. In addition, the TRS rules limit the deductibility of interest paid or accrued by a TRS to its parent REIT to assure that the TRS is subject to an appropriate level of corporate taxation. The rules also impose a 100% excise tax on certain transactions between a TRS and its parent REIT that are not conducted on an arm’s-length basis.
Any TRS of ours will pay federal, state and local income tax on its taxable income, and its after-tax net income will be available (but not required) to be distributed to us. We anticipate that the aggregate value of any TRS stock and securities owned by us will be significantly less than 25% of the value of our total assets (including the TRS stock and securities). Furthermore, we will monitor the value of our investments in TRSs for the purpose of ensuring compliance with the rule that no more than 25% of the value of our assets may consist of TRS stock and securities (which is applied at the end of each calendar quarter). In addition, we will scrutinize all of our transactions with TRSs for the purpose of ensuring that they are entered into on arm’s-length terms in order to avoid incurring the 100% excise tax described above. No assurance, however, can be given that we will be able to comply with the 25% limitation on ownership of TRS stock and securities on an ongoing basis so as to maintain our REIT qualification or avoid application of the 100% excise tax imposed on certain non-arm’s-length transactions.
The ability of our board of directors to revoke our REIT qualification without stockholder approval may subject us to federal income tax and reduce distributions to our stockholders.
Our charter provides that our board of directors may revoke or otherwise terminate our REIT election, without the approval of our stockholders, if it determines that it is no longer in our best interest to continue to be qualified as a REIT. If we cease to be a REIT, we would become subject to federal income tax on our taxable income and would no longer be required to distribute most of our taxable income to our stockholders, which may have adverse consequences on our total return to our stockholders and on the market price of our common stock.
We may be subject to adverse legislative or regulatory tax changes that could reduce the market price of our common stock and preferred stock.
At any time, the federal income tax laws governing REITs or the administrative interpretations of those laws may be amended. We cannot predict when or if any new federal income tax law, regulation, or administrative interpretation, or any amendment to any existing federal income tax law, regulation or administrative
25
Table of Contents
interpretation, will be adopted, promulgated or become effective and any such law, regulation, or interpretation may take effect retroactively. We and our stockholders could be adversely affected by any such change in, or any new, federal income tax law, regulation or administrative interpretation.
Risks Related to Our Common Stock and Our Preferred Stock
Level of cash distributions, market interest rates and other factors may affect the value of our common stock and our preferred stock.
The market value of the equity securities of a REIT is based upon the market’s perception of the REIT’s growth potential and its current and potential future cash distributions, whether from operations, sales or refinancings, and upon the real estate market value of the underlying assets. Our common stock may trade at prices that are higher or lower than our net asset value per share. To the extent we retain operating cash flows for investment purposes, working capital reserves or other purposes, these retained funds, while increasing the value of our underlying assets, may not correspondingly increase the market price of our common stock. Our failure to meet the market’s expectations with regard to future earnings and cash distributions likely would adversely affect the market price of our common stock. In addition, the price of our common stock and our preferred stock will be influenced by the dividend yield on the common stock and preferred stock relative to market interest rates and the dividend yields of other REITs. An increase in market interest rates, which are currently at low levels relative to historical rates, could cause the market price of our common stock or our preferred stock to go down. The trading price of the shares of common stock and preferred stock will also depend on many other factors, which may change from time to time, including:
| • | the market for similar securities; |
| • | the attractiveness of REIT securities in comparison to the securities of other companies, taking into account, among other things, the higher tax rates imposed on dividends paid by REITs; |
| • | government action or regulation; |
| • | our issuance of debt or preferred equity securities; |
| • | changes in earnings estimates by analysts and our ability to meet analysts’ earnings estimates; |
| • | general economic conditions; and |
| • | our financial condition, performance and prospects. |
The number of shares of our common stock available for future sale could adversely affect the market price of our common stock and our preferred stock and have a dilutive effect to our existing stockholders.
Sales of substantial amounts of shares of our common stock and preferred stock in the public market or the perception that such sales might occur could adversely affect the market price of the shares of our common stock and preferred stock, respectively. The vesting of any restricted stock granted to certain directors, executive officers and other employees under our Amended and Restated 2010 Equity Incentive Plan, the issuance of our common stock in connection with property, portfolio or business acquisitions and other issuances of our common stock and preferred stock could have an adverse effect on the market price of our common stock and preferred stock. Future sales of shares of our common stock or preferred stock may be dilutive to existing stockholders.
The market price and trading volume of our common stock and preferred stock may be volatile.
The market price of our common stock and preferred stock may be volatile. In addition, the trading volume in our common stock and preferred stock may fluctuate and cause significant price variations to occur. If the market price of our common stock or preferred stock declines significantly, you may be unable to resell your shares at or above the price you paid for such shares. We cannot assure you that the market price of our common stock or preferred stock will not fluctuate or decline significantly in the future.
26
Table of Contents
Some of the factors that could negatively affect our share price or result in fluctuations in the price or trading volume of our common stock and preferred stock include:
| • | our financial condition, performance, liquidity and prospects; |
| • | actual or anticipated variations in our quarterly operating results or distributions; |
| • | changes in our funds from operations (as defined by NAREIT and discussed in “Management’s Discussion and Analysis of Financial Condition and Results of Operations” elsewhere in this Annual Report on Form 10-K) or earnings; |
| • | publication of research reports about us or the real estate industry; |
| • | changes in earnings estimates by analysts; |
| • | our ability to meet analysts’ earnings estimates; |
| • | increases in market interest rates that lead purchasers of our shares to demand a higher yield; |
| • | changes in market valuations of similar companies; |
| • | adverse market reaction to any additional debt we incur in the future; |
| • | additions or departures of key management personnel; |
| • | the market for similar securities issued by REITs; |
| • | actions by institutional stockholders; |
| • | speculation in the press or investment community; |
| • | our compliance with generally accepted accounting principles; |
| • | our compliance with applicable laws and regulations and the listing requirements of the New York Stock Exchange; |
| • | the realization of any of the other risk factors presented in this Annual Report on Form 10-K; and |
| • | general market, including capital market and real estate market, and economic conditions. |
Future offerings of debt, which would be senior to our common stock and preferred stock upon liquidation, and/or preferred stock which may be senior to our common stock for purposes of dividend distributions or upon liquidation, may adversely affect the market price of our common stock or preferred stock, as applicable.
We have a credit facility that consists of a $100.0 million revolving credit facility, a five-year $50.0 million term loan, a seven-year $50.0 million term loan and a five-year $100.0 million term loan to finance acquisitions and for working capital requirements with total outstanding borrowings of $200.0 million as of December 31, 2014. In addition, as of December 31, 2014, we had total mortgage loans payable of approximately $104.5 million. We have agreed to guarantee the obligations of the borrower (a wholly-owned subsidiary) under our credit facility. Upon liquidation, holders of our debt securities and shares of preferred stock, including our Series A Preferred Stock, and lenders with respect to other borrowings, including our existing mortgage loans payable, will receive distributions of our available assets prior to the holders of our common stock. In addition, holders of our debt securities and lenders with respect to other borrowings will receive distributions of our available assets prior to the holders of our Series A Preferred Stock. Additional equity offerings may dilute the holdings of our existing stockholders and/or reduce the market price of our common stock or our preferred stock. Holders of our common stock are not entitled to preemptive rights or other protections against dilution. Our preferred stock has a preference on liquidating distributions and a preference on dividend payments that could limit our ability to pay a dividend or make another distribution to the holders of our common stock. Because our decision to issue securities in any future offering will depend on market conditions and other factors beyond our control, we cannot predict or estimate the amount, timing or nature of our future offerings. Thus, our stockholders bear the risk of our future offerings reducing the market price of our common stock or preferred stock and diluting their stock holdings in us.
27
Table of Contents
We may be unable to generate sufficient cash flows from our operations to make distributions to our stockholders at any time in the future.
Our ability to make distributions to our stockholders may be adversely affected by the risk factors described in this Form 10-K. We may not generate sufficient income to make distributions to our stockholders. Our board of directors has the sole discretion to determine the timing, form and amount of any distributions to our stockholders. Our board of directors will make determinations regarding distributions based upon, among other factors, our financial performance, any debt service obligations, any debt covenants, and capital expenditure requirements. Among the factors that could impair our ability to make distributions to our stockholders are:
| • | our inability to realize attractive risk-adjusted returns on our investments; |
| • | unanticipated expenses or reduced revenues that reduce our cash flow or non-cash earnings; and |
| • | decreases in the value of our industrial properties that we own. |
As a result, no assurance can be given that we will be able to make distributions to our stockholders at any time in the future or that the level of any distributions we do make to our stockholders will increase or even be maintained over time, any of which could materially and adversely affect the market price of our shares of common stock and preferred stock.
Our shares of common stock rank junior to our Series A Preferred Stock.
Our shares of common stock rank junior to our Series A Preferred Stock with respect to dividends and upon liquidation, dissolution or winding up, which could limit or restrict our ability to make distributions on our common stock. In certain circumstances, following a change of control of our company, holders of our Series A Preferred Stock will be entitled to convert their shares of Series A Preferred Stock into a specified number of shares of common stock, subject to our option to redeem the Series A Preferred Stock for cash at $25.00 per share plus accrued and unpaid dividends. Holders of our shares of common stock are not entitled to preemptive rights or other protections against dilution. We may in the future attempt to increase our capital resources by making additional offerings of equity securities, including additional classes or series of preferred stock, which would likely have preferences with respect to dividends or upon dissolution that are senior to our shares of common stock. Because our decision to issue securities in any future offering will depend on market conditions and other factors, many of which are beyond our control, we cannot predict or estimate the amount, timing or nature of any future offerings. Thus, our common stockholders bear the risk of our future offerings reducing the market price of our shares of common stock and diluting their interest in us.
The change of control conversion feature of the Series A Preferred Stock may make it more difficult for a party to take over our company or discourage a party from taking over our company.
Upon the occurrence of a change of control (as defined in the Articles Supplementary for the Series A Preferred Stock) the result of which our common stock or the common securities of the acquiring or surviving entity are not listed on the NYSE, NYSE Amex or NASDAQ, holders of the Series A Preferred Stock will have the right (unless, prior to the change of control conversion date, we have provided or provide notice of our election to redeem the Series A Preferred Stock) to convert some or all of their Series A Preferred Stock into shares of our common stock (or equivalent value of alternative consideration). Upon such a conversion, the holders will be limited to a maximum number of shares of our common stock equal to the share cap of 3.2446 multiplied by the number of shares of Series A Preferred Stock converted. The change of control conversion feature of the Series A Preferred Stock may have the effect of discouraging a third party from making an acquisition proposal for our company or of delaying, deferring or preventing certain change of control transactions of our company under circumstances that stockholders may otherwise believe are in their best interests.
28
Table of Contents
Our ability to pay dividends is limited by the requirements of Maryland law.
Our ability to pay dividends on our stock is limited by the laws of the State of Maryland. Under applicable Maryland law, a Maryland corporation generally may not make a distribution if, after giving effect to the distribution, the corporation would not be able to pay its debts as the debts become due in the usual course of business, or the corporation’s total assets would be less than the sum of its total liabilities plus, unless the corporation’s charter provides otherwise, the amount that would be needed, if the corporation were dissolved at the time of the distribution, to satisfy the preferential rights upon dissolution of stockholders whose preferential rights are superior to those receiving the distribution. Accordingly, we generally may not make a distribution on our stock if, after giving effect to the distribution, we would not be able to pay our debts as they become due in the usual course of business or our total assets would be less than the sum of our total liabilities plus, unless the terms of such class or series provide otherwise, the amount that would be needed to satisfy the preferential rights upon dissolution of the holders of shares of any class or series of preferred stock then outstanding, if any, with preferences senior to those of our outstanding stock.
| Item 1B. | Unresolved Staff Comments. |
None.
| Item 2. | Properties. |
As of December 31, 2014, we owned 126 buildings (including one building held for sale) aggregating approximately 9.3 million square feet and two improved land parcels consisting of 3.5 acres. The properties are located in Los Angeles; Northern New Jersey/New York City; San Francisco Bay Area; Seattle; Miami; and Washington D.C./Baltimore. As of December 31, 2014, our properties were approximately 93.7% leased to 299 customers, the largest of which accounted for approximately 5.3% of our total annualized base rent. We own several types of industrial real estate, including warehouse/distribution (approximately 88.8% of our total portfolio square footage as of December 31, 2014), flex (including light industrial and R&D) (approximately 9.4%) and trans-shipment (approximately 1.8%). See “Our Investment Strategy – Industrial Facility General Characteristics” in this Annual Report on Form 10-K for a general description of these types of industrial real estate. We target functional buildings in infill locations that may be shared by multiple tenants and that cater to customer demand within the various submarkets in which we operate. See our “Consolidated Financial Statements, Schedule III-Real Estate Investments and Accumulated Depreciation” in this Annual Report on Form 10-K, for a detailed listing of our properties.
The following table summarizes by market our investments in real estate as of December 31, 2014:
| Market |
Number of Buildings |
Rentable Square Feet |
% of Total |
Occupancy % as of December 31, 2014 |
Annualized Base Rent (000’s) 1 |
% of Total |
Annualized Base Rent Per Occupied Square Foot |
Weighted Average Remaining Lease Term (Years) 2 |
Gross Book Value (000’s)4 |
|||||||||||||||||||||||||||
| Los Angeles |
18 | 1,568,571 | 17.0 | % | 92.6 | % | $ | 9,684 | 15.2 | % | $ | 6.67 | 2.5 | $ | 169,325 | |||||||||||||||||||||
| Northern New Jersey/New York City |
41 | 2,604,563 | 28.1 | % | 85.9 | % | 17,791 | 27.9 | % | 7.95 | 3.6 | 267,041 | ||||||||||||||||||||||||
| San Francisco Bay Area |
21 | 1,043,891 | 11.3 | % | 99.6 | % | 10,217 | 16.0 | % | 9.83 | 5.5 | 135,738 | ||||||||||||||||||||||||
| Seattle |
10 | 904,914 | 9.8 | % | 95.9 | % | 5,252 | 8.2 | % | 6.05 | 3.7 | 80,299 | ||||||||||||||||||||||||
| Miami |
18 | 1,333,243 | 14.4 | % | 99.2 | % | 8,904 | 14.0 | % | 6.73 | 2.7 | 103,497 | ||||||||||||||||||||||||
| Washington, D.C./Baltimore 3 |
18 | 1,796,484 | 19.4 | % | 97.5 | % | 11,928 | 18.7 | % | 6.81 | 4.6 | 152,335 | ||||||||||||||||||||||||
|
|
|
|
|
|
|
|
|
|
|
|
|
|
|
|
|
|
|
|||||||||||||||||||
| Total/Weighted Average |
126 | 9,251,666 | 100.0 | % | 93.7 | % | $ | 63,776 | 100.0 | % | $ | 7.35 | 3.7 | $ | 908,235 | |||||||||||||||||||||
|
|
|
|
|
|
|
|
|
|
|
|
|
|
|
|
|
|
|
|||||||||||||||||||
29
Table of Contents
| 1 | Annualized base rent is calculated as monthly base rent per the leases, excluding any partial or full rent abatements, as of December 31, 2014, multiplied by 12. |
| 2 | Weighted average remaining lease term is calculated by summing the remaining lease term of each lease as of December 31, 2014, weighted by the respective square footage. |
| 3 | Includes one property held for sale with a gross book value of approximately $6.9 million and accumulated depreciation and amortization of approximately $0.6 million as of December 31, 2014. |
| 4 | Includes 3.5 acres of improved land as discussed below. |
We also own approximately 3.5 acres of improved land that is 100% leased to two tenants. Such land is used for truck, trailer and container storage and/or car parking. In the future, we may consider redeveloping such land either by expansion of adjacent buildings or the construction of new buildings.
The following table summarizes by market our investments in improved land as of December 31, 2014:
| Market |
Number of Parcels |
Acres | % of Total |
Occupancy % as of December 31, 2014 |
Annualized Base Rent (000’s) 1 |
% of Total |
Annualized Base Rent Per Occupied Square Foot |
Weighted Average Remaining Lease Term (Years) 2 |
||||||||||||||||||||||||
| Los Angeles |
1 | 1.2 | 34.3 | % | 100.0 | % | $ | 142 | 41.3 | % | $ | 2.72 | 2.0 | |||||||||||||||||||
| Northern New Jersey/ New York City |
— | — | 0.0 | % | — | — | 0.0 | % | — | — | ||||||||||||||||||||||
| San Francisco Bay Area |
— | — | 0.0 | % | — | — | 0.0 | % | — | — | ||||||||||||||||||||||
| Seattle |
— | — | 0.0 | % | — | — | 0.0 | % | — | — | ||||||||||||||||||||||
| Miami |
1 | 2.3 | 65.7 | % | 100.0 | % | 202 | 58.7 | % | 2.02 | 1.4 | |||||||||||||||||||||
| Washington, D.C./Baltimore |
— | — | 0.0 | % | — | — | 0.0 | % | — | — | ||||||||||||||||||||||
|
|
|
|
|
|
|
|
|
|
|
|
|
|
|
|
|
|||||||||||||||||
| Total/Weighted Average |
2 | 3.5 | 100.0 | % | 100.0 | % | $ | 344 | 100.0 | % | $ | 2.26 | 1.6 | |||||||||||||||||||
|
|
|
|
|
|
|
|
|
|
|
|
|
|
|
|
|
|||||||||||||||||
| 1 | Annualized base rent is calculated as monthly base rent per the leases, excluding any partial or full rent abatements, as of December 31, 2014, multiplied by 12. |
| 2 | Weighted average remaining lease term is calculated by summing the remaining lease term of each lease as of December 31, 2014, weighted by the respective square footage. |
The following table summarizes our capital expenditures incurred during the three months and years ended December 31, 2014 and 2013 (dollars in thousands):
| For the Three Months Ended December 31, |
For the Year Ended December 31, |
|||||||||||||||
| 2014 | 2013 | 2014 | 2013 | |||||||||||||
| Building improvements |
$ | 2,668 | $ | 1,578 | $ | 11,974 | $ | 5,441 | ||||||||
| Tenant improvements |
1,038 | 509 | 4,450 | 1,904 | ||||||||||||
| Leasing commissions |
1,503 | 950 | 4,157 | 2,633 | ||||||||||||
|
|
|
|
|
|
|
|
|
|||||||||
| Total capital expenditures1 |
$ | 5,209 | $ | 3,037 | $ | 20,581 | $ | 9,978 | ||||||||
|
|
|
|
|
|
|
|
|
|||||||||
| 1 | Includes approximately $2.8 million and $2.4 million for the three months ended December, 2014 and 2013, respectively, and approximately $14.9 million and $5.7 million for the years ended December 31, 2014 and 2013, respectively, related to leasing acquired vacancy and renovation projects (stabilization capital) at 11 and 13 properties, respectively, for the three months and year ended December 31, 2014 and seven and nine properties, respectively, for the three months and year ended December 31, 2013. |
30
Table of Contents
The following table summarizes the anticipated lease expirations for leases in place at December 31, 2014, without giving effect to the exercise of renewal options or termination rights, if any, at or prior to the scheduled expirations:
| Year |
Rentable Square Feet 1 |
% of Total Rentable Square Feet |
Annualized Base Rent (000’s) 1, 2 |
% of Total Annualized Base Rent 1 |
||||||||||||
| 2015 |
1,599,042 | 17.3 | % | $ | 9,362 | 13.4 | % | |||||||||
| 2016 |
847,145 | 9.1 | % | 7,027 | 10.1 | % | ||||||||||
| 2017 |
908,006 | 9.8 | % | 8,770 | 12.6 | % | ||||||||||
| 2018 |
1,033,348 | 11.2 | % | 8,765 | 12.6 | % | ||||||||||
| 2019 |
1,579,743 | 17.1 | % | 11,920 | 17.1 | % | ||||||||||
| Thereafter |
2,704,694 | 29.2 | % | 23,793 | 34.2 | % | ||||||||||
|
|
|
|
|
|
|
|
|
|||||||||
| Total |
8,671,978 | 93.7 | % | $ | 69,637 | 100.0 | % | |||||||||
|
|
|
|
|
|
|
|
|
|||||||||
| 1 | Includes leases that expire on or after December 31, 2014 and month-to-month leases totaling 371,981 square feet. |
| 2 | Annualized base rent is calculated as monthly base rent per the leases at expiration, excluding any partial or full rent abatements, as of December 31, 2014, multiplied by 12. |
Our ability to re-lease or renew expiring space at rental rates equal to or in excess of current rental rates will impact our results of operations. As of December 31, 2014, leases representing approximately 17.3% of the total rentable square footage of our portfolio are scheduled to expire during the year ending December 31, 2015. In general, we continue to see improving demand for industrial space in our markets. We currently expect that on average, the rental rates we are likely to achieve on any new (re-leased) or renewed leases for our 2015 expirations will generally be above the rates currently being paid for the same space. Our past performance may not be indicative of future results, and we cannot assure you that leases will be renewed or that our properties will be re-leased at all or at rental rates above the current average rental rates. Further, re-leased/renewed rental rates in a particular market may not be consistent with rental rates across our portfolio as a whole and re-leased/renewed rental rates for particular properties within a market may not be consistent with rental rates across our portfolio within a particular market, in each case due to a number of factors, including local real estate conditions, local supply and demand for industrial space, the condition of the property, the impact of leasing incentives, including free rent and tenant improvements and whether the property, or space within the property, has been redeveloped.
Our industrial properties are typically subject to leases on a “triple net basis,” in which tenants pay their proportionate share of real estate taxes, insurance and operating costs, or are subject to leases on a “modified gross basis,” in which tenants pay expenses over certain threshold levels. In addition, approximately 84.2% of our leased space includes fixed rental increases or Consumer Price Index-based rental increases. Lease terms typically range from three to ten years. We monitor the liquidity and creditworthiness of our tenants on an on-going basis by reviewing outstanding accounts receivable balances, and as provided under the respective lease agreements, review the tenant’s financial condition periodically as appropriate. As needed, we hold discussions with the tenant’s management about their business and we conduct site visits of the tenant’s operations.
31
Table of Contents
Our top 20 customers based on annualized base rent as of December 31, 2014 are as follows:
| Tenant |
Leases |
Rentable |
% of Total |
Annualized |
% of Total |
|||||||||||||||||
| 1 | FedEx Corporation | 5 | 241,783 | 2.6 | % | $ | 3,354 | 5.3 | % | |||||||||||||
| 2 | Cepheid | 3 | 171,707 | 1.9 | % | 2,791 | 4.4 | % | ||||||||||||||
| 3 | Northrop Grumman Systems | 2 | 199,866 | 2.2 | % | 2,140 | 3.4 | % | ||||||||||||||
| 4 | H.D. Smith Wholesale Drug Company | 1 | 211,418 | 2.3 | % | 2,131 | 3.3 | % | ||||||||||||||
| 5 | HD Supply Company | 2 | 223,741 | 2.4 | % | 1,861 | 2.9 | % | ||||||||||||||
| 6 | Home Depot | 1 | 413,092 | 4.4 | % | 1,847 | 2.9 | % | ||||||||||||||
| 7 | United States Government | 2 | 152,099 | 1.6 | % | 1,707 | 2.7 | % | ||||||||||||||
| 8 | West Coast Warehouse | 1 | 265,500 | 2.9 | % | 1,370 | 2.1 | % | ||||||||||||||
| 9 | YRC Worldwide | 2 | 61,252 | 0.7 | % | 1,298 | 2.0 | % | ||||||||||||||
| 10 | Miami International Freight Solutions | 1 | 192,454 | 2.1 | % | 1,174 | 1.8 | % | ||||||||||||||
| 11 | Avborne Accessory Group | 1 | 137,594 | 1.5 | % | 1,048 | 1.6 | % | ||||||||||||||
| 12 | Ace World Class | 1 | 161,610 | 1.7 | % | 1,008 | 1.6 | % | ||||||||||||||
| 13 | Banah International Group 2 | 1 | 301,983 | 3.3 | % | 906 | 1.4 | % | ||||||||||||||
| 14 | New Breed Logistics, Inc. | 2 | 123,035 | 1.3 | % | 824 | 1.3 | % | ||||||||||||||
| 15 | Service West Inc. | 1 | 129,279 | 1.4 | % | 773 | 1.2 | % | ||||||||||||||
| 16 | Flying Food Group | 1 | 69,500 | 0.7 | % | 692 | 1.1 | % | ||||||||||||||
| 17 | JAM’N Logistics | 1 | 110,336 | 1.2 | % | 690 | 1.1 | % | ||||||||||||||
| 18 | International Paper Company | 1 | 137,872 | 1.5 | % | 673 | 1.1 | % | ||||||||||||||
| 19 | Maines Paper & Food Service | 1 | 98,745 | 1.1 | % | 658 | 1.0 | % | ||||||||||||||
| 20 | United Parcel Service | 4 | 79,712 | 0.8 | % | 625 | 1.0 | % | ||||||||||||||
|
|
|
|
|
|
|
|
|
|
|
|||||||||||||
| Total |
34 | 3,482,578 | 37.6 | % | $ | 27,570 | 43.2 | % | ||||||||||||||
|
|
|
|
|
|
|
|
|
|
|
|||||||||||||
| 1 | Annualized base rent is calculated as monthly base rent per the leases, excluding any partial or full rent abatements, as of December 31, 2014, multiplied by 12. |
| 2 | Represents a month-to-month lease related to the tenant default described under the heading “2014 Developments – Tenant Default” under “Management’s Discussion and Analysis of Financial Condition and Results of Operations” in this Annual Report on Form 10-K. The tenant vacated the space during January 2015 and we regained possession. |
As of December 31, 2014, 15 of our 73 properties with a net investment book value of approximately $213.4 million were encumbered by mortgage loans payable totaling approximately $104.5 million, which bear interest at a weighted average fixed annual rate of 4.51%.
| Item 3. | Legal Proceedings. |
We are not involved in any material litigation nor, to our knowledge, is any material litigation threatened against us.
| Item 4. | Mine Safety Disclosures. |
Not Applicable.
32
Table of Contents
PART II
| Item 5. | Market for Our Common Stock and Related Stockholder Matters. |
Market Information
Our common stock is listed on the New York Stock Exchange (the “NYSE”) under the symbol “TRNO”. The following table sets forth, for the indicated periods, the high and low sale prices for our common stock, as reported on the NYSE and the per share dividends declared:
| Year |
High | Low | Dividend | |||||||||
| 2014 |
||||||||||||
| First Quarter |
$ | 19.00 | $ | 16.88 | $ | 0.13 | ||||||
| Second Quarter |
19.84 | 17.83 | 0.14 | |||||||||
| Third Quarter |
20.38 | 18.51 | 0.14 | |||||||||
| Fourth Quarter |
21.48 | 18.94 | 0.16 | |||||||||
| 2013 |
||||||||||||
| First Quarter |
$ | 18.03 | $ | 15.59 | $ | 0.12 | ||||||
| Second Quarter |
20.20 | 17.78 | 0.13 | |||||||||
| Third Quarter |
19.21 | 17.00 | 0.13 | |||||||||
| Fourth Quarter |
18.63 | 16.71 | 0.13 | |||||||||
As of January 26, 2015, there were approximately 4,263 holders of record of shares of our common stock. This number does not include stockholders for which shares are held in “nominee” or “street” name.
Distribution Policy
We intend to pay regular quarterly distributions when, as and if authorized by our board of directors and declared by us. Our ability to make distributions to our stockholders also will depend on our levels of retained cash flows, which we intend to use as a source of investment capital. In order to qualify for taxation as a REIT, we must distribute to our stockholders an amount at least equal to:
| (i) | 90% of our REIT taxable income (determined before the deduction for dividends paid and excluding any net capital gain); plus |
| (ii) | 90% of the excess of our after-tax net income, if any, from foreclosure property over the tax imposed on such income by the Code; less |
| (iii) | the sum of certain items of non-cash income. |
Generally, we expect to distribute 100% of our REIT taxable income so as to avoid the income and excise tax on undistributed REIT taxable income. However, we cannot assure you as to our ability to sustain those distributions.
The timing and frequency of distributions will be authorized by our board of directors and declared by us based upon a variety of factors, including:
| • | actual results of operations; |
| • | our level of retained cash flows; |
| • | any debt service requirements; |
| • | capital expenditure requirements for our properties; |
| • | our property dispositions; |
| • | our taxable income; |
| • | the annual distribution requirement under the REIT provisions of the Code; |
33
Table of Contents
| • | the amount required to declare and pay in cash or set aside for the payment of dividends on our Series A Preferred Stock for all past dividend periods that have ended; |
| • | our operating expenses; |
| • | restrictions on the availability of funds under Maryland law; and |
| • | other factors that our board of directors may deem relevant. |
In addition, our credit facility has a covenant limiting our maximum REIT distribution paid to a percentage of our funds from operations (see “Management’s Discussion and Analysis of Financial Condition and Results of Operations – Non-GAAP Financial Measures”) before acquisition costs of 95% for each fiscal year (subject to distribution payments necessary to preserve our REIT status) beginning in fiscal 2012. To the extent that, in respect of any calendar year, cash available for distribution is less than our REIT taxable income, we could be required to sell assets or borrow funds to make cash distributions or make a portion of the required distribution in the form of a taxable share distribution or distribution of debt securities. Income as computed for purposes of the tax rules described above will not necessarily correspond to our income as determined for financial reporting purposes.
Distributions to our stockholders generally are taxable to our stockholders as ordinary income; however, because a significant portion of our investments are equity ownership interests in industrial properties, which generate depreciation and other non-cash charges against our income, a portion of our distributions may constitute a tax-free return of capital, although our current intention is to limit the level of such return of capital.
The following table sets forth the cash dividends paid or payable during the years ended December 31, 2014 and 2013:
| For the Three Months Ended |
Security | Dividend per Share |
Declaration Date | Record Date | Date Paid | |||||||
| March 31, 2014 | Common stock | $ | 0.130000 | February 19, 2014 | April 7, 2014 | April 21, 2014 | ||||||
| March 31, 2014 | Preferred stock | $ | 0.484375 | February 19, 2014 | March 10, 2014 | March 31, 2014 | ||||||
| June 30, 2014 | Common stock | $ | 0.140000 | May 9, 2014 | July 7, 2014 | July 21, 2014 | ||||||
| June 30, 2014 | Preferred stock | $ | 0.484375 | May 9, 2014 | June 11, 2014 | June 30, 2014 | ||||||
| September 30, 2014 | Common stock | $ | 0.140000 | August 8, 2014 | October 7, 2014 | October 21, 2014 | ||||||
| September 30, 2014 | Preferred stock | $ | 0.484375 | August 8, 2014 | September 12, 2014 | September 30, 2014 | ||||||
| December 31, 2014 | Common stock | $ | 0.160000 | November 4, 2014 | December 31, 2014 | January 14, 2015 | ||||||
| December 31, 2014 | Preferred stock | $ | 0.484375 | November 4, 2014 | December 12, 2014 | December 31, 2014 | ||||||
| For the Three Months Ended |
Security | Dividend per Share |
Declaration Date | Record Date | Date Paid | |||||||
| March 31, 2013 | Common stock | $ | 0.120000 | February 19, 2013 | April 5, 2013 | April 19, 2013 | ||||||
| March 31, 2013 | Preferred stock | $ | 0.484375 | February 19, 2013 | March 11, 2013 | March 31, 2013 | ||||||
| June 30, 2013 | Common stock | $ | 0.130000 | May 7, 2013 | July 5, 2013 | July 19, 2013 | ||||||
| June 30, 2013 | Preferred stock | $ | 0.484375 | May 7, 2013 | June 11, 2013 | July 1, 2013 | ||||||
| September 30, 2013 | Common stock | $ | 0.130000 | August 6, 2013 | October 7, 2013 | October 21, 2013 | ||||||
| September 30, 2013 | Preferred stock | $ | 0.484375 | August 6, 2013 | September 11, 2013 | September 30, 2013 | ||||||
| December 31, 2013 | Common stock | $ | 0.130000 | November 5, 2013 | December 31, 2013 | January 14, 2014 | ||||||
| December 31, 2013 | Preferred stock | $ | 0.484375 | November 5, 2013 | December 11, 2013 | December 31, 2013 | ||||||
34
Table of Contents
Issuer Purchases of Equity Securities
| Period |
(a) Total Number of Shares of Common Stock Purchased |
(b) Average Price Paid per Common Share |
(c) Total Number of Shares Purchased as Part of Publicly Announced Plans or Programs |
(d) Maximum Number (or Approximate Dollar Value) of Shares that May Yet be Purchased Under the Plan or Program | ||||||||
| October 1, 2014 - October 31, 2014 |
— | $ | — | N/A | N/A | |||||||
| November 1, 2014 - November 30, 2014 |
326 | 1 | 21.26 | N/A | N/A | |||||||
| December 1, 2014 - December 31, 2014 |
— | — | N/A | N/A | ||||||||
|
|
|
|
|
|||||||||
| 326 | $ | 21.26 | N/A | N/A | ||||||||
| 1 | Represents shares of common stock surrendered by employees to the Company to satisfy such employees’ tax withholding obligations in connection with the vesting of restricted stock. |
Performance Graph
The following graph compares the change in the cumulative total stockholder return on our common stock during the period from February 10, 2010 (the first day our stock began trading on the NYSE) to December 31, 2014 with the cumulative total return of the Standard and Poor’s 500 Stock Index, the MSCI U.S. REIT Index and the FTSE NAREIT Equity Industrial Index. The return shown on the graph is not necessarily indicative of future performance. The comparison assumes that $100 was invested on February 10, 2010 in our common stock and in each of the foregoing indices and assumes reinvestment of dividends, if any.
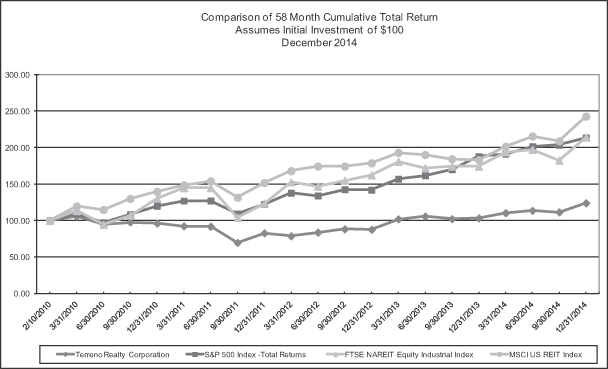
The performance graph and related information shall not be deemed “soliciting material” or be deemed to be “filed” with the SEC, nor shall such information be incorporated by reference into any future filing, except to the extent that the Company specifically incorporates it by reference into such filing.
35
Table of Contents
| Item 6. | Selected Financial Data. |
The following table sets forth selected financial data derived from our audited consolidated financial statements as of December 31, 2014, 2013, 2012, 2011 and 2010, for the years ended December 31, 2014, 2013, 2012 and 2011 and the period from February 16, 2010 (commencement of operations) to December 31, 2010 and should be read in conjunction with the consolidated financial statements and notes thereto included in this Annual Report on Form 10-K beginning on page F-1 and with Part II, Item 7 “Management’s Discussion and Analysis of Financial Condition and Results of Operations” (dollars in thousands, except share and per share amounts):
| For the Year
Ended December 31, |
Period from February 16, 2010 (Commencement of Operations) to December 31, 2010 |
|||||||||||||||||||
| 2014 | 2013 | 2012 | 2011 | |||||||||||||||||
| Operating Data |
||||||||||||||||||||
| Total revenues |
$ | 68,875 | $ | 45,529 | $ | 29,335 | $ | 14,182 | $ | 3,105 | ||||||||||
| Total costs and expenses |
51,567 | 36,973 | 25,931 | 17,375 | 8,629 | |||||||||||||||
| Income (loss) from continuing operations |
10,718 | 2,451 | (2,031 | ) | (5,807 | ) | (5,984 | ) | ||||||||||||
| Income from discontinued operations |
— | 1,412 | 2,059 | 2,078 | 594 | |||||||||||||||
| Gain on sales of real estate investments |
— | 2,778 | 4,037 | — | — | |||||||||||||||
| Net income (loss) available to common stockholders, net of preferred stock dividends |
7,126 | 3,056 | 2,437 | (3,729 | ) | (5,390 | ) | |||||||||||||
| Earnings per Common Share - Basic and Diluted: |
||||||||||||||||||||
| Income (loss) from continuing operations available to common stockholders, net of preferred stock dividends |
$ | 0.23 | $ | (0.05) | $ | (0.28) | $ | (0.64) | $ | (0.63) | ||||||||||
| Income from discontinued operations |
— | 0.20 | 0.47 | 0.23 | 0.04 | |||||||||||||||
|
|
|
|
|
|
|
|
|
|
|
|||||||||||
| Net income (loss) available to common stockholders, net of preferred stock dividends |
$ | 0.23 | $ | 0.15 | $ | 0.19 | $ | (0.41 | ) | $ | (0.59 | ) | ||||||||
|
|
|
|
|
|
|
|
|
|
|
|||||||||||
| Dividends declared per common share |
$ | 0.57 | $ | 0.51 | $ | 0.46 | $ | 0.40 | $ | — | ||||||||||
| Dividends declared per preferred share |
1.94 | 1.94 | 0.87 | — | — | |||||||||||||||
| Basic and Diluted Weighted Average Common Shares Outstanding |
30,433,017 | 21,011,276 | 13,135,440 | 9,161,805 | 9,112,000 | |||||||||||||||
| Other Data |
||||||||||||||||||||
| Funds from operations 1 |
$ | 26,097 | $ | 12,689 | $ | 7,435 | $ | 1,056 | $ | (4,209 | ) | |||||||||
| Basic and diluted FFO per common share 1 |
0.86 | 0.60 | 0.57 | 0.12 | (0.46 | ) | ||||||||||||||
| Cash flows provided by (used in): |
||||||||||||||||||||
| Operating activities |
$ | 29,321 | $ | 13,495 | $ | 9,749 | $ | 2,149 | $ | (2,019 | ) | |||||||||
| Investing activities |
(249,916 | ) | (201,865 | ) | (160,180 | ) | (105,884 | ) | (116,581 | ) | ||||||||||
| Financing activities |
404,207 | 189,429 | 153,112 | 49,731 | 175,852 | |||||||||||||||
| Balance Sheet Data |
||||||||||||||||||||
| Investments in real estate at cost 2 |
$ | 901,273 | $ | 651,839 | $ | 445,348 | $ | 264,584 | $ | 136,363 | ||||||||||
| Total assets |
1,076,766 | 645,324 | 445,318 | 267,049 | 194,382 | |||||||||||||||
| Total debt |
304,501 | 189,313 | 177,044 | 99,315 | 17,676 | |||||||||||||||
| Total stockholders’ equity |
747,036 | 438,835 | 255,274 | 159,011 | 165,499 | |||||||||||||||
36
Table of Contents
| 1 | See Part II, Item 7 “Management’s Discussion and Analysis of Financial Condition and Results of Operations – Non-GAAP Financial Measures,” in this Annual Report on Form 10-K for a reconciliation to net income, net of preferred stock dividends and a discussion of why we believe funds from operations, or FFO, is a useful supplemental measure of operating performance, ways in which investors might use FFO when assessing our financial performance, and FFO’s limitations as a measurement tool. |
| 2 | Excludes one property held for sale with a gross book value of approximately $6.9 million as of December 31, 2014. |
| Item 7. | Management’s Discussion and Analysis of Financial Condition and Results of Operations. |
You should read the following discussion in conjunction with the sections of this Annual Report on Form 10-K entitled “Risk Factors”, “Forward-Looking Statements”, “Business” and our audited consolidated financial statements and the related notes thereto included elsewhere in this Annual Report on Form 10-K. This discussion contains forward-looking statements reflecting current expectations that involve risks and uncertainties. Actual results and the timing of events may differ materially from those contained in these forward-looking statements due to a number of factors, including those discussed in the section entitled “Risk Factors” and elsewhere in this Annual Report on Form 10-K.
Overview
We acquire, own and operate industrial real estate in six major coastal U.S. markets: Los Angeles; Northern New Jersey/New York City; San Francisco Bay Area; Seattle; Miami; and Washington, D.C./Baltimore. We invest in several types of industrial real estate, including warehouse/distribution (approximately 88.8% of our total portfolio square footage as of December 31, 2014), flex (including light industrial and R&D) (approximately 9.4%) and trans-shipment (approximately 1.8%). We target functional buildings in infill locations that may be shared by multiple tenants and that cater to customer demand within the various submarkets in which we operate. As of December 31, 2014, we owned 126 buildings (including one building held for sale) aggregating approximately 9.3 million square feet and two improved land parcels consisting of 3.5 acres, which we purchased for an aggregate purchase price of approximately $851.5 million, including the assumption of mortgage loans payable of approximately $63.9 million, which includes mortgage premiums of approximately $1.9 million. As of December 31, 2014, our properties were approximately 93.7% leased to 299 customers, the largest of which accounted for approximately 5.3% of our total annualized base rent. We are an internally managed Maryland corporation and elected to be taxed as a REIT under Sections 856 through 860 of the Code, commencing with our taxable year ended December 31, 2010.
Our Investment Strategy
We invest in industrial properties in six major coastal U.S. markets: Los Angeles; Northern New Jersey/New York City; San Francisco Bay Area; Seattle; Miami; and Washington, D.C./Baltimore. We invest in several types of industrial real estate, including warehouse/distribution, flex (including light industrial and R&D) and trans-shipment. We target functional buildings in infill locations that may be shared by multiple tenants and that cater to customer demand within the various submarkets in which we operate.
We selected our target markets by drawing upon the experience of our executive management investing and operating in over 50 global industrial markets located in North America, Europe and Asia, the fundamentals of supply and demand, and in anticipation of trends in logistics patterns resulting from population changes, regulatory and physical constraints, changes in technology, potential long term increases in carbon prices and other factors. We believe that our target markets have attractive long term investment attributes. We target assets with characteristics that include, but are not limited to, the following:
| • | Located in high population coastal markets; |
| • | Close proximity to transportation infrastructure (such as sea ports, airports, highways and railways); |
37
Table of Contents
| • | Situated in supply-constrained submarkets with barriers to new industrial development, as a result of physical and/or regulatory constraints; |
| • | Functional and flexible layout that can be modified to accommodate single and multiple tenants; |
| • | Acquisition price at a discount to the replacement cost of the property; |
| • | Potential for enhanced return through re-tenanting or operational and physical improvements; and |
| • | Opportunity for higher and better use of the property over time. |
In general, we prefer to utilize local third party property managers for day-to-day property management and as a source of acquisition opportunities. We believe outsourcing property management is cost effective and provides us with operational flexibility. We currently manage one of our properties directly and may directly manage other properties in the future if we determine such direct property management is in our best interest.
We have no current intention to acquire undeveloped industrial land or to pursue ground up development. However, we may pursue redevelopment opportunities of properties that we own or acquire adjacent land to expand our existing facilities.
We expect that we will continue to acquire the significant majority of our investments as equity interests in individual properties or portfolios of properties. We may also acquire industrial properties through the acquisition of other corporations or entities that own industrial real estate. We will opportunistically target investments in debt secured by industrial real estate that would otherwise meet our investment criteria with the intention of ultimately acquiring the underlying real estate. We currently do not intend to target specific percentages of holdings of particular types of industrial properties. This expectation is based upon prevailing market conditions and may change over time in response to different prevailing market conditions.
The properties we acquire may be stabilized (fully leased) or unstabilized (have near term lease expirations or be partially or fully vacant). During the period from February 16, 2010 to December 31, 2014, we acquired 37 unstabilized properties of which 24 have been stabilized.
We may sell properties from time to time when we believe the prospective total return from a property is particularly low relative to its market value and/or the market value of the property is significantly greater than its estimated replacement cost. Capital from such sales will be reinvested into properties that are expected to provide better prospective returns or returned to shareholders. We have disposed of two properties since inception for a cumulative sales price of approximately $36.0 million and a total gain of approximately $6.8 million.
38
Table of Contents
2014 Developments
Acquisition Activity
During the year ended December 31, 2014, we acquired 29 industrial buildings containing 2,266,082 square feet and one improved land parcel consisting of 1.2 acres for a total purchase price of approximately $235.7 million. The properties were acquired from unrelated third parties using existing cash on hand, net of assumed mortgage loans payable of approximately $8.5 million with a weighted average interest rate of approximately 5.74% and borrowings under our credit facility. The following table sets forth the industrial buildings we acquired during the year ended December 31, 2014:
| Property Name |
Location |
Acquisition Date |
Number of Buildings |
Square Feet |
Purchase Price (in thousands) 1 |
Stabilized Cap Rate 2 |
||||||||||||||
| SW 34th Street |
Renton, WA | February 11, 2014 | 1 | 62,004 | $ | 6,600 | 7.1 | % | ||||||||||||
| Parkway |
Hanover, MD | March 26, 2014 | 1 | 158,769 | 18,000 | 7.1 | % | |||||||||||||
| Pulaski |
Bayonne, NJ | March 31, 2014 | 1 | 98,049 | 9,200 | 5.9 | % | |||||||||||||
| 747 Glasgow |
Inglewood, CA | April 22, 2014 | 1 | 19,326 | 3,450 | 4.8 | % | |||||||||||||
| Hampton |
Capitol Heights, MD | May 13, 2014 | 1 | 138,780 | 18,050 | 6.4 | % | |||||||||||||
| Burroughs |
San Leandro, CA | May 14, 2014 | 3 | 129,279 | 13,328 | 5.3 | % | |||||||||||||
| California |
Corona, CA | June 5, 2014 | 1 | 89,819 | 7,815 | 5.1 | % | |||||||||||||
| Las Hermanas 3 |
Compton, CA | June 12, 2014 | 1 | 23,735 | 4,020 | 5.1 | % | |||||||||||||
| South Main II |
Carson, CA | July 18, 2014 | 1 | 33,769 | 8,500 | 6.0 | % | |||||||||||||
| 79th Ave South |
Kent, WA | July 25, 2014 | 1 | 35,018 | 2,770 | 6.6 | % | |||||||||||||
| Auburn 1307 |
Auburn, WA | August 22, 2014 | 1 | 91,607 | 9,530 | 5.6 | % | |||||||||||||
| 3401 Lind |
Renton, WA | October 3, 2014 | 1 | 113,170 | 9,975 | 5.5 | % | |||||||||||||
| 900 Hart |
Rahway, NJ | October 8, 2014 | 1 | 84,000 | 7,205 | 6.1 | % | |||||||||||||
| Kent 216th |
Kent, WA | October 24, 2014 | 1 | 106,910 | 9,214 | 5.6 | % | |||||||||||||
| 9020 Junction |
Annapolis Junction, MD | November 17, 2014 | 1 | 96,666 | 13,800 | 7.6 | % | |||||||||||||
| 11300 NW 131st |
Medley, FL | November 19, 2014 | 1 | 85,000 | 8,925 | 5.5 | % | |||||||||||||
| Terminal Way |
Avenel, NJ | November 25, 2014 | 2 | 80,200 | 7,445 | 5.7 | % | |||||||||||||
| 14605 Miller |
Fontana, CA | December 2, 2014 | 1 | 265,500 | 22,899 | 5.4 | % | |||||||||||||
| Park Union City |
Union City, CA | December 10, 2014 | 3 | 170,129 | 23,800 | 5.7 | % | |||||||||||||
| 75th Ave |
Landover, MD | December 17, 2014 | 5 | 384,352 | 31,215 | 6.2 | % | |||||||||||||
|
|
|
|
|
|
|
|
|
|||||||||||||
| Total |
29 | 2,266,082 | $ | 235,741 | 6.0 | % | ||||||||||||||
|
|
|
|
|
|
|
|
|
|||||||||||||
| 1 | Excludes intangible liabilities and mortgage premiums, if any. The total aggregate investment was approximately $236.7 million. |
| 2 | Stabilized cap rates are calculated, at the time of acquisition, as annualized cash basis net operating income for the property stabilized to market occupancy (generally 95%) divided by the total acquisition cost for the property. Total acquisition cost basis for the property includes the initial purchase price, the effects of marking assumed debt to market, buyer’s due diligence and closing costs, estimated near-term capital expenditures and leasing costs necessary to achieve stabilization. We define cash basis net operating income for the property as net operating income excluding straight-line rents and amortization of lease intangibles. These stabilized cap rates are subject to risks, uncertainties, and assumptions and are not guarantees of future performance, which may be affected by known and unknown risks, trends, uncertainties, and factors that are beyond our control, including risks related to our ability to meet our estimated forecasts related to stabilized cap rates and those risk factors contained in this Annual Report on Form 10-K. |
| 3 | Includes an improved land parcel consisting of 1.2 acres that is separately leased for trailer storage. |
Public Follow-on Offerings
On December 9, 2014, we completed a public follow-on offering of 9,775,000 shares of our common stock at a price per share of $19.60. The net proceeds of the follow-on offering were approximately $183.0 million after deducting the underwriting discount and offering costs of approximately $8.6 million. We intend to use of the net proceeds to acquire industrial properties and for general corporate purposes.
39
Table of Contents
On May 22, 2014, we completed a public follow-on offering of 8,050,000 shares of our common stock at a price per share of $17.75. The net proceeds of the follow-on offering were approximately $136.5 million after deducting the underwriting discount and offering costs of approximately $6.4 million. We used approximately $100.0 million of the net proceeds to repay outstanding borrowings under our revolving credit facility and the remaining net proceeds to acquire industrial properties and for general business purposes.
Establishment of ATM Program
On February 28, 2014, we established an at-the market equity offering program (the “ATM Program”) pursuant to which we may issue and sell shares of our common stock having an aggregate offering price of up to $100,000,000 in amounts and at times as we determine from time to time. Actual sales, if any, will depend on a variety of factors to be determined by our company from time to time, including, among others, market conditions, the trading price of our common stock, our determinations of the appropriate sources of funding for our company and potential uses of funding available to us. We intend to use the net proceeds from the offering of the shares under the ATM Program, if any, for general corporate purposes, which may include future acquisitions and repayment of indebtedness, including borrowings under our credit facility. During the three months and year ended December 31, 2014, we did not issue any shares of common stock under the ATM Program.
Amendments to Credit Facility and New Term Loans
On May 8, 2014, we entered into a Third Amended and Restated Senior Credit Agreement (the “Facility”) with KeyBank National Association, as administrative agent and as a lender, KeyBanc Capital Markets, as a lead arranger and PNC Bank, National Association, Union Bank, N.A. and Regions Bank as lenders (collectively the “Lenders”) to, among other matters, add a seven-year $50.0 million term loan to the existing $150.0 million facility, which included a $100.0 million revolving credit facility and a five-year $50.0 million term loan. The seven-year $50.0 million term loan maturity date under the Facility is May 2021. The five-year $50.0 million term loan maturity date under the Facility was extended to May 2019 (previously January 2018) and the maturity date of the revolving credit facility was extended to May 2018 (previously January 2016) with one 12-month extension option exercisable by us, subject, among other things, to there being an absence of an event of default under the Facility and to the payment of an extension fee.
On December 8, 2014 we entered into a first amendment to the Facility (the “Amended Facility”) with KeyBank National Association, as administrative agent and as a lender, and PNC Bank, National Association, MUFG Union Bank, N.A., Regions Bank and Goldman Sachs Bank USA as lenders to add a five-year $100.0 million term loan to our existing $200.0 million credit facility. The five-year $100.0 million term loan matures in March 2020.
The aggregate amount of the Amended Facility may be increased to a total of up to $500.0 million, subject to the approval of the administrative agent and the identification of lenders willing to make available additional amounts. Outstanding borrowings under the Amended Facility are limited to the lesser of (i) the sum of our $100.0 million revolving credit facility, our $50.0 million five-year term loan, our $50.0 million seven-year term loan and our $100.0 million five-year term loan or (ii) 60.0% of the value of the unencumbered properties. Interest on the Amended Facility, including the five-year and seven-year term loans, is generally to be paid based upon, at our option, either (i) LIBOR plus the applicable LIBOR margin or (ii) the applicable base rate which is the greatest of the administrative agent’s prime rate, 0.50% above the federal funds effective rate, or thirty-day LIBOR plus the applicable LIBOR margin for LIBOR rate loans under the Amended Facility plus 1.25%. The applicable LIBOR margin will range from 1.50% to 2.05% (1.50% at December 31, 2014) for the revolving credit facility and each of the five-year term loans and 1.75% to 2.30% (1.75% at December 31, 2014) for the seven-year term loan, depending on the ratio of our outstanding consolidated indebtedness to the value of our consolidated gross asset value.
The Amended Facility requires quarterly payments of an annual unused facility fee in an amount equal to 0.20% or 0.25% depending on the unused portion of the Amended Facility. The Amended Facility is guaranteed by us and by substantially all of the current and to-be-formed subsidiaries of the borrower that own an
40
Table of Contents
unencumbered property. The Amended Facility has been modified to be unsecured by our properties or by interests in the subsidiaries that hold such properties. The Amended Facility includes a series of financial and other covenants that we must comply with in order to borrow under the Amended Facility. As of December 31, 2014, there were no borrowings outstanding on the revolving credit facility and $200.0 million of borrowings outstanding on the term loans. As of December 31, 2013, there were $31.0 million of borrowings outstanding on the revolving credit facility and $50.0 million of borrowings outstanding on a five-year term loan. We were in compliance with the covenants under the Amended Facility at December 31, 2014 and 2013.
Tenant Default
On January 29, 2013, we filed a one count eviction action against Banah International Group, Inc. (“Banah”), our tenant at 215 10th Avenue in Hialeah, FL, for failure to pay December 2012 and January 2013 rent. On February 21, 2013, the state court entered a default judgment for possession against Banah. Later that same day, Banah filed a Chapter 11 bankruptcy petition and subsequently extended the deadline to affirm or reject the lease while working on a plan of reorganization. Banah made all payments in accordance with the lease for the period from February 21, 2013 through October 31, 2014 and a partial payment for November 2014 during the bankruptcy. The lease was recorded as month-to-month and revenue was recognized as cash was received. On December 18, 2013, Banah filed its proposed plan for reorganization which called for a successor entity (the “Successor Entity”) to assume the lease, pending plan confirmation by the Bankruptcy Court. On September 9, 2014, following the failure of the Successor Entity to fulfill its obligations, the Bankruptcy Court vacated the plan and engaged a court appointed trustee to oversee the operations of Banah. On September 24, 2014, the Court approved an emergency motion by the trustee to convert the bankruptcy to Chapter 7. As a result, Banah vacated the space and we regained possession during January 2015.
Dividend and Distribution Activity
The following table sets forth the cash dividends paid or payable per share during the year ended December 31, 2014:
| For the Three Months Ended |
Security | Dividend per Share |
Declaration Date | Record Date | Date Paid | |||||||
| March 31, 2014 | Common stock | $ | 0.130000 | February 19, 2014 | April 7, 2014 | April 21, 2014 | ||||||
| March 31, 2014 | Preferred stock | $ | 0.484375 | February 19, 2014 | March 10, 2014 | March 31, 2014 | ||||||
| June 30, 2014 | Common stock | $ | 0.140000 | May 9, 2014 | July 7, 2014 | July 21, 2014 | ||||||
| June 30, 2014 | Preferred stock | $ | 0.484375 | May 9, 2014 | June 11, 2014 | June 30, 2014 | ||||||
| September 30, 2014 | Common stock | $ | 0.140000 | August 8, 2014 | October 7, 2014 | October 21, 2014 | ||||||
| September 30, 2014 | Preferred stock | $ | 0.484375 | August 8, 2014 | September 12, 2014 | September 30, 2014 | ||||||
| December 31, 2014 | Common stock | $ | 0.160000 | November 4, 2014 | December 31, 2014 | January 14, 2015 | ||||||
| December 31, 2014 | Preferred stock | $ | 0.484375 | November 4, 2014 | December 12, 2014 | December 31, 2014 | ||||||
Recent Developments
Acquisition Activity
Subsequent to December 31, 2014, we acquired seven industrial buildings containing 927,017 square feet for a total purchase price of approximately $125.4 million. The properties were acquired from unrelated third parties using cash on hand. The following table sets forth the wholly-owned industrial properties we acquired subsequent to December 31, 2014:
| Property Name |
Location | Acquisition Date | Number of Buildings |
Square Feet | Purchase Price (in thousands) |
Stabilized Cap Rate |
||||||||||||||
| 10100 NW 25th |
Doral, FL | January 23, 2015 | 1 | 106,810 | $ | 9,875 | 6.4 | % | ||||||||||||
| V Street |
Washington, D.C. | January 29, 2015 | 6 | 820,207 | 115,500 | 5.8 | % | |||||||||||||
|
|
|
|
|
|
|
|
|
|||||||||||||
| Total |
7 | 927,017 | $ | 125,375 | 5.8 | % | ||||||||||||||
|
|
|
|
|
|
|
|
|
|||||||||||||
41
Table of Contents
Contractual Commitments
As of February 11, 2015 we have five outstanding contracts with third-party sellers to acquire five industrial properties, one non-binding letter of intent with a third-party seller to acquire one industrial property and one outstanding contract with a third-party purchaser to sell one property as further described under the heading “Contractual Obligations” in this Annual Report on Form 10-K. There is no assurance that we will acquire or sell the properties under contract or non-binding letter of intent because the proposed acquisitions and disposition are subject to the completion of satisfactory due diligence, various closing conditions and with respect to one of the properties, the consent of the mortgage lender, and, in addition, with respect to the property under non-binding letter of intent, our entry into a purchase and sale agreement.
Outlook
We believe that industrial rents have stopped falling in our markets and in most cases are rising and will continue to rise in 2015. However, new speculative development has begun in a growing number of markets. This new development is likely to slow potential rent growth from what it would be without such new development. We see a growing set of acquisition opportunities and seek to increase our total acquisitions in 2015 over 2014. Over the intermediate term of the next four to five years, we seek to grow our portfolio to approximately $3.0 billion of assets to optimize our operating efficiency, increase our shareholder liquidity and position us to achieve an investment grade credit rating to broaden our access to capital. We remain mindful, however, that it is per share, rather than aggregate, results that matter. We believe in the long-term operating prospects of our functional, infill coastal assets. We believe in sound balance sheet management. We believe in the benefits of our market-leading corporate governance and exceptionally aligned executive management compensation.
The primary source of our operating revenues and earnings is rents received from tenants under operating leases at our properties, including reimbursements from tenants for certain operating costs. We seek long-term earnings growth primarily through increasing rents and operating income at existing properties and acquiring properties in our six target markets. We intend to seek to grow our portfolio by utilizing one or more of cash on hand, future borrowings under our credit facility, future sales of common or preferred equity and future placements of secured or unsecured debt.
Inflation
Although the U.S. economy has been experiencing relatively modest inflation rates recently, and a wide variety of industries and sectors are affected differently by changing commodity prices, inflation has not had a significant impact on us in our markets of operation. Most of our leases require the tenants to pay their share of operating expenses, including common area maintenance, real estate taxes and insurance, thereby reducing our exposure to increases in costs and operating expenses resulting from inflation. In addition, approximately 64.5% of our total rentable square feet expire within five years which enables us to seek to replace existing leases with new leases at the then-existing market rate.
Financial Condition and Results of Operations
We derive substantially all of our revenues from rents received from tenants under existing leases on each of our properties. These revenues include fixed base rents and recoveries of certain property operating expenses that we have incurred and that we pass through to the individual tenants. Approximately 84.2% of our leased space includes fixed rental increases or Consumer Price Index-based rental increases. Lease terms typically range from three to ten years.
Our primary cash expenses consist of our property operating expenses, which include: real estate taxes, repairs and maintenance, management expenses, insurance, utilities, general and administrative expenses, which include compensation costs, office expenses, professional fees and other administrative expenses, acquisition costs, which include third-party costs paid to brokers and consultants, and interest expense, primarily on mortgage loans and our Amended Facility.
42
Table of Contents
Our consolidated results of operations often are not comparable from period to period due to the impact of property acquisitions at various times during the course of such periods. The results of operations of any acquired property are included in our financial statements as of the date of its acquisition.
The analysis of our results below for the years ended December 31, 2014 and 2013 includes the changes attributable to same store properties. The same store pool for the comparison of the 2014 and 2013 fiscal years includes all properties that were owned and in operation as of December 31, 2014 and since January 1, 2013 and excludes properties that were either disposed of or held for sale to a third party. As of December 31, 2014, the same store pool consisted of 65 buildings aggregating approximately 4.8 million square feet. As of December 31, 2014, the non-same store properties, which we acquired or disposed of during the course of 2013 and 2014, consisted of 61 buildings aggregating approximately 4.5 million square feet. As of December 31, 2014, the consolidated same store pool occupancy was approximately 97.1% compared to approximately 96.3% as of December 31, 2013.
Our future financial condition and results of operations, including rental revenues, straight-line rents and amortization of lease intangibles, may be impacted by the acquisitions of additional properties, and expenses may vary materially from historical results.
Comparison of the Year Ended December 31, 2014 to the Year Ended December 31, 2013:
| For the Year Ended December 31, |
||||||||||||||||
| 2014 | 2013 | $ Change | % Change | |||||||||||||
| (Dollars in thousands) | ||||||||||||||||
| Rental revenues |
||||||||||||||||
| Same store |
$ | 32,550 | $ | 30,942 | $ | 1,608 | 5.2 | % | ||||||||
| 2013 and 2014 Acquisitions |
21,578 | 4,929 | 16,649 | 337.8 | % | |||||||||||
|
|
|
|
|
|
|
|
|
|||||||||
| Total rental revenues |
54,128 | 35,871 | 18,257 | 50.9 | % | |||||||||||
| Tenant expense reimbursements |
||||||||||||||||
| Same store |
9,363 | 8,717 | 646 | 7.4 | % | |||||||||||
| 2013 and 2014 Acquisitions |
5,384 | 941 | 4,443 | 472.2 | % | |||||||||||
|
|
|
|
|
|
|
|
|
|||||||||
| Total tenant expense reimbursements |
14,747 | 9,658 | 5,089 | 52.7 | % | |||||||||||
|
|
|
|
|
|
|
|
|
|||||||||
| Total revenues |
68,875 | 45,529 | 23,346 | 51.3 | % | |||||||||||
|
|
|
|
|
|
|
|
|
|||||||||
| Property operating expenses |
||||||||||||||||
| Same store |
11,362 | 11,018 | 344 | 3.1 | % | |||||||||||
| 2013 and 2014 Acquisitions |
7,799 | 1,753 | 6,046 | 344.9 | % | |||||||||||
|
|
|
|
|
|
|
|
|
|||||||||
| Total property operating expenses |
19,161 | 12,771 | 6,390 | 50.0 | % | |||||||||||
|
|
|
|
|
|
|
|
|
|||||||||
| Net operating income 1 |
||||||||||||||||
| Same store |
30,551 | 28,641 | 1,910 | 6.7 | % | |||||||||||
| 2013 and 2014 Acquisitions |
19,163 | 4,117 | 15,046 | 365.5 | % | |||||||||||
|
|
|
|
|
|
|
|
|
|||||||||
| Total net operating income |
$ | 49,714 | $ | 32,758 | $ | 16,956 | 51.8 | % | ||||||||
|
|
|
|
|
|
|
|
|
|||||||||
| Other costs and expenses |
||||||||||||||||
| Depreciation and amortization |
19,170 | 12,481 | 6,689 | 53.6 | % | |||||||||||
| General and administrative |
9,496 | 8,423 | 1,073 | 12.7 | % | |||||||||||
| Acquisition costs |
3,740 | 3,298 | 442 | 13.4 | % | |||||||||||
|
|
|
|
|
|
|
|
|
|||||||||
| Total other costs and expenses |
32,406 | 24,202 | 8,204 | 33.9 | % | |||||||||||
|
|
|
|
|
|
|
|
|
|||||||||
| Other income (expense) |
||||||||||||||||
| Interest and other income |
1 | 109 | (108 | ) | (99.1 | )% | ||||||||||
| Interest expense, including amortization |
(6,591 | ) | (6,214 | ) | (377 | ) | 6.1 | % | ||||||||
|
|
|
|
|
|
|
|
|
|||||||||
| Total other income and expenses |
(6,590 | ) | (6,105 | ) | (485 | ) | 7.9 | % | ||||||||
|
|
|
|
|
|
|
|
|
|||||||||
| Income from discontinued operations |
— | 4,190 | (4,190 | ) | n/a | |||||||||||
|
|
|
|
|
|
|
|
|
|||||||||
| Net income |
$ | 10,718 | $ | 6,641 | $ | 4,077 | 61.4 | % | ||||||||
|
|
|
|
|
|
|
|
|
|||||||||
43
Table of Contents
| 1 | Includes straight-line rents and amortization of lease intangibles. See “Non-GAAP Financial Measures” in this Annual Report on Form 10-K for a reconciliation of net operating income and same store net operating income from net income and a discussion of why we believe net operating income and same store net operating income are useful supplemental measures of our operating performance. |
Revenues. Total revenues increased approximately $23.3 million for the year ended December 31, 2014 compared to the prior year due primarily to property acquisitions during 2013 and 2014 and increased occupancy in the same store pool portfolio. The increase in same store revenues is primarily related to same store consolidated occupancy at year end increasing to 97.1% as of December 31, 2014 as compared to 96.3% as of December 31, 2013. In addition, rent changes on new and renewed leases commenced during the year ended December 31, 2014 were approximately 8.0% higher as compared with the previous rental rates in that same space. For the quarter and year ended December 31, 2014, approximately $0.3 million and $1.5 million, respectively, was recorded in straight-line rental revenues related to contractual rent abatements given to certain tenants.
Property operating expenses. Total property operating expenses increased approximately $6.4 million during the year ended December 31, 2014 compared to the same period from the prior year due primarily to property acquisitions during 2013 and 2014. Total same store property operating expenses increased during the year ended December 31, 2014 compared to the same period from the prior year primarily due to an increase in snow removal expenses.
Depreciation and amortization. Depreciation and amortization increased approximately $6.7 million during the year ended December 31, 2014 compared to the same period from the prior year due to property acquisitions during 2013 and 2014.
General and administrative expenses. General and administrative expenses increased approximately $1.1 million for the year ended December 31, 2014 compared to the same period from the prior year due primarily to increased compensation expense and professional fees and offset by a decrease in the accrued performance share awards of approximately $0.3 million as compared to the prior year period.
Acquisition costs. Acquisition costs increased by approximately $0.4 million for the year ended December 31, 2014 from the prior year due to a higher volume of property acquisitions during the year ended December 31, 2014 as compared to the prior year.
Interest and other income. Interest and other income decreased approximately $0.1 million for the year ended December 31, 2014 compared to the same period from the prior year due primarily to insurance proceeds received in 2013 in excess of expenses due to Hurricane Sandy.
Interest expense, including amortization. Interest expense increased approximately $0.4 million for the year ended December 31, 2014 compared to the prior year due primarily to the assumption and origination of mortgage loans payable during 2013 and 2014, as well as an increase in borrowings on the Amended Facility, net of capitalized interest.
The analysis of our results below for the years ended December 31, 2013 and 2012 includes the changes attributable to same store properties. The same store pool for the comparison of the 2013 and 2012 fiscal years includes all properties that were owned and in operation as of December 31, 2013 and since January 1, 2012 and excludes properties that were either disposed of or held for sale to a third party. As of December 31, 2013, the same store pool consisted of 44 buildings aggregating approximately 3.1 million square feet. As of December 31, 2013, the non-same store properties, which we acquired or disposed of during the course of 2012 and 2013, consisted of 52 buildings aggregating approximately 3.7 million square feet. As of December 31, 2013, the consolidated same store pool occupancy was approximately 96.8% compared to approximately 95.3% as of December 31, 2012.
44
Table of Contents
Comparison of the Year Ended December 31, 2013 to the Year Ended December 31, 2012:
| For the Year Ended December 31, |
||||||||||||||||
| 2013 | 2012 | $ Change | % Change | |||||||||||||
| (Dollars in thousands) | ||||||||||||||||
| Rental revenues |
||||||||||||||||
| Same store |
$ | 18,779 | $ | 17,889 | $ | 890 | 5.0 | % | ||||||||
| 2012 and 2013 Acquisitions |
17,092 | 5,168 | 11,924 | 230.7 | % | |||||||||||
|
|
|
|
|
|
|
|
|
|||||||||
| Total rental revenues |
35,871 | 23,057 | 12,814 | 55.6 | % | |||||||||||
| Tenant expense reimbursements |
||||||||||||||||
| Same store |
5,630 | 5,012 | 618 | 12.3 | % | |||||||||||
| 2012 and 2013 Acquisitions |
4,028 | 1,266 | 2,762 | 218.2 | % | |||||||||||
|
|
|
|
|
|
|
|
|
|||||||||
| Total tenant expense reimbursements |
9,658 | 6,278 | 3,380 | 53.8 | % | |||||||||||
|
|
|
|
|
|
|
|
|
|||||||||
| Total revenues |
45,529 | 29,335 | 16,194 | 55.2 | % | |||||||||||
|
|
|
|
|
|
|
|
|
|||||||||
| Property operating expenses |
||||||||||||||||
| Same store |
7,163 | 6,965 | 198 | 2.8 | % | |||||||||||
| 2012 and 2013 Acquisitions |
5,608 | 1,597 | 4,011 | 251.2 | % | |||||||||||
|
|
|
|
|
|
|
|
|
|||||||||
| Total property operating expenses |
12,771 | 8,562 | 4,209 | 49.2 | % | |||||||||||
|
|
|
|
|
|
|
|
|
|||||||||
| Net operating income 1 |
||||||||||||||||
| Same store |
17,246 | 15,936 | 1,310 | 8.2 | % | |||||||||||
| 2012 and 2013 Acquisitions |
15,512 | 4,837 | 10,675 | 220.7 | % | |||||||||||
|
|
|
|
|
|
|
|
|
|||||||||
| Total net operating income |
$ | 32,758 | $ | 20,773 | $ | 11,985 | 57.7 | % | ||||||||
|
|
|
|
|
|
|
|
|
|||||||||
| Other costs and expenses |
||||||||||||||||
| Depreciation and amortization |
12,481 | 8,728 | 3,753 | 43.0 | % | |||||||||||
| General and administrative |
8,423 | 6,403 | 2,020 | 31.5 | % | |||||||||||
| Acquisition costs |
3,298 | 2,238 | 1,060 | 47.4 | % | |||||||||||
|
|
|
|
|
|
|
|
|
|||||||||
| Total other costs and expenses |
24,202 | 17,369 | 6,833 | 39.3 | % | |||||||||||
|
|
|
|
|
|
|
|
|
|||||||||
| Other income (expense) |
||||||||||||||||
| Interest and other income |
109 | 37 | 72 | 194.6 | % | |||||||||||
| Interest expense, including amortization |
(6,214 | ) | (5,472 | ) | (742 | ) | 13.6 | % | ||||||||
|
|
|
|
|
|
|
|
|
|||||||||
| Total other income and expenses |
(6,105 | ) | (5,435 | ) | (670 | ) | 12.3 | % | ||||||||
|
|
|
|
|
|
|
|
|
|||||||||
| Income from discontinued operations |
4,190 | 6,096 | (1,906 | ) | (31.3 | )% | ||||||||||
|
|
|
|
|
|
|
|
|
|||||||||
| Net income |
$ | 6,641 | $ | 4,065 | $ | 2,576 | 63.4 | % | ||||||||
|
|
|
|
|
|
|
|
|
|||||||||
| 1 | Includes straight-line rents and amortization of lease intangibles. See “Non-GAAP Financial Measures” in this Annual Report on Form 10-K for a reconciliation of net operating income and same store net operating income from net income and a discussion of why we believe net operating income and same store net operating income are useful supplemental measures of our operating performance. |
Revenues. Total revenues increased approximately $16.2 million for the year ended December 31, 2013 compared to the prior year due primarily to property acquisitions during 2012 and 2013. The increase in same store revenues in 2013 is primarily due to the 2012 write-off of $1.1 million related to the tenant default as described under the heading “2014 Developments – Tenant Default.” For the quarter and year ended December 31, 2013, approximately $0.4 million and $2.4 million, respectively, was recorded in straight-line rental revenues related to contractual rent abatements given to certain tenants.
45
Table of Contents
Property operating expenses. Total property operating expenses increased approximately $4.2 million during the year ended December 31, 2013 compared to the same period from the prior year. The increase in total property operating expenses was due to an increase of approximately $4.0 million attributable to property acquisitions during 2012 and 2013 and an increase in same store operating expenses of approximately $0.2 million compared to the same period from the prior year due to non-reimbursable legal expenses related to the tenant default described under the heading “2014 Developments – Tenant Default” and an increase in real estate tax expense.
Depreciation and amortization. Depreciation and amortization increased approximately $3.8 million during the year ended December 31, 2013 compared to the same period from the prior year due to property acquisitions during 2012 and 2013.
General and administrative expenses. General and administrative expenses increased approximately $2.0 million for the year ended December 31, 2013 compared to the same period from the prior year due primarily to an increase in the accrued performance share awards of approximately $0.6 million and increased compensation expense and professional fees as compared to the prior year.
Acquisition costs. Acquisition costs increased by approximately $1.1 million for the year ended December 31, 2013 from the prior year due to a higher volume of property acquisitions during the year ended December 31, 2013 as compared to the prior year.
Interest and other income. Interest and other income increased approximately $0.1 million for the year ended December 31, 2013 compared to the prior year due primarily to insurance proceeds received in 2013 in excess of expenses due to Hurricane Sandy.
Interest expense, including amortization. Interest expense increased approximately $0.7 million for the year ended December 31, 2013 compared to the prior year due primarily to the assumption and origination of mortgage loans payable during 2013 and 2013, as well as borrowings under our Amended Facility.
Liquidity and Capital Resources
The primary objective of our financing strategy is to maintain financial flexibility with a conservative capital structure using retained cash flows, long-term debt and the issuance of common and perpetual preferred stock to finance our growth. Over the long-term, we intend to:
| • | limit the sum of the outstanding principal amount of our consolidated indebtedness and the liquidation preference of any outstanding perpetual preferred stock to less than 40% of our total enterprise value; |
| • | maintain a fixed charge coverage ratio in excess of 2.0x; |
| • | limit the principal amount of our outstanding floating rate debt to less than 20% of our total consolidated indebtedness; and |
| • | have staggered debt maturities that are aligned to our expected average lease term (5-7 years), positioning us to re-price parts of our capital structure as our rental rates change with market conditions. |
We intend to preserve a flexible capital structure with a long-term goal to obtain an investment grade rating and be in a position to issue unsecured debt and additional perpetual preferred stock. Prior to attaining an investment grade rating, we intend to primarily utilize credit facilities, recourse bank term loans or non-recourse debt secured by individual properties or pools of properties with a targeted maximum loan-to-value of 65% at the time of financing, and perpetual preferred stock. We may also assume debt in connection with property acquisitions which may have a higher loan-to-value.
We expect to meet our short-term liquidity requirements generally through net cash provided by operations, existing cash balances and, if necessary, short-term borrowings under our Amended Facility. We believe that our
46
Table of Contents
net cash provided by operations will be adequate to fund operating requirements, pay interest on any borrowings and fund distributions in accordance with the REIT requirements of the federal income tax laws. In the near-term, we intend to fund future investments in properties with term loans, mortgages, borrowings under our Amended Facility, perpetual preferred and common stock issuance and, from time to time, property sales. We expect to meet our long-term liquidity requirements, including with respect to other investments in industrial properties, property acquisitions and scheduled debt maturities, through borrowings under our Amended Facility, periodic issuances of common stock, perpetual preferred stock, and long-term secured and unsecured debt, and with proceeds from the disposition of properties. The success of our acquisition strategy may depend, in part, on our ability to obtain and borrow under our credit facility and to access additional capital through issuances of equity and debt securities.
On January 13, 2012, we completed a public follow-on offering of 4,000,000 shares of our common stock, including 93,000 shares purchased by our senior management and directors, at a price per share of $14.25. On February 13, 2012, we sold an additional 61,853 shares of our common stock at a price per share of $14.25 upon the exercise by the underwriters of their option to purchase additional shares. The net proceeds of the offering, after deducting the underwriting discount and estimated offering costs, were approximately $54.7 million. We used approximately $41.0 million of the net proceeds to repay outstanding borrowings under our credit facility on January 13, 2012 and the remaining net proceeds were used to invest in industrial properties and for general business purposes.
On July 19, 2012, we completed a public offering of 1,840,000 shares of our Series A Preferred Stock, including 240,000 shares sold upon the exercise by the underwriters of their option to purchase additional shares, at a price per share of $25.00. The net proceeds of the offering were approximately $44.3 million after deducting the underwriting discount and other offering expenses of approximately $1.7 million. We used the net proceeds to reduce outstanding borrowings under our Amended Facility. Dividends on the Series A Preferred Stock are payable when, as and if authorized by our board of directors quarterly in arrears on or about the last day of March, June, September and December of each year. The Series A Preferred Stock ranks, with respect to dividend rights and rights upon our liquidation, dissolution or winding-up, senior to our common stock.
Generally, we may not redeem the Series A Preferred Stock prior to July 19, 2017, except in limited circumstances relating to our ability to qualify as a REIT, and pursuant to a special optional redemption related to a specified change of control (as defined in the articles supplementary for the Series A Preferred Stock). On and after July 19, 2017, we may, at our option, redeem the Series A Preferred Stock, in whole or in part, at any time or from time to time, for cash at a redemption price of $25.00 per share, plus any accrued and unpaid dividends (whether or not authorized or declared) up to but excluding the redemption date.
On February 19, 2013, we completed a public follow-on offering of 5,750,000 shares of our common stock at a price per share of $16.60, including 90,325 shares that were sold in the offering to our executive and senior officers and members of our board of directors. No underwriting discount or commission was paid on the shares sold to such officers and directors. The net proceeds of the offering, after deducting the underwriting discount and offering costs, were approximately $90.8 million. We used approximately $65.4 million of the net proceeds to repay outstanding borrowings under our revolving credit facility and the remaining net proceeds to invest in industrial properties and for general business purposes.
On July 11, 2013, we completed a public follow-on offering of 5,750,000 shares of our common stock at a price per share of $18.25, including 43,250 shares that were sold in the offering to our executive and senior officers and members of our board of directors. No underwriting discount or commission was paid on the shares sold to such officers and directors. The net proceeds of the offering were approximately $99.9 million after deducting the underwriting discount and offering costs of approximately $5.0 million. We used approximately $6.5 million of the net proceeds to repay outstanding borrowings under our revolving credit facility and the remaining net proceeds to acquire industrial properties and for general business purposes.
47
Table of Contents
On February 28, 2014, we established an ATM Program pursuant to which we may issue and sell shares of our common stock having an aggregate offering price of up to $100,000,000 in amounts and at times as we determine from time to time. Actual sales, if any, will depend on a variety of factors to be determined by our company from time to time, including, among others, market conditions, the trading price of our common stock, our determinations of the appropriate sources of funding for our company and potential uses of funding available to us. We intend to use the net proceeds from the offering of the shares under the ATM Program, if any, for general corporate purposes, which may include future acquisitions and repayment of indebtedness, including borrowings under our Amended Facility. During the year ended December 31, 2014, we did not issue any shares of common stock under the ATM Program.
On May 22, 2014, we completed a public follow-on offering of 8,050,000 shares of our common stock at a price per share of $17.75. The net proceeds of the follow-on offering were approximately $136.5 million after deducting the underwriting discount and offering costs of approximately $6.4 million. We used approximately $100.0 million of the net proceeds to repay outstanding borrowings under our revolving credit facility and the remaining net proceeds to acquire industrial properties and for general business purposes.
On December 9, 2014, we completed a public follow-on offering of 9,775,000 shares of our common stock at a price per share of $19.60. The net proceeds of the follow-on offering were approximately $183.0 million after deducting the underwriting discount and offering costs of approximately $8.6 million. We intend to use the net proceeds to acquire industrial properties and for general corporate purposes.
On May 8, 2014, we entered into a Third Amended and Restated Senior Credit Agreement (the “Facility”) with KeyBank National Association, as administrative agent and as a lender, KeyBanc Capital Markets, as a lead arranger and PNC Bank, National Association, Union Bank, N.A. and Regions Bank as lenders (collectively the “Lenders”) to, among other matters, add a seven-year $50.0 million term loan to the existing $150.0 million facility, which included a $100.0 million revolving credit facility and a five-year $50.0 million term loan. The seven-year $50.0 million term loan maturity date under the Facility is May 2021. The five-year $50.0 million term loan maturity date under the Facility was extended to May 2019 (previously January 2018) and the maturity date of the revolving credit facility was extended to May 2018 (previously January 2016) with one 12-month extension option exercisable by us, subject, among other things, to there being an absence of an event of default under the Facility and to the payment of an extension fee.
On December 8, 2014 we entered into a first amendment to the Facility (the “Amended Facility”) with KeyBank National Association, as administrative agent and as a lender, and PNC Bank, National Association, MUFG Union Bank, N.A., Regions Bank and Goldman Sachs Bank USA as lenders to add a five-year $100.0 million term loan to our existing $200.0 million credit facility. The five-year $100.0 million term loan matures in March 2020.
The aggregate amount of the Amended Facility may be increased to a total of up to $500.0 million, subject to the approval of the administrative agent and the identification of lenders willing to make available additional amounts. Outstanding borrowings under the Amended Facility are limited to the lesser of (i) the sum of our $100.0 million revolving credit facility, our $50.0 million five-year term loan, our $50.0 million seven-year term loan and our $100.0 million five-year term loan or (ii) 60.0% of the value of the unencumbered properties. Interest on the Amended Facility, including the five-year and seven-year term loans, is generally to be paid based upon, at our option, either (i) LIBOR plus the applicable LIBOR margin or (ii) the applicable base rate which is the greatest of the administrative agent’s prime rate, 0.50% above the federal funds effective rate, or thirty-day LIBOR plus the applicable LIBOR margin for LIBOR rate loans under the Amended Facility plus 1.25%. The applicable LIBOR margin will range from 1.50% to 2.05% (1.50% at December 31, 2014) for the revolving credit facility and each of the five-year term loans and 1.75% to 2.30% (1.75% at December 31, 2014) for the seven-year term loan, depending on the ratio of our outstanding consolidated indebtedness to the value of our consolidated gross asset value.
48
Table of Contents
The Amended Facility requires quarterly payments of an annual unused facility fee in an amount equal to 0.20% or 0.25% depending on the unused portion of the Amended Facility. The Amended Facility is guaranteed by us and by substantially all of the current and to-be-formed subsidiaries of the borrower that own an unencumbered property. The Amended Facility has been modified to be unsecured by our properties or by interests in the subsidiaries that hold such properties. The Amended Facility includes a series of financial and other covenants that we must comply with in order to borrow under the Amended Facility. As of December 31, 2014, there were no borrowings outstanding on the revolving credit facility and $200.0 million of borrowings outstanding on the term loans. As of December 31, 2013, there were $31.0 million of borrowings outstanding on the revolving credit facility and $50.0 million of borrowings outstanding on a five-year term loan. We were in compliance with the covenants under the Amended Facility at December 31, 2014 and 2013.
As of December 31, 2014 and 2013, we had outstanding mortgage loans payable of approximately $104.5 million and $108.3 million, respectively, and held cash and cash equivalents totaling approximately $190.6 million and $7.0 million, respectively.
The following table summarizes our debt maturities, principal payments, market capitalization, capitalization ratios, Adjusted EBITDA, interest coverage, fixed charge coverage and debt ratios as of and for the year ended December 31, 2014 (dollars in thousands):
| Credit Facility |
Term Loans |
Mortgage Loans Payable |
Total Debt | |||||||||||||
| 2015 |
$ | — | $ | — | $ | 24,788 | $ | 24,788 | ||||||||
| 2016 |
— | — | 12,130 | 12,130 | ||||||||||||
| 2017 |
— | — | 1,916 | 1,916 | ||||||||||||
| 2018 |
— | — | 1,910 | 1,910 | ||||||||||||
| 2019 |
— | 50,000 | 18,806 | 68,806 | ||||||||||||
| Thereafter |
— | 150,000 | 44,348 | 194,348 | ||||||||||||
|
|
|
|
|
|
|
|
|
|||||||||
| Subtotal |
— | 200,000 | 103,898 | 303,898 | ||||||||||||
| Unamortized net premiums |
— | — | 603 | 603 | ||||||||||||
|
|
|
|
|
|
|
|
|
|||||||||
| Total Debt |
$ | — | $ | 200,000 | $ | 104,501 | $ | 304,501 | ||||||||
|
|
|
|
|
|
|
|
|
|||||||||
| Weighted Average Interest Rate |
n/a | 1.7 | % | 4.5 | % | 2.7 | % | |||||||||
| Shares Outstanding 1 |
Market Price 2 | Market Value | ||||||||||
| Common Stock |
42,869,463 | $ | 20.63 | $ | 884,397 | |||||||
| Preferred Stock ($25.00 per share liquidation preference) |
46,000 | |||||||||||
|
|
|
|||||||||||
| Total Equity |
930,397 | |||||||||||
|
|
|
|||||||||||
| Total Market Capitalization |
$ | 1,234,898 | ||||||||||
|
|
|
|||||||||||
| Total Debt-to-Total Investments in Properties 3 |
33.5 | % | ||||||||||
| Total Debt-to-Total Market Capitalization 4 |
24.7 | % | ||||||||||
| Total Debt and Preferred Stock-to-Total Market Capitalization 5 |
28.4 | % | ||||||||||
| Floating Rate Debt as a % of Total Debt 6 |
65.7 | % | ||||||||||
| Adjusted EBITDA 7 |
$ | 42,279 | ||||||||||
| Interest Coverage 8 |
6.4 x | |||||||||||
| Fixed Charge Coverage 9 |
4.0 x | |||||||||||
| Total Debt-to-Adjusted EBITDA 10 |
6.6 x | |||||||||||
| Total Debt and Preferred Stock-to-Adjusted EBITDA 11 |
7.6 x | |||||||||||
| Weighted Average Maturity (years) |
4.8 | |||||||||||
49
Table of Contents
| 1 | Includes 156,488 shares of unvested restricted stock as of December 31, 2014. |
| 2 | Closing price of our shares of common stock on the New York Stock Exchange on December 31, 2014 in dollars per share. |
| 3 | Total debt-to-total investments in properties is calculated as total debt, including premiums, divided by total investments in properties, including properties held for sale with a gross book value of $6.9 million, as of December 31, 2014. |
| 4 | Total debt-to-total market capitalization is calculated as total debt, including premiums, divided by total market capitalization as of December 31, 2014. |
| 5 | Total debt and preferred stock-to-total market capitalization is calculated as total debt, including premiums, plus preferred stock at liquidation preference, divided by total market capitalization as of December 31, 2014. |
| 6 | Floating rate debt includes our $50.0 million seven-year term loan with an interest rate cap of 4.0% plus 1.75% to 2.30% depending on leverage. See “Note 9 – Derivative Financial Instruments” for more information regarding our interest rate cap that we entered into in October 2014 and is in effect beginning December 1, 2014. |
| 7 | Earnings before interest, taxes, gains (losses) from sales of property, depreciation and amortization, acquisition costs and stock-based compensation (“Adjusted EBITDA”) for the year ended December 31, 2014. See “Non-GAAP Financial Measures” in this Annual Report on Form 10-K for a reconciliation of Adjusted EBITDA from net income and a discussion of why we believe Adjusted EBITDA is a useful supplemental measure of our operating performance. |
| 8 | Interest coverage is calculated as Adjusted EBITDA divided by interest expense, including amortization. See “Non-GAAP Financial Measures” in this Annual Report on Form 10-K for a reconciliation of Adjusted EBITDA from net income and a discussion of why we believe Adjusted EBITDA is a useful supplemental measure of our operating performance. |
| 9 | Fixed charge coverage is calculated as Adjusted EBITDA divided by interest expense, including amortization plus preferred stock dividends. See “Non-GAAP Financial Measures” in this Annual Report on Form 10-K for a reconciliation of Adjusted EBITDA from net income and a discussion of why we believe Adjusted EBITDA is a useful supplemental measure of our operating performance. |
| 10 | Total debt-to-Adjusted EBITDA is calculated as total debt, including premiums, divided by annualized Adjusted EBITDA. See “Non-GAAP Financial Measures” in this Annual Report on Form 10-K for a reconciliation of Adjusted EBITDA from net income and a discussion of why we believe Adjusted EBITDA is a useful supplemental measure of our operating performance. |
| 11 | Total debt and preferred stock-to-Adjusted EBITDA is calculated as total debt, including premiums, plus preferred stock divided by annualized Adjusted EBITDA. See “Non-GAAP Financial Measures” in this Annual Report on Form 10-K for a reconciliation of Adjusted EBITDA from net income and a discussion of why we believe Adjusted EBITDA is a useful supplemental measure of our operating performance. |
The following table sets forth the cash dividends paid or payable per share during the years ended December 31, 2014 and 2013.
| For the Three Months Ended |
Security | Dividend per Share |
Declaration Date | Record Date | Date Paid | |||||||
| March 31, 2014 | Common stock | $ | 0.130000 | February 19, 2014 | April 7, 2014 | April 21, 2014 | ||||||
| March 31, 2014 | Preferred stock | $ | 0.484375 | February 19, 2014 | March 10, 2014 | March 31, 2014 | ||||||
| June 30, 2014 | Common stock | $ | 0.140000 | May 9, 2014 | July 7, 2014 | July 21, 2014 | ||||||
| June 30, 2014 | Preferred stock | $ | 0.484375 | May 9, 2014 | June 11, 2014 | June 30, 2014 | ||||||
| September 30, 2014 | Common stock | $ | 0.140000 | August 8, 2014 | October 7, 2014 | October 21, 2014 | ||||||
| September 30, 2014 | Preferred stock | $ | 0.484375 | August 8, 2014 | September 12, 2014 | September 30, 2014 | ||||||
| December 31, 2014 | Common stock | $ | 0.160000 | November 4, 2014 | December 31, 2014 | January 14, 2015 | ||||||
| December 31, 2014 | Preferred stock | $ | 0.484375 | November 4, 2014 | December 12, 2014 | December 31, 2014 | ||||||
50
Table of Contents
| For the Three Months Ended |
Security | Dividend per Share |
Declaration Date | Record Date | Date Paid | |||||||
| March 31, 2013 | Common stock | $ | 0.120000 | February 19, 2013 | April 5, 2013 | April 19, 2013 | ||||||
| March 31, 2013 | Preferred stock | $ | 0.484375 | February 19, 2013 | March 11, 2013 | March 31, 2013 | ||||||
| June 30, 2013 | Common stock | $ | 0.130000 | May 7, 2013 | July 5, 2013 | July 19, 2013 | ||||||
| June 30, 2013 | Preferred stock | $ | 0.484375 | May 7, 2013 | June 11, 2013 | July 1, 2013 | ||||||
| September 30, 2013 | Common stock | $ | 0.130000 | August 6, 2013 | October 7, 2013 | October 21, 2013 | ||||||
| September 30, 2013 | Preferred stock | $ | 0.484375 | August 6, 2013 | September 11, 2013 | September 30, 2013 | ||||||
| December 31, 2013 | Common stock | $ | 0.130000 | November 5, 2013 | December 31, 2013 | January 14, 2014 | ||||||
| December 31, 2013 | Preferred stock | $ | 0.484375 | November 5, 2013 | December 11, 2013 | December 31, 2013 | ||||||
Sources and Uses of Cash
Our principal sources of cash are cash from operations, borrowings under mortgage loans payable, draws on our Amended Facility and common and preferred stock issuances. Our principal uses of cash are asset acquisitions, debt service, capital expenditures, operating costs, corporate overhead costs and common and preferred stock dividends.
Cash From Operating Activities. Net cash provided by operating activities totaled approximately $29.3 million for the year ended December 31, 2014 compared to approximately $13.5 million for the year ended December 31, 2013. This increase in cash provided by operating activities is primarily attributable to additional cash flows generated from properties acquired during 2013 and 2014.
Cash From Investing Activities. Net cash used in investing activities was $249.9 million and $201.9 million, respectively, for the years ended December 31, 2014 and 2013, which consists primarily of cash paid for property acquisitions of $225.8 million and $209.3 million, respectively, and additions to buildings, improvements and leasing costs of approximately $19.7 million and $9.5 million, respectively, offset by proceeds from sales of real estate investments of approximately $17.5 million for the year ended December 31, 2013.
Cash From Financing Activities. Net cash provided by financing activities was $404.2 million for the year ended December 31, 2014, which consists primarily of $319.6 million in net common stock issuance proceeds and net borrowings on the Amended Facility of approximately $119.0 million less approximately $12.3 million in net payments on mortgage loan payables and $19.3 million in dividend payments. Net cash provided by financing activities was $189.4 million for the year ended December 31, 2013, which consists primarily of $190.8 million in net common stock issuance proceeds and net borrowings on the Amended Facility of approximately $15.6 million less approximately $13.2 million in dividend payments.
Critical Accounting Policies
Below is a discussion of the accounting policies that we believe are critical. We consider these policies critical because they require estimates about matters that are inherently uncertain, involve various assumptions and require significant management judgment, and because they are important for understanding and evaluating our reported financial results. These judgments will affect the reported amounts of assets and liabilities and our disclosure of contingent assets and liabilities at the dates of the financial statements and the reported amounts of revenue and expenses during the reporting periods. Applying different estimates or assumptions may result in materially different amounts reported in our financial statements.
Capitalization of Costs. We capitalize costs directly related to the redevelopment, expansion and renovation of our investment in real estate. Costs associated with redevelopment, expansion or renovation projects are capitalized as incurred. If the project is abandoned, these costs are expensed during the period in which the redevelopment project is abandoned. Costs considered for capitalization include, but are not limited to, construction costs, interest, real estate taxes and insurance, if appropriate. These costs are capitalized only during the period in which activities necessary to ready an asset for its intended use are in progress. In the event that the
51
Table of Contents
activities to ready the asset for its intended use are suspended, the capitalization period will cease until such activities are resumed. Costs incurred for maintaining and repairing properties, which do not extend their useful lives, are expensed as incurred.
Interest is capitalized based on actual capital expenditures from the period when redevelopment or expansion commences until the asset is ready for its intended use, at the weighted average borrowing rate during the period.
Property Acquisitions. Upon acquisition of a property, which are accounted for as business combinations, we estimate the fair value of acquired tangible assets (consisting generally of land, buildings and improvements) and intangible assets and liabilities (consisting generally of the above and below-market leases and the origination value of all in-place leases). We determine fair values using replacement cost, estimated cash flow projections and other valuation techniques and applying appropriate discount and capitalization rates based on available market information. Mortgage loans assumed in connection with acquisitions are recorded at their fair value using current market interest rates for similar debt at the date of acquisition. Acquisition-related costs associated with business combinations are expensed as incurred.
The fair value of the tangible assets is determined by valuing the property as if it were vacant. Land values are derived from current comparative sales values, when available, or management’s estimates of the fair value based on market conditions and the experience of our management team. Building and improvement values are calculated as replacement cost less depreciation, or management’s estimates of the fair value of these assets using discounted cash flows analyses or similar methods. The fair value of the above and below-market leases is based on the present value of the difference between the contractual amounts to be received pursuant to the acquired leases (using a discount rate that reflects the risks associated with the acquired leases) and our estimate of the market lease rates measured over a period equal to the remaining term of the leases plus the term of any below-market fixed rate renewal options. The above and below-market lease values are amortized to rental revenues over the remaining initial term plus the term of any below-market fixed rate renewal options that are considered bargain renewal options of the respective leases. The origination value of in-place leases is based on costs to execute similar leases including commissions and other related costs. The origination value of in-place leases also includes real estate taxes, insurance and an estimate of lost rent revenue at market rates during the estimated time required to lease up the property from vacant to the occupancy level at the date of acquisition.
Impairment. Carrying values for financial reporting purposes are reviewed for impairment on a property-by-property basis whenever events or changes in circumstances indicate that the carrying value of a property may not be fully recoverable. Examples of such events or changes in circumstances may include classifying an asset to be held for sale, changing the intended hold period or when an asset remains vacant significantly longer than expected. The intended use of an asset either held for sale or held for use can significantly impact how impairment is measured. If an asset is intended to be held for the long-term, the recoverability is based on the undiscounted future cash flows. If the asset carrying value is not supported on an undiscounted future cash flow basis, then the asset carrying value is measured against the lower of cost or the present value of expected cash flows over the expected hold period. An impairment charge to earnings is recognized for the excess of the asset’s carrying value over the lower of cost or the present values of expected cash flows over the expected hold period. If an asset is intended to be sold, impairment is determined using the estimated fair value less costs to sell. The estimation of expected future net cash flows is inherently uncertain and relies on assumptions, among other things, regarding current and future economic and market conditions and the availability of capital. We determine the estimated fair values based on its assumptions regarding rental rates, lease-up and holding periods, as well as sales prices. When available, current market information is used to determine capitalization and rental growth rates. If available, current comparative sales values may also be used to establish fair value. When market information is not readily available, the inputs are based on our understanding of market conditions and the experience of our management team. Actual results could differ significantly from our estimates. The discount rates used in the fair value estimates represent a rate commensurate with the indicated holding period with a premium layered on for risk.
52
Table of Contents
Discontinued Operations. We separately report as discontinued operations the historical operating results attributable to properties sold and the applicable gain or loss on the disposition of the properties. Although this application may affect the presentation of our results of operations for the periods that we have already reported, there will be no effect on our previously reported consolidated financial statements. The results of operations for real estate properties sold or held for sale during the relevant reporting periods were shown under discontinued operations on the consolidated statements of operations. The results of operations for the two properties are included in discontinued operations for the years ended December 31, 2013 and 2012 because these properties were previously classified as held for sale and sold during the year ended December 31, 2013 and 2012. Our other 2014 asset classified as held for sale does not qualify as discontinued operations and its operating results for the year ended December 31, 2014 are presented within income from continuing operations in the consolidated statements of operations.
Revenue Recognition. We record rental revenue from operating leases on a straight-line basis over the term of the leases and maintains an allowance for estimated losses that may result from the inability of our tenants to make required payments. If tenants fail to make contractual lease payments that are greater than our allowance for doubtful accounts, security deposits and letters of credit, then we may have to recognize additional doubtful account charges in future periods. We monitor the liquidity and creditworthiness of our tenants on an on-going basis by reviewing their financial condition periodically as appropriate. Each period we review our outstanding accounts receivable, including straight-line rents, for doubtful accounts and provide allowances as needed. We also record lease termination fees when a tenant has executed a definitive termination agreement with us and the payment of the termination fee is not subject to any conditions that must be met or waived before the fee is due to us. If a tenant remains in the leased space following the execution of a definitive termination agreement, the applicable termination will be deferred and recognized over the term of such tenant’s occupancy.
Tenant expense reimbursement income includes payments and amounts due from tenants pursuant to their leases for real estate taxes, insurance and other recoverable property operating expenses and is recognized as revenues during the same period the related expenses are incurred.
Income Taxes. We elected to be taxed as a REIT under the Code and operate as such beginning with our taxable year ended December 31, 2010. To qualify as a REIT, we must meet certain organizational and operational requirements, including a requirement to distribute at least 90% of our annual REIT taxable income to our stockholders (which is computed without regard to the dividends paid deduction or net capital gain and which does not necessarily equal net income as calculated in accordance with GAAP). As a REIT, we generally will not be subject to federal income tax to the extent we distribute qualifying dividends to our stockholders. If we fail to qualify as a REIT in any taxable year, we will be subject to federal income tax on our taxable income at regular corporate income tax rates and generally will not be permitted to qualify for treatment as a REIT for federal income tax purposes for the four taxable years following the year during which qualification is lost unless the IRS grants us relief under certain statutory provisions. Such an event could materially adversely affect our net income and net cash available for distribution to stockholders. However, we believe we are organized and operate in such a manner as to qualify for treatment as a REIT.
Stock-Based Compensation and Other Long-Term Incentive Compensation. We follow the provisions of ASC 718, Compensation-Stock Compensation, to account for our stock-based compensation plan, which requires that the compensation cost relating to stock-based payment transactions be recognized in the financial statements and that the cost be measured on the fair value of the equity or liability instruments issued. We have adopted the Amended and Restated 2010 Equity Incentive Plan, which provides for the grant of restricted stock awards, performance share awards, unrestricted shares or any combination of the foregoing. Stock-based compensation is recognized as a general and administrative expense in the financial statements and measured at the fair value of the award on the date of grant. We estimate the forfeiture rate based on historical experience as well as expected behavior. The amount of the expense may be subject to adjustment in future periods depending on the specific characteristics of the stock-based award.
53
Table of Contents
In addition, we have awarded long-term incentive target awards to our executives that are payable in shares of our common stock after the conclusion of each pre-established performance measurement period. The amount that may be earned under the long-term incentive plan is variable depending on the relative total shareholder return of our stock as compared to the total shareholder return of the MSCI U.S. REIT Index and the FTSE NAREIT Equity Industrial Index over the pre-established performance measurement period. We estimate the fair value of the long-term incentive target awards using a Monte Carlo simulation model on the date of grant and at each reporting period. These awards are recognized as compensation expense over the requisite performance period based on the fair value of the award at the balance sheet date.
Off-Balance Sheet Arrangements
We do not have any off-balance sheet arrangements that have or are reasonably likely to have a current or future effect on our financial condition, changes in financial condition, revenues or expenses, results of operations, liquidity, capital expenditures or capital resources that are material to investors.
Contractual Obligations
Currently we have five outstanding contracts with third-party sellers to acquire five industrial properties. There is no assurance that we will acquire the properties under contract because the proposed acquisitions are subject to the completion of satisfactory due diligence, various closing conditions and with respect to one of the properties, the consent of the mortgage lender. The following table summarizes certain information with respect to the properties we have under contract:
| Market |
Number of Buildings |
Square Feet | Purchase Price (in thousands) |
Assumed Debt (in thousands) |
||||||||||||
| Los Angeles |
— | — | $ | — | $ | — | ||||||||||
| Northern New Jersey/New York City 1 |
— | — | 9,416 | — | ||||||||||||
| San Francisco Bay Area |
4 | 300,620 | 37,200 | — | ||||||||||||
| Seattle |
4 | 138,154 | 12,250 | 4,837 | ||||||||||||
| Miami |
2 | 87,532 | 8,500 | — | ||||||||||||
| Washington, D.C./Baltimore |
1 | 115,287 | 10,360 | — | ||||||||||||
|
|
|
|
|
|
|
|
|
|||||||||
| Total |
11 | 641,593 | $ | 77,726 | $ | 4,837 | ||||||||||
|
|
|
|
|
|
|
|
|
|||||||||
| 1 | Represents one improved land parcel consisting of 4.5 acres. |
The following table summarizes our contractual obligations due by period as of December 31, 2014 (dollars in thousands):
| Contractual Obligations |
Less than 1 Year |
1-3 Years | 3-5 Years | More than 5 Years |
Total | |||||||||||||||
| Debt |
$ | 24,788 | $ | 14,046 | $ | 20,716 | $ | 244,348 | $ | 303,898 | ||||||||||
| Debt Interest Payments |
4,467 | 5,795 | 4,574 | 1,134 | 15,970 | |||||||||||||||
| Operating lease commitments |
239 | 497 | 522 | 687 | 1,945 | |||||||||||||||
| Purchase Obligations 1 |
77,726 | — | — | — | 77,726 | |||||||||||||||
|
|
|
|
|
|
|
|
|
|
|
|||||||||||
| Total |
$ | 107,220 | $ | 20,338 | $ | 25,812 | $ | 246,169 | $ | 399,539 | ||||||||||
|
|
|
|
|
|
|
|
|
|
|
|||||||||||
| 1 | Excludes unfunded capital commitments of $0.7 million to expand an existing 413,000 square foot facility by approximately 190,000 square feet. |
54
Table of Contents
Non-GAAP Financial Measures
We use the following non-GAAP financial measures that we believe are useful to investors as key supplemental measures of our operating performance: funds from operations, or FFO, Adjusted EBITDA, net operating income, or NOI, same store NOI and cash-basis same store NOI. FFO, Adjusted EBITDA, NOI, same store NOI and cash-basis same store NOI should not be considered in isolation or as a substitute for measures of performance in accordance with GAAP. Further, our computation of FFO, Adjusted EBITDA, NOI, same store NOI and cash-basis same store NOI may not be comparable to FFO, Adjusted EBITDA, NOI, same store NOI and cash-basis same store NOI reported by other companies.
We compute FFO in accordance with standards established by the National Association of Real Estate Investment Trusts (“NAREIT”), which defines FFO as net income (loss) (determined in accordance with GAAP), excluding gains (losses) from sales of property and impairment write-downs of depreciable real estate, plus depreciation and amortization on real estate assets and after adjustments for unconsolidated partnerships and joint ventures (which are calculated to reflect FFO on the same basis). We believe that presenting FFO provides useful information to investors regarding our operating performance because it is a measure of our operations without regard to specified non-cash items, such as real estate depreciation and amortization and gain or loss on sale of assets.
We believe that FFO is a meaningful supplemental measure of our operating performance because historical cost accounting for real estate assets in accordance with GAAP implicitly assumes that the value of real estate assets diminishes predictably over time. Since real estate values have historically risen or fallen with market conditions, many industry investors and analysts have considered the presentation of operating results for real estate companies that use historical cost accounting alone to be insufficient. As a result, we believe that the use of FFO, together with the required GAAP presentations, provide a more complete understanding of our operating performance.
55
Table of Contents
The following table reflects the calculation of FFO reconciled from net income, net of preferred stock dividends for the three months ended December 31, 2014, 2013 and 2012 and for the years ended December 31, 2014, 2013 and 2012 (dollars in thousands except per share data):
| For the Three Months Ended December 31, |
For the Three Months Ended December 31, |
|||||||||||||||||||||||||||||||
| 2014 | 2013 | $ Change | % Change | 2013 | 2012 | $ Change | % Change | |||||||||||||||||||||||||
| Net income, net of preferred stock dividends |
$ | 1,883 | $ | 2,810 | $ | (927 | ) | (33.0 | )% | $ | 2,810 | $ | 2,662 | $ | 148 | 5.6 | % | |||||||||||||||
| Gain on sales of real estate investments |
— | (2,778 | ) | 2,778 | n/a | (2,778 | ) | (4,037 | ) | 1,259 | (31.2 | )% | ||||||||||||||||||||
| Depreciation and amortization |
||||||||||||||||||||||||||||||||
| Depreciation and amortization from continuing operations |
5,123 | 3,685 | 1,438 | 39.0 | % | 3,685 | 2,911 | 774 | 26.6 | % | ||||||||||||||||||||||
| Depreciation related to discontinued operations |
— | — | — | n/a | — | 101 | (101 | ) | n/a | |||||||||||||||||||||||
| Non-real estate depreciation |
(28 | ) | (23 | ) | (5 | ) | 21.7 | % | (23 | ) | (56 | ) | 33 | (58.9 | )% | |||||||||||||||||
| Allocation to participating securities 1 |
(25 | ) | (23 | ) | (2 | ) | 8.7 | % | (23 | ) | (18 | ) | (5 | ) | 27.8 | % | ||||||||||||||||
|
|
|
|
|
|
|
|
|
|
|
|
|
|
|
|
|
|||||||||||||||||
| Funds from operations 2 |
$ | 6,953 | $ | 3,671 | $ | 3,282 | 89.4 | % | $ | 3,671 | $ | 1,563 | $ | 2,108 | 134.9 | % | ||||||||||||||||
|
|
|
|
|
|
|
|
|
|
|
|
|
|
|
|
|
|||||||||||||||||
| Basic and diluted FFO per common share |
$ | 0.20 | $ | 0.15 | $ | 0.05 | 32.9 | % | $ | 0.15 | $ | 0.12 | $ | 0.03 | 25.6 | % | ||||||||||||||||
|
|
|
|
|
|
|
|
|
|
|
|
|
|
|
|
|
|||||||||||||||||
| Weighted average basic and diluted common shares |
35,381,477 | 24,833,304 | 24,833,304 | 13,285,181 | ||||||||||||||||||||||||||||
|
|
|
|
|
|
|
|
|
|||||||||||||||||||||||||
| For the Year Ended December 31, |
For the Year Ended December 31, |
|||||||||||||||||||||||||||||||
| 2014 | 2013 | $ Change | % Change | 2013 | 2012 | $ Change | % Change | |||||||||||||||||||||||||
| Net income, net of preferred stock dividends |
$ | 7,153 | $ | 3,076 | $ | 4,077 | 132.5 | % | $ | 3,076 | $ | 2,461 | $ | 615 | 25.0 | % | ||||||||||||||||
| Gain on sales of real estate investments |
— | (2,778 | ) | 2,778 | n/a | (2,778 | ) | (4,037 | ) | 1,259 | (31.2 | )% | ||||||||||||||||||||
| Depreciation and amortization |
||||||||||||||||||||||||||||||||
| Depreciation and amortization from continuing operations |
19,170 | 12,481 | 6,689 | 53.6 | % | 12,481 | 8,728 | 3,753 | 43.0 | % | ||||||||||||||||||||||
| Depreciation related to discontinued operations |
— | 101 | (101 | ) | n/a | 101 | 509 | (408 | ) | (80.2 | )% | |||||||||||||||||||||
| Non-real estate depreciation |
(101 | ) | (100 | ) | (1 | ) | 1.0 | % | (100 | ) | (147 | ) | 47 | (32.0 | )% | |||||||||||||||||
| Allocation to participating securities 1 |
(125 | ) | (91 | ) | (34 | ) | 37.4 | % | (91 | ) | (79 | ) | (12 | ) | 15.2 | % | ||||||||||||||||
|
|
|
|
|
|
|
|
|
|
|
|
|
|
|
|
|
|||||||||||||||||
| Funds from operations 2 |
$ | 26,097 | $ | 12,689 | $ | 13,408 | 105.7 | % | $ | 12,689 | $ | 7,435 | $ | 5,254 | 70.7 | % | ||||||||||||||||
|
|
|
|
|
|
|
|
|
|
|
|
|
|
|
|
|
|||||||||||||||||
| Basic and diluted FFO per common share |
$ | 0.86 | $ | 0.60 | $ | 0.26 | 43.7 | % | $ | 0.60 | $ | 0.57 | $ | 0.03 | 4.9 | % | ||||||||||||||||
|
|
|
|
|
|
|
|
|
|
|
|
|
|
|
|
|
|||||||||||||||||
| Weighted average basic and diluted common shares |
30,433,017 | 21,011,276 | 21,011,276 | 13,135,440 | ||||||||||||||||||||||||||||
|
|
|
|
|
|
|
|
|
|||||||||||||||||||||||||
| 1 | To be consistent with the company’s policies of determining whether instruments granted in share-based payment transactions are participating securities and accounting for earnings per share, the FFO per |
56
Table of Contents
| common share is adjusted for FFO distributed through declared dividends (if any) and allocated to all participating securities (weighted average common shares outstanding and unvested restricted shares outstanding) under the two-class method. Under this method, allocations were made to 156,885, 156,965 and 149,532 of weighted average unvested restricted shares outstanding for the three months ended December 31, 2014, 2013 and 2012, respectively, and 157,386, 156,203 and 147,200 for the years ended December 31, 2014, 2013 and 2012, respectively. |
| 2 | Includes expensed acquisition costs of approximately $2.0 million, $1.4 million and $0.4 million, respectively, for the three months ended December 31, 2014, 2013 and 2012 and approximately $3.7 million, $3.3 million and $2.2 million, respectively, for the years ended December 31, 2014, 2013 and 2012. |
We compute Adjusted EBITDA as earnings before interest, taxes, depreciation and amortization, gain on sales of real estate investments, acquisition costs and stock-based compensation. We believe that presenting Adjusted EBITDA provides useful information to investors regarding our operating performance because they are measures of our operations on an unleveraged basis before the effects of tax, non-cash depreciation and amortization expense (and acquisition costs and stock-based compensation with regard to Adjusted EBITDA). By excluding interest expense, Adjusted EBITDA allow investors to measure our operating performance independent of our capital structure and indebtedness and, therefore, allow for more meaningful comparison of our operating performance between quarters as well as annual periods and for the comparison of our operating performance to that of other companies, both in the real estate industry and in other industries. As we are currently in a growth phase, acquisition costs are excluded from Adjusted EBITDA to allow for the comparison of our operating performance to that of stabilized companies.
The following table reflects the calculation of Adjusted EBITDA reconciled from net income for the three months ended December 31, 2014, 2013 and 2012 and for the years ended December 31, 2014, 2013 and 2012 (dollars in thousands):
| For the Three Months Ended December 31, |
For the Three Months Ended December 31, |
|||||||||||||||||||||||||||||||
| 2014 | 2013 | $ Change | % Change | 2013 | 2012 | $ Change | % Change | |||||||||||||||||||||||||
| Net income |
$ | 2,774 | $ | 3,701 | $ | (927 | ) | (25.0 | )% | $ | 3,701 | $ | 3,553 | $ | 148 | 4.2 | % | |||||||||||||||
| Gain on sales of real estate investments |
— | (2,778 | ) | 2,778 | n/a | (2,778 | ) | (4,037 | ) | 1,259 | (31.2 | )% | ||||||||||||||||||||
| Depreciation and amortization from continuing operations |
5,123 | 3,685 | 1,438 | 39.0 | % | 3,685 | 2,911 | 774 | 26.6 | % | ||||||||||||||||||||||
| Depreciation related to discontinued operations |
— | — | — | n/a | — | 101 | (101 | ) | n/a | |||||||||||||||||||||||
| Interest expense, including amortization |
1,869 | 1,604 | 265 | 16.5 | % | 1,604 | 1,740 | (136 | ) | (7.8 | )% | |||||||||||||||||||||
| Stock-based compensation |
(247 | ) | 523 | (770 | ) | n/a | 523 | 109 | 414 | 379.8 | % | |||||||||||||||||||||
| Acquisition costs |
1,968 | 1,437 | 531 | 37.0 | % | 1,437 | 440 | 997 | 226.6 | % | ||||||||||||||||||||||
|
|
|
|
|
|
|
|
|
|
|
|
|
|
|
|
|
|||||||||||||||||
| Adjusted EBITDA |
$ | 11,487 | $ | 8,172 | $ | 3,315 | 40.6 | % | $ | 8,172 | $ | 4,817 | $ | 3,355 | 69.6 | % | ||||||||||||||||
|
|
|
|
|
|
|
|
|
|
|
|
|
|
|
|
|
|||||||||||||||||
| For the Year Ended December 31, |
For the Year Ended December 31, |
|||||||||||||||||||||||||||||||
| 2014 | 2013 | $ Change | % Change | 2013 | 2012 | $ Change | % Change | |||||||||||||||||||||||||
| Net income |
$ | 10,718 | $ | 6,641 | $ | 4,077 | 61.4 | % | $ | 6,641 | $ | 4,065 | $ | 2,576 | 63.4 | % | ||||||||||||||||
| Gain on sales of real estate investments |
— | (2,778 | ) | 2,778 | n/a | (2,778 | ) | (4,037 | ) | 1,259 | (31.2 | )% | ||||||||||||||||||||
| Depreciation and amortization from continuing operations |
19,170 | 12,481 | 6,689 | 53.6 | % | 12,481 | 8,728 | 3,753 | 43.0 | % | ||||||||||||||||||||||
| Depreciation related to discontinued operations |
— | 101 | (101 | ) | n/a | 101 | 509 | (408 | ) | (80.2 | )% | |||||||||||||||||||||
| Interest expense, including amortization |
6,591 | 6,214 | 377 | 6.1 | % | 6,214 | 5,472 | 742 | 13.6 | % | ||||||||||||||||||||||
| Stock-based compensation |
2,060 | 2,137 | (77 | ) | (3.6 | )% | 2,137 | 1,121 | 1,016 | 90.6 | % | |||||||||||||||||||||
| Acquisition costs |
3,740 | 3,298 | 442 | 13.4 | % | 3,298 | 2,238 | 1,060 | 47.4 | % | ||||||||||||||||||||||
|
|
|
|
|
|
|
|
|
|
|
|
|
|
|
|
|
|||||||||||||||||
| Adjusted EBITDA |
$ | 42,279 | $ | 28,094 | $ | 14,185 | 50.5 | % | $ | 28,094 | $ | 18,096 | $ | 9,998 | 55.2 | % | ||||||||||||||||
|
|
|
|
|
|
|
|
|
|
|
|
|
|
|
|
|
|||||||||||||||||
57
Table of Contents
We compute NOI as rental revenues, including tenant expense reimbursements, less property operating expenses. We compute same store NOI as rental revenues, including tenant expense reimbursements, less property operating expenses on a same store basis. NOI excludes depreciation, amortization, general and administrative expenses, acquisition costs and interest expense. We compute cash-basis same store NOI as same store NOI excluding straight-line rents and amortization of lease intangibles. The same store pool includes all properties that were owned as of December 31, 2014 and since January 1, 2013 and excludes properties that were either disposed of or held for sale to a third party. As of December 31, 2014, the same store pool consisted of 65 buildings aggregating approximately 4.8 million square feet. We believe that presenting NOI, same store NOI and cash-basis same store NOI provides useful information to investors regarding our operating performance of our properties because NOI excludes certain items that are not considered to be controllable in connection with the management of the property, such as depreciation, amortization, general and administrative expenses, acquisition costs and interest expense. By presenting same store NOI and cash-basis same store NOI, the operating results on a same store basis are directly comparable from period to period.
The following table reflects the calculation of NOI, same store NOI and cash-basis same store NOI reconciled from net income for the three months and the years ended December 31, 2014, 2013 and 2012 (dollars in thousands):
| For the Three Months Ended December 31, |
For the Three Months Ended December 31, |
|||||||||||||||||||||||||||||||
| 2014 | 2013 | $ Change | % Change | 2013 | 2012 | $ Change | % Change | |||||||||||||||||||||||||
| Net income |
$ | 2,774 | $ | 3,701 | $ | (927 | ) | (25.0 | )% | $ | 3,701 | $ | 3,553 | $ | 148 | 4.2 | % | |||||||||||||||
| Depreciation and amortization from continuing operations |
5,123 | 3,685 | 1,438 | 39.0 | % | 3,685 | 2,911 | 774 | 26.6 | % | ||||||||||||||||||||||
| Income from discontinued operations |
— | (3,138 | ) | 3,138 | n/a | (3,138 | ) | (4,485 | ) | 1,347 | (30.0 | )% | ||||||||||||||||||||
| General and administrative |
1,842 | 2,253 | (411 | ) | (18.2 | )% | 2,253 | 1,496 | 757 | 50.6 | % | |||||||||||||||||||||
| Acquisition costs |
1,968 | 1,437 | 531 | 37.0 | % | 1,437 | 440 | 997 | 226.6 | % | ||||||||||||||||||||||
| Total other income and expenses |
1,868 | 1,601 | 267 | 16.7 | % | 1,601 | 1,739 | (138 | ) | (7.9 | )% | |||||||||||||||||||||
|
|
|
|
|
|
|
|
|
|
|
|
|
|
|
|
|
|||||||||||||||||
| Net operating income |
13,575 | 9,539 | 4,036 | 42.3 | % | 9,539 | 5,654 | 3,885 | 68.7 | % | ||||||||||||||||||||||
| Less non same store NOI |
(6,007 | ) | (1,985 | ) | (4,022 | ) | 202.6 | % | (5,000 | ) | (2,533 | ) | (2,467 | ) | 97.4 | % | ||||||||||||||||
|
|
|
|
|
|
|
|
|
|
|
|
|
|
|
|
|
|||||||||||||||||
| Same store NOI |
$ | 7,568 | $ | 7,554 | $ | 14 | 0.2 | % | $ | 4,539 | $ | 3,121 | $ | 1,418 | 45.4 | % | ||||||||||||||||
|
|
|
|
|
|
|
|
|
|
|
|
|
|
|
|
|
|||||||||||||||||
| Less straight-line rents and amortization of lease intangibles 1 |
(560 | ) | (645 | ) | 85 | (13.2 | )% | (148 | ) | 519 | (667 | ) | n/a | |||||||||||||||||||
|
|
|
|
|
|
|
|
|
|
|
|
|
|
|
|
|
|||||||||||||||||
| Cash-basis same store NOI |
$ | 7,008 | $ | 6,909 | $ | 99 | 1.4 | % | $ | 4,391 | $ | 3,640 | $ | 751 | 20.6 | % | ||||||||||||||||
|
|
|
|
|
|
|
|
|
|
|
|
|
|
|
|
|
|||||||||||||||||
| 1 | Includes straight-line rents and amortization of lease intangibles for the same store pool only. |
58
Table of Contents
| For the Year Ended December 31, |
For the Year Ended December 31, |
|||||||||||||||||||||||||||||||
| 2014 | 2013 | $ Change | % Change | 2013 | 2012 | $ Change | % Change | |||||||||||||||||||||||||
| Net income |
$ | 10,718 | $ | 6,641 | $ | 4,077 | 61.4 | % | $ | 6,641 | $ | 4,065 | $ | 2,576 | 63.4 | % | ||||||||||||||||
| Depreciation and amortization from continuing operations |
19,170 | 12,481 | 6,689 | 53.6 | % | 12,481 | 8,728 | 3,753 | 43.0 | % | ||||||||||||||||||||||
| Income from discontinued operations |
— | (4,190 | ) | 4,190 | n/a | (4,190 | ) | (6,096 | ) | 1,906 | (31.3 | )% | ||||||||||||||||||||
| General and administrative |
9,496 | 8,423 | 1,073 | 12.7 | % | 8,423 | 6,403 | 2,020 | 31.5 | % | ||||||||||||||||||||||
| Acquisition costs |
3,740 | 3,298 | 442 | 13.4 | % | 3,298 | 2,238 | 1,060 | 47.4 | % | ||||||||||||||||||||||
| Total other income and expenses |
6,590 | 6,105 | 485 | 7.9 | % | 6,105 | 5,435 | 670 | 12.3 | % | ||||||||||||||||||||||
|
|
|
|
|
|
|
|
|
|
|
|
|
|
|
|
|
|||||||||||||||||
| Net operating income |
49,714 | 32,758 | 16,956 | 51.8 | % | 32,758 | 20,773 | 11,985 | 57.7 | % | ||||||||||||||||||||||
| Less non same store NOI |
(19,163 | ) | (4,117 | ) | (15,046 | ) | 365.5 | % | (15,512 | ) | (4,837 | ) | (10,675 | ) | 220.7 | % | ||||||||||||||||
|
|
|
|
|
|
|
|
|
|
|
|
|
|
|
|
|
|||||||||||||||||
| Same store NOI |
$ | 30,551 | $ | 28,641 | $ | 1,910 | 6.7 | % | $ | 17,246 | $ | 15,936 | $ | 1,310 | 8.2 | % | ||||||||||||||||
|
|
|
|
|
|
|
|
|
|
|
|
|
|
|
|
|
|||||||||||||||||
| Less straight-line rents and amortization of lease intangibles 1 |
(2,183 | ) | (3,521 | ) | 1,338 | (38.0 | )% | (974 | ) | (2,155 | ) | 1,181 | (54.8 | )% | ||||||||||||||||||
|
|
|
|
|
|
|
|
|
|
|
|
|
|
|
|
|
|||||||||||||||||
| Cash-basis same store NOI |
$ | 28,368 | $ | 25,120 | $ | 3,248 | 12.9 | % | $ | 16,272 | $ | 13,781 | $ | 2,491 | 18.1 | % | ||||||||||||||||
|
|
|
|
|
|
|
|
|
|
|
|
|
|
|
|
|
|||||||||||||||||
| 1 | Includes straight-line rents and amortization of lease intangibles for the same store pool only. |
| Item 7A. | Quantitative And Qualitative Disclosures About Market Risk. |
Market risk includes risks that arise from changes in interest rates, foreign currency exchange rates, commodity prices, equity prices and other market changes that affect market sensitive instruments. In pursuing our business strategies, the primary market risk which we are exposed to is interest rate risk. We are exposed to interest rate changes primarily as a result of debt used to maintain liquidity, fund capital expenditures and expand our investment portfolio and operations. We seek to limit the impact of interest rate changes on earnings and cash flows and to lower our overall borrowing costs. As described below, some of our outstanding debt bears interest at variable rates, and we expect that some of our future outstanding debt will have variable interest rates. We may use interest rate caps to manage our interest rate risks relating to our variable rate debt. We expect to replace variable rate debt on a regular basis with fixed rate, long-term debt to finance our assets and operations.
As of December 31, 2014, we had $200.0 million of borrowings outstanding under our Amended Facility. Of the $200.0 million outstanding on the Amended Facility, $50.0 million is subject to an interest rate cap as further described under “Note 9 – Derivative Financial Instruments”. Amounts borrowed under our Amended Facility, bear interest at a variable rate based on LIBOR plus an applicable LIBOR margin. The weighted average interest rate on borrowings outstanding under our Amended Facility was 1.72% as of December 31, 2014. If the LIBOR rate fluctuates by 0.25%, interest expense would increase or decrease, depending on rate movement, future earnings and cash flows by approximately $500,000 annually on the total of the outstanding balances on our Amended Facility, as of December 31, 2014.
| Item 8. | Financial Statements And Supplementary Data. |
See Part IV, Item 15 – “Exhibits and Financial Statement Schedules” beginning on page F-1 of this Annual Report on Form 10-K.
| Item 9. | Changes In And Disagreements With Accountants On Accounting And Financial Disclosure. |
None.
59
Table of Contents
| Item 9A. | Controls And Procedures |
Evaluation of Disclosure Controls and Procedures
Our management has evaluated, under the supervision and with the participation of our Chief Executive Officer, President and Chief Financial Officer, the effectiveness of our disclosure controls and procedures (as defined in Rules 13a-15(e) and 15d-15(e) under the Exchange Act), and has concluded that as of the end of the period covered by this report, our disclosure controls and procedures were effective to give reasonable assurance that information required to be disclosed by us in the reports that we file or submit under the Exchange Act is recorded, processed, summarized and reported within the time periods specified in the SEC’s rules and forms and is accumulated and communicated to our management, including our Chief Executive Officer, President and Chief Financial Officer, as appropriate to allow timely decisions regarding required disclosures.
Management’s Annual Report on Internal Control Over Financial Reporting
Terreno Realty Corporation’s management is responsible for establishing and maintaining adequate internal control over financial reporting. This internal control system was designed to provide reasonable assurance to the company’s management and board of directors regarding the preparation and fair presentation of published financial statements. All internal control systems, no matter how well designed, have inherent limitations. Therefore, even those systems determined to be effective can provide only reasonable assurance with respect to financial statement preparation and presentation.
Terreno Realty Corporation’s management assessed the effectiveness of its internal control over financial reporting as of December 31, 2014. In making this assessment, it used the criteria set forth by the Committee of Sponsoring Organizations of the Treadway Commission (COSO) in Internal Control-Integrated Framework (2013 framework). Based on its assessment, management of Terreno Realty Corporation believes that, as of December 31, 2014, the company’s internal control over financial reporting is effective based on those criteria. Terreno Realty Corporation’s independent auditors have issued an audit report on the effectiveness of the Company’s internal control over financial reporting, as stated in their report included in this Annual Report on Form 10-K, (which expresses an unqualified opinion on the effectiveness of the Company’s internal control over financial reporting as of December 31, 2014).
60
Table of Contents
Report of Independent Registered Public Accounting Firm
The Board of Directors and Shareholders of Terreno Realty Corporation
We have audited Terreno Realty Corporation’s internal control over financial reporting as of December 31, 2014, based on criteria established in Internal Control — Integrated Framework issued by the Committee of Sponsoring Organizations of the Treadway Commission (2013 framework), (the COSO criteria). Terreno Realty Corporation’s management is responsible for maintaining effective internal control over financial reporting, and for its assessment of the effectiveness of internal control over financial reporting included in the accompanying Management’s Annual Report on Internal Control over Financial Reporting. Our responsibility is to express an opinion on the company’s internal control over financial reporting based on our audit.
We conducted our audit in accordance with the standards of the Public Company Accounting Oversight Board (United States). Those standards require that we plan and perform the audit to obtain reasonable assurance about whether effective internal control over financial reporting was maintained in all material respects. Our audit included obtaining an understanding of internal control over financial reporting, assessing the risk that a material weakness exists, testing and evaluating the design and operating effectiveness of internal control based on the assessed risk, and performing such other procedures as we considered necessary in the circumstances. We believe that our audit provides a reasonable basis for our opinion.
A company’s internal control over financial reporting is a process designed to provide reasonable assurance regarding the reliability of financial reporting and the preparation of financial statements for external purposes in accordance with generally accepted accounting principles. A company’s internal control over financial reporting includes those policies and procedures that (1) pertain to the maintenance of records that, in reasonable detail, accurately and fairly reflect the transactions and dispositions of the assets of the company; (2) provide reasonable assurance that transactions are recorded as necessary to permit preparation of financial statements in accordance with generally accepted accounting principles, and that receipts and expenditures of the company are being made only in accordance with authorizations of management and directors of the company; and (3) provide reasonable assurance regarding prevention or timely detection of unauthorized acquisition, use, or disposition of the company’s assets that could have a material effect on the financial statements.
Because of its inherent limitations, internal control over financial reporting may not prevent or detect misstatements. Also, projections of any evaluation of effectiveness to future periods are subject to the risk that controls may become inadequate because of changes in conditions, or that the degree of compliance with the policies or procedures may deteriorate.
In our opinion, Terreno Realty Corporation maintained, in all material respects, effective internal control over financial reporting as of December 31, 2014, based on the COSO criteria.
We also have audited, in accordance with the standards of the Public Company Accounting Oversight Board (United States), the consolidated balance sheet of Terreno Realty Corporation as of December 31, 2014 and 2013, and the related consolidated statements of operations, comprehensive income, equity, and cash flows for each of the three years in the period ended December 31, 2014 and our report dated February 11, 2015 expressed an unqualified opinion thereon.
/s/ Ernst & Young LLP
San Francisco, CA
February 11, 2015
61
Table of Contents
Changes in Internal Control over Financial Reporting
There were no changes in our internal control over financial reporting during the quarter ended December 31, 2014 that have materially affected, or are reasonably likely to materially affect, our internal control over financial reporting.
| Item 9B. | Other Information. |
None.
Part III
| Item 10. | Directors, Executive Officers and Corporate Governance. |
The information required by Item 10 will be contained in a definitive proxy statement for our Annual Meeting of Stockholders, which we anticipate will be filed no later than 120 days after the end of our fiscal year ended December 31, 2014 and is incorporated herein by reference.
| Item 11. | Executive Compensation. |
The information required by Item 11 will be contained in a definitive proxy statement for our Annual Meeting of Stockholders, which we anticipate will be filed no later than 120 days after the end of our fiscal year ended December 31, 2014 and is incorporated herein by reference.
| Item 12. | Security Ownership of Certain Beneficial Owners and Management and Related Stockholder Matters. |
The information required by Item 12 will be contained in a definitive proxy statement for our Annual Meeting of Stockholders, which we anticipate will be filed no later than 120 days after the end of our fiscal year ended December 31, 2014 and is incorporated herein by reference.
| Item 13. | Certain Relationships and Related Transactions, and Director Independence. |
The information required by Item 13 will be contained in a definitive proxy statement for our Annual Meeting of Stockholders, which we anticipate will be filed no later than 120 days after the end of our fiscal year ended December 31, 2014 and is incorporated herein by reference.
| Item 14. | Principal Accounting Fees and Services. |
The information required by Item 14 will be contained in a definitive proxy statement for our Annual Meeting of Stockholders, which we anticipate will be filed no later than 120 days after the end of our fiscal year ended December 31, 2014 and is incorporated herein by reference.
62
Table of Contents
Part IV
| Item 15. | Exhibits and Financial Statement Schedules. |
(a)1. and 2. Financial Statements and Schedules
The following consolidated financial information is included as a separate section of this Annual Report on Form 10-K beginning on page F-1 as follows:
All other schedules for which provision is made in the applicable accounting regulations of the Securities and Exchange Commission are not required under the related instructions or are inapplicable, and therefore have been omitted, or the required information is included in the consolidated financial statements and notes thereto.
3. Exhibits
The exhibits required to be filed by Item 601 of Regulation S-K are listed in the Exhibit Index at the end of this Annual Report on Form 10-K, which is incorporated by reference herein.
63
Table of Contents
Report of Independent Registered Public Accounting Firm
The Board of Directors and Shareholders of Terreno Realty Corporation
We have audited the accompanying consolidated balance sheets of Terreno Realty Corporation as of December 31, 2014 and 2013, and the related consolidated statements of operations, comprehensive income, equity and cash flows for each of the three years in the period ended December 31, 2014. Our audits also included the financial statement schedule listed in the Index at Item 15. These financial statements and schedule are the responsibility of the Company’s management. Our responsibility is to express an opinion on these financial statements and schedule based on our audits.
We conducted our audits in accordance with the standards of the Public Company Accounting Oversight Board (United States). Those standards require that we plan and perform the audit to obtain reasonable assurance about whether the financial statements are free of material misstatement. An audit includes examining, on a test basis, evidence supporting the amounts and disclosures in the financial statements. An audit also includes assessing the accounting principles used and significant estimates made by management, as well as evaluating the overall financial statement presentation. We believe that our audits provide a reasonable basis for our opinion.
In our opinion, the financial statements referred to above present fairly, in all material respects, the consolidated financial position of Terreno Realty Corporation at December 31, 2014 and 2013, and the consolidated results of its operations and its cash flows for each of the three years in the period ended December 31, 2014, in conformity with U.S. generally accepted accounting principles. Also, in our opinion, the related financial statement schedule, when considered in relation to the basic financial statements taken as a whole, presents fairly in all material respects the information set forth therein.
As discussed in Note 2 to the consolidated financial statements, Terreno Realty Corporation changed its reporting of discontinued operations as a result of the adoption of the amendments to the FASB Accounting Standards Codification resulting from Accounting Standards Update No. 2014-08, “Presentation of Financial Statements (Topic 205) and Property, Plant, and Equipment (Topic 360), Reporting Discontinued Operations and Disclosures of Disposals of Components of an Entity”.
We also have audited, in accordance with the standards of the Public Company Accounting Oversight Board (United States), Terreno Realty Corporation’s internal control over financial reporting as of December 31, 2014, based on criteria established in Internal Control-Integrated Framework issued by the Committee of Sponsoring Organizations of the Treadway Commission (2013 framework) and our report dated February 11, 2015 expressed an unqualified opinion thereon.
/s/ Ernst & Young LLP
San Francisco, CA
February 11, 2015
F-1
Table of Contents
Terreno Realty Corporation
(in thousands – except share and per share data)
| December 31, 2014 | December 31, 2013 | |||||||
| ASSETS |
||||||||
| Investments in real estate |
||||||||
| Land |
$ | 388,007 | $ | 301,802 | ||||
| Buildings and improvements |
470,348 | 317,944 | ||||||
| Intangible assets |
42,918 | 32,093 | ||||||
|
|
|
|
|
|||||
| Total investments in properties |
901,273 | 651,839 | ||||||
| Accumulated depreciation and amortization |
(45,446 | ) | (27,103 | ) | ||||
|
|
|
|
|
|||||
| Net investments in properties |
855,827 | 624,736 | ||||||
| Properties held for sale, net |
6,315 | — | ||||||
|
|
|
|
|
|||||
| Net investments in real estate |
862,142 | 624,736 | ||||||
| Cash and cash equivalents |
190,601 | 6,989 | ||||||
| Restricted cash |
6,963 | 2,560 | ||||||
| Deferred financing costs, net |
2,986 | 1,896 | ||||||
| Other assets, net |
14,074 | 9,143 | ||||||
|
|
|
|
|
|||||
| Total assets |
$ | 1,076,766 | $ | 645,324 | ||||
|
|
|
|
|
|||||
| LIABILITIES AND EQUITY |
||||||||
| Liabilities |
||||||||
| Credit facility |
$ | — | $ | 31,000 | ||||
| Term loans payable |
200,000 | 50,000 | ||||||
| Mortgage loans payable |
104,501 | 108,313 | ||||||
| Security deposits |
5,315 | 3,733 | ||||||
| Intangible liabilities, net |
3,556 | 3,989 | ||||||
| Dividends payable |
6,859 | 3,249 | ||||||
| Accounts payable and other liabilities |
9,499 | 6,205 | ||||||
|
|
|
|
|
|||||
| Total liabilities |
329,730 | 206,489 | ||||||
| Commitments and contingencies (Note 14) |
||||||||
| Equity |
||||||||
| Stockholders’ equity |
||||||||
| Preferred stock: $0.01 par value, 100,000,000 shares authorized, and 1,840,000 and 1,840,000 shares (liquidation preference of $25.00 per share) issued and outstanding, respectively |
46,000 | 46,000 | ||||||
| Common stock: $0.01 par value, 400,000,000 shares authorized, and 42,869,463 and 24,990,120 shares issued and outstanding, respectively |
428 | 249 | ||||||
| Additional paid-in capital |
700,755 | 392,586 | ||||||
| Retained earnings |
— | — | ||||||
| Accumulated other comprehensive loss |
(147 | ) | — | |||||
|
|
|
|
|
|||||
| Total stockholders’ equity |
747,036 | 438,835 | ||||||
|
|
|
|
|
|||||
| Total liabilities and equity |
$ | 1,076,766 | $ | 645,324 | ||||
|
|
|
|
|
|||||
The accompanying notes are an integral part of these consolidated financial statements.
F-2
Table of Contents
Terreno Realty Corporation
Consolidated Statements of Operations
(in thousands – except share and per share data)
| For the Year Ended December 31, | ||||||||||||
| 2014 | 2013 | 2012 | ||||||||||
| REVENUES |
||||||||||||
| Rental revenues |
$ | 54,128 | $ | 35,871 | $ | 23,057 | ||||||
| Tenant expense reimbursements |
14,747 | 9,658 | 6,278 | |||||||||
|
|
|
|
|
|
|
|||||||
| Total revenues |
68,875 | 45,529 | 29,335 | |||||||||
|
|
|
|
|
|
|
|||||||
| COSTS AND EXPENSES |
||||||||||||
| Property operating expenses |
19,161 | 12,771 | 8,562 | |||||||||
| Depreciation and amortization |
19,170 | 12,481 | 8,728 | |||||||||
| General and administrative |
9,496 | 8,423 | 6,403 | |||||||||
| Acquisition costs |
3,740 | 3,298 | 2,238 | |||||||||
|
|
|
|
|
|
|
|||||||
| Total costs and expenses |
51,567 | 36,973 | 25,931 | |||||||||
|
|
|
|
|
|
|
|||||||
| OTHER INCOME (EXPENSE) |
||||||||||||
| Interest and other income |
1 | 109 | 37 | |||||||||
| Interest expense, including amortization |
(6,591 | ) | (6,214 | ) | (5,472 | ) | ||||||
|
|
|
|
|
|
|
|||||||
| Total other income and expenses |
(6,590 | ) | (6,105 | ) | (5,435 | ) | ||||||
|
|
|
|
|
|
|
|||||||
| Income (loss) from continuing operations |
10,718 | 2,451 | (2,031 | ) | ||||||||
| Discontinued operations |
||||||||||||
| Income from discontinued operations |
— | 1,412 | 2,059 | |||||||||
| Gain on sales of real estate investments |
— | 2,778 | 4,037 | |||||||||
|
|
|
|
|
|
|
|||||||
| Income from discontinued operations |
— | 4,190 | 6,096 | |||||||||
|
|
|
|
|
|
|
|||||||
| Net income |
10,718 | 6,641 | 4,065 | |||||||||
| Preferred stock dividends |
(3,565 | ) | (3,565 | ) | (1,604 | ) | ||||||
|
|
|
|
|
|
|
|||||||
| Net income, net of preferred stock dividends |
7,153 | 3,076 | 2,461 | |||||||||
| Allocation to participating securities |
(27 | ) | (20 | ) | (24 | ) | ||||||
|
|
|
|
|
|
|
|||||||
| Net income available to common stockholders, net of preferred stock dividends |
$ | 7,126 | $ | 3,056 | $ | 2,437 | ||||||
|
|
|
|
|
|
|
|||||||
| EARNINGS PER COMMON SHARE – BASIC AND DILUTED: |
||||||||||||
| Income (loss) from continuing operations available to common stockholders, net of preferred stock dividends |
$ | 0.23 | $ | (0.05 | ) | $ | (0.28 | ) | ||||
| Income from discontinued operations |
— | 0.20 | 0.47 | |||||||||
|
|
|
|
|
|
|
|||||||
| Net income available to common stockholders, net of preferred stock dividends |
$ | 0.23 | $ | 0.15 | $ | 0.19 | ||||||
|
|
|
|
|
|
|
|||||||
| BASIC AND DILUTED WEIGHTED AVERAGE COMMON SHARES OUTSTANDING |
30,433,017 | 21,011,276 | 13,135,440 | |||||||||
|
|
|
|
|
|
|
|||||||
The accompanying notes are an integral part of these consolidated financial statements.
F-3
Table of Contents
Terreno Realty Corporation
Consolidated Statements of Comprehensive Income
(in thousands)
| For the Year Ended December 31, | ||||||||||||
| 2014 | 2013 | 2012 | ||||||||||
| Net income |
$ | 10,718 | $ | 6,641 | $ | 4,065 | ||||||
| Other comprehensive loss: cash flow hedge adjustment |
(147 | ) | — | — | ||||||||
|
|
|
|
|
|
|
|||||||
| Comprehensive income |
$ | 10,571 | $ | 6,641 | $ | 4,065 | ||||||
|
|
|
|
|
|
|
|||||||
The accompanying notes are an integral part of these consolidated financial statements.
F-4
Table of Contents
Terreno Realty Corporation
Consolidated Statements of Equity
(in thousands – except share data)
| Preferred Stock |
Common Stock | Additional Paid-in Capital |
Retained Earnings |
Accumulated Other Comprehensive Loss |
Total | |||||||||||||||||||||||
| Number of Shares |
Amount | |||||||||||||||||||||||||||
| Balance as of December 31, 2011 |
$ | — | 9,308,670 | $ | 91 | $ | 168,039 | $ | (9,119 | ) | $ | — | $ | 159,011 | ||||||||||||||
| Net income |
— | — | — | — | 4,065 | — | 4,065 | |||||||||||||||||||||
| Issuance of common stock, net of issuance costs of $305 |
— | 4,083,269 | 42 | 55,007 | — | — | 55,049 | |||||||||||||||||||||
| Repurchase of common stock |
— | (4,917 | ) | — | (79 | ) | — | — | (79 | ) | ||||||||||||||||||
| Issuance of restricted stock |
— | 47,536 | — | — | — | — | — | |||||||||||||||||||||
| Issuance of preferred stock |
46,000 | — | — | (1,729 | ) | — | — | 44,271 | ||||||||||||||||||||
| Stock-based compensation |
— | — | — | 739 | — | — | 739 | |||||||||||||||||||||
| Common stock dividends |
— | — | — | (6,178 | ) | — | — | (6,178 | ) | |||||||||||||||||||
| Preferred stock dividends |
— | — | — | (1,604 | ) | — | — | (1,604 | ) | |||||||||||||||||||
|
|
|
|
|
|
|
|
|
|
|
|
|
|
|
|||||||||||||||
| Balance as of December 31, 2012 |
46,000 | 13,434,558 | 133 | 214,195 | (5,054 | ) | — | 255,274 | ||||||||||||||||||||
| Net income |
— | — | — | — | 6,641 | — | 6,641 | |||||||||||||||||||||
| Issuance of common stock, net of issuance costs of $728 |
— | 11,515,793 | 116 | 190,632 | — | — | 190,748 | |||||||||||||||||||||
| Repurchase of common stock |
— | (9,122 | ) | — | (160 | ) | — | — | (160 | ) | ||||||||||||||||||
| Issuance of restricted stock |
— | 48,891 | — | — | — | — | — | |||||||||||||||||||||
| Stock-based compensation |
— | — | — | 1,203 | — | — | 1,203 | |||||||||||||||||||||
| Common stock dividends |
— | — | — | (11,306 | ) | — | — | (11,306 | ) | |||||||||||||||||||
| Preferred stock dividends |
— | — | — | (1,978 | ) | (1,587 | ) | — | (3,565 | ) | ||||||||||||||||||
|
|
|
|
|
|
|
|
|
|
|
|
|
|
|
|||||||||||||||
| Balance as of December 31, 2013 |
46,000 | 24,990,120 | 249 | 392,586 | — | — | 438,835 | |||||||||||||||||||||
| Net income |
— | — | — | — | 10,718 | — | 10,718 | |||||||||||||||||||||
| Issuance of common stock, net of issuance costs of $782 |
— | 17,841,140 | 179 | 319,302 | — | — | 319,481 | |||||||||||||||||||||
| Repurchase of common stock |
— | (12,943 | ) | — | (284 | ) | — | — | (284 | ) | ||||||||||||||||||
| Issuance of restricted stock |
— | 51,146 | — | — | — | — | — | |||||||||||||||||||||
| Stock-based compensation |
— | — | — | 1,378 | — | — | 1,378 | |||||||||||||||||||||
| Common stock dividends |
— | — | — | (12,227 | ) | (7,153 | ) | — | (19,380 | ) | ||||||||||||||||||
| Preferred stock dividends |
— | — | — | — | (3,565 | ) | — | (3,565 | ) | |||||||||||||||||||
| Other comprehensive loss |
— | — | — | — | — | (147 | ) | (147 | ) | |||||||||||||||||||
|
|
|
|
|
|
|
|
|
|
|
|
|
|
|
|||||||||||||||
| Balance as of December 31, 2014 |
$ | 46,000 | 42,869,463 | $ | 428 | $ | 700,755 | $ | — | $ | (147 | ) | $ | 747,036 | ||||||||||||||
|
|
|
|
|
|
|
|
|
|
|
|
|
|
|
|||||||||||||||
The accompanying notes are an integral part of these consolidated financial statements.
F-5
Table of Contents
Terreno Realty Corporation
Consolidated Statements of Cash Flows
(in thousands)
| For the Year Ended December 31, | ||||||||||||
| 2014 | 2013 | 2012 | ||||||||||
| CASH FLOWS FROM OPERATING ACTIVITIES |
||||||||||||
| Net income |
$ | 10,718 | $ | 6,641 | $ | 4,065 | ||||||
| Adjustments to reconcile net income to net cash provided by operating activities |
||||||||||||
| Straight-line rents |
(2,744 | ) | (3,005 | ) | (2,673 | ) | ||||||
| Amortization of lease intangibles |
(1,099 | ) | (864 | ) | 399 | |||||||
| Depreciation and amortization |
19,170 | 12,481 | 8,728 | |||||||||
| Depreciation related to discontinued operations |
— | 101 | 509 | |||||||||
| Gain on sales of real estate investments |
— | (2,778 | ) | (4,037 | ) | |||||||
| Deferred financing cost and mortgage premium amortization |
279 | 252 | 462 | |||||||||
| Stock-based compensation |
2,060 | 2,137 | 1,121 | |||||||||
| Changes in assets and liabilities |
||||||||||||
| Other assets |
(1,510 | ) | (576 | ) | (533 | ) | ||||||
| Accounts payable and other liabilities |
2,447 | (894 | ) | 1,708 | ||||||||
|
|
|
|
|
|
|
|||||||
| Net cash provided by operating activities |
29,321 | 13,495 | 9,749 | |||||||||
| CASH FLOWS FROM INVESTING ACTIVITIES |
||||||||||||
| Restricted cash |
(40 | ) | (265 | ) | (218 | ) | ||||||
| Cash paid for property acquisitions |
(225,797 | ) | (209,338 | ) | (166,043 | ) | ||||||
| Cash paid for deposits on property acquisitions |
(4,350 | ) | (200 | ) | — | |||||||
| Proceeds from sales of real estate investments |
— | 17,469 | 16,293 | |||||||||
| Additions to buildings, improvements and leasing costs |
(19,729 | ) | (9,531 | ) | (10,212 | ) | ||||||
|
|
|
|
|
|
|
|||||||
| Net cash used in investing activities |
(249,916 | ) | (201,865 | ) | (160,180 | ) | ||||||
| CASH FLOWS FROM FINANCING ACTIVITIES |
||||||||||||
| Issuance of common stock |
320,263 | 191,475 | 55,004 | |||||||||
| Issuance costs on issuance of common stock |
(630 | ) | (648 | ) | (305 | ) | ||||||
| Repurchase of common stock |
(284 | ) | (160 | ) | (79 | ) | ||||||
| Issuance of preferred stock |
— | — | 44,551 | |||||||||
| Issuance costs on issuance of preferred stock |
— | — | (260 | ) | ||||||||
| Purchase of derivative instrument |
(835 | ) | — | — | ||||||||
| Borrowings on credit facility |
115,000 | 62,500 | 162,700 | |||||||||
| Payments on credit facility |
(146,000 | ) | (96,929 | ) | (138,271 | ) | ||||||
| Borrowings on term loans payable |
150,000 | 50,000 | — | |||||||||
| Payments on term loans payable |
— | — | (20,050 | ) | ||||||||
| Borrowings on mortgage loans payable |
— | — | 59,880 | |||||||||
| Payments on mortgage loans payable |
(12,267 | ) | (2,852 | ) | (1,847 | ) | ||||||
| Payment of deferred financing costs |
(1,705 | ) | (723 | ) | (1,110 | ) | ||||||
| Dividends paid to common stockholders |
(15,770 | ) | (9,669 | ) | (5,497 | ) | ||||||
| Dividends paid to preferred stockholders |
(3,565 | ) | (3,565 | ) | (1,604 | ) | ||||||
|
|
|
|
|
|
|
|||||||
| Net cash provided by financing activities |
404,207 | 189,429 | 153,112 | |||||||||
| Net increase in cash and cash equivalents |
183,612 | 1,059 | 2,681 | |||||||||
| Cash and cash equivalents at beginning of year |
6,989 | 5,930 | 3,249 | |||||||||
|
|
|
|
|
|
|
|||||||
| Cash and cash equivalents at end of year |
$ | 190,601 | $ | 6,989 | $ | 5,930 | ||||||
|
|
|
|
|
|
|
|||||||
| SUPPLEMENTAL DISCLOSURES OF CASH FLOW INFORMATION |
||||||||||||
| Cash paid for interest, net of capitalized interest |
$ | 6,242 | $ | 6,413 | $ | 4,819 | ||||||
| Supplemental disclosures of non-cash transactions |
||||||||||||
| Accounts payable related to capital improvements |
$ | 2,353 | $ | 1,685 | $ | 451 | ||||||
| Reconciliation of cash paid for property acquisitions |
||||||||||||
| Acquisition of properties |
$ | 236,747 | $ | 212,434 | $ | 185,281 | ||||||
| Assumption of mortgage loans payable |
(8,497 | ) | — | (14,832 | ) | |||||||
| Mortgage premiums |
(344 | ) | — | (701 | ) | |||||||
| Assumption of other assets and liabilities |
(2,109 | ) | (3,096 | ) | (3,705 | ) | ||||||
|
|
|
|
|
|
|
|||||||
| Net cash paid for property acquisitions |
$ | 225,797 | $ | 209,338 | $ | 166,043 | ||||||
|
|
|
|
|
|
|
|||||||
The accompanying notes are an integral part of these consolidated financial statements.
F-6
Table of Contents
Terreno Realty Corporation
Notes to Consolidated Financial Statements
Note 1. Organization
Terreno Realty Corporation (“Terreno”, and together with its subsidiaries, the “Company”) acquires, owns and operates industrial real estate in six major coastal U.S. markets: Los Angeles; Northern New Jersey/New York City; San Francisco Bay Area; Seattle; Miami; and Washington, D.C./Baltimore. As of December 31, 2014, the Company owned 126 buildings (including one building held for sale) aggregating approximately 9.3 million square feet (unaudited).
The Company commenced operations upon completion of an initial public offering (“IPO”) and a concurrent private placement of common stock purchased by the Company’s executive management on February 16, 2010. The Company is an internally managed Maryland corporation and elected to be taxed as a real estate investment trust (“REIT”) under Sections 856 through 860 of the Internal Revenue Code of 1986, as amended (the “Code”) commencing with its taxable year ended December 31, 2010.
Note 2. Significant Accounting Policies
Basis of Presentation. The accompanying consolidated financial statements of the Company have been prepared in accordance with accounting principles generally accepted in the United States of America (“GAAP”). The accompanying consolidated financial statements include all of the Company’s accounts and its subsidiaries and all intercompany balances and transactions have been eliminated in consolidation.
Use of Estimates. The preparation of the consolidated financial statements in conformity with GAAP requires management to make estimates and assumptions that affect the reported amounts of assets and liabilities and disclosure of contingent assets and liabilities at the date of the financial statements. Actual results could differ from those estimates.
Capitalization of Costs. The Company capitalizes costs directly related to the redevelopment, expansion and renovation of its investment in real estate. Costs associated with such projects are capitalized as incurred. If the project is abandoned, these costs are expensed during the period in which the redevelopment project is abandoned. Costs considered for capitalization include, but are not limited to, construction costs, interest, real estate taxes and insurance, if appropriate. These costs are capitalized only during the period in which activities necessary to ready an asset for its intended use are in progress. In the event that the activities to ready the asset for its intended use are suspended, the capitalization period will cease until such activities are resumed. Costs incurred for maintaining and repairing properties, which do not extend their useful lives, are expensed as incurred.
Interest is capitalized based on actual capital expenditures from the period when redevelopment, expansion or renovation commences until the asset is ready for its intended use, at the weighted average borrowing rate during the period.
Investments in Real Estate. Investments in real estate, including tenant improvements, leasehold improvements and leasing costs, are stated at cost, less accumulated depreciation, unless circumstances indicate that the cost cannot be recovered, in which case, an adjustment to the carrying value of the property is made to reduce it to its estimated fair value. The Company also reviews the impact of above and below-market leases, in-place leases and lease origination costs for acquisitions and records an intangible asset or liability accordingly.
Impairment. Carrying values for financial reporting purposes are reviewed for impairment on a property-by-property basis whenever events or changes in circumstances indicate that the carrying value of a property may not be fully recoverable. Examples of such events or changes in circumstances may include classifying an asset
F-7
Table of Contents
to be held for sale, changing the intended hold period or when an asset remains vacant significantly longer than expected. The intended use of an asset either held for sale or held for use can significantly impact how impairment is measured. If an asset is intended to be held for the long-term, the recoverability is based on the undiscounted future cash flows. If the asset carrying value is not supported on an undiscounted future cash flow basis, then the asset carrying value is measured against the lower of cost or the present value of expected cash flows over the expected hold period. An impairment charge to earnings is recognized for the excess of the asset’s carrying value over the lower of cost or the present values of expected cash flows over the expected hold period. If an asset is intended to be sold, impairment is determined using the estimated fair value less costs to sell. The estimation of expected future net cash flows is inherently uncertain and relies on assumptions, among other things, regarding current and future economic and market conditions and the availability of capital. The Company determines the estimated fair values based on its assumptions regarding rental rates, lease-up and holding periods, as well as sales prices. When available, current market information is used to determine capitalization and rental growth rates. If available, current comparative sales values may also be used to establish fair value. When market information is not readily available, the inputs are based on the Company’s understanding of market conditions and the experience of the Company’s management team. Actual results could differ significantly from the Company’s estimates. The discount rates used in the fair value estimates represent a rate commensurate with the indicated holding period with a premium layered on for risk. There were no impairment charges recorded during the years ended December 31, 2014, 2013 or 2012.
Property Acquisitions. Upon acquisition of a property, which are accounted for as business combinations, the Company estimates the fair value of acquired tangible assets (consisting generally of land, buildings and improvements) and intangible assets and liabilities (consisting generally of the above and below-market leases and the origination value of all in-place leases). The Company determines fair values using replacement cost, estimated cash flow projections and other valuation techniques and applying appropriate discount and capitalization rates based on available market information. Mortgage loans assumed in connection with acquisitions are recorded at their fair value using current market interest rates for similar debt at the date of acquisition. Acquisition-related costs associated with business combinations are expensed as incurred.
The fair value of the tangible assets is determined by valuing the property as if it were vacant. Land values are derived from current comparative sales values, when available, or management’s estimates of the fair value based on market conditions and the experience of the Company’s management team. Building and improvement values are calculated as replacement cost less depreciation, or management’s estimates of the fair value of these assets using discounted cash flows analyses or similar methods. The fair value of the above and below-market leases is based on the present value of the difference between the contractual amounts to be received pursuant to the acquired leases (using a discount rate that reflects the risks associated with the acquired leases) and the Company’s estimate of the market lease rates measured over a period equal to the remaining term of the leases plus the term of any below-market fixed rate renewal options. The above and below-market lease values are amortized to rental revenues over the remaining initial term plus the term of any below-market fixed rate renewal options that are considered bargain renewal options of the respective leases. The total net impact to rental revenues due to the amortization of above and below-market leases was a net increase (decrease) of approximately $1.1 million, $0.9 million and ($0.4 million), respectively, for the years ended 2014, 2013 and 2012. The origination value of in-place leases is based on costs to execute similar leases including commissions and other related costs. The origination value of in-place leases also includes real estate taxes, insurance and an estimate of lost rental revenue at market rates during the estimated time required to lease up the property from vacant to the occupancy level at the date of acquisition. The remaining weighted average lease term related to these intangible assets and liabilities as of December 31, 2014 is 3.9 years. As of December 31, 2014 and 2013,
F-8
Table of Contents
the Company’s intangible assets and liabilities, including properties held for sale, consisted of the following (dollars in thousands):
| December 31, 2014 | December 31, 2013 | |||||||||||||||||||||||
| Gross | Accumulated Amortization |
Net | Gross | Accumulated Amortization |
Net | |||||||||||||||||||
| In-place leases |
$ | 39,413 | $ | (17,154 | ) | $ | 22,259 | $ | 28,601 | $ | (10,886 | ) | $ | 17,715 | ||||||||||
| Above-market leases |
$ | 4,079 | $ | (2,596 | ) | $ | 1,483 | $ | 3,492 | $ | (1,922 | ) | $ | 1,570 | ||||||||||
| Below-market leases |
$ | (7,188 | ) | $ | 3,632 | $ | (3,556 | ) | $ | (5,860 | ) | $ | 1,871 | $ | (3,989 | ) | ||||||||
Projected net amortization of the intangible assets and liabilities for the next five years and thereafter as of December 31, 2014 is as follows (dollars in thousands):
| 2015 |
$ | 6,279 | ||
| 2016 |
5,020 | |||
| 2017 |
3,811 | |||
| 2018 |
2,282 | |||
| 2019 |
1,306 | |||
| Thereafter |
1,488 | |||
|
|
|
|||
| Total |
$ | 20,186 | ||
|
|
|
Depreciation and Useful Lives of Real Estate and Intangible Assets. Depreciation and amortization are computed on a straight-line basis over the estimated useful lives of the related assets or liabilities. The following table reflects the standard depreciable lives typically used to compute depreciation and amortization. However, such depreciable lives may be different based on the estimated useful life of such assets or liabilities.
| Description |
Standard Depreciable Life | |
| Land | Not depreciated | |
| Building | 40 years | |
| Building Improvements | 5-40 years | |
| Tenant Improvements | Shorter of lease term or useful life | |
| Leasing Costs | Lease term | |
| In-place leases | Lease term | |
| Above/Below-Market Leases | Lease term |
Discontinued Operations. Effective January 1, 2014, the Company adopted Accounting Standards Update (“ASU”) 2014-08, Presentation of Financial Statements (Topic 205) and Property, Plant and Equipment (Topic 360), Reporting Discontinued Operations and Disclosures of Disposals of Components of an Entity (Note 5). Prior to January 1, 2014, the Company separately reported as discontinued operations the historical operating results attributable to properties sold or held for sale and the applicable gain or loss on the disposition of the properties. Although this application may affect the presentation of the Company’s results of operations for the periods that it has already reported, there will be no effect on its previously reported consolidated financial statements.
Held for Sale Assets. The Company considers a property to be held for sale when it meets the criteria established under ASC 360, Property, Plant, and Equipment (Note 6). Properties held for sale are reported at the lower of the carrying amount or fair value less estimated costs to sell and are not depreciated while they are held for sale.
Cash and Cash Equivalents. Cash and cash equivalents consists of cash held in a major banking institution and other highly liquid short-term investments with original maturities of three months or less. Cash equivalents are generally invested in U.S. government securities, government agency securities or money market accounts.
F-9
Table of Contents
Restricted Cash. Restricted cash includes cash held in escrow in connection with property acquisitions and reserves for certain capital improvements, leasing, interest and real estate tax and insurance payments as required by certain mortgage loan obligations.
Revenue Recognition. The Company records rental revenue from operating leases on a straight-line basis over the term of the leases and maintains an allowance for estimated losses that may result from the inability of its tenants to make required payments. If tenants fail to make contractual lease payments that are greater than the Company’s allowance for doubtful accounts, security deposits and letters of credit, then the Company may have to recognize additional doubtful account charges in future periods. The Company monitors the liquidity and creditworthiness of its tenants on an on-going basis by reviewing their financial condition periodically as appropriate. Each period the Company reviews its outstanding accounts receivable, including straight-line rents, for doubtful accounts and provides allowances as needed. The Company also records lease termination fees when a tenant has executed a definitive termination agreement with the Company and the payment of the termination fee is not subject to any conditions that must be met or waived before the fee is due to the Company. If a tenant remains in the leased space following the execution of a definitive termination agreement, the applicable termination will be deferred and recognized over the term of such tenant’s occupancy.
Tenant expense reimbursement income includes payments and amounts due from tenants pursuant to their leases for real estate taxes, insurance and other recoverable property operating expenses and is recognized as revenues during the same period the related expenses are incurred.
As of December 31, 2014 and 2013, approximately $10.6 million and $7.2 million, respectively, of straight-line rent and accounts receivable, net of allowances of approximately $0.4 million and $0.1 million as of December 31, 2014 and 2013, respectively, were included as a component of other assets in the accompanying consolidated balance sheets.
Deferred Financing Costs. Costs incurred in connection with financings are capitalized and amortized to interest expense using the effective interest method over the term of the related loan. Deferred financing costs in the accompanying consolidated balance sheets are shown at cost, net of accumulated amortization of approximately $2.6 million and $1.9 million as of December 31, 2014 and 2013, respectively.
Mortgage Premiums. Mortgage premiums represent the excess of the fair value of debt assumed over the principal value of debt assumed in connection with property acquisitions. The mortgage premiums are being amortized to interest expense over the term of the related debt instrument using the effective interest method. As of both December 31, 2014 and 2013, the net unamortized mortgage premiums were approximately $0.6 million and were included as a component of mortgage loans payable in the accompanying consolidated balance sheets.
Income Taxes. The Company elected to be taxed as a REIT under the Code and operates as such beginning with its taxable year ended December 31, 2010. To qualify as a REIT, the Company must meet certain organizational and operational requirements, including a requirement to distribute at least 90% of its annual REIT taxable income to its stockholders (which is computed without regard to the dividends paid deduction or net capital gain and which does not necessarily equal net income as calculated in accordance with GAAP). As a REIT, the Company generally will not be subject to federal income tax to the extent it distributes qualifying dividends to its stockholders. If it fails to qualify as a REIT in any taxable year, it will be subject to federal income tax on its taxable income at regular corporate income tax rates and generally will not be permitted to qualify for treatment as a REIT for federal income tax purposes for the four taxable years following the year during which qualification is lost unless the IRS grants it relief under certain statutory provisions. Such an event could materially adversely affect the Company’s net income and net cash available for distribution to stockholders. However, the Company believes it is organized and operates in such a manner as to qualify for treatment as a REIT.
ASC 740-10, Income Taxes, provides guidance for how uncertain tax positions should be recognized, measured, presented and disclosed in the financial statements. ASC 740-10 requires the evaluation of tax positions taken in
F-10
Table of Contents
the course of preparing the Company’s tax returns to determine whether the tax positions are “more-likely-than-not” of being sustained by the applicable tax authority. Tax benefits of positions not deemed to meet the more-likely-than-not threshold are recorded as a tax expense in the current year. As of December 31, 2014 and 2013, the Company did not have any unrecognized tax benefits and does not believe that there will be any material changes in unrecognized tax positions over the next 12 months. The Company’s tax returns are subject to examination by federal, state and local tax jurisdictions beginning with the 2010 calendar year.
Stock-Based Compensation and Other Long-Term Incentive Compensation. The Company follows the provisions of ASC 718, Compensation-Stock Compensation, to account for its stock-based compensation plan, which requires that the compensation cost relating to stock-based payment transactions be recognized in the financial statements and that the cost be measured on the fair value of the equity or liability instruments issued. The Company has adopted the Amended and Restated 2010 Equity Incentive Plan, which provides for the grant of restricted stock awards, performance share awards, unrestricted shares or any combination of the foregoing. Stock-based compensation is recognized as a general and administrative expense in the accompanying consolidated statements of operations and measured at the fair value of the award on the date of grant. The Company estimates the forfeiture rate based on historical experience as well as expected behavior. The amount of the expense may be subject to adjustment in future periods depending on the specific characteristics of the stock-based award.
In addition, the Company has awarded long-term incentive target awards (the “Performance Share awards”) to its executives that may be payable in shares of the Company’s common stock after the conclusion of each pre-established performance measurement period. The amount that may be earned under the Performance Share awards is variable depending on the relative total shareholder return of the Company’s common stock as compared to the total shareholder return of the MSCI U.S. REIT Index and the FTSE NAREIT Equity Industrial Index over the pre-established performance measurement period. The Company estimates the fair value of the Performance Share awards using a Monte Carlo simulation model on the date of grant and at each reporting period. The Performance Share awards are recognized as compensation expense over the requisite performance period based on the fair value of the Performance Share awards at the balance sheet date.
Use of Derivative Financial Instruments. ASC 815, Derivatives and Hedging, provides the disclosure requirements for derivatives and hedging activities with the intent to provide users of financial statements with an enhanced understanding of: (a) how and why the Company uses derivative instruments, (b) how the Company accounts for derivative instruments and related hedged items, and (c) how derivative instruments and related hedged items affect the Company’s financial position, financial performance, and cash flows. Further, qualitative disclosures are required that explain the Company’s objectives and strategies for using derivatives, as well as quantitative disclosures about the fair value of and gains and losses on derivative instruments.
The Company records all derivatives on the consolidated balance sheets at fair value. The accounting for changes in the fair value of derivatives depends on the intended use of the derivative, whether the Company has elected to designate a derivative in a hedging relationship and apply hedge accounting and whether the hedging relationship has satisfied the criteria necessary to apply hedge accounting. Derivatives designated and qualifying as a hedge of the exposure to changes in the fair value of an asset, liability, or firm commitment attributable to a particular risk, such as interest rate risk, are considered fair value hedges. Derivatives designated and qualifying as a hedge of the exposure to variability in expected future cash flows, or other types of forecasted transactions, are considered cash flow hedges. Hedge accounting generally provides for the matching of the timing of gain or loss recognition on the hedging instrument with the recognition of the changes in the fair value of the hedged asset or liability that are attributable to the hedged risk in a fair value hedge or the earnings effect of the hedged forecasted transactions in a cash flow hedge. The Company may enter into derivative contracts that are intended to economically hedge certain of its risks, even though hedge accounting does not apply or the Company elects not to apply hedge accounting.
Fair Value of Financial Instruments. ASC 820, Fair Value Measurements and Disclosures, defines fair value as the price that would be received to sell an asset or paid to transfer a liability in an orderly transaction
F-11
Table of Contents
between market participants at the measurement date (Note 10). ASC 820 also provides guidance for using fair value to measure financial assets and liabilities. ASC 820 requires disclosure of the level within the fair value hierarchy in which the fair value measurements fall, including measurements using quoted prices in active markets for identical assets or liabilities (Level 1), quoted prices for similar instruments in active markets or quoted prices for identical or similar instruments in markets that are not active (Level 2), and significant valuation assumptions that are not readily observable in the market (Level 3).
New Accounting Standards. In May 2014, the Financial Accounting Standards Board (“FASB”) issued ASU 2014-09, their final standard on revenue from contracts with customers. The guidance specifically notes that lease contracts with customers are a scope exception. ASU 2014-09 outlines a single comprehensive model for entities to use in accounting for revenues arising from contracts with customers. ASU 2014-09 is effective for annual reporting periods (including interim periods), beginning after December 15, 2016, and early adoption is not permitted. The Company will adopt the guidance effective January 1, 2017 and is currently assessing the impact on its consolidated financial statements and notes to its consolidated financial statements.
In August 2014, the FASB issued ASU 2014-15, update to Accounting Standards Codification (ASC) subtopic 250-40, Presentation of Financial Statements-Going Concern. The amendments require management to assess an entity’s ability to continue as a going concern by incorporating and expanding upon certain principals that are currently in the U.S. auditing standards. Specifically, the amendments (1) provide a definition of the term “substantial doubt”, (2) require an evaluation every reporting period including interim periods, (3) provide principals for considering the mitigating effect of management’s plans, (4) require certain disclosures when substantial doubt is alleviated as a result of consideration of management’s plans, (5) require an express statement and other disclosures when substantial doubt is not alleviated, and (6) require an assessment for a period of one year after the date that the financial statements are issued (or available to be issued). ASU 2014-15 is effective for annual reporting periods ending after December 15, 2016, and early adoption is permitted. The Company will adopt the guidance effective January 1, 2017 and is currently assessing the impact on its consolidated financial statements and notes to its consolidated financial statements.
Segment Disclosure. ASC 280, Segment Reporting, establishes standards for reporting financial and descriptive information about an enterprise’s reportable segment. The Company has determined that it has one reportable segment, with activities related to investing in real estate. The Company’s investments in real estate are geographically diversified and the chief operating decision makers evaluate operating performance on an individual asset level. As each of the Company’s assets has similar economic characteristics, the assets have been aggregated into one reportable segment.
Note 3. Concentration of Credit Risk
Financial instruments that potentially subject the Company to a significant concentration of credit risk consist primarily of cash and cash equivalents. The Company may maintain deposits in federally insured financial institutions in excess of federally insured limits. However, the Company’s management believes the Company is not exposed to significant credit risk due to the financial position of the depository institutions in which those deposits are held.
As of December 31, 2014, the Company owned 41 buildings and approximately 2.6 million square feet (unaudited) located in Northern New Jersey/New York City, which accounted for approximately 27.9% of its annualized base rent, which is based on contractual base rent from leases in effect as of December 31, 2014, excluding any partial or full rent abatements.
Other real estate companies compete with the Company in its real estate markets. This results in competition for tenants to occupy space. The existence of competing properties could have a material impact on the Company’s ability to lease space and on the level of rent that can be achieved. The Company had no tenants that accounted for greater than approximately 10% of the rental revenues for the year ended December 31, 2014.
F-12
Table of Contents
Note 4. Investments in Real Estate
During the year ended December 31, 2014, the Company acquired 29 industrial buildings containing 2,266,082 square feet (unaudited), one improved land parcel consisting of 1.2 acres (unaudited), including the assumption of two mortgage loans with a total principal amount of approximately $8.5 million that bear interest at a weighted average interest rate of 5.74%. Each of the mortgage loans payable is secured by separate property and requires monthly interest and principal payments until maturity and is generally non-recourse. The mortgage loans mature in 2015 and 2016. The total aggregate initial investment was approximately $236.7 million, of which $88.7 million was recorded to land, $136.0 million to buildings and improvements, $12.0 million to intangible assets and $1.3 million to intangible liabilities.
The following table sets forth the wholly-owned industrial properties the Company acquired during the year ended December 31, 2014:
| Property Name |
Location |
Acquisition Date |
Number of |
Square Feet |
Purchase Price |
|||||||||||
| SW 34th Street | Renton, WA | February 11, 2014 | 1 | 62,004 | $ | 6,600 | ||||||||||
| Parkway | Hanover, MD | March 26, 2014 | 1 | 158,769 | 18,000 | |||||||||||
| Pulaski | Bayonne, NJ | March 31, 2014 | 1 | 98,049 | 9,200 | |||||||||||
| 747 Glasgow | Inglewood, CA | April 22, 2014 | 1 | 19,326 | 3,450 | |||||||||||
| Hampton | Capitol Heights, MD | May 13, 2014 | 1 | 138,780 | 18,050 | |||||||||||
| Burroughs | San Leandro, CA | May 14, 2014 | 3 | 129,279 | 13,328 | |||||||||||
| California | Corona, CA | June 5, 2014 | 1 | 89,819 | 7,815 | |||||||||||
| Las Hermanas 2 | Compton, CA | June 12, 2014 | 1 | 23,735 | 4,020 | |||||||||||
| South Main II | Carson, CA | July 18, 2014 | 1 | 33,769 | 8,500 | |||||||||||
| 79th Ave South | Kent, WA | July 25, 2014 | 1 | 35,018 | 2,770 | |||||||||||
| Auburn 1307 | Auburn, WA | August 22, 2014 | 1 | 91,607 | 9,530 | |||||||||||
| 3401 Lind | Renton, WA | October 3, 2014 | 1 | 113,170 | 9,975 | |||||||||||
| 900 Hart | Rahway, NJ | October 8, 2014 | 1 | 84,000 | 7,205 | |||||||||||
| Kent 216th | Kent, WA | October 24, 2014 | 1 | 106,910 | 9,214 | |||||||||||
| 9020 Junction | Annapolis Junction, MD | November 17, 2014 | 1 | 96,666 | 13,800 | |||||||||||
| 11300 NW 131st | Medley, FL | November 19, 2014 | 1 | 85,000 | 8,925 | |||||||||||
| Terminal Way | Avenel, NJ | November 25, 2014 | 2 | 80,200 | 7,445 | |||||||||||
| 14605 Miller | Fontana, CA | December 2, 2014 | 1 | 265,500 | 22,899 | |||||||||||
| Park Union City | Union City, CA | December 10, 2014 | 3 | 170,129 | 23,800 | |||||||||||
| 75th Ave | Landover, MD | December 17, 2014 | 5 | 384,352 | 31,215 | |||||||||||
|
|
|
|
|
|
|
|||||||||||
| Total |
29 | 2,266,082 | $ | 235,741 | ||||||||||||
|
|
|
|
|
|
|
|||||||||||
| 1 | Excludes intangible liabilities and mortgage premiums, if any. The total aggregate investment was approximately $236.7 million. |
| 2 | Includes an improved land parcel consisting of 1.2 acres (unaudited) that is separately leased for trailer storage. |
The Company recorded revenues and net income for the year ended December 31, 2014 of approximately $7.0 million and $2.9 million, respectively, related to the above acquisitions.
During year ended December 31, 2013, the Company acquired 30 industrial buildings containing 1,916,394 square feet (unaudited), one improved land parcel consisting of 2.3 acres (unaudited), including one redevelopment property that contains 69,500 square feet (unaudited). The total aggregate initial investment was approximately $212.4 million, of which $90.8 million was recorded to land, $110.8 million to buildings and improvements, $10.8 million to intangible assets and $1.4 million to intangible liabilities.
F-13
Table of Contents
The following table sets forth the wholly-owned industrial properties the Company acquired during the year ended December 31, 2013:
| Property Name |
Location |
Acquisition Date |
Number of |
Square Feet |
Purchase Price |
|||||||||||
| 107th Avenue | Medley, FL | March 6, 2013 | 1 | 49,284 | $ | 5,095 | ||||||||||
| SeaTac 8th Ave | Burien, WA | March 21, 2013 | 1 | 68,583 | 6,450 | |||||||||||
| 240 Littlefield Avenue | South San Francisco, CA | April 3, 2013 | 1 | 67,800 | 8,400 | |||||||||||
| 101st Road 2 | Medley, FL | April 26, 2013 | 1 | 52,536 | 6,000 | |||||||||||
| Americas Gateway | Doral, FL | May 22, 2013 | 6 | 306,924 | 23,725 | |||||||||||
| Route 100 | Elkridge, MD | June 12, 2013 | 2 | 348,610 | 16,650 | |||||||||||
| 1 Dodge Drive | West Caldwell, NJ | June 20, 2013 | 1 | 92,913 | 6,775 | |||||||||||
| 17 Madison | Fairfield, NJ | July 23, 2013 | 1 | 30,792 | 2,840 | |||||||||||
| 550 Delancy | Newark, NJ | July 25, 2013 | 1 | 52,086 | 15,000 | |||||||||||
| Melanie Lane | East Hanover, NJ | September 30, 2013 | 3 | 166,735 | 20,000 | |||||||||||
| Michele/Meadow | Carlstadt, NJ | October 17, 2013 | 2 | 90,225 | 9,875 | |||||||||||
| 60 Ethel | Piscataway, NJ | November 6, 2013 | 2 | 104,930 | 7,000 | |||||||||||
| 8215 Dorsey | Jessup, MD | November 15, 2013 | 1 | 88,438 | 6,000 | |||||||||||
| 4230 Forbes | Lanham, MD | December 11, 2013 | 1 | 55,877 | 5,600 | |||||||||||
| 14611 Broadway | Gardena, CA | December 19, 2013 | 1 | 40,000 | 6,000 | |||||||||||
| 3601 Pennsy | Landover, MD | December 23, 2013 | 1 | 71,400 | 7,000 | |||||||||||
| JFK Airgate | Queens, NY | December 27, 2013 | 4 | 229,261 | 53,111 | |||||||||||
|
|
|
|
|
|
|
|||||||||||
| Total |
30 | 1,916,394 | $ | 205,521 | ||||||||||||
|
|
|
|
|
|
|
|||||||||||
| 1 | Excludes intangible liabilities and assumed mortgage premiums, if any. The total aggregate investment was approximately $212.4 million. |
| 2 | Includes an improved land parcel consisting of 2.3 acres (unaudited) that is separately leased for trailer storage and parking. |
The Company recorded revenues and net income for the year ended December 31, 2013 of approximately $5.2 million and $1.3 million, respectively, related to the above acquisitions.
The above assets and liabilities were recorded at fair value, which uses Level 3 inputs. The properties were acquired from unrelated third parties using existing cash on hand and borrowings under the credit facility and were accounted for as business combinations.
Pro Forma Financial Information:
The following supplementary pro forma financial information presents the results of operations of the Company for the years ended December 31, 2014 and 2013 as if all of the Company’s acquisitions during the year ended December 31, 2014 occurred on January 1, 2013. The following pro forma results for the years ended December 31, 2014 and 2013 have been presented for comparative purposes only and are not necessarily indicative of the results of operations that would have actually occurred had all transactions taken place on January 1, 2013, or of future results of operations (dollars in thousands, except per share data).
| For the Year Ended December 31, |
||||||||
| 2014 | 2013 | |||||||
| (Unaudited) | ||||||||
| Total revenues |
$ | 81,720 | $ | 65,306 | ||||
| Net income available to common stockholders, net of preferred stock dividends |
17,000 | 8,288 | ||||||
| Basic and diluted net income available to common stockholders per share, net of preferred stock dividends |
$ | 0.56 | $ | 0.39 | ||||
F-14
Table of Contents
Note 5. Discontinued Operations
The Company separately reports as discontinued operations the historical operating results attributable to properties sold and the applicable gain or loss on the disposition of the properties. Although this application may affect the presentation of the Company’s results of operations for the periods that it has already reported, there will be no effect on its previously reported consolidated financial statements.
In April 2014, the FASB issued ASU 2014-08 on the reporting of discontinued operations, which amends the definition of discontinued operations by limiting discontinued operations reporting to disposals of components of an entity that represent a strategic shift that has (or will have) a major effect on an entity’s operations and financial results (e.g., a disposal of a major geographical area, a major line of business, a major equity method investment or other major parts of an entity). The Company elected to early adopt this standard as of January 1, 2014. Prior to the adoption, the results of operations for real estate properties sold or held for sale during the relevant reporting periods were shown under discontinued operations on the consolidated statements of operations. The results of operations for the two properties are included in discontinued operations for the years ended December 31, 2013 and 2012 because these properties were previously classified as held for sale and sold during the year ended December 31, 2013 and 2012. The Company’s other 2014 asset classified as held for sale does not qualify as discontinued operations under ASU 2014-08 and its operating results for the year ended December 31, 2014 are presented within income from continuing operations in the consolidated statements of operations.
During the year ended December 31, 2013, the Company sold one property located in the Northern New Jersey/New York City market for a sales price of approximately $19.0 million, resulting in a gain of approximately $2.8 million. During the year ended December 31, 2012, the Company sold one property located in the Los Angeles market for a sales price of approximately $17.0 million, resulting in a gain of approximately $4.0 million.
The following summarizes the condensed results of operations of the properties sold for the years ended December 31, 2014, 2013 and 2012 (dollars in thousands):
| For the Year Ended December 31, |
||||||||||||
| 2014 | 2013 | 2012 | ||||||||||
| Rental revenues |
$ | — | $ | 1,541 | $ | 2,636 | ||||||
| Tenant expense reimbursements |
— | 380 | 579 | |||||||||
| Property operating expenses |
— | (408 | ) | (647 | ) | |||||||
| Depreciation and amortization |
— | (101 | ) | (509 | ) | |||||||
|
|
|
|
|
|
|
|||||||
| Income from discontinued operations |
$ | — | $ | 1,412 | $ | 2,059 | ||||||
|
|
|
|
|
|
|
|||||||
Note 6. Held for Sale Assets
The Company considers a property to be held for sale when it meets the criteria established under ASC 360, Property, Plant, and Equipment. Properties held for sale are reported at the lower of the carrying amount or fair value less estimated costs to sell and are not depreciated while they are held for sale. As of December 31, 2014, the Company has entered into an agreement with a third-party purchaser to sell one property located in the Washington, D.C./Baltimore market for a sales price of approximately $11.2 million (net book value of approximately $6.3 million). The sale of the property is subject to the purchaser’s completion of satisfactory due diligence and various closing conditions.
F-15
Table of Contents
The following summarizes the condensed results of operations of the property held for sale as of December 31, 2014, for the years ended December 31, 2014, 2013 and 2012 (dollars in thousands):
| For the Year Ended December 31, |
||||||||||||
| 2014 | 2013 | 2012 | ||||||||||
| Rental revenues |
$ | 594 | $ | 594 | $ | 127 | ||||||
| Tenant expense reimbursements |
123 | 109 | 19 | |||||||||
| Property operating expenses |
(123 | ) | (116 | ) | (23 | ) | ||||||
| Depreciation and amortization |
(261 | ) | (313 | ) | (73 | ) | ||||||
|
|
|
|
|
|
|
|||||||
| Income from operations |
$ | 333 | $ | 274 | $ | 50 | ||||||
|
|
|
|
|
|
|
|||||||
Note 7. Debt
On May 8, 2014, the Company entered into a Third Amended and Restated Senior Credit Agreement (the “Facility”) with KeyBank National Association, as administrative agent and as a lender, KeyBanc Capital Markets, as a lead arranger and PNC Bank, National Association, Union Bank, N.A. and Regions Bank as lenders (collectively the “Lenders”) to, among other matters, add a seven-year $50.0 million term loan to the existing $150.0 million facility, which included a $100.0 million revolving credit facility and a five-year $50.0 million term loan. The seven-year $50.0 million term loan maturity date under the Facility is May 2021. The five-year $50.0 million term loan maturity date under the Facility was extended to May 2019 (previously January 2018) and the maturity date of the revolving credit facility was extended to May 2018 (previously January 2016) with one 12-month extension option exercisable by the Company, subject, among other things, to there being an absence of an event of default under the Facility and to the payment of an extension fee.
On December 8, 2014 the Company entered into a first amendment to the Facility (the “Amended Facility”) with KeyBank National Association, as administrative agent and as a lender, and PNC Bank, National Association, MUFG Union Bank, N.A., Regions Bank and Goldman Sachs Bank USA as lenders to add a five-year $100.0 million term loan to the Company’s existing $200.0 million credit facility. The five-year $100.0 million term loan matures in March 2020.
The aggregate amount of the Amended Facility may be increased to a total of up to $500.0 million, subject to the approval of the administrative agent and the identification of lenders willing to make available additional amounts. Outstanding borrowings under the Amended Facility are limited to the lesser of (i) the sum of the $100.0 million revolving credit facility, the $50.0 million five-year term loan, the $50.0 million seven-year term loan and the $100.0 million five-year term loan or (ii) 60.0% of the value of the unencumbered properties. Interest on the Amended Facility, including the five-year and seven-year term loans, is generally to be paid based upon, at the Company’s option, either (i) LIBOR plus the applicable LIBOR margin or (ii) the applicable base rate which is the greatest of the administrative agent’s prime rate, 0.50% above the federal funds effective rate, or thirty-day LIBOR plus the applicable LIBOR margin for LIBOR rate loans under the Amended Facility plus 1.25%. The applicable LIBOR margin will range from 1.50% to 2.05% (1.50% at December 31, 2014) for the revolving credit facility and each of the five-year term loans and 1.75% to 2.30% (1.75% at December 31, 2014) for the seven-year term loan, depending on the ratio of the Company’s outstanding consolidated indebtedness to the value of the Company’s consolidated gross asset value.
The Amended Facility requires quarterly payments of an annual unused facility fee in an amount equal to 0.20% or 0.25% depending on the unused portion of the Amended Facility. The Amended Facility is guaranteed by us and by substantially all of the current and to-be-formed subsidiaries of the borrower that own an unencumbered property. The Amended Facility has been modified to be unsecured by the Company’s properties or by interests in the subsidiaries that hold such properties. The Amended Facility includes a series of financial and other covenants that the Company must comply with in order to borrow under the Amended Facility. As of
F-16
Table of Contents
December 31, 2014, there no borrowings outstanding on the revolving credit facility and $200.0 million of borrowings outstanding on the term loans. As of December 31, 2013, there were $31.0 million of borrowings outstanding on the revolving credit facility and $50.0 million of borrowings outstanding on a five-year term loan. The Company was in compliance with the covenants under the Amended Facility at December 31, 2014 and 2013.
The Company has mortgage loans payable which are collateralized by certain of the properties and require monthly interest and principal payments until maturity and are generally non-recourse. The mortgage loans mature between 2015 and 2021. As of December 31, 2014, the Company had nine mortgage loans payable totaling approximately $104.5 million, which bear interest at a weighted average fixed annual rate of 4.5%. As of December 31, 2013, the Company had nine mortgage loans payable totaling approximately $108.3 million, which bore interest at a weighted average fixed annual interest rate of 4.5%. As of December 31, 2014 and 2013, the total net book value of the properties securing the debt was approximately $213.4 million and $218.0 million, respectively.
During the years ended December 31, 2014, 2013 and 2012, the Company capitalized approximately $0.3 million, $0.2 million and $0, respectively, of interest associated with redevelopment and expansion activities.
The scheduled principal payments of the Company’s debt as of December 31, 2014 were as follows (dollars in thousands):
| Credit Facility |
Term Loans | Mortgage Loans Payable |
Total Debt | |||||||||||||
| 2015 |
$ | — | $ | — | $ | 24,788 | $ | 24,788 | ||||||||
| 2016 |
— | — | 12,130 | 12,130 | ||||||||||||
| 2017 |
— | — | 1,916 | 1,916 | ||||||||||||
| 2018 |
— | — | 1,910 | 1,910 | ||||||||||||
| 2019 |
— | 50,000 | 18,806 | 68,806 | ||||||||||||
| Thereafter |
— | 150,000 | 44,348 | 194,348 | ||||||||||||
|
|
|
|
|
|
|
|
|
|||||||||
| Subtotal |
— | 200,000 | 103,898 | 303,898 | ||||||||||||
| Unamortized net premiums |
— | — | 603 | 603 | ||||||||||||
|
|
|
|
|
|
|
|
|
|||||||||
| Total Debt |
$ | — | $ | 200,000 | $ | 104,501 | $ | 304,501 | ||||||||
|
|
|
|
|
|
|
|
|
|||||||||
| Weighted Average Interest Rate |
n/a | 1.7 | % | 4.5 | % | 2.7 | % | |||||||||
Note 8. Leasing
The following is a schedule of minimum future cash rentals on tenant operating leases in effect as of December 31, 2014. The schedule does not reflect future rental revenues from the renewal or replacement of existing leases and excludes property operating expense reimbursements (dollars in thousands):
| 2015 |
$ | 57,918 | ||
| 2016 |
51,459 | |||
| 2017 |
45,719 | |||
| 2018 |
36,776 | |||
| 2019 |
26,839 | |||
| Thereafter |
57,083 | |||
|
|
|
|||
| Total |
$ | 275,794 | ||
|
|
|
F-17
Table of Contents
Note 9. Derivative Financial Instruments
Risk Management Objective of Using Derivatives
The Company is exposed to certain risk arising from both its business operations and economic conditions. The Company principally manages its exposures to a wide variety of business and operational risks through management of its core business activities. The Company manages economic risks, including interest rate, liquidity, and credit risk primarily by managing the amount, sources, and duration of its debt funding and the use of derivative financial instruments. Specifically, the Company enters into derivative financial instruments to manage exposures that arise from business activities that result in the payment of future known and uncertain cash amounts, the value of which are determined by interest rates. The Company’s derivative financial instruments are used to manage differences in the amount, timing, and duration of its known or expected cash payments principally related to its borrowings.
Derivative Instruments
The Company’s objectives in using interest rate derivatives are to add stability to interest expense and to manage exposure to interest rate movements. To accomplish this objective, the Company primarily uses interest rate caps as part of its interest rate risk management strategy. Interest rate caps involve the receipt of variable amounts from a counterparty at the end of each period in which the interest rate exceeds the agreed fixed price. The Company does not use derivatives for trading or speculative purposes. The Company requires that hedging derivative instruments be highly effective in reducing the risk exposure that they are designated to hedge. As a result, there is no significant ineffectiveness from any of its derivative activities.
The accounting for changes in fair value (i.e., gains or losses) of a derivative instrument depends on whether it has been designated and qualifies as part of a hedging relationship and further, on the type of hedging relationship. Derivatives that are not designated as hedges must be adjusted to fair value through earnings. For a derivative that is designated and that qualifies as a cash flow hedge, the effective portion of the change in fair value of the derivative is initially recorded in accumulated other comprehensive income (loss) (“AOCI”). Amounts recorded in AOCI are subsequently reclassified into earnings in the period that the hedged forecasted transaction affects earnings. The ineffective portion of a derivative’s change in fair value is immediately recognized in earnings.
On October 31, 2014, the Company executed a forward-starting interest rate cap transaction to hedge the variable cash flows associated with its existing $50.0 million seven-year variable-rate term loan that generally bears interest at LIBOR plus 1.75% to 2.30%, depending on leverage. The cap has a notional value of $50.0 million, which is in effect beginning in December 1, 2014. The Company is required to make certain monthly variable rate payments on the $50.0 million seven-year term loan, while the applicable counterparty is obligated to make certain monthly floating rate payments based on LIBOR to us in the event LIBOR is greater than 4.0%, referencing the same notional amount. The interest rate cap will effectively cap the annual interest rate payable on the $50.0 million seven-year term at 4.0% plus 1.75% to 2.30%, depending on leverage for the period from October 31, 2014 to May 1, 2021.
The Company records all derivative instruments on a gross basis in other assets on the consolidated balance sheets, and accordingly, there are no offsetting amounts that net assets against liabilities. The following table presents a summary of the Company’s derivative instruments designated as hedging instruments (dollars in thousands):
| Effective Date |
Maturity Date |
Interest Rate Strike |
Fair Value | Notional Amount | ||||||||||||||||||||||||
| December 31, | December 31, | |||||||||||||||||||||||||||
| 2014 | 2013 | 2014 | 2013 | |||||||||||||||||||||||||
| Derivative Instrument | ||||||||||||||||||||||||||||
| Assets: |
||||||||||||||||||||||||||||
| Interest Rate Cap |
10/31/2014 | 5/1/2021 | 4.0 | % | $ | 688 | $ | — | $ | 50,000 | $ | — | ||||||||||||||||
F-18
Table of Contents
Note 10. Fair Value Measurements
ASC 820 requires disclosure of the level within the fair value hierarchy in which the fair value measurements fall, including measurements using quoted prices in active markets for identical assets or liabilities (Level 1), quoted prices for similar instruments in active markets or quoted prices for identical or similar instruments in markets that are not active (Level 2), and significant valuation assumptions that are not readily observable in the market (Level 3).
Recurring Measurements – Interest Rate Contracts
Fair Value of Interest Rate Cap
Currently, the Company uses an interest rate cap agreement to manage its interest rate risk. The valuation of this instrument is determined using widely accepted valuation techniques including discounted cash flow analysis on the expected cash flows of the derivative. This analysis reflects the contractual terms of the derivatives, including the period to maturity, and uses observable market-based inputs, including interest rate curves. As of December 31, 2014, the Company applied the provisions of this standard to the valuation of its interest rate cap.
The following sets forth the Company’s financial instruments that are accounted for at fair value on a recurring basis as of December 31, 2014 (dollars in thousands):
| Fair Value Measurement Using | ||||||||||||||||
| Total Fair Value | Quoted Price in Active Markets for Identical Assets and Liabilities (Level 1) |
Significant Other Observable Inputs (Level 2) |
Significant Unobservable Inputs (Level 3) |
|||||||||||||
| Assets |
||||||||||||||||
| Interest rate cap at: |
||||||||||||||||
| December 31, 2014 |
$ | 688 | $ | — | $ | 688 | $ | — | ||||||||
Financial Instruments Disclosed at Fair Value
As of December 31, 2014 and 2013, the fair values of cash and cash equivalents and accounts payable approximated their carrying values because of the short-term nature of these investments or liabilities based on Level 1 inputs.
The fair value of the Company’s mortgage loans payable was estimated by calculating the present value of principal and interest payments, based on borrowing rates available to the Company, which are Level 2 inputs, adjusted with a credit spread, and assuming the loans are outstanding through maturity. The fair value of the Company’s credit facility approximated its carrying value because the variable interest rate approximates market borrowing rates available to the Company, which are Level 2 inputs.
The following table sets forth the carrying value and the estimated fair value of the Company’s debt as of December 31, 2014 and December 31, 2013 (dollars in thousands):
| Fair Value Measurement Using | ||||||||||||||||||||
| Total Fair Value | Quoted Price in Active Markets for Identical Assets and Liabilities (Level 1) |
Significant Other Observable Inputs (Level 2) |
Significant Unobservable Inputs (Level 3) |
Carrying Value | ||||||||||||||||
| Liabilities |
||||||||||||||||||||
| Debt at: |
||||||||||||||||||||
| December 31, 2014 |
$ | 305,660 | $ | — | $ | 305,660 | $ | — | $ | 304,501 | ||||||||||
| December 31, 2013 |
$ | 188,737 | $ | — | $ | 188,737 | $ | — | $ | 189,313 | ||||||||||
F-19
Table of Contents
Note 11. Stockholders’ Equity
The Company’s authorized capital stock consists of 400,000,000 shares of common stock, $0.01 par value per share, and 100,000,000 shares of preferred stock, $0.01 par value per share. On July 11, 2013, the Company completed a public follow-on offering of 5,750,000 shares of its common stock at a price per share of $18.25 including 43,250 shares that were sold in the offering to the Company’s executive and senior officers and members of the board of directors. No underwriting discount or commission was paid on the shares sold to such officers and directors. The net proceeds of the follow-on offering were approximately $99.9 million after deducting the full underwriting discount and offering costs of approximately $5.0 million. The Company used approximately $6.5 million of the net proceeds to repay outstanding borrowings under the Facility and the remaining net proceeds to acquire industrial properties and for general business purposes. On February 19, 2013, the Company completed a public follow-on offering of 5,750,000 shares of its common stock at a price per share of $16.60 including 90,325 shares that were sold in the offering to the Company’s executive and senior officers and members of the board of directors. No underwriting discount or commission was paid on the shares sold to such officers and directors. The net proceeds of the follow-on offering were approximately $90.8 million after deducting the full underwriting discount and offering costs of approximately $4.6 million. The Company used approximately $65.4 million of the net proceeds to repay outstanding borrowings under the revolving credit facility and the remaining net proceeds to invest in industrial properties and for general business purposes.
On February 28, 2014, the Company established an at-the-market equity offering program (the “ATM Program”) pursuant to which the Company may issue and sell shares of its common stock having an aggregate offering price of up to $100,000,000 in amounts and at times to be determined by the Company from time to time. Actual sales, if any, will depend on a variety of factors to be determined by the Company from time to time, including, among others, market conditions, the trading price of the Company’s common stock, determinations by the Company of the appropriate sources of funding for the Company and potential uses of funding available to the Company. The Company intends to use the net proceeds from the offering of the shares under the ATM Program, if any, for general corporate purposes, which may include future acquisitions and repayment of indebtedness, including borrowings under the Amended Facility. During the year ended December 31, 2014, the Company did not issue any shares of common stock under the ATM Program.
On May 22, 2014, the Company completed a public follow-on offering of 8,050,000 shares of its common stock at a price per share of $17.75. The net proceeds of the follow-on offering were approximately $136.5 million after deducting the underwriting discount and offering costs of approximately $6.4 million. The Company used approximately $100.0 million of the net proceeds to repay outstanding borrowings under the Amended Facility and used the remaining net proceeds to acquire industrial properties and for general business purposes.
On December 9, 2014, the Company completed a public follow-on offering of 9,775,000 shares of its common stock at a price per share of $19.60. The net proceeds of the follow-on offering were approximately $183.0 million after deducting the underwriting discount and offering costs of approximately $8.6 million. The Company intends to use the net proceeds to acquire industrial properties and for general corporate purposes. As of December 31, 2014, 42,869,463 shares of common stock were issued and outstanding, including 156,488 non-vested restricted stock awards. As of December 31, 2013, 24,990,120 shares of common stock were issued and outstanding, including 156,568 non-vested restricted stock awards.
In connection with the annual meeting of stockholders on May 7, 2013, the Company granted a total of 15,793 shares of unrestricted common stock to its independent directors under the Company’s 2010 Equity Incentive Plan with a grant date fair value per share of $19.00. The grant date fair value of the unrestricted common stock was determined using the closing price of the Company’s common stock on the date of the grant. The Company recognized approximately $0.3 million in compensation costs for the year ended December 31, 2013 related to this issuance.
In connection with the annual meeting of stockholders on May 9, 2014, the Company granted a total of 16,140 shares of unrestricted common stock to its independent directors under the Company’s Amended and Restated
F-20
Table of Contents
2010 Equity Incentive Plan with a grant date fair value per share of $18.59. The grant date fair value of the unrestricted common stock was determined using the closing price of the Company’s common stock on the date of the grant. The Company recognized approximately $0.3 million in compensation costs for the year ended December 31, 2014 related to this issuance.
As of both December 31, 2014 and 2013, 1,840,000 shares of 7.75% Series A Cumulative Redeemable Preferred Stock (the “Series A Preferred Stock”) were issued and outstanding. Dividends on the Series A Preferred Stock are payable when, as and if authorized by the Company’s board of directors quarterly in arrears on or about the last day of March, June, September and December of each year. The Series A Preferred Stock ranks, with respect to dividend rights and rights upon the Company’s liquidation, dissolution or winding-up, senior to the Company’s common stock.
Generally, the Company may not redeem the Series A Preferred Stock prior to July 19, 2017, except in limited circumstances relating to the Company’s ability to qualify as a REIT, and pursuant to a special optional redemption related to a specified change of control (as defined in the articles supplementary for the Series A Preferred Stock). On and after July 19, 2017, the Company may, at its option, redeem the Series A Preferred Stock, in whole or in part, at any time or from time to time, for cash at a redemption price of $25.00 per share, plus any accrued and unpaid dividends (whether or not authorized or declared) up to but excluding the redemption date.
As of December 31, 2014, there were 1,705,000 shares of common stock authorized for issuance as restricted stock grants, unrestricted stock awards or Performance Share awards under the Company’s Amended and Restated 2010 Equity Incentive Plan, of which 1,304,840 were remaining. The grant date fair value per share of restricted stock awards issued during the period from February 16, 2010 (commencement of operations) to December 31, 2014 ranged from $14.20 to $20.00. The grant date fair value of the restricted stock was determined using the initial public offering price of $20.00 for grants issued on February 16, 2010 (commencement of operations) and for all grants issued after the commencement of operations, the Company uses the closing price of the Company’s common stock on the date of grant. The fair value of the restricted stock that was granted during the year ended December 31, 2014 was $1.0 million and the vesting period for the restricted stock is five years. As of December 31, 2014, the Company had approximately $1.8 million of total unrecognized compensation costs related to restricted stock issuances, which is expected to be recognized over a remaining weighted average period of approximately 3.2 years. The Company recognized compensation costs of approximately $1.1 million, $0.9 million and $0.7 million, respectively, for the years ended December 31, 2014, 2013 and 2012 related to the restricted stock issuances. The following is a summary of the total restricted shares granted to the Company’s executive officers and employees with the related weighted average grant date fair value share prices for the years ended December 31, 2014, 2013 and 2012.
F-21
Table of Contents
Restricted Stock Activity:
| Shares | Weighted Average Grant Date Fair Value |
|||||||
| Non-vested shares outstanding as of December 31, 2011 |
133,526 | $ | 19.54 | |||||
| Granted |
47,536 | 14.20 | ||||||
| Forfeited |
(4,917 | ) | 19.81 | |||||
| Vested |
(27,020 | ) | 19.81 | |||||
|
|
|
|
|
|||||
| Non-vested shares outstanding as of December 31, 2012 |
149,125 | 17.78 | ||||||
| Granted |
48,891 | 17.08 | ||||||
| Forfeited |
(9,122 | ) | 18.29 | |||||
| Vested |
(32,326 | ) | 18.29 | |||||
|
|
|
|
|
|||||
| Non-vested shares outstanding as of December 31, 2013 |
156,568 | 17.43 | ||||||
| Granted |
51,146 | 18.38 | ||||||
| Forfeited |
(12,943 | ) | 18.33 | |||||
| Vested |
(38,283 | ) | 18.33 | |||||
|
|
|
|
|
|||||
| Non-vested shares outstanding as of December 31, 2014 |
156,488 | $ | 17.45 | |||||
|
|
|
|
|
|||||
The following is a vesting schedule of the total non-vested shares of restricted stock outstanding as of December 31, 2014:
| Non-vested Shares Vesting Schedule |
Number of Shares | |||
| 2015 |
61,102 | |||
| 2016 |
35,198 | |||
| 2017 |
29,531 | |||
| 2018 |
20,158 | |||
| 2019 |
10,499 | |||
|
|
|
|||
| Total Non-vested Shares |
156,488 | |||
|
|
|
|||
Long-Term Incentive Plan:
As of December 31, 2014, there are three open performance measurement periods for the Performance Share awards: January 1, 2012 to December 31, 2014, January 1, 2013 to December 31, 2015 and January 1, 2014 to December 31, 2016. The Performance Share awards related to the performance measurement periods from February 16, 2010 to December 31, 2013 resulted in no compensation expense as the Compensation Committee of the Board of Directors determined that the Company’s total shareholder return did not exceed the applicable metrics during the performance measurement period. The Company recorded compensation costs of approximately $0.7 million, $0.9 million and $0.1 million, respectively, for the years ended December 31, 2014, 2013 and 2012.
F-22
Table of Contents
Dividends:
The following table sets forth the cash dividends paid or payable per share during the years ended December 31, 2014 and 2013:
| For the Three Months Ended |
Security | Dividend per Share |
Declaration Date | Record Date | Date Paid | |||||
| March 31, 2014 | Common stock | $0.130000 | February 19, 2014 | April 7, 2014 | April 21, 2014 | |||||
| March 31, 2014 | Preferred stock | $0.484375 | February 19, 2014 | March 10, 2014 | March 31, 2014 | |||||
| June 30, 2014 | Common stock | $0.140000 | May 9, 2014 | July 7, 2014 | July 21, 2014 | |||||
| June 30, 2014 | Preferred stock | $0.484375 | May 9, 2014 | June 11, 2014 | June 30, 2014 | |||||
| September 30, 2014 | Common stock | $0.140000 | August 8, 2014 | October 7, 2014 | October 21, 2014 | |||||
| September 30, 2014 | Preferred stock | $0.484375 | August 8, 2014 | September 12, 2014 | September 30, 2014 | |||||
| December 31, 2014 | Common stock | $0.160000 | November 4, 2014 | December 31, 2014 | January 14, 2015 | |||||
| December 31, 2014 | Preferred stock | $0.484375 | November 4, 2014 | December 12, 2014 | December 31, 2014 | |||||
| For the Three Months Ended |
Security | Dividend per Share |
Declaration Date | Record Date | Date Paid | |||||
| March 31, 2013 | Common stock | $0.120000 | February 19, 2013 | April 5, 2013 | April 19, 2013 | |||||
| March 31, 2013 | Preferred stock | $0.484375 | February 19, 2013 | March 11, 2013 | March 31, 2013 | |||||
| June 30, 2013 | Common stock | $0.130000 | May 7, 2013 | July 5, 2013 | July 19, 2013 | |||||
| June 30, 2013 | Preferred stock | $0.484375 | May 7, 2013 | June 11, 2013 | July 1, 2013 | |||||
| September 30, 2013 | Common stock | $0.130000 | August 6, 2013 | October 7, 2013 | October 21, 2013 | |||||
| September 30, 2013 | Preferred stock | $0.484375 | August 6, 2013 | September 11, 2013 | September 30, 2013 | |||||
| December 31, 2013 | Common stock | $0.130000 | November 5, 2013 | December 31, 2013 | January 14, 2014 | |||||
| December 31, 2013 | Preferred stock | $0.484375 | November 5, 2013 | December 11, 2013 | December 31, 2013 | |||||
Note 12. Net Income (Loss) Per Share
Pursuant to ASC 260-10-45, Determining Whether Instruments Granted in Share-Based Payment Transactions Are Participating Securities, unvested share-based payment awards that contain non-forfeitable rights to dividends are participating securities and are included in the computation of earnings per share pursuant to the two-class method. The two-class method of computing earnings per share allocates earnings per share for common stock and any participating securities according to dividends declared (whether paid or unpaid) and participation rights in undistributed earnings. Under the two-class method, earnings per common share are computed by dividing the sum of distributed earnings to common stockholders and undistributed earnings allocated to common stockholders by the weighted average number of common shares outstanding for the period. The Company’s non-vested shares of restricted stock are considered participating securities since these share-based awards contain non-forfeitable rights to dividends irrespective of whether the awards ultimately vest or expire. The Company had no dilutive restricted stock awards outstanding for the years ended December 31, 2014, 2013 and 2012.
In accordance with the Company’s policies of determining whether instruments granted in share-based payment transactions are participating securities and accounting for earnings per share, the net income (loss) per common share is adjusted for earnings distributed through declared dividends (if any) and allocated to all participating securities (weighted average common shares outstanding and unvested restricted shares outstanding) under the two-class method. Under this method, allocations were made to 157,386, 156,203 and 147,200 of weighted average unvested restricted shares outstanding for the years ended December 31, 2014, 2013 and 2012.
F-23
Table of Contents
Note 13. Quarterly Results of Operations – Unaudited
The following tables summarize the Company’s quarterly financial information. All fiscal quarters have been revised in accordance with guidance on accounting for discontinued operations.
| 2014 Quarter Ended | ||||||||||||||||
| March 31 | June 30 | September 30 | December 31 | |||||||||||||
| Total revenues |
$ | 15,804 | $ | 16,610 | $ | 17,714 | $ | 18,747 | ||||||||
| Total costs and expenses |
(12,426 | ) | (12,230 | ) | (12,806 | ) | (14,105 | ) | ||||||||
| Total other income and expenses |
(1,593 | ) | (1,659 | ) | (1,470 | ) | (1,868 | ) | ||||||||
| Income from continuing operations |
1,785 | 2,721 | 3,438 | 2,774 | ||||||||||||
| Income from discontinued operations |
— | — | — | — | ||||||||||||
| Gain on sales of real estate investments |
— | — | — | — | ||||||||||||
| Net income available to common stockholders, net of preferred stock dividends |
$ | 888 | $ | 1,823 | $ | 2,535 | $ | 1,880 | ||||||||
| Earnings per Common Share – Basic and Diluted: |
||||||||||||||||
| Income from continuing operations available to common stockholders, net of preferred stock dividends 1 |
0.04 | 0.06 | 0.08 | 0.05 | ||||||||||||
| Income from discontinued operations 1 |
— | — | — | — | ||||||||||||
|
|
|
|
|
|
|
|
|
|||||||||
| Net income available to common stockholders, net of preferred stock dividends 1 |
$ | 0.04 | $ | 0.06 | $ | 0.08 | $ | 0.05 | ||||||||
|
|
|
|
|
|
|
|
|
|||||||||
| Basic and Diluted Weighted Average Common Shares Outstanding |
24,850,760 | 28,419,154 | 32,937,432 | 35,381,477 | ||||||||||||
|
|
|
|
|
|
|
|
|
|||||||||
| 2013 Quarter Ended | ||||||||||||||||
| March 31 | June 30 | September 30 | December 31 | |||||||||||||
| Total revenues |
$ | 10,029 | $ | 10,815 | $ | 11,516 | $ | 13,169 | ||||||||
| Total costs and expenses |
(7,930 | ) | (8,906 | ) | (9,131 | ) | (11,006 | ) | ||||||||
| Total other income and expenses |
(1,515 | ) | (1,537 | ) | (1,452 | ) | (1,601 | ) | ||||||||
| Income from continuing operations |
584 | 372 | 933 | 562 | ||||||||||||
| Income from discontinued operations |
210 | 450 | 392 | 360 | ||||||||||||
| Gain on sales of real estate investments |
— | — | — | 2,778 | ||||||||||||
| Net income (loss) available to common stockholders, net of preferred stock dividends |
$ | (97 | ) | $ | (69 | ) | $ | 432 | $ | 2,790 | ||||||
| Earnings per Common Share – Basic and Diluted: |
||||||||||||||||
| Income (loss) from continuing operations available to common stockholders,net of preferred stock dividends 1 |
(0.01 | ) | (0.02 | ) | — | (0.01 | ) | |||||||||
| Income from discontinued operations 1 |
— | 0.02 | 0.02 | 0.12 | ||||||||||||
|
|
|
|
|
|
|
|
|
|||||||||
| Net income (loss) available to common stockholders, net of preferred stock dividends 1 |
$ | (0.01 | ) | $ | — | $ | 0.02 | $ | 0.11 | |||||||
|
|
|
|
|
|
|
|
|
|||||||||
| Basic and Diluted Weighted Average Common Shares Outstanding |
15,792,553 | 19,076,760 | 24,208,008 | 24,833,304 | ||||||||||||
|
|
|
|
|
|
|
|
|
|||||||||
| 1 | The above quarterly income (losses) per share calculations are based on the weighted average number of common shares outstanding during each quarter. The income (losses) per share calculation for the years ended December 31, 2014 and 2013 in the consolidated statements of operations is based on the weighted average number of common shares outstanding for the years ended December 31, 2014 and 2013, respectively. The sum of the quarterly financial data may vary from the years ended December 31, 2014 and 2013 data due to rounding. |
F-24
Table of Contents
Note 14. Commitments and Contingencies
Litigation. The Company is not involved in any material litigation nor, to its knowledge, is any material litigation threatened against it. In the normal course of business, from time to time, the Company may be involved in legal actions relating to the ownership and operations of its properties. Management does not expect that the liabilities, if any, that may ultimately result from such legal actions will have a material effect on the consolidated financial position, results of operations or cash flows of the Company.
Environmental Matters. The industrial properties that the Company owns and will acquire are subject to various federal, state and local environmental laws. Under these laws, courts and government agencies have the authority to require the Company, as owner of a contaminated property, to clean up the property, even if it did not know of or was not responsible for the contamination. These laws also apply to persons who owned a property at the time it became contaminated, and therefore it is possible the Company could incur these costs even after the Company sells some of the properties it acquires. In addition to the costs of cleanup, environmental contamination can affect the value of a property and, therefore, an owner’s ability to borrow using the property as collateral or to sell the property. Under applicable environmental laws, courts and government agencies also have the authority to require that a person who sent waste to a waste disposal facility, such as a landfill or an incinerator, pay for the clean-up of that facility if it becomes contaminated and threatens human health or the environment.
Furthermore, various court decisions have established that third parties may recover damages for injury caused by property contamination. For instance, a person exposed to asbestos at one of the Company’s properties may seek to recover damages if he or she suffers injury from the asbestos. Lastly, some of these environmental laws restrict the use of a property or place conditions on various activities. An example would be laws that require a business using chemicals to manage them carefully and to notify local officials that the chemicals are being used.
The Company could be responsible for any of the costs discussed above. The costs to clean up a contaminated property, to defend against a claim, or to comply with environmental laws could be material and could adversely affect the funds available for distribution to its stockholders. The Company generally obtains “Phase I environmental site assessments”, or ESAs, on each property prior to acquiring it. However, these ESAs may not reveal all environmental costs that might have a material adverse effect on the Company’s business, assets, results of operations or liquidity and may not identify all potential environmental liabilities.
The Company utilizes local third party property managers for day-to-day property management and will rely on these third parties to operate its industrial properties in compliance with applicable federal, state and local environmental laws in their daily operation of the respective properties and to promptly notify the Company of any environmental contaminations or similar issues.
As a result, the Company may become subject to material environmental liabilities of which it is unaware. The Company can make no assurances that (1) future laws or regulations will not impose material environmental liabilities on it, or (2) the environmental condition of the Company’s industrial properties will not be affected by the condition of the properties in the vicinity of its industrial properties (such as the presence of leaking underground storage tanks) or by third parties unrelated to the Company. The Company was not aware of any significant or material exposures as of December 31, 2014 or 2013.
General Uninsured Losses. The Company carries property and rental loss, liability and terrorism insurance. The Company believes that the policy terms, conditions, limits and deductibles are adequate and appropriate under the circumstances, given the relative risk of loss, the cost of such coverage and current industry practice. In addition, the Company’s properties are located, or may in the future be located, in areas that are subject to earthquake and flood activity. As a result, the Company has obtained, as applicable, limited earthquake and flood insurance on those properties. There are, however, certain types of extraordinary losses, such as those due to acts of war that may be either uninsurable or not economically insurable. Although the Company has obtained
F-25
Table of Contents
coverage for certain acts of terrorism, with policy specifications and insured limits that it believes are commercially reasonable, there can be no assurance that the Company will be able to collect under such policies. Should an uninsured loss occur, the Company could lose its investment in, and anticipated profits and cash flows from, a property. The Company was not aware of any significant or material exposures as of December 31, 2014 and 2013.
Contractual Commitments. As of February 11, 2015, the Company had five outstanding contracts with third-party sellers to acquire five industrial properties consisting of 641,593 square feet (unaudited). There is no assurance that the Company will acquire the properties under contract because the proposed acquisitions are subject to the completion of satisfactory due diligence, various closing conditions and with respect to one of the properties, the consent of the mortgage lender. The following table summarizes certain information with respect to the properties the Company has under contract1:
| Market |
Number of Buildings |
Square Feet (Unaudited) |
Purchase Price (in thousands) |
Assumed Debt (in thousands) |
||||||||||||
| Los Angeles |
— | — | $ | — | $ | — | ||||||||||
| Northern New Jersey/New York City 2 |
— | — | 9,416 | — | ||||||||||||
| San Francisco Bay Area |
4 | 300,620 | 37,200 | — | ||||||||||||
| Seattle |
4 | 138,154 | 12,250 | 4,837 | ||||||||||||
| Miami |
2 | 87,532 | 8,500 | — | ||||||||||||
| Washington, D.C./Baltimore |
1 | 115,287 | 10,360 | — | ||||||||||||
|
|
|
|
|
|
|
|
|
|||||||||
| Total |
11 | 641,593 | $ | 77,726 | $ | 4,837 | ||||||||||
|
|
|
|
|
|
|
|
|
|||||||||
| 1 | Excludes unfunded capital commitments of $0.7 million to expand an existing 413,000 square foot (unaudited) facility by approximately 190,000 square feet (unaudited). |
| 2 | Represents one improved land parcel consisting of 4.5 acres (unaudited). |
As of February 11, 2015, the Company has executed one non-binding letter of intent with a third-party seller to acquire one industrial property consisting of 34,200 square feet (unaudited). The total purchase price for the industrial property is approximately $3.2 million. In the normal course of its business, the Company enters into non-binding letters of intent to purchase properties from third parties that may obligate the Company to make payments or perform other obligations upon the occurrence of certain events, including the execution of a purchase and sale agreement and satisfactory completion of various due diligence matters. There is no assurance that the Company will enter into purchase and sale agreements with respect to these properties or otherwise complete any such prospective purchases on the terms described or at all.
As of February 11, 2015, the Company had one outstanding contract with a third-party purchaser to sell one property, consisting of 84,961 square feet (unaudited), located in the Washington, D.C./Baltimore market for a sales price of approximately $11.2 million. There is no assurance that the Company will sell the property under contract because the proposed disposition is subject to the completion of satisfactory due diligence and various closing conditions.
Note 15. Subsequent Events
On January 23, 2015, the Company acquired one industrial building located in Doral, Florida containing 106,810 square feet (unaudited) for a total purchase price of approximately $9.9 million. The property was acquired from an unrelated third party using existing cash on hand.
On January 29, 2015, the Company acquired six industrial buildings located in Washington, D.C. containing 820,207 square feet (unaudited) for a total purchase price of approximately $115.5 million. The property was acquired from an unrelated third party using existing cash on hand.
F-26
Table of Contents
Terreno Realty Corporation
Real Estate Investments and Accumulated Depreciation
As of December 31, 2014
(in thousands)
| Initial Cost to Company |
Costs Capitalized Subsequent to Acquisition |
Gross Amount Carried at 12/31/14 |
||||||||||||||||||||||||||||||||||||||||||||
| Property Name |
No. of Bldgs. |
Location |
Encumbrances | Land | Buildings & Improvements |
Land | Buildings & Improvements |
Total | Accumulated Depreciation |
Year Acquired |
Year Constructed |
|||||||||||||||||||||||||||||||||||
| Los Angeles |
||||||||||||||||||||||||||||||||||||||||||||||
| 630 Glasgow |
1 | Inglewood, CA | $ | 2,321 | $ | 2,245 | $ | 1,855 | $ | 363 | $ | 2,245 | $ | 2,218 | $ | 4,463 | $ | 266 | 2011 | 1988 | ||||||||||||||||||||||||||
| 747 Glasgow |
1 | Inglewood, CA | — | 1,759 | 1,555 | 62 | 1,759 | 1,617 | 3,376 | 32 | 2014 | 1981 | ||||||||||||||||||||||||||||||||||
| 14605 Miller Ave |
1 | Fontana, CA | — | 8,695 | 12,945 | — | 8,695 | 12,945 | 21,640 | 14 | 2014 | 1990 | ||||||||||||||||||||||||||||||||||
| 14611 Broadway |
1 | Gardena, CA | — | 4,757 | 1,243 | 613 | 4,757 | 1,856 | 6,613 | 93 | 2013 | 1962 | ||||||||||||||||||||||||||||||||||
| 19601 Hamilton |
1 | Torrance, CA | 6,378 | 7,409 | 4,072 | 8 | 7,409 | 4,080 | 11,489 | 352 | 2011 | 1985 | ||||||||||||||||||||||||||||||||||
| California |
1 | Corona, CA | — | 3,225 | 4,416 | 4 | 3,225 | 4,420 | 7,645 | 65 | 2014 | 1994 | ||||||||||||||||||||||||||||||||||
| Garfield |
5 | Commerce, CA | 24,627 | 27,539 | 22,694 | 951 | 27,539 | 23,645 | 51,184 | 1,849 | 2012 | 2002 | ||||||||||||||||||||||||||||||||||
| Las Hermanas |
1 | Compton, CA | — | 3,330 | 751 | 178 | 3,330 | 929 | 4,259 | 17 | 2014 | 1970 | ||||||||||||||||||||||||||||||||||
| Manhattan Beach |
1 | Redondo Beach, CA | — | 7,874 | 5,641 | 53 | 7,874 | 5,694 | 13,568 | 372 | 2012 | 1963/1970 | ||||||||||||||||||||||||||||||||||
| South Main |
3 | Carson, CA | — | 10,072 | 4,849 | — | 10,072 | 4,849 | 14,921 | 272 | 2012 | 1966 | ||||||||||||||||||||||||||||||||||
| South Main II |
1 | Carson, CA | — | 6,299 | 2,196 | — | 6,299 | 2,196 | 8,495 | 30 | 2014 | 1963/2012 | ||||||||||||||||||||||||||||||||||
| Whittier |
1 | Whittier, CA | — | 7,736 | 7,902 | 412 | 7,736 | 8,314 | 16,050 | 597 | 2012 | 2004 | ||||||||||||||||||||||||||||||||||
| Northern New Jersey/ |
||||||||||||||||||||||||||||||||||||||||||||||
| 1 Dodge Drive |
1 | West Caldwell, NJ | — | 3,819 | 2,982 | 581 | 3,819 | 3,563 | 7,382 | 135 | 2013 | 1985 | ||||||||||||||||||||||||||||||||||
| 17 Madison |
1 | Fairfield, NJ | — | 974 | 1,647 | 65 | 974 | 1,712 | 2,686 | 70 | 2013 | 1979 | ||||||||||||||||||||||||||||||||||
| 20 Pulaski |
1 | Bayonne, NJ | — | 4,003 | 4,946 | 116 | 4,003 | 5,062 | 9,065 | 104 | 2014 | 1965 | ||||||||||||||||||||||||||||||||||
| 341 Michele |
1 | Carlstadt, NJ | — | 2,372 | 4,798 | 76 | 2,372 | 4,874 | 7,246 | 150 | 2013 | 1973 | ||||||||||||||||||||||||||||||||||
| 465 Meadow |
1 | Carlstadt, NJ | — | 713 | 1,618 | — | 713 | 1,618 | 2,331 | 50 | 2013 | 1972 | ||||||||||||||||||||||||||||||||||
| 550 Delancy |
1 | Newark, NJ | — | 9,230 | 4,855 | 10 | 9,230 | 4,865 | 14,095 | 214 | 2013 | 1987 | ||||||||||||||||||||||||||||||||||
| 620 Division |
1 | Elizabeth, NJ | 6,335 | 6,491 | 3,568 | 2,981 | 6,491 | 6,549 | 13,040 | 627 | 2011 | 1980 | ||||||||||||||||||||||||||||||||||
| 900 Hart |
1 | Piscataway, NJ | — | 3,202 | 3,866 | 186 | 3,202 | 4,052 | 7,254 | 22 | 2014 | 1983 | ||||||||||||||||||||||||||||||||||
| Belleville |
1 | Kearny, NJ | 13,670 | 12,845 | 18,041 | 68 | 12,845 | 18,109 | 30,954 | 1,642 | 2011 | 2006 | ||||||||||||||||||||||||||||||||||
| Dell |
1 | Carlstadt, NJ | — | 6,641 | 771 | 23 | 6,641 | 794 | 7,435 | 68 | 2011 | 1972 | ||||||||||||||||||||||||||||||||||
| Ethel |
2 | Piscataway, NJ | — | 2,748 | 3,801 | 865 | 2,748 | 4,666 | 7,414 | 148 | 2013 | 1981/1984 | ||||||||||||||||||||||||||||||||||
| Interstate |
2 | South Brunswick, NJ | — | 13,686 | 12,135 | 8,914 | 13,686 | 21,049 | 34,735 | 1,491 | 2010/2013 | 1999/2014 | ||||||||||||||||||||||||||||||||||
| JFK Airgate |
4 | Queens, NY | — | 18,282 | 32,933 | 58 | 18,282 | 32,991 | 51,273 | 1,002 | 2013 | 1986/1991 | ||||||||||||||||||||||||||||||||||
| Melanie Lane |
3 | East Hanover, NJ | — | 5,931 | 13,178 | 481 | 5,931 | 13,659 | 19,590 | 484 | 2013 | 1980/1998 | ||||||||||||||||||||||||||||||||||
| Middlebrook |
18 | Bound Brook, NJ | 13,350 | 16,442 | 10,241 | 6,066 | 16,442 | 16,307 | 32,749 | 2,614 | 2010 | 1958/1976 | ||||||||||||||||||||||||||||||||||
| Terminal Way |
2 | Avenel, NJ | — | 3,537 | 3,598 | — | 3,537 | 3,598 | 7,135 | 12 | 2014 | 1950/1968 | ||||||||||||||||||||||||||||||||||
S-1
Table of Contents
| Initial Cost to Company |
Costs Capitalized Subsequent to Acquisition |
Gross Amount Carried at 12/31/14 |
||||||||||||||||||||||||||||||||||||||||||||
| Property Name |
No. of Bldgs. |
Location |
Encumbrances | Land | Buildings & Improvements |
Land | Buildings & Improvements |
Total | Accumulated Depreciation |
Year Acquired |
Year Constructed |
|||||||||||||||||||||||||||||||||||
| San Francisco Bay Area |
||||||||||||||||||||||||||||||||||||||||||||||
| 238/242 Lawrence |
2 | South San Francisco, CA | 689 | 6,674 | 2,655 | 835 | 6,674 | 3,490 | 10,164 | 509 | 2010 | 1986 | ||||||||||||||||||||||||||||||||||
| 240 Littlefield |
1 | South San Francisco, CA | — | 5,107 | 3,293 | 2,847 | 5,107 | 6,140 | 11,247 | 92 | 2013 | 2013 | ||||||||||||||||||||||||||||||||||
| 299 Lawrence |
1 | South San Francisco, CA | — | 1,352 | 1,198 | 416 | 1,352 | 1,614 | 2,966 | 263 | 2010 | 1968 | ||||||||||||||||||||||||||||||||||
| 631 Brennan |
1 | San Jose, CA | — | 1,932 | 2,245 | 447 | 1,932 | 2,692 | 4,624 | 180 | 2012 | 1975 | ||||||||||||||||||||||||||||||||||
| Ahern |
2 | Union City, CA | 3,348 | 3,246 | 2,749 | 402 | 3,246 | 3,151 | 6,397 | 438 | 2010 | 1986 | ||||||||||||||||||||||||||||||||||
| Burroughs |
3 | San Leandro, CA | — | 5,400 | 7,092 | 100 | 5,400 | 7,192 | 12,592 | 128 | 2014 | 1966 | ||||||||||||||||||||||||||||||||||
| Caribbean |
3 | Sunnyvale, CA | — | 17,483 | 14,493 | 1,635 | 17,483 | 16,128 | 33,611 | 1,027 | 2012 | 1980/1981 | ||||||||||||||||||||||||||||||||||
| Carlton Court |
1 | South San Francisco, CA | — | 2,036 | 1,475 | 108 | 2,036 | 1,583 | 3,619 | 111 | 2012 | 1981 | ||||||||||||||||||||||||||||||||||
| Clawiter |
1 | Hayward, CA | 4,669 | 5,964 | 1,159 | 23 | 5,964 | 1,182 | 7,146 | 88 | 2011 | 1967 | ||||||||||||||||||||||||||||||||||
| Park Union City |
3 | Union City, CA | — | 8,468 | 14,165 | — | 8,468 | 14,165 | 22,633 | 16 | 2014 | 1989 | ||||||||||||||||||||||||||||||||||
| Fortune/Qume |
1 | San Jose, CA | — | 2,518 | 2,484 | 707 | 2,518 | 3,191 | 5,709 | 575 | 2010 | 1980 | ||||||||||||||||||||||||||||||||||
| Warm Springs I and II |
2 | Fremont, CA | — | 3,664 | 2,782 | 1,119 | 3,664 | 3,901 | 7,565 | 848 | 2010 | 1984 | ||||||||||||||||||||||||||||||||||
| Seattle |
||||||||||||||||||||||||||||||||||||||||||||||
| 79 Ave South |
1 | Kent, WA | — | 1,267 | 1,503 | 205 | 1,267 | 1,708 | 2,975 | 21 | 2014 | 2000 | ||||||||||||||||||||||||||||||||||
| 3401 Lind |
1 | Renton, WA | 5,685 | 2,999 | 6,707 | — | 2,999 | 6,707 | 9,706 | 36 | 2014 | 1984/2012 | ||||||||||||||||||||||||||||||||||
| 17600 West Valley Highway |
1 | Tukwila, WA | 4,740 | 3,361 | 5,260 | 303 | 3,361 | 5,563 | 8,924 | 391 | 2012 | 1986 | ||||||||||||||||||||||||||||||||||
| Auburn 1307 |
1 | Auburn, WA | — | 4,253 | 5,034 | — | 4,253 | 5,034 | 9,287 | 52 | 2014 | 2002 | ||||||||||||||||||||||||||||||||||
| Kent 188 |
1 | Kent, WA | 5,098 | 3,251 | 4,719 | 1,179 | 3,251 | 5,898 | 9,149 | 715 | 2010 | 1979 | ||||||||||||||||||||||||||||||||||
| Kent 216 |
1 | Kent, WA | — | 3,672 | 5,408 | 276 | 3,672 | 5,684 | 9,356 | 29 | 2014 | 1996 | ||||||||||||||||||||||||||||||||||
| SeaTac 8th Avenue |
1 | Burien, WA | — | 2,501 | 4,020 | 332 | 2,501 | 4,352 | 6,853 | 231 | 2013 | 1988 | ||||||||||||||||||||||||||||||||||
| SW 34th |
1 | Renton, WA | 2,707 | 2,912 | 3,289 | — | 2,912 | 3,289 | 6,201 | 81 | 2014 | 1996/2010 | ||||||||||||||||||||||||||||||||||
| Valley Corporate |
2 | Kent, WA | 8,360 | 5,264 | 9,096 | 341 | 5,264 | 9,437 | 14,701 | 792 | 2011 | 1987 | ||||||||||||||||||||||||||||||||||
| Miami |
||||||||||||||||||||||||||||||||||||||||||||||
| 10th Avenue |
1 | Hialeah, FL | — | 6,376 | 2,624 | 1,179 | 6,376 | 3,803 | 10,179 | 575 | 2010 | 1957/2005 | ||||||||||||||||||||||||||||||||||
| 26th Street |
2 | Miami, FL | — | 4,569 | 6,183 | 27 | 4,569 | 6,210 | 10,779 | 374 | 2012 | 1973 | ||||||||||||||||||||||||||||||||||
| 39th Street |
1 | Doral, FL | 1,921 | 1,420 | 2,717 | 8 | 1,420 | 2,725 | 4,145 | 231 | 2011 | 2002 | ||||||||||||||||||||||||||||||||||
| 48th Avenue |
2 | Miami Gardens, FL | — | 4,322 | 2,187 | 47 | 4,322 | 2,234 | 6,556 | 177 | 2011 | 1987 | ||||||||||||||||||||||||||||||||||
| 60th Avenue |
1 | Miami Lakes, FL | — | 6,203 | 1,567 | 6,345 | 6,203 | 7,912 | 14,115 | 1,129 | 2010 | 1971/2011 | ||||||||||||||||||||||||||||||||||
| 70th Avenue |
1 | Miami, FL | — | 1,434 | 2,333 | 136 | 1,434 | 2,469 | 3,903 | 224 | 2011 | 1999 | ||||||||||||||||||||||||||||||||||
| 78th Avenue |
1 | Doral, FL | — | 2,445 | 1,755 | 1,885 | 2,445 | 3,640 | 6,085 | 285 | 2012 | 1977 | ||||||||||||||||||||||||||||||||||
| 107th Avenue |
1 | Medley, FL | — | 2,787 | 2,036 | 30 | 2,787 | 2,066 | 4,853 | 109 | 2013 | 2001 | ||||||||||||||||||||||||||||||||||
| 101st Road |
1 | Medley, FL | — | 2,647 | 3,258 | 552 | 2,647 | 3,810 | 6,457 | 304 | 2013 | 2012 | ||||||||||||||||||||||||||||||||||
| 131st Street |
1 | Medley, FL | — | 2,903 | 5,729 | — | 2,903 | 5,729 | 8,632 | 19 | 2014 | 1999 | ||||||||||||||||||||||||||||||||||
| Americas Gateway |
6 | Doral, FL | — | 11,152 | 11,721 | 663 | 11,152 | 12,384 | 23,536 | 603 | 2013 | 1978/1982 | ||||||||||||||||||||||||||||||||||
| Washington, D.C./Baltimore |
||||||||||||||||||||||||||||||||||||||||||||||
| 75th Ave |
5 | Landover, MD | — | 10,658 | 18,615 | — | 10,658 | 18,615 | 29,273 | 21 | 2014 | 1987/1990 | ||||||||||||||||||||||||||||||||||
| 3601 Pennsy |
1 | Landover, MD | — | 2,331 | 4,375 | 11 | 2,331 | 4,386 | 6,717 | 137 | 2013 | 1996 | ||||||||||||||||||||||||||||||||||
S-2
Table of Contents
| Initial Cost to Company | Costs Capitalized Subsequent to Acquisition |
Gross Amount Carried at 12/31/14 |
||||||||||||||||||||||||||||||||||||||||||||
| Property Name |
No. of Bldgs. |
Location |
Encumbrances | Land | Buildings & Improvements |
Land | Buildings & Improvements |
Total | Accumulated Depreciation |
Year Acquired |
Year Constructed |
|||||||||||||||||||||||||||||||||||
| 4230 Forbes |
1 | Lanham, MD | — | 1,736 | 2,395 | 111 | 1,736 | 2,506 | 4,242 | 90 | 2013 | 2003 | ||||||||||||||||||||||||||||||||||
| 8215 Dorsey |
1 | Jessup, MD | — | 2,263 | 3,200 | — | 2,263 | 3,200 | 5,463 | 102 | 2013 | 1965/1981 | ||||||||||||||||||||||||||||||||||
| 8730 Bollman |
1 | Savage, MD | — | 4,361 | 2,757 | 527 | 4,361 | 3,284 | 7,645 | 298 | 2011 | 1984 | ||||||||||||||||||||||||||||||||||
| Dorsey |
1 | Jessup, MD | — | 3,207 | 2,383 | 1,258 | 3,207 | 3,641 | 6,848 | 440 | 2011 | 1977 | ||||||||||||||||||||||||||||||||||
| Global Plaza |
1 | Sterling, VA | — | 1,948 | 3,619 | 7 | 1,948 | 3,626 | 5,574 | 277 | 2012 | 2006 | ||||||||||||||||||||||||||||||||||
| Hampton |
1 | Capitol Heights, MD | — | 5,095 | 11,672 | — | 5,095 | 11,672 | 16,767 | 202 | 2014 | 2006 | ||||||||||||||||||||||||||||||||||
| Junction |
1 | Annapolis Junction, MD | — | 2,526 | 10,419 | — | 2,526 | 10,419 | 12,945 | 35 | 2014 | 1989/2012 | ||||||||||||||||||||||||||||||||||
| Parkway |
1 | Hanover, MD | — | 4,543 | 12,094 | — | 4,543 | 12,094 | 16,637 | 266 | 2014 | 1968/2012 | ||||||||||||||||||||||||||||||||||
| Route 100 |
2 | Elkridge, MD | — | 6,492 | 9,403 | 1,135 | 6,492 | 10,538 | 17,030 | 473 | 2013 | 1973/1974 | ||||||||||||||||||||||||||||||||||
| Sweitzer |
1 | Laurel, MD | — | 2,541 | 3,835 | 12 | 2,541 | 3,847 | 6,388 | 237 | 2012 | 1995 | ||||||||||||||||||||||||||||||||||
| Troy Hill |
1 | Elkridge, MD | — | 1,409 | 5,033 | 20 | 1,409 | 5,053 | 6,462 | 320 | 2012 | 2003 | ||||||||||||||||||||||||||||||||||
|
|
|
|
|
|
|
|
|
|
|
|
|
|
|
|
|
|
|
|||||||||||||||||||||||||||||
| Subtotal |
126 | 103,898 | 390,548 | 425,833 | 48,362 | 390,548 | 474,195 | 864,743 | 26,343 | |||||||||||||||||||||||||||||||||||||
| Unamortized net premiums |
— | 603 | — | — | — | — | — | — | — | |||||||||||||||||||||||||||||||||||||
| Intangible assets |
— | — | — | — | — | — | — | 43,492 | 19,750 | |||||||||||||||||||||||||||||||||||||
|
|
|
|
|
|
|
|
|
|
|
|
|
|
|
|
|
|
|
|||||||||||||||||||||||||||||
| Total |
126 | $ | 104,501 | $ | 390,548 | $ | 425,833 | $ | 48,362 | $ | 390,548 | $ | 474,195 | $ | 908,235 | $ | 46,093 | |||||||||||||||||||||||||||||
|
|
|
|
|
|
|
|
|
|
|
|
|
|
|
|
|
|
|
|||||||||||||||||||||||||||||
S-3
Table of Contents
Terreno Realty Corporation
Schedule III
Real Estate Investments and Accumulated Depreciation – (Continued)
As of December 31, 2014
(in thousands)
A summary of activity for real estate and accumulated depreciation for the years ended December 31, 2014 and 2013 is as follows:
| 2014 | 2013 | |||||||
| Investment in Properties |
||||||||
| Balance at beginning of year |
$ | 651,839 | $ | 445,348 | ||||
| Acquisition of properties |
236,747 | 212,434 | ||||||
| Disposition of properties |
— | (16,500 | ) | |||||
| Properties held for sale |
(6,962 | ) | — | |||||
| Improvements, net of write-offs |
19,649 | 10,557 | ||||||
|
|
|
|
|
|||||
| Balance at end of year |
$ | 901,273 | $ | 651,839 | ||||
|
|
|
|
|
|||||
| 2014 | 2013 | |||||||
| Accumulated Depreciation |
||||||||
| Balance at beginning of year |
$ | 27,103 | $ | 15,648 | ||||
| Amortization of lease intangible assets |
6,942 | 4,448 | ||||||
| Depreciation expense |
12,127 | 8,034 | ||||||
| Accumulated depreciation on properties held for sale |
(647 | ) | — | |||||
| Disposition of properties and write-offs |
(79 | ) | (1,027 | ) | ||||
|
|
|
|
|
|||||
| Balance at end of year |
$ | 45,446 | $ | 27,103 | ||||
|
|
|
|
|
|||||
S-4
Table of Contents
Pursuant to the requirements of Section 13 or 15(d) of the Securities Exchange Act of 1934, the registrant has duly caused this report to be signed on its behalf by the undersigned, thereunto duly authorized, in the City of San Francisco, State of California, on February 11, 2015.
| Terreno Realty Corporation | ||
| By: | /s/ W. Blake Baird | |
| W. Blake Baird | ||
| Chairman and Chief Executive Officer | ||
Power of Attorney
We, the undersigned directors of Terreno Realty Corporation hereby severally constitute and appoint W. Blake Baird and Michael A. Coke, and each of them singly, our true and lawful attorneys, with full power to them and each of them singly, to sign for us in our names in the capacities indicated below, all amendments to this report, and generally to do all things in our names and on our behalf in such capacities to enable Terreno Realty Corporation to comply with the provisions of the Securities Exchange Act of 1934, as amended, and all requirements of the Securities and Exchange Commission.
Pursuant to the requirements of the Securities Exchange Act of 1934, this report has been signed by the following persons on behalf of the registrant and in the capacities and on the dates indicated.
| Signature |
Title |
Date | ||
| /s/ W. Blake Baird W. Blake Baird |
Chairman, Chief Executive Officer and Director (principal executive officer) |
February 11, 2015 | ||
| /s/ Michael A. Coke |
President and Director | February 11, 2015 | ||
| Michael A. Coke | ||||
| /s/ Jaime J. Cannon Jaime J. Cannon |
Chief Financial Officer (principal financial and accounting officer) |
February 11, 2015 | ||
| /s/ LeRoy E. Carlson |
Director | February 11, 2015 | ||
| LeRoy E. Carlson | ||||
| /s/ Peter J. Merlone |
Director | February 11, 2015 | ||
| Peter J. Merlone | ||||
| /s/ Douglas M. Pasquale |
Director | February 11, 2015 | ||
| Douglas M. Pasquale | ||||
| /s/ Dennis Polk |
Director | February 11, 2015 | ||
| Dennis Polk | ||||
Table of Contents
| Exhibit Number |
Exhibit Description | |
| 3.1 | Articles of Amendment and Restatement of Registrant, as amended (previously filed as Exhibit 3.1 to Amendment No. 2 to the Registrant’s Registration Statement on Form S-11 on January 6, 2010 and incorporated herein by reference). | |
| 3.2 | Articles Supplementary for Registrant’s 7.75% Series A Cumulative Redeemable Preferred Stock (as previously filed as Exhibit 3.1 to the Registrant’s Current Report on Form 8-K on July 19, 2012 and incorporated herein by reference). | |
| 3.3 | Amended and Restated Bylaws of Registrant (previously filed as Exhibit 3.2 to Amendment No. 2 to the Registrant’s Registration Statement on Form S-11 on January 6, 2010 and incorporated herein by reference). | |
| 4.1 | Specimen Common Stock Certificate of Registrant (previously filed as Exhibit 4.1 to Amendment No. 3 to the Registrant’s Registration Statement on Form S-11 on January 15, 2010 and incorporated herein by reference). | |
| 4.2 | Specimen Certificate for the Company’s 7.75% Series A Cumulative Redeemable Preferred Stock (previously filed as Exhibit 4.1 to the Company’s Form 8-A on July 13, 2012 and incorporated herein by reference). | |
| 10.1+ | Amended and Restated Severance Agreement between Registrant and W. Blake Baird, dated as of February 18, 2014 (previously filed as Exhibit 10.1 to the Registrant’s Current Report on Form 8-K on February 19, 2014 and incorporated herein by reference). | |
| 10.2+ | Amended and Restated Severance Agreement between Registrant and Michael A. Coke dated as of February 18, 2014 (previously filed as Exhibit 10.2 to the Registrant’s Current Report on Form 8-K on February 19, 2014 and incorporated herein by reference). | |
| 10.3+ | Severance Agreement between Registrant and Jaime J. Cannon dated as of February 18, 2014 (previously filed as Exhibit 10.3 to the Registrant’s Current Report on Form 8-K on February 19, 2014 and incorporated herein by reference). | |
| 10.4+ | Amended and Restated 2010 Equity Incentive Plan of Registrant (previously filed as Appendix A to the Registrant’s Definitive Proxy Statement on Schedule 14A on March 19, 2014 and incorporated herein by reference). | |
| 10.5+ | Form of Restricted Stock Award Agreement for Executive Officers and Employees (previously filed as Exhibit 10.4 to Amendment No. 2 to the Registrant’s Registration Statement on Form S-11 on January 6, 2010 and incorporated herein by reference). | |
| 10.6+ | Form of Restricted Stock Award Agreement for Non-Employee Directors (previously filed as Exhibit 10.5 to Amendment No. 2 to the Registrant’s Registration Statement on Form S-11 on January 6, 2010 and incorporated herein by reference). | |
| 10.7+ | Form of Indemnification Agreement between Registrant and its Directors and Executive Officers (previously filed as Exhibit 10.6 to Amendment No. 2 to the Registrant’s Registration Statement on Form S-11 on January 6, 2010 and incorporated herein by reference). | |
| 10.8+ | Amended and Restated Long-Term Incentive Plan of Registrant (previously filed as Exhibit 10.4 to the Registrant’s Current Report on Form 8-K on February 19, 2014 and incorporated by reference herein). | |
| 10.9+ | Form of Award Notice under the Long-Term Incentive Plan of Registrant (previously filed as Exhibit 10.8 to Amendment No. 2 to the Registrant’s Registration Statement on Form S-11 on January 6, 2010 and incorporated herein by reference). | |
| 10.10+ | Form of Subscription Agreement (previously filed as Exhibit 10.9 to Amendment No. 2 to the Registrant’s Registration Statement on Form S-11 on January 6, 2010 and incorporated herein by reference). | |
Table of Contents
| 10.11 | Third Amended and Restated Senior Credit Agreement, dated as of May 8, 2014, among Terreno Realty LLC, KeyBank National Association, both individually as a “Lender” and as “Administrative Agent”, KeyBanc Capital Markets as “Lead Arranger,” and the several banks, financial institutions and other entities which may from time to time become parties as additional “Lenders” (previously filed as Exhibit 10.1 to the Registrant’s Current Report on Form 8-K on May 14, 2014 and incorporated herein by reference). | |
| 10.12 | First Amendment to the Third Amended and Restated Senior Credit Agreement, dated as of December 8, 2014, among Terreno Realty LLC, KeyBank National Association, both individually as a “Lender” and as “Administrative Agent”, KeyBanc Capital Markets as “Lead Arranger,” and the several banks, financial institutions and other entities which may from time to time become parties as additional “Lenders” (previously filed as Exhibit 10.1 to the Registrant’s Current Report on Form 8-K on December 12, 2014 and incorporated herein by reference). | |
| 10.13 | Agreement of Purchase and Sale, dated as of December 20, 2013, between Prologis Targeted U.S. Logistics Fund, L.P. and Terreno Airgate LLC (previously filed as Exhibit 10.11 to the Registrant’s Annual Report on Form 10-K on February 19, 2014 and incorporated herein by reference). | |
| 10.14 | Sale Contract, dated as of December 6, 2014, by and between SMC-United Industrial Limited Partnership and Terreno Realty LLC (previously filed as Exhibit 2.1 to the Registrant’s Current Report on Form 8-K on February 4, 2015 and incorporated herein by reference). | |
| 10.15 | First Amendment to Sale Contract, dated as of January 8, 2015, by and between SMC-United Industrial Limited Partnership and Terreno Realty LLC (previously filed as Exhibit 2.2 to the Registrant’s Current Report on Form 8-K on February 4, 2015 and incorporated herein by reference). | |
| 10.16 | Second Amendment to Sale Contract, dated as of January 16, 2015, by and between SMC-United Industrial Limited Partnership and Terreno Realty LLC (previously filed as Exhibit 2.3 to the Registrant’s Current Report on Form 8-K on February 4, 2015 and incorporated herein by reference). | |
| 12.1* | Statement of Computation of Ratios. | |
| 21* | Subsidiaries of Registrant. | |
| 23* | Consent of Independent Registered Public Accounting Firm. | |
| 24.1* | Power of Attorney (included on the signature page to this Annual Report on Form 10-K). | |
| 31.1* | Certification of Chief Executive Officer, pursuant to Rules 13a-15(e) and 15d-15(e), as adopted pursuant to Section 302 of the Sarbanes-Oxley Act of 2002. | |
| 31.2* | Certification of Chief Financial Officer, pursuant to Rules 13a-15(e) and 15d-15(e), as adopted pursuant to Section 302 of the Sarbanes-Oxley Act of 2002. | |
| 31.3* | Certification of President, pursuant to Rules 13a-15(e) and 15d-15(e), as adopted pursuant to Section 302 of the Sarbanes-Oxley Act of 2002. | |
| 32.1** | Certification of Chief Executive Officer, pursuant to 18 U.S.C. Section 1350, as adopted pursuant to Section 906 of the Sarbanes-Oxley Act of 2002. | |
| 32.2** | Certification of Chief Financial Officer, pursuant to 18 U.S.C. Section 1350, as adopted pursuant to Section 906 of the Sarbanes-Oxley Act of 2002. | |
| 32.3** | Certification of President, pursuant to 18 U.S.C. Section 1350, as adopted pursuant to Section 906 of the Sarbanes-Oxley Act of 2002. | |
| 101 | The following materials from Terreno Realty Corporation’s Annual Report on Form 10-K for the year ended December 31, 2014, formatted in XBRL (eXtensible Business Reporting Language): (i) Consolidated Balance Sheets, (ii) Consolidated Statements of Operations, (iii) Consolidated Statements of Comprehensive Income, (iv) Consolidated Statements of Equity, (v) Consolidated Statements of Cash Flows and (vi) Notes to Consolidated Financial Statements and (vii) Schedule III-Real Estate Investments and Accumulated Depreciation. | |
| * | Filed herewith. |
| ** | Furnished herewith. |
| + | Exhibit is a management contract or compensatory plan or arrangement. |