Attached files
| file | filename |
|---|---|
| 8-K - 8-K - SQUARE 1 FINANCIAL INC | sqbk021520158k.htm |
Investor Update Fourth Quarter 2014 Douglas H. Bowers President Chief Executive Officer Patrick Oakes Executive Vice President Chief Financial Officer NASDAQ: SQBK www.square1financial.com
Disclosure Fourth Quarter 2014 | 2 This report contains forward-looking statements within the meaning of the Private Securities Litigation Reform Act of 1995. These forward-looking statements are not historical facts, and are based on current expectations, estimates and projections about our industry, management's beliefs and certain assumptions made by management, many of which, by their nature, are inherently uncertain and beyond our control. Accordingly, we caution you that any such forward-looking statements are not guarantees of future performance and are subject to risks, assumptions and uncertainties that are difficult to predict. Although we believe that the expectations reflected in these forward-looking statements are reasonable as of the date made, actual results may prove to be materially different from the results expressed or implied by the forward-looking statements. There are or will be important factors that could cause our actual results to differ materially from those indicated in these forward-looking statements, including, but not limited to, the following: (i) market and economic conditions (including interest rate environment, levels of public offerings, mergers and acquisitions and venture capital financing activities) and the associated impact on us; (ii) the sufficiency of our capital, including sources of capital (such as funds generated through retained earnings) and the extent to which capital may be used or required; (iii) our overall investment plans, strategies and activities, including our investment of excess cash/liquidity; (iv) operational, liquidity and credit risks associated with our business; (v) deterioration of our asset quality; (vi) our overall management of interest rate risk; (vii) our ability to execute our strategy and to achieve organic loan and deposit growth; (viii) increased competition in the financial services industry, nationally, regionally or locally, which may adversely affect pricing and terms; (ix) the adequacy of reserves (including allowance for loan and lease losses) and the appropriateness of our methodology for calculating such reserves; (x) volatility and direction of market interest rates; (xi) changes in the regulatory or legal environment; and (xii) other factors that are discussed in the section titled "Risk Factors," in our registration statement on Form S-1/A, filed with the Securities and Exchange Commission and effective as of March 26, 2014. Our forward-looking statements may also be subject to other risks and uncertainties, including those that we may discuss elsewhere in our new releases or in our filings with the SEC. The foregoing factors should not be construed as exhaustive. If one or more events related to these or other risks or uncertainties materialize, or if our underlying assumptions prove to be incorrect, actual results may differ materially from what we anticipate. Any forward-looking statement speaks only as of the date on which it is made, and we do not intend, or undertake any obligation to publicly update these forward-looking statements.
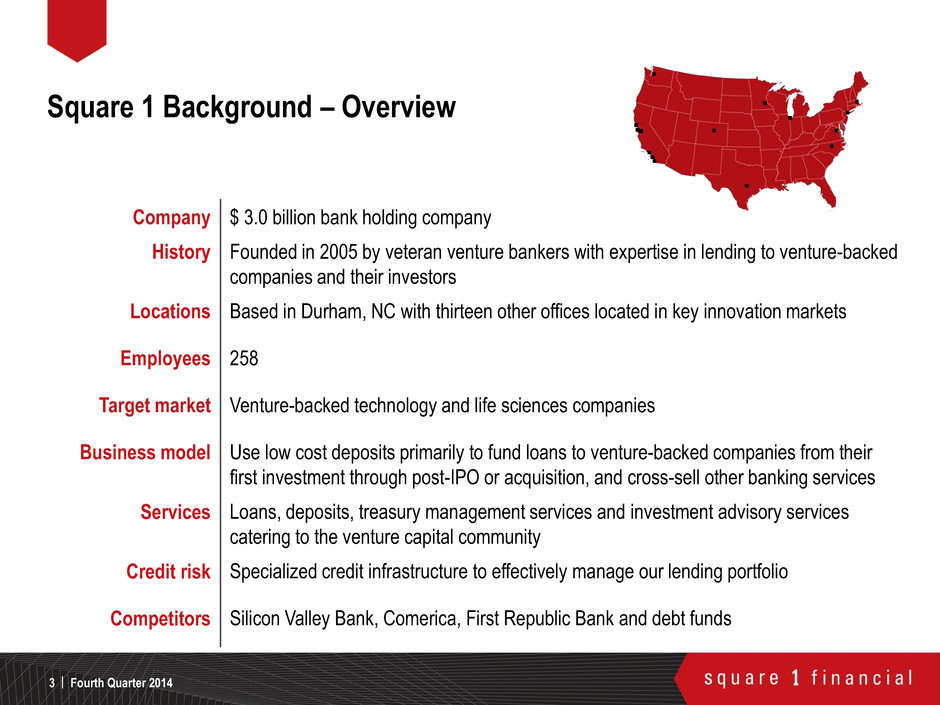
Square 1 Background – Overview Company $ 3.0 billion bank holding company History Founded in 2005 by veteran venture bankers with expertise in lending to venture-backed companies and their investors Locations Based in Durham, NC with thirteen other offices located in key innovation markets Employees 258 Target market Venture-backed technology and life sciences companies Business model Use low cost deposits primarily to fund loans to venture-backed companies from their first investment through post-IPO or acquisition, and cross-sell other banking services Services Loans, deposits, treasury management services and investment advisory services catering to the venture capital community Credit risk Specialized credit infrastructure to effectively manage our lending portfolio Competitors Silicon Valley Bank, Comerica, First Republic Bank and debt funds Fourth Quarter 2014 3 |
Differentiated business model Pure play venture bank, focused on innovation sector nationwide (source of new potential clients) Expertise in lending to venture-backed companies, known for high-touch client service Seasoned management team, extensive networks, proven track records Consistent growth Average loan growth – 24% CAGR 2011 – 2014 Average deposit growth – 18% CAGR 2011 – 2014 Strong and diversified noninterest income growth – reflects overall increase in balance sheet Diversified balance sheet and strong liquidity position Loan portfolio diversified across industry, stage, geography and size Low cost, core deposits – current average cost of deposits is 2 basis points Benefit from rising interest rates – 92% of loans are variable rate; investment portfolio duration of 2.8 years Strong Profitability – 2014 Return on average assets – 1.25% Efficient, scalable platform – Efficiency ratio of 50% Net Interest Margin – 4.06% Square 1’s Investment Summary Fourth Quarter 2014 | 4 Note Data as of December 31, 2014
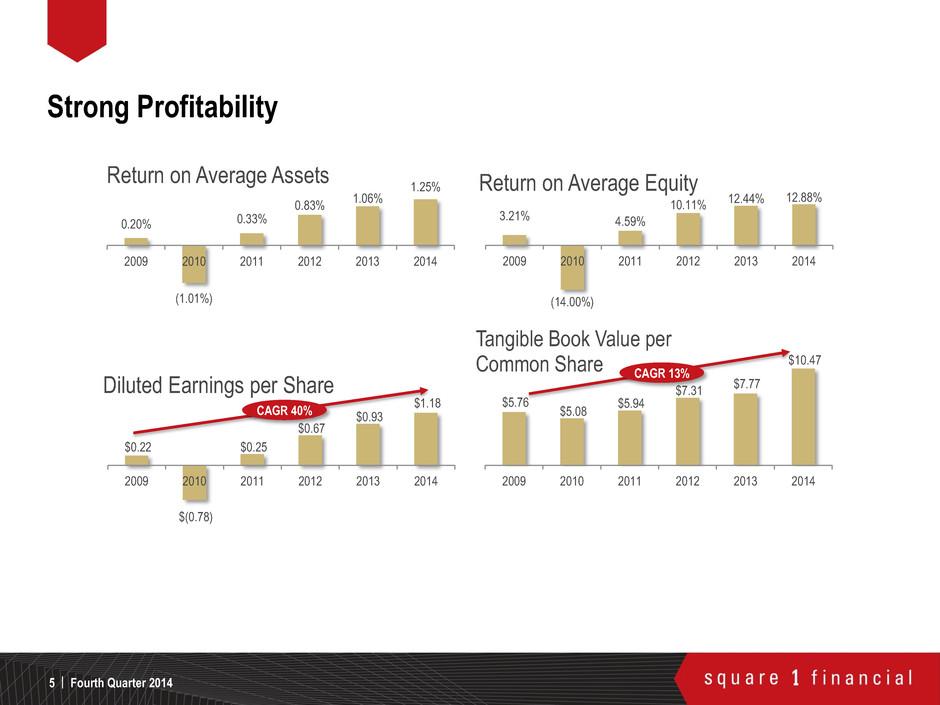
Strong Profitability Fourth Quarter 2014 5 | 0.20% (1.01%) 0.33% 0.83% 1.06% 1.25% 2009 2010 2011 2012 2013 2014 Return on Average Assets 3.21% (14.00%) 4.59% 10.11% 12.44% 12.88% 2009 2010 2011 2012 2013 2014 Return on Average Equity $0.22 $(0.78) $0.25 $0.67 $0.93 $1.18 2009 2010 2011 2012 2013 2014 Diluted Earnings per Share CAGR 40% $5.76 $5.08 $5.94 $7.31 $7.77 $10.47 2009 2010 2011 2012 2013 2014 Tangible Book Value per Common Share CAGR 13%
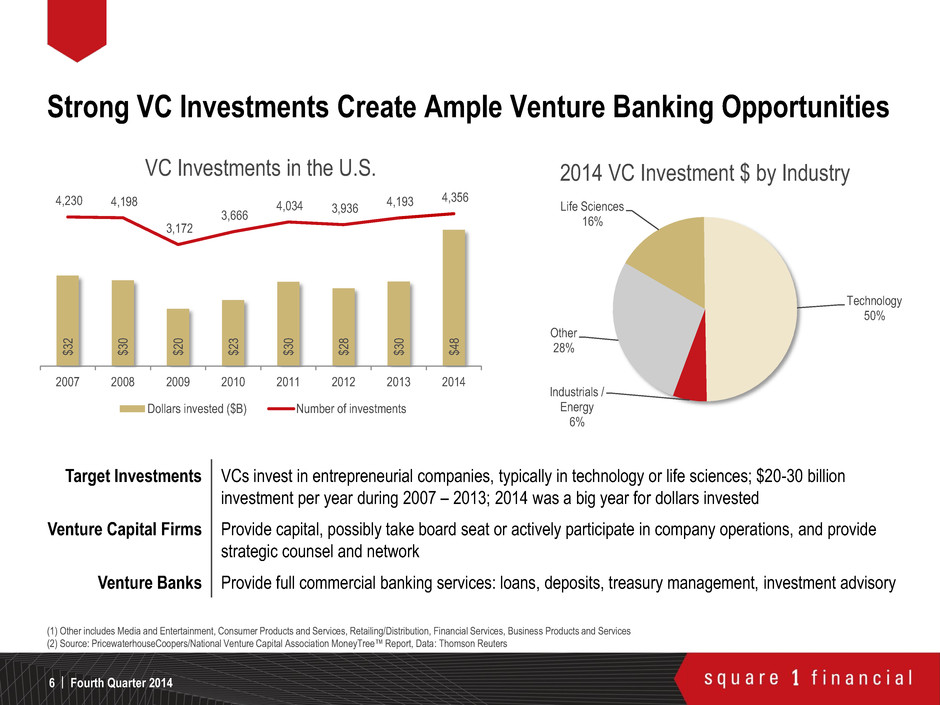
Strong VC Investments Create Ample Venture Banking Opportunities | 6 Target Investments VCs invest in entrepreneurial companies, typically in technology or life sciences; $20-30 billion investment per year during 2007 – 2013; 2014 was a big year for dollars invested Venture Capital Firms Provide capital, possibly take board seat or actively participate in company operations, and provide strategic counsel and network Venture Banks Provide full commercial banking services: loans, deposits, treasury management, investment advisory (1) Other includes Media and Entertainment, Consumer Products and Services, Retailing/Distribution, Financial Services, Business Products and Services (2) Source: PricewaterhouseCoopers/National Venture Capital Association MoneyTree™ Report, Data: Thomson Reuters Fourth Quarter 2014 $ 32 $ 30 $ 20 $ 23 $ 30 $ 28 $ 30 $ 48 4,230 4,198 3,172 3,666 4,034 3,936 4,193 4,356 2007 2008 2009 2010 2011 2012 2013 2014 VC Investments in the U.S. Dollars invested ($B) Number of investments Life Sciences 16% Technology 50% Industrials / Energy 6% Other 28% 2014 VC Investment $ by Industry
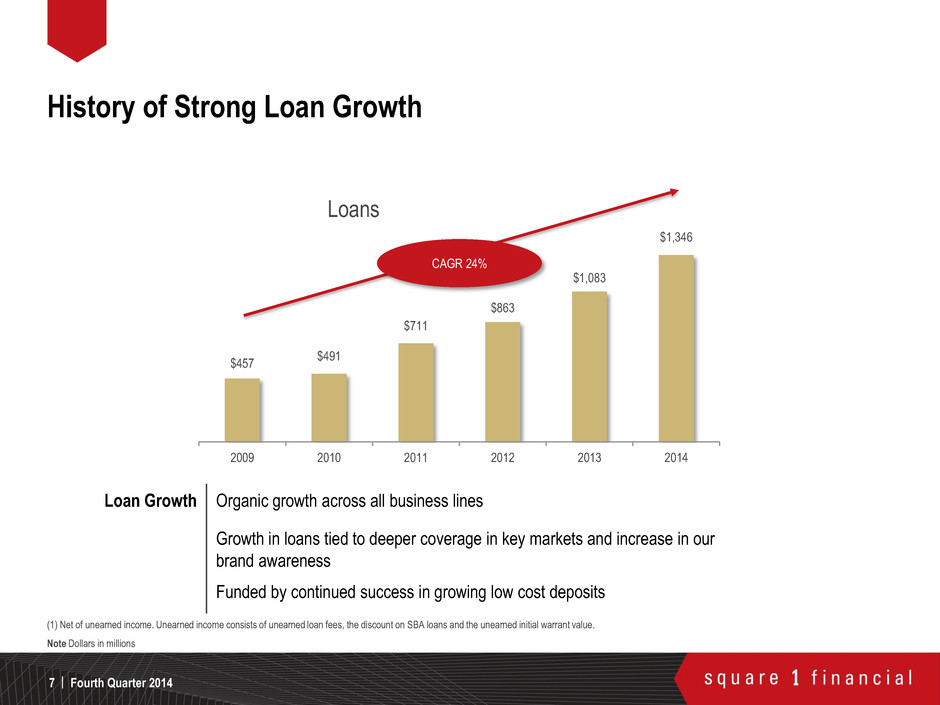
History of Strong Loan Growth Fourth Quarter 2014 | 7 Loan Growth Organic growth across all business lines Growth in loans tied to deeper coverage in key markets and increase in our brand awareness Funded by continued success in growing low cost deposits (1) Net of unearned income. Unearned income consists of unearned loan fees, the discount on SBA loans and the unearned initial warrant value. Note Dollars in millions $457 $491 $711 $863 $1,083 $1,346 2009 2010 2011 2012 2013 2014 Loans CAGR 24%
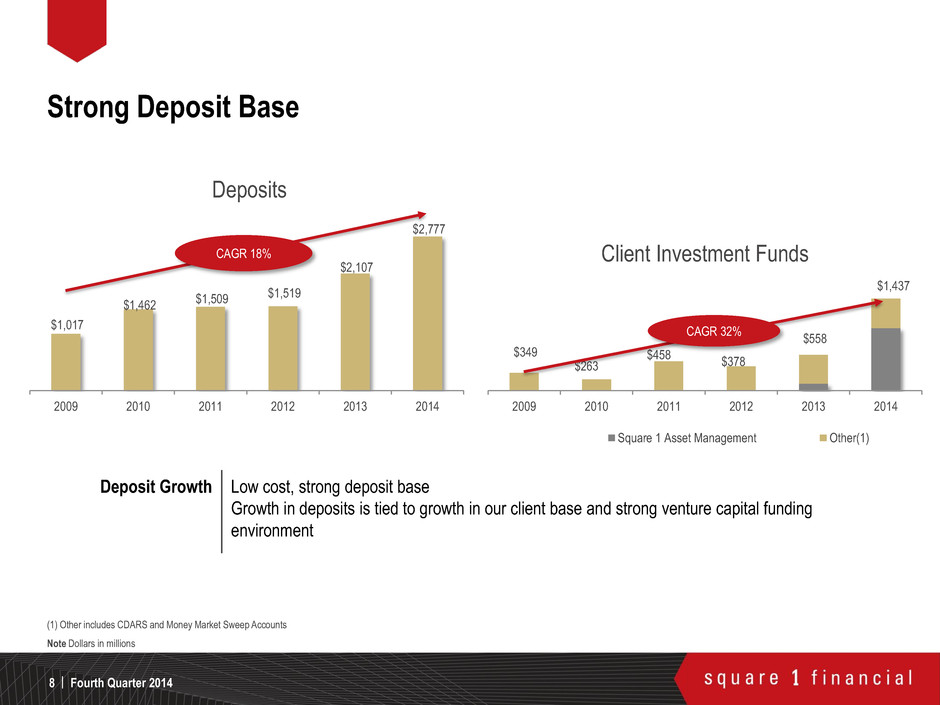
Strong Deposit Base Fourth Quarter 2014 | 8 Deposit Growth Low cost, strong deposit base Growth in deposits is tied to growth in our client base and strong venture capital funding environment (1) Other includes CDARS and Money Market Sweep Accounts Note Dollars in millions $1,017 $1,462 $1,509 $1,519 $2,107 $2,777 2009 2010 2011 2012 2013 2014 Deposits CAGR 18% $349 $263 $458 $378 $558 $1,437 2009 2010 2011 2012 2013 2014 Client Investment Funds Square 1 Asset Management Other(1) CAGR 32%
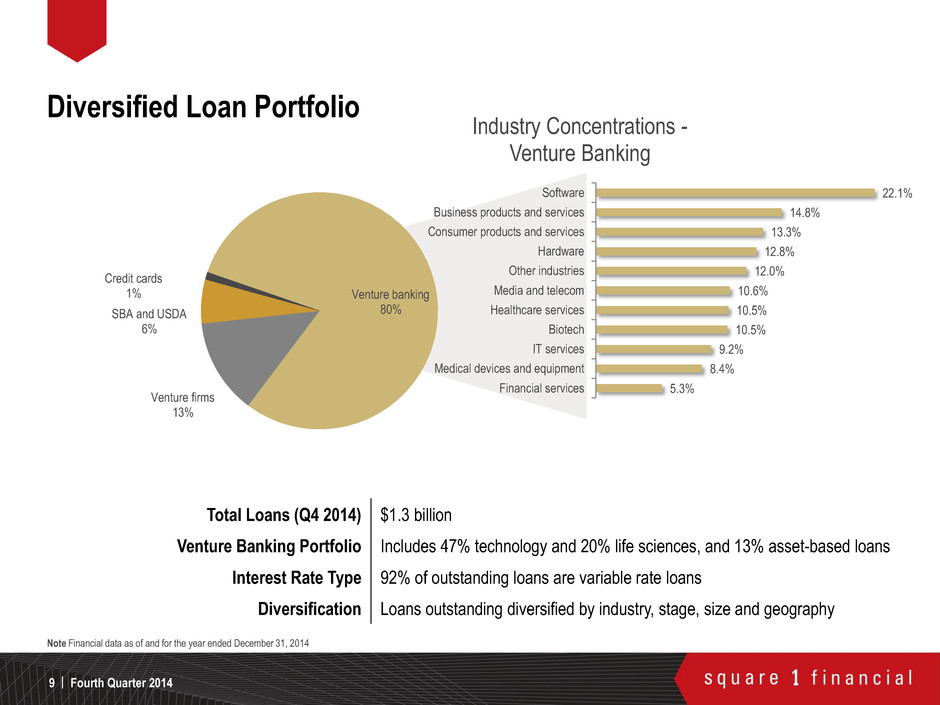
Diversified Loan Portfolio Note Financial data as of and for the year ended December 31, 2014 Total Loans (Q4 2014) $1.3 billion Venture Banking Portfolio Includes 47% technology and 20% life sciences, and 13% asset-based loans Interest Rate Type 92% of outstanding loans are variable rate loans Diversification Loans outstanding diversified by industry, stage, size and geography Fourth Quarter 2014 9 | 5.3% 8.4% 9.2% 10.5% 10.5% 10.6% 12.0% 12.8% 13.3% 14.8% 22.1% Financial services Medical devices and equipment IT services Biotech Healthcare services Media and telecom Other industries Hardware Consumer products and services Business products and services Software Industry Concentrations - Venture Banking Venture banking 80% Venture firms 13% SBA and USDA 6% Credit cards 1%
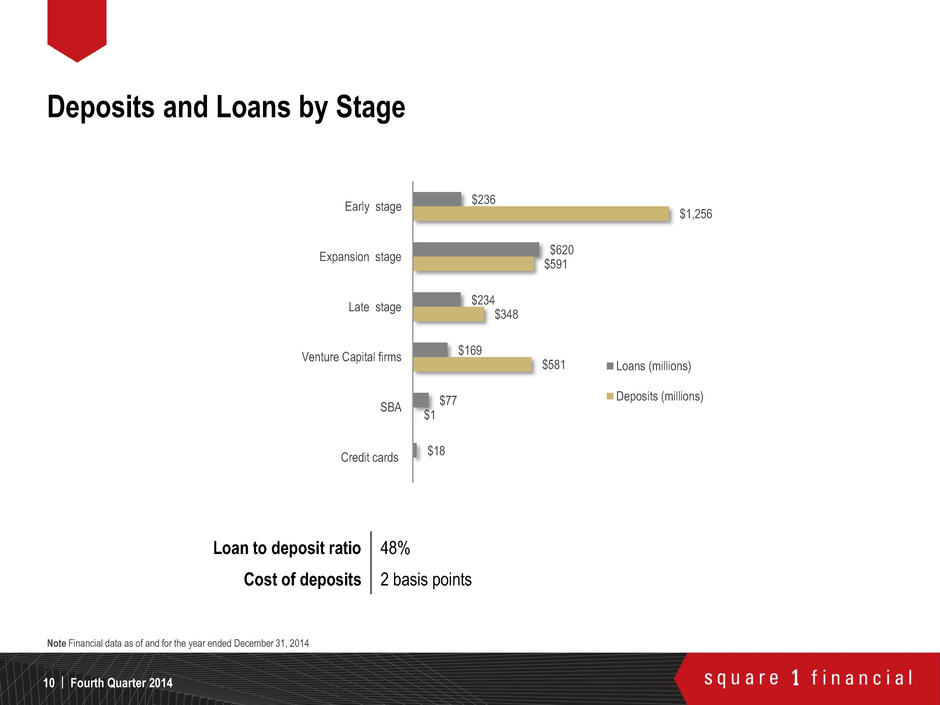
Deposits and Loans by Stage Note Financial data as of and for the year ended December 31, 2014 Loan to deposit ratio 48% Cost of deposits 2 basis points Fourth Quarter 2014 10 | $236 $620 $234 $169 $77 $18 $1,256 $591 $348 $581 $1 Early stage Expansion stage Late stage Venture Capital firms SBA Credit cards Loans (millions) Deposits (millions)
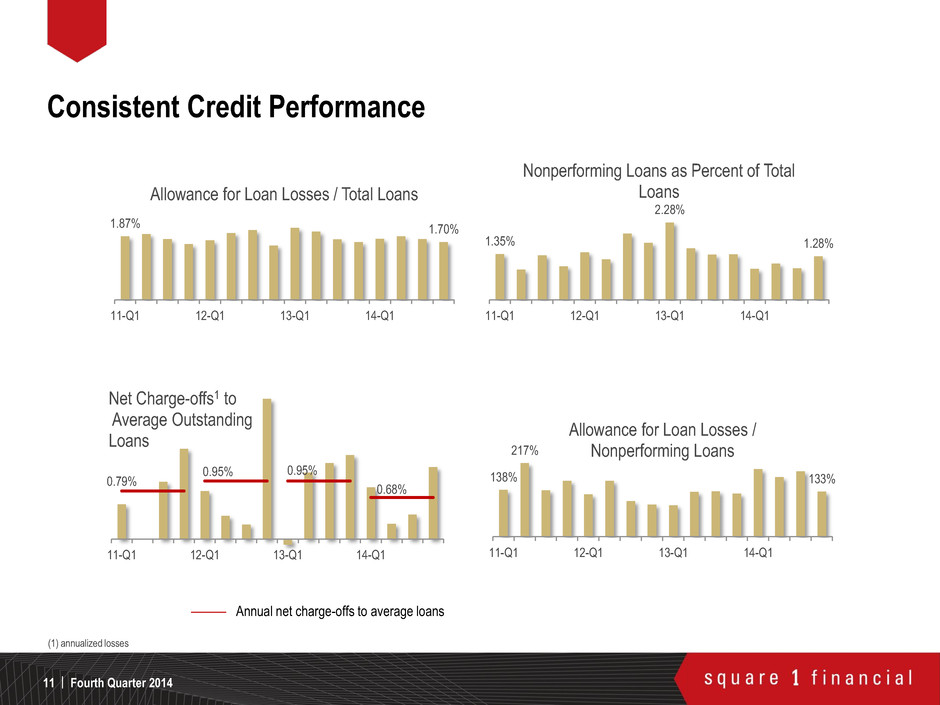
Fourth Quarter 2014 11 | (1) annualized losses Consistent Credit Performance 0.79% 0.95% 0.95% 0.68% 11-Q1 12-Q1 13-Q1 14-Q1 Net Charge-offs1 to Average Outstanding Loans 138% 217% 133% 11-Q1 12-Q1 13-Q1 14-Q1 Allowance for Loan Losses / Nonperforming Loans 1.35% 2.28% 1.28% 11-Q1 12-Q1 13-Q1 14-Q1 Nonperforming Loans as Percent of Total Loans 1.87% 1.70% 11-Q1 12-Q1 13-Q1 14-Q1 Allowance for Loan Losses / Total Loans ——— Annual net charge-offs to average loans
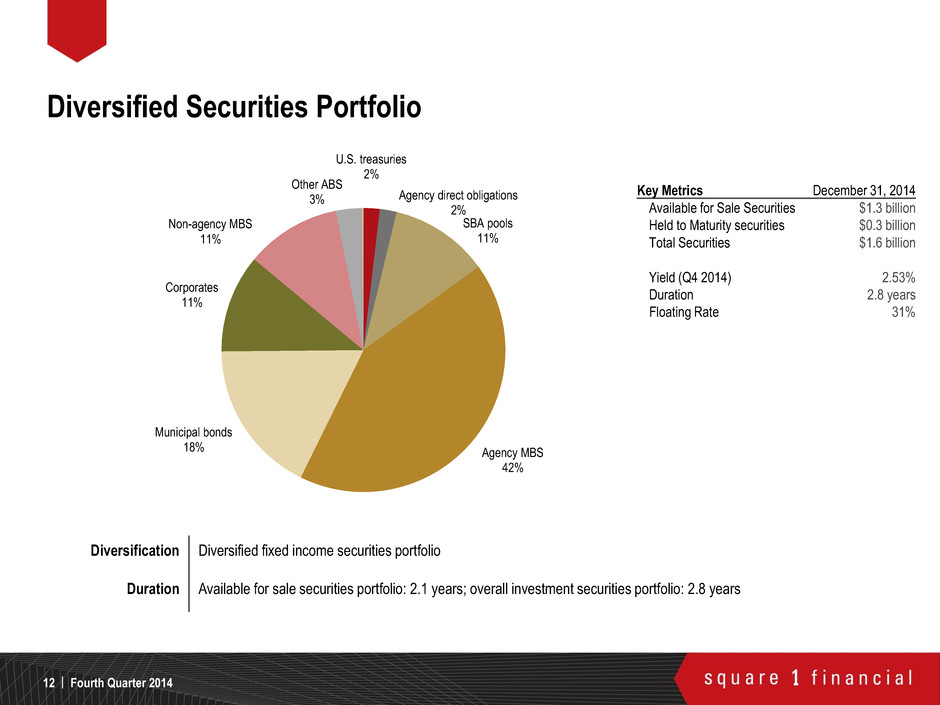
Diversified Securities Portfolio Diversification Diversified fixed income securities portfolio Duration Available for sale securities portfolio: 2.1 years; overall investment securities portfolio: 2.8 years Fourth Quarter 2014 12 | Key Metrics December 31, 2014 Available for Sale Securities $1.3 billion Held to Maturity securities $0.3 billion Total Securities $1.6 billion Yield (Q4 2014) 2.53% Duration 2.8 years Floating Rate 31% U.S. treasuries 2% Agency direct obligations 2% SBA pools 11% Agency MBS 42% Municipal bonds 18% Corporates 11% Non-agency MBS 11% Other ABS 3%
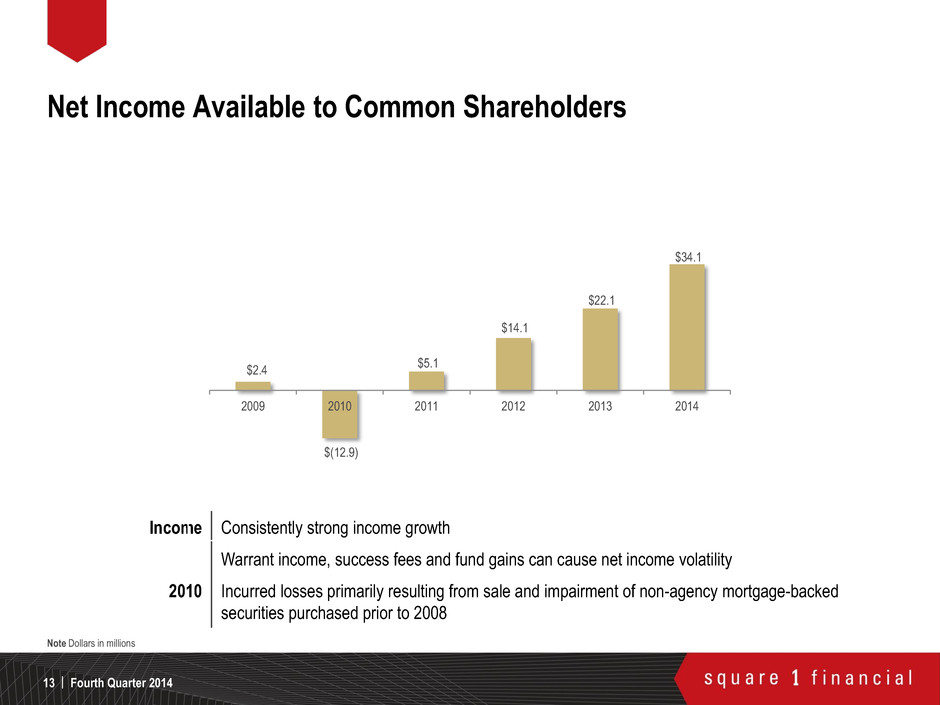
Income Consistently strong income growth Warrant income, success fees and fund gains can cause net income volatility 2010 Incurred losses primarily resulting from sale and impairment of non-agency mortgage-backed securities purchased prior to 2008 Note Dollars in millions Fourth Quarter 2014 13 | Net Income Available to Common Shareholders $2.4 $(12.9) $5.1 $14.1 $22.1 $34.1 2009 2010 2011 2012 2013 2014
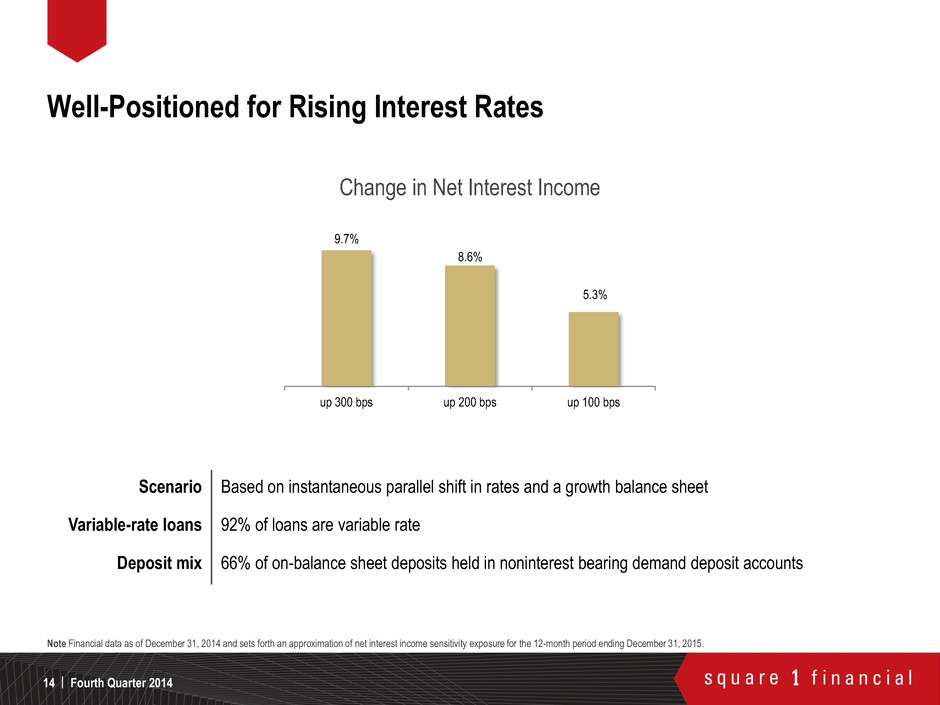
Well-Positioned for Rising Interest Rates Fourth Quarter 2014 | 14 Scenario Based on instantaneous parallel shift in rates and a growth balance sheet Variable-rate loans 92% of loans are variable rate Deposit mix 66% of on-balance sheet deposits held in noninterest bearing demand deposit accounts Note Financial data as of December 31, 2014 and sets forth an approximation of net interest income sensitivity exposure for the 12-month period ending December 31, 2015. 9.7% 8.6% 5.3% up 300 bps up 200 bps up 100 bps Change in Net Interest Income
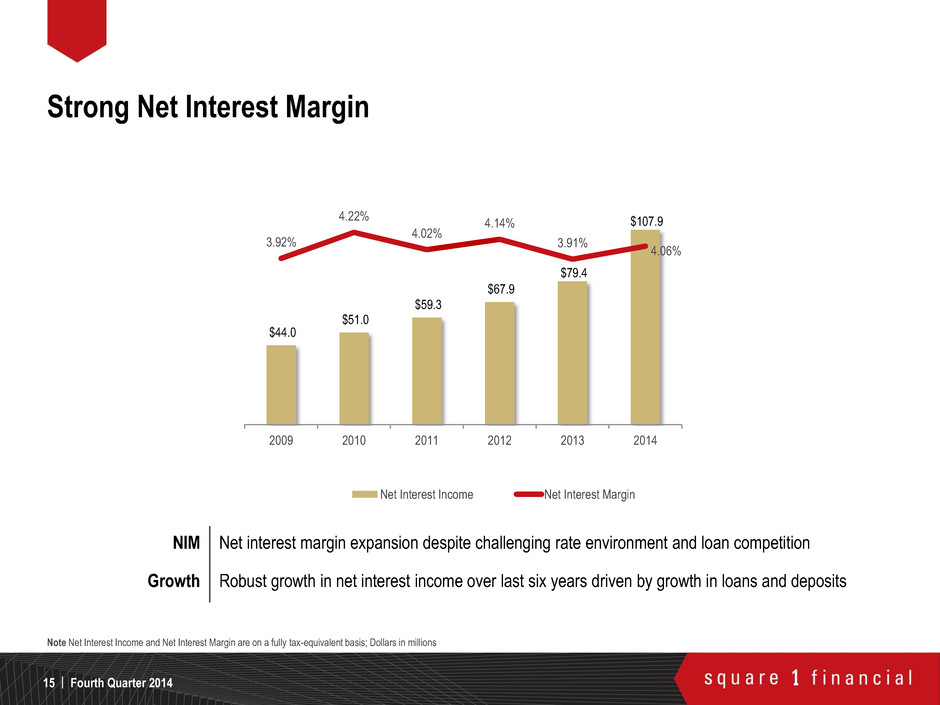
Strong Net Interest Margin Fourth Quarter 2014 | 15 NIM Net interest margin expansion despite challenging rate environment and loan competition Growth Robust growth in net interest income over last six years driven by growth in loans and deposits Note Net Interest Income and Net Interest Margin are on a fully tax-equivalent basis; Dollars in millions $44.0 $51.0 $59.3 $67.9 $79.4 $107.9 3.92% 4.22% 4.02% 4.14% 3.91% 4.06% $- $20.0 $40.0 $60.0 $80.0 $100.0 $120.0 2009 2010 2011 2012 2013 2014 Net Interest Income Net Interest Margin
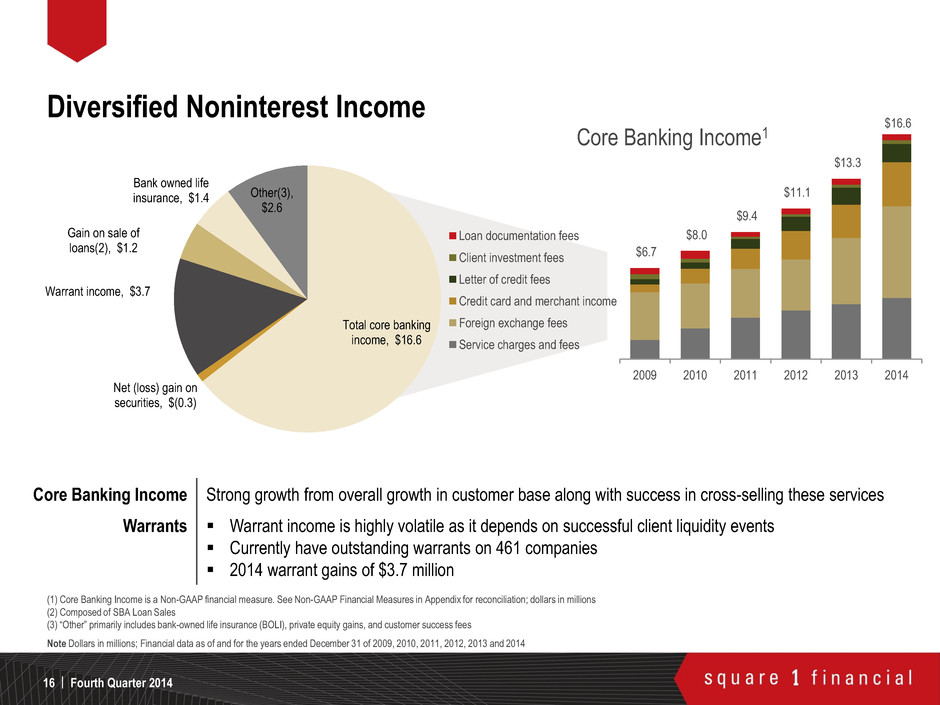
Fourth Quarter 2014 | 16 Diversified Noninterest Income Core Banking Income Strong growth from overall growth in customer base along with success in cross-selling these services Warrants Warrant income is highly volatile as it depends on successful client liquidity events Currently have outstanding warrants on 461 companies 2014 warrant gains of $3.7 million (1) Core Banking Income is a Non-GAAP financial measure. See Non-GAAP Financial Measures in Appendix for reconciliation; dollars in millions (2) Composed of SBA Loan Sales (3) “Other” primarily includes bank-owned life insurance (BOLI), private equity gains, and customer success fees Note Dollars in millions; Financial data as of and for the years ended December 31 of 2009, 2010, 2011, 2012, 2013 and 2014 $6.7 $8.0 $9.4 $11.1 $13.3 $16.6 2009 2010 2011 2012 2013 2014 Core Banking Income1 Loan documentation fees Client investment fees Letter of credit fees Credit card and merchant income Foreign exchange fees Service charges and fees Total core banking income, $16.6 Net (loss) gain on securities, $(0.3) Warrant income, $3.7 Gain on sale of loans(2), $1.2 Bank owned life insurance, $1.4 Other(3), $2.6
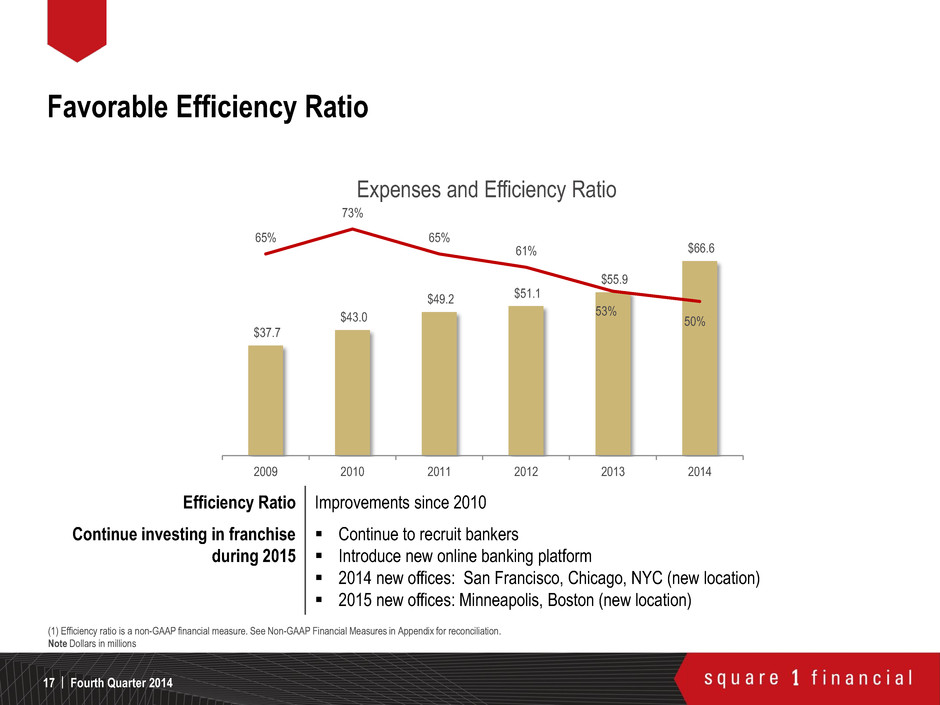
Favorable Efficiency Ratio Fourth Quarter 2014 | 17 Efficiency Ratio Improvements since 2010 Continue investing in franchise during 2015 Continue to recruit bankers Introduce new online banking platform 2014 new offices: San Francisco, Chicago, NYC (new location) 2015 new offices: Minneapolis, Boston (new location) (1) Efficiency ratio is a non-GAAP financial measure. See Non-GAAP Financial Measures in Appendix for reconciliation. Note Dollars in millions $37.7 $43.0 $49.2 $51.1 $55.9 $66.6 65% 73% 65% 61% 53% 50% 2009 2010 2011 2012 2013 2014 Expenses and Efficiency Ratio
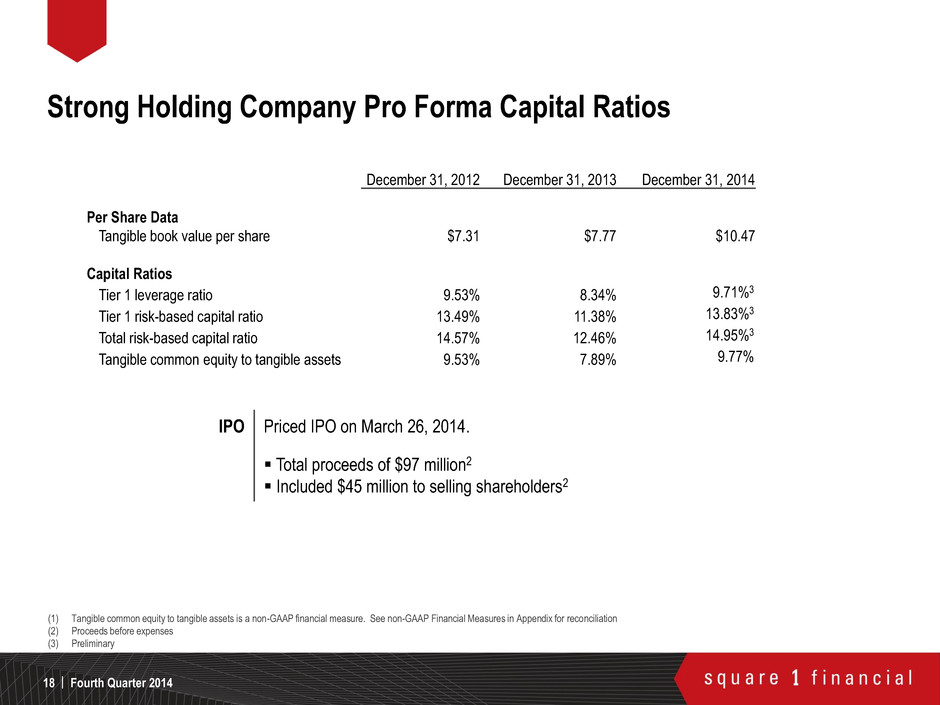
Strong Holding Company Pro Forma Capital Ratios Fourth Quarter 2014 | 18 December 31, 2012 December 31, 2013 December 31, 2014 Per Share Data Tangible book value per share $7.31 $7.77 $10.47 Capital Ratios Tier 1 leverage ratio 9.53% 8.34% 9.71%3 Tier 1 risk-based capital ratio 13.49% 11.38% 13.83%3 Total risk-based capital ratio 14.57% 12.46% 14.95%3 Tangible common equity to tangible assets 9.53% 7.89% 9.77% IPO Priced IPO on March 26, 2014. Total proceeds of $97 million2 Included $45 million to selling shareholders2 (1) Tangible common equity to tangible assets is a non-GAAP financial measure. See non-GAAP Financial Measures in Appendix for reconciliation (2) Proceeds before expenses (3) Preliminary
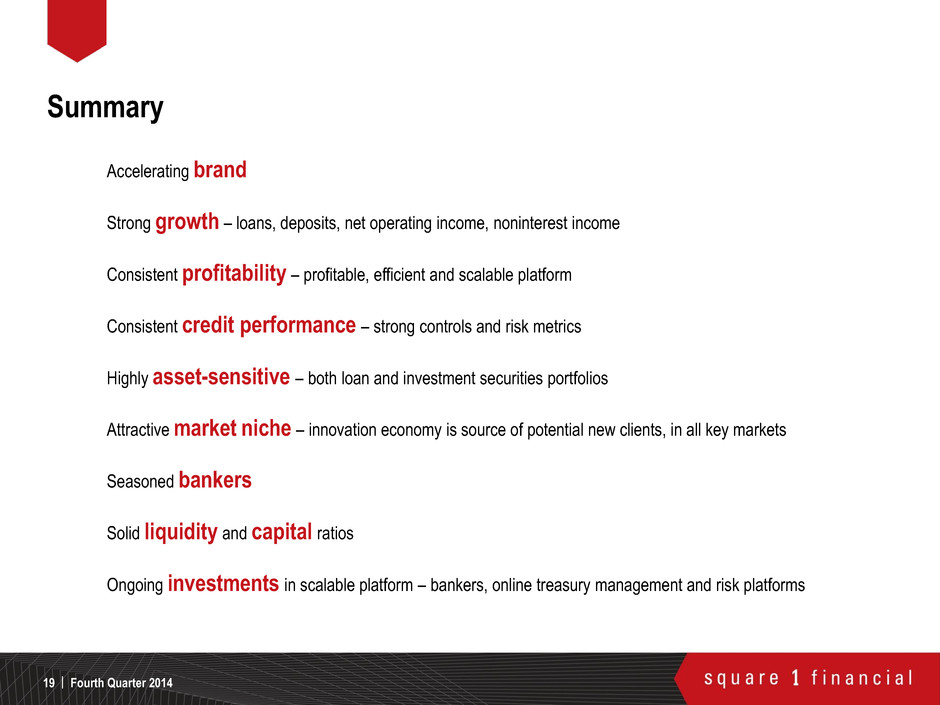
Accelerating brand Strong growth – loans, deposits, net operating income, noninterest income Consistent profitability – profitable, efficient and scalable platform Consistent credit performance – strong controls and risk metrics Highly asset-sensitive – both loan and investment securities portfolios Attractive market niche – innovation economy is source of potential new clients, in all key markets Seasoned bankers Solid liquidity and capital ratios Ongoing investments in scalable platform – bankers, online treasury management and risk platforms Summary Fourth Quarter 2014 | 19
Square 1 Financial Investor Relations web: ir.square1financial.com email: investorrelations@square1bank.com phone: 866.355.7101 For More Information Fourth Quarter 2014 | 20

Appendix Fourth Quarter 2014 | 21
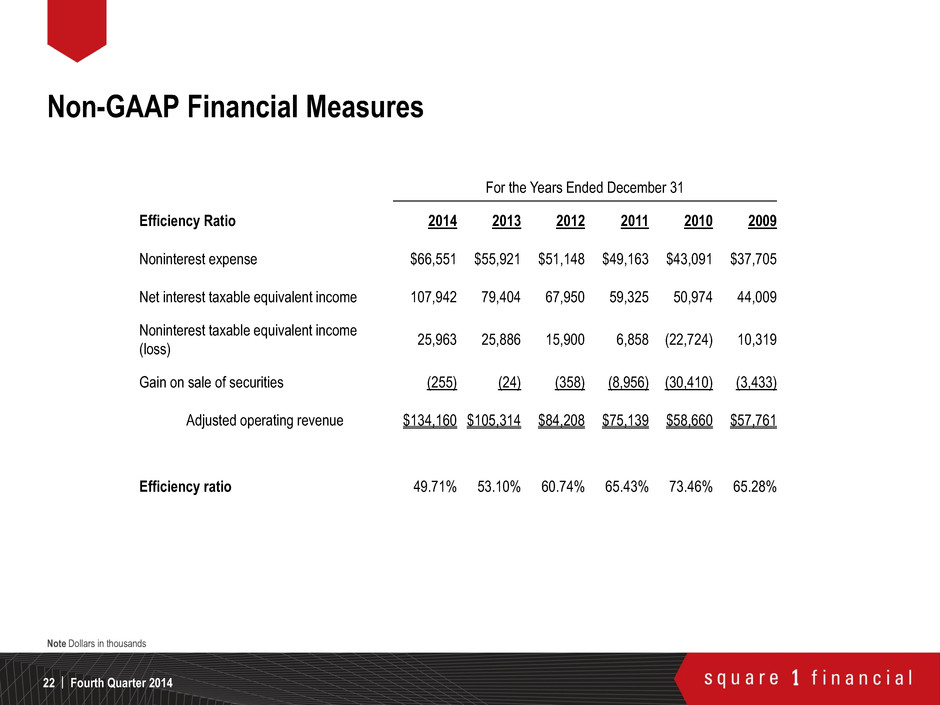
Non-GAAP Financial Measures Fourth Quarter 2014 | 22 For the Years Ended December 31 Efficiency Ratio 2014 2013 2012 2011 2010 2009 Noninterest expense $66,551 $55,921 $51,148 $49,163 $43,091 $37,705 Net interest taxable equivalent income 107,942 79,404 67,950 59,325 50,974 44,009 Noninterest taxable equivalent income (loss) 25,963 25,886 15,900 6,858 (22,724) 10,319 Gain on sale of securities (255) (24) (358) (8,956) (30,410) (3,433) Adjusted operating revenue $134,160 $105,314 $84,208 $75,139 $58,660 $57,761 Efficiency ratio 49.71% 53.10% 60.74% 65.43% 73.46% 65.28% Note Dollars in thousands
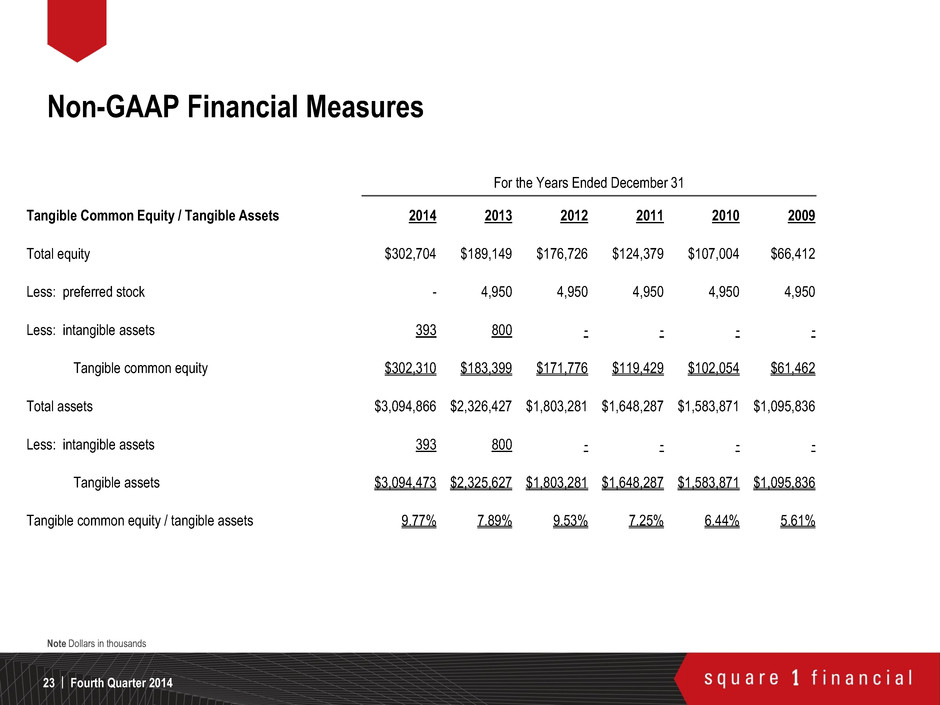
Non-GAAP Financial Measures Fourth Quarter 2014 | 23 For the Years Ended December 31 Tangible Common Equity / Tangible Assets 2014 2013 2012 2011 2010 2009 Total equity $302,704 $189,149 $176,726 $124,379 $107,004 $66,412 Less: preferred stock - 4,950 4,950 4,950 4,950 4,950 Less: intangible assets 393 800 - - - - Tangible common equity $302,310 $183,399 $171,776 $119,429 $102,054 $61,462 Total assets $3,094,866 $2,326,427 $1,803,281 $1,648,287 $1,583,871 $1,095,836 Less: intangible assets 393 800 - - - - Tangible assets $3,094,473 $2,325,627 $1,803,281 $1,648,287 $1,583,871 $1,095,836 Tangible common equity / tangible assets 9.77% 7.89% 9.53% 7.25% 6.44% 5.61% Note Dollars in thousands
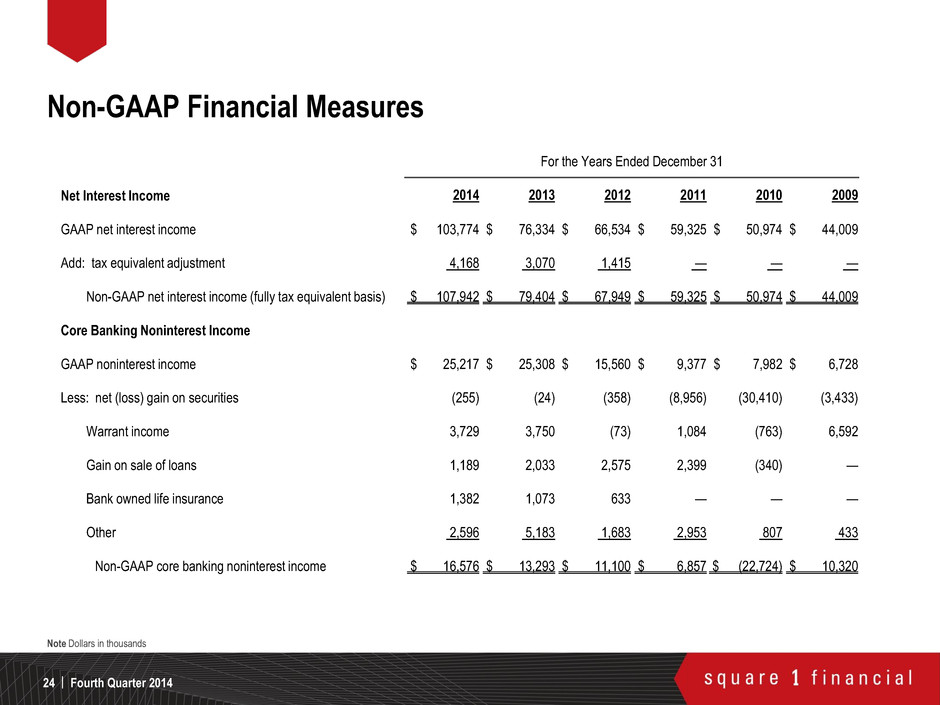
Non-GAAP Financial Measures Fourth Quarter 2014 | 24 For the Years Ended December 31 Net Interest Income 2014 2013 2012 2011 2010 2009 GAAP net interest income $ 103,774 $ 76,334 $ 66,534 $ 59,325 $ 50,974 $ 44,009 Add: tax equivalent adjustment 4,168 3,070 1,415 — — — Non-GAAP net interest income (fully tax equivalent basis) $ 107,942 $ 79,404 $ 67,949 $ 59,325 $ 50,974 $ 44,009 Core Banking Noninterest Income GAAP noninterest income $ 25,217 $ 25,308 $ 15,560 $ 9,377 $ 7,982 $ 6,728 Less: net (loss) gain on securities (255) (24) (358) (8,956) (30,410) (3,433) Warrant income 3,729 3,750 (73) 1,084 (763) 6,592 Gain on sale of loans 1,189 2,033 2,575 2,399 (340) — Bank owned life insurance 1,382 1,073 633 — — — Other 2,596 5,183 1,683 2,953 807 433 Non-GAAP core banking noninterest income $ 16,576 $ 13,293 $ 11,100 $ 6,857 $ (22,724) $ 10,320 Note Dollars in thousands
