UNITED STATES
SECURITIES AND EXCHANGE COMMISSION
Washington, DC 20549
FORM 8-K
CURRENT REPORT
Pursuant to Section 13 or 15(d) of the
Securities Exchange Act of 1934
Date of Report (Date of earliest event reported): February 11, 2015
MB FINANCIAL, INC.
(Exact name of registrant as specified in its charter)
|
Maryland |
|
1-36599 |
|
36-4460265 |
|
(State or other jurisdiction of incorporation) |
|
(Commission File No.) |
|
(IRS Employer Identification No.) |
|
800 West Madison Street, Chicago, Illinois |
|
60607 |
|
(Address of principal executive offices) |
|
(Zip Code) |
Registrant’s telephone number, including area code: (888) 422-6562
N/A
(Former name or former address, if changed since last report)
Check the appropriate box below if the Form 8-K filing is intended to simultaneously satisfy the filing obligation of the registrant under any of the following provisions (see General Instruction A.2. below):
o Written communications pursuant to Rule 425 under the Securities Act (17 CFR 230.425)
o Soliciting material pursuant to Rule 14a-12 under the Exchange Act (17 CFR 240.14a-12)
o Pre-commencement communications pursuant to Rule 14d-2(b) under the Exchange Act (17 CFR 240.14d-2(b))
o Pre-commencement communications pursuant to Rule 13e-4(c) under the Exchange Act (17 CFR 240.13e-4(c))
Item 7.01. Regulation FD Disclosure
Forward-Looking Statements
When used in this Current Report on Form 8-K and in other reports filed with or furnished to the Securities and Exchange Commission (the “SEC”), in press releases or other public stockholder communications, or in oral statements made with the approval of an authorized executive officer, the words or phrases “believe,” “will,” “should,” “will likely result,” “are expected to,” “will continue” “is anticipated,” “estimate,” “project,” “plans,” or similar expressions are intended to identify “forward-looking statements” within the meaning of the Private Securities Litigation Reform Act of 1995. You are cautioned not to place undue reliance on any forward-looking statements, which speak only as of the date made. These statements may relate to our future financial performance, strategic plans or objectives, revenues or earnings projections, or other financial items. By their nature, these statements are subject to numerous uncertainties that could cause actual results to differ materially from those anticipated in the statements.
Important factors that could cause actual results to differ materially from the results anticipated or projected include, but are not limited to, the following: (1) expected revenues, cost savings, synergies and other benefits from the Taylor Capital merger and our other merger and acquisition activities might not be realized within the anticipated time frames or at all, and costs or difficulties relating to integration matters, including but not limited to customer and employee retention, might be greater than expected; (2) the possibility that the expected benefits of the other acquisition transactions we previously completed will not be realized; (3) the credit risks of lending activities, including changes in the level and direction of loan delinquencies and write-offs and changes in estimates of the adequacy of the allowance for loan losses, which could necessitate additional provisions for loan losses, resulting both from loans we originate and loans we acquire from other financial institutions; (4) results of examinations by the Office of Comptroller of Currency, the Federal Reserve Board, the Consumer Financial Protection Bureau and other regulatory authorities, including the possibility that any such regulatory authority may, among other things, require us to increase our allowance for loan losses or write down assets; (5) competitive pressures among depository institutions; (6) interest rate movements and their impact on customer behavior and net interest margin; (7) the possibility that our mortgage banking business may increase volatility in our revenues and earnings and the possibility that the profitability of our mortgage banking business could be significantly reduced if we are unable to originate and sell mortgage loans at profitable margins; (8) the impact of repricing and competitors’ pricing initiatives on loan and deposit products; (9) fluctuations in real estate values; (10) the ability to adapt successfully to technological changes to meet customers’ needs and developments in the market-place; (11) our ability to realize the residual values of our direct finance, leveraged, and operating leases; (12) our ability to access cost-effective funding; (13) changes in financial markets; (14) changes in economic conditions in general and in the Chicago metropolitan area in particular; (15) the costs, effects and outcomes of litigation; (16) new legislation or regulatory changes, including but not limited to the Dodd-Frank Wall Street Reform and Consumer Protection Act of 2010 (the “Dodd-Frank Act”) and regulations adopted thereunder, changes in capital requirements pursuant to the Dodd-Frank Act and the implementation of the Basel III capital standards, other governmental initiatives affecting the financial services industry and changes in federal and/or state tax laws or interpretations thereof by taxing authorities; (17) changes in accounting principles, policies or guidelines; (18) our future acquisitions of other depository institutions or lines of business; (19) future goodwill impairment due to changes in our business, changes in market conditions, or other factors; and (20) the impact of fluctuating interest rates on our mortgage servicing rights asset.
MB Financial does not undertake any obligation to update any forward-looking statement to reflect circumstances or events that occur after the date on which the forward-looking statement is made.
Set forth below are investor presentation materials.
|
|
February 2015 NASDAQ: MBFI Investor Presentation |
|
|
Forward-Looking Statements 1 Forward-Looking Statements When used in this presentation and in reports filed with or furnished to the Securities and Exchange Commission, in press releases or other public stockholder communications, or in oral statements made with the approval of an authorized executive officer, the words or phrases “believe,” “will,” “should,” “will likely result,” “are expected to,” “will continue” “is anticipated,” “estimate,” “project,” “plans,” or similar expressions are intended to identify “forward-looking statements” within the meaning of the Private Securities Litigation Reform Act of 1995. You are cautioned not to place undue reliance on any forward-looking statements, which speak only as of the date made. These statements may relate to our future financial performance, strategic plans or objectives, revenues or earnings projections, or other financial items. By their nature, these statements are subject to numerous uncertainties that could cause actual results to differ materially from those anticipated in the statements. Important factors that could cause actual results to differ materially from the results anticipated or projected include, but are not limited to, the following: (1) expected revenues, cost savings, synergies and other benefits from the Taylor Capital merger and our other merger and acquisition activities might not be realized within the anticipated time frames or at all, and costs or difficulties relating to integration matters, including but not limited to customer and employee retention, might be greater than expected; (2) the possibility that the expected benefits of the other acquisition transactions we previously completed will not be realized; (3) the credit risks of lending activities, including changes in the level and direction of loan delinquencies and write-offs and changes in estimates of the adequacy of the allowance for loan losses, which could necessitate additional provisions for loan losses, resulting both from loans we originate and loans we acquire from other financial institutions; (4) results of examinations by the Office of Comptroller of Currency, the Federal Reserve Board, the Consumer Financial Protection Bureau and other regulatory authorities, including the possibility that any such regulatory authority may, among other things, require us to increase our allowance for loan losses or write down assets; (5) competitive pressures among depository institutions; (6) interest rate movements and their impact on customer behavior and net interest margin; (7) the possibility that our mortgage banking business may increase volatility in our revenues and earnings and the possibility that the profitability of our mortgage banking business could be significantly reduced if we are unable to originate and sell mortgage loans at profitable margins; (8) the impact of repricing and competitors’ pricing initiatives on loan and deposit products; (9) fluctuations in real estate values; (10) the ability to adapt successfully to technological changes to meet customers’ needs and developments in the market-place; (11) our ability to realize the residual values of our direct finance, leveraged, and operating leases; (12) our ability to access cost-effective funding; (13) changes in financial markets; (14) changes in economic conditions in general and in the Chicago metropolitan area in particular; (15) the costs, effects and outcomes of litigation; (16) new legislation or regulatory changes, including but not limited to the Dodd-Frank Wall Street Reform and Consumer Protection Act of 2010 (the “Dodd-Frank Act”) and regulations adopted thereunder, changes in capital requirements pursuant to the Dodd-Frank Act and the implementation of the Basel III capital standards, other governmental initiatives affecting the financial services industry and changes in federal and/or state tax laws or interpretations thereof by taxing authorities; (17) changes in accounting principles, policies or guidelines; (18) our future acquisitions of other depository institutions or lines of business; (19) future goodwill impairment due to changes in our business, changes in market conditions, or other factors; and (20) the impact of fluctuating interest rates on our mortgage servicing rights asset. We do not undertake any obligation to update any forward-looking statement to reflect circumstances or events that occur after the date on which the forward-looking statement is made. |
|
|
Net Income Available to Common Stockholders of $34.1 Million or $0.45 per Diluted Common Share Operating Earnings of $39.6 Million up 11% from $35.7 million in 3Q 20141 Net Interest Income, Noninterest Income and Noninterest Expense all Increased due to the full quarter results of the Merger: Net interest income increased $24.2 million or 25% from 3Q 2014 Broad increases in core noninterest income up 27% from prior quarter: Leasing revenue increased 5% from the prior quarter due to higher fees and sales of third-party equipment maintenance contracts. The mortgage banking segment generated $29.1 million of origination and servicing revenue. Commercial deposit and treasury management fees increased 15% from the prior quarter with new customer activity due to both the merger and organic growth. On a fully tax-equivalent basis, core non interest income increased to 39% of revenues in the 4Q 2014. The 4Q 2014 efficiency ratio of 63.4% and the ratio of net non-interest expense to average assets of 1.39% both improved from year ago levels and did not change significantly from the prior quarter. Credit Quality Metrics Reflect Continued Improvement: Non-performing loans continued to decrease from year ago and prior quarter levels, with the ratio of non-performing loans to total loans decreasing to 0.96% at 12/31/2014 from 1.12% at 09/30/2014. Recent Company Highlights – 4Q 2014 2 1Operating earnings is defined as net income as reported less non-core items, net of tax. |
|
|
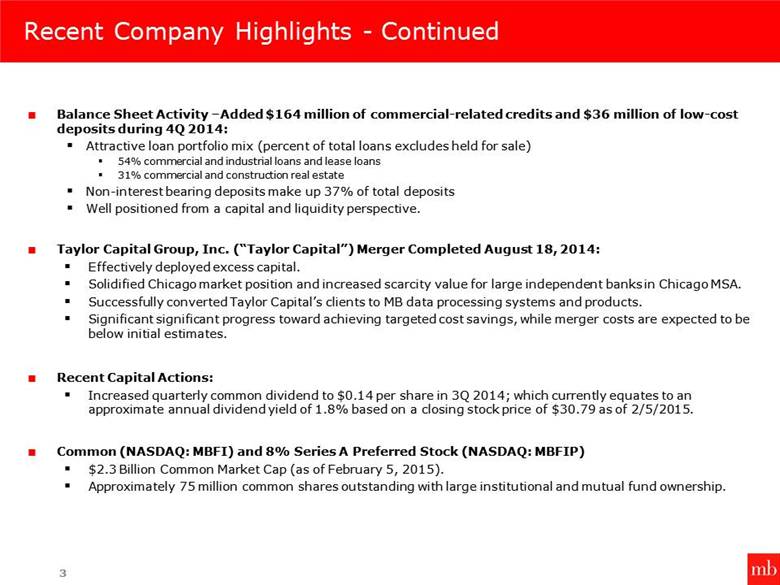
Balance Sheet Activity –Added $164 million of commercial-related credits and $36 million of low-cost deposits during 4Q 2014: Attractive loan portfolio mix (percent of total loans excludes held for sale) 54% commercial and industrial loans and lease loans 31% commercial and construction real estate Non-interest bearing deposits make up 37% of total deposits Well positioned from a capital and liquidity perspective. Taylor Capital Group, Inc. (“Taylor Capital”) Merger Completed August 18, 2014: Effectively deployed excess capital. Solidified Chicago market position and increased scarcity value for large independent banks in Chicago MSA. Successfully converted Taylor Capital’s clients to MB data processing systems and products. Significant significant progress toward achieving targeted cost savings, while merger costs are expected to be below initial estimates. Recent Capital Actions: Increased quarterly common dividend to $0.14 per share in 3Q 2014; which currently equates to an approximate annual dividend yield of 1.8% based on a closing stock price of $30.79 as of 2/5/2015. Common (NASDAQ: MBFI) and 8% Series A Preferred Stock (NASDAQ: MBFIP) $2.3 Billion Common Market Cap (as of February 5, 2015). Approximately 75 million common shares outstanding with large institutional and mutual fund ownership. Recent Company Highlights - Continued 3 |
|
|
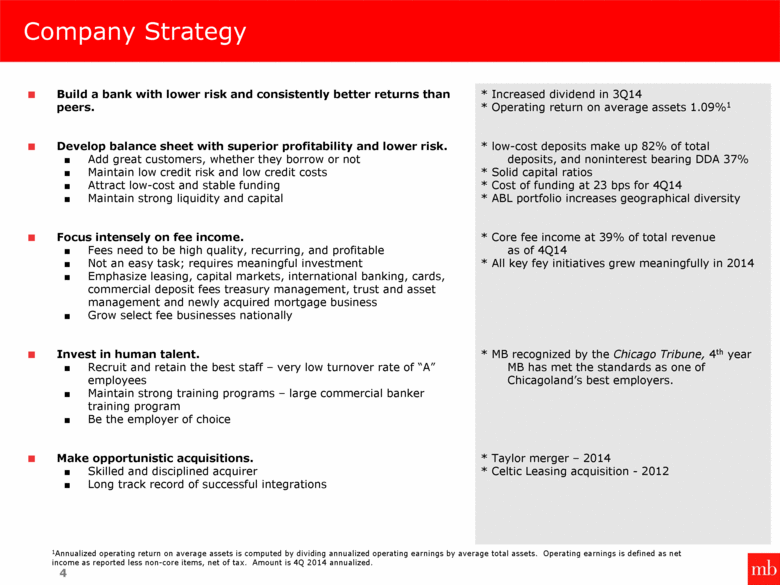
Company Strategy Build a bank with lower risk and consistently better returns than peers. Develop balance sheet with superior profitability and lower risk. Add great customers, whether they borrow or not Maintain low credit risk and low credit costs Attract low-cost and stable funding Maintain strong liquidity and capital Focus intensely on fee income. Fees need to be high quality, recurring, and profitable Not an easy task; requires meaningful investment Emphasize leasing, capital markets, international banking, cards, commercial deposit fees treasury management, trust and asset management and newly acquired mortgage business Grow select fee businesses nationally Invest in human talent. Recruit and retain the best staff – very low turnover rate of “A” employees Maintain strong training programs – large commercial banker training program Be the employer of choice Make opportunistic acquisitions. Skilled and disciplined acquirer Long track record of successful integrations 4 * Increased dividend in 3Q14 * Operating return on average assets 1.09%1 * low-cost deposits make up 82% of total deposits, and noninterest bearing DDA 37% * Solid capital ratios * Cost of funding at 23 bps for 4Q14 * ABL portfolio increases geographical diversity * Core fee income at 39% of total revenue as of 4Q14 * All key fey initiatives grew meaningfully in 2014 * MB recognized by the Chicago Tribune, 4th year MB has met the standards as one of Chicagoland’s best employers. * Taylor merger – 2014 * Celtic Leasing acquisition - 2012 1Annualized operating return on average assets is computed by dividing annualized operating earnings by average total assets. Operating earnings is defined as net income as reported less non-core items, net of tax. Amount is 4Q 2014 annualized. |
|
|
Banking Segment – Lines of Business 5 Retail Banking Provides a significant portion of funding for the banking segment; 49% of deposits and 11% of loans High percentage of core funding Low reliance on CDs Focuses on business banking customers and individuals that live or work near our branches Key fee initiatives include card services and treasury management services for business banking customers Wealth Management Provides customized private banking, trust, investment management, brokerage, and retirement plan services through a team of experienced advisors Specializes in serving business owners, high-net worth families, foundations, and endowments Focused on asset management, low-cost deposits, and private banking services Manages more than $3.5 billion of client assets through trust department and asset management subsidiary (Cedar Hill Associates, LLC) Commercial Banking Lending and depository services to middle-market companies with revenues ranging from $10 to $500 million “Relationship banking” culture; calling officers have 20+ years average experience Commercial and industrial and commercial real estate loan portfolio – terms generally range from 1 to 5 years; 90% with total relationship carrying amount of $20 million or less; approximately 74% have a floating rate of interest (64% indexed to LIBOR and 36% indexed to Prime) Note: Business line financial data as of December 31, 2014 Lease Banking Lease banking – provides banking services to lessors located throughout the U.S.; lease and working capital loans and lease equity investments Lease loans totaled $1.69 billion at 12/31/14 Lease loans are underwritten primarily on the creditworthiness of the lessee Lessees include mostly investment grade “Fortune 1000” companies located throughout the U.S. and large middle-market companies Asset Based Lending Targets national middle-market companies, including manufacturers, distributors, and select service companies with sales from $25 million to $500 million Deal flow via marketing efforts and relationships with private equity firms, mezzanine and second lien capital providers Asset based and hybrid ABL cash flow loans from $5 to $50 million Over $800 million of loans currently outstanding Treasury Management Focused on providing high quality and recurring services to commercial and business banking customers Expanding nationally where we have expertise Broad suite of services includes account management, payments systems access, information management, and fraud and risk mitigation |
|
|
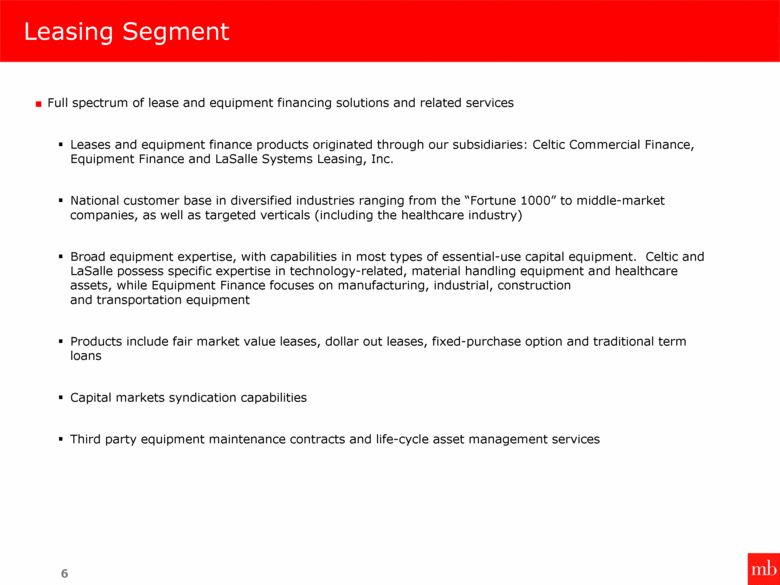
Leasing Segment Full spectrum of lease and equipment financing solutions and related services Leases and equipment finance products originated through our subsidiaries: Celtic Commercial Finance, Equipment Finance and LaSalle Systems Leasing, Inc. National customer base in diversified industries ranging from the “Fortune 1000” to middle-market companies, as well as targeted verticals (including the healthcare industry) Broad equipment expertise, with capabilities in most types of essential-use capital equipment. Celtic and LaSalle possess specific expertise in technology-related, material handling equipment and healthcare assets, while Equipment Finance focuses on manufacturing, industrial, construction and transportation equipment Products include fair market value leases, dollar out leases, fixed-purchase option and traditional term loans Capital markets syndication capabilities Third party equipment maintenance contracts and life-cycle asset management services 6 |
|
|
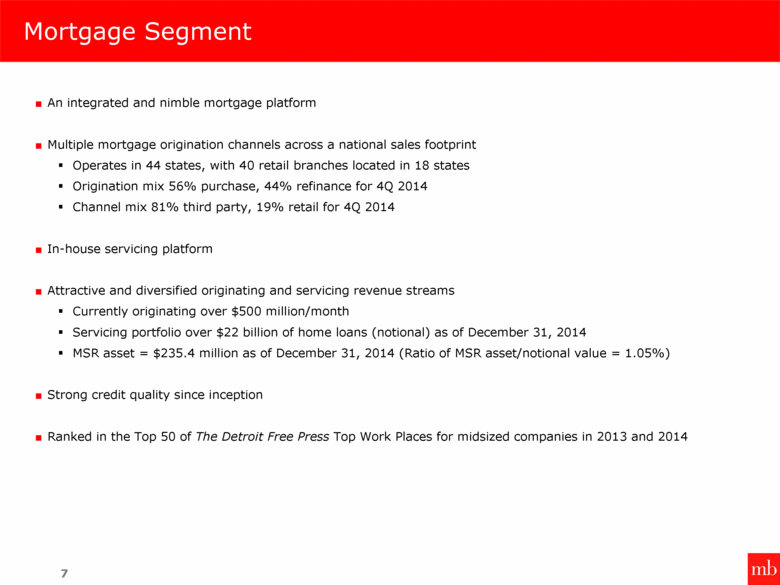
Mortgage Segment An integrated and nimble mortgage platform Multiple mortgage origination channels across a national sales footprint Operates in 44 states, with 40 retail branches located in 18 states Origination mix 56% purchase, 44% refinance for 4Q 2014 Channel mix 81% third party, 19% retail for 4Q 2014 In-house servicing platform Attractive and diversified originating and servicing revenue streams Currently originating over $500 million/month Servicing portfolio over $22 billion of home loans (notional) as of December 31, 2014 MSR asset = $235.4 million as of December 31, 2014 (Ratio of MSR asset/notional value = 1.05%) Strong credit quality since inception Ranked in the Top 50 of The Detroit Free Press Top Work Places for midsized companies in 2013 and 2014 7 |
|
|
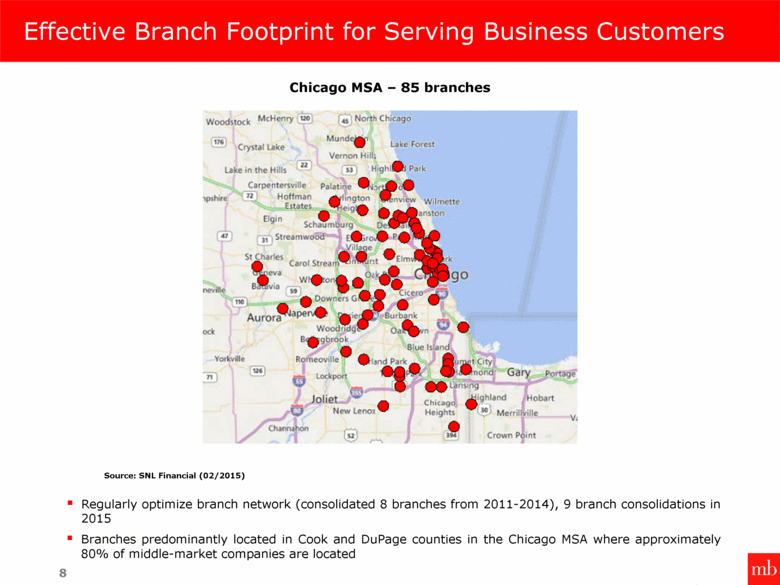
Effective Branch Footprint for Serving Business Customers 8 Chicago MSA – 85 branches Regularly optimize branch network (consolidated 8 branches from 2011-2014), 9 branch consolidations in 2015 Branches predominantly located in Cook and DuPage counties in the Chicago MSA where approximately 80% of middle-market companies are located Source: SNL Financial (02/2015) |
|
|
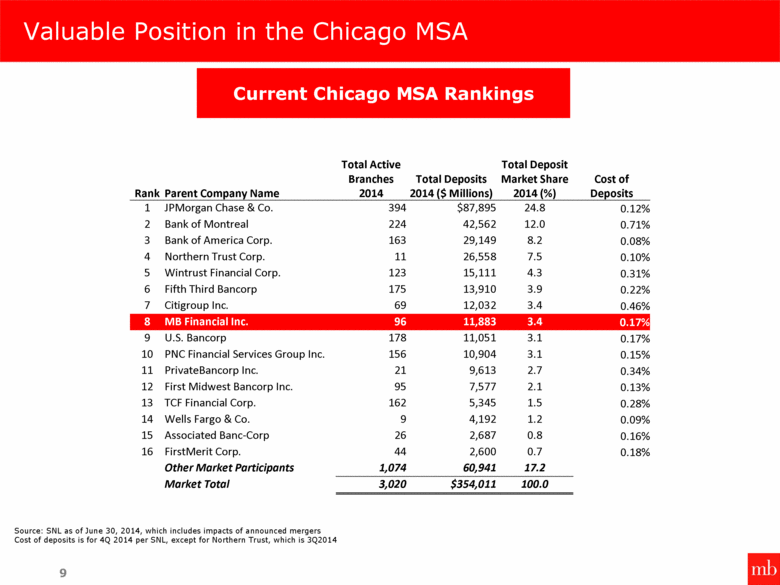
Valuable Position in the Chicago MSA Current Chicago MSA Rankings Source: SNL as of June 30, 2014, which includes impacts of announced mergers Cost of deposits is for 4Q 2014 per SNL, except for Northern Trust, which is 3Q2014 9 Rank Parent Company Name Total Active Branches 2014 Total Deposits 2014 ($ Millions) Total Deposit Market Share 2014 (%) Cost of Deposits 1 JPMorgan Chase & Co. 394 $87,895 24.8 0.12% 2 Bank of Montreal 224 42,562 12.0 0.71% 3 Bank of America Corp. 163 29,149 8.2 0.08% 4 Northern Trust Corp. 11 26,558 7.5 0.10% 5 Wintrust Financial Corp. 123 15,111 4.3 0.31% 6 Fifth Third Bancorp 175 13,910 3.9 0.22% 7 Citigroup Inc. 69 12,032 3.4 0.46% 8 MB Financial Inc. 96 11,883 3.4 0.17% 9 U.S. Bancorp 178 11,051 3.1 0.17% 10 PNC Financial Services Group Inc. 156 10,904 3.1 0.15% 11 PrivateBancorp Inc. 21 9,613 2.7 0.34% 12 First Midwest Bancorp Inc. 95 7,577 2.1 0.13% 13 TCF Financial Corp. 162 5,345 1.5 0.28% 14 Wells Fargo & Co. 9 4,192 1.2 0.09% 15 Associated Banc-Corp 26 2,687 0.8 0.16% 16 FirstMerit Corp. 44 2,600 0.7 0.18% Other Market Participants 1,074 60,941 17.2 Market Total 3,020 $354,011 100.0 |
|
|
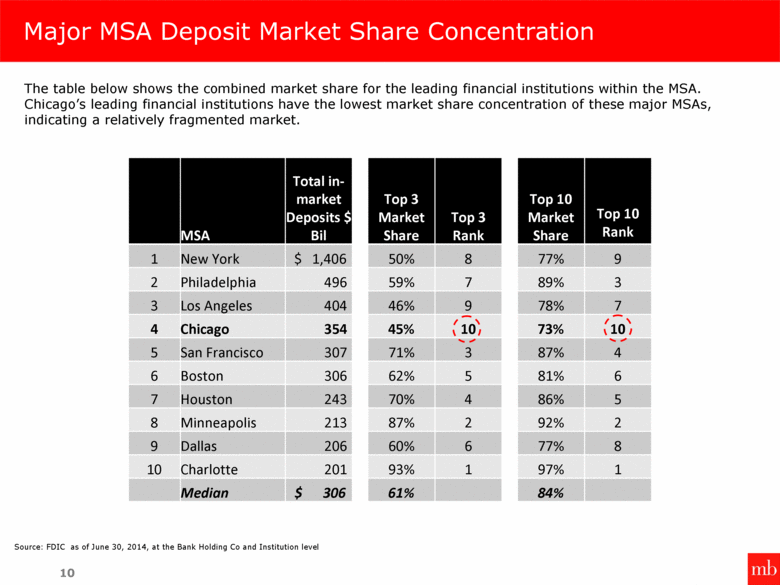
Total in-market Deposits $ Bil Top 3 Market Share Top 10 Market Share MSA Top 3 Rank Top 10 Rank 1 New York $ 1,406 50% 8 77% 9 2 Philadelphia 496 59% 7 89% 3 3 Los Angeles 404 46% 9 78% 7 4 Chicago 354 45% 10 73% 10 5 San Francisco 307 71% 3 87% 4 6 Boston 306 62% 5 81% 6 7 Houston 243 70% 4 86% 5 8 Minneapolis 213 87% 2 92% 2 9 Dallas 206 60% 6 77% 8 10 Charlotte 201 93% 1 97% 1 Median $ 306 61% 84% Major MSA Deposit Market Share Concentration Source: FDIC as of June 30, 2014, at the Bank Holding Co and Institution level 10 The table below shows the combined market share for the leading financial institutions within the MSA. Chicago’s leading financial institutions have the lowest market share concentration of these major MSAs, indicating a relatively fragmented market. |
|
|
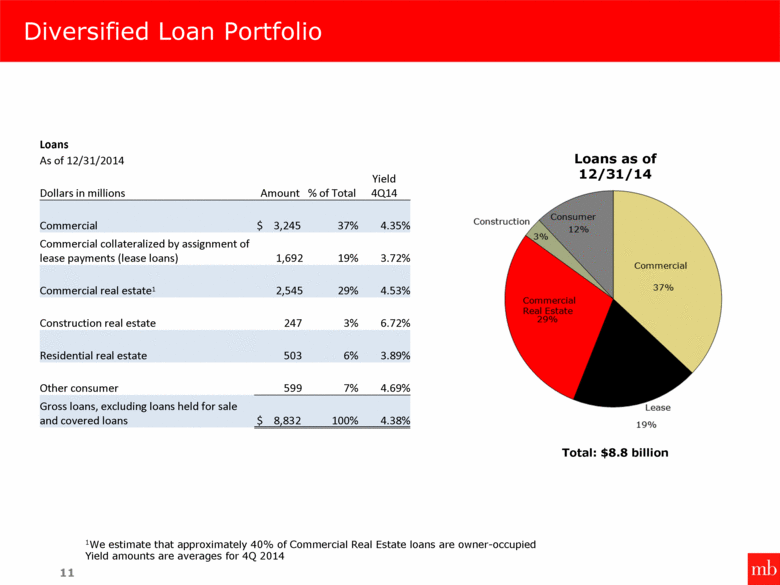
Diversified Loan Portfolio 11 1We estimate that approximately 40% of Commercial Real Estate loans are owner-occupied Yield amounts are averages for 4Q 2014 Loans as of 12/31/14 Total: $8.8 billion Loans As of 12/31/2014 Dollars in millions Amount % of Total Yield 4Q14 Commercial $ 3,245 37% 4.35% Commercial collateralized by assignment of lease payments (lease loans) 1,692 19% 3.72% Commercial real estate1 2,545 29% 4.53% Construction real estate 247 3% 6.72% Residential real estate 503 6% 3.89% Other consumer 599 7% 4.69% Gross loans, excluding loans held for sale and covered loans $ 8,832 100% 4.38% |
|
|
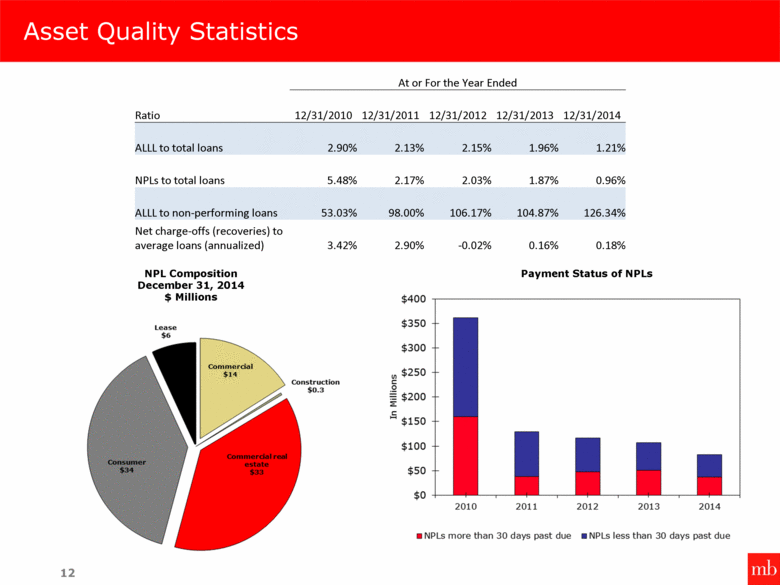
NPL Composition December 31, 2014 $ Millions Asset Quality Statistics 12 Payment Status of NPLs At or For the Year Ended Ratio 12/31/2010 12/31/2011 12/31/2012 12/31/2013 12/31/2014 ALLL to total loans 2.90% 2.13% 2.15% 1.96% 1.21% NPLs to total loans 5.48% 2.17% 2.03% 1.87% 0.96% ALLL to non-performing loans 53.03% 98.00% 106.17% 104.87% 126.34% Net charge-offs (recoveries) to average loans (annualized) 3.42% 2.90% -0.02% 0.16% 0.18% |
|
|
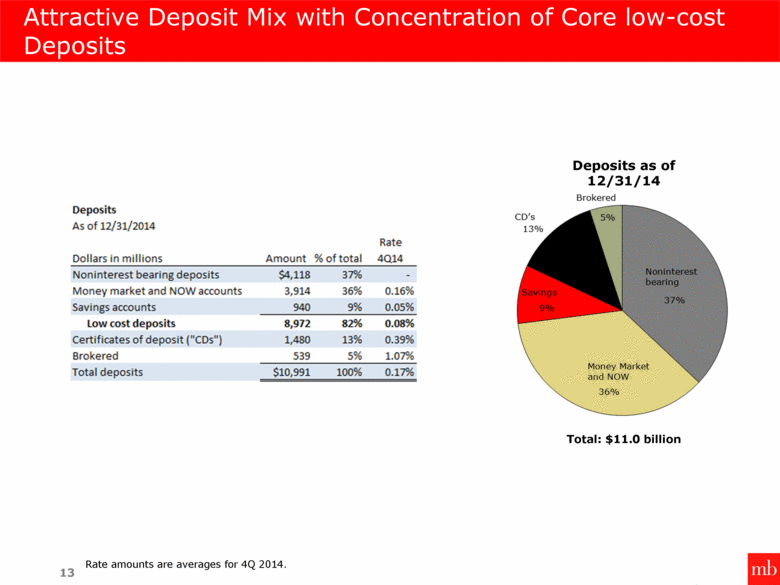
Attractive Deposit Mix with Concentration of Core low-cost Deposits 13 Deposits as of 12/31/14 Total: $11.0 billion Rate amounts are averages for 4Q 2014. |
|
|
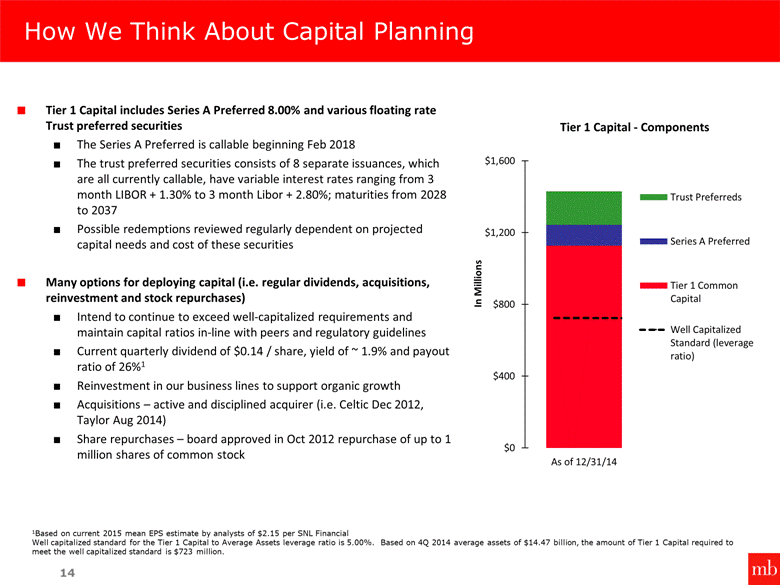
How We Think About Capital Planning 14 1Based on current 2015 mean EPS estimate by analysts of $2.15 per SNL Financial Well capitalized standard for the Tier 1 Capital to Average Assets leverage ratio is 5.00%. Based on 4Q 2014 average assets of $14.47 billion, the amount of Tier 1 Capital required to meet the well capitalized standard is $723 million. Tier 1 Capital includes Series A Preferred 8.00% and various floating rate Trust preferred securities The Series A Preferred is callable beginning Feb 2018 The trust preferred securities consists of 8 separate issuances, which are all currently callable, have variable interest rates ranging from 3 month LIBOR + 1.30% to 3 month Libor + 2.80%; maturities from 2028 to 2037 Possible redemptions reviewed regularly dependent on projected capital needs and cost of these securities Many options for deploying capital (i.e. regular dividends, acquisitions, reinvestment and stock repurchases) Intend to continue to exceed well-capitalized requirements and maintain capital ratios in-line with peers and regulatory guidelines Current quarterly dividend of $0.14 / share, yield of ~ 1.9% and payout ratio of 26%1 Reinvestment in our business lines to support organic growth Acquisitions – active and disciplined acquirer (i.e. Celtic Dec 2012, Taylor Aug 2014) Share repurchases – board approved in Oct 2012 repurchase of up to 1 million shares of common stock |
|
|
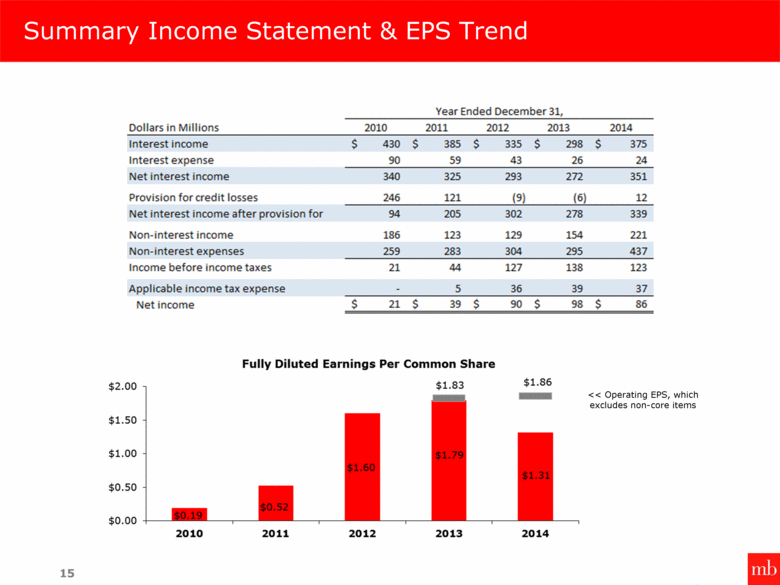
Summary Income Statement & EPS Trend 15 << Operating EPS, which excludes non-core items Year Ended December 31, Dollars in Millions 2010 2011 2012 2013 2014 Interest income $430 $385 $335 $298 $375 Interest expense 90 59 43 26 24 Net interest income 340 325 293 272 351 Provision for credit losses 246 121 (9) (6) (12) Net interest income after provision for 94 205 302 278 339 Non-interest income 186 123 129 154 221 Non-interest expenses 259 283 304 295 437 Income before income taxes 21 44 127 138 123 Applicable income tax expense - 5 36 39 37 Net income $21 $39 $90 $98 $86 |
|
|
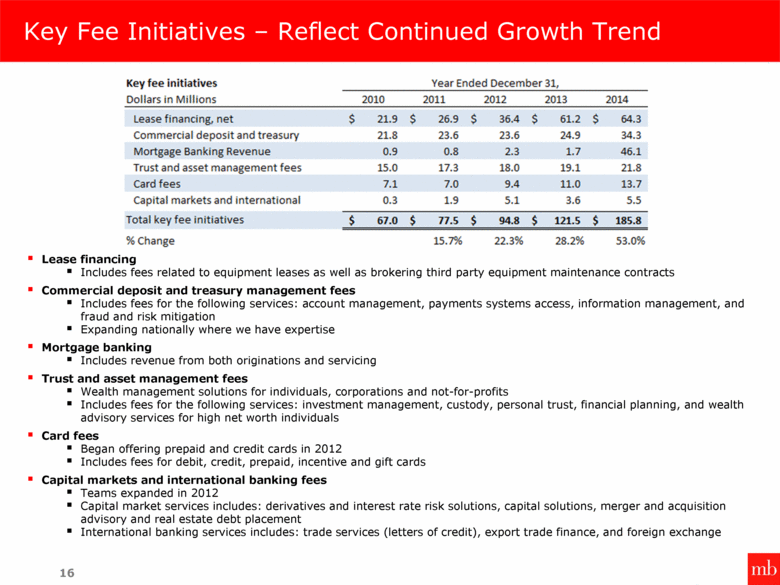
Key Fee Initiatives – Reflect Continued Growth Trend 16 Lease financing Includes fees related to equipment leases as well as brokering third party equipment maintenance contracts Commercial deposit and treasury management fees Includes fees for the following services: account management, payments systems access, information management, and fraud and risk mitigation Expanding nationally where we have expertise Mortgage banking Includes revenue from both originations and servicing Trust and asset management fees Wealth management solutions for individuals, corporations and not-for-profits Includes fees for the following services: investment management, custody, personal trust, financial planning, and wealth advisory services for high net worth individuals Card fees Began offering prepaid and credit cards in 2012 Includes fees for debit, credit, prepaid, incentive and gift cards Capital markets and international banking fees Teams expanded in 2012 Capital market services includes: derivatives and interest rate risk solutions, capital solutions, merger and acquisition advisory and real estate debt placement International banking services includes: trade services (letters of credit), export trade finance, and foreign exchange Key fee initiatives Year Ended December 31, Dollars in Million 2010 2011 2012 2013 2014 Lease financing, net $21.9 $26.9 $36.4 $61.2 $64.3 Commercial deposits and treasury 21.8 23.6 23.6 24.9 34.3 Mortgage Banking Revenue 0.9 0.8 2.3 1.7 46.1 Trust and asset management fees 15.0 17.3 18.0 19.1 21.8 Cards fees 7.1 7.0 9.4 11.0 13.7 Capital markets and international 0.3 1.9 5.1 3.6 5.5 Total fee initiatives $67.0 $77.5 $94.8 $121.5 $185.8 % Change 15.7% 22.3% 28.2% 53.0% |
|
|
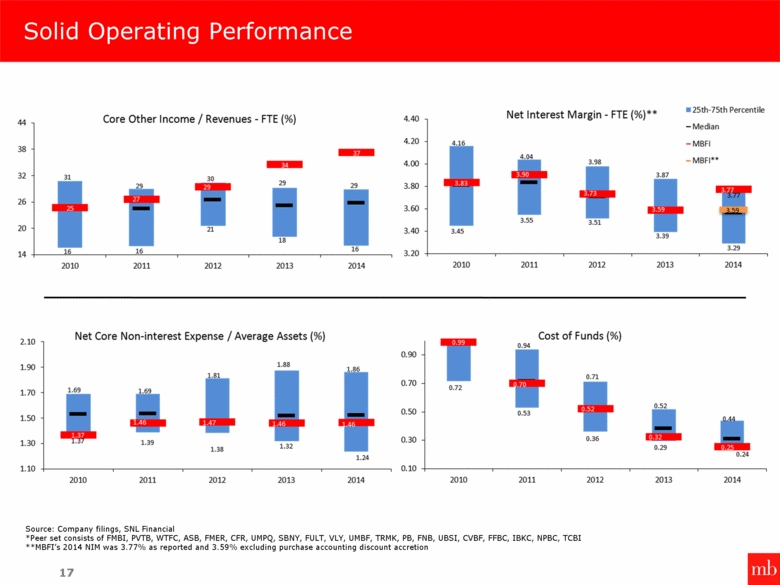
Solid Operating Performance 17 Source: Company filings, SNL Financial *Peer set consists of FMBI, PVTB, WTFC, ASB, FMER, CFR, UMPQ, SBNY, FULT, VLY, UMBF, TRMK, PB, FNB, UBSI, CVBF, FFBC, IBKC, NPBC, TCBI **MBFI’s 2014 NIM was 3.77% as reported and 3.59% excluding purchase accounting discount accretion |
|
|
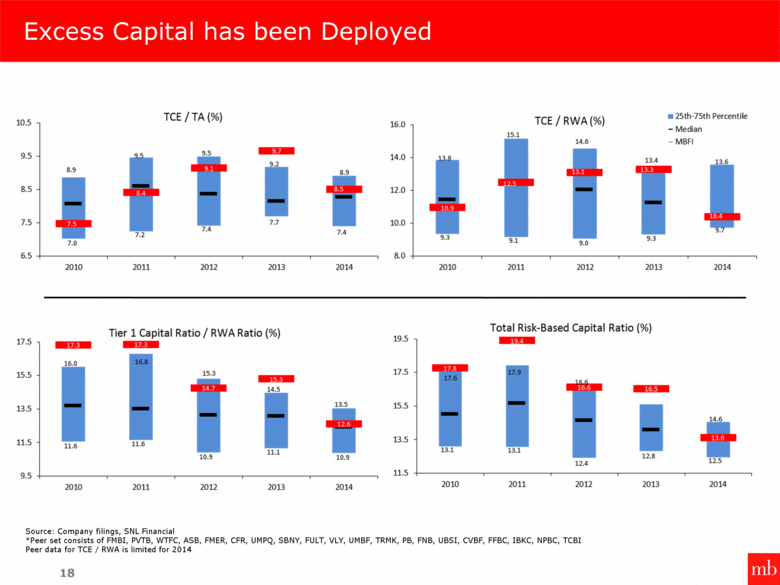
Excess Capital has been Deployed 18 Source: Company filings, SNL Financial *Peer set consists of FMBI, PVTB, WTFC, ASB, FMER, CFR, UMPQ, SBNY, FULT, VLY, UMBF, TRMK, PB, FNB, UBSI, CVBF, FFBC, IBKC, NPBC, TCBI Peer data for TCE / RWA is limited for 2014 |
|
|
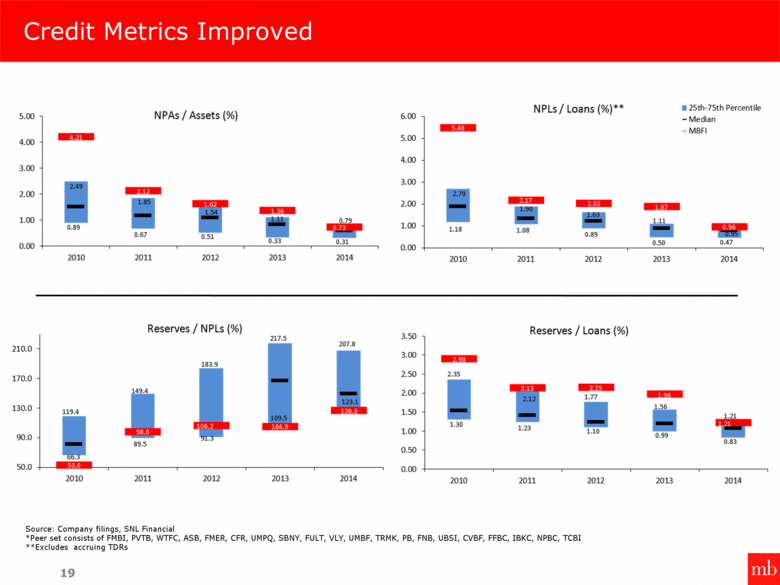
19 Reserves/Loans (%) Credit Metrics Improved Source: Company filings, SNL Financial *Peer set consists of FMBI, PVTB, WTFC, ASB, FMER, CFR, UMPQ, SBNY, FULT, VLY, UMBF, TRMK, PB, FNB, UBSI, CVBF, FFBC, IBKC, NPBC, TCBI **Excludes accruing TDRs |
|
|
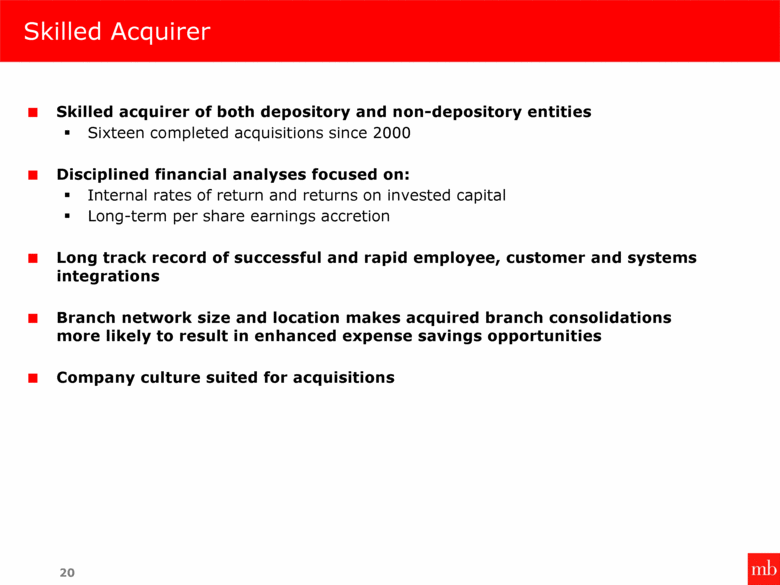
20 Skilled Acquirer Skilled acquirer of both depository and non-depository entities Sixteen completed acquisitions since 2000 Disciplined financial analyses focused on: Internal rates of return and returns on invested capital Long-term per share earnings accretion Long track record of successful and rapid employee, customer and systems integrations Branch network size and location makes acquired branch consolidations more likely to result in enhanced expense savings opportunities Company culture suited for acquisitions |
|
|
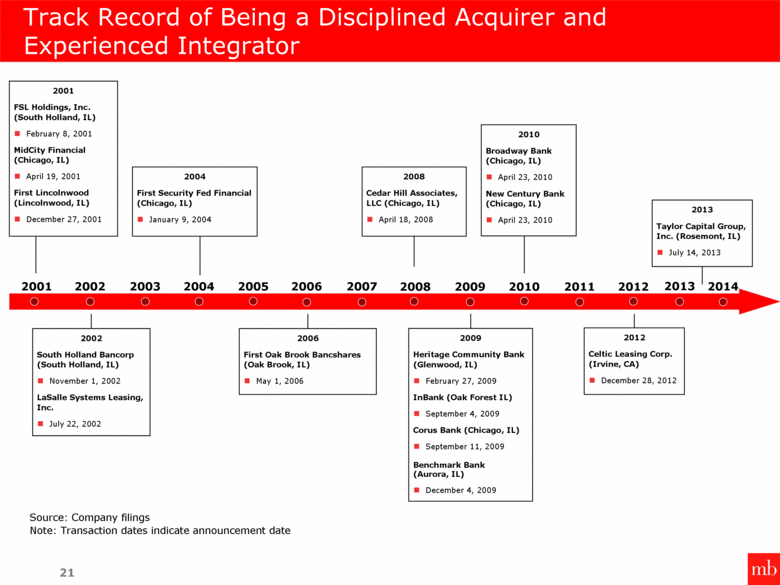
21 2001 2002 2004 2006 2008 2004 First Security Fed Financial (Chicago, IL) January 9, 2004 2002 South Holland Bancorp (South Holland, IL) November 1, 2002 LaSalle Systems Leasing, Inc. July 22, 2002 2006 First Oak Brook Bancshares (Oak Brook, IL) May 1, 2006 2009 Heritage Community Bank (Glenwood, IL) February 27, 2009 InBank (Oak Forest IL) September 4, 2009 Corus Bank (Chicago, IL) September 11, 2009 Benchmark Bank (Aurora, IL) December 4, 2009 Source: Company filings Note: Transaction dates indicate announcement date 2008 Cedar Hill Associates, LLC (Chicago, IL) April 18, 2008 Track Record of Being a Disciplined Acquirer and Experienced Integrator 2009 2010 2010 Broadway Bank (Chicago, IL) April 23, 2010 New Century Bank (Chicago, IL) April 23, 2010 2001 FSL Holdings, Inc. (South Holland, IL) February 8, 2001 MidCity Financial (Chicago, IL) April 19, 2001 First Lincolnwood (Lincolnwood, IL) December 27, 2001 2012 2012 Celtic Leasing Corp. (Irvine, CA) December 28, 2012 2003 2005 2007 2011 2013 2013 Taylor Capital Group, Inc. (Rosemont, IL) July 14, 2013 2014 |
|
|
Non-GAAP Disclosure Appendix 22 |
|
|
Non-GAAP Disclosure Reconciliations This presentation contains certain financial information determined by methods other than in accordance with accounting principles generally accepted in the United States of America (GAAP). These measures include net interest margin on a fully tax equivalent basis; ratio of core non-interest income to total revenue on a fully tax equivalent basis, operating earnings, operating earnings per common share and ratio of net non-interest expense to average assets, with net gains on investment securities, gain on extinguishment of debt, net gains and losses on sale of other assets, net gain on sale of loans held for sale, acquisition related gains and increase (decrease) in market value of assets held in trust for deferred compensation excluded from the calculations of the non-interest income and core non-interest income components of these ratios, contingent consideration expense and impairment charges, prepayment fees on interest-bearing liabilities, contribution to MB Financial Charitable Foundation, net gains and losses on other real estate owned, merger related expenses, loss on low to moderate income real estate investment and increase (decrease) in market value of assets held in trust for deferred compensation excluded from the non-interest expense components of the ratio of net non-interest expense to average assets with tax equivalent adjustments for tax-exempt interest income and increase in cash surrender value of life insurance; ratios of tangible common equity to risk weighted assets and tangible common equity to tangible assets. Our management uses these non-GAAP measures, together with the related GAAP measures, in its analysis of our performance and in making business decisions. Management also uses these measures for peer comparisons. The tax equivalent adjustments to net interest margin, non-interest income and total revenue recognizes the income tax savings when comparing taxable and tax-exempt assets and assumes a 35% tax rate. Management believes that others within the banking industry present these measures on a fully tax equivalent basis, and accordingly believes that providing these measures may be useful for peer comparison purposes. For the same reasons, management believes the tax equivalent adjustments for tax-exempt interest income and increase in cash surrender value of life insurance are useful. Management believes that operating earnings, core and non-core non-interest income and expense are useful in assessing our operating performance and in understanding the primary drivers of our non-interest income and expense when comparing periods. Management also believes that by excluding net gains and losses on investment securities, net gains and losses on sale of other assets, gain on extinguishment of debt, net gain on sale of loans held for sale, acquisition related gains and increase (decrease) in market value of assets held in trust for deferred compensation from the other (non-interest) income components and excluding impairment charges, prepayment fees on interest-bearing liabilities, contribution to MB Financial Charitable Foundation, net gains and losses on other real estate owned, merger related expenses, contingent consideration expense, loss on low to moderate income real estate investment and increase (decrease) in market value of assets held in trust for deferred compensation from the non-interest expense components of the ratio of net non-interest expense to average assets and, in the case of the income-related items, the ratio of core non-interest income to total revenue on a fully tax equivalent basis, this information better reflects our operating performance, as the excluded items do not pertain to our core business operations and their exclusion makes this information more meaningful when comparing our operating results from period to period. 23 |
|
|
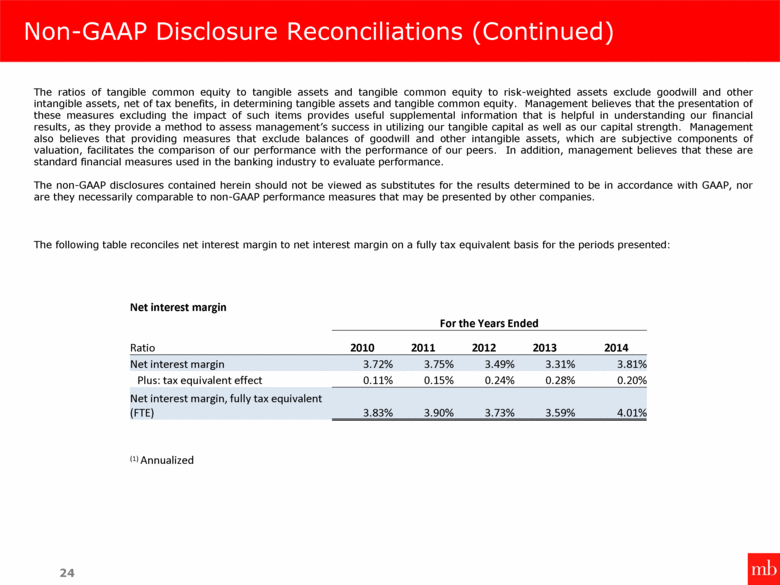
Non-GAAP Disclosure Reconciliations (Continued) The ratios of tangible common equity to tangible assets and tangible common equity to risk-weighted assets exclude goodwill and other intangible assets, net of tax benefits, in determining tangible assets and tangible common equity. Management believes that the presentation of these measures excluding the impact of such items provides useful supplemental information that is helpful in understanding our financial results, as they provide a method to assess management’s success in utilizing our tangible capital as well as our capital strength. Management also believes that providing measures that exclude balances of goodwill and other intangible assets, which are subjective components of valuation, facilitates the comparison of our performance with the performance of our peers. In addition, management believes that these are standard financial measures used in the banking industry to evaluate performance. The non-GAAP disclosures contained herein should not be viewed as substitutes for the results determined to be in accordance with GAAP, nor are they necessarily comparable to non-GAAP performance measures that may be presented by other companies. The following table reconciles net interest margin to net interest margin on a fully tax equivalent basis for the periods presented: 24 Net interest margin For the Years Ended Ratio 2010 2011 2012 2013 2014 Net interest margin 3.72% 3.75% 3.49% 3.31% 3.81% Plus: tax equivalent effect 0.11% 0.15% 0.24% 0.28% 0.20% Net interest margin, fully tax equivalent (FTE) 3.83% 3.90% 3.73% 3.59% 4.01% (1) Annualized |
|
|
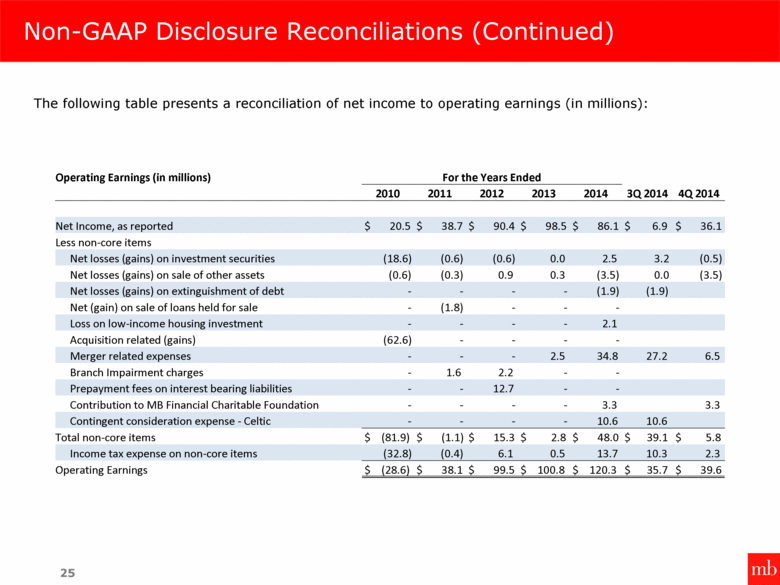
Non-GAAP Disclosure Reconciliations (Continued) The following table presents a reconciliation of net income to operating earnings (in millions): 25 Operating Earnings (in millions) For the Years Ended 3Q 2014 4Q 2014 2010 2011 2012 2013 2014 Net Income, as reported $ 20.5 $ 38.7 $ 90.4 $ 98.5 $ 86.1 $ 6.9 $ 36.1 Less non-core items Net losses (gains) on investment securities (18.6) (0.6) (0.6) 0.0 2.5 3.2 (0.5) Net losses (gains) on sale of other assets (0.6) (0.3) 0.9 0.3 (3.5) 0.0 (3.5) Net losses (gains) on extinguishment of debt - - - - (1.9) (1.9) Net (gain) on sale of loans held for sale - (1.8) - - - Loss on low-income housing investment - - - - 2.1 Acquisition related (gains) (62.6) - - - - Merger related expenses - - - 2.5 34.8 27.2 6.5 Branch Impairment charges - 1.6 2.2 - - Prepayment fees on interest bearing liabilities - - 12.7 - - Contribution to MB Financial Charitable Foundation - - - - 3.3 3.3 Contingent consideration expense - Celtic - - - - 10.6 10.6 Total non-core items $ (81.9) $ (1.1) $ 15.3 $ 2.8 $ 48.0 $ 39.1 $ 5.8 Income tax expense on non-core items (32.8) (0.4) 6.1 0.5 13.7 10.3 2.3 Operating Earnings $ (28.6) $ 38.1 $ 99.5 $ 100.8 $ 120.3 $ 35.7 $ 39.6 |
|
|
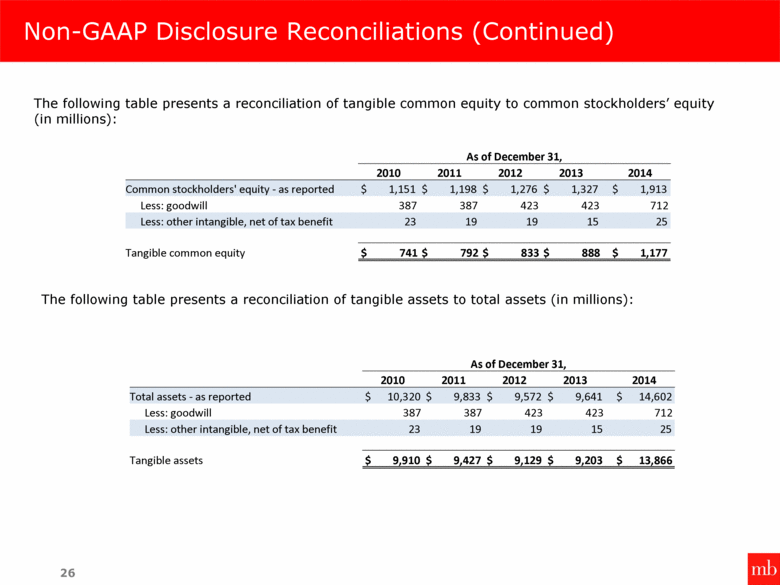
Non-GAAP Disclosure Reconciliations (Continued) The following table presents a reconciliation of tangible common equity to common stockholders’ equity (in millions): 26 The following table presents a reconciliation of tangible assets to total assets (in millions): As of December 31, 2010 2011 2012 2013 2014 Common stockholders' equity - as reported $ 1,151 $ 1,198 $ 1,276 $ 1,327 $ 1,913 Less: goodwill 387 387 423 423 712 Less: other intangible, net of tax benefit 23 19 19 15 25 Tangible common equity $ 741 $ 792 $ 833 $ 888 $ 1,177 As of December 31, 2010 2011 2012 2013 2014 Total assets - as reported $ 10,320 $ 9,833 $ 9,572 $ 9,641 $ 14,602 Less: goodwill 387 387 423 423 712 Less: other intangible, net of tax benefit 23 19 19 15 25 Tangible assets $ 9,910 $ 9,427 $ 9,129 $ 9,203 $ 13,866 |
|
|
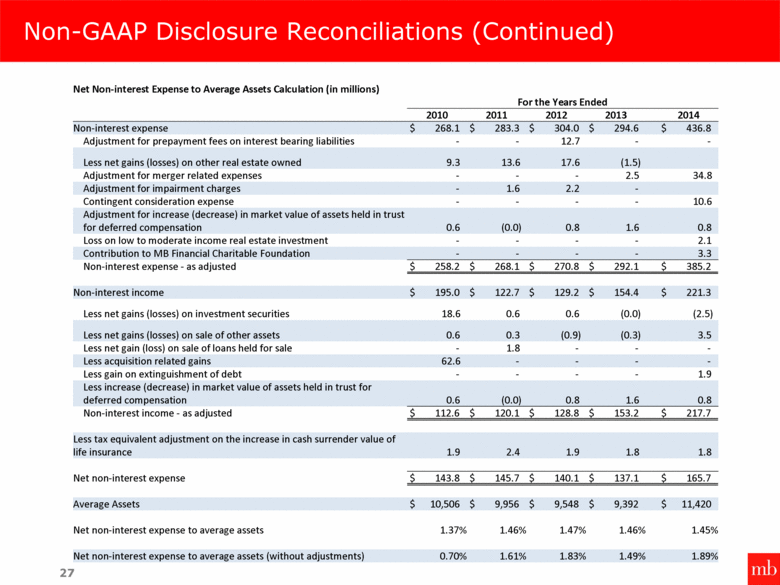
Non-GAAP Disclosure Reconciliations (Continued) 27 Net Non-interest Expense to Average Assets Calculation (in millions) For the Years Ended 2010 2011 2012 2013 2014 Non-interest expense $ 268.1 $ 283.3 $ 304.0 $ 294.6 $ 436.8 Adjustment for prepayment fees on interest bearing liabilities - - 12.7 - - Less net gains (losses) on other real estate owned 9.3 13.6 17.6 (1.5) Adjustment for merger related expenses - - - 2.5 34.8 Adjustment for impairment charges - 1.6 2.2 - Contingent consideration expense - - - - 10.6 Adjustment for increase (decrease) in market value of assets held in trust for deferred compensation 0.6 (0.0) 0.8 1.6 0.8 Loss on low to moderate income real estate investment - - - - 2.1 Contribution to MB Financial Charitable Foundation - - - - 3.3 Non-interest expense - as adjusted $ 258.2 $ 268.1 $ 270.8 $ 292.1 $ 385.2 Non-interest income $ 195.0 $ 122.7 $ 129.2 $ 154.4 $ 221.3 Less net gains (losses) on investment securities 18.6 0.6 0.6 (0.0) (2.5) Less net gains (losses) on sale of other assets 0.6 0.3 (0.9) (0.3) 3.5 Less net gain (loss) on sale of loans held for sale - 1.8 - - - Less acquisition related gains 62.6 - - - - Less gain on extinguishment of debt - - - - 1.9 Less increase (decrease) in market value of assets held in trust for deferred compensation 0.6 (0.0) 0.8 1.6 0.8 Non-interest income - as adjusted $ 112.6 $ 120.1 $ 128.8 $ 153.2 $ 217.7 Less tax equivalent adjustment on the increase in cash surrender value of life insurance 1.9 2.4 1.9 1.8 1.8 Net non-interest expense $ 143.8 $ 145.7 $ 140.1 $ 137.1 $ 165.7 Average Assets $ 10,506 $ 9,956 $ 9,548 $ 9,392 $ 11,420 Net non-interest expense to average assets 1.37% 1.46% 1.47% 1.46% 1.45% Net non-interest expense to average assets (without adjustments) 0.70% 1.61% 1.83% 1.49% 1.89% |
|
|
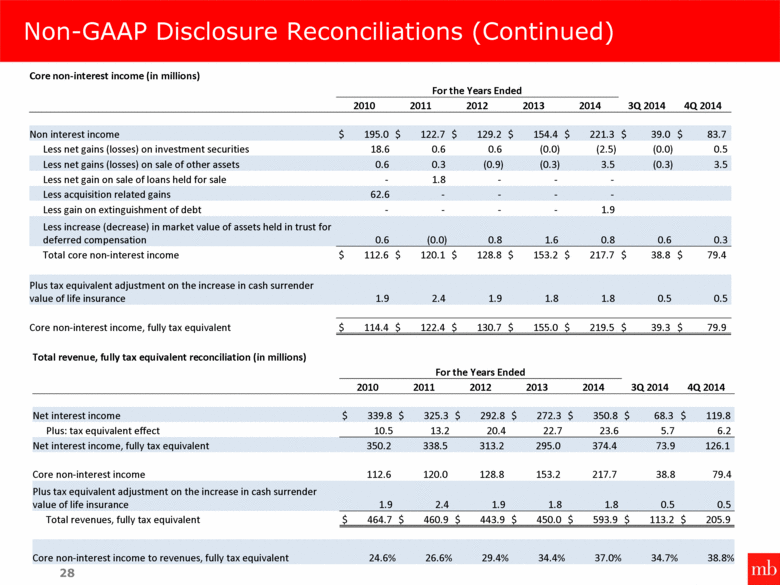
Non-GAAP Disclosure Reconciliations (Continued) 28 Core non-interest income (in millions) For the Years Ended 2010 2011 2012 2013 2014 3Q 2014 4Q 2014 Non interest income $ 195.0 $ 122.7 $ 129.2 $ 154.4 $ 221.3 $ 39.0 $ 83.7 Less net gains (losses) on investment securities 18.6 0.6 0.6 (0.0) (2.5) (0.0) 0.5 Less net gains (losses) on sale of other assets 0.6 0.3 (0.9) (0.3) 3.5 (0.3) 3.5 Less net gain on sale of loans held for sale - 1.8 - - - Less acquisition related gains 62.6 - - - - Less gain on extinguishment of debt - - - - 1.9 Less increase (decrease) in market value of assets held in trust for deferred compensation 0.6 (0.0) 0.8 1.6 0.8 0.6 0.3 Total core non-interest income $ 112.6 $ 120.1 $ 128.8 $ 153.2 $ 217.7 $ 38.8 $ 79.4 Plus tax equivalent adjustment on the increase in cash surrender value of life insurance 1.9 2.4 1.9 1.8 1.8 0.5 0.5 Core non-interest income, fully tax equivalent $ 114.4 $ 122.4 $ 130.7 $ 155.0 $ 219.5 $ 39.3 $ 79.9 Total revenue, fully tax equivalent reconciliation (in millions) For the Years Ended 2010 2011 2012 2013 2014 3Q 2014 4Q 2014 Net interest income $ 339.8 $ 325.3 $ 292.8 $ 272.3 $ 350.8 $ 68.3 $ 119.8 Plus: tax equivalent effect 10.5 13.2 20.4 22.7 23.6 5.7 6.2 Net interest income, fully tax equivalent 350.2 338.5 313.2 295.0 374.4 73.9 126.1 Core non-interest income 112.6 120.0 128.8 153.2 217.7 38.8 79.4 Plus tax equivalent adjustment on the increase in cash surrender value of life insurance 1.9 2.4 1.9 1.8 1.8 0.5 0.5 Total revenues, fully tax equivalent $ 464.7 $ 460.9 $ 443.9 $ 450.0 $ 593.9 $ 113.2 $ 205.9 Core non-interest income to revenues, fully tax equivalent 24.6% 26.6% 29.4% 34.4% 37.0% 34.7% 38.8% |
|
|
February 2015 NASDAQ: MBFI Investor Presentation |
SIGNATURES
Pursuant to the requirements of the Securities Exchange Act of 1934, the registrant has duly caused this report to be signed on its behalf by the undersigned hereunto duly authorized.
|
|
| |
|
|
MB FINANCIAL, INC. | |
|
|
|
|
|
Date: February 11, 2015 |
By: |
/s/Jill E. York |
|
|
|
Jill E. York |
|
|
|
Vice President and Chief Financial Officer |

