Attached files
| file | filename |
|---|---|
| 8-K - 8-K - FIRST BANCORP /PR/ | d869674d8k.htm |
 First
BanCorp Investor Presentation
February 2015
Exhibit 99.1 |
 Disclaimer
1
This presentation may contain “forward-looking statements” concerning the
Corporation’s future economic performance. The words or phrases “expect,” “anticipate,” “look forward,”
“should,” “believes” and similar expressions are meant to identify
“forward-looking statements” within the meaning of Section 27A of the Securities Act of 1933, as amended, and Section
21E of the Securities Exchange Act of 1934, as amended, and are subject to the safe harbor
created by such sections. The Corporation wishes to caution readers not to place undue
reliance on any such “forward-looking statements,” which speak only as of the
date made, and to advise readers that various factors, including, but not limited to, the following could
cause actual results to differ materially from those expressed in, or implied by such
forward-looking statements: uncertainty about whether the Corporation and FirstBank will be able to
fully comply with the written agreement dated June 3, 2010 that the Corporation entered into
with the Federal Reserve Bank of New York (the “New York Fed”) and the consent order
dated June 2, 2010 that FirstBank entered into with the FDIC and the Office of the
Commissioner of Financial Institutions of the Commonwealth of Puerto Rico (the “FDIC Order”) that,
among other things, require FirstBank to maintain certain capital levels and reduce its
special mention, classified, delinquent, and non-performing assets; the risk of being subject to
possible additional regulatory actions; uncertainty as to the availability of certain funding
sources, such as brokered CDs; the Corporation’s reliance on brokered CDs and its ability to
obtain, on a periodic basis, approval from the FDIC to issue brokered CDs to fund operations
and provide liquidity in accordance with the terms of the FDIC Order; the risk of not being
able to fulfill the Corporation’s cash obligations or resume paying dividends to the
Corporation’s stockholders in the future due to the Corporation’s inability to receive approval from the
New York Fed or the Board of Governors of the Federal Reserve System (“Federal Reserve
Board”) to receive dividends from FirstBank or FirstBank’s failure to generate sufficient cash flow
to make a dividend payment to the Corporation; the strength or weakness of the real estate
markets and of the consumer and commercial credit sectors and their impact on the credit
quality of the Corporation’s loans and other assets, which has contributed and may
continue to contribute to, among other things, the high levels of non-performing assets, charge-offs,
and provisions and may subject the Corporation to further risk from loan defaults and
foreclosures; the ability of FirstBank to realize the benefit of the deferred tax asset; adverse changes
in general economic conditions in Puerto Rico, the U.S., and the U.S. Virgin Islands and
British Virgin Islands, including the interest rate environment, market liquidity, housing absorption
rates, real estate prices, and disruptions in the U.S. capital markets, which may reduce
interest margins, impact funding sources, and affect demand for all of the Corporation’s products
and services and reduce the Corporation’s revenues, earnings, and the value of the
Corporation’s assets; an adverse change in the Corporation’s ability to attract new clients and retain
existing ones; a decrease in demand for the Corporation’s products and services and lower
revenues and earnings because of the continued recession in Puerto Rico, the current fiscal
problems and budget deficit of the Puerto Rico government and recent credit downgrades of the
Puerto Rico government; a credit default by the Puerto Rico government or any of its
public corporations or other instrumentalities, and recent and/or future downgrades of the
long-term debt ratings of the Puerto Rico government, which could adversely affect economic
conditions in Puerto Rico; the risk that any portion of the unrealized losses in the
Corporation’s investment portfolio is determined to be other-than-temporary, including unrealized losses
on Puerto Rico government obligations; uncertainty about regulatory and legislative changes
for financial services companies in Puerto Rico, the U.S., and the U.S. Virgin Islands and British
Virgin Islands, which could affect the Corporation’s financial condition or performance
and could cause the Corporation’s actual results for future periods to differ materially from prior
results and anticipated or projected results; changes in the fiscal and monetary policies and
regulations of the federal government, including those determined by the Federal Reserve
Board, the New York Fed, the FDIC, government-sponsored housing agencies, and regulators
in Puerto Rico and the U.S. and British Virgin Islands; the risk of possible failure or
circumvention of controls and procedures and the risk that the Corporation’s risk
management policies may not be adequate; the risk that the FDIC may further increase the deposit
insurance premium and/or require special assessments to replenish its insurance fund, causing
an additional increase in the Corporation’s non-interest expenses; the impact on the
Corporation’s results of operations and financial condition of acquisitions and
dispositions; a need to recognize additional impairments on financial instruments, goodwill, or other
intangible assets relating to acquisitions; the risks that downgrades in the credit ratings of
the Corporation’s long-term senior debt will adversely affect the Corporation’s ability to access
necessary external funds; the impact of the Dodd-Frank Wall Street Reform and Consumer
Protection Act on the Corporation’s businesses, business practices, and cost of operations; the
risk of losses in the value of investments in unconsolidated entities that the Corporation
does not control; and general competitive factors and industry consolidation. The Corporation
does not undertake, and specifically disclaims any obligation, to update any
“forward-looking statements” to reflect occurrences or unanticipated events or circumstances after the date
of such statements except as required by the federal securities laws. |
 A
turn-around story underscored by steady improvement and organic market share gains in
the core franchise, operating within a challenging macro environment.
Strong, tenured leadership team with a commitment to increasing shareholder value, while
fulfilling our vision to be the most highly regarded financial institution in the markets we
serve.
Improving operating results, together with ongoing efforts to improve efficiencies and further
build-out our core franchise, are our priorities.
Improving our risk profile and maintaining a strong capital position remain central to our
operating philosophy.
Opportunities for additional branch consolidation and market share expansion.
Outlook enhanced by the increasing interest of foreign investment in Puerto Rico and
potential benefits for the underlying economy.
Share price continues to trail capital formation and profitability as TBV ended 4Q14 at
$6.02/share. Our DTA valuation allowance is $516 million.
2
The Value of First BanCorp |
 Eastern
Caribbean:
7% of Assets
Franchise Overview
Founded in 1948
Headquartered in San Juan, Puerto
Rico with operations in PR, Eastern
Caribbean (Virgin Islands) and Florida
–
~2,500 FTE employees
(1)
2nd largest financial holding company
in Puerto Rico with attractive business
mix and substantial loan market share
Florida presence with focus on
serving south Florida region
The largest depository institution in
the US Virgin Islands with
approximately 40% market share
164 ATM machines and largest ATM
network in the Eastern Caribbean
Region
(2)
A well diversified operation with over
650,000 retail & commercial
customers
Well diversified with significant competitive strengths
As of December 31, 2014.
1) FTE = Full Time Equivalent.
2) Eastern Caribbean Region or ECR includes United States and British Virgin Islands.
3) Data as of September 30, 2014. Core deposits excludes brokered CDs.
3
10 bank branches
1 Loan Production Office
SE Florida:
11% of Assets
28% of core
deposits
(3)
15% of core
deposits
(3)
12 bank branches
2 First Express branches
Total Assets -
$12.4B
Total Loans -
$9.3B
Total Deposits -
$9.5 |
 Franchise
Overview ($ in millions)
Well positioned Puerto Rico institution in a consolidating market
Source: PR Market Share Report prepared with data provided by the Commissioner of Financial
Institutions of Puerto Rico as of 9/30/14. 1) Puerto Rico only.
2) Calculated as institution bank branches within a mile of an FBP branch as a percentage of
total institution branches. 3) Alphabetical order.
4
Puerto
Rico
Total
Assets
(1)
Puerto
Rico
Total
Loans
(1)
Puerto
Rico
Deposits,
Net
of
Brokered
(1)
Strong and uniquely positioned franchise in
densely populated regions of core operating
footprint
Strong market share in loan portfolios
facilitates customer relationship expansion and
cross-sell to increase deposit share
Long-term opportunity for additional
consolidation
Branch overlap of greater than 40% with six
Puerto
Rico
institutions
(2)
58
44
100%
40
49
43
Portfolio
Balance
Market
Share
Portfolio
Balance
Market
Share
Portfolio
Balance
Market
Share
1
Banco Popular
$25,164
41.4%
1
Banco Popular
$18,743
40.8%
1
Banco Popular
$18,104
45.8%
2
FirstBank
9,692
16.0%
2
FirstBank
7,735
16.8%
2
Banco Santander
4,803
12.2%
3
Oriental Bank
7,165
11.8%
3
Oriental Bank
4,959
10.8%
3
Oriental Bank
4,408
11.2%
4
Scotiabank
5,925
9.8%
4
Banco Santander
4,603
10.0%
4
FirstBank
4,082
10.3%
5
Banco Santander
5,899
9.7%
5
Scotiabank
4,388
9.5%
5
Scotiabank
3,612
9.1%
6
Doral Bank
3,821
6.3%
6
Other
2,806
6.1%
6
Citibank
2,595
6.6%
7
Citibank
2,501
4.1%
7
Doral Bank
1,994
4.3%
7
Doral Bank
1,449
3.7%
8
Banco Cooperativo
522
0.9%
8
Citibank
583
1.3%
8
Banco Cooperativo
432
1.1%
9
BBU
66
0.1%
9
Banco Cooperativo
168
0.4%
9
BBU
35
0.1%
Total
$60,754
100%
Total
$45,982
100%
Total
$39,520
100%
Institutions
Institutions
Institutions
1-mile
branch
overlap
(3) |
 5
Consumer Banking
Mortgage Banking
Commercial Lending
•
Focus on small to middle market
commercial and corporate
borrowers across FBP’s footprint.
Complimented by full suite of
deposit and business products.
•
Balanced risk/return profile to
manage concentration
risk/earnings.
•
Growth opportunities centered in
south Florida region and
expanding lending teams.
•
Building stronger transaction
banking services to target
market share opportunities.
•
Emphasis on cross-sell and core
deposit gathering with recent
launch of new products and
services.
•
Average
origination
(1)
volume
over past 4 quarters of $462
million.
•
Attractive branch network across
densely populated regions in
Puerto Rico, south Florida and the
V.I.
•
Full suite of leading edge deposit
products. Increased emphasis on
transaction processing.
•
Well-diversified, high-yielding
consumer portfolio: auto finance -
#1 market share among banks;
personal loans; and credit card
portfolio.
•
Earnings growth focused on
ongoing market share gains and
product penetration via cross-
selling activities —notably tied to
mortgage, credit cards, personal
loans and auto finance.
•
Average
origination
(1)
volume over
past 4 quarters of $257million.
Diversified business model across all regions
Franchise Overview
1) Originations include purchases, refinancings, and draws from existing revolving and
non-revolving commitments. Strong Governance, Risk Management and Compliance
Culture •
Originate, sale & servicing
model.
•
Production channels centered on
expanding branch network vs.
correspondents/brokers.
•
Target majority conforming
originations .
•
Fannie, Freddie and FHA
Servicer.
•
Recently purchased prime
residential mortgage portfolio
of $192 million from in-market
competitor.
•
Average origination
(1)
volume
over the past 4 quarters of
$159 million. |
 Executing for
Earnings Growth Targeted strategies for growth
6
Puerto Rico Market Share
Puerto Rico
Opportunities for ongoing market share gains
–
Largest opportunity on deposit products, electronic
banking & transaction services
–
Growth in selected loan products for balanced
risk/return to manage risk concentration and diversify
income sources
–
FirstBank-branded credit card portfolio continues to
broaden and deepen relationships, while diversifying
revenue stream
SE Florida
Expansion prospects in Florida given long-term
demographic trends
–
Continue focus in core deposit growth, commercial
and transaction banking and conforming residential
mortgages
–
Lending teams generating growth in loan portfolio
Virgin Islands
Solidify leadership position by further increasing
customer share of wallet
16.8%
16.0%
11.8%
10.3%
21.8%
19.9%
18.9%
17.1%
16.3%
8.4%
18.5%
11.1%
7.3%
4.4%
Total Loans
Total Assets
Branches
Deposits, net of brokered
Small Loans
Commercial Loans
Auto Loans & Leasing
Credit Cards
Residential Mortgage
Personal Loans
POS Terminals
ATM Terminals
Debit Cards
ACH Transactions
2
3Q 2014
4
2
2
2
2
4
2
2
4
2
3
3
6 |
 7
Effectively executing strategic plan as we continue to strengthen our core franchise across our
three geographies and further de-risk the balance sheet
Profitability: Achieved our most profitable year since return to
profitability… FY 2014 net income
$87.8 million, or $0.42 share, compared to adjusted 2013 net income of $45.4 million;
Posted a strong pre-tax pre-provision income for 2014 of $206 million compared to $184
million in 2013; Prudently managed expense base reducing non-interest expense by
$24.4 million (excluding impact of 2013 bulk sales); and
Re-aligned branch network for optimal efficiency and made significant investments in a new
technology platform, new products and talent management.
Core Deposits: Continued building product capabilities and deepening
relationships…
According
to
recent
study
(1)
bank
customers
ranked
FirstBank
highest
for
“Likelihood
to
Recommend”
among
PR
banks;
FirstBank also ranked highest among PR banks
(2)
for “Offering attractive products and services”
Increased deposits net of brokered and government by $164 million, or 3%, during 2014;
and Reduced reliance on brokered CDs by $255 million compared to FY 2013.
Loan Originations: Key strength of the franchise… $3.5 billion of originations for 2014 at healthy
levels as we selectively pursue loans in a challenging market and leverage on our
improved franchise in Florida;
Purchased two residential portfolios from a competitor during 2014; and
Continue to build Commercial, Mortgage and Consumer books across our markets.
Asset Quality: Remains our top priority… Stabilized NPA migration, NPAs relatively flat, down
$8 million compared to FYE 2013; NPAs are in a much better disposition state -
commercial NPLs net carrying amount of 58%; and
Continue to focus on options to accelerate disposition of NPAs.
Capital Position:
Continues to grow stronger…
Strong capital position allowing us to continue to address our legacy asset issues and growth
opportunities; U.S. Treasury sold 4.4 million shares during 2014 reducing
ownership stake to 7.2% and continues selling efforts; and TBV/Share grew to $6.02 from
$5.30 in 2013. Fiscal Year 2014
Highlights
(1)
Source: Ipsos Advertising Tracking Study 2nd Wave Oct-Nov 2014
(2)
Source: Financial Behavior of Individuals: Puerto Rico Gaither /
Inmark |
 Profitability
•
Net income of $26.3 million, or $0.12 per diluted share, up 13% compared to $23.2 million in
3Q 2014.
•
During 4Q 2014 Net interest margin decreased by 3 basis points to 4.09%.
•
Pre-tax, pre-provision income of $49.6 million compared to $50.8 million in 3Q
2014. Asset Quality
•
Total NPAs decreased by $27.7 million compared to 3Q 2014. No large nonperforming loan sales
were completed during the quarter.
•
Inflows
to
nonperforming
loans
decreased
by
$16.9
million
or
21%
compared
to
3Q
2014.
•
Provision
for
loan
and
lease
losses
of
$23.9
million
compared
to
$27.0
million
in
3Q
2014
a
$3.1
million decline.
•
Net charge-offs of $26.9 million declined from $42.7 million in 3Q 2014, the decrease was
primarily reflected in the commercial and industrial loan portfolio.
Core Deposits
•
Deposits, net of government and brokered, increased by $25.5 million in 4Q 2014.
•
Government deposits decreased $68.0 million in 4Q 2014.
•
Brokered certificates of deposit (CDs) decreased by $176.7 million in 4Q 2014.
Capital
•
4Q 2014 Capital position was further strengthened:
Risk Based Capital Ratio 19.2% compared to 18.6% in 3Q 2014;
Tier 1 Ratio 17.9% compared to 17.3% in 3Q 2014; and
Leverage Ratio 12.5% compared to 12.3% in 3Q 2014.
•
Book value per common share of $6.25 compared to $6.05 in 3Q 2014.
•
Tangible book value per common share of $6.02 compared to $5.81 in 3Q 2014.
•
Deferred Tax Asset valuation allowance of $516 million.
8
Fourth Quarter 2014
Highest Net Income Quarter Since Return to Profitability |
 Ongoing
Improvement in Risk Profile 9
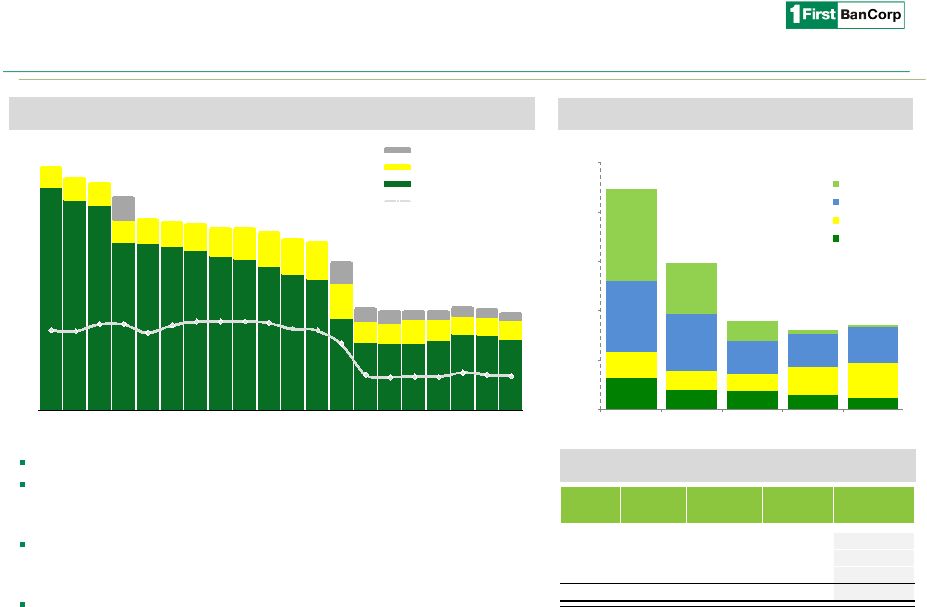
Net Charge-offs (NCO)
Non-performing Assets (NPA)
NPAs are down over $1 billion, or 56%, since the peak in 1Q 2010.
Commercial NPLs are being carried at 58.0% of unpaid principal balance,
net of specific reserves. Commercial REOs are carried at approximately
42% of UPB.
Focus remains on controlling migration and the reduction of
nonperforming assets, including the disposition of $192 million of HFS
and OREO.
We continue to move many complex credit cases to a position in which
the asset can be marketed and sold.
(1)
($ in millions)
(2)
Commercial
NPLs
(Includes
HFS)
(3)
Product
Book
Value
Accum.
Charge-offs
Reserves
Net Carrying
Amount
(4)
C&I
$122.5
$51.0
$15.5
61.7%
Const.
77.2
98.5
2.9
42.3%
CRE
155.3
60.9
8.6
67.9%
Total
$355.0
$210.4
$26.9
58.0%
63
39
37
29
23
54
38
35
56
71
142
118
67
68
73
186
101
41
7
5
$445
$296
$180
$160
$172
$-
$100
$200
$300
$400
$500
2010
2011
2012
2013
2014
Construction
Commercial
Consumer
Residential
2010
2011
2012
2013
2014
1,639
1,551
1,506
1,239
1,233
1,208
1,184
1,138
1,119
1,066
1,008
976
683
506
498
496
522
565
560
524
150
150
163
163
172
176
188
194
213
242
251
260
256
151
147
175
154
138
130
138
159
148
95
80
55
55
55
55
55
1,790
1,701
1,669
1,562
1,410
1,390
1,377
1,337
1,332
1,308
1,259
1,238
1,087
752
726
725
731
757
744
717
9.5%
10.0%
9.3%
10.2%
10.2%
9.6%
8.4%
5.7%
5.7%
6.1%
5.9%
5.8%
$0
$400
$800
$1,200
$1,600
$2,000
1Q
2Q
3Q
4Q
1Q
2Q
3Q
4Q
1Q
2Q
3Q
4Q
1Q
2Q
3Q
4Q
1Q
2Q
3Q
4Q
NPLs Held for Sale
Repossessed Assets & Other
Loans Held for Investment
NPAs / Assets
Proactively managing asset quality
1) Excludes $165 million of net charge-offs associated with the bulk sale to CPG in
2010. 2) Excludes $232 million of net-charge offs associated with the bulk
asset sales and transfer of loans in 2013. 3) December 31, 2014.
4) Net Carrying Amount = % of carrying value net of reserves and accumulated charge-offs.
|
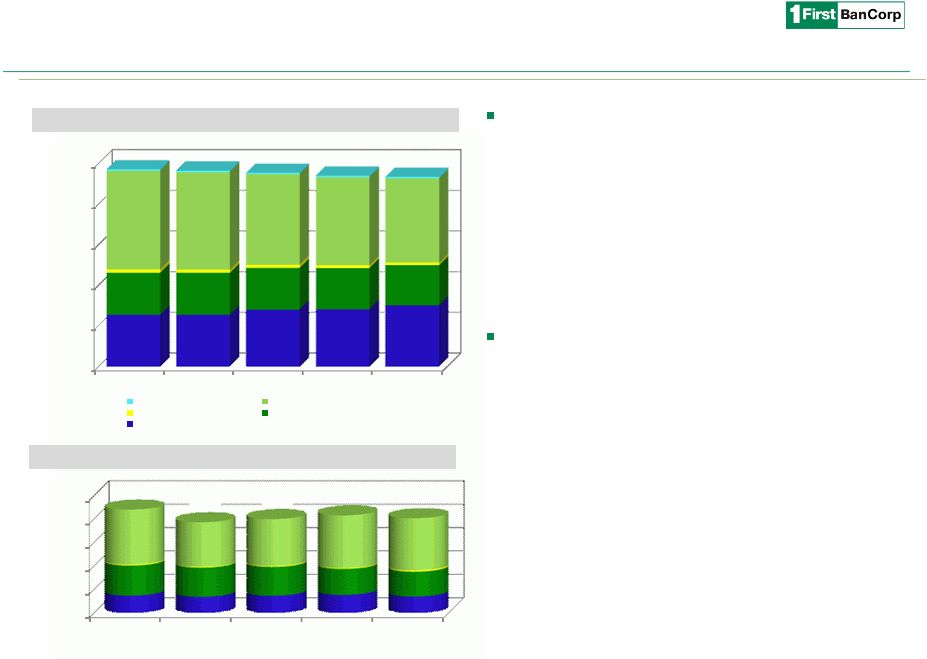 Despite
softening in our market, we continue selectively pursuing high quality loans:
–
Increase in residential mortgages through pool
purchased from competitor.
–
Reduction in the commercial book includes the pay-
off of two commercial loans and the sale of loan
participations as part of our de-risking strategies.
–
Focus on growth opportunities within our markets.
Origination and renewal activity at $891 million for 4Q
2014 at healthy levels compared to prior quarters:
–
Softening consumer demand persists in our main
market.
–
Executing within a more challenging market
environment in Puerto Rico during 2015 and continue
building on Florida growth opportunities.
–
The FL market produced approximately $85 million in
commercial origination volume in 4Q compared to
$71 million in 3Q.
10
Loan Portfolio
1) Originations include purchases, refinancings, and draws from existing revolving and
non-revolving commitments. Business Model Driven by Strong Origination
Capabilities Loan Originations
(1)
($ in millions)
Rebuilding and replacing to achieve higher quality portfolio
Loans Held for Sale
Commercial
Construction
Consumer & Finance Leases
Residential Mortgage
$0
$2,000
$4,000
$6,000
$8,000
$10,000
4Q 2013
1Q 2014
2Q 2014
3Q 2014
4Q 2014
2,549
2,548
2,795
2,820
3,011
2,067
2,072
2,062
2,027
1,983
169
153
148
142
123
4,852
4,794
4,461
4,327
4,145
76
79
72
80
77
$9,712
$9,646
$9,539
$9,395
$9,339
-
$220
$440
$660
$880
$1,100
4Q 2013
1Q 2014
2Q 2014
3Q 2014
4Q 2014
162
151
161
169
154
284
275
272
245
235
9
6
7
7
12
517
421
442
496
490
$972
$853
$882
$917
$891
$ |
 2014 Consumer
Loan Composition Well Balanced Loan Portfolio Mix
11
2014 Commercial Loan Composition
2014 Residential Loan by Geography
Diversified sources of revenue
Our well-diversified business model within
commercial, consumer and residential across
three unique regions allows us to be agile when
responding to growth opportunities.
Commercial represents 46%, residential
represents 33% and consumer represents 21%
of the total loan portfolio.
23% of Residential portfolio is located outside of
Puerto Rico
54%
12%
15%
10%
5%
2%
2%
Auto
Lease Finance
Credit Card
Personal Loans
Small Loans
Boat
Other
39%
3%
55%
3%
Commercial Mortgage
Construction
Commercial & Industrial
Floor Plans
77%
12%
11%
Puerto Rico
South Florida
Virgin Islands
1) Loan portfolio mix percentages exclude $77 million loans held for sale. |
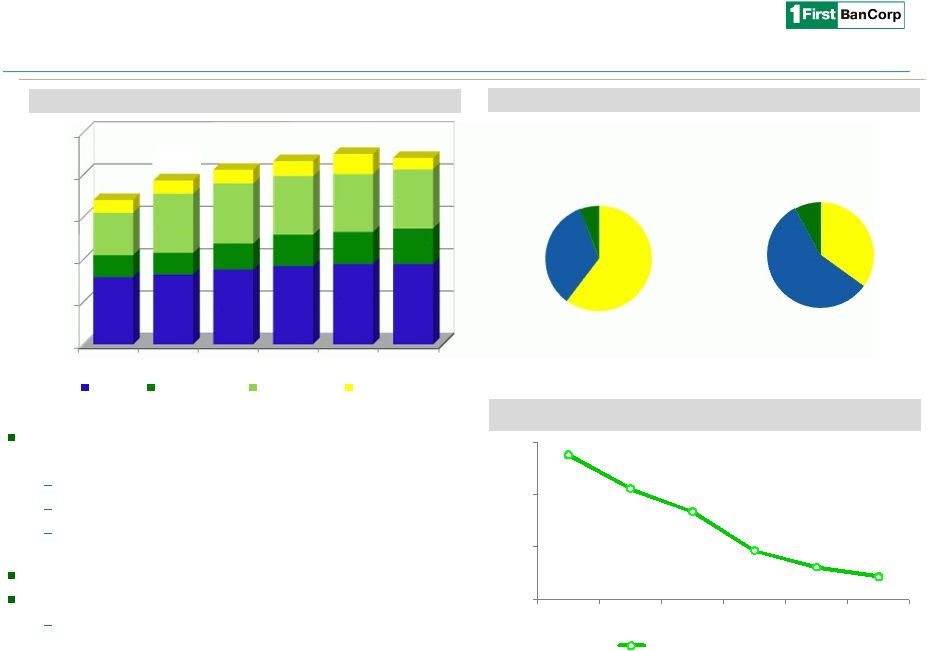 Core deposit
growth strategy continues producing positive results; $1.5 billion since 2009.
Florida continues to be a strong funding source.
Focus remains on cross-selling opportunities.
2014 core deposits declined due to an anticipated
reduction in government deposits.
Cost of deposits, net of brokered CDs, decreased to 0.72%.
Continue to improve by reducing reliance on brokered CDs:
$2.9 billion (30% of deposits) today vs. $7.6 billion
(60%) in 2009.
12
Core
Deposits
(1)
Total Deposit Composition
Cost
of
Deposits
(1)
Brokered CDs
30%
Non-interest
bearing
10%
Interest bearing
60%
4Q 2014
1) Total Deposits excluding Brokered CDs.
Favorable Funding Mix Shift
Successful deposit growth over recent years
Brokered CDs
60%
Non-interest
bearing
6%
Interest bearing
34%
4Q 2009
($ in millions)
1.88%
1.56%
1.34%
0.97%
0.81%
0.72%
0.50%
1.00%
1.50%
2.00%
2009
2010
2011
2012
2013
2014
Total Deposits, Net of Brokered
$-
$1,500
$3,000
$4,500
$6,000
$7,500
2009
2010
2011
2012
2013
2014
2,381
2,477
2,654
2,776
2,842
2,841
774
763
915
1,108
1,136
1,263
1,505
2,090
2,126
2,077
2,054
2,092
448
470
481
529
706
401
$5,108
$5,800
$6,176
$6,490
$6,738
$6,597
Retail
Commercial
CDs & IRAs
Public Funds |
 Income
Statement 4Q 2013
1Q 2014
2Q 2014
3Q 2014
4Q 2014
GAAP Net Interest Income
132.7
$
131.3
$
129.9
$
127.7
$
129.2
$
Provision for loan and lease losses
23.0
31.9
26.7
27.0
23.9
Non-interest income
18.4
18.0
16.6
16.2
17.9
Equity in (losses) gains of unconsolidated entities
(5.9)
(6.6)
(0.7)
-
-
Non-interest expense
106.5
92.8
98.1
93.6
94.8
Pre-tax net income
15.6
18.0
21.0
23.3
28.4
Income tax (expense) benefit
(0.8)
(0.9)
0.3
0.1
2.1
Net income
14.8
$
17.1
$
21.2
$
23.2
$
26.3
$
Adjusted Pre-tax pre-provision earnings
47.6
$
56.9
$
48.6
$
50.8
$
49.6
$
Net Interest Margin, (GAAP) (%)
4.25%
4.27%
4.21%
4.14%
4.18%
Net income per common share-basic
0.07
$
0.08
$
0.11
$
0.11
$
0.12
$
Tangible book value per common share
5.30
$
5.48
$
5.72
$
5.81
$
6.02
$
Improving Core Performance
Opportunities for earnings growth
($ in millions, except per share results)
1)
See reconciliation on page 21.
2)
See reconciliation on page 22.
(1)
13
Opportunity for revenue expansion and earnings growth
Potential for NIM expansion as low interest rate environment affects both liquidity
reinvestment and floating rate loan yields. Additional income opportunities through
replacement of NPLs with performing loans and reduced provisioning needs.
Future earnings potential with a reduction in high costs associated with managing NPLs and
OREO. Potential for additional loan growth opportunities as macro environment in Puerto
Rico improves. Long-term potential for value creation from consolidation in Puerto
Rico. Net income of $26.3 million in 4Q 2014; highest net income since
return to profitability.
Pre-tax pre-provision income of $49.6 million
(1)
average 5 quarters of $51 million.
(2) |
 Earnings Continue
to Drive Capital Growth 14
Tier 1 Common of $1.3 billion or 14.9% and Tier 1 capital of 17.9%.
Book value per common share of $6.25 compared to $5.57 in 2013.
Tangible book value per common share of $6.02
(1)
compared to $5.30 in 2013.
Deferred Tax Asset Valuation Allowance of $516m; Adjusted Tangible Book Value
(2)
of $8.44 / share.
17.1%
Total Risk Based Capital
18.6%
19.2%
12.7%
Tier 1 Common
14.4%
14.9%
8.7%
Tangible Common
9.8%
10.4%
8.0%
12.0%
16.0%
20.0%
4Q 2013
1Q 2014
2Q 2014
3Q 2014
4Q 2014
1)
See reconciliation to total equity on page 22. 2)
Assuming 100% reversal of Deferred Tax Asset Valuation Allowance of $516m;
shares outstanding of 213m. See reconciliation to adjusted tangible book value on page 22.
Healthy capital levels |
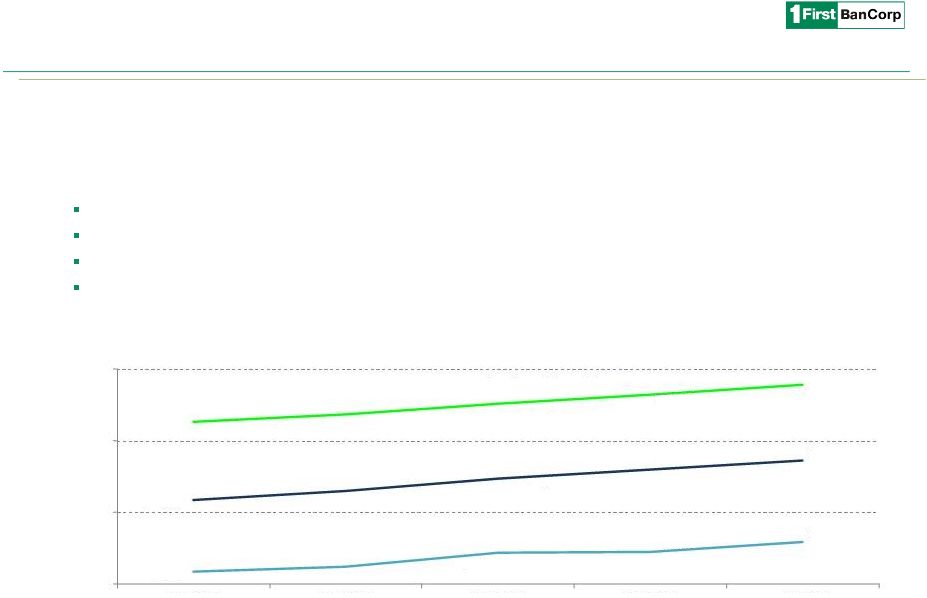
 A
turn-around story underscored by steady improvement and organic market share gains in
the core franchise, operating within a challenging macro environment.
Strong, tenured leadership team with a commitment to increasing shareholder value, while
fulfilling our vision to be the most highly regarded financial institution in the markets we
serve.
Improving operating results, together with ongoing efforts to improve efficiencies and further
build-out our core franchise, are our priorities.
Improving our risk profile and maintaining a strong capital position remain central to our
operating philosophy.
Opportunities for additional branch consolidation and market share expansion.
Outlook enhanced by the increasing interest of foreign investment in Puerto Rico and
potential benefits for the underlying economy.
Share price continues to trail capital formation and profitability as TBV ended 2014 at
$6.05/share. Our DTA valuation allowance is $516 million.
15
The Value of First BanCorp |
 Appendix
|
 2009
2014
Change ('09-'14)
% improvement
NPAs
$1,711
$717
$994
58%
NPAs/assets
8.7%
5.8%
294 bps
Tier 1 Common
4.1%
14.9%
1083 bps
125%
TCE / TA
3.2%
10.4%
715 bps
105%
Core deposits
$5,108
$6,597
$1,489
29%
NIM
2.69%
4.20%
151 bps
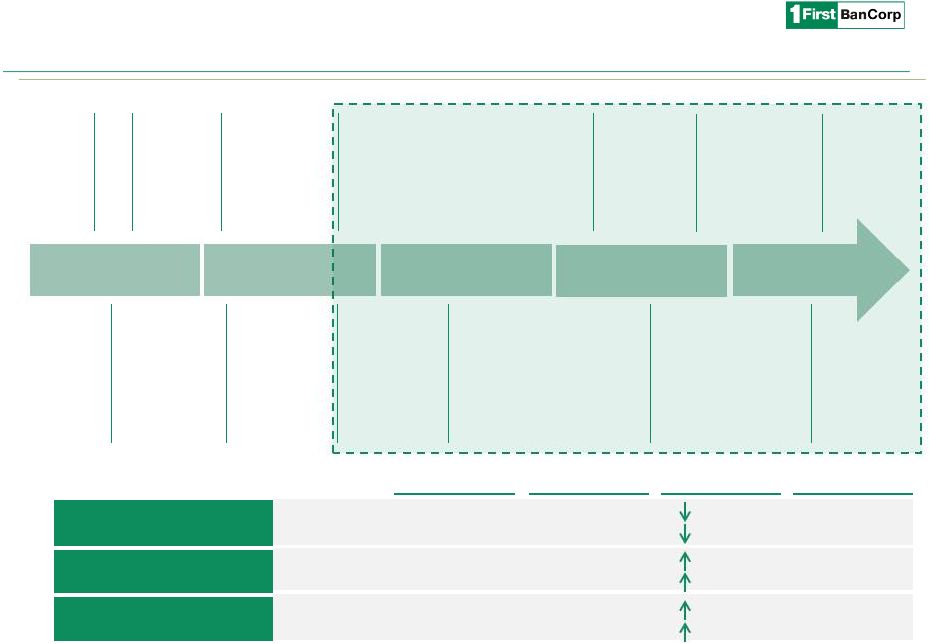
Our Turnaround Story
($ in millions)
De-Risking of Balance Sheet
Capital
Enhanced Franchise Value
17
1) Represents change in dollar amount.
(1)
(1)
(1)
(1)
June 2010:
Written
Agreement
with the FED
and Consent
Order with
FDIC
July 2010:
The U.S.
Treasury
exchanged
TARP for
convertible
preferred
August 2010:
Exchange of
89% Perpetual
Preferred
Stock for
Common
February 2011:
Sale of non-
performing
loans with a
book value of
$269 million
Feb-April 2011:
Sale of $330
million of MBS
and $518
million of
performing
residential
mortgages
March 2013:
Sale of non-performing
loans with a book value
of $217.7 million and
entered two separate
agreements for sale of
NPLs with a book value
of $99 million
2010
2011
2014
October 2011:
Conversion of
the shares held
by the U.S.
Treasury into
32.9 million
shares of
common stock
May 2012:
Acquisition of a
$406 million
portfolio of
FirstBank-
branded credit
cards from FIA
June 2013:
Write-off of $66.6
million collateral
pledged to
Lehman, sale of
NPLs with book
value of $203.8
million and $19.2
million of OREO
October 2011:
Private placement
of $525 million in
common stock.
Lead investors
included Thomas H.
Lee & Oaktree
2012
August 2013:
Completed
secondary
offering reducing
ownership
interest of U S
Treasury and PE
Investors
2013
September 2014:
Achieved five
consecutive
quarters of
profitability.
Average PPPT
income over
five quarters
$51 million
September 2014:
UST announced on
September 9
its
first predefined
written trading
plan, in which it
will be selling it’s
position in FBP.
December 2014:
UST released a
report that as of
12/5/14 it had
sold 4.4 million
shares. UST
ownership at
7.7%.
th |
 Non-performing Assets
1) Collateral pledged with Lehman Brothers Special Financing, Inc.
18
($ in thousands)
2009
2010
2011
2012
2013
1Q 2014
2Q 2014
3Q 2014
2014
Non-performing loans held for investment:
Residential mortgage
441,642
$
392,134
$
338,208
$
313,626
$
161,441
$
172,796
$
175,404
$
185,025
$
180,707
$
Commercial mortgage
196,535
217,165
240,414
214,780
120,107
145,535
166,218
169,967
148,473
Commercial & industrial
241,316
317,243
270,171
230,090
114,833
113,996
143,669
130,917
122,547
Construction
634,329
263,056
250,022
178,190
58,866
50,387
38,830
30,111
29,354
Consumer & finance leases
50,041
49,391
39,547
38,875
40,302
39,061
40,510
43,496
42,815
Total non-performing loans held for investment
1,563,863
1,238,989
1,138,362
975,561
495,549
521,775
564,631
559,516
523,896
OREO
69,304
84,897
114,292
185,764
160,193
138,622
121,842
112,803
124,003
Other repossessed property
12,898
14,023
15,392
10,107
14,865
15,587
16,114
17,467
14,229
Other assets
(1)
64,543
64,543
64,543
64,543
-
-
-
-
-
Total non-performing assets, excluding loans held for sale
1,710,608
1,402,452
1,332,589
1,235,975
670,607
675,984
702,587
689,786
662,128
Non-performing loans held for sale
-
159,321
4,764
2,243
54,801
54,755
54,755
54,641
54,641
Total non-performing assets
1,710,608
$
1,561,773
$
1,337,353
$
1,238,218
$
725,408
$
730,739
$
757,342
$
744,427
$
716,769
$ |
  Quarterly Migration
Trends ($ in thousands)
19
Residential
Mortgage
Commercial
Mortgage
Commercial &
Industrial
Construction
Consumer
Total
Beginning balance
185,025
$
169,967
$
130,917
$
30,111
$
43,496
$
559,516
$
Plus:
Additions to non-performing
27,554
10,045
5,931
809
19,828
64,167
Less:
Non-performing loans transferred to OREO
(3,829)
(21,120)
(2,194)
(118)
(272)
(27,533)
Non-performing loans charged-off
(4,333)
(3,423)
(2,345)
(78)
(14,284)
(24,463)
Loans returned to accrual status /
collections (23,710)
(6,996)
(9,762)
(1,370)
(5,953)
(47,791)
Ending balance
180,707
$
148,473
$
122,547
$
29,354
$
42,815
$
523,896
$
Residential
Mortgage
Commercial
Mortgage
Commercial &
Industrial
Construction
Consumer
Total
Beginning balance
175,404
$
166,218
$
143,669
$
38,830
$
40,510
$
564,631
$
Plus:
Additions to non-performing
35,645
11,985
13,967
122
19,392
81,111
Less:
Non-performing loans transferred to OREO
(2,216)
(1,058)
(2,124)
(749)
(103)
(6,250)
Non-performing loans
charged-off (4,445)
(2,292)
(17,570)
(7,689)
(13,773)
(45,769)
Loans returned to accrual status /
collections (19,363)
(4,886)
(7,025)
(403)
(2,530)
(34,207)
Ending balance
185,025
$
169,967
$
130,917
$
30,111
$
43,496
$
559,516
$
December 31, 2014
September 30, 2014 |
  Puerto Rico
Government Exposure 20
As of December 31, 2014
($ in millions)
Total asset exposure to the Puerto Rico
Government was $400 million of which
$369 million was outstanding as of
December 31, 2014, down $8 million
compared to 3Q 2014 and over $100
million compared to $470 million 4Q
2013.
In addition, there is $133 million of
indirect exposure to the Tourism
Development Fund supporting hotel
projects down from $200 million in 3Q
2014.
Total Government Deposits as of
December 31, 2014 were $227 million.
Time deposits declined $3.4 million
compared to 3Q 2014.
Transaction accounts decreased $20.0
million compared to 3Q 2014.
Total
Government Unit
Outstanding
Investment Portfolio
61.2
$
Central Government:
Commonwealth Appropriations
7.1
Federal Funds
6.1
Total Central Government (2 Loans)
13.2
Public Corporations:
Operating Revenues
89.5
Rental Income
3.9
Total Public Corporations (3 Loans)
93.4
Municipalities (10 Loans)
Property Tax Revenues
201.4
Total Direct Government Exposure
369.2
$
Source of Repayment
Government Unit
Time
Deposits
Transaction
Accounts
Total
Federal Funds
-
$
-
$
-
$
Municipalities
17.7
104.7
122.4
Public Agencies
1.7
101.9
103.6
Public Corporations
-
1.4
1.4
Total Deposits
19.3
$
208.1
$
227.4
$ |
  Adjusted
Pre-tax, Pre-provision Income Reconciliation 21
($ in thousands)
4Q 2013
1Q 2014
2Q 2014
3Q 2014
4Q 2014
Income (loss) before income taxes
15,634
$
17,970
$
20,949
$
23,264
$
28,391
$
Add: Provision for loan and lease losses
22,969
31,915
26,744
26,999
23,872
Add: Net loss on investments and impairments
-
-
(291)
245
172
Less: Unrealized gain (loss) on derivatives instruments and
liabilities measured at fair value
(355)
(313)
(262)
(418)
(265)
Less: Prepayment penalty on commercial loan tied to an interest
rate swap
-
-
-
-
(2,546)
Add: Acquisition of mortgage loans from Doral related expenses
-
-
576
659
-
Less: National gross receipt tax - outside Puerto Rico (1)
(473)
-
-
-
-
Add: Branch consolidations and other restructuring
expenses/valuation adjustments
1,421
718
236
-
-
Add: Write-off collateral pledged to Lehman and related expenses
2,500
-
-
-
-
Add: Equity in losses (earnings) of unconsolidated entities
5,893
6,610
670
-
-
Adjusted pre-tax, pre-provision income
47,589
$
56,900
$
48,622
$
50,750
$
49,624
$
Quarter Ended
(1) Represents the impact of the national gross receipt tax related to the trade or business
outside of Puerto Rico that was reversed in the fourth quarter after enactment of Act No. 117. |
 4Q 2013
1Q 2014
2Q 2014
3Q 2014
4Q 2014
Tangible equity:
Total equity - GAAP
1,216
$
1,256
$
1,306
$
1,324
$
1,367
$
Preferred equity
(63)
(57)
(36)
(36)
(36)
Goodwill
(28)
(28)
(28)
(28)
(28)
Purchased credit card relationship
(20)
(19)
(18)
(17)
(16)
Core deposit intangible
(7)
(7)
(6)
(6)
(5)
Tangible common equity
1,098
$
1,145
$
1,218
$
1,237
$
1,281
$
Common shares outstanding
207
209
213
213
213
Tangible book value per common share
5.30
$
5.48
$
5.72
$
5.81
$
6.02
$
Deferred tax valuation allowance
523
$
519
$
511
$
505
$
516
$
Deferred tax valuation allowance per share
2.53
2.48
2.40
2.37
2.42
Adjusted tangible book value per share
7.83
$
7.97
$
8.12
$
8.18
$
8.44
$
Tangible Book Value Per Share Reconciliation
22
($ in millions, except for per share data)
1) Assuming 100% recapture of valuation allowance.
(1) |
 Stock
Profile 23
Trading Symbol:
•
FBP
Exchange:
•
NYSE
Share
Price
(2/6/15):
•
$6.30
Shares Outstanding
(as of December 31, 2014): •
213,004,449
Market Capitalization
(2/6/15):
•
$1.3 billion
1 Yr. Average Daily Volume:
•
811,3488
Price
(2/6/15)
to
Tangible
Book
(12/31/14):
•
1.05x
5% of more Beneficial Ownership
Beneficial Owner
Amount
Percent of
Class
Entities affiliated with Thomas H. Lee
Partners, L.P.
41,851,067
19.6%
Entities managed by Oaktree Capital
Management, L.P.
41,851,066
19.6%
United States Department of the
Treasury
(1)
16,577,452
7.7%
1) Includes the U.S. Treasury warrant that entitles it to purchase up to 1,285,899 shares of
Common Stock at an exercise price of $3.29 per share, as adjusted as a result of the issuance of
shares of Common Stock in the Corporation’s $525m private placement of Common Stock
completed in October 2011. The exercise price and the number of shares issuable upon exercise
of the warrant are subject to further adjustments under certain circumstances to prevent
dilution. The warrant has a 10-year term from its issue date and is exercisable in whole or in part
at any time. On December 9, 2014, the UST released a report showing that it had
sold 4.4 million shares through its First Predefined Written Trading Plan announced on September 9,
2014 and lasting 90 days. The reduction is reflected in the total. |