Attached files
U.S. SECURITIES AND EXCHANGE COMMISSION
Washington, D.C. 20549
FORM 10-Q
(Mark One)
x QUARTERLY REPORT PURSUANT TO SECTION 13 OR 15(d) OF THE SECURITIES EXCHANGE ACT OF 1934 FOR THE QUARTERLY PERIOD ENDED DECEMBER 31, 2014
OR
o TRANSITION REPORT PURSUANT TO SECTION 13 OR 15(d) OF THE SECURITIES EXCHANGE ACT OF 1934
Commission File Number 000-51151
ENERGIZER RESOURCES INC.
(Name of registrant in its charter)
|
Minnesota
|
20-0803515
|
|
|
(State or other jurisdiction of
Incorporation or organization)
|
(I.R.S. Employer
Identification No.)
|
520 – 141 Adelaide Street West, Toronto, Ontario M5H 3L5
(Address of principal executive offices)
_____________________
(416) 364-4911
(Issuer’s telephone number)
_____________________
Securities registered under Section 12(b) of the Exchange Act: None
Securities registered under Section 12(g) of the Exchange Act: Common Stock, $0.001 par value per share
(Title of Class)
Indicate by check mark whether the registrant (1) has filed all reports required to be filed by Section 13 or 15 (d) of the Securities Exchange Act of 1934 during the preceding 12 months (or for such shorter period that the registrant was required to file such reports), and (2) has been subject to such filing requirements for the past 90 days. Yes x No o
Indicate by check mark whether the registrant has submitted electronically and posted on its corporate Web site, if any, every Interactive Data File required to be submitted and posted pursuant to Rule 405 of Regulation S-T (§232.405 of this chapter) during the preceding 12 months (or for such shorter period that the registrant was required to submit and post such files). Yes o No x
Indicate by check mark whether the registrant is a large accelerated filer, an accelerated filer, a non-accelerated filer or a smaller reporting company.
| Large accelerated filer | o | Accelerated Filer | o |
| Non-accelerated filer | o | Smaller reporting company | x |
Indicate by check mark whether the registrant is a shell company (as defined in Rule 12b-2 of the Exchange Act).Yes oNo x
As of February 10, 2015, there were 308,384,670 shares of the Registrant's common stock issued and outstanding.
Transitional Small Business Disclosure Format Yes o No x

Energizer Resources Inc.
PART 1
FINANCIAL INFORMATION
As used in these footnotes, “we”, “us”, “our”, “Energizer Resources”, “Energizer”, “Company” or “our company” refers to Energizer Resources Inc. and all of its subsidiaries.
ITEM 1. INTERIM CONSOLIDATED FINANCIAL STATEMENTS AND NOTES
General
The accompanying reviewed interim unaudited consolidated financial statements have been prepared in accordance with the instructions to Form 10-Q. Therefore, they do not include all information and footnotes necessary for a complete presentation of financial position, results of operations, cash flows, and stockholders' equity in conformity with generally accepted accounting principles applicable in the United States of America. Except as disclosed herein, there has been no material change in the information disclosed in the notes to the consolidated financial statements included in our Company's annual report on Form 10-K for the year ended June 30, 2014. In the opinion of management, all adjustments considered necessary for a fair presentation of the results of operations and financial position have been included and all such adjustments are of a normal recurring nature. Operating results for the period ended December 31, 2014 are not necessarily indicative of the results that can be expected for the year ending June 30, 2015.
All references to “dollars”, “$” or “US$” are to United States dollars and all references to “CAD$” are to Canadian dollars. United States dollar equivalents of Canadian dollar figures are based on the exchange rate as reported by the Bank of Canada on the applicable date.
2
ENERGIZER RESOURCES INC.
(An Exploration Stage Company)
Unaudited Condensed Consolidated Interim Financial Statements
For the six month period ended December 31, 2014
(Expressed in US Dollars)
3
Energizer Resources Inc.
Condensed Consolidated Interim Balance Sheets
(Expressed in US Dollars)
|
December 31, 2014
|
June 30, 2014
|
|||||||
|
(Unaudited)
|
(Audited)
|
|||||||
|
Assets
|
||||||||
|
Current Assets:
|
||||||||
|
Cash and cash equivalents
|
$ | 1,358,571 | $ | 1,250,383 | ||||
|
Amounts receivable and prepaid expenses (note 4)
|
239,037 | 430,596 | ||||||
|
Loan to related parties (note 4)
|
87,763 | 94,512 | ||||||
|
Marketable securities (note 5)
|
3,870 | 70,277 | ||||||
|
Total current assets
|
1,689,241 | 1,845,768 | ||||||
|
Equipment (note 6)
|
99,476 | 126,385 | ||||||
|
Total assets
|
$ | 1,788,717 | $ | 1,972,153 | ||||
|
Liabilities and Stockholders' Equity
|
||||||||
|
Liabilities
|
||||||||
|
Current Liabilities:
|
||||||||
|
Accounts payable and accrued liabilities (note 4)
|
$ | 846,902 | $ | 1,816,623 | ||||
|
Deferred premium on flow-through shares (note 8)
|
- | 37,145 | ||||||
|
Warrant liability (note 11)
|
1,341,032 | 1,830,151 | ||||||
|
Total liabilities
|
2,187,934 | 3,683,919 | ||||||
|
Stockholders' Deficiency
|
||||||||
|
Common stock, 650,000,000 shares authorized, $0.001 par value,
|
||||||||
|
308,384,670 issued and outstanding (June 30, 2014 -
|
||||||||
|
268,627,603) (note 9)
|
308,385 | 268,627 | ||||||
|
Additional paid-in capital (note 9)
|
89,652,421 | 84,265,060 | ||||||
|
Accumulated comprehensive (loss) / income
|
(9,323 | ) | 8,771 | |||||
|
Accumulated deficit
|
(90,350,700 | ) | (86,254,224 | ) | ||||
|
Total stockholders' deficiency
|
(399,217 | ) | (1,711,766 | ) | ||||
|
Total liabilities and stockholders' deficiency
|
$ | 1,788,717 | $ | 1,972,153 | ||||
The accompanying notes are an integral part of these unaudited condensed consolidated interim financial statements.
Going Concern (note 1)
Mineral Properties (note 7)
Commitments (note 13)
4
Energizer Resources Inc.
Unaudited Condensed Consolidated Interim Statements of Operations and Comprehensive Loss
(Expressed in US Dollars)
|
For the six months
|
For the three months
|
|||||||||||||||
|
ended December 31,
|
ended December 31,
|
|||||||||||||||
|
2014
|
2013
|
2014
|
2013
|
|||||||||||||
|
Revenues
|
$ | - | $ | - | $ | - | $ | - | ||||||||
|
Expenses
|
||||||||||||||||
|
Mineral exploration expense (notes 4 and 7)
|
3,233,878 | 1,584,290 | 1,607,502 | 547,556 | ||||||||||||
|
Stock-based compensation (notes 4, 9 and 10)
|
404,160 | 241,819 | - | 27,550 | ||||||||||||
|
General and administrative (note 4)
|
500,664 | 593,735 | 268,472 | 344,483 | ||||||||||||
|
Professional and consulting fees (note 4)
|
472,052 | 624,550 | 240,155 | 330,694 | ||||||||||||
|
Depreciation (note 6)
|
26,909 | 11,967 | 15,540 | 5,296 | ||||||||||||
|
Foreign currency translation loss / (gain)
|
3,827 | (90,570 | ) | 33,137 | (40,807 | ) | ||||||||||
|
Total expenses
|
4,641,490 | 2,965,791 | 2,164,806 | 1,214,772 | ||||||||||||
|
Net loss from operations
|
(4,641,490 | ) | (2,965,791 | ) | (2,164,806 | ) | (1,214,772 | ) | ||||||||
|
Other Income
|
||||||||||||||||
|
Investment income
|
6,472 | 7,400 | 2,497 | 6,470 | ||||||||||||
|
Sale of flow-through tax benefits (note 8)
|
37,145 | - | 8,724 | - | ||||||||||||
|
Impairment of marketable securities (note 5)
|
- | (63,849 | ) | - | - | |||||||||||
|
Gain on sale of marketable securities (note 5)
|
12,278 | - | 12,278 | - | ||||||||||||
|
Change in fair value of warrant liability (note 11)
|
489,119 | - | 990,514 | - | ||||||||||||
|
Net Loss
|
(4,096,476 | ) | (3,022,240 | ) | (1,150,793 | ) | (1,208,302 | ) | ||||||||
|
Unrealized (loss)/gain in marketable securities
|
(5,816 | ) | 4,439 | (5,816 | ) | 5,439 | ||||||||||
|
Recognition of other than temporary loss (note 5)
|
- | 63,849 | - | - | ||||||||||||
|
Realized gains included in net loss (note 5)
|
(12,278 | ) | - | (12,278 | ) | - | ||||||||||
|
Comprehensive loss
|
$ | (4,114,570 | ) | $ | (2,953,952 | ) | $ | (1,168,887 | ) | $ | (1,202,863 | ) | ||||
|
Loss per share - basic and diluted (note 12)
|
$ | (0.01 | ) | $ | (0.02 | ) | $ | (0.00 | ) | $ | (0.01 | ) | ||||
|
Weighted average shares outstanding -
|
||||||||||||||||
|
basic and diluted (note 12)
|
286,991,806 | 189,902,681 | 303,538,222 | 194,152,780 | ||||||||||||
The accompanying notes are an integral part of these unaudited condensed consolidated interim financial statements.
5
Energizer Resources Inc.
Unaudited Condensed Consolidated Interim Statements of Cash Flows
(Expressed in US Dollars)
|
For the six months ended December 31,
|
||||||||
|
2014
|
2013
|
|||||||
|
Operating Activities
|
||||||||
|
Net loss
|
$ | (4,096,476 | ) | $ | (3,022,240 | ) | ||
|
Adjustments to reconcile net loss to net cash used in operating activities:
|
||||||||
|
Depreciation
|
26,909 | 11,967 | ||||||
|
Gain on sale of marketable securities
|
(12,278 | ) | (4,545 | ) | ||||
|
Change in fair value of warrant liability
|
(489,119 | ) | - | |||||
|
Stock-based compensation
|
404,160 | 241,819 | ||||||
|
Impairment of marketable securities
|
- | 63,849 | ||||||
|
Sale of flow-through tax benefits
|
(37,145 | ) | - | |||||
|
Change in operating assets and liabilities:
|
||||||||
|
Amounts receivable and prepaid expenses
|
191,559 | (59,867 | ) | |||||
|
Accounts payable and accrued liabilities
|
(969,721 | ) | (84,824 | ) | ||||
|
Net cash used in operating activities
|
(4,982,111 | ) | (2,853,841 | ) | ||||
|
Financing Activities
|
||||||||
|
Proceeds from issuance of common stock, net of costs
|
4,956,775 | 3,314,757 | ||||||
|
Exercise of warrants
|
72,049 | - | ||||||
|
Net cash provided by financing activities
|
5,028,824 | 3,314,757 | ||||||
|
Investing Activities
|
||||||||
|
Loan to related party
|
6,749 | 56,474 | ||||||
|
Purchases of marketable securities, net of sales
|
- | (103,763 | ) | |||||
|
Proceeds on sale of marketable securities
|
54,726 | 55,424 | ||||||
|
Net cash provided by investing activities
|
61,475 | 8,135 | ||||||
|
Increase in cash and cash equivalents
|
108,188 | 469,051 | ||||||
|
Cash and cash equivalents - beginning of period
|
1,250,383 | 825,100 | ||||||
|
Cash and cash equivalents - end of period
|
$ | 1,358,571 | $ | 1,294,151 | ||||
The accompanying notes are an integral part of these unaudited condensed consolidated interim financial statements.
6
Energizer Resources Inc.
Notes to Unaudited Condensed Consolidated Interim Financial Statements
For the six month period ended December 31, 2014
(Expressed in US Dollars)
|
1.
|
Nature of Operations and Going Concern
|
Energizer Resources Inc. (the "Company") is a State of Minnesota, United States of America incorporated entity. The Company's fiscal year end is June 30. The Company's principal business is the acquisition and exploration of mineral resources. During fiscal 2008, the Company incorporated Energizer Resources (Mauritius) Ltd., a Mauritius subsidiary and Energizer Resources Madagascar Sarl, a Madagascar subsidiary. During fiscal 2009, the Company incorporated THB Venture Ltd., a Mauritius subsidiary to hold the interest in Energizer Resources Minerals Sarl, a Madagascar subsidiary, which holds the Green Giant Property in Madagascar (see note 7). During fiscal 2012, the Company incorporated Madagascar-ERG Joint Venture (Mauritius) Ltd., a Mauritius subsidiary and ERG (Madagascar) Sarl, a Madagascar subsidiary. ERG (Madagascar) Sarl is 100% owned by Madagascar-ERG Joint Venture (Mauritius) Ltd. which is now owned 100% by Energizer Resources (Mauritius) Ltd. ERG (Madagascar) Sarl holds the Malagasy Joint Venture Ground (see note 7). During fiscal 2014, the Company incorporated 2391938 Ontario Inc., an Ontario, Canada subsidiary. In addition, the Company owns a 25% interest in Ampanihy Exploration Ltd, a Mauritius company who holds a 100% interest in Ampex Sarl, a Madagascar company. Ampex Sarl holds the non-industrial mineral rights on certain Green Giant permits. The Company has not yet fully determined whether its properties contain mineral reserves that are economically recoverable.
These condensed consolidated interim financial statements have been prepared on a going concern basis, which assumes that the Company will continue to realize its assets and discharge its liabilities in the normal course of business. The Company has yet to generate revenue from mining operations or pay dividends and is unlikely to do so in the immediate or foreseeable future. The continuation of the Company as a going concern is dependent upon the continued financial support from its shareholders, the ability of the Company to obtain necessary equity or debt financing to continue operations, the Company's ability to attract joint venture partners and off-take contracts and the attainment of profitable operations. As of December 31, 2014, the Company has accumulated losses of $90,350,700. As such, there is substantial doubt regarding the Company's ability to continue as a going concern. These consolidated financial statements do not include any adjustments to the recoverability and classification of recorded asset amounts and classification of liabilities that might be necessary should the Company be unable to continue as a going concern.
|
2.
|
Significant Accounting Policies
|
Principals of Consolidation and Basis of Presentation
These condensed consolidated interim financial statements are presented in accordance with accounting principles generally accepted in the United States ("U.S. GAAP"), and are expressed in United States dollars. These consolidated financial statements include the accounts of Energizer Resources Inc. and its wholly-owned subsidiaries, Energizer Resources (Mauritius) Ltd., THB Ventures Ltd., Energizer Resources Madagascar Sarl, Energizer Resources Minerals Sarl, Madagascar-ERG Joint Venture (Mauritius) Ltd, ERG (Madagascar) Sarl and 2391938 Ontario Inc. All inter-company balances and transactions have been eliminated on consolidation.
Unaudited Condensed Consolidated Interim Financial Statements
These unaudited condensed consolidated interim financial statements have been prepared on the same basis as the annual consolidated financial statements and should be read in conjunction with those annual financial statements filed on Form 10-K for the year ended June 30, 2014. In the opinion of management, these unaudited condensed consolidated interim financial statements reflect adjustments, necessary to present fairly the Company's financial position, results of operations and cash flows for the periods shown. The results of operations for such periods are not necessarily indicative of the results expected for a full year or for any future period.
7
Energizer Resources Inc.
Notes to Unaudited Condensed Consolidated Interim Financial Statements
For the six month period ended December 31, 2014
(Expressed in US Dollars)
|
3.
|
Recent Accounting Pronouncements Potentially Affecting The Company
|
The following are recent FASB accounting pronouncements, which may have an impact on the Company's future consolidated financial statements.
|
-
|
“Income Taxes (ASC Topic 740): Presentation of an Unrecognized Tax Benefit when a Net Operating Loss Carry-forward, a Similar Tax Loss, or a Tax Credit Carry-forward Exists" ("ASU 2013-11") was issued during July 2013. FASB issued guidance on how to present an unrecognized tax benefit. The guidance is effective for annual periods beginning after December 15, 2013 for public companies. The Company has adopted this pronouncement during the current period.
|
|
-
|
“Presentation of Financial Statements Going Concern (ASC Topic 205-40): Disclosure of Uncertainties about an Entity’s Ability to Continue as a Going Concern ("ASU 2014-15") was issued during August 2014. FASB issued guidance on how to account for and disclose going concern risks. This guidance is effective for annual periods beginning after December 15, 2016.
|
The adoption of ASC Topic 740 did not have a significant impact on the Company's results of operations, financial performance or cash flows. The Company is currently evaluating the impact of ASU Topic 2014-15 on its financial statements.
|
4.
|
Related Party Transactions and Balances
|
Parties are related if one party has the ability, directly or indirectly, to control the other party or exercise significant influence over the other party in making operating and financial decisions. Parties are also related if they are subject to common control or common significant influence. Related parties may be individuals or corporate entities. A transaction is considered to be a related party transaction when there is a transfer of resources or obligations between related parties. Related party transactions that are in the normal course of business and have commercial substance are measured at the exchange amount, which is fair value.
The following are the related party transactions for the six month period ended December 31, 2014:
|
a)
|
The Company incurred $52,200 (December 31, 2013: $60,000), in office administration and rent, included in general and administrative expenses, from a public company related by common management, Red Pine Exploration Inc (TSX.V: "RPX").
|
|
b)
|
2,700,000 (December 31, 2013: 1,870,000) stock options were issued to related parties during the period with an exercise price of $0.15 (December 31, 2013: between $0.11 and $0.15). These stock options were valued at $227,340 (December 31, 2013: $241,819) using the Black-Scholes pricing model and were issued to directors and officers of the Company and included in stock-based compensation (see note 10).
|
|
c)
|
The Company incurred $327,862 (December 31, 2013: $461,272) in expenses to directors and officers or companies under their control, $146,402 (December 31, 2013: $107,500) of which is included in mineral exploration expenses and $181,460 (December 31, 2013: $353,772) which is included in professional and consulting fees.
|
|
d)
|
The Company incurred $1,704,809 (December 31, 2013: $7,760) in charges from a mining and engineering firm for which one of the Company's directors serves as a senior officer and a director which was included in mineral exploration expense.
|
|
e)
|
During the year ended June 30, 2014, the Company entered into an agreement to option a 75% interest in the Sagar Property to Honey Badger Exploration Inc. (TSX-V: "TUF"), a public company related by common management (see Note 7).
|
8
Energizer Resources Inc.
Notes to Unaudited Condensed Consolidated Interim Financial Statements
For the six month period ended December 31, 2014
(Expressed in US Dollars)
|
4.
|
Related Party Transactions and Balances - continued
|
The following are the related party balances as of December 31, 2014:
|
a)
|
Related party balances of $Nil (June 30, 2014: $54,764) were included in amounts receivable and prepaid expenses and $52,200 (June 30, 2014: $33,019) related to rent, was included in accounts payable and accrued liabilities.
|
|
b)
|
During May 2014, the Company advanced a short-term loan to MacDonald Mines Exploration Ltd. (TSX-V: "BMK") totaling $86,007 (June 30, 2014: $47,081). This loan is interest bearing at a rate of 5%. No amounts have been paid back up to December 31, 2014. Accrued interest due totalled $1,756 as at December 31, 2014, and is included in the balance.
|
|
c)
|
Of the $1,704,809 (June 30, 2014: $7,760) in charges from a mining and engineering firm for which one of the Company's former directors serves as a senior officer and director. $301,700 (June 30, 2014: $633,416) is included in accounts payable and accrued liabilities.
|
|
d)
|
$129,010 (June 30, 2014: $264,922) is included within accounts payable and accrued liabilities as a committed amount due to the former Chief Executive Officer of the Company.
|
|
5.
|
Marketable Securities
|
Marketable securities consist of available-for-sale securities over which the Company does not have significant influence or control. $3,870 (June 30, 2014: $70,277) was invested in TSX-Venture listed entities. For the six months ended December 31, 2013, the Company determined that $63,849 of unrealized losses were other than temporary and as such were recognized as an "other expense" in net loss and removed from accumulated other comprehensive income. During the six month period ended December 31, 2014, the Company sold marketable securities and recognized a gain on sale of $12,278 which has been recorded in the statement of operations and comprehensive loss and removed from accumulated other comprehensive income.
|
6.
|
Equipment
|
|
Accumulated
|
December 31, 2014
|
June 30, 2014
|
||||||||||||||
|
|
Cost
|
Depreciation
|
Net Book Value
|
Net Book Value
|
||||||||||||
|
Exploration equipment
|
$ | 195,561 | $ | 96,085 | $ | 99,476 | $ | 126,385 | ||||||||
For the six month period ended December 31, 2014, depreciation expense totaled $26,909 (December 31, 2013: $11,967).
9
Energizer Resources Inc.
Notes to Unaudited Condensed Consolidated Interim Financial Statements
For the six month period ended December 31, 2014
(Expressed in US Dollars)
|
7.
|
Mineral Properties
|
Molo Graphite Project, Southern Madagascar, Africa
On December 14, 2011, the Company entered into a Definitive Joint Venture Agreement ("JVA") with Malagasy Minerals Limited ("Malagasy"), a public company on the Australian Stock Exchange, to acquire a 75% interest to explore and develop a group of industrial minerals, including graphite, vanadium and approximately 25 other minerals. The land position covers 2,119 permits and 827.7 square kilometres and is mostly adjacent to the south and east of the Company's 100% owned Green Giant Property. The Company paid $2,261,690 and issued 7,500,000 common shares valued at $1,350,000.
On April 16, 2014, the Company signed a Sale and Purchase Agreement and a Mineral Rights Agreement with Malagasy to acquire the remaining 25% interest. The Company made the following payments: $364,480 (CAD$400,000); issued 2,500,000 common shares subject to a 12 month voluntary vesting period and valued at $325,000; and issued 3,500,000 common share purchase warrants, valued at $320,950 using the Black-Scholes pricing model with an exercise price of $0.14 and an expiry date of April 15, 2019. The Company is required to make a cash payment of $655,922 (CAD$700,000) and issue 1,000,000 common shares within five days of the completion of a bankable feasibility study (“BFS”) for the Molo Graphite Project or the formal announcement of a decision to mine; and a cash payment of $937,032 (CAD$1,000,000) within five days of the commencement of commercial production. Malagasy retains a 1.5% net smelter return royalty ("NSR"). The Company also acquired a 100% interest to the industrial mineral rights on approximately 1-1/2 additional claim blocks comprising 10,811 hectares immediately to the east and adjoining the Molo Graphite Project.
Green Giant Property, Southern Madagascar, Africa
During 2007 to acquire a 75% interest in the property, the Company paid $765,000, issued 2,500,000 common shares and 1,000,000 now expired common share purchase warrants to enter into a joint venture agreement for the Green Giant Property with Madagascar Minerals and Resources Sarl ("MMR").
On July 9, 2009, the Company acquired the remaining 25% interest for $100,000. MMR retains a 2% NSR. The NSR can be purchased, at the Company's option, for $500,000 in cash or common shares for the first 1% and at a price of $1,000,000 in cash or common shares for the second 1%.
On April 16, 2014, the Company signed a Joint Venture Agreement with Malagasy, whereby Malagasy acquired a 75% interest for non-industrial minerals on the Company's 100% owned Green Giant Property in Madagascar. The Company retains the remaining 25% and has a free carried interest through the BFS. No specific consideration was received for this transaction as it was part of the Molo Graphite Project transaction dated April 16, 2014.
Sagar Property - Romanet Horst, Labrador Trough, Quebec, Canada
During 2006, the Company purchased from Virginia Mines Inc. ("Virginia") a 100% interest in 382 claims located in northern Quebec, Canada. Virginia retains a 2% NSR on certain claims within this property with other unrelated vendors holding a 1% NSR on certain claims, and a 0.5% NSR on other claims. For the other vendor's NSR, the Company has the right to buy back half of the 1% NSR for $200,000 and half of the 0.5% NSR for $100,000.
On February 28, 2014, the Company signed an agreement to sell an interest in the Sagar property to TUF, a public company related by common management. On July 31, 2014, the Company revised the terms of this agreement. Under the revised agreement, in order for TUF to acquire an initial 35% interest in the property, the Company will receive CAD$150,000 and TUF will spend CAD$1,500,000 developing the property. TUF can earn further percentage interests up to 75% over a four year period by spending a total of $7,739,100 (CAD$9,000,000), paying the Company $773,910 (CAD$900,000) and issuing to the Company the lesser of 15% of its issued and outstanding shares or 35,000,000 shares. Once these commitments have been met, TUF can acquire the remaining interest by paying the Company an additional $1,719,800 (CAD$2,000,000) and issuing the lesser of 19.5% of TUF outstanding shares or up to 60,000,000 shares, including all previously issued shares.
10
Energizer Resources Inc.
Notes to Unaudited Condensed Consolidated Interim Financial Statements
For the six month period ended December 31, 2014
(Expressed in US Dollars)
|
8.
|
Deferred Premium on Flow-Through Shares
|
The premium paid for flow-through shares in excess of the market value of the shares without a flow-through feature is initially recognized as a liability. The liability is subsequently reduced and recorded in the consolidated statements of comprehensive loss on a pro-rata basis based on the corresponding eligible flow-through expenditures that have been incurred. The following summarizes the deferred premium liability on flow-through transactions for the period ended December 31, 2014.
|
Deferred premium on flow-through shares, June 30, 2014
|
$ | 37,145 | ||
|
Recorded to consolidated statement of comprehensive loss
|
(37,145 | ) | ||
|
Deferred premium on flow-through shares, December 31, 2014
|
$ | - |
|
9.
|
Common Stock and Additional Paid-in Capital
|
|
a)
|
On July 9, 2013, the Company issued 1,255,000 stock options to directors, officers and consultants at an exercise price of $0.11. The stock options were valued at $117,594 using the Black-Scholes pricing model with the following assumptions: risk free interest rate - 1.25%; expected volatility - 128%; dividend yield - NIL; and expected life - 5 years. These stock options vested on the grant date.
|
|
b)
|
Between July 26, 2013 and August 1, 2013, the Company closed a private placement raising $2,043,452. The Company issued 16,950,001 common stock at prices at $0.12 and $0.121 per share. The Company paid a fee of $120,674 and issued 402,000 compensation warrants at an exercise price of $0.11 and 150,000 compensation warrants at an exercise price of $0.12. Each compensation warrant expires one year from the date of issue.
|
|
c)
|
On September 19, 2013, the Company issued 750,000 stock options to directors, officers and consultants at an exercise price of $0.15. The stock options were valued at $96,675 using the Black-Scholes pricing model with the following assumptions: risk free interest rate - 1.25%; expected volatility - 127%; dividend yield - NIL; and expected life - 5 years. These stock options vested on the grant date.
|
|
d)
|
On October 9, 2013, the Company issued 250,000 stock options to a director of the Company at an exercise of $0.13 and an expiry date of October 9, 2018. The stock options were valued at $27,550 using the Black-Scholes pricing model with the following assumptions: risk free interest rate - 1.25%; expected volatility - 126%; dividend yield - NIL; and expected life - 5 years. These stock options vested on the grant date.
|
|
e)
|
On December 18, 2013 the Company closed a private placement raising a total of $1,479,024. The Company issued 11,189,215 common shares at a price of $0.132. The Company paid fees of $98,176 and issued 671,353 compensation warrants at an exercise price of $0.121. Each compensation warrant expires eighteen months from the date of issue.
|
|
f)
|
On January 10, 2014, the Company issued 4,625,000 stock options to directors and officers of the Company at an exercise of $0.18 and an expiry date of January 10, 2019. The stock options were valued at $413,475 using the Black-Scholes pricing model with the following assumptions: risk free interest rate - 1.50%; expected volatility - 110%; dividend yield - NIL; and expected life - 5 years. These stock options vested on the grant date.
|
11
Energizer Resources Inc.
Notes to Unaudited Condensed Consolidated Interim Financial Statements
For the six month period ended December 31, 2014
(Expressed in US Dollars)
|
9.
|
Common Stock and Additional Paid-in Capital - continued
|
|
g)
|
On January 15, 2014 and January 31, 2014, the Company closed a private placement raising a total of $6,906,008. The Company issued 62,384,067 common shares at a price of $0.111 and 31,192,033 common share purchase warrants with an exercise price of $0.155. Of the 31,192,033 common share purchase warrants, 29,152,033 expire on January 14, 2017, 1,450,000 expire on June 14, 2015 and 590,000 expire on January 31, 2017. The Company paid fees, including commissions, legal fees and TSX fees of $649,707 and issued 3,396,744 compensation warrants at an exercise price of $0.121. Each compensation warrant expires eighteen months from the date of issue.
|
|
h)
|
On February 6, 2014, the Company issued 250,000 stock options to a consultant of the Company at an exercise of $0.18 and an expiry date of February 6, 2019. The stock options were valued at $26,125 using the Black-Scholes pricing model with the following assumptions: risk free interest rate - 1.50%; expected volatility - 107%; dividend yield - NIL; and expected life - 5 years. These stock options vested on the grant date.
|
|
i)
|
On June 23, 2014, the Company issued 2,500,000 shares of common stock to Malagasy valued at $0.13 per share for total consideration of $325,000 and 3,500,000 common share purchase warrants valued at $320,950 using the Black-Scholes pricing model, with an exercise price of $0.14 and an expiry date of April 15, 2019 for the remaining 25% interest in the Molo Graphite Project. The Black-Scholes assumptions used were as follows: risk free interest rate - 1.53%; expected volatility - 105%; dividend yield - NIL; and expected life - 5 years.
|
|
j)
|
On July 3, 2014, the Company issued 4,800,000 stock options to directors and officers of the Company at an exercise of $0.15 and an expiry date of July 3, 2019. The stock options were valued at $404,160 using the Black-Scholes pricing model with the following assumptions: risk free interest rate - 1.50%; expected volatility - 97%; dividend yield - NIL; and expected life - 5 years. These stock options vested on the grant date.
|
|
k)
|
On September 18, 2014 a total of 571,353 broker common share purchase warrants were exercised at $0.126 per share for proceeds of $72,049.
|
|
l)
|
On September 26, 2014 the Company closed a private placement raising a total of $4,800,000. The Company issued 34,285,714 common shares at a price of $0.14. The Company paid fees, including commissions, legal fees and TSX fees of $413,225 and issued 1,928,571 compensation common share purchase warrants at an exercise price of $0.14 and an expiry date of September 26, 2016.
|
|
m)
|
On December 30, 2014 the Company closed a private placement raising a total of $588,000. The Company issued 4,900,000 common shares at a price of $0.12. The Company paid fees, including commissions, legal fees and TSX fees of $24,822 and issued 147,000 compensation common share purchase warrants at an exercise price of $0.12 and an expiry date of December 30, 2016.
|
|
n)
|
On December 16, 2014 the authorized capital of the Company was increased from an aggregate of four hundred fifty million (450,000,000) shares to six hundred fifty million (650,000,000) shares, par value of $0.001 per share, of which 640,000,000 will be deemed common shares and the remaining 10,000,000 will be deemed eligible to be divisible into classes, series and types as designated by the board of directors.
|
12
Energizer Resources Inc.
Notes to Unaudited Condensed Consolidated Interim Financial Statements
For the six month period ended December 31, 2014
(Expressed in US Dollars)
|
10.
|
Stock Options
|
On March 9, 2006, the Company filed a Form S-8 registration statement in connection with its newly adopted 2006 Stock Option Plan (the "2006 Plan") allowing for the direct award of shares or granting of stock options to acquire up to a total of 2,000,000 common shares. On December 18, 2006, February 16, 2007, July 11, 2007, September 29, 2009, May 3, 2011, March 1, 2012, February 27, 2013, December 23, 2013 and January 30, 2015, the 2006 Plan was amended to increase the stock option pool by a total of 41,000,000 additional common shares.
The following is a continuity schedule of the Company's stock options, all of which vest on the grant date:
|
Number of
Stock Options
|
Weighted-Average
Exercise Price ($)
|
|||||||
|
Outstanding and exercisable, June 30, 2013
|
27,140,000 | 0.28 | ||||||
|
Issued
|
7,130,000 | 0.16 | ||||||
|
Expired
|
(5,600,000 | ) | 0.39 | |||||
|
Cancelled
|
(200,000 | ) | 0.26 | |||||
|
Outstanding and exercisable, June 30, 2014
|
28,470,000 | 0.23 | ||||||
|
Issued
|
4,800,000 | 0.15 | ||||||
|
Cancelled
|
(200,000 | ) | 0.19 | |||||
|
Outstanding and exercisable, December 31, 2014
|
33,070,000 | 0.22 | ||||||
The following is a summary stock options outstanding as of December 31, 2014:
|
Exercise
Price ($)
|
Number of
Stock Options
|
Expiry
Date
|
|||||||
|
|
|||||||||
| 0.30 | 3,700,000 |
July 1, 2016
|
|||||||
| 0.29 | 1,695,000 |
July 13, 2016
|
|||||||
| 0.20 | 1,800,000 |
October 24, 2016
|
|||||||
| 0.21 | 2,240,000 |
December 1, 2016
|
|||||||
| 0.28 | 5,850,000 |
March 7, 2017
|
|||||||
| 0.23 | 180,000 |
May 23, 2017
|
|||||||
| 0.21 | 5,725,000 |
February 27, 2018
|
|||||||
| 0.11 | 1,205,000 |
July 9, 2018
|
|||||||
| 0.15 | 750,000 |
September 19, 2018
|
|||||||
| 0.13 | 250,000 |
October 9, 2018
|
|||||||
| 0.18 | 4,625,000 |
January 10, 2019
|
|||||||
| 0.18 | 250,000 |
February 6, 2019
|
|||||||
| 0.15 | 4,800,000 |
July 3, 2019
|
|||||||
|
33,070,000
|
|||||||||
13
Energizer Resources Inc.
Notes to Unaudited Condensed Consolidated Interim Financial Statements
For the six month period ended December 31, 2014
(Expressed in US Dollars)
|
11.
|
Warrants
|
The following is a continuity schedule of the Company's common share purchase warrants:
|
Number
of Warrants
|
Weighted-Average
Exercise Price ($)
|
|||||||
|
Outstanding and exercisable, June 30, 2013
|
3,513,599 | 0.46 | ||||||
|
Issued
|
39,312,130 | 0.16 | * | |||||
|
Expired
|
(270,000 | ) | 0.19 | |||||
|
Outstanding and exercisable, June 30, 2014
|
42,555,729 | 0.16 | * | |||||
|
Issued
|
2,075,571 | 0.14 | ||||||
|
Exercised
|
(571,353 | ) | 0.12 | * | ||||
|
Expired
|
(892,028 | ) | 0.20 | * | ||||
|
Outstanding and exercisable, December 31, 2014
|
43,167,919 | 0.15 | * | |||||
* Amount represents the converted USD exercise price
The following is a summary common share purchase warrants outstanding as of December 31, 2014:
|
Exercise
|
Number of | Expiry | ||||||||
|
Price ($)
|
Warrants
|
Date | ||||||||
| 0.12 | (b) | 100,000 |
June 19, 2015
|
|||||||
| 0.12 | (b) | 3,396,744 |
July 14, 2015
|
|||||||
| 0.16 | (c) | 1,450,000 |
July 14, 2015
|
|||||||
| 0.14 | 1,928,571 | September 26, 2016 | ||||||||
| 0.18 | (a) | 2,903,571 |
November 15, 2016
|
|||||||
| 0.12 | 147,000 | December 30, 2016 | ||||||||
| 0.16 | (c) | 29,152,033 |
January 14, 2017
|
|||||||
| 0.16 | (c) | 590,000 |
January 31, 2017
|
|||||||
| 0.14 | 3,500,000 | April 15, 2019 | ||||||||
| 43,167,919 |
|
(a)
|
On December 24, 2013, the Company re-priced and extended the term of the common share purchase warrants from an expiry of November 15, 2015 and an exercise price of $0.23 to November 15, 2016 and $0.18, respectively.
|
|
(b)
|
The exercise price is CAD$0.14.
|
|
(c)
|
The exercise price is CAD$0.18.
|
14
Energizer Resources Inc.
Notes to Unaudited Condensed Consolidated Interim Financial Statements
For the six month period ended December 31, 2014
(Expressed in US Dollars)
|
11.
|
Warrants - continued
|
The Company has accounted for the warrant liability in accordance with ASC Topic 815. These warrants are considered derivative instruments as they were issued in a currency other than the Company's functional currency of the US dollar. The estimated fair value of warrants accounted for as liabilities was determined on the date of issue and are marked to market at each financial reporting period. The change in fair value of the warrant liability is recorded in the consolidated statements of operations and comprehensive loss as a gain or loss and estimated using the Binomial model with the following weighted average inputs:
|
December 31, 2014
|
June 30, 2014
|
|||||||
|
Exercise price
|
$ | 0.155 | $ | 0.134 | ||||
|
Risk free rate
|
1.02 | % | 1.19 | % | ||||
|
Expected volatility
|
91.3 | % | 88 | % | ||||
|
Expected Dividend yield
|
Nil
|
Nil
|
||||||
|
Expected life (in years)
|
1.97 | 2.48 | ||||||
|
December 31, 2014
|
June 30, 2014 | |||||||
|
Beginning balance, derivative warrant liability
|
$ | 1,830,151 | $ | - | ||||
|
Origination of derivative warrant liability January 2014
|
- | 1,806,865 | ||||||
|
(Gain)/Loss on change in fair value of derivative warrant liability
|
(489,119 | ) | 23,286 | |||||
|
Ending balance, derivative warrants liability
|
$ | 1,341,032 | $ | 1,830,151 | ||||
|
12.
|
Loss Per Share
|
Basic and diluted loss per share is computed using the weighted average number of common stock outstanding. Diluted loss per share and the weighted average number of shares of common stock exclude all potentially dilutive shares since their effect is anti-dilutive. As at December 31, 2014, there were a total of 76,237,919 (December 31, 2013: 33,181,952) potentially dilutive stock options and common share purchase warrants outstanding.
|
13.
|
Commitments
|
The Company was required to spend and renounce $4,095,631 (CAD$4,761,990) on qualifying Canadian Exploration Expenditures before December 31, 2014. The Company has met this commitment.
15
Energizer Resources Inc.
Notes to Unaudited Condensed Consolidated Interim Financial Statements
For the six month period ended December 31, 2014
(Expressed in US Dollars)
|
14.
|
Segmented Reporting
|
The Company operates one operating segment, that being the exploration and development of mineral properties. The Company's Chief Executive Officer, President and Chief Operating Officer and Chief Financial Officer are the operating decision-makers, and direct the allocation of resources to geographic segments. No revenue has been generated by these properties. A summary of mineral exploration expenses by geographic area is as follows:
|
For the period ended December 31, 2014
|
Madagascar
|
Canada
|
Total
|
|||||||||
|
Mineral exploration expense
|
$ | 1,666,360 | $ | 1,567,518 | $ | 3,233,878 | ||||||
|
For the period ended December 31, 2013
|
Madagascar
|
Canada
|
Total
|
|||||||||
|
Mineral exploration expense
|
$ | 871,238 | $ | 713,052 | $ | 1,584,290 | ||||||
As at December 31, 2014, $54,599 (June 30, 2014: $58,110) in cash was held in Africa and $1,303,972 (June 30, 2014: $1,192,273) in cash held in Canada. All of the Company's remaining assets were held in Canada.
16
As used in this quarterly report, “we”, “us”, “our”, “Energizer Resources”, “Energizer”, “Company” or “our company” refers to Energizer Resources Inc. and all of its subsidiaries. The term NSR stands for Net Smelter Royalty.
ITEM 2. MANAGEMENT’S DISCUSSION AND ANALYSIS OF FINANCIAL CONDITION AND RESULTS OF OPERATIONS
Included in this report are "forward-looking" statements, within the meaning of the Private Securities Litigation Reform Act of 1995 ("PSLRA") as well as historical information. Certain statements included in this Form 10-Q, including, without limitation, statements related to anticipated cash flow sources and uses, and words including but not limited to “anticipates”, “believes”, “plans”, “expects”, “future” and similar statements or expressions, identify forward looking statements. Examples of forward-looking statements include, but are not limited to: (a) projections of our revenues, capital expenditures, growth, prospects, dividends, capital structure and other financial matters; (b) statements of our plans and objectives; (c) statements of our future economic performance; (d) statements of assumptions underlying other statements and statements about us and our business relating to the future; and (e) any statements using the words "believes," "budget," "target," "goal," "anticipate," "expect," "plan," "outlook," "objective," "may," "project," "intend," "estimate," or similar expressions. Any forward-looking statements herein are subject to certain risks and uncertainties in the business of Energizer Resources Inc. including but not limited to, planned capital expenditures, potential increases in prospective production costs, future cash flows and borrowings, pursuit of potential acquisition opportunities, the possibility that the industry may be subject to future regulatory or legislative actions (including additional taxes, changes in environmental regulation, changes in Madagascar French civil law and traditional Malagasy law, and disclosure requirements under the Dodd-Frank Wall Street Reform, Consumer Protection Act and the Jumpstart our Business Startups Act of 2012), our financial position, business strategy and other plans, objectives for future operations, difficulties of hiring or retaining key personnel and any changes in current accounting rules, all of which may be beyond the control of our Company. Our actual results could differ materially from those anticipated in these forward-looking statements as a result of certain factors, including those set forth therein. We claim the protection afforded by the safe harbor for forward-looking statements provided by the PSLRA.
Management’s Discussion and Analysis of Results of Financial Condition and Results of Operations (“MD&A”) should be read in conjunction with our financial statements included herein. Further, this quarterly report on Form 10-Q should be read in conjunction with our Financial Statements and Notes to Financial Statements included in our fiscal 2014 Annual Report on Form 10-K for the year ended June 30, 2014, filed with the Securities and Exchange Commission on September 29, 2014. Our actual results could differ materially from those anticipated by the forward-looking statements due to important factors and risks including, but not limited to, those set forth under “Risk Factors” in Part I, Item 1A of our Annual Report on Form 10-K. In addition, the foregoing factors may affect generally our business, results of operations and financial position. Forward-looking statements speak only as of the date the statement was made. We do not undertake and specifically decline any obligation to update any forward-looking statements.
Our financial statements have been prepared in accordance with United States generally accepted accounting principles. We urge you to read this report in conjunction with the risk factors described herein.
ITEM 1. DESCRIPTION OF BUSINESS
BACKGROUND – COMPANY OVERVIEW
Our company is a State of Minnesota, United States of America incorporated entity. Our fiscal year end is June 30. Our principal business is the acquisition and exploration of mineral resources. During fiscal 2008, we incorporated Energizer Resources (Mauritius) Ltd., a Mauritius subsidiary and Energizer Resources Madagascar Sarl, a Madagascar subsidiary. During fiscal 2009, we incorporated THB Venture Ltd., a Mauritius subsidiary to hold the interest in Energizer Resources Minerals Sarl, a Madagascar subsidiary, which holds the Green Giant Property in Madagascar (see note 7). During fiscal 2012, we incorporated Madagascar-ERG Joint Venture (Mauritius) Ltd., a Mauritius subsidiary and ERG (Madagascar) Sarl, a Madagascar subsidiary. ERG (Madagascar) Sarl is 100% owned by Madagascar-ERG Joint Venture (Mauritius) Ltd. which is now owned 100% by Energizer Resources (Mauritius) Ltd. ERG (Madagascar) Sarl holds the Malagasy Joint Venture Ground. During fiscal 2014, we incorporated 2391938 Ontario Inc., an Ontario, Canada subsidiary. In addition, we own a 25% interest in Ampanihy Exploration Ltd, a Mauritius company who holds a 100% interest in Ampex Sarl, a Madagascar company. Ampex Sarl holds the non-industrial mineral rights on certain Green Giant permits. We have not yet fully determined whether its properties contain mineral reserves that are economically recoverable.
17
We have not had any bankruptcy, receivership or similar proceeding since incorporation. Except as described below, there have been no material reclassifications, mergers, consolidations or purchases or sales of any significant amount of assets not in the ordinary course of business since the date of incorporation.
On December 16, 2014 the authorized capital of the Company was increased from an aggregate of four hundred fifty million (450,000,000) shares to six hundred fifty million (650,000,000) shares, par value of $0.001 per share, of which 640,000,000 will be deemed common shares and the remaining 10,000,000 will be deemed eligible to be divisible into classes, series and types as designated by the board of directors.
Summary of Our Business
We are an exploration stage company engaged in the search for graphite, vanadium, gold, uranium and other minerals. We have an interest in properties located in the African country of Madagascar and Canada in the Province of Québec. Under the definitions of U.S. Guidelines, none of the properties in which we hold an interest have economically feasible known mineral reserves of any kind at this time. As such, the work programs planned by us are exploratory in nature.
Our executive offices are currently located at 520–141 Adelaide Street West, Toronto, Ontario, Canada M5H 3L5. Our telephone number is (416) 364-4911. We maintain a website at www.energizerresources.com (which website is expressly not incorporated by reference into this filing). These offices are leased on a month-to-month basis, and our monthly rental payments are currently approximately $8,500 per month.
Further details regarding each of our Madagascar properties, although not incorporated by reference, including the comprehensive geological report prepared in compliance with Canada’s National Instrument 43-101 - Standards of Disclosure for Mineral Properties (“NI 43-101”) on our Molo Graphite Project and separately our technical report on our Green Giant Property in Madagascar can be found on our Company’s website: www.energizerresources.com (which website is expressly not incorporated by reference into this filing) or in our Company’s Canadian regulatory filings on www.sedar.com (which website and content is expressly not incorporated by reference into this filing). U.S. investors are cautioned that mineral resources that are not mineral “reserves” do not have demonstrated economic viability and there can be no assurance that any part of a mineral deposit included in the measured and indicated categories will ever be converted into a reserve. Please also refer to “Cautionary Note Regarding Resource and Reserve Calculation” discussed below.
Cautionary Note
Due to the nature of our business, we anticipate incurring operating losses for the foreseeable future. We base this expectation, in part, on the fact that very few mineral properties in the exploration stage ultimately develop into producing profitable mines. Our future financial results are also uncertain due to a number of factors, some of which are outside our control. These factors include, but are not limited to: our ability to raise additional capital as required; the market price for graphite, vanadium, gold, uranium and for any other minerals which we may find; the stability of, and our ability to obtain exploration and mining permits, in the jurisdictions where we operate; the results of our proposed exploration programs on our mineral properties; environmental regulations that may adversely impact cost and operations; and our ability to find joint venture partners, as needed, for the development of our property interests. If we are successful in completing an equity financing, as necessary, existing shareholders will experience dilution of their interest in our company. In the event we are not successful in raising additional financing, we anticipate that we will not be able to proceed with our business plan. In such a case, we may decide to discontinue our current business plan and seek other business opportunities in the resource sector. During this period, should it ever arise, we will need to maintain our periodic filings with the appropriate regulatory authorities and, as such, will incur legal and accounting costs. In the event no other such opportunities are available and we cannot raise additional capital to sustain operations, we may be forced to discontinue our business altogether. We do not have any specific alternative business opportunities in mind and have not planned for any such contingency.
Due to our lack of operating history and present inability to generate revenues, our auditors have stated their opinion in the notes to our audited financial statements in our annual report on Form 10-K and we have included in Note 1 of this quarterly report that there currently exists doubt as to our ability to continue as a going concern.
18
Properties
Cautionary Note Regarding Resource and Reserve Calculation – Energizer Resources Inc. reports mineral reserve estimates in accordance with U.S. SEC Industry Guide 7. Canadian investors should review the mineral resource estimates prepared in accordance with NI 43-101 found in the Company’s technical report titled "Molo Graphite Project Fotadrevo Province of Toliara, Madagascar Preliminary Economic Assessment Technical Report Update” dated April 12, 2013 (prepared by DRA Mineral Projects Pty Ltd and authored by John Hancox, Pri.Sc.Nat, Desmond Subramani, Pri.Sc.Nat, Dave Thompson and Glenn Bezuidenhout, all Qualified Persons as defined by NI 43-101, and independent of Energizer Resources for the purposes of NI 43-101 requirements) and the technical report titled “Molo Graphite Project, Fotadrevo, Province of Toliara, Madagascar” dated September 25, 2014 (prepared by Philip John Hancox, Pr.Sci.Nat. and Desmond Subramani, Pr.Sci.Nat. who are Qualified Persons as defined by NI 43-101, and independent of Energizer Resources for the purposes of NI 43-101 requirements) in respect of the Molo Project and the Company’s technical report titled “Green Giant Property Technical Report Update NI 43-101, Fotadrevo, Province of Toliara, Madagascar” (prepared by Pierre Desautels, P.Geo., Todd McCracken, P.Geo., and Andy Holloway, P.Eng., C.Eng. who are Qualified Persons as defined by NI 43-101, and independent of Energizer Resources for the purposes of NI 43-101 requirements) dated June 24, 2010, in respect of the Green Giant Property. Canadian investors should refer to the technical reports for a discussion in respect of certain key assumptions, parameters and methods in respect to the mineral resource disclosure. U.S. investors are cautioned that mineral “resources” that are not mineral “reserves” do not have demonstrated economic viability and there can be no assurance that any part of a mineral deposit included in the measured and indicated categories will ever be converted into a reserve.
The disclosure in this report uses mineral resource classification terms that comply with reporting standards in Canada and are made in accordance with NI 43-101. NI 43-101 establishes standards for all public disclosure an issuer makes of scientific and technical information concerning mineral projects. These standards differ significantly from the mineral reserve disclosure requirements of the SEC set forth in Industry Guide 7. Consequently, information regarding mineralization contained in this report is not comparable to similar information that would generally be disclosed by U.S. companies in accordance with the rules of the SEC. Under SEC standards, mineralization may not be classified as a “reserve” unless the determination has been made that the mineralization could be economically and legally produced or extracted at the time the reserve determination is made. Among other things, all necessary permits would be required to be in hand or issuance imminent in order to classify mineralized material as reserves under the SEC standards. This report uses the terms “measured mineral resources,” “indicated mineral resources” and “inferred mineral resources” to comply with the reporting standards in Canada. The SEC does not recognize mineral resources and U.S. companies are generally not permitted to disclose mineral resources of any category in documents they file with the SEC. Investors are specifically cautioned not to assume that any part or all of the mineral deposits in these categories will ever be converted into mineral reserves as defined in NI 43-101 or Industry Guide 7. Further, “inferred mineral resources” have a great amount of uncertainty as to their existence and as to whether they can be mined legally or economically. Therefore, investors are also cautioned not to assume that all or any part of an inferred resource exists. It cannot be assumed that all or any part of “measured mineral resources,” “indicated mineral resources,” or “inferred mineral resources” will ever be upgraded to a higher category. Investors are cautioned not to assume that any part of the reported “measured mineral resources,” “indicated mineral resources,” or “inferred mineral resources” in this report are economically or legally mineable. For the above reasons, information contained in this report containing descriptions of our mineral resource estimates are not comparable to similar information made public by U.S. companies subject to the reporting and disclosure requirements of the SEC.
Mr. Craig Scherba, P.Geo., President and COO is the qualified person who reviewed and approved the technical information provided in this report.
Properties
Madagascar Properties
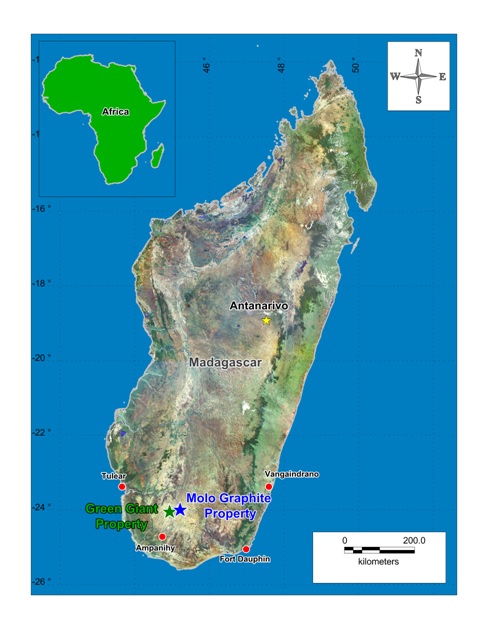
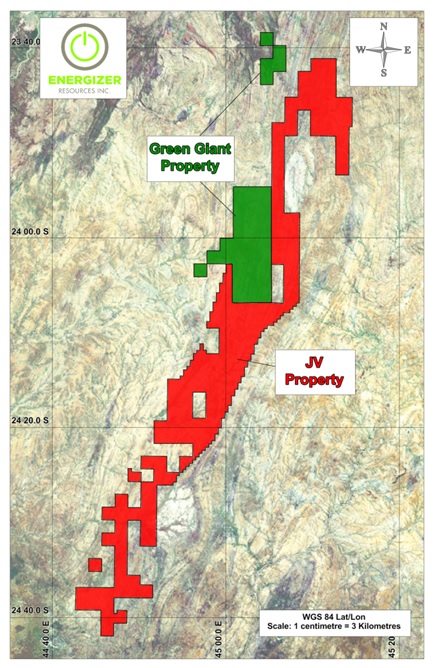
Molo Graphite Project, Southern Madagascar, Africa
On December 14, 2011, we entered into a Definitive Joint Venture Agreement ("JVA") with Malagasy Minerals Limited ("Malagasy"), a public company on the Australian Stock Exchange, to acquire a 75% interest to explore and develop a group of industrial minerals, including graphite, vanadium and approximately 25 other minerals. The land position covers 2,119 permits and 827.7 square kilometres and is mostly adjacent to the south and east of our 100% owned Green Giant Property. We paid $2,261,690 and issued 7,500,000 common shares valued at $1,350,000.
On October 24, 2013, we signed a Memorandum of Understanding ("MOU") with Malagasy to acquire the remaining 25% interest in land position. On April 16, 2014, we signed a Sale and Purchase Agreement and a Mineral Rights Agreement with Malagasy to acquire the remaining 25% interest. We made the following payments: CAD$400,000; issued 2,500,000 common shares subject to a 12 month voluntary vesting period and valued at $325,000; and issued 3,500,000 common share purchase warrants. We will make a cash payment of CAD$700,000 and issue 1,000,000 common shares within five days of completion of a bankable feasibility study (“BFS”) or the formal announcement of a decision to mine; and a cash payment of CAD$1,000,000 within five days of the commencement of commercial production. Malagasy retains a 1.5% net smelter return royalty ("NSR"). We also acquired a 100% interest to the industrial mineral rights on approximately 1-1/2 additional claim blocks comprising 10,811 hectares to the east and adjoining the Molo Graphite Project. We will continue to own a 100% interest in the industrial mineral rights, which includes our Canadian NI 43-101 vanadium resource estimate, comprising an indicated mineral resource of 49.5 million tonnes at an average grade of 0.693% vanadium pentoxide (V2O5) and an inferred mineral resource of 9.7 million tonnes at an average grade of 0.632% V2O5 at a cut-off of 0.5% V2O5. Canadian investors should refer to the technical reports for a discussion in respect of certain key assumptions, parameters and methods in respect to the mineral resource disclosure. Please also refer to “Cautionary Note Regarding Resource and Reserve Calculation” discussed above.
19
Green Giant Property, Madagascar
During 2007 we acquired a 75% interest in the property. We paid $765,000, issued 2,500,000 common shares and 1,000,000 now expired common share purchase warrants to enter into a joint venture agreement for the Green Giant Property with Madagascar Minerals and Resources Sarl ("MMR").
On July 9, 2009, we acquired the remaining 25% interest for $100,000. MMR retains a 2% NSR. The NSR can be purchased at our option, for $500,000 in cash or common shares for the first 1% and at a price of $1,000,000 in cash or common shares for the second 1%.
On April 16, 2014, we signed a Joint Venture Agreement with Malagasy, whereby Malagasy acquired a 75% interest for non-industrial minerals on the property. We retain remaining 25% and have a free carried interest through the BFS. No specific consideration was received for this transaction as it was part of the Molo Graphite Project transaction dated April 16, 2014.
Further details on exploration programs carried out on all our Company’s properties can be found below.
Canadian Property
Sagar Property – Romanet Horst, Labrador Trough, Québec, Canada
During 2006, we purchased from Virginia Mines Inc. ("Virginia") a 100% interest in 382 claims located in northern Quebec, Canada. Virginia retains a 2% NSR on certain claims within this property with other unrelated vendors holding a 1% NSR on certain claims, and a 0.5% NSR on other claims. For the other vendor's NSR, we have the right to buy back half of the 1% NSR for $200,000 and half of the 0.5% NSR for $100,000.
On July 31, 2014 we revised our February 28, 2014 agreement with Honey Badger Exploration Inc. (“TUF”), a public company related by common management, to sell an interest in the Sagar Property. Under the revised agreement, in order for TUF to acquire an initial 35% interest in the property, we will receive CAD$150,000 and TUF will spend CAD$1,500,000 developing the property. TUF can earn further percentage interests up to 75% over a four year period by spending a total of CAD$9,000,000, paying the Company CAD$900,000 and issuing to us the lesser of 15% of its issued and outstanding shares or 35,000,000 shares. Once these commitments have been met, TUF can acquire the remaining interest by paying us an additional CAD$2,000,000 and issuing the lesser of 19.5% of TUF outstanding shares or up to 60,000,000 shares, including all previously issued shares.
Competitive Conditions in our Industry
The mineral exploration and mining industry is competitive in all phases of exploration, development and production. We compete with a number of other entities and individuals in the search for, and acquisition of, attractive mineral properties. As a result of this competition, the majority of which is with companies with greater financial resources than us, we may not in the future be able to acquire attractive properties on terms our management considers acceptable. Furthermore, we compete with other resource companies, many of whom have greater financial resources and/or more advanced properties that are better able to attract equity investments and other capital. Factors beyond our control may affect the marketability of minerals mined or discovered by us.
Employees
As of February 9, 2015, we had 10 total employees, 7 full-time and 3 part-time employees. In addition to our full time employees, we engage consultants to serve several important managerial and non-managerial functions for us.
20
MADAGASCAR PROPERTIES
21
Molo Graphite Property Description and Location
The “Molo Graphite Property” is comprised of a portion of or all of 40 mineral permits. The properties are located in the District of Toliara and are referenced as TN 3,432,P(R); TN 5,394, P(R); TN 13,064 P(R); TN 13,811 P(R); TN 14618 P(R), TN 14,619 P(R); TN 14,620 P(R); TN 14,622 P(R); TN 14,623 P(R); TN 16,747 P(R); TN 16,753 P(R); TN 19,003 P(R); TN 19,851 P(R); TN 19,932 P(R); TN 19,934 P(R); TN 19,935 P(R); TN 21,059 P(R); TN 21,060 P(R); TN 21,061 P(R); TN 21,062 P(R); TN 21,063 P(R); TN 21,064 P(R); TN 24,864 P(R); TN 25,605 P(R); TN 25,606 P(R); TN 28,340 P(R); TN 28,346 P(R); TN 28,347 P(R); TN 28,348 P(R); TN 28,349 P(R); TN 28,352 P(R); TN 28,353 P(R); TN 29,020 P(R); TN 31,734 P(R); TN 31,735 P(R); TN 38,323 P(R); TN 38,324 P(R); TN 38,325 P(R); TN 38,392 P(R); and TN 38,469 P(R) as issued by the Bureau de Cadastre Minier de Madagascar (“BCMM”) pursuant to the Mining Code 1999 (as amended) and its implementing decrees. The total land position is 940.2 sq. kilometres. This property can be accessed by both air and road.
22
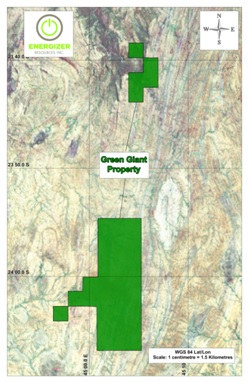
Green Giant Property Description and Location
The Green Giant Property is comprised of 6 mineral permits. The properties are located in the District of Toliara and are referenced as TN 12,306,P(R); TN 12,814, P(R); TN 12,887 P(R); TN 12,888 P(R); TN 13,020 P(R); TN 13,021 P(R) as issued by the Bureau de Cadastre Minier de Madagascar (“BCMM”) pursuant to the Mining Code 1999 (as amended) and its implementing decrees. The total land position is 225 sq. kilometres. This property can be accessed by both air and road.
Agreements
Molo Graphite Project, Southern Madagascar, Africa
On December 14, 2011, we entered into a Definitive Joint Venture Agreement ("JVA") with Malagasy Minerals Limited ("Malagasy"), a public company on the Australian Stock Exchange, to acquire a 75% interest to explore and develop a group of industrial minerals, including graphite, vanadium and approximately 25 other minerals. The land position covers 2,119 permits and 827.7 square kilometres and are mostly adjacent to the south and east of our 100% owned Green Giant Property. We paid $2,261,690 and issued 7,500,000 common shares valued at $1,350,000.
On April 16, 2014, we signed a Sale and Purchase Agreement and a Mineral Rights Agreement with Malagasy to acquire the remaining 25% interest. We made the following payments: CAD$400,000; issued 2,500,000 common shares subject to a 12 month voluntary vesting period and valued at $325,000; and issued 3,500,000 common share purchase warrants. We will make a cash payment of CAD$700,000 and issue 1,000,000 common shares within five days of completion of a BFS or the formal announcement of a decision to mine; and a cash payment of CAD$1,000,000 within five days of the commencement of commercial production. Malagasy retains a 1.5% net smelter return royalty ("NSR"). We also acquired a 100% interest to the industrial mineral rights on approximately 1-1/2 additional claim blocks comprising 10,811 hectares to the east and adjoining the Molo Graphite Project.
DRA Agreement Signed for Ability to Develop and Build Mine
During January 2012, we signed a formal agreement with South Africa's DRA Mineral Projects (“DRA”), a world-leading process engineering and mining project development management firm, for the development of our projects in Madagascar. Specific focus will be on the development of vanadium and graphite minerals. This partnership provides us with the ability to both build and manage a mining operation. It also provides DRA the option to purchase up to 5% of our Company through private placement at current market conditions.
23
Madagascar Historical Exploration Programs
The Green Giant Property displays extensive gossans outcroppings at surface. An examination of part of this property revealed several large areas covered with gossanous boulders, which are believed to overlie massive sulphide mineralization. Phases of the exploration projects were managed by our company’s President and COO, Craig Scherba, P. Geol., who at the time was one of our outside consultant geologists. We conducted a first phase of exploration from September to November 2007 that included the following activities:
|
●
|
Stream Sediment sampling of all stream on the property area
|
|
●
|
Detailed Geological mapping over selected startigraphic horizons
|
|
●
|
Reconnaissance geological mapping over the entire property
|
|
●
|
Soil sampling over selected target areas and prospecting over selected target areas
|
|
●
|
Limited trenching over selected targets
|
|
●
|
Construction of a cinder block base camp
|
|
●
|
Construction of a one kilometre long surfaced airstrip
|
|
●
|
Repair and surfacing of the access road from base camp to the airstrip
|
|
●
|
Airborne geophysical surveying
|
During March 2008-June 2008, a full field exploration program following up on the airborne geophysical survey and results of the 2007 exploration program was implemented. This exploration consisted of the following:
|
●
|
Infill stream sediment sampling
|
|
●
|
Detailed Geological mapping over selected stratigraphic horizons
|
|
●
|
Prospecting over selected target areas
|
|
●
|
Grid emplacement over selected target areas
|
|
●
|
Ground-based magnetometer and frequency domain EM surveys
|
|
●
|
Soil sampling over selected target areas
|
After reviewing the analytical data from the March 2008- June 2008 program, additional exploration was conducted from July 2008 to September 2008 to prepare for a drill program. This exploration consisted of the following:
|
●
|
Infill stream sediment sampling
|
|
●
|
Detailed geological mapping over selected stratigraphic horizons
|
|
●
|
Prospecting over selected target areas with the aid of a mobile XRF analyzer
|
Based on compiled analytical results obtained from the various exploration programs, a drill program was initiated on the property from September 2008-November 2008. This exploration program consisted of the following:
|
●
|
Prospecting over selected target areas with the aid of a mobile XRF analyzer
|
|
●
|
Ground-based scintillometer surveying over selected target areas
|
|
●
|
Diamond drilling of 31 holes over 4,073 metres
|
Based on early indications for vanadium on the property, another exploration program was initiated on the Green Giant Property during the spring of 2009. The program (completed between April 2009-July 2009) consisted of an extensive X-Ray Fluorescence analysis (XRF) soil sampling program coupled with mechanical trenching and scintillometer surveys over possible areas of vanadium enrichment and new areas, defined by the soil XRF survey.
We initiated a vanadium drill program during September 2009-December 2009 consisting of the following:
|
●
|
XRF soil sample analyses (8,490 samples) on lines 200 metres apart covering 18 kilometre strike length
|
|
●
|
Scintillometer surveying (112 line kilometres) on lines 200 metres apart over an 18 kilometre strike length
|
|
●
|
Trenching (140 trenches for 17,105 metres)
|
|
●
|
Diamond drilling of 54 diamond drill holes over 8,931 metres
|
The exploration programs to date resulted in the delineation of two vanadium pentoxide (V2O5) deposits (named the Jaky and Manga), characterized by two separate categories: oxide and primary.
Based on the results of the September 2009-December 2009 program, we conducted an additional exploration program on the property from April 2010-July 2010. This program consisted of the following activities:
|
●
|
Diamond drilling of 46 diamond drill holes over 8,952 metres
|
|
●
|
Prospecting over selected target areas with the aid of a mobile XRF analyzer (20 grab samples)
|
|
●
|
Geologic mapping over the Manga and Mainty deposits at 1:5000 scale
|
|
●
|
ERT ground geophysical survey (5.64 km)
|
|
●
|
MAG ground geophysical survey (169.53 km)
|
|
●
|
Gradient Array EM ground geophysical survey (128.82 km)
|
24
In 2011, the identification of graphite in the Manga, Jaky and Mainty zones led our geologists to conduct a reconnaissance exploration program (Phase I program) on the properties in September, 2011. The goal of this exploration program was to delineate new graphitic trends, and compare them to those associated with vanadium mineralization. This program consisted of the following activities:
|
●
|
Diamond drilling of 10 holes over 1,157.5 metres
|
|
●
|
Trenching (16 trenches for 1,912 metres)
|
|
●
|
Prospecting over selected target areas
|
An additional reconnaissance exploration program was conducted from November 2011-December, 2011 (Phase II program). The purpose of this program was to ascertain the industrial mineral potential on the Joint Venture Ground, and further drill testing of graphitic trends on the Green Giant Property. This program consisted of the following:
|
●
|
Diamond drilling of 20 holes over 2,842 metres
|
|
●
|
Prospecting over selected target areas
|
|
●
|
EM31 ground geophysical survey over selected target areas (160.5 km)
|
The discovery of graphite mineralization from the 2011 exploration programs resulted in the initiation of a resource delineation drill program from May 2012-August 2012. This program consisted of the following:
|
●
|
Trenching (18 trenches for 2,100 metres)
|
|
●
|
Diamond drilling of 41 diamond drill holes over 8,459 metres
|
The resource delineation drill program identified that graphite mineralization could be divided into a high grade zone (6 to 10% carbon) that produces small to large graphite flakes, and a low grade zone (4 to 6% carbon) that produces large to jumbo graphite flakes. A bulk sampling program was undertaken in May 2013 with the purpose of collecting two separate samples, in order to test the nature of the low-grade and high-grade deposits to see if they have different requirements. The two bulk samples were submitted for metallurgical test work, which is deemed to be representative of the future plant feed, and hence could be used for a Bankable Feasibility Study going forward. In order to be representative, an external geological consultant determined a sample size of 100 tonnes each was deemed sufficient.
The primary objectives for analyzing the bulk samples at a 'pilot plant scale' were as follows:
|
●
|
Confirm the robustness of the proposed metallurgical flow-sheet that was first developed on a laboratory scale under continuous conditions
|
|
●
|
Develop process design criteria for the Full Feasibility Study
|
|
●
|
Generate large samples of concentrate for evaluation by potential off take partners
|
The metallurgical results confirmed the proposed flow sheet, and that the graphite flakes from the Molo deposit can be upgraded to high-grade graphite concentrate by means of simple flotation.
Bulk sample highlights:
|
●
|
The average mass recovery into the large and extra-large flake category (greater than +80 mesh) was 43.5% based on the results of fifteen size fraction analyses of the combined concentrate;
|
|
●
|
The average grade of the extra-large flake (greater than +48 mesh) was 97.7%Ct (Total Carbon)
|
|
●
|
The average grade of the large flake (greater than +80 mesh) was 97.4%Ct;
|
|
●
|
The average grade of the medium flake (greater than +200 mesh) was 96.7% Ct; and
|
|
●
|
The majority of the impurities reported to the small flake size fractions (-400 mesh).
|
The average total carbon content of twelve pilot plant surveys was 93.7% Ct at an average carbon recovery of 90.3%. The average composition of the combined concentrate of fifteen size fraction analyses is shown in the table below.
25
Molo Average Flake Size Analysis
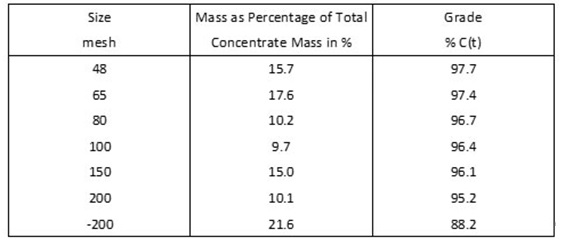
A part of the full feasibility study, the Company conducted an infill resource delineation program from May 2014-June 2012. This program consisted of the following:
| ● |
Trenching (9 trenches for 1,876 metres)
|
| ● |
Diamond drilling of 32 diamond drill holes over 2,063 metres
|
Madagascar Infrastructure
|
·
|
Road Access
|
Access to the Company’s Molo Graphite Deposit from Toliara, starts with a 70 km paved road to the village of Andranovory. From Andranovory, secondary all-season roads continue to Betioky, a distance of 93 km. From Betioky, the Molo Graphite Deposit can be reached from Ambatry to Fotadrevo, a distance of 105 km, for an overall total of 268 km, or from Betioky to Ejeda then onwards to Fotadrevo, a distance of 161 km, for an overall total of 324 km. The second route from Ejeda to Fotadrevo is used by heavy transport trucks and by all vehicles during portions of the rainy season, as the other route can become impassable. At the height of the rainy season, both routes to Fotadrevo may become impassable. From Fotadrevo, the Molo Graphite Deposit may be reached by a fairly well maintained dirt track. The map below shows the road access to the Molo Graphite Deposit from the town of Toliara.
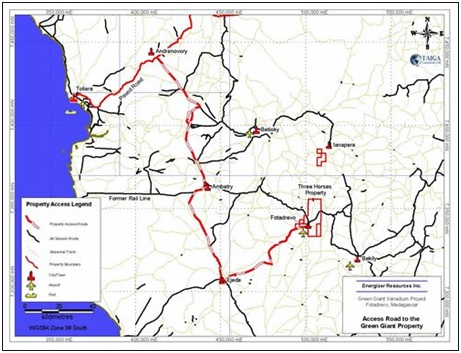
Map of Road Structure from Toliara to Fotadrevo
26
Air Access
With the upgrading of an existing airstrip at Fotadrevo to an all-weather airstrip during the 2008 exploration program, our Madagascar properties are accessible year-round by private aircraft out of Antananarivo, except under special circumstance caused by continuous or multiple days of heavy rain. Flying times to Fotadrevo are approximately 2.5 hours from Antananarivo and 45 minutes from Toliara.
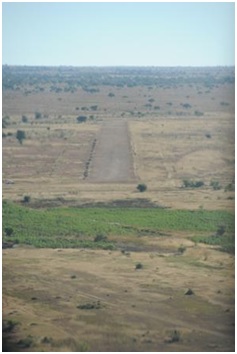
Photo of the Landing Strip at Fotadrevo
Antananarivo is currently serviced by Air France (Paris), South African Airways (Johannesburg), and Air Mauritius (Mauritius). Air Madagascar also provides service to Paris, Johannesburg, Mauritius, Nairobi, and Réunion Island. Domestically, Air Madagascar has regularly scheduled jet and propjet flights throughout the country, including daily flights between Antananarivo and Toliara.
The village of Fotadrevo, where we have our base camp, is located to the west of the Molo Graphite Deposit. The village has been a labour source during our Company’s exploration programs, and will likely provide a portion of the workforce during future exploration and development. A few basic goods are commercially available in the village, however, the main centre for support of exploration and development are the cities of Toliara and Antananarivo. Two 40 kVA diesel-powered generators provide power to the camp facility.
A cellular telephone tower is located in Fotadrevo, which provides phone and internet coverage. No potable water is currently available within the project area. A well 123 millimetre in diameter has been drilled to a depth of 42 metres within the camp compound, which provides non-potable water for the camp.
27
Graphite Market and Pricing
Market Overview
According to the latest Industrial Minerals magazine data, the natural graphite market is 1,015,100 tonnes of which roughly 55% is flake and 45% is low grade amorphous (or 582,800 flake, 428,300 amorphous, 4,000 vein). Graphite is produced globally, however China currently accounts for most of the graphite production with a market share of 77%. Two tables listing the current major production countries of flake and amorphous graphite are below (Source: Natural Graphite Report 2012, Industrial Minerals, www.indmin.com):
|
Country
|
Flake output
|
|
China
|
380,000
|
|
Brazil
|
96,000
|
|
India
|
35,000
|
|
North Korea
|
30,000
|
|
Canada
|
21,000
|
|
Norway
|
8,000
|
|
Zimbabwe
|
5,000
|
|
Madagascar
|
4,000
|
|
Russia
|
2,000
|
|
Ukraine
|
1,500
|
|
Germany
|
300
|
|
Total
|
582,800
|
|
Country
|
Amorphous output
|
|
China
|
400,000
|
|
Austria
|
16,000
|
|
Mexico
|
12,000
|
|
Turkey
|
300
|
|
Total
|
428,300
|
China produces 77% of the world’s graphite, however approximately half of its production is low grade amorphous. The graphite industry in China is undergoing fundamental reforms. China is protecting its domestic supply and has imposed a combined 37% export duty and value added tax. Furthermore, China is consolidating and closing a large number of mines, between 180-200, to preserve graphite resources and address environmental concerns.
Current Demand
Graphite has many wide-ranging uses from refractories to anodes in batteries (Source: Natural Graphite Report 2012, Industrial Minerals, www.indmin.com)
|
Refractories, foundry and crucibles
|
39%
|
|
Metallurgy
|
28%
|
|
Parts and components
|
10%
|
|
Batteries
|
9%
|
|
Lubricants
|
9%
|
|
Other
|
5%
|
Future Demand
Batteries alone is the fastest growing market for graphite with growth between 15-25% a year (Source: Industrial Minerals, 2012) and future demand for graphite is expected through the uptake of lithium-ion batteries (Li-ion). There is 11 times more graphite in a Li-ion battery than there is lithium and demand for graphite in Li-ion batteries, specifically from the growth of the electric vehicle market, is expected to be significant. Other future demand drivers include pebble bed nuclear reactors, fuel cells, large-scale energy storage and graphene.
Graphite Pricing
Graphite pricing is a function of flake size and purity where larger flake and higher purity command premium pricing in the market. The three major categories for flake graphite are large, medium, and small (amorphous).
28
Graphite is not freely traded on an open market. This means determining its price is somewhat of an opaque market as prices are determined through contracts between buyers and sellers. Nevertheless, Industrial Minerals performs regular customer surveys tracking pricing trends and, from their analysis, overall graphite prices have substantially increased since 2007 due to increased demand and constrained supply. Recently however, graphite prices have decreased from their peak due to the slowdown in the global economy particularly in Europe and Asia. Despite this recent decline, future prices are predicted to remain strong as can be outlined in the graph below:
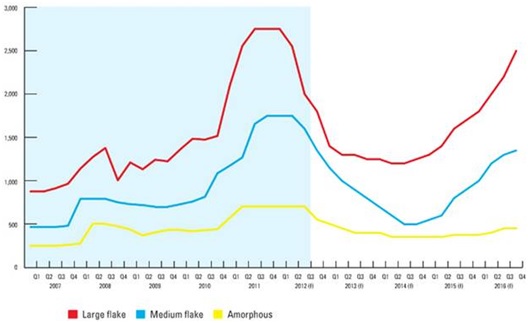
Source: Natural Graphite Report 2012, Industrial Minerals, www.indmin.com
Vanadium Market and Pricing
Source of this entire section: United States Geological Survey. Data in metric tons of vanadium content unless otherwise noted
Domestic Production and Use
Seven U.S. firms comprise most of the domestic vanadium industry produced ferrovanadium, vanadium pentoxide, vanadium metal and vanadium-bearing chemicals or specialty alloys by processing materials such as petroleum residues, spent catalysts, utility ash and vanadium-bearing pig iron slag. Metallurgical use, primarily as an alloying agent for iron and steel, accounted for about 93% of the U.S. vanadium consumption in 2011. Of the other uses for vanadium, the major non-metallurgical use was in catalysts for the production of maleic anhydride and sulfuric acid.
|
Salient Statistics—United States
|
2008
|
2009
|
2010
|
2011
|
2012est
|
|||||||||||||||
|
Production, mine, mill
|
520 | 230 | 1,060 | 590 | 270 | |||||||||||||||
|
Imports for consumption:
|
||||||||||||||||||||
|
Ferrovanadium
|
2,800 | 353 | 1,340 | 2,220 | 3,400 | |||||||||||||||
|
Vanadium pentoxide, anhydride
|
3,700 | 1,120 | 4,000 | 2,810 | 1,570 | |||||||||||||||
|
Oxides and hydroxides, other
|
144 | 25 | 167 | 886 | 1,210 | |||||||||||||||
|
Aluminum-vanadium master alloys (gross weight)
|
618 | 282 | 951 | 278 | 180 | |||||||||||||||
|
Ash and residues
|
1,040 | 791 | 521 | 1,420 | 1,500 | |||||||||||||||
|
Sulfates
|
2 | 16 | 48 | 42 | 40 | |||||||||||||||
|
Vanadates
|
187 | 214 | 158 | 303 | 320 | |||||||||||||||
|
Vanadium metal, including waste and scrap
|
5 | 22 | 10 | 44 | 110 | |||||||||||||||
|
Exports:
|
||||||||||||||||||||
|
Ferrovanadium
|
452 | 672 | 611 | 314 | 530 | |||||||||||||||
|
Vanadium pentoxide, anhydride
|
249 | 401 | 140 | 89 | 40 | |||||||||||||||
|
Oxides and hydroxides, other
|
1,040 | 506 | 1,100 | 254 | 190 | |||||||||||||||
|
Aluminum-vanadium master alloys (gross weight)
|
1,390 | 447 | 1,190 | 920 | 1,400 | |||||||||||||||
|
Vanadium metal, including waste and scrap
|
57 | 23 | 21 | 102 | 10 | |||||||||||||||
|
Consumption:
|
||||||||||||||||||||
|
Apparent
|
5,820 | 1,040 | 5,190 | 6,963 | 6,400 | |||||||||||||||
|
Reported
|
5,170 | 4,690 | 5,030 | 5,120 | 5,200 | |||||||||||||||
|
Stocks, consumer, yearend
|
335 | 295 | 248 | 2185 | 2220 | |||||||||||||||
|
* Price, average, dollars per pound V2O5
|
$ | 12.92 | $ | 5.43 | $ | 6.46 | $ | 6.76 | $ | 6.52 | ||||||||||
|
Imports + exports + adjustments for government
|
||||||||||||||||||||
|
and industry stock changes as a percentage of apparent consumption
|
91 | % | 78 | % | 81 | % | 92 | % | 96 | % | ||||||||||
* Vanadium is not freely traded on an open market. This means determining prices for vanadium is somewhat of an opaque market as prices are determined through contracts between buyers and sellers.
29
Events, Trends, and Issues
U.S. apparent consumption of vanadium in 2012 decreased by 9% from its 2011 level; however, it was still almost six times higher than its level in 2009. Apparent consumption of vanadium declined dramatically in 2009 from that of 2008 owing to the global economic recession in 2009. Among the major uses for vanadium, production of carbon, full-alloy, and high-strength low-alloy steels accounted for 16%, 45%, and 33% of domestic consumption, respectively. U.S. imports for consumption of vanadium in 2012 increased 4% from those of the previous year. U.S. exports increased 29% from those of the previous year.
In the fourth quarter of 2011, vanadium pentoxide (V2O5) prices continued to decrease to a year-to-date low of $6.22 per pound of V2O5 in December 2011. In January 2012, prices continued to decrease to a year-to-date low of $5.83 per pound of V2O5 until February when prices began to slowly increase again. In August 2012, V2O5 prices averaged $6.60 per pound of V2O5, slightly more than average V2O5 prices in August 2011. In the fourth quarter of 2011, U.S. ferrovanadium (FeV) prices continued to slowly decrease to a year-to-date low of $13.19 per pound FeV (contained vanadium) in December 2011. In January 2012, prices continued to decrease until February 2012 when prices began to slowly increase. In August 2012, FeV prices averaged $15.60 per pound of FeV.
World Mine Production and Reserves
Production data for the United States were revised based on new company information.
| Mine production | Reserves (thousand | |||||||||||
|
2011
|
2012est
|
metric tons)
|
||||||||||
|
China
|
23,000 | 23,000 | 5,100 | |||||||||
|
South Africa
|
22,000 | 22,000 | 3,500 | |||||||||
|
Russia
|
15,200 | 16,000 | 5,000 | |||||||||
|
United States
|
1,590 | 1,270 | 45 | |||||||||
|
Other countries
|
1,600 | 1,600 |
not applicable
|
|||||||||
|
World total (approximate)
|
63,390 | 63,870 | 14,000 | |||||||||
World Resources the Substitutes
World resources of vanadium exceed 63 million tons. Vanadium occurs in deposits of phosphate rock, titaniferous magnetite, and uraniferous sandstone and siltstone, in which it constitutes less than 2% of the host rock. Significant amounts are also present in bauxite and carboniferous materials, such as coal, crude oil, oil shale, and tar sands. Because vanadium is usually recovered as a byproduct or co-product, demonstrated world resources of the element are not fully indicative of available supplies. While domestic resources and secondary recovery are adequate to supply a large portion of domestic needs, a substantial part of U.S. demand is currently met by foreign material.
Steels containing various combinations of other alloying elements can be substituted for steels containing vanadium. Certain metals, such as manganese, molybdenum, niobium (columbium), titanium, and tungsten, are to some degree interchangeable with vanadium as alloying elements in steel. Platinum and nickel can replace vanadium compounds as catalysts in some chemical processes. There is currently no acceptable substitute for vanadium in aerospace titanium alloys.
Permitting in Madagascar
Companies in Madagascar first apply for an exploration mining permit with the Bureau de Cadastre Minier de Madagascar (“BCMM”), a government agency falling under the authority of the Minister of Mines. Permits are granted under usual circumstances are generally issued within a month. The 2014 fees per square within a mining permit range from approximately 92,500 Ariary to 500,000 Ariary (between $35 and $194 using a current exchange rate of 2,580 Madagascar Ariary = $1 USD). The number of squares varies widely by claim number. For the 2014 year, the Company paid approximately $400,000 to the BCMM to renew all of its claims in Madagascar. This fee covered both the 100% owned Green Giant Property (6 claims) and the Molo Graphite Property (39 claims). Each year the Company is required to pay a similar amount in order to maintain the claims in good standing.
30
The next step in the permitting process, which our Company has initiated, is to apply for an exploitation permit. Our company has engaged a third party environmental study company in Madagascar to assist us with this process. In order to get an exploitation permit, an investment plan, exploitation work plan budget and specific ground mapping is submitted to the BCMM. This step is completed in conjunction with a submission of an environmental impact study for the BCMM. This environmental impact study includes, among other things, completion of a water study and a social impact study.
QA/QC Protocols
At all times during sample collection, storage, and shipment to the laboratory facility, the samples are in the control of our Company or parties that we have contracted to act as our agents.
When sufficient sample material (grab, trench or core) has been collected, the samples are flown or sent by truck to our storage location in Antananarivo, Madagascar. At all times samples are accompanied by an employee, consultant or agent of our Company. From there, samples are shipped to labs either in South Africa or Canada for ICP-MS analysis.
All analytical results are e-mailed directly by the lab to the Company’s project manager on site in Madagascar and to our company’s geological and executive staff. Results are also posted on a secure website and downloaded by our company’s personnel using a secure username and password. All of the labs that carried out the sampling and analytical work are independent of our company.
In order to carry out QA/QC protocols on the assays, blanks, standards and duplicates were inserted into the sample streams. This was done once in every 30 samples, representing an insertion rate of 3.33% of the total.
Since the 2009 Madagascar drill program, our company has rigorously implemented a blank protocol. For the Molo Graphite Deposit a fine-grained quartz sand sourced from a hardware store in Antananarivo was used as the blank material for the sampling campaign. A total of 208 blank samples were used in this program. A detection limit of 0.05% Carbon was used for the purpose of this exercise. To verify the reliability of the blank samples, the detection limit and the blank + 2, and 3 times the detection limit were plotted against the date. The plot shows that there are a lot of blank samples that have concentrations that exceed the blank + 3 times detection limit threshold. This, coupled with the large spread of data points, would lead to the assumption that samples may have been contaminated during their preparation for analysis.
Blanks plot – Log %C versus the date of the analysis.
Since certified reference materials (“CRMs”) are essentially non-existent for graphite, our Company commissioned a third party lab in Canada to create a CRM from the remaining Molo Graphite Deposit drill core pulps from the 2011 program. As certified the third party lab standard (STD 1 C) a recommended value of 9.11 % Carbon.
31
To check the reliability of the standard, a plot of the recommended CRM value versus date was created. The upper and lower limits of one, two and three times the standard deviations of the recommended value are also included in the plot. All the results except for two fall within the acceptable limit of two times the standard deviation. It is however worth noting that there seems to be a negative bias towards lower concentrations in the first batch of samples that were submitted. As the campaign progressed the bias leant towards the positive side. This issue appears to have been sorted out towards the latter parts of the campaign as the data becomes less spread, and is closer to the recommended value.
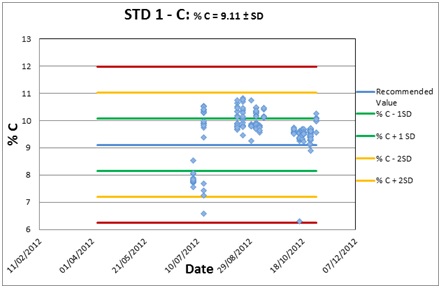
Graph showing carbon concentration as analyzed in STD 1C.
For the Molo Graphite Deposit, 205 field duplicates were prepared. To check how close these were to the original samples, a plot of the original samples with a zero, five, and ten per cent difference of the original samples was created. The majority of the samples were within the 10% difference limit. The plot also shows a good correlation between the original value and the duplicate, as is evident from the regression line with an R2 value of 0.96.
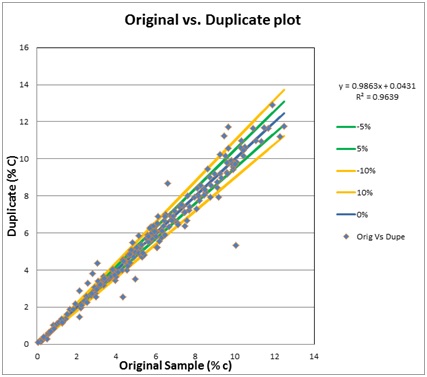
Original (“Orig”) versus Duplicate (“Dupe”) plots.
32
Next Steps
The Company is completing the full feasibility study for the Molo deposit, and anticipates this study to be completed in either December 2014 or early 2015. With this study, the Company will have the technical data to approach financiers and strategic partners for the funding of a mine.
Future Programs
The economic potential of the property rests upon the ability to extract graphite and/or vanadium using reasonable, potentially economic parameters. Initial metallurgical results indicate that an economic processing method is available to extract graphite. This will be determined within a full feasibility study anticipated for release in December 2014 or early 2015. The results of this study will dictate how our management proceeds with project development.
Other Expenses
Management anticipates spending approximately $350,000 - $450,000 in ongoing general office and administration expenses and professional fees per quarter for the next twelve months. Expenses will vary in direct proportion with the level of activity relating to future acquisitions and exploration programs.
RESULTS OF OPERATIONS
We have had no operating revenues from inception on March 1, 2004 through to December 31, 2014. Our activities have been financed from the proceeds of securities subscriptions. Explanations for material fluctuations during the six-month period ended December 31, 2014 when compared to the six-month period ended December 31, 2013 are as follows:
|
·
|
Amounts spent on mineral properties totalled $3,233,878 (December 31, 2013: $1,584,290), which represents an increase of $1,649,588. $1.7 million was spent on the Madagascar Molo graphite project primarily on advancing the bankable feasibility study with DRA Minerals (our EPCM) and $1.5 was spent on the Sagar Property on a drill program to satisfy our Canadian tax agency flow-through share commitment. As the flow-through share commitment has been satisfied, we anticipate costs going forward on the Sagar Property will decrease and ultimately be eliminated.
|
|
·
|
Professional fees totalled $472,052, down $152,498 from the six-month period ended December 31, 2013 total of $624,550. This represents a 24% decrease in costs between periods. A decrease of approximately $35,000 in legal and audit fees, $40,000 decrease in consulting fees to current and former executive team members, and a $35,000 decrease in listing and filing fees were the primary reasons for this reduction.
|
|
·
|
General and administrative costs relate to costs associated with running the Toronto office and the Madagascar operations, cost for travel, investor relations fees and TSX fees. These costs decreased by $93,071 between periods (December 31, 2014: $500,664 and December 31, 2013: $593,735). Travel costs were approximately $35,000 lower, promotion expenses were $20,000 lower, rental charges were 8,000 lower and courier and postage costs were $10,000 lower. These account for the majority of the reduction in general and administrative costs.
|
|
·
|
Stock-based compensation increased by $162,341 (December 31, 2014: $404,160 and December 31, 2013: $241,819). This expense is the Black-Scholes theoretical cost to issue stock options. A total of 4,800,000 stock options were issued during the six-month period ended December 31, 2014 (December 31, 2013: 2,255,000 stock options issued).
|
|
·
|
Depreciation increased by $14,942 (December 31, 2014: $26,909, December 31, 2013: $11,967). This increase is due to the purchase of fixed assets which occurred late in fiscal 2014.
|
|
·
|
Foreign currency translation was in a loss position for the period ended December 31, 2014 (loss of $3,827) and a loss position during the period ended December 31, 2013 (gain of $90,570). This item arises due to the fluctuations in foreign currency exchange rates at the time that transactions occur in a currency other than our functional currency of US dollars and due to the revaluation of balance sheet items from foreign currencies into US dollars as of the date of the balance sheet, namely December 31, 2014. During the current period ended, the U.S. dollar continued materially to strengthened relative to the Canadian dollar and other currencies that the Company transacts in resulting in a small loss.
|
|
·
|
Investment income decreased increased by $928, specifically from $6,472 for the six-month period ended December 31, 2013 to $7,400 for the six-month period ended December 31, 2014. These amount relate to returns on our passive investments and interest income on cash balances.
|
|
·
|
The warrant liability change resulted in a decrease in net loss by $489,119 for the six-month period ended December 31, 2014. This warrant liability did not exist as of December 31, 2013. Certain warrants that are currently issued by our company are considered derivative instruments as they were issued in Canadian Dollars, a currency other than the Company's functional currency of the US dollar. The estimated fair value of warrants accounted for as liabilities was determined on as of December 31, 2014 and are marked to market at each financial reporting period. The change in fair value of the warrant liability is recorded in the consolidated statements of operations and comprehensive loss as a gain or loss and estimated using the Binomial model.
|
|
·
|
For the six month period ended December 31, 2014, the Company sold marketable securities and recognized a gain on sale of $12,278 (December 31, 2013: $Nil) which has been recorded in the statement of operations and comprehensive loss and removed from accumulated other comprehensive income.
|
|
·
|
For the six months ended December 31, 2013, the Company determined that $63,849 of unrealized losses were other than temporary and as such were recognized as an "other expense" in net loss and removed from accumulated other comprehensive income. No entry was recorded for the six-month period ended December 31, 2014.
|
33
Liquidity, Capital Resources and Foreign Currencies
As at December 31, 2014, we had cash on hand of $1,358,571. Our working capital was $842,339 which excludes the warrant liability which are non-cash items reflected as liabilities. We hold a material portion of cash reserves in Canadian dollars. Due to foreign exchange rate fluctuations, the value of these Canadian dollar reserves can result in translation gains or losses in US dollar terms. If there was to be a significant decline in the Canadian dollar against the US dollar, the US dollar value of that Canadian dollar cash position presented on our balance sheet would also significantly decline. If the US dollar significantly declines relative to the Canadian dollar, our quoted US dollar cash position would also significantly decline. Such foreign exchange declines could cause us to experience losses. In addition to paying expenses in Canadian dollars, we also pay expenses in South African Rand, Madagascar Ariary and Australian Dollars. During the current period ended December 31, 2014, the U.S. dollar materially strengthened relative to the Canadian dollar and other currencies that our company transacts. Therefore, we are subject to risks relating to movements in those currencies.
There are no assurances that we will be able to achieve further sales of common shares or any other form of additional financing. If we are unable to achieve the financing necessary to continue the plan of operations, then we will not be able to continue our exploration and our venture will fail.
Capital Financing
|
·
|
From inception through June 30, 2004, we raised $59,750 through the issuance of 9,585,000 common shares.
|
|
·
|
For the year ended June 30, 2005, we did not raise any capital from new financings.
|
|
·
|
For the year ended June 30, 2006, we raised $795,250 through the issuance of 2,750,000 common shares and 2,265,000 common share purchase warrants.
|
|
·
|
For the year ended June 30, 2007, we raised $17,300,000 through the issuance of 34,600,000 common shares and 29,000,250 common share purchase warrants.
|
|
·
|
For the year ended June 30, 2008, we did not raise any capital from new financings.
|
|
·
|
For the year ended June 30, 2009, we raised $680,000 through the issuance of 6,800,000 common shares and 3,400,000 common share purchase warrants.
|
|
·
|
For the year ended June 30, 2010, we raised $6,500,000 through the issuance of 21,666,667 common shares and 21,666,667 common share purchase warrants.
|
|
·
|
For the year ended June 30, 2011, we raised net proceeds of $13,178,708 through the issuance of 30,936,654 common shares and 15,468,328 common share purchase warrants and $886,501 (by issuing 4,549,500 common shares) through the exercise of common share purchase warrants.
|
|
·
|
For the year ended June 30, 2012, we raised proceeds of $635,000 (by issuing 2,540,000 common shares) through the issuance of common shares and $84,000 (by issuing 510,000 common shares) through the exercise of common stock purchase options.
|
|
·
|
For the year ended June 30, 2013, we raised net proceeds of $4,076,133 through the issuance of 18,157,142 common shares and 3,513,599 common share purchase warrants and $105,000, by issuing 700,000 common shares, through the exercise of common stock purchase options.
|
|
·
|
For the year ended June 30, 2014, we raised net proceeds of $9,559,926 through the issuance of 90,523,283 common shares and
39,185,714 common share purchase warrants.
|
|
·
|
For the six-month period ended December 31, 2014, we raised net proceeds of $4,956,775 through the issuance of 39,757,067 common
shares and $72,049 through the exercise of 571,353 common share broker
warrants.
|
We will require additional funding during fiscal 2015, which will likely be in the form of equity financing from the sale of our common shares. However, we cannot provide investors with any assurance that we will be able to raise sufficient funding from the sale of common shares for additional phases of exploration.
34
Issuances of Securities
We have funded our business to date from sales of our securities. From July 1, 2013 through December 31, 2014, the Company issued the following unregistered securities:
|
·
|
On July 9, 2013, we issued 1,255,000 stock options to directors, officers and consultants at $0.11 per share.
|
|
·
|
Between July 26, 2013 and August 1, 2013, we closed a private placement raising $2,043,452. We issued 16,950,001 common stock at prices of $0.12 and $0.121 per share. We issued 402,000 compensation warrants at an exercise price of 0.11 and 150,000 compensation warrants at an exercise price of $0.12.
|
|
·
|
On September 19, 2013, we issued 750,000 stock options to directors, officers and consultants at $0.15 per share.
|
|
·
|
On October 9, 2013, we issued 250,000 stock options to a director at $0.13 per share.
|
|
·
|
On December 18, 2013 we closed a non-brokered financing and raised $1,479,024. We issued 11,189,215 common shares at $0.1322 per share. We also issued 671,353 compensation warrants at $0.115 per share.
|
|
·
|
On January 10, 2014, we issued 4,625,000 stock options to directors and officers at $0.18 per share.
|
|
·
|
On January 15, 2014 and January 31, 2014, we closed a private placement raising a total of $6,906,008. The Company issued 62,384,067 common shares at $0.111 and 31,192,033 common share purchase warrants. We also issued 3,396,744 compensation warrants.
|
|
·
|
On February 6, 2014, we issued 250,000 stock options to a consultant at $0.18 per share.
|
|
·
|
On June 23, 2014, we issued 2,500,000 common stock to Malagasy at $0.13 per share for the Molo Graphite Project.
|
|
·
|
On July 3 2014, we issued 4,800,000 stock options to directors and officers at $0.15 per share.
|
|
·
|
On September 18, 2014, 571,353 broker warrants were exercised at $0.126 for total proceeds of $72,049.
|
|
·
|
On September 26, 2014, we issued 34,285,714 shares of common stock at $0.14 per share raising $4,800,000.
|
|
·
|
On December 31, 2014, we issued 4,900,000 shares of common stock at $0.12 per share raising $588,000.
|
The offer and sale of all shares of our common shares and warrants listed above were affected in reliance on the exemptions for sales of securities not involving a public offering, as set forth in Regulation S promulgated under the Securities Act. The Investor acknowledged the following: Subscriber is not a United States Person, nor is the Subscriber acquiring the shares of our common stock and warrants directly or indirectly for the account or benefit of a United States Person. None of the funds used by the Subscriber to purchase the shares of our common stock and warrants have been obtained from United States Persons. For purposes of this Agreement, “United States Person” within the meaning of U.S. tax laws, means a citizen or resident of the United States, any former U.S. citizen subject to Section 877 of the Internal Revenue Code, any corporation, or partnership organized or existing under the laws of the United States of America or any state, jurisdiction, territory or possession thereof and any estate or trust the income of which is subject to U.S. federal income tax irrespective of its source, and within the meaning of U.S. securities laws, as defined in Rule 902(o) of Regulation S, means: (i) any natural person resident in the United States; (ii) any partnership or corporation organized or incorporated under the laws of the United States; (iii) any estate of which any executor or administrator is a U.S. person; (iv) any trust of which any trustee is a U.S. person; (v) any agency or branch of a foreign entity located in the United States; (vi) any non-discretionary account or similar account (other than an estate or trust) held by a dealer or other fiduciary for the benefit or account of a U.S. person; (vii) any discretionary account or similar account (other than an estate or trust) held by a dealer or other fiduciary organized, incorporated, or (if an individual) resident in the United States; and (viii) any partnership or corporation if organized under the laws of any foreign jurisdiction, and formed by a U.S. person principally for the purpose of investing in securities not registered under the Securities Act, unless it is organized or incorporated, and owned, by accredited investors (as defined in Rule 501(a)) who are not natural persons, estates or trusts. Further, we anticipate that additional funding will be in the form of equity financing from the sale of our common stock. However, we cannot provide investors with any assurance that we will be able to raise sufficient funding for additional phases of exploration. We currently believe that debt financing will not be an alternative for funding additional phases of exploration. We do not have any arrangements in place for any future equity financing.
There are no assurances that we will be able to achieve further sales of our common stock or any other form of additional financing. If we are unable to achieve the financing necessary to continue our plan of operations, then we will not be able to continue our exploration and our venture will fail.
Off-balance sheet arrangements
We have no off-balance sheet arrangements including arrangements that would affect the liquidity, capital resources, market risk support and credit risk support or other benefits.
35
ITEM 3. - QUANTITATIVE AND QUALITATIVE DISCLOSURES ABOUT MARKET RISK
Other than warrants and broker warrants, noted with the financial statements above denominated in Canadian dollars, we do not hold any derivative instruments and do not engage in any hedging activities. Most of our activity is the development and mining of our mining claim.
ITEM 4. - CONTROLS AND PROCEDURES
Disclosure Controls and Procedures
Our management team, under the supervision and with the participation of our principal executive officer and our principal financial officer, evaluated the effectiveness of the design and operation of our disclosure controls and procedures as such term is defined under Rule 13a-15(e) promulgated under the Securities Exchange Act of 1934, as amended (Exchange Act), as of the last day of the fiscal period covered by this report, December 31, 2014. The term disclosure controls and procedures means our controls and other procedures that are designed to ensure that information required to be disclosed by us in the reports that we file or submit under the Exchange Act is recorded, processed, summarized and reported, within the time periods specified in the SEC’s rules and forms. Disclosure controls and procedures include, without limitation, controls and procedures designed to ensure that information required to be disclosed by us in the reports that we file or submit under the Exchange Act is accumulated and communicated to management, including our principal executive and principal financial officer, or persons performing similar functions, as appropriate to allow timely decisions regarding required disclosure. Based on this evaluation and the deficiencies noted in our management’s report on internal controls and procedures over financial reporting in our Form 10-K for the year ended June 30, 2014, our principal executive officer and our principal financial officer concluded that, given the size of our Company and its finance department, that our disclosure controls and procedures were not effective as of December 31, 2014.
Changes in Internal Control over Financial Reporting
During the fiscal quarter ended December 31, 2014,
the company appointed two independent directors to make the majority of the
board independent and resulting in effective oversight at a board level in the
establishment and monitoring of required internal controls and procedures.
36
PART II – OTHER INFORMATION
ITEM 1. - LEGAL PROCEEDINGS
We are currently not involved in any litigation that we believe could have a material adverse effect on our financial condition or results of operations. There is no action, suit, proceeding, inquiry or investigation before or by any court, public board, government agency, self-regulatory organization or body pending or, to the knowledge of the executive officers of our Company or any of our subsidiaries, threatened against or affecting our company, our common stock, any of our subsidiaries or of our companies or our subsidiaries' officers or directors in their capacities as such, in which an adverse decision could have a material adverse effect.
ITEM 1A. - RISK FACTORS
Our business is subject to a variety of risks and uncertainties, including, but not limited to, the risks and uncertainties described below. If any of the risks described below, or elsewhere in this report on Form 10-K, or our Company’s other filings with the Securities and Exchange Commission (the "SEC"), were to occur, our financial condition and results of operations could suffer and the trading price of our common stock could decline. Additionally, if other risks not presently known to us, or that we do not currently believe to be significant, occur or become significant, our financial condition and results of operations could suffer and the trading price of our common stock could decline. You should carefully review the risk factors together with all other information contained in this Quarterly Report on Form 10-Q, our Annual Report on Form 10-K for the year ended June 30, 2014, and in prior reports pursuant to the Securities Exchange Act of 1934, as amended and the Securities Act of 1933, as amended. Our risk factors, including but not limited to the risk factors listed below, are as follows:
SHOULD ONE OR MORE OF THE FOREGOING RISKS OR UNCERTAINTIES MATERIALIZE, OR SHOULD THE UNDERLYING ASSUMPTIONS OF OUR BUSINESS PROVE INCORRECT, ACTUAL RESULTS MAY DIFFER SIGNIFICANTLY FROM THOSE ANTICIPATED, BELIEVED, ESTIMATED, EXPECTED, INTENDED OR PLANNED.
The report of our independent registered public accounting firm contains explanatory language that substantial doubt exists about our ability to continue as a going concern.
The independent auditor’s report on our financial statements contains explanatory language that substantial doubt exists about our ability to continue as a going concern. Due to our lack of operating history and present inability to generate revenues, we have sustained operating losses since our inception. Since our inception, up to December 31, 2014, we had accumulated net losses of $90,350,700. If we are unable to obtain sufficient financing in the near term as required or achieve profitability, then we would, in all likelihood, experience severe liquidity problems and may have to curtail our operations. If we curtail our operations, we may be placed into bankruptcy or undergo liquidation, the result of which will adversely affect the value of our common shares.
37
We may not have access to sufficient capital to pursue our business and therefore would be unable to achieve our planned future growth.
We intend to pursue a strategy that includes development of our Company’s business plan. Currently we have limited capital, which is insufficient to pursue our plans for development and growth. Our ability to implement our Company’s plans will depend primarily on our ability to obtain additional private or public equity or debt financing. Such financing may not be available, or we may be unable to locate and secure additional capital on terms and conditions that are acceptable to us. Financing exploration plans through equity financing will have a dilutive effect on our common shares. Our failure to obtain additional capital will have a material adverse effect on our business.
Our primary exploration efforts are in the African country of Madagascar, where a new government has been in place since early 2014.
Any adverse developments to the political situation in Madagascar could have a material effect on our Company’s business, results of operations and financial condition. Democratic elections in Madagascar occurred toward the end of 2013 as planned by the elections calendar jointly established between the UN and the Elections Commissions. To date, our Company has not experienced any disruptions or been placed under any constraints in our exploration efforts due to the political situation in Madagascar. Depending on future actions taken by the newly elected government, or any future government, our Company’s business operations could be impacted.
The newly elected President was inaugurated on January 25, 2014 and the lower house of Parliament took office in February 2014. A government reshuffle occurred in early 2015, with the naming of a new Prime Minister on January 14, 2015. Ministers composing the new government were named on January 25, 2015.
We are actively monitoring the political climate in Madagascar and continue to hold meetings with representatives of the government and the Ministry attached to the Presidency in charge of Mining. The transformation or amendment of exploration and research mining permits within the country continues to be suspended. Our Company has continued to pay taxes and administrative fees in Madagascar with respect to all the mining permits we hold. These payments have been acknowledged and accepted by the Madagascar government.
Our common shares have been subject to penny stock regulation in the United States of America.
Our common shares have been subject to the provisions of Section 15(g) and Rule 15g-9 of the (US) Securities Exchange Act of 1934, as amended (the “Exchange Act”), commonly referred to as the “penny stock” rule. Section 15(g) sets forth certain requirements for transactions in penny stocks and Rule 15g-9(d)(1) incorporates the definition of penny stock as that used in Rule 3a51-1 of the Exchange Act. The Commission generally defines penny stock to be any equity security that has a market price less than US$5.00 per share, subject to certain exceptions. Rule 3a51-1 provides that any equity security is considered to be penny stock unless that security is: registered and traded on a national securities exchange meeting specified criteria set by the Commission; issued by a registered investment company; excluded from the definition on the basis of price (at least US$5.00 per share) or the registrant’s net tangible assets; or exempted from the definition by the Commission. If our common shares are deemed to be “penny stock”, trading in common shares will be subject to additional sales practice requirements on broker/dealers who sell penny stock to persons other than established customers and accredited investors.
Financial Industry Regulatory Authority, Inc. (“FINRA”) sales practice requirements may limit a shareholder’s ability to buy and sell our common shares.
In addition to the “penny stock” rules described above, FINRA has adopted rules that require that in recommending an investment to a client, a broker-dealer must have reasonable grounds for believing that the investment is suitable for that client. Prior to recommending speculative low priced securities to their non-institutional clients, broker-dealers must make reasonable efforts to obtain information about the client’s financial status, tax status, investment objectives and other information. Under interpretations of these rules, FINRA believes that there is a high probability that speculative low priced securities will not be suitable for at least some clients. FINRA requirements make it more difficult for broker-dealers to recommend that their clients buy our common shares, which may limit your ability to buy and sell our stock and have an adverse effect on the market for our shares.
38
As a public company we are subject to complex legal and accounting requirements that will require us to incur significant expenses and will expose us to risk of non-compliance.
As a public company, we are subject to numerous legal and accounting requirements in both Canada and the United States of America that do not apply to private companies. The cost of compliance with many of these requirements is material, not only in absolute terms but, more importantly, in relation to the overall scope of the operations of a small company. Our relative inexperience with these requirements may increase the cost of compliance and may also increase the risk that we will fail to comply. Failure to comply with these requirements can have numerous adverse consequences including, but not limited to, our inability to file required periodic reports on a timely basis, loss of market confidence, delisting of our securities and/or governmental or private actions against us. We cannot assure you that we will be able to comply with all of these requirements or that the cost of such compliance will not prove to be a substantial competitive disadvantage vis-à-vis privately held and larger public competitors.
Compliance with changing regulation of corporate governance and public disclosure will result in additional expenses and pose challenges for our management.
Changing laws, regulations and standards relating to corporate governance and public disclosure, including the Dodd-Frank Wall Street Reform and Consumer Protection Act and the rules and regulations promulgated thereunder, the Sarbanes-Oxley Act and SEC regulations, have created uncertainty for public companies and significantly increased the costs and risks associated with accessing the U.S. public markets. Our management team needs to devote significant time and financial resources to comply with both existing and evolving standards for public companies, which will lead to increased general and administrative expenses and a diversion of management time and attention from revenue generating activities to compliance activities.
Changes in tax laws or tax rulings could materially affect our financial position and results of operations.
Changes in tax laws or tax rulings could materially affect our financial position and results of operations. For example, the current U.S. administration and key members of Congress have made public statements indicating that tax reform is a priority. Certain changes to U.S. tax laws, including limitations on the ability to defer U.S. taxation on earnings outside of the United States until those earnings are repatriated to the United States, could affect the tax treatment of our foreign earnings. In addition, many countries in the European Union, as well as a number of other countries and organizations such as the Organization for Economic Cooperation and Development, are actively considering changes to existing tax laws. Certain proposals could include recommendations that would significantly increase our tax obligations in many countries where we do business. Due to the large and expanding scale of our international business activities, any changes in the taxation of such activities may increase our worldwide effective tax rate and harm our financial position and results of operations.
Because we are quoted on the OTCQX instead of a national securities exchange in the United States, our U.S. investors may have more difficulty selling their stock or experience negative volatility on the market price of our stock in the United States.
In the United States, our common shares are quoted on the OTCQX. The OTCQX is marketed as an electronic exchange for high growth and early stage U.S. companies and a prospective “final step toward a NASDAQ or NYSE listing” (although no assurances can be provided that such change of market shall occur). Trades are settled and cleared in the U.S. similar to any NASDAQ or NYSE stock and trade reports are disseminated through Yahoo, Bloomberg, Reuters, and most other financial data providers. The OTCQX can be significantly illiquid, in part because it does not have a national quotation system by which potential investors can follow the market price of shares except through information received and generated by a limited number of broker-dealers that make markets in particular stocks. There is a greater chance of volatility for securities that trade on the OTCQX as compared to a national securities exchange in the United States, such as the New York Stock Exchange, the NASDAQ Stock Market or the NYSE Amex. This volatility may be caused by a variety of factors, including the lack of readily available price quotations, the absence of consistent administrative supervision of bid and ask quotations, lower trading volume, and market conditions. U.S. investors in our common shares may experience high fluctuations in the market price and volume of the trading market for our securities. These fluctuations, when they occur, have a negative effect on the market price for our common shares. Accordingly, our U.S. shareholders may not be able to realize a fair price from their shares when they determine to sell them or may have to hold them for a substantial period of time until the market for our common shares improves.
In addition to being quoted on the OTCQX, our common shares trade on the Toronto Stock Exchange (“TSX”), Canada’s national stock exchange, under the symbol EGZ and on the Frankfurt Exchange under the symbol A1CXW3.
39
The price at which you purchase our common shares may not be indicative of the price that will prevail in the trading market. You may be unable to sell your common shares at or above your purchase price, which may result in substantial losses to you. The market price for our common shares is particularly volatile given our status as a relatively unknown company with a small and thinly traded public float, limited operating history and lack of profits which could lead to wide fluctuations in our share price.
The market for our common shares is characterized by significant price volatility when compared to seasoned issuers, and we expect that our share price will continue to be more volatile than a seasoned issuer. The volatility in our share price is attributable to a number of factors. First our common shares, at times, are thinly traded. As a consequence of this lack of liquidity, the trading of relatively small quantities of shares by our shareholders may disproportionately influence the price of those shares in either direction. The price for our shares could, for example, decline precipitously in the event that a large number of our common shares are sold on the market without commensurate demand, as compared to a seasoned issuer which could better absorb those sales without adverse impact on its share price. Second, we are a speculative or “risky” investment due to our limited operating history, lack of profits to date and uncertainty of future market acceptance for our potential products. As a consequence, more risk-adverse investors may, under the fear of losing all or most of their investment in the event of negative news or lack of progress, be more inclined to sell their shares on the market more quickly and at greater discounts than would be the case with the stock of a seasoned issuer. Many of these factors are beyond our control and may decrease the market price of our common shares, regardless of our performance. We cannot make any predictions as to what the prevailing market price for our common shares will be at any time or as to what effect that the sale of shares or the availability of common shares for sale at any time will have on the prevailing market price.
Shareholders should be aware that, according to SEC Release No. 34-29093, the market for penny stocks has suffered in recent years from patterns of fraud and abuse. Such patterns include control of the market for the security by one or a few broker-dealers that are often related to the promoter or issuer; manipulation of prices through prearranged matching of purchases and sales and false and misleading press releases; boiler room practices involving high-pressure sales tactics and unrealistic price projections by inexperienced sales persons; excessive and undisclosed bid-ask differential and markups by selling broker-dealers; and the wholesale dumping of the same securities by promoters and broker-dealers after prices have been manipulated to a desired level, along with the resulting inevitable collapse of those prices and with consequent investor losses. Our management is aware of the abuses that have occurred historically in the penny stock market. Although we do not expect to be in a position to dictate the behavior of the market or of broker-dealers who participate in the market, management will strive within the confines of practical limitations to prevent the described patterns from being established with respect to our securities. The occurrence of these patterns or practices could increase the volatility of our share price.
Volatility in our common share price may subject us to securities litigation, thereby diverting our resources that may have a material effect on our profitability and results of operations.
The market for our common shares is characterized by significant price volatility when compared to seasoned issuers, and we expect that our share price will continue to be more volatile than a seasoned issuer for the indefinite future. In the past, plaintiffs have often initiated securities class action litigation against a company following periods of volatility in the market price of its securities. We may in the future be the target of similar litigation. This type of litigation could result in substantial costs and could divert management’s attention and resources.
Failure to achieve and maintain effective internal controls in accordance with Section 404 of the Sarbanes-Oxley Act of 2002 (the “Sarbanes-Oxley Act”) could have a material adverse effect on our business and our operating results.
If we fail to comply with the requirements of Section 404 of the Sarbanes-Oxley Act regarding internal control over financial reporting or to remedy any material weaknesses in our internal controls that we may identify, such failure could result in material misstatements in our financial statements, cause investors to lose confidence in our reported financial information and have a negative effect on the trading price of our common shares.
Pursuant to Section 404 of the Sarbanes-Oxley Act and current SEC regulations, we are required to prepare assessments regarding internal controls over financial reporting. In connection with our on-going assessment of the effectiveness of our internal control over financial reporting, we may discover “material weaknesses” in our internal controls as defined in standards established by the Public Company Accounting Oversight Board, or the PCAOB. A material weakness is a significant deficiency, or combination of significant deficiencies, that results in more than a remote likelihood that a material misstatement of the annual or interim financial statements will not be prevented or detected. The PCAOB defines “significant deficiency” as a deficiency that results in more than a remote likelihood that a misstatement of the financial statements that is more than inconsequential will not be prevented or detected.
In the event that a material weakness is identified, as it has been for this report, subject to expansion of the size of our Company and our finance department, we will employ qualified personnel and adopt and implement policies and procedures to address any material weaknesses that we identify. However, the process of designing and implementing effective internal controls is a continuous effort that requires us to anticipate and react to changes in our business and the economic and regulatory environments and to expend significant resources to maintain a system of internal controls that is adequate to satisfy our reporting obligations as a public company. We cannot assure you that the measures we will take will remediate any material weaknesses that we may identify or that we will implement and maintain adequate controls over our financial process and reporting in the future.
40
Currently our CEO and Principal Financial and Accounting Officer, concluded that our disclosure controls and procedures were ineffective as of the end of December 31, 2014, due to (1) inadequate segregation of duties consistent with control objectives; (2) lack of a majority of independent directors on the Company’s board of directors, resulting in ineffective oversight in the establishment and monitoring of required internal controls and procedures; (3) insufficient written policies and procedures for accounting and financial reporting with respect to the requirements and application of US GAAP and SEC disclosure requirements; and (4) ineffective controls over period end financial disclosure and reporting processes.
Any failure to complete our assessment of our internal control over financial reporting, to remediate any material weaknesses that we may identify or to implement new controls, or difficulties encountered in their implementation, could harm our operating results, cause us to fail to meet our reporting obligations or result in material misstatements in our financial statements. Any such failure could adversely affect the results of the management evaluations of our internal controls. Inadequate internal controls could also cause investors to lose confidence in our reported financial information, which could have a negative effect on the trading price of our common shares.
Should we lose the services of our key executives, our financial condition and proposed expansion may be negatively impacted.
We depend on the continued contributions of our executive officers to work effectively as a team, to execute our business strategy and to manage our business. The loss of key personnel, or their failure to work effectively, could have a material adverse effect on our business, financial condition, and results of operations. Specifically, we rely on Richard Schler, our Chief Executive Officer, Craig Scherba, our President and Chief Operating Officer and Peter Liabotis, our Chief Financial Officer. We do not maintain key man life insurance. Should we lose any or all of their services and we are unable to replace their services with equally competent and experienced personnel, our operational goals and strategies may be adversely affected, which will negatively affect our potential revenues.
Minnesota law and our articles of incorporation protect our directors from certain types of lawsuits, which could make it difficult for us to recover damages from them in the event of a lawsuit.
Minnesota law provides that our directors will not be liable to our Company or to our stockholders for monetary damages for all but certain types of conduct as directors. Our articles of incorporation require us to indemnify our directors and officers against all damages incurred in connection with our business to the fullest extent provided or allowed by law. The exculpation provisions may have the effect of preventing stockholders from recovering damages against our directors caused by their negligence, poor judgment or other circumstances. The indemnification provisions may require our Company to use its assets to defend our directors and officers against claims, including claims arising out of their negligence, poor judgment, or other circumstances.
Due to the speculative nature of mineral property exploration, there is substantial risk that our assets will not go into commercial production and our business will fail.
Exploration for minerals is a speculative venture involving substantial risk. We cannot provide investors with any assurance that our claims and properties will ever enter into commercial production. The exploration work that we intend to conduct on our claims or properties may not result in the commercial production of graphite, vanadium, gold, uranium, or other minerals. Problems such as unusual and unexpected rock formations and other conditions are involved in mineral exploration and often result in unsuccessful exploration efforts. In such a case, we would be unable to complete our business plan.
We are a mineral exploration company with a limited operating history and expect to incur operating losses for the foreseeable future.
We are a mineral exploration company. We have not earned any revenues and we have not been profitable. Prior to completing exploration on our claims, we may incur increased operating expenses without realizing any revenues. There are numerous difficulties normally encountered by mineral exploration companies, and these companies experience a high rate of failure. The likelihood of success must be considered in light of the problems, expenses, difficulties, complications and delays encountered in connection with the exploration of the mineral properties that we plan to undertake. These potential problems include, but are not limited to, unanticipated problems relating to exploration and additional costs and expenses that may exceed current estimates. We have no history upon which to base any assumption as to the likelihood that our business will prove successful, and we can provide no assurance to investors that we will generate any operating revenues or ever achieve profitable operations.
41
Because of the inherent dangers involved in mineral exploration, there is a risk that we may incur liability or damages as we conduct our business.
The search for valuable minerals involves numerous hazards. As a result, we may become subject to liability for such hazards, including pollution, cave-ins and other hazards against which we cannot, or may elect not, to insure against. We currently have no such insurance, but our management intends to periodically review the availability of commercially reasonable insurance coverage. If a hazard were to occur, the costs of rectifying the hazard may exceed our asset value and cause us to liquidate all our assets.
If we confirm commercial concentrations of graphite, vanadium, gold, uranium or other minerals on our claims and interests, we can provide no assurance that we will be able to successfully bring those claims or interests into commercial production.
If our exploration programs are successful in confirming deposits of commercial tonnage and grade, we will require significant additional funds in order to place the claims and interests into commercial production. This may occur for a number of reasons, including because of regulatory or permitting difficulties, because we are unable to obtain any adequate funds or because we cannot obtain such funds on terms that we consider economically feasible.
Because access to our properties may be restricted by inclement weather or proper infrastructure, our exploration programs are likely to experience delays.
Access to most of the properties underlying our claims and interests is restricted due to their remote locations and because of weather conditions. Some of our properties are only accessible by air. As a result, any attempts to visit, test, or explore the property are generally limited to those periods when weather permits such activities. These limitations can result in significant delays in exploration efforts, as well as mining and production efforts in the event that commercial amounts of minerals are found. This could cause our business to fail.
As we undertake exploration of our claims and interests, we will be subject to the compliance of government regulation that may increase the anticipated time and cost of our exploration program.
There are several governmental regulations that materially restrict the exploration of minerals. We will be subject to the mining laws and regulations in force in the jurisdictions where our claims are located, and these laws and regulations may change over time. In order to comply with these regulations, we may be required to obtain work permits, post bonds, complete environmental assessments and perform remediation work for any physical disturbance to land. While our planned budget for exploration programs includes a contingency for regulatory compliance, there is a risk that new regulations could increase our costs of doing business and prevent us from carrying out our exploration program, or that our budgeted amounts are inadequate.
Our operations are subject to strict environmental regulations, which result in added costs of operations and operational delays.
Our operations are subject to environmental regulations, which could result in additional costs and operational delays. All phases of our operations are subject to environmental regulation. Environmental legislation is evolving in some countries and jurisdictions in a manner that may require stricter standards, and enforcement, increased fines and penalties for non-compliance, more stringent environmental assessments of proposed projects, and a heightened degree of responsibility for companies and their officers, directors, and employees. There is no assurance that any future changes in environmental regulation will not negatively affect our projects.
We have no insurance for environmental problems.
Insurance against environmental risks, including potential liability for pollution or other hazards as a result of the disposal of waste products occurring from exploration and production, has not been available generally in the mining industry. We have no insurance coverage for most environmental risks. In the event of a problem, the payment of environmental liabilities and costs would reduce the funds available to us for future operations. If we are unable to full pay for the cost of remedying an environmental problem, we might be required to enter into an interim compliance measure pending completion of the required remedy.
We do not intend to pay dividends.
We do not anticipate paying cash dividends on our common shares in the foreseeable future. We may not have sufficient funds to legally pay dividends. Even if funds are legally available to pay dividends, we may nevertheless decide, in our sole discretion, not to pay dividends. The declaration, payment and amount of any future dividends will be made at the discretion of our board of directors, and will depend upon, among other things, the results of our operations, cash flows and financial condition, operating and capital requirements, and other factors our board of directors may consider relevant. There is no assurance that we will pay any dividends in the future, and, if dividends are paid, there is no assurance with respect to the amount of any such dividend.
42
Due to external market factors in the mining business, we may not be able to market any minerals that may be found.
The mining industry, in general, is intensely competitive. Even if commercial quantities of minerals are discovered, we can provide no assurance to investors that a ready market will exist for the sale of these minerals. Numerous factors beyond our control may affect the marketability of any substances discovered. These factors include market fluctuations, the sale price of the minerals, the proximity and capacity of markets and processing equipment, and government regulations, including regulations relating to prices, taxes, royalties, land tenure, land use, mineral importing and exporting and environmental protection. The effect of these factors cannot be accurately predicted, but any combination of these factors may result in our not receiving an adequate return on invested capital.
Our performance may be subject to fluctuations in market prices of any minerals that we find.
The profitability of a mineral exploration project could be significantly affected by changes in the market price of the relevant minerals. Market prices of graphite have increased over the past several months due to possible new applications. The price of vanadium has increased due to the markets in China as well as the expanded uses including large-scale power storage application. The price of gold has fallen slightly after recently reaching record highs. Demand for gold can also be influenced by economic conditions, attractiveness as an investment vehicle and the relative strength of the U.S. dollar and local investment currencies. The market price of uranium has increased due in large measure to projections as to the number of new nuclear energy plants that will be constructed in China, the United States and other jurisdictions. A number of other factors affect the market prices for other minerals. The aggregate effect of the factors affecting the prices of various minerals is impossible to predict with accuracy. Fluctuations in mineral prices may adversely affect the value of any mineral discoveries made on the properties with which we are involved, which may in turn affect the market price and liquidity of our common shares and our ability to pursue and implement our business plan. In addition, the price of both graphite and vanadium can fluctuate significantly on a month-to-month and year-to-year basis.
Because from time to time we hold a significant portion of our cash reserves in Canadian dollars, we may experience losses due to foreign exchange translations.
From time to time we hold a significant portion of our cash reserves in Canadian dollars. Due to foreign exchange rate fluctuations, the value of these Canadian dollar reserves can result in translation gains or losses in U.S. dollar terms. If there was a significant decline in the Canadian dollar versus the U.S. dollar, our converted Canadian dollar cash balances presented in U.S. dollars on our balance sheet would significantly decline. If the US dollar significantly declines relative to the Canadian dollar our quoted US dollar cash position would significantly decline as it would be more expensive in US dollar terms to pay Canadian dollar expenses. We have not entered into derivative instruments to offset the impact of foreign exchange fluctuations.
We are exposed to general economic conditions, which could have a material adverse impact on our business, operating results and financial condition.
Recently there have been adverse conditions and uncertainty in the global economy as the result of unstable global financial and credit markets, inflation, and recession. These unfavorable economic conditions and the weakness of the credit market may continue to have, an impact on our Company’s business and our Company’s financial condition. The current global macroeconomic environment may affect our Company’s ability to access the capital markets may be severely restricted at a time when our Company wishes or needs to access such markets, which could have a materially adverse impact on our Company’s flexibility to react to changing economic and business conditions or carry on our operations.
Until we can fully validate, the properties described herein have no known mineral reserves of any kind, as defined under U.S. Guidelines.
Further details regarding our Company’s properties, although not incorporated by reference, including the comprehensive geological report prepared in compliance with Canada’s National Instrument 43-101 on the Green Giant Property in Madagascar and on the Molo Graphite Deposit in Madagascar, have been filed within our Company’s filings on Sedar at http://www.sedar.com (which website is expressly not incorporated by reference into this filing).
Climate change and related regulatory responses may impact our business.
Climate change as a result of emissions of greenhouse gases is a current topic of discussion and may generate government regulatory responses in the near future. It is impracticable to predict with any certainty the impact of climate change on our business or the regulatory responses to it, although we recognize that they could be significant. However, it is too soon for us to predict with any certainty the ultimate impact, either directionally or quantitatively, of climate change and related regulatory responses.
43
To the extent that climate change increases the risk of natural disasters or other disruptive events in the areas in which we operate, we could be harmed. While we maintain rudimentary business recovery plans that are intended to allow us to recover from natural disasters or other events that can be disruptive to our business, our plans may not fully protect us from all such disasters or events.
The current financial environment may impact our business and financial condition that we cannot predict.
The continued instability in the global financial system and related limitation on availability of credit may continue to have an impact on our business and our financial condition, and we may continue to face challenges if conditions in the financial markets do not improve. Our ability to access the capital markets has been restricted as a result of the economic downturn and related financial market conditions and may be restricted in the future when we would like, or need, to raise capital. The difficult financial environment may also limit the number of prospects for potential joint venture, asset monetization or other capital raising transactions that we may pursue in the future or reduce the values we are able to realize in those transactions, making these transactions uneconomic or difficult to consummate.
Public disclosure requirements and compliance with changing regulation of corporate governance pose challenges for our management team and result in additional expenses and costs which may reduce the focus of management and the profitability of our company.
Changing laws, regulations and standards relating to corporate governance and public disclosure, including the Dodd-Frank Wall Street Reform and Consumer Protection Act and the rules and regulations promulgated thereunder, the Sarbanes-Oxley Act and SEC regulations, have created uncertainty for public companies and significantly increased the costs and risks associated with accessing the U.S. public markets. Our management team will need to devote significant time and financial resources to comply with both existing and evolving standards for public companies, which will lead to increased general and administrative expenses and a diversion of management time and attention from revenue generating activities to compliance activities.
ITEM 2. UNREGISTERED SALES OF EQUITY SECURITIES AND USE OF PROCEEDS
We have funded our business to date from sales of our securities. From July 1, 2013 through December 31, 2014, the Company issued the following unregistered securities:
|
·
|
On July 9, 2013, we issued 1,255,000 stock options to directors, officers and consultants at $0.11 per share.
|
|
·
|
Between July 26, 2013 and August 1, 2013, we closed a private placement raising $2,043,452. We issued 16,950,001 common stock at prices of $0.12 and $0.121 per share. We issued 402,000 compensation warrants at an exercise price of 0.11 and 150,000 compensation warrants at an exercise price of $0.12.
|
|
·
|
On September 19, 2013, we issued 750,000 stock options to directors, officers and consultants at $0.15 per share.
|
|
·
|
On October 9, 2013, we issued 250,000 stock options to a director at $0.13 per share.
|
|
·
|
On December 18, 2013 we closed a non-brokered financing and raised $1,479,024. We issued 11,189,215 common shares at $0.1322 per share. We also issued 671,353 compensation warrants at $0.115 per share.
|
|
·
|
On January 10, 2014, we issued 4,625,000 stock options to directors and officers at $0.18 per share.
|
|
·
|
On January 15, 2014 and January 31, 2014, we closed a private placement raising a total of $6,906,008. The Company issued 62,384,067 common shares at $0.111 and 31,192,033 common share purchase warrants. We also issued 3,396,744 compensation warrants.
|
|
·
|
On February 6, 2014, we issued 250,000 stock options to a consultant at $0.18 per share.
|
|
·
|
On June 23, 2014, we issued 2,500,000 common stock to Malagasy at $0.13 per share for the Molo Graphite Project.
|
|
·
|
On July 3 2014, we issued 4,800,000 stock options to directors and officers at $0.15 per share.
|
|
·
|
On September 18, 2014, 571,353 broker warrants were exercised at $0.126 for total proceeds of $72,049.
|
|
·
|
On September 26, 2014, we issued 34,285,714 shares of common stock at $0.14 per share raising $4,800,000. The Offering consisted of brokered and non-brokered portions, with our company issuing 1,928,571 On September 26, 2014, we issued 34,285,714 shares of common stock at $0.14 per share raising $4,800,000. The Offering consisted of brokered and non-brokered portions, with our company issuing 1,928,571 compensation common share purchase warrants. .
|
|
·
|
On December 30, 2014, we issued 4,900,000 shares of common stock at $0.12 per share raising $588,000. We also issued 147,000 compensation common share purchase warrants.
|
44
The offer and sale of all shares of our common shares and warrants listed above were affected in reliance on the exemptions for sales of securities not involving a public offering, as set forth in Regulation S promulgated under the Securities Act. The Investor acknowledged the following: Subscriber is not a United States Person, nor is the Subscriber acquiring the shares of our common stock and warrants directly or indirectly for the account or benefit of a United States Person. None of the funds used by the Subscriber to purchase the shares of our common stock and warrants have been obtained from United States Persons. For purposes of this Agreement, “United States Person” within the meaning of U.S. tax laws, means a citizen or resident of the United States, any former U.S. citizen subject to Section 877 of the Internal Revenue Code, any corporation, or partnership organized or existing under the laws of the United States of America or any state, jurisdiction, territory or possession thereof and any estate or trust the income of which is subject to U.S. federal income tax irrespective of its source, and within the meaning of U.S. securities laws, as defined in Rule 902(o) of Regulation S, means: (i) any natural person resident in the United States; (ii) any partnership or corporation organized or incorporated under the laws of the United States; (iii) any estate of which any executor or administrator is a U.S. person; (iv) any trust of which any trustee is a U.S. person; (v) any agency or branch of a foreign entity located in the United States; (vi) any non-discretionary account or similar account (other than an estate or trust) held by a dealer or other fiduciary for the benefit or account of a U.S. person; (vii) any discretionary account or similar account (other than an estate or trust) held by a dealer or other fiduciary organized, incorporated, or (if an individual) resident in the United States; and (viii) any partnership or corporation if organized under the laws of any foreign jurisdiction, and formed by a U.S. person principally for the purpose of investing in securities not registered under the Securities Act, unless it is organized or incorporated, and owned, by accredited investors (as defined in Rule 501(a)) who are not natural persons, estates or trusts. Further, we anticipate that additional funding will be in the form of equity financing from the sale of our common stock. However, we cannot provide investors with any assurance that we will be able to raise sufficient funding for additional phases of exploration. We currently believe that debt financing will not be an alternative for funding additional phases of exploration. We do not have any arrangements in place for any future equity financing.
ITEM 3. DEFAULTS UPON SENIOR SECURITIES
There were no defaults upon senior securities during the period ended December 31, 2014.
ITEM 4. MINE SAFETY DISCLOSURES
Not applicable.
ITEM 5. OTHER INFORMATION
There is no information with respect to which information is not otherwise called for by this form.
WHERE YOU CAN FIND MORE INFORMATION
We file annual, quarterly and current reports, proxy statements and other information with the Commission. Our Commission filings are available to the public over the Internet at the Commission’s website at http://www.sec.gov. The public may also read and copy any document we file with the Commission at its Public Reference Room at 100 F Street, N.E., Washington, D.C. 20549, on official business days during the hours of 10:00 am to 3:00 pm. The public may obtain information on the operation of the Public Reference Room by calling the Commission at 1-800-SEC-0330. We maintain a website at http://www.energizerresources.com, (which website is expressly not incorporated by reference into this filing). Information contained on our website is not part of this report on Form 10-Q.
45
ITEM 6. – EXHIBITS
Exhibit Number & Description
|
3.1
|
Articles of Incorporation of Uranium Star Corp. (now known as Energizer Resources Inc.) (Incorporated by reference to Exhibit 3.1 to the registrant’s current report on Form 8-K as filed with the SEC on May 20, 2008)
|
|
3.2
|
Articles of Amendment to Articles of Incorporation of Uranium Star Corp. changing its name to Energizer Resources Inc. (Incorporated by reference to Exhibit 3.1 to the registrant’s current report on Form 8-K filed with the SEC on July 16, 2010)
|
|
3.3
|
Amended and Restated By-Laws of Energizer Resources Inc. (Incorporated by reference to Exhibit 3.2 to the registrant’s current report on Form 8-K as filed with the SEC on July 16, 2010)
|
|
3.4
|
Amendment to the By-Laws of Energizer Resources Inc. (Incorporated by reference to the registrant’s current report on Form 8-K as filed with the SEC on October 16, 2013)
|
|
4.1
|
Amended and Restated 2006 Stock Option Plan of Energizer Resources, Inc. (as of February 2009) (Incorporated by reference to Exhibit 4.1 to the registrant's Form S-8 registration statement as filed with the SEC on February 19, 2010)
|
|
4.2
|
Form of broker Subscription Agreement for Units (Canadian and Offshore Subscribers) (Incorporated by reference to Exhibit 4.1 to the registrant’s current report on Form 8-K as filed with the SEC on March 19, 2010)
|
|
4.3
|
Form of standard Subscription Agreement for Units (Canadian and Offshore Subscribers) (Incorporated by reference to Exhibit 4.2 to the registrant’s current report on Form 8-K as filed with the SEC on March 19, 2010)
|
|
4.4
|
Form of Warrant to Purchase common shares (Incorporated by reference to Exhibit 4.3 to the registrant’s current report on Form 8-K as filed with the SEC on March 19, 2010)
|
|
4.5
|
Form of Class A broker warrant to Purchase common shares (Incorporated by reference to Exhibit 4.4 to the registrant’s current report on Form 8-K as filed with the SEC on March 19, 2010)
|
|
4.6
|
Form of Class B broker warrant to Purchase common shares (Incorporated by reference to Exhibit 4.5 to the registrant’s current report on Form 8-K as filed with the SEC on March 19, 2010)
|
|
4.7
|
Agency Agreement, dated March 15, 2010, between Energizer Resources, Clarus Securities Inc. and Byron Securities Limited (Incorporated by reference to Exhibit 4.6 to the registrant’s current report on Form 8-K filed with the SEC on March 19, 2010)
|
|
4.8
|
Form of Warrant relating to private placement completed during November 2012.
|
|
4.9
|
Agency Agreement relating to private placement completed during November 2012.
|
|
4.10.
|
Amended and Restated Stock Option Plan of Energizer Resources, Inc. (Incorporated by reference to the registrant’s current report on Form 8-K as filed with the SEC on October 16, 2013)
|
|
10.1
|
Property Agreement effective May 14, 2004 between Thornton J. Donaldson and Thornton J. Donaldson, Trustee for Yukon Resources Corp. (Incorporated by reference to Exhibit 10.1 to the registrant's Form SB-2 registration statement as filed with the SEC on September 14, 2004)
|
|
10.2
|
Letter of Intent dated March 10, 2006 with Apofas Ltd. (Incorporated by reference to Exhibit 99.1 to the registrant's current report on Form 8-K as filed with the SEC on March 13, 2006)
|
|
10.3
|
Letter agreement effective May 12, 2006 between Yukon Resources Corp. and Virginia Mines Inc. (Incorporated by reference to Exhibit 99.1 to the registrant's current report on Form 8-K filed as with the SEC on May 9, 2006)
|
|
10.4
|
Joint Venture Agreement dated August 22, 2007 between Uranium Star Corp. & Madagascar Minerals and Resources Sarl (Incorporated by reference to Exhibit 10.1 to the registrant's Form 8-K as filed with SEC on September 11, 2007)
|
|
10.5
|
Share Purchase Agreement between Madagascar Minerals and Resources Sarl and THB Venture Limited (a subsidiary of Energizer Resources Inc.) dated July 9, 2009 (Incorporated by reference to Exhibit 10.5 to the registrant’s Form 10-K/A as filed on April 8, 2013)
|
|
10.6
|
Joint Venture Agreement between Malagasy Minerals Limited and Energizer Resources Inc. dated December 14, 2011 (Incorporated by reference to Exhibit 10.6 to the registrant’s Form 10-K/A as filed on April 8, 2013).
|
|
10.7
|
Agreement to Purchase Interest In Claims between Honey Badger Exploration Inc. and Energizer Resources Inc. dated February 28, 2014.(Incorporated by reference to Exhibit 10.7 to the registrant’s Form 10-Q as filed on May 14, 2014).
|
|
10.8
|
Sale and Purchase Agreement between Malagasy Minerals Limited and Energizer Resources Inc. dated April 16, 2014 (Incorporated by reference to Exhibit 10.8 to the registrant’s Form 10-Q as filed on May 14, 2014).
|
|
10.9
|
ERG Project Minerals Rights Agreement between Malagasy Minerals Limited and Energizer Resources Inc. dated April 16, 2014 (Incorporated by reference to Exhibit 10.9 to the registrant’s Form 10-Q as filed on May 14, 2014).
|
|
10.10
|
Green Giant Project Joint Venture Agreement between Malagasy Minerals Limited and Energizer Resources Inc. dated April 16, 2014 (Incorporated by reference to Exhibit 10.9 to the registrant’s Form 10-Q as filed on May 14, 2014).
|
|
21
|
Subsidiaries of the Registrant (Incorporated by reference to Exhibit 21.1 to the registrant’s annual report on Form 10-K filed with the SEC on September 21, 2009)
|
|
99.1
|
Canadian National Instrument 43-101 Technical Report Update for Green Giant Property, Fotadrevo, Province of Toliara, Madagascar (Incorporated by reference to Exhibit 99.1 to the registrant's report on Form 8-K filed with SEC on July 9, 2010).
|
46
SIGNATURES
Pursuant to the requirements of Section 13 or 15(d) of the Securities Exchange Act of 1934 the registrant has duly caused this report to be signed on its behalf by the undersigned, thereunto duly authorized.
ENERGIZER RESOURCES INC.
Dated: February 11, 2015
| By: | /s/ Richard Schler | ||
| Name: | Richard Schler | ||
| Title: | Chief Executive Officer and Director | ||
Dated: February 11, 2015
| By: | /s/ Peter Liabotis | ||
| Name: | Peter Liabotis | ||
| Title: | Chief Financial Officer (Principal Accounting Officer) | ||
47