Attached files
| file | filename |
|---|---|
| 8-K - FORM 8-K - WILLIS TOWERS WATSON PLC | d870061d8k.htm |
| EX-99.1 - EX-99.1 - WILLIS TOWERS WATSON PLC | d870061dex991.htm |
 FOURTH
QUARTER 2014 RESULTS
Willis Group Holdings
February, 2015
Exhibit 99.2 |
 This presentation
contains certain “forward-looking statements” within the meaning of Section 27A of the Securities Act of 1933, and Section 21E of the Securities Exchange Act of 1934,
which are intended to be covered by the safe harbors created by those laws. These forward-looking
statements include information about possible or assumed future results of our operations.
All statements, other than statements of historical facts, included in this document that address
activities, events or developments that we expect or anticipate may occur in the future,
including such things as our outlook, potential cost savings and accelerated adjusted operating margin
and adjusted earnings per share growth, future capital expenditures, growth in commissions and
fees, business strategies, competitive strengths, goals, the benefits of new initiatives, growth of our business and operations, plans, and references to future successes
are forward-looking statements. Also, when we use the words such as ‘anticipate’,
‘believe’, ‘estimate’, ‘expect’, ‘intend’, ‘plan’, ‘probably’, or similar expressions, we are making forward-
looking statements.
There are important uncertainties, events and factors that could cause our actual results or
performance to differ materially from those in the forward-looking statements contained in this
document, including the following: the impact of any regional, national or global political, economic,
business, competitive, market, environmental or regulatory conditions on our global business
operations; the impact of current global economic conditions on our results of operations and financial condition, including as a result of those associated with the Eurozone, any
insolvencies of or other difficulties experienced by our clients, insurance companies or financial
institutions; our ability to implement and fully realize anticipated benefits of our growth
strategy and revenue generating initiatives; our ability to implement and realize anticipated benefits
of any expense reduction initiative, including our ability to achieve expected savings from the
multi-year operational improvement program as a result of unexpected costs or delays and demand on managerial, operational and administrative resources and/or macroeconomic
factors affecting the program; changes in the tax or accounting treatment of our operations and
fluctuations in our tax rate; volatility or declines in insurance markets and premiums on which
our commissions are based, but which we do not control; our ability to develop and implement
technology solutions and invest in innovative product offerings in an efficient and effective
manner; our ability to continue to manage our significant indebtedness; our ability to compete in our
industry; our ability to develop new products and services; material changes in
commercial property and casualty markets generally or the availability of insurance products or
changes in premiums resulting from a catastrophic event, such as a hurricane; our ability to
retain key employees and clients and attract new business; the timing or ability to carry out share
repurchases and redemptions; the timing or ability to carry out refinancing or take other steps
to manage our capital and the limitations in our long-term debt agreements that may restrict our ability to take these actions; fluctuations in our earnings as a result of potential
changes to our valuation allowance(s) on our deferred tax assets; any fluctuations in exchange and
interest rates that could affect expenses and revenue; the potential costs and difficulties in
complying with a wide variety of foreign laws and regulations and any related changes, given the global scope of our operations; rating agency actions, including a downgrade to our
credit rating, that could inhibit our ability to borrow funds or the pricing thereof and in certain
circumstances cause us to offer to buy back some of our debt; a significant decline in the value
of investments that fund our pension plans or changes in our pension plan liabilities or funding
obligations; our ability to achieve anticipated benefits of any acquisition or other transactions
in which we may engage, including any revenue growth or operational efficiencies; our ability to
effectively integrate any acquisition into our business; our inability to exercise full
management control over our associates, such as Gras Savoye; our ability to receive dividends or other
distributions in needed amounts from our subsidiaries; any potential impact from the US
healthcare reform legislation; our involvement in and the results of any regulatory investigations, legal proceedings and other contingencies; underwriting, advisory or reputational risks
associated with non-core operations as well as the potential significant impact our non-core
operations (including the Willis Capital Markets & Advisory operations) can have on our financial
results; our exposure to potential liabilities arising from errors and omissions and other potential
claims against us; the interruption or loss of our information processing systems, data
security breaches or failure to maintain secure information systems; and impairment of the goodwill in
one of our reporting units, in which case we may be required to record significant charges to
earnings. The foregoing list of factors is not exhaustive and new factors may emerge from time to time that
could also affect actual performance and results. For additional information see also Part I,
Item 1A “Risk Factors” included in Willis’ Form 10-K for the year ended December
31, 2013, and our subsequent filings with the Securities and Exchange Commission. Copies are available
online at http://www.sec.gov or on request from the Company.
Although we believe that the assumptions underlying our forward-looking statements are reasonable,
any of these assumptions, and therefore also the forward-looking statements based on these
assumptions, could themselves prove to be inaccurate. In light of the significant uncertainties inherent in the forward-looking statements included in this presentation, our inclusion of
this information is not a representation or guarantee by us that our objectives and plans will be
achieved. Our forward-looking statements speak only as of the date made and we will not
update these forward-looking statements unless the securities laws require us to do so. In light
of these risks, uncertainties and assumptions, the forward-looking events discussed in this
Important disclosures regarding forward-looking statements
1
presentation may not occur, and we caution you against unduly relying on these forward-looking
statements.
|
 Important disclosures regarding non-GAAP measures
2
This presentation contains references to "non-GAAP financial measures" as defined in
Regulation G of SEC rules. We present these measures because we believe they are of
interest to the investment community and they provide additional meaningful methods of evaluating certain aspects of the Company’s operating performance from
period to period on a basis that may not be otherwise apparent on a generally accepted accounting
principles (GAAP) basis. These financial measures should be viewed in addition to, not in
lieu of, the Company’s condensed consolidated income statements and balance sheet as of the relevant date. Consistent with Regulation G, a
description of such information is provided below and a reconciliation of certain of such items to
GAAP information can be found in our periodic filings with the SEC. Our method of
calculating these non-GAAP financial measures may differ from other companies and therefore comparability may be limited.
Definitions of non-GAAP financial measures We
believe that investors’ understanding of the Company’s performance is enhanced by our disclosure of the following non-GAAP financial measures. Our method of
calculating these measures may differ from those used by other companies and therefore comparability
may be limited.
Organic commissions and fees growth
Organic commissions and fees growth excludes: (i) the impact of foreign currency translation; (ii) the
first twelve months of net commission and fee revenues generated from acquisitions; and (iii)
the net commission and fee revenues related to operations disposed of in each period presented, from reported commissions and fees growth.
We believe organic growth in commissions and fees provides a measure that the investment community may
find helpful in assessing the performance of operations that were part of our operations in
both the current and prior periods, and provides a measure against which our businesses may be assessed in the future.
Underlying commissions and fees, underlying revenues, underlying total expenses, underlying salaries
and benefits, underlying other operating expenses, underlying operating income, underlying
operating margin, underlying EBITDA, underlying net income and underlying net income per diluted share (“Underlying measures”).
Underlying measures are calculated by excluding the impact of certain items, including foreign
currency translation, from the most directly comparable GAAP measures. We believe that
excluding such items provides a more complete and consistent comparative analysis of our results of operations.
Organic revenues, organic total expenses, organic salaries and benefits, organic other operating
expenses, organic operating income, organic operating margin and organic EBITDA (“Organic
measures”).
Organic measures are calculated by excluding the twelve month impact from acquisitions and disposals
(together with the impact of certain items, including foreign currency translation noted
above), from the most directly comparable GAAP measures. We believe that excluding these items provides a more complete and consistent
comparative analysis of our results of operations.
|
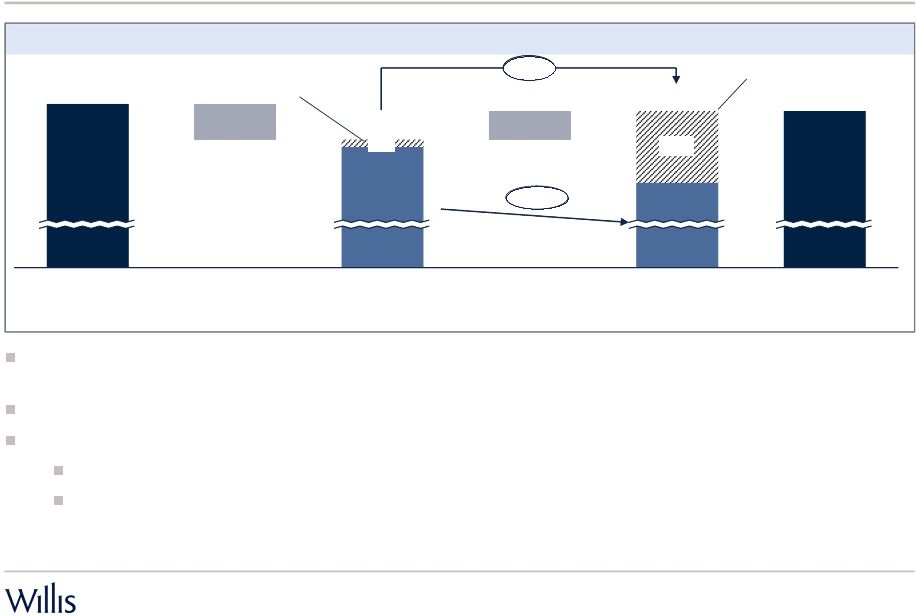
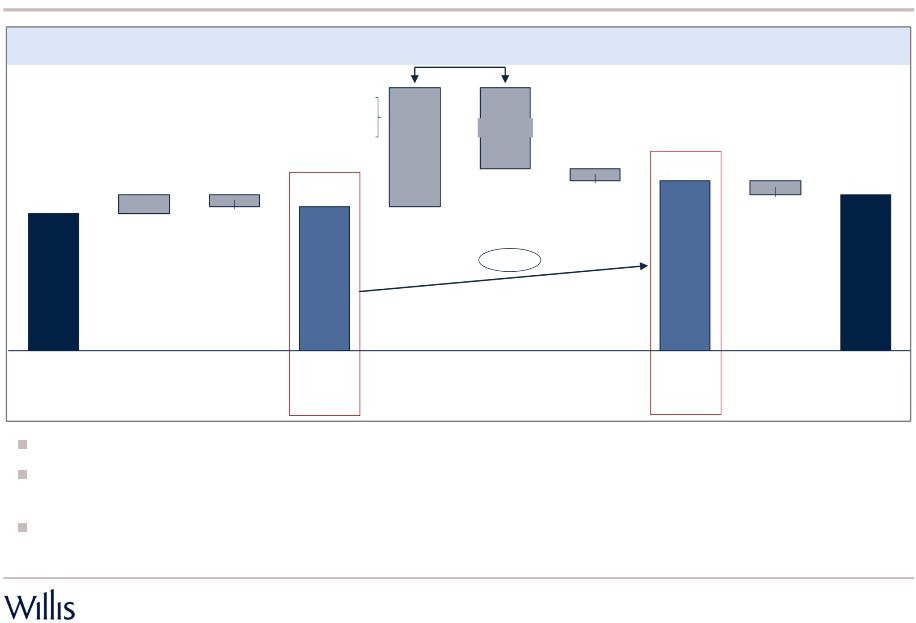 4Q
2014 EPS growth 3
See important disclosures regarding non-GAAP measures on page 2 and
reconciliations starting on page 20 Net revenue and expense growth increased
Underlying EPS by $0.10 Primary driver was organic growth in C&F (+3.6%)
outpacing organic expense growth (+2.7%), as well as net profit derived from
net acquisitions and disposals Also positively impacted by a net settlement
for a book of business within our Global segment (included in other
income) Reported EPS grew 13.5%; Underlying EPS grew 17.9%
4Q 2014
Reported EPS
Adjusting
Items
($0.04)
4Q 2014
Underlying
EPS
Other
($0.03)
Total
Operating
Expenses
($0.22)
Total
Revenues
4Q 2013
Underlying
EPS
Foreign
Currency
Movements
($0.03)
Adjusting
Items
4Q 2013
Reported EPS
Adjusting item:
Deferred tax valuation
allowance = $0.05
Business performance = $0.10
-
Commissions and fees
= $0.27
-
Investment & other
income = $0.05
Adjusting items:
Operational Improvement
Program = $0.06
Gain on Disposal = $(0.02)
17.9%
$0.05
$0.32
$0.42
$0.46
$0.39
$0.37 |
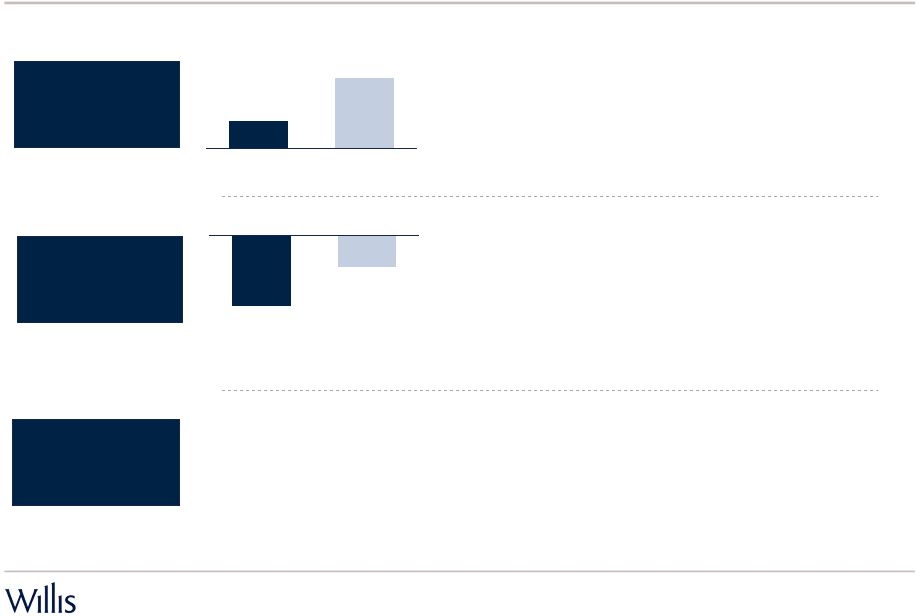
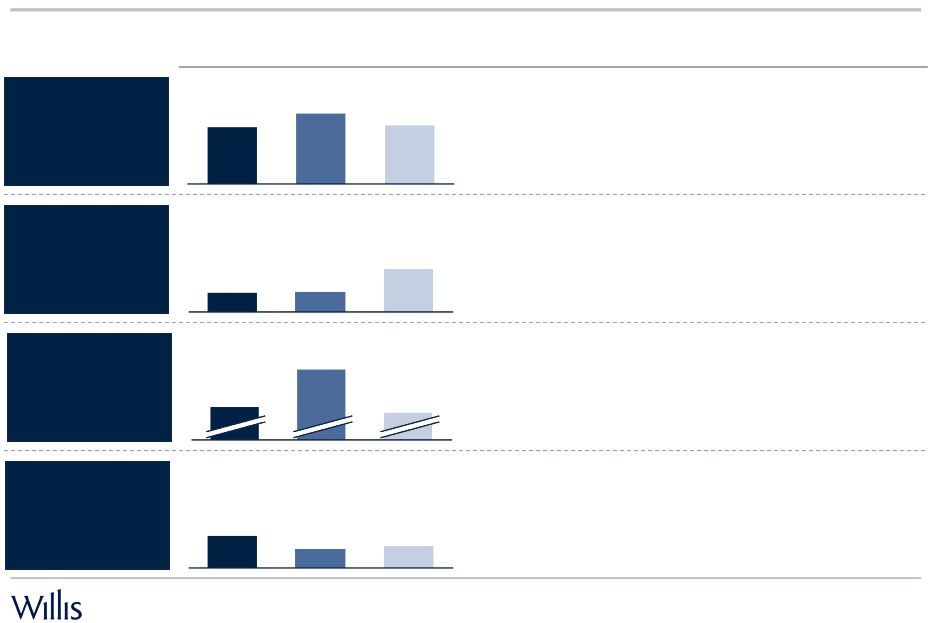
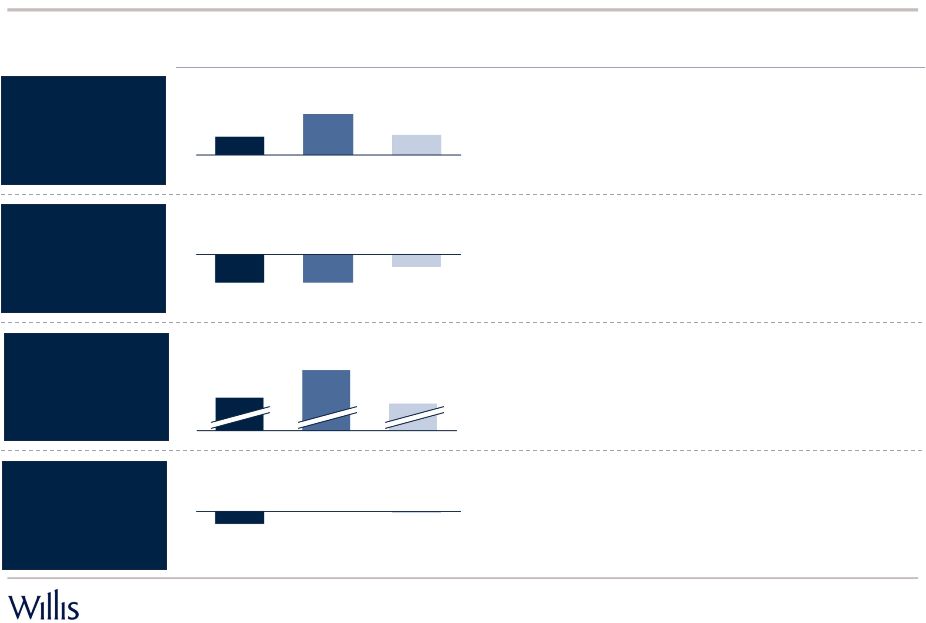 4Q
2014 Commissions and fees growth 4
•
Reported impacted by FX movements and net M&A
activity
•
Underlying reflects strong M&A activity
•
Excellent organic result driven by strong growth in all
regions
•
Reported impacted by FX movements and net M&A
activity
•
Underlying reflects impact of M&A activity
•
Organic growth driven by International and Willis Re
•
Reported C&F impacted by FX movements
•
Growth in Willis Re offset by decline in UK Insurance
•
Reported and underlying C&F impacted by disposals
and prior year adjustment
•
Human Capital, FINEX up solidly while Construction
down
3.1%
7.2%
3.6%
-4.9%
-2.1%
-4.9%
15.9%
18.6%
32.7%
-0.3%
-2.1%
0.0%
See important disclosures regarding non-GAAP measures on page 2 and
reconciliations starting on page 20 Group
North America
International
Global
% Growth Q4 2014 versus 4Q 2013
Reported
Organic
Underlying
Commentary |
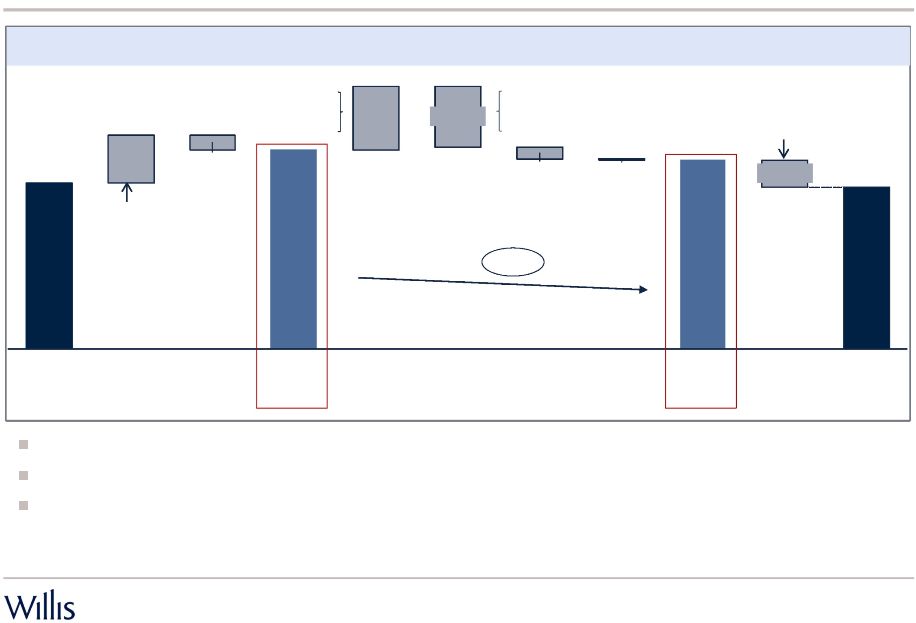
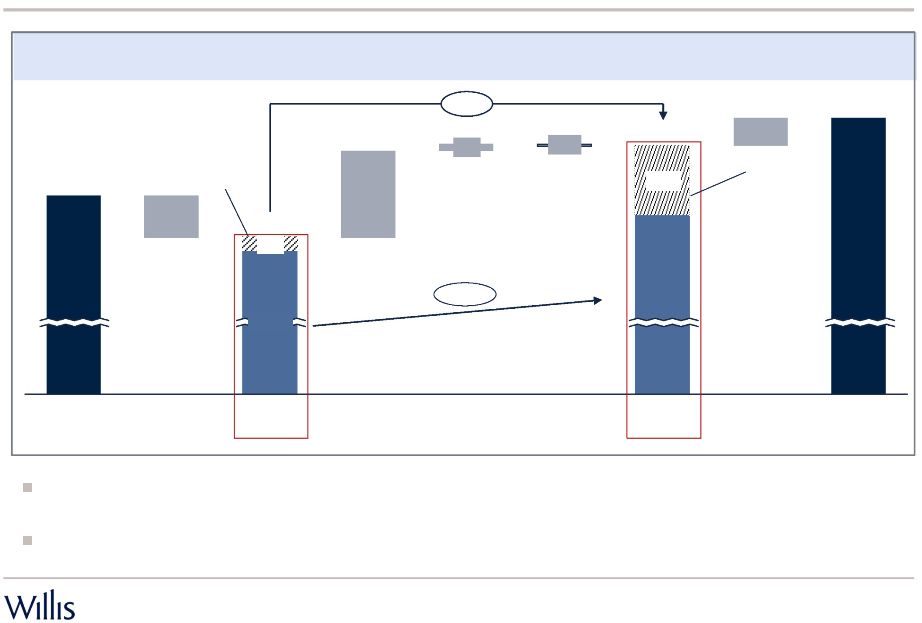 4Q
2014 Total operating expenses Increased
net
expenses
from
acquisitions
and
disposals
accounted
for
440
bps
of
the
underlying
expense growth
Organic expense growth driven by higher salaries and benefits, partially offset by
lower other operating expenses
5
$ millions
Foreign
Currency
Movement
($24)
4Q 2013
Reported
$774
7.1%
4Q 2014
Reported
$819
Operational
Improvement
Program
4Q 2014
Underlying
$803
$750
4Q 2013
Underlying
Salaries and
Benefits
$7
$4
Other operating
Expenses
($1)
Depreciation
and
Amortization
$40
2.7%
Organic growth
Acquisitions and Disposals
Acquisitions and Disposals
See important disclosures regarding non-GAAP measures on page 2 and
reconciliations starting on page 20 $16
$50
$763
$743
Organic total expense growth of 2.7%; underlying expense growth of 7.1% heavily impacted by
M&A
|
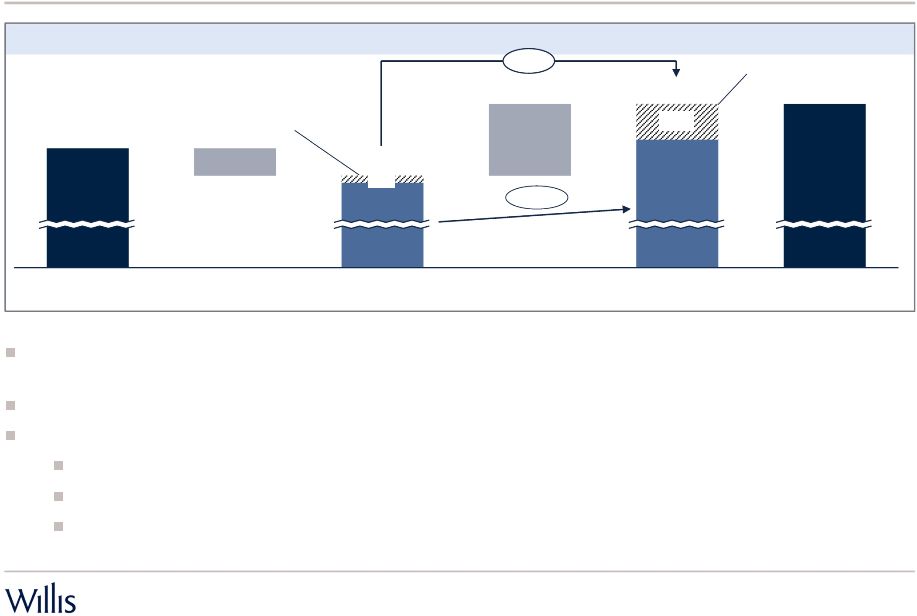 4Q
2014 Salaries and benefits 6
Underlying salaries and benefits growth impacted by net acquisitions and
disposals $5
($19)
$569
9.1%
$600
$600
$575
$25
$550
$545
5.5%
Organic growth
Reported S&B included $19 million from favorable FX movements offset by $20
million increase from M&A activity (primarily Max Matthiessen)
Underlying
grew
$50
million,
including
$20
million
increase
from
M&A
activity
Organic growth reflects:
Salary increases of between 2%~3% globally, in line with inflation
Period over period organic headcount growth
Increased production incentives driven by higher C&F growth in International
Acquisitions and Disposals
Acquisitions and Disposals
$ millions
See important disclosures regarding non-GAAP measures on page 2 and
reconciliations starting on page 20 $50
4Q 2013
Reported
Foreign Currency
Movement
4Q 2013
Underlying
Salaries and Benefits
4Q 2014
Underlying
4Q 2014
Reported |
 Organic
17,800
17,900
LTM Net M&A
200
500
Total FTEs
18,000
18,400
4Q 2014 Salaries and benefits
7
Organic S&B relatively flat from 1Q14 through 4Q14
3Q14
$600
$569
$25
4Q14
$3
2Q14
$575
$2
1Q14
$570
$3
4Q13
$550
$5
Organic
Acquisitions and Disposals
Underlying S&B increased in 4Q14 due to net M&A activity
Organic S&B relatively flat throughout 2014
Organic headcount growth of ~1% in 2014
About 50% of the increase in 2014 total FTEs in Mumbai
Underlying
$ millions
See important disclosures regarding non-GAAP measures on page 2 and
reconciliations starting on page 20 $545
$567
$573
$566
$575 |
 Spend
$36
$130
$240
$410
Savings
$11
$60
$135
$235
$420
$300
Operational Improvement Program and metrics
8
$ millions
2014A
2015E
2016E
2017E
Cumulative
2014-2017E
Annualized
2018+E
Key metrics :
3/31/14
12/31/14
•
Ratio of full time employees (FTEs) in higher cost vs. lower
cost
near-shore and off-shore centers
•
Ratio of square footage of real estate per FTE (indexed to 100)
•
Ratio of desks per FTE (indexed to 100)
80:20
100
100
(1)
Excludes the impact from acquisitions which were largely in higher cost
geographies 78:22
(1)
98
99 |
 11.6%
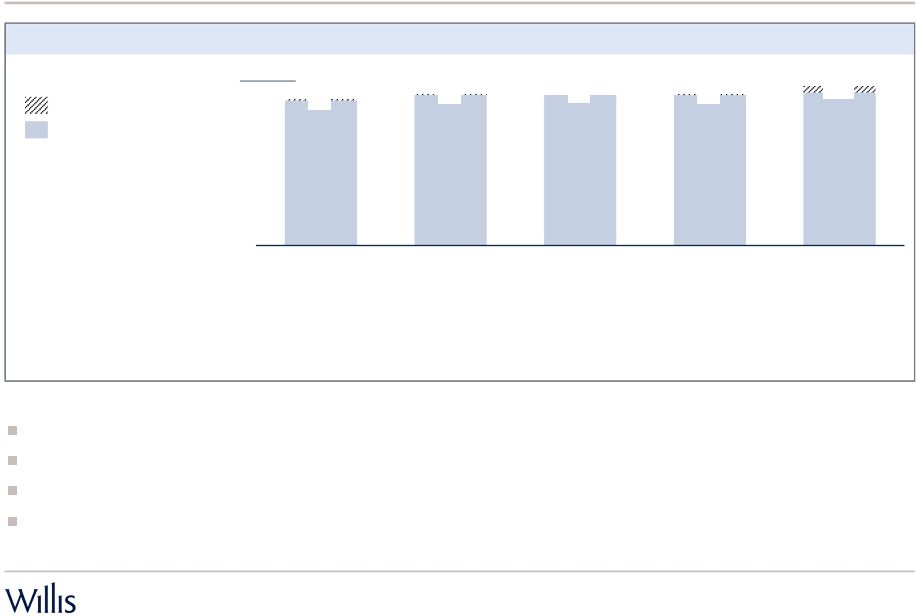
4Q and FY 2014 underlying EBITDA
Full year underlying EBITDA up modestly; 4Q14 up 11.6%
9
$ millions
$359
$362
$191
$187
$96
$87
$173
$193
1.2%
Q1
Q2
Q3
Q4
2014
$829
2013
$819
See important disclosures regarding non-GAAP measures on page 2 and
reconciliations starting on page 20 Full year underlying EBITDA driven
by: Revenue growth
Solid organic revenue growth and growth from acquisitions including Max Matthiessen
in 4Q Expense growth reflects:
Late 2013 investments negatively impacted 1H2014
2H 2014 expense growth moderated resulting in 4Q growth in EBITDA, improved
margins and positive spread between organic revenue and expenses
|
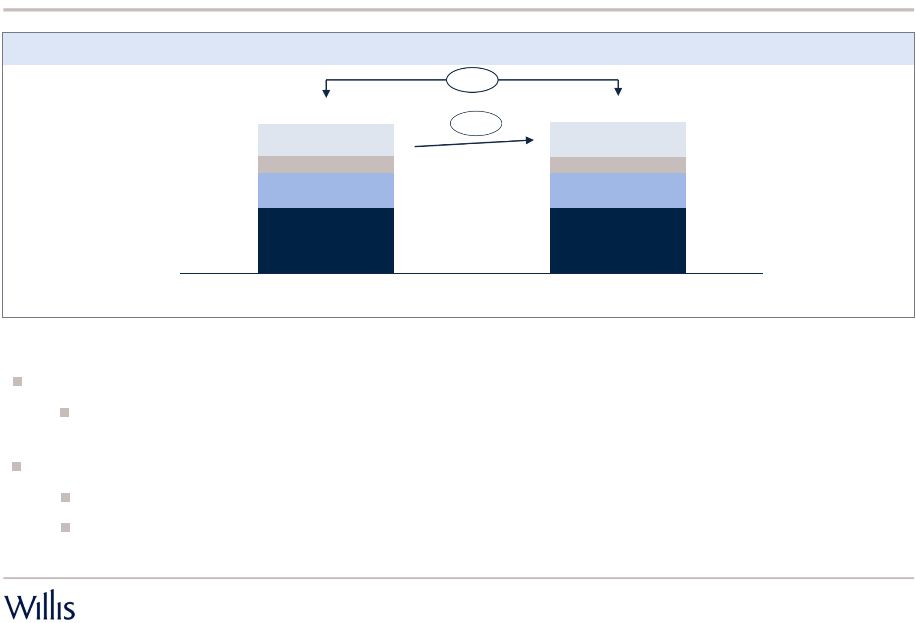
 Corporate uses of cash and cash balance
10
•
Cash on hand down from prior year primarily due to
significantly increased corporate uses of cash, per above
including:
•
Cash consideration paid for acquisitions, including
Charles Monat and Max Matthiessen
•
Net cash outflow from the issue and repurchase of
shares
Cash as of
Corporate Uses of Cash
$ millions
$ millions
$113
$193
$210
$213
$112
$241
2013
$30
$335
$777
2014
Dividends
Capex
Share buyback
Acquisitions
$635
$796
•
Significantly higher level of M&A in 2014
•
Announced share buyback program for 2014 completed in
October
•
2014 dividend payout increased 9% from prior year
•
CapEx unchanged
Dec 31
2013
Dec 31
2014 |
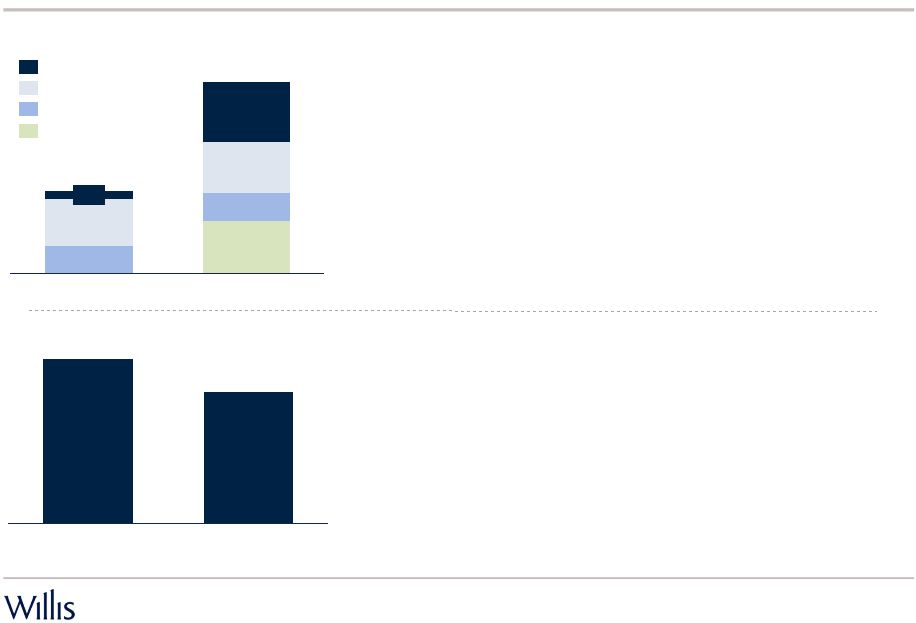
 2013
Investor Conference Key Metrics / Goals 11
Capital Management
70 bps + spread of
organic C&F over organic
expense growth
Improving cash flows
Mid-single digit organic
revenue growth
-
Ongoing expense
management driving
progress
-
Operational Improvement
Program
-
Investments included
Global Wealth Solutions
and Connecting Willis
-
Increased strategic M&A
in 2014
-
Increased dividend and
completed buyback
-
Diversified and resilient
business model
-
Organic growth in each
segment for full year 2014
-
Cash flow remains key
focus
-
EBITDA improving in 4Q
Invest in the business
for growth
Targeted M&A
Steadily increasing
dividend
Repurchase shares
2014
Organic Growth
3.8%
2014
organic spread:
(80) basis points
4Q 2014
organic spread:
+90 basis points
2014
Underlying EBITDA:
+1.2%
4Q14
Underlying EBITDA:
+11.6%
2014 Progress |
 APPENDICES |
 4Q
2014 Other operating expenses 13
Ongoing expense management reflected in 3.1% organic decline
$155
$10
$161
$160
$1
($5)
$166
$165
2.5%
$165
(3.1)%
Organic decline
Reported decline in other operating expenses of (0.6)% included $5 million from
favorable FX movements and $9 million increase from M&A activity
Underlying growth included the $9 million increase from M&A activity
Organic decline reflects ongoing expense management initiatives
$3 million gain on system sale in 4Q14
non-recurrence of $2 million branding-related expenses incurred in 4Q13
Acquisitions and Disposals
Acquisitions and Disposals
$ millions
See important disclosures regarding non-GAAP measures on page 2 and
reconciliations starting on page 20 $4
4Q 2013
Reported
Foreign Currency
Movement
4Q 2013
Underlying
Other Operating
Expenses
4Q 2014
Underlying
4Q 2014
Reported |
 4Q
2014 Non-operating segment items and Corporate & other 14
•
Improved performance from Associates in 4Q14,
primarily Gras Savoye
•
FY 2014 performance +$14 million up from $nil in
prior year
•
$11 million increase due to higher WNA gains on
disposals
•
No significant year over year change in foreign
exchange gain/loss on revaluation
•
Underlying tax rates for 4Q14 and FY2014 of 24% and 25%, respectively.
•
Most significant underlying adjustment for 2014 was non-cash adjustment to
the deferred tax valuation allowance in the second quarter
Other
income/expense
Tax
Associates
$18
$7
4Q 2014
4Q 2013
($5)
4Q 2014
4Q 2013
($11) |
 2014
EPS growth 15
Reported EPS down 2.0%; Underlying EPS down 4.9%
($0.33)
Other
Higher
Tax Rate
($0.15)
Operating
Expenses
($0.75)
Total
Revenues
2013
Underlying
EPS
Foreign
Currency
Movements
Adjusting
Items
2013
Reported
EPS
Adjusting
Items
Adjusting items include:
-
Loss on debt extinguishment
=$0.34
-
Expense reduction initiative
= $0.21
-
Deferred tax valuation
allowance = $0.05
-
Salaries & benefits = $0.59
-
Other operating expenses = $0.15
-
Operational Improvement
Program = $(0.15)
-
Deferred tax valuation allowance
= $(0.12)
-
Venezuela devaluation = $(0.07)
Net impact from revenue and expense growth increased Underlying EPS by $0.04
However, impact of higher tax rate outweighed underlying business performance
Other items include improved contributions from Associates of $0.06, offset by
increased interest expense $(0.04) and higher share count $(0.02)
(4.9)%
See important disclosures regarding non-GAAP measures on page 2 and
reconciliations starting on page 20 ($0.19)
-
Commissions and fees
= $0.73
-
Investment & other
income = $0.06
($0.01)
$0.60
$0.79
$2.00
$2.33
$2.45
$2.04
2014
Underlying
EPS
2014
Reported
EPS |
 •
Mid-single digit organic growth despite challenging
market conditions in reinsurance and moderating rates
across markets
•
Underlying reflects net impact of acquisitions and
disposals
Group
•
Organic reflects growth across most geographic
regions, Employee Benefits and Construction
•
Reported and underlying reflect offices sold
North America
•
Strong organic growth driven by emerging markets and
Western Europe
•
Underlying higher due to acquisitions
International
2014 Commissions and fees growth
16
% Growth 2014 versus 2013
•
Reported reflects impact of foreign currency movements
•
Willis Re up mid-single digits
•
Willis Insurance UK down low single digits
Global
4.6%
3.8%
3.7%
2.8%
1.2%
1.3%
9.0%
14.8%
9.7%
1.2%
1.4%
2.1%
Reported
Organic
Underlying
See important disclosures regarding non-GAAP measures on page 2 and
reconciliations starting on page 20 Commentary |
 2014
Total operating expenses 17
$ millions
Expense growth reflects investments for growth made in late 2013
Increased
net
expenses
from
acquisitions
and
disposals
accounted
for
110
bps
of
the
underlying
expense growth
Organic expense growth primarily driven by higher salaries and benefits
Operational
Improvement
Program
$3,155
$3,119
$53
Depreciation
and
Amortization
$1
Other
operating
Expenses
Salaries and
Benefits
2014
Reported
$2,951
$19
Other
Adjustments
($47)
2013
Underlying
$6
2013
Reported
$2,992
5.7%
2014
Underlying
Foreign
Currency
Movement
4.6%
See important disclosures regarding non-GAAP measures on page 2 and
reconciliations starting on page 20 Acquisitions and Disposals
Acquisitions and Disposals
$3,066
$2,932
$133
$34
$36
Total organic operating expense growth of 4.6%; underlying growth of 5.7% driven by M&A
activity
|
 2014
Salaries and benefits 18
Organic S&B of 5.2%; underlying growth of 6.1%
Salaries and Benefits
$2,181
$2,168
$13
Foreign Currency
Movement
$3
Expense
Reduction Initiative
($29)
$2,207
6.1%
$2,314
$2,281
$33
$2,314
5.2%
Organic growth
Reported growth in S&B of 4.8% included $29 million from 2013 Expense Reduction
Initiative and $3 million from FX movements
Underlying S&B up $133 million, including $20 million increase in net
S&B from acquisitions and disposals Organic growth in S&B reflects:
Reflects investments made in late 2013 to drive growth
Global salary increases of between 2%~3%, in line with inflation
Organic headcount growth (excludes FTEs from acquisitions and disposals) of less
than 1% About 50% of the increase in total FTEs in Mumbai
Acquisitions and Disposals
Acquisitions and Disposals
$ millions
See important disclosures regarding non-GAAP measures on page 2 and
reconciliations starting on page 20 $133
2013
Reported
Reported
2014
2014
2013
Underlying
Underlying |
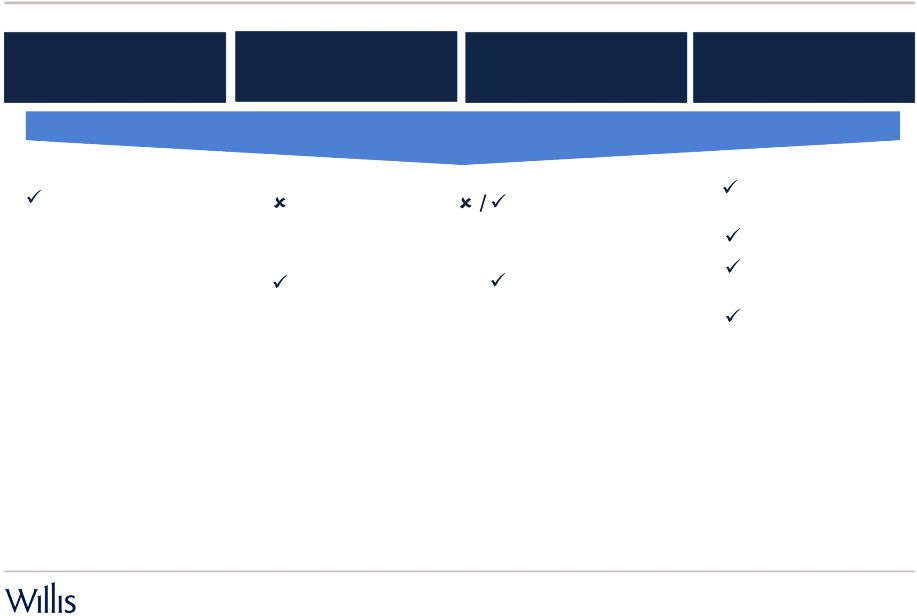
 New
Segment Structure 19
Willis Re
Willis Capital Markets
& Advisory
Wholesale
businesses (e.g.,
Miller)
Willis Portfolio and
Underwriting Services
New Segment structure from January 1, 2015
Report 1Q15 on new basis; expect to file restated financial information in March
2015 Willis Great Britain
Willis North America
Willis International
Willis Capital, Wholesale
and Reinsurance
Focused on serving
corporate clients,
delivering full range of
Willis expertise
across Great Britain
Focused on serving
corporate clients,
delivering full range of
Willis expertise
across the United
States and Canada
Focused on serving
corporate clients,
delivering full range of
Willis expertise
across Asia, CEMEA,
Latin America and
Western Europe |
 Important disclosures regarding non-GAAP measures
20
Commissions and fees analysis
2014
2013
Change
Foreign
currency
translation
Acquisitions
and
disposals
Organic
commissions
and fees
growth
($ millions)
%
%
%
%
Three months ended
December 31, 2014
North America
$328
$345
(4.9)
-
(2.8)
(2.1)
International
325
274
18.6
(14.1)
16.8
15.9
Global
286
292
(2.1)
(2.1)
0.3
(0.3)
Total
$939
$911
3.1
(4.1)
3.6
3.6
2014
2013
Change
Foreign
currency
translation
Acquisitions
and
disposals
Organic
commissions
and fees
growth
($ millions)
%
%
%
%
Twelve months ended
December 31, 2014
North America
$1,365
$1,349
1.2
(0.1)
(1.5)
2.8
International
1,016
926
9.7
(5.1)
5.8
9.0
Global
1,386
1358
2.1
0.9
(0.2)
1.4
Total
$3,767
$3,633
3.7
(0.9)
0.8
3.8 |
 Important disclosures regarding non-GAAP measures
21
Operating income to underlying and organic operating income
For prior periods, underlying measures have been rebased to current period exchange
rates to remove the impact of foreign currency movements when comparing periods
2013
2014
(In millions)
1Q
2Q
3Q
4Q
FY
1Q
2Q
3Q
4Q
FY
Total revenue
$1,051
$890
$795
$919
$3,655
$1,097
$935
$812
$958
$3,802
excluding:
Foreign currency movements
3
5
(3)
(35)
(30)
-
-
-
-
-
Underlying revenue
$1,054
$895
$792
$884
$3,625
$1,097
$935
$812
$958
$3,802
Net revenue from acquisitions and disposals
(5)
(6)
(8)
(11)
(30)
(2)
(4)
(7)
(43)
(56)
Organic revenue
$1,049
$889
$784
$873
$3,595
$1,095
$931
$805
$915
$3,746
Operating income
$281
$167
$70
$145
$663
$326
$148
$34
$139
$647
excluding:
Operational improvement program
-
-
-
-
-
-
3
17
16
36
Expense reduction initiative
46
-
-
-
46
-
-
-
-
-
Fees related to extinguishment of debt
-
-
1
-
1
-
-
-
-
-
Foreign currency movements
(4)
(11)
(10)
(11)
(36)
-
-
-
-
-
Underlying operating income
$323
$156
$61
$134
$674
$326
$151
$51
$155
$683
Net operating income from acquisitions and disposals
(2)
(2)
(3)
(4)
(11)
(2)
-
(2)
(3)
(3)
Organic operating income
$321
$154
$58
$130
$663
$324
$151
$49
$152
$680
Operating margin (operating income as a percentage of
total revenue)
26.7%
18.8%
8.8%
15.8%
18.1%
29.7%
15.8%
4.2%
14.5%
17.0%
Underlying operating margin (underlying operating
income as a percentage of underlying total revenue)
30.6%
17.4%
7.7%
15.2%
18.6%
29.7%
16.1%
6.3%
16.2%
18.0%
Organic operating margin (organic operating income as
a percentage of organic total revenue)
30.6%
17.3%
7.4%
14.9%
18.4%
29.6%
16.2%
6.1%
16.6%
18.2% |
 Important disclosures regarding non-GAAP measures
22
Net income (loss) to underlying net income
For prior periods, underlying measures have been rebased to current period exchange
rates to remove the impact of foreign currency movements when comparing periods
2013
2014
(In millions, except per share data)
1Q
2Q
3Q
4Q
YTD
1Q
2Q
3Q
4Q
FY
Net income (loss)
$219
$105
($27)
$68
$365
$246
$47
($7)
$76
$362
Excluding the following, net of tax:
Operational improvement program
-
-
-
-
-
-
2
14
11
27
Venezuela currency devaluation
-
-
-
-
-
-
13
-
-
13
Deferred tax valuation allowance
-
-
-
9
9
-
21
-
-
21
Expense reduction initiative
38
-
-
-
38
-
-
-
-
-
Net loss (gain) on disposal of operations
-
-
-
(1)
(1)
2
-
-
(4)
(2)
Fees related to extinguishment of debt
-
-
1
-
1
-
-
-
-
-
Loss on extinguishment of debt
-
-
60
-
60
-
-
-
-
-
Foreign currency movements
(6)
(5)
(18)
(5)
(34)
-
-
-
-
-
Underlying net income
$251
$100
$16
$71
$438
$248
$83
$7
$83
$421
Diluted shares outstanding
176
178
177
182
179
182
182
178
180
181
$1.24
$0.59
($0.15)
$0.37
Net income per diluted share
$ 2.04
$1.35
$0.26
($0.04)
$0.42
$2.00
$1.46
$0.56
$0.10
$0.39
Underlying net income per diluted share
$2.45
$1.36
$0.46
$0.04
$0.46
$2.33 |
 Important disclosures regarding non-GAAP measures
23
Net income (loss) to underlying and organic EBITDA
For prior periods, underlying measures have been rebased to current period exchange
rates to remove the impact of foreign currency movements when comparing periods 2013
2014
1Q
2Q
3Q
4Q
FY
1Q
2Q
3Q
4Q
FY
Net income (loss) attributable to
Willis Group Holdings
$219
$105
($27)
$68
$365
$246
$47
($7)
$76
$362
Excluding:
Net (loss) income attributable to
noncontrolling interests
4
2
-
6
12
4
1
(1)
7
11
Interest in earnings(losses) of
associates, net of tax
(15)
3
1
11
-
(19)
3
(3)
5
(14)
Income taxes
48
29
11
34
122
63
59
2
35
159
Interest expense
31
32
30
33
126
32
35
34
34
135
Other expense (income), net
(6)
(4)
(5)
(7)
(22)
-
3
9
(18)
(6)
Loss on extinguishment of debt
-
-
60
-
60
-
-
-
-
-
Depreciation
26
21
21
26
94
23
24
23
22
92
Amortization
14
14
14
13
55
13
12
13
16
54
EBITDA
$321
$202
$105
$184
$812
$362
$184
$70
$177
$793
Excluding:
Operational Improvement Program
-
-
-
-
-
-
3
17
16
36
Expense reduction initiative
41
-
-
-
41
-
-
-
-
-
Fees related to extinguishment of
debt
-
-
1
-
1
-
-
-
-
-
Foreign currency movements
(3)
(11)
(10)
(11)
(36)
-
-
-
-
-
Underlying EBITDA
$359
$191
$96
$173
$819
$362
$187
$87
$193
$829
Net EBITDA from acquisitions and
disposals
(2)
(3)
(2)
(4)
(11)
1
(2)
(2)
(8)
(11)
Organic EBITDA
$357
$188
$94
$169
$808
$363
$185
$85
$185
$818 |
 Important disclosures regarding non-GAAP measures
24
Reported total expenses and salaries and benefits to underlying and organic total
expenses and salaries and benefits
For prior periods, underlying measures have been rebased to current period exchange
rates to remove the impact of foreign currency movements when comparing periods
2013
2014
(In millions)
1Q
2Q
3Q
4Q
FY
1Q
2Q
3Q
4Q
FY
Reported total expenses
$770
$723
$725
$774
$2,992
$771
$787
$778
$819
$3,155
Excluding:
Operational improvement program
-
-
-
-
-
-
(3)
(17)
(16)
(36)
Expense reduction initiative
(46)
-
-
-
(46)
-
-
-
-
-
Fees related to extinguishment of debt
-
-
(1)
-
(1)
-
-
-
-
-
Foreign currency movements
7
16
7
(24)
6
-
-
-
-
-
Underlying total expenses
$731
$739
$731
$750
$2,951
$771
$784
$761
$803
$3,119
Net expenses from acquisitions and disposals
(3)
(4)
(5)
(7)
(19)
(4)
(4)
(5)
(40)
(53)
Organic total expenses
$728
$735
$726
$743
$2,932
$767
$780
$756
$763
$3,066
Reported salaries and benefits
$568
$529
$541
$569
$2,207
$570
$575
$569
$600
$2,314
Excluding:
Expense reduction initiative
(29)
-
-
-
(29)
-
-
-
-
-
Foreign currency movements
4
12
6
(19)
3
-
-
-
-
-
Underlying salaries and benefits
$543
$541
$547
$550
$2,181
$570
$575
$569
$600
$2,314
Net expenses from acquisitions and disposals
(2)
(3)
(3)
(5)
(13)
(3)
(2)
(3)
(25)
(33)
Organic Salaries and benefits
$541
$538
$544
$545
$2,168
$567
$573
$566
$575
$2,281 |
 IR
Contacts
Media Contact Peter Poillon
Tel: +1 212 915-8084
Email:
peter.poillon@willis.com
Mark Jones
Tel: +1 212 915-8796
Email:
mark.p.jones@willis.com
25
Juliet Massey
Tel: +44 7984 156 739
Email:
juliet.massey@willis.com |