Attached files
| file | filename |
|---|---|
| EX-99.1 - PRESS RELEASE - PG&E Corp | ex9901.htm |
| 8-K - FORM 8-K DATED 2-10-15 - PG&E Corp | form8k4qeps.htm |

FOURTH QUARTER EARNINGS CALL February 10, 2015

* Safe Harbor Statements Management's statements and assumptions about PG&E Corporation’s 2015 earnings from operations (including estimates and forecasts of costs, capital expenditures, rate base, and equity issuances) are forward-looking statements that reflect management’s judgment and opinions. These statements and assumptions are necessarily subject to various risks and uncertainties, the realization or resolution of which may be outside of management’s control. PG&E Corporation and the Utility are not able to predict all the factors that may affect future results. Some of the factors that could cause actual results to differ materially include: the final outcomes of the pending CPUC investigations and enforcement matters, the federal criminal prosecution of the Utility, and the other investigations that have been or may be commenced relating to the Utility’s compliance with natural gas-related laws and regulations, including the ultimate amount of fines imposed, whether a monitor is appointed to oversee the Utility’s natural gas operations, and the ultimate amount of costs related to the Utility’s natural gas operations that is disallowed or unrecoverable; the timing and outcome of additional regulatory enforcement actions or criminal investigations that may be or have been commenced relating to communications between the Utility and the CPUC and whether such outcomes or investigations negatively affect the final decisions to be issued in the 2015 GT&S rate case, the pending CPUC investigations, or other ratemaking proceedings; whether PG&E Corporation and the Utility are able to repair the harm to their reputations caused by negative publicity about the San Bruno accident, the criminal prosecution, the citations issued by the SED against the Utility under the CPUC’s gas safety citation program, the state and federal investigations, the CPUC’s restrictions on the Utility’s communications with the CPUC, and the Utility’s ongoing work to remove encroachments from transmission pipeline rights-of-way; the amount and timing of additional common stock and debt issuances by PG&E Corporation; the ability of PG&E Corporation and the Utility to access capital markets and other sources of debt and equity financing in a timely manner on acceptable terms; changes in credit ratings that could result in increased borrowing costs especially if PG&E Corporation or the Utility were to lose its investment grade credit ratings; whether the ultimate outcome of investigations and enforcement proceedings affects the Utility’s ability to make distributions to PG&E Corporation, and, in turn, PG&E Corporation’s ability to pay dividends; the occurrence of events, including cyber-attacks, that cause unplanned outages, reduce generating output, disrupt service to customers, damage property owned by the Utility or third parties, subject the Utility to claims by third parties, or result in the imposition of civil, criminal, or regulatory penalties on the Utility; the impact of changes in GAAP, standards, rules, or policies, including those related to regulatory accounting, and the impact of changes in their interpretation or application; and the other factors disclosed in PG&E Corporation’s and the Utility’s joint Annual Report on Form 10-K for the year ended December 31, 2014. This presentation is not complete without the accompanying statements made by management during the webcast conference call held on February 10, 2015. This presentation, including Appendices, and the accompanying press release were attached to PG&E Corporation’s Current Report on Form 8-K that was furnished to the Securities and Exchange Commission on February 10, 2015 and, along with the replay of the conference call, is also available on PG&E Corporation’s website at www.pge-corp.com.

* Key Focus Areas Execute critical gas work Complete regulatory and legal proceedings as soon as possible Rigorous multi-year planning Drive continuous improvement Strengthen local presence Engage in public policy development Resolve gas issues Position company for success Partner effectively

* Gas Investigations – Awaiting decision Gas Transmission and Storage rate case – Schedule resumed. Hearings Feb 2-27, final decision anticipated August 2015 Cost of Capital – Mechanism extended through end of 2016 Regulatory Update Operational and Regulatory Update Executing on Operations 2014 Operational Results Record reliability (SAIDI) 6th year in a row Highest customer satisfaction score since 2009 Renewables exceeded 25% of electric power provided Gas Safety Work in 2014 Tested, or validated through records, 190 miles of pipeline Replaced or installed 31 miles of pipeline Installed 74 automated valves Conducted in-line inspections on 421 miles of pipeline Completed cast iron distribution pipe replacement program

* 2014 Earnings Results Earnings from Operations is not calculated in accordance with GAAP and excludes items impacting comparability. See Exhibit A in Appendix 2 for a reconciliation of Earnings per Share (“EPS”) from Operations to EPS on a GAAP basis. (1) These amounts included pipeline-related costs to perform work under the Utility’s PSEP and other activities associated with safety improvements to the Utility’s natural gas system, as well as legal and other costs related to natural gas matters and regulatory communications.

* Q4 2014: Quarter over Quarter Comparison EPS from Operations Earnings per Share from Operations is not calculated in accordance with GAAP and excludes items impacting comparability. See Exhibit A in Appendix 2 for a reconciliation of EPS from Operations to EPS on a GAAP basis.
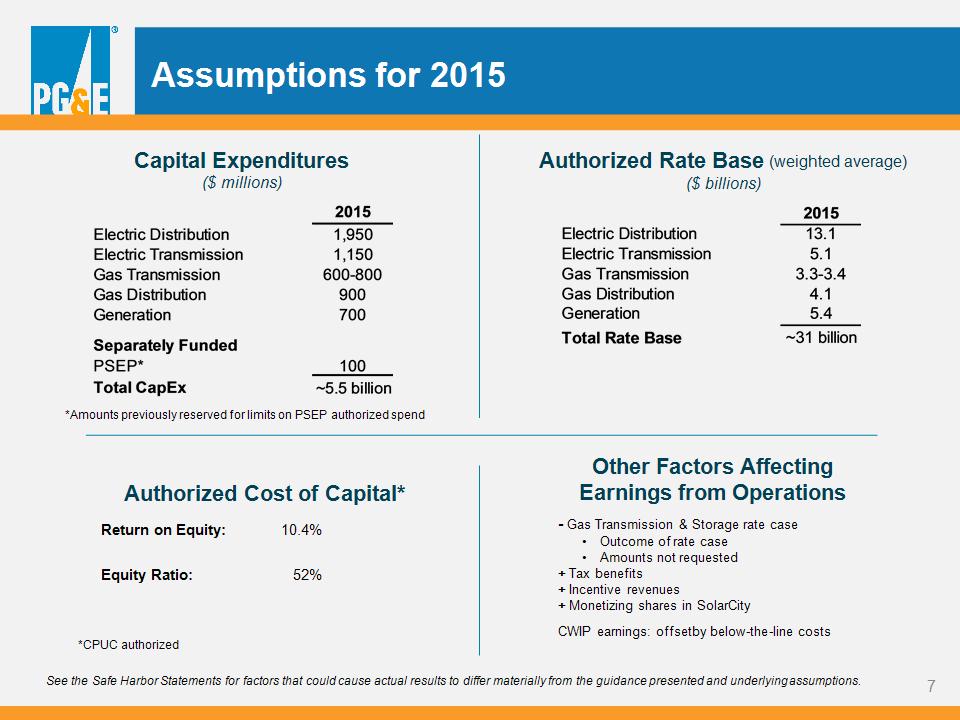
* Assumptions for 2015 Return on Equity: 10.4% Equity Ratio: 52% Authorized Cost of Capital* Authorized Rate Base (weighted average) ($ billions) Other Factors Affecting Earnings from Operations - Gas Transmission & Storage rate case Outcome of rate case Amounts not requested + Tax benefits + Incentive revenues + Monetizing shares in SolarCity CWIP earnings: offset by below-the-line costs Capital Expenditures ($ millions) *Amounts previously reserved for limits on PSEP authorized spend *CPUC authorized See the Safe Harbor Statements for factors that could cause actual results to differ materially from the guidance presented and underlying assumptions.

* 2015 Items Impacting Comparability Guidance ranges exclude potential fines or penalties and any future insurance recoveries. “Pipeline related expenses” includes costs for rights of way encroachment and unrecovered PSEP expenses. “Legal and regulatory related expenses” includes legal and other costs incurred in connection with various enforcement, regulatory, and litigation activities regarding natural gas matters and regulatory communications. “Fines and penalties” includes future fines or penalties resulting from these matters. See Exhibit E in Appendix 2 for detailed 2015 Item Impacting Comparability guidance. See the Safe Harbor Statements for factors that could cause actual results to differ materially from the guidance presented and underlying assumptions.
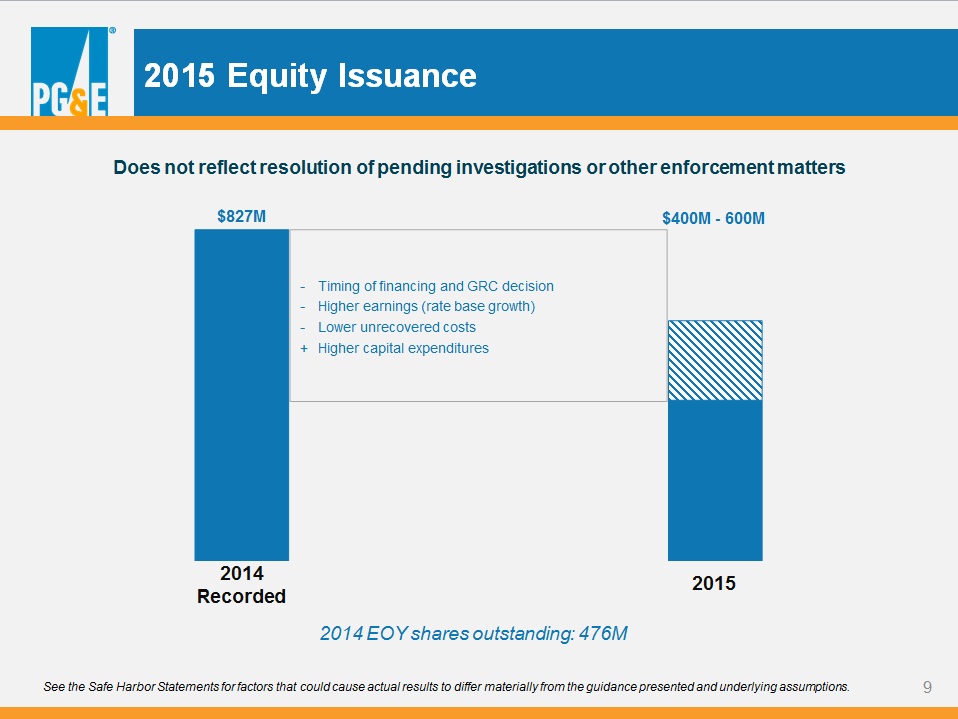
* 2015 Equity Issuance 2014 Recorded $827M $400M - 600M 2014 EOY shares outstanding: 476M Does not reflect resolution of pending investigations or other enforcement matters Timing of financing and GRC decision Higher earnings (rate base growth) Lower unrecovered costs + Higher capital expenditures 2015 See the Safe Harbor Statements for factors that could cause actual results to differ materially from the guidance presented and underlying assumptions.
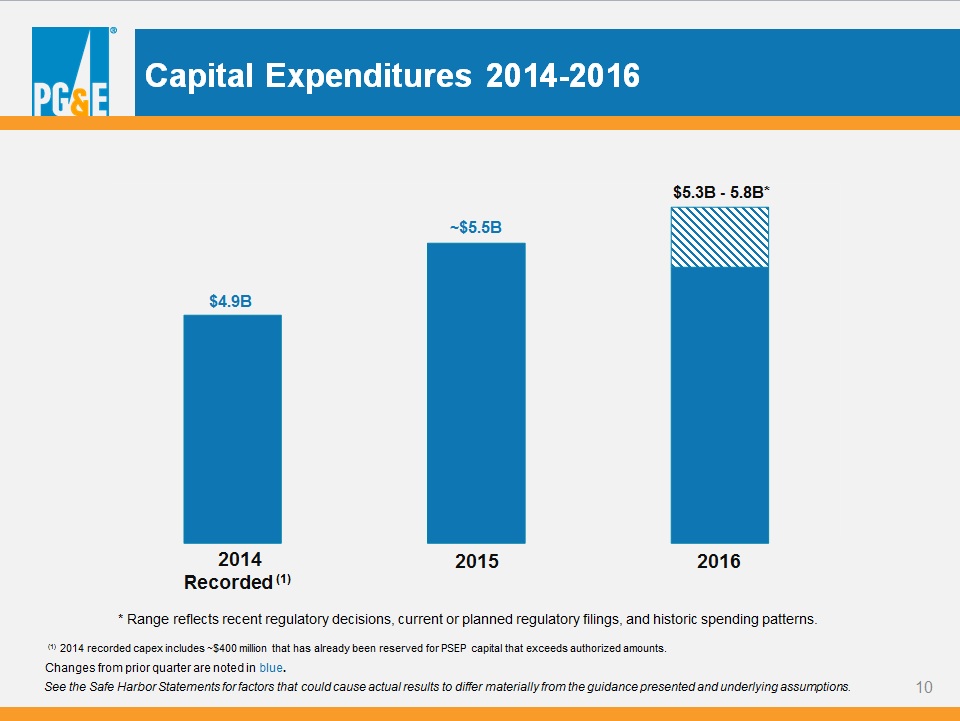
* Capital Expenditures 2014-2016 $4.9B ~$5.5B $5.3B - 5.8B* 2014 Recorded (1) (1) 2014 recorded capex includes ~$400 million that has already been reserved for PSEP capital that exceeds authorized amounts. * Range reflects recent regulatory decisions, current or planned regulatory filings, and historic spending patterns. See the Safe Harbor Statements for factors that could cause actual results to differ materially from the guidance presented and underlying assumptions. 2016 2015 Changes from prior quarter are noted in blue.
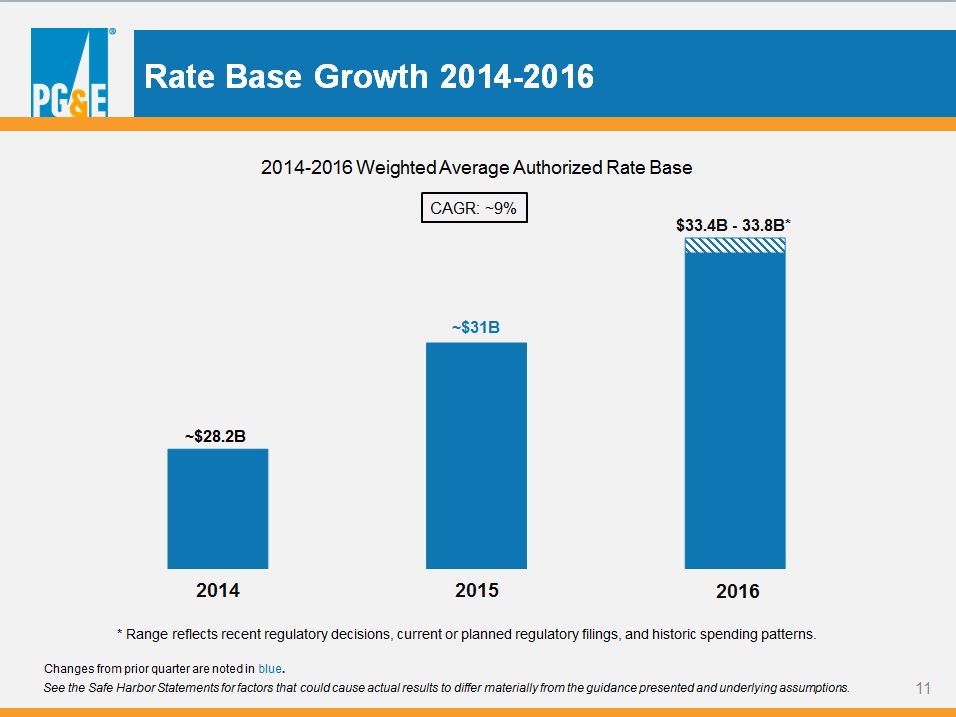
* Rate Base Growth 2014-2016 $33.4B - 33.8B* ~$28.2B 2014 2016 2015 ~$31B 2014-2016 Weighted Average Authorized Rate Base CAGR: ~9% * Range reflects recent regulatory decisions, current or planned regulatory filings, and historic spending patterns. See the Safe Harbor Statements for factors that could cause actual results to differ materially from the guidance presented and underlying assumptions. Changes from prior quarter are noted in blue.

* Appendix 1 – Regulatory and Guidance Matters Updates to Appendix 1 Since the Previous Quarter slide 13 Rate Cases 2015 CPUC Gas Transmission and Storage Rate Case slide 14 CPUC General Rate Cases slide 15 FERC Transmission Owner Rate Case slide 16 Natural Gas Matters Gas Regulatory Proceedings Schedule slide 17 Gas Pipeline Safety Costs slide 18 Presiding Officers’ Joint Penalty Decision: Estimated Total Shareholder Impact slide 19 Incremental Equity Factors slide 20

* Updates to Appendix 1 Since the Previous Quarter Slide 14 2015 CPUC Gas Transmission and Storage Rate Case Slide 15 CPUC General Rate Cases Slide 16 FERC Transmission Owner Rate Case Slide 17 Gas Regulatory Proceedings Schedule Slide 18 Gas Pipeline Safety Costs Slide 19 Presiding Officers’ Joint Penalty Decision: Estimated Total Shareholder Impact
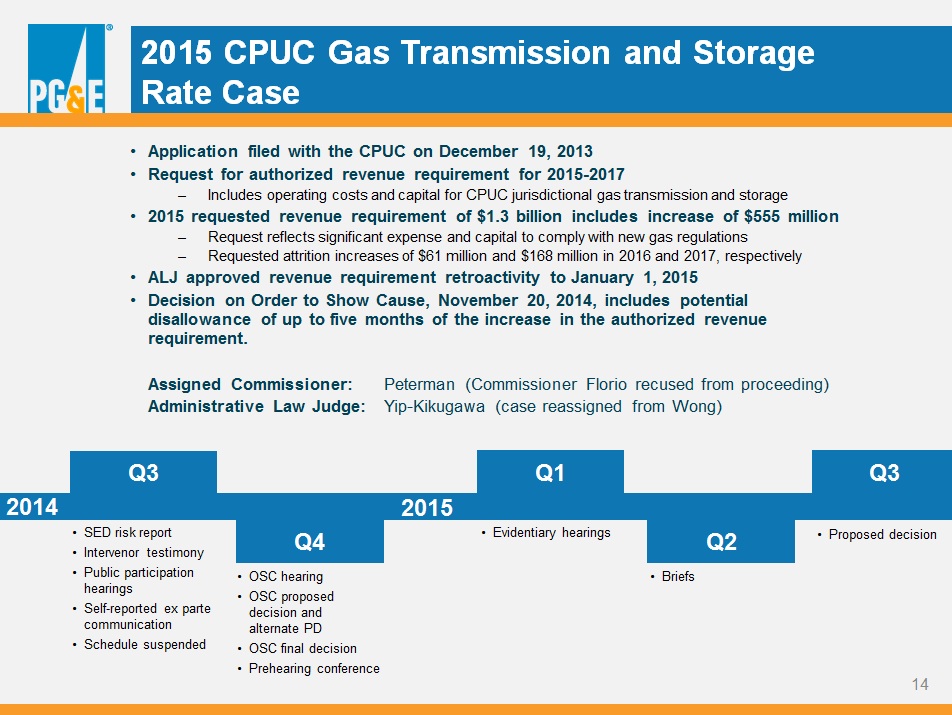
* 2015 CPUC Gas Transmission and Storage Rate Case Application filed with the CPUC on December 19, 2013 Request for authorized revenue requirement for 2015-2017 Includes operating costs and capital for CPUC jurisdictional gas transmission and storage 2015 requested revenue requirement of $1.3 billion includes increase of $555 million Request reflects significant expense and capital to comply with new gas regulations Requested attrition increases of $61 million and $168 million in 2016 and 2017, respectively ALJ approved revenue requirement retroactivity to January 1, 2015 Decision on Order to Show Cause, November 20, 2014, includes potential disallowance of up to five months of the increase in the authorized revenue requirement. Assigned Commissioner: Peterman (Commissioner Florio recused from proceeding) Administrative Law Judge: Yip-Kikugawa (case reassigned from Wong) Q2 Q4 Q3 Q1 Q3 2014 Briefs SED risk report Intervenor testimony Public participation hearings Self-reported ex parte communication Schedule suspended OSC hearing OSC proposed decision and alternate PD OSC final decision Prehearing conference Evidentiary hearings 2015 Proposed decision

* CPUC General Rate Cases General Rate Case set base revenue requirement for 2014-2016 Includes operating costs and capital for generation and electric and gas distribution Excludes cost of capital determination, electric transmission, gas transmission, and cost of fuel and purchased power Final decision adopted an increase of $460 million compared to the requested increase of $1.16 billion Decision in August 2014; revenues retroactive to January 1, 2014 Decision adopted attrition increases for 2015 and 2016 of $324 million and $371 million, compared to the requested increases of $436 million and $486 million, respectively The CPUC approved balancing account treatment for recovery of costs associated with gas leak survey and repair (up to a cap), major emergencies, and certain new regulatory requirements related to nuclear operations and hydroelectric relicensing. Request to be filed September 2015 2017 GRC 2014 GRC

* FERC Transmission Owner Rate Case July 30, 2014 – TO16 filed with FERC Requested revenue requirement of $1.366 billion and ROE of 11.26% September 30, 2014 – TO16 was accepted and rate changes suspended until March 1, 2015 February 25 and 26, 2015 – Next settlement conference TO16

* Gas Regulatory Proceedings Schedule Recordkeeping OII I. 11-02-016 Class Location OII I. 11-11-009 Gas Pipeline OII I. 12-01-007 February December January March Gas Pipeline Safety OIR R. 11-02-019 2014 Order to Show Cause - Ex Parte A. 13-12-012 2015 Gas Distribution OII and Order to Show Cause I. 14-11-008 12/26: PG&E files request for rehearing 12/22: Parties respond to OII 12/29: Parties’ reply comments on OSC 1/23: Proposed decision on GO 112 (pipeline safety) rule revisions 1/30: PSEP quarterly compliance filing 2/26: CPUC to vote on GO 112 (pipeline safety) rule revisions

* Gas Pipeline Safety Costs See the Safe Harbor Statements for factors that could cause actual results to differ materially from the guidance presented and underlying assumptions. PSEP Costs: Customer Recovery ($ millions) Changes from prior quarter are noted in blue.
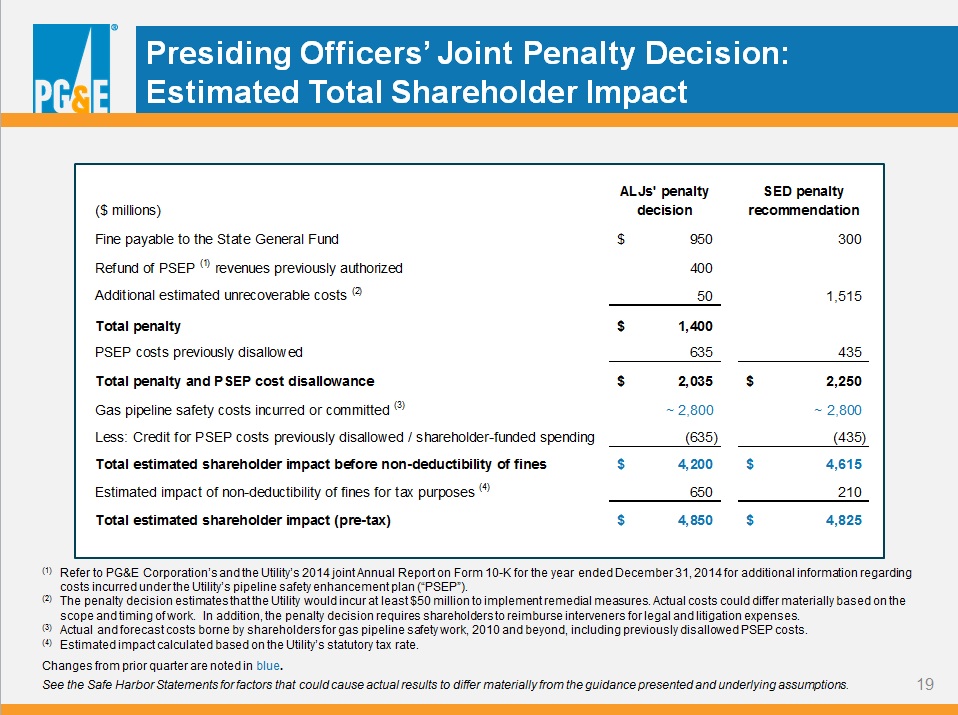
* Presiding Officers’ Joint Penalty Decision: Estimated Total Shareholder Impact (1) Refer to PG&E Corporation’s and the Utility’s 2014 joint Annual Report on Form 10-K for the year ended December 31, 2014 for additional information regarding costs incurred under the Utility’s pipeline safety enhancement plan (“PSEP”). (2) The penalty decision estimates that the Utility would incur at least $50 million to implement remedial measures. Actual costs could differ materially based on the scope and timing of work. In addition, the penalty decision requires shareholders to reimburse interveners for legal and litigation expenses. (3) Actual and forecast costs borne by shareholders for gas pipeline safety work, 2010 and beyond, including previously disallowed PSEP costs. (4) Estimated impact calculated based on the Utility’s statutory tax rate. See the Safe Harbor Statements for factors that could cause actual results to differ materially from the guidance presented and underlying assumptions. Changes from prior quarter are noted in blue.
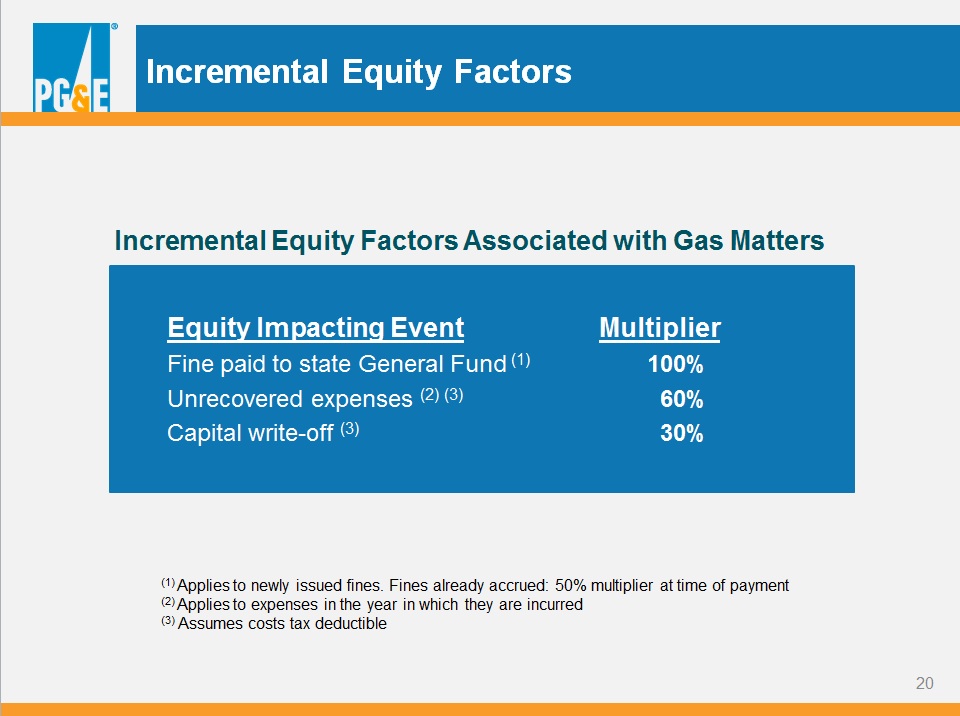
* Incremental Equity Factors Equity Impacting Event Multiplier Fine paid to state General Fund (1) 100% Unrecovered expenses (2) (3) 60% Capital write-off (3) 30% Incremental Equity Factors Associated with Gas Matters (1) Applies to newly issued fines. Fines already accrued: 50% multiplier at time of payment (2) Applies to expenses in the year in which they are incurred (3) Assumes costs tax deductible

* Appendix 2 – Supplemental Earnings Materials Exhibit A: Reconciliation of PG&E Corporation Earnings from Operations to Consolidated slide 22 Income Available for Common Shareholders in Accordance with GAAP Exhibit B: Key Drivers of PG&E Corporation Earnings per Common Share from Operations slide 23 Exhibit C: Operational Performance Metrics slide 24-25 Exhibit D: Sales and Sources Summary slide 26 Exhibit E: PG&E Corporation Guidance for Items Impacting Comparability (“IIC”) slide 27 Exhibit F: General Earnings Sensitivities slide 28 Exhibit G: Summary of Selected Regulatory Cases slide 29-35

* Exhibit A: Reconciliation of PG&E Corporation Earnings from Operations to Consolidated Income Available for Common Shareholders in Accordance with Generally Accepted Accounting Principles (“GAAP”) Fourth Quarter and full year, 2014 vs. 2013 (in millions, except per share amounts) “Earnings from operations” is not calculated in accordance with GAAP and excludes items impacting comparability as described in Note (2) below. Items impacting comparability reconcile earnings from operations with Consolidated Income Available for Common Shareholders as reported in accordance with GAAP. The Utility incurred net costs of $197 million and $356 million pre-tax, during the three and twelve months ended December 31, 2014, respectively, in connection with natural gas matters. These amounts included pipeline-related costs to perform work under the Utility’s pipeline safety enhancement plan (“PSEP”) and other activities associated with safety improvements to the Utility’s natural gas system, as well as legal and other costs related to natural gas matters, including $7 million for legal costs related to regulatory communications. A charge of $116 million was also recorded for PSEP capital expenditures, reflecting forecasted capital expenditures in 2015 and beyond that are expected to exceed the amount authorized for recovery. Accrued fines includes a charge for violations related to the Carmel incident of $10.85 million and for violations of the rules governing ex parte communications of $1.05 million. These costs were partially offset by insurance recoveries and the resolution of all remaining third-party claims related to the San Bruno accident, which resulted in a reduction to the accrual for third-party liability claims. After the State of California established a final drinking water standard for hexavalent chromium that became effective on July 1, 2014, the Utility discontinued its whole house water replacement program associated with remediation at the Utility’s natural gas compressor station located near Hinkley, California. Accordingly, the Utility reduced its accrual related to the whole house water program by $7 million, pre-tax, in the third quarter of 2014. No additional amounts were recorded during the three months ended December 31, 2014.

* Exhibit B: Key Drivers of PG&E Corporation Earnings per Common Share (“EPS”) from Operations Fourth Quarter and full year, 2014 vs. 2013 ($/Share, Diluted) See Exhibit A for a reconciliation of EPS from Operations to EPS on a GAAP basis. In 2013, the Utility incurred approximately $200 million of expense and $1 billion of capital costs above authorized levels. The 2014 GRC decision authorized revenues that support this higher level of spending in 2014 and throughout the GRC period. The amounts in the table represent the after-tax higher authorized revenue recognized during the three and twelve months ended December 31, 2014, for the recovery of these expenses and costs. Represents the favorable impact of recent IRS guidance and forecast changes based on flow-through ratemaking treatment for federal tax deductions resulting from temporary differences attributable to repairs and certain other property-related costs as reflected in the revenue requirements authorized in the 2014 GRC decision. Includes customer energy efficiency incentive awards. Represents the timing of taxes reportable in quarterly statements, nuclear refueling, and other expenses.

* Exhibit C: Operational Performance Metrics The 2014 target for earnings from operations is not publicly reported. See following page for definitions of the operational performance metrics.

* Definitions of 2014 Operational Performance Metrics from Exhibit C Safety Public and employee safety are measured in four areas: (1) Nuclear Operations Safety, (2) Gas Operations Safety, (3) Electric Operations Safety, and (4) Employee Safety. The safety of the Utility’s nuclear power operations, Unit 1 and Unit 2, is an index comprised of 12 performance indicators for nuclear power generation that are regularly benchmarked against other nuclear power generators. The safety of the Utility’s natural gas operations is represented by (a) the number of third party “dig-ins” (i.e., damage resulting in repair or replacement of underground facility) to Utility gas assets per 1,000 Underground Service Alert tickets; and (b) the timeliness (measured in minutes) of on-site response to gas emergency service calls. The safety of the Utility’s electric operations is represented by (a) the percentage improvement in the number of wire down events with resulting sustained unplanned outages compared to the same report period of the previous year, and (b) the percentage of time that Utility personnel are on site within 60 minutes after receiving a 911 call of a potential PG&E electric hazard. The safety of the Utility’s employees is represented by (a) the number of lost workday cases incurred per 200,000 hours worked (or for approximately every 100 employees), and (b) the number of serious preventable motor vehicle incidents that the driver could have reasonably avoided, per one million miles driven. Customer Customer satisfaction and service reliability are measured by: The overall satisfaction (measured as a score of zero to 100) of customers with the products and services offered by the Utility, as measured through a quarterly survey performed by an independent third-party research firm. The Utility’s ability to complete planned in-line inspections and pipeline retrofit projects, measured by two equally weighted components of (a) In-Line Inspections and (b) In-Line Upgrades. The timeliness (measured in days) of gas asset information being entered into the Utility’s gas mapping system after a gas project is completed. The efficient completion of certain committed work for gas operations-related programs. The index is comprised of three components related to the completion of committed work and the cost of completing the work. The total time (measured in minutes) the average customer is without electric power during a given time period. Financial Earnings from operations measures PG&E Corporation’s earnings power from ongoing core operations. It allows investors to compare the underlying financial performance of the business from one period to another, exclusive of items that management believes do not reflect the normal course of operations (items impacting comparability). Earnings from operations is not calculated in accordance with GAAP. For a reconciliation of earnings from operations to earnings in accordance with GAAP, see Exhibit A.

* (1) Includes other sources of electric energy totaling 2,004 kWh and 1,958 kWh for the three months ended December 31, 2014 and 2013, respectively, and 5,501 kWh and 5,132 kWh for the twelve months ended December 31, 2014 and 2013, respectively. Exhibit D: Pacific Gas and Electric Company Sales and Sources Summary Fourth Quarter and full year, 2014 vs. 2013 Please see the 2014 Annual Report on Form 10-K for additional information about operating statistics.

* Exhibit E: PG&E Corporation Guidance for Items Impacting Comparability (“IIC”) Items impacting comparability are those items that management believes do not reflect the normal course of operations. These items are excluded when calculating “earnings from operations” which is a non-GAAP measure that allows investors to compare the underlying financial performance of the business from one period to another. These items are included in calculating Consolidated Income Available for Common Shareholders in accordance with GAAP. “Pipeline related expenses” includes costs to perform remaining work associated with the Utility’s Pipeline Safety Enhancement Plan and costs related to the Utility’s multi-year effort to identify and remove encroachments from transmission pipeline rights-of-way. The pre-tax range of estimated costs is shown below. (3) “Legal and regulatory related expenses” includes legal and other costs incurred in connection with various enforcement, regulatory, and litigation activities regarding natural gas matters and regulatory communications. The pre-tax range of estimated costs is shown below. Actual financial results for 2015 may differ materially from the guidance provided. For a discussion of the factors that may affect future results, see the Safe Harbor Statements. (4) “Fines and penalties” includes future fines or penalties resulting from various enforcement, regulatory and litigation activities regarding natural gas matters and regulatory communications. Guidance does not include amounts for such fines or penalties, which could have a material impact on PG&E Corporation and the Utility’s financial results. (5) The guidance provided does not include any additional insurance recoveries for third-party liability claims related to the San Bruno accident. The Utility recognizes insurance recoveries when they are deemed probable under applicable accounting standards. Guidance also does not include potential environmental-related costs that the Utility could incur if the final order for remediation at Hinkley is more onerous than the Utility’s proposal.
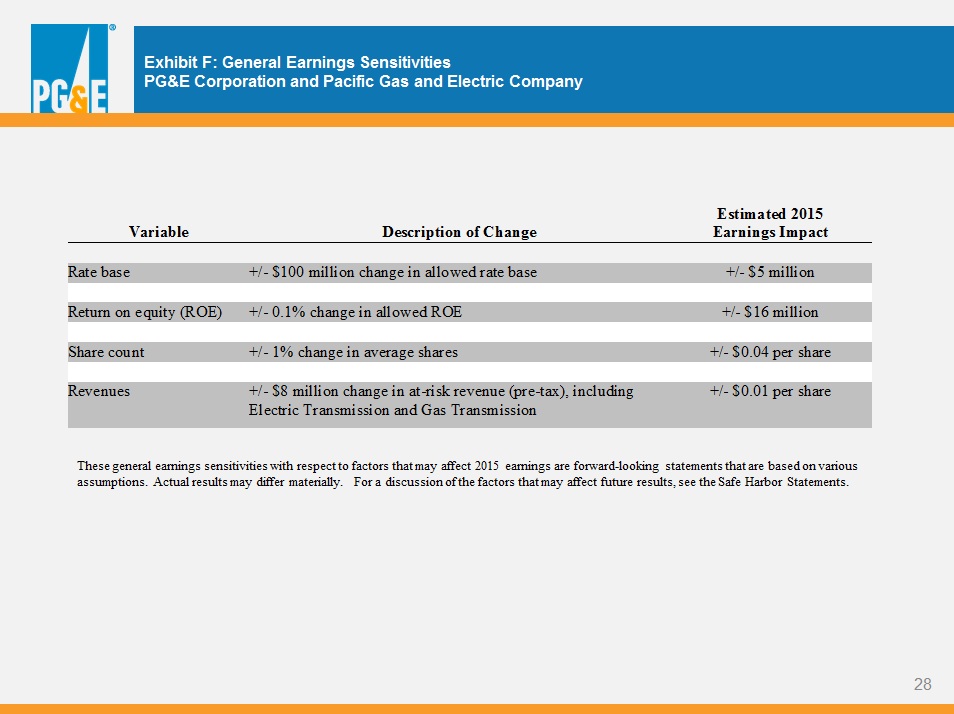
* Exhibit F: General Earnings Sensitivities PG&E Corporation and Pacific Gas and Electric Company These general earnings sensitivities with respect to factors that may affect 2015 earnings are forward-looking statements that are based on various assumptions. Actual results may differ materially. For a discussion of the factors that may affect future results, see the Safe Harbor Statements.

* Exhibit G: Pacific Gas and Electric Company Summary of Selected Regulatory Cases

* Exhibit G: Pacific Gas and Electric Company Summary of Selected Regulatory Cases
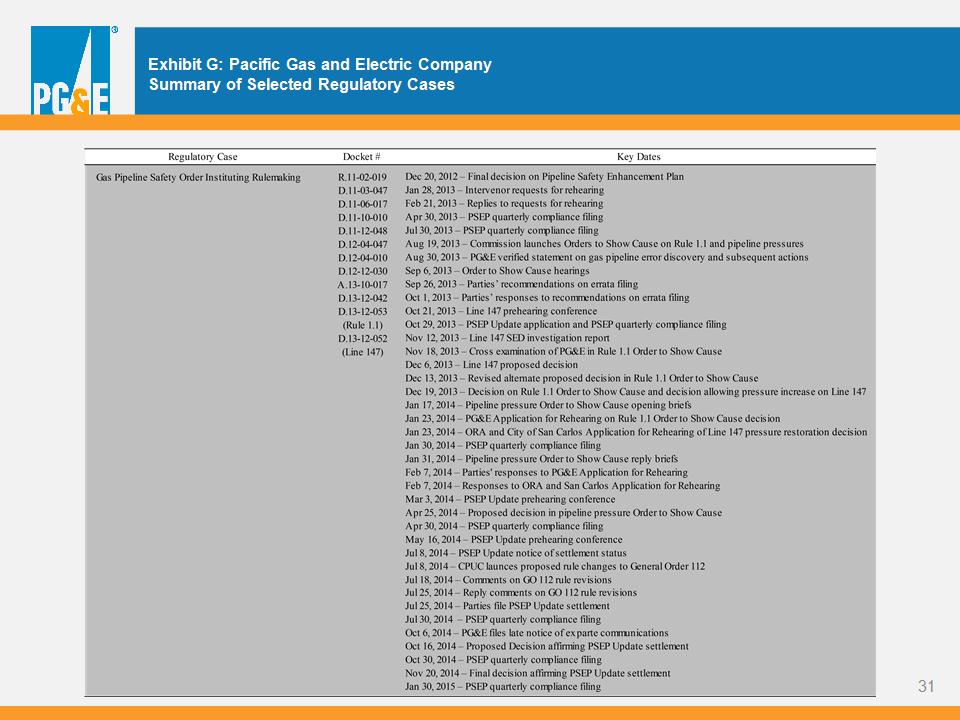
* Exhibit G: Pacific Gas and Electric Company Summary of Selected Regulatory Cases
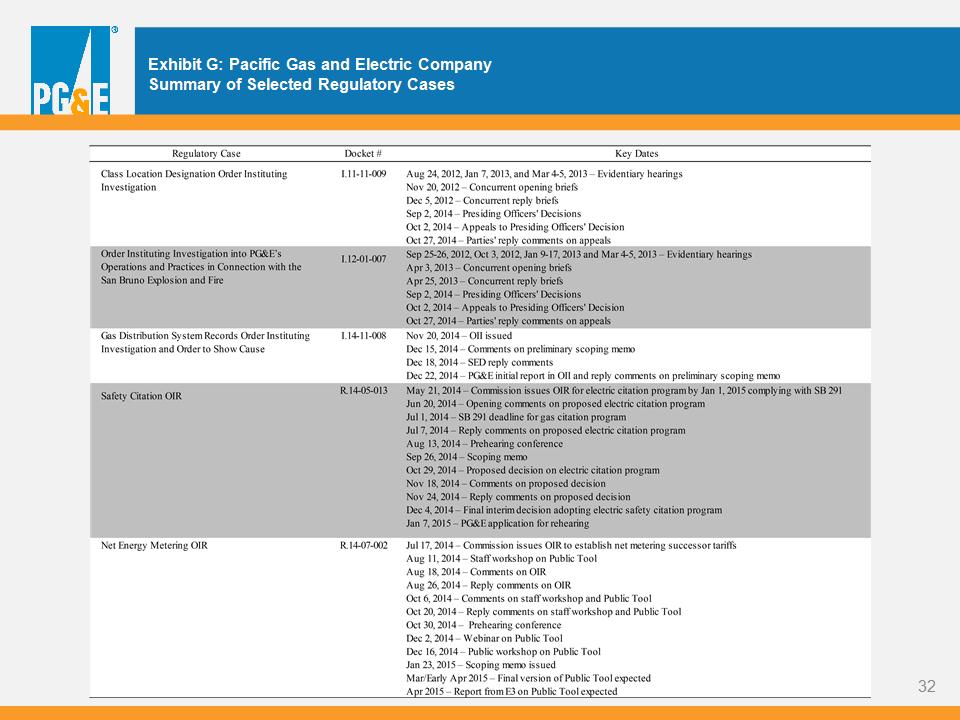
* Exhibit G: Pacific Gas and Electric Company Summary of Selected Regulatory Cases

* Exhibit G: Pacific Gas and Electric Company Summary of Selected Regulatory Cases

* Exhibit G: Pacific Gas and Electric Company Summary of Selected Regulatory Cases

* Exhibit G: Pacific Gas and Electric Company Summary of Selected Regulatory Cases