Attached files
| file | filename |
|---|---|
| 8-K - 8-K - Matson, Inc. | a15-4078_18k.htm |
Exhibit 99.1
|
|
Investor Presentation – February 2015 |
|
|
Statements in this presentation that set forth expectations or predictions are based on facts and situations that are known to us as of February 10, 2015, the date of this filing. Actual results may differ materially, due to risks and uncertainties, such as those described on pages 8-14 of our 2013 Form 10-K and other subsequent filings with the SEC. Statements in this presentation are not guarantees of future performance. We do not undertake any obligation to update our forward-looking statements. Investors may obtain a free copy of all filings containing information about Matson from the SEC at the SEC’s website at http://www.sec.gov after such documents have been filed with the SEC. In addition, copies of filings containing information about us can be obtained without charge by sending a request to Matson, Inc., 1411 Sand Island Parkway, Honolulu, Hawaii 96819, Attention: Investor Relations; by calling (510) 628-4021; or by accessing them on the web at http://www.matson.com. Forward Looking Statements |
|
|
Market and service leader in core Hawaii and Guam trade lanes Strong, defensible market position Unique expedited China Service (CLX) achieving premium rates Superior assets with high utilization and flexibility Generates significant and stable cash flow Strong balance sheet Capital allocation catalysts New vessel construction Pending Alaska Acquisition Attractive cash dividend Investment Highlights |
|
|
Unique Ocean Transportation Network HON = Honolulu; LB = Long Beach; OAK = Oakland; SEA = Seattle 2 Ships HON / OAK / LB 2 Ships HON / SEA / OAK 5 Ships LB / HON / Guam / China |
|
|
Kodiak Anchorage Tacoma Dutch Harbor Pending Alaska Acquisition Reliable Alaska Operating Platform 2X Weekly 1X Weekly Vessel Name Year Built Power Plant TEU Status Anchorage 1987 Diesel 1,668 Active Tacoma 1987 Diesel 1,668 Active Kodiak 1987 Diesel 1,668 Active Consumer 1973 Steam 1,690 Reserve Active vessels are well-maintained and well-sized for market Reliable schedule ~10 yrs remaining useful life Kodiak and Dutch Harbor operations are strategic Critical lifeline to these communities Important terminal and slot charter services for Maersk and APL 2X Weekly Five other steam-powered vessels to be acquired at or near the end of their economic lives |
|
|
Pending Alaska Acquisition Compelling Strategic Rationale Annual revenue of ~$330 million Unique opportunity to leverage Matson’s platform into Alaska Attractive Alaska market a natural geographic extension in the Pacific Geographic revenue diversification Significantly grows and enhances Matson’s platform, providing multiple new growth and value creation catalysts Grows and Enhances Platform Reduction of duplicative corporate overhead and G&A Core operational savings in vessel and transportation management costs Customer overlap and sales force efficiencies Numerous Synergy Opportunities Annual run-rate EBITDA contribution ~$70 million within 2 yrs post-closing Immediate EPS accretion (excl. one-time items) as follows: Low to mid-teens EPS accretion in yrs 1 and 2 post-closing ~$0.35-0.45 annual EPS accretion thereafter ~$1.00 of annual cash flow per share accretion within 2 yrs (excl. one-time items) Significant Value Creation |

|
|
Horizon pioneered container shipping into Alaska over 50 years ago and continues to be a market leader Long-term steady economic growth High vessel utilization Well-Balanced Demand and Supply Remote, non-contiguous economy dependent on reliable container service as part of vital supply lifeline A market that values premium service Loyal customer base; ~80% overlap with Matson’s Hawaii customers Similarities with Hawaii Market Northbound volume represents ~75% of total, driven by Alaska general economy, energy and mineral resource development, and military cargo Southbound volume more seasonal, driven by seafood industry Long-term Stable Revenue Profile Pending Alaska Acquisition A Valuable Franchise in an Attractive Market |

|
|
$0.72 per common share in cash, plus repayment of Horizon’s debt at closing Equity value of $69.2 million(1); transaction value of $456.1 million(2) Matson to acquire the stock of Horizon which will include the Alaska operations and the assumption of all non-Hawaii business assets and liabilities Purchase Price Expect to fund through combination of Matson’s cash on hand and borrowings under existing revolving credit facility Expect to close in 2015, subject to regulatory approval of Pasha transaction, Horizon stockholder vote and other customary closing conditions Financing Timing Horizon to sell Hawaii Operations to Pasha for $141.5 million; condition to closing Matson/Horizon Transaction Horizon ceased Puerto Rico service at the end of 2014 Hawaii Business Sale and Puerto Rico Shut Down (1) Based on fully diluted equity (2) Based on net debt outstanding as of September 21, 2014, less the Hawaii Business Sale proceeds Horizon stockholders representing 55 percent of the fully diluted equity (41 percent of the voting stock) have agreed to vote their shares in support of the Transaction Shareholder Voting Agreements Pending Alaska Acquisition Transaction Highlights |

|
|
Expect run-rate EBITDA contribution of $70 million within 2 years post-closing Operational efficiencies and reduction of duplicative corporate overhead and SG&A Excludes one-time pre-tax items ~$25 million transaction closing costs ~$20-25 million restructuring and integration costs Transaction value at time of closing subject to change based upon Horizon’s corporate cash flow performance between now and closing (1) Based on net debt outstanding as of September 21, 2014 (2) The Hawaii Business Sale is not expected to create any corporate level taxes payable at Horizon due to existing NOLs Pending Alaska Acquisition Financial Summary of the Transaction Transaction Value ($ in millions, except per share amounts) Per share offer $0.72 Diluted shares outstanding 96.1 Equity value $69.2 Plus: Horizon Net Debt (1) $528.4 Less: Hawaii Business Sale Proceeds (2) ($141.5) Transaction Value $456.1 Run-rate EBITDA (within 2 years post-closing) $70.0 Transaction Mulitple Transaction Value / Run-rate EBITDA 6.5x |
|
|
4Q14 Ocean Transportation operating income expected to be approximately $45.0 million Higher than expected freight rates in its China service Rate and volume growth in Hawaii and Guam Timing of fuel surcharge collections 4Q14 Logistics operating income expected to be approximately $3.0 million Continuing improvements in volume, yield, and warehouse operations Preliminary full year 2015 outlook: Ocean Transportation operating income expected to be flat to modestly higher than 2014 levels Logistics operating income expected to exceed 2014 levels Revised 4Q14 and Preliminary 2015 Outlook |
|
|
Hawaii: Poised for Growth Indicator (% Change YOY) 2013 2014F 2015F 2016F Real Gross Domestic Product 1.9 2.9 3.5 2.7 Visitor Arrivals 1.7 1.2 1.9 1.0 Construction Jobs 5.6 0.9 5.9 6.0 Residential Building Permits 16.5 7.8 27.5 22.2 Non-Residential Building Permits (10.7) 23.9 9.6 5.8 Sources: UHERO: University of Hawaii Economic Research Organization; STATE FORECAST UPDATE, October 24, 2014, http://www.uhero.hawaii.edu Construction activity key to Hawaii volume growth; forecast shifted out Urban Honolulu area projects – 15 projects with a combined total of ~5,400 units under construction, permitted, in permitting or recently completed Continued progress on Honolulu Rail Transit Project |

|
|
Unique, Premium, Expedited Service Weekly 5 ship string connecting 3 ports in China to Long Beach 3-6 day competitive advantage: Fastest transit time: 10 days (vs. 12-14 day trade standard) Next-day freight availability at Long Beach Achieves freight rate premium to the spot market Utilization of Jones Act tonnage in round trip dual head-haul revenue model China Service (CLX) |
|
|
Critical Link in CLX Network Configuration Primary carrier to Guam since departure of major competitor in late 2011 Volume in Guam remains stable Connections from Oakland and Pacific Northwest to Guam via Honolulu Guam Service |
|
|
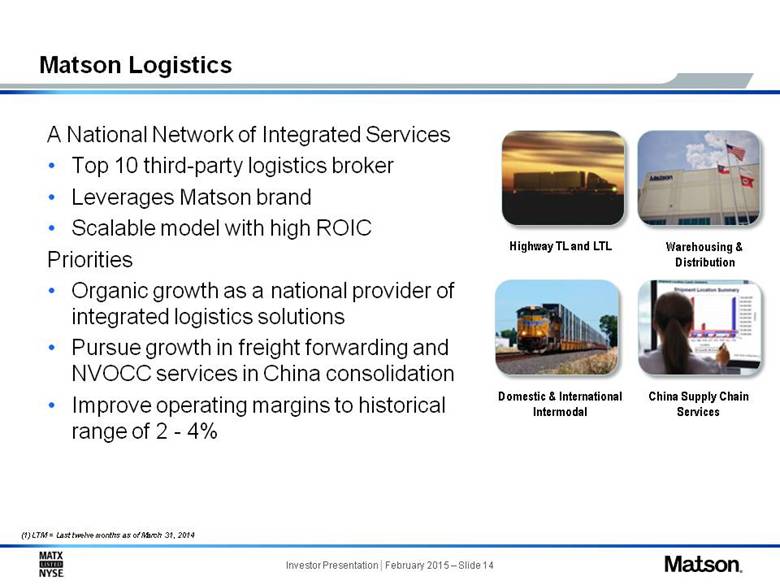
A National Network of Integrated Services Top 10 third-party logistics broker Leverages Matson brand Scalable model with high ROIC Priorities Organic growth as a national provider of integrated logistics solutions Pursue growth in freight forwarding and NVOCC services in China consolidation Improve operating margins to historical range of 2 - 4% Matson Logistics (1) LTM = Last twelve months as of March 31, 2014 Domestic & International Intermodal Highway TL and LTL Warehousing & Distribution China Supply Chain Services |
|
|
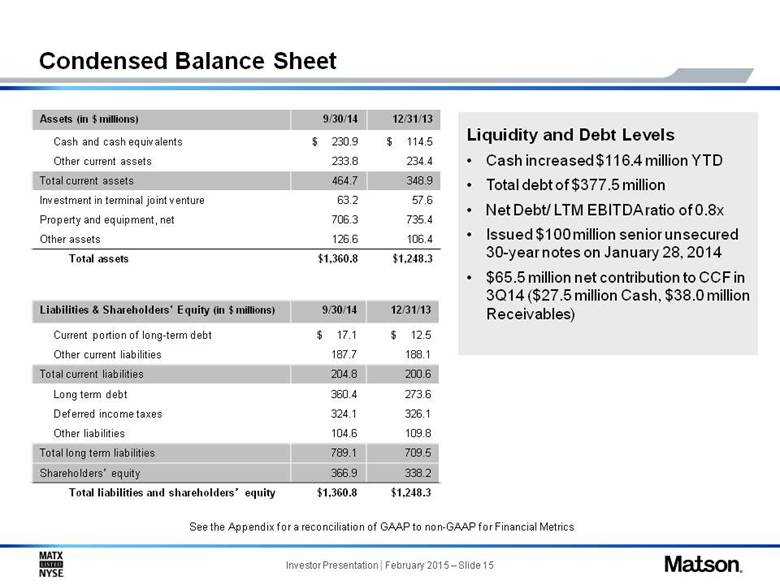
Condensed Balance Sheet See the Appendix for a reconciliation of GAAP to non-GAAP for Financial Metrics Assets (in $ millions) 9/30/14 12/31/13 Cash and cash equivalents $ 230.9 $ 114.5 Other current assets 233.8 234.4 Total current assets 464.7 348.9 Investment in terminal joint venture 63.2 57.6 Property and equipment, net 706.3 735.4 Other assets 126.6 106.4 Total assets $1,360.8 $1,248.3 Liabilities & Shareholders’ Equity (in $ millions) 9/30/14 12/31/13 Current portion of long-term debt $ 17.1 $ 12.5 Other current liabilities 187.7 188.1 Total current liabilities 204.8 200.6 Long term debt 360.4 273.6 Deferred income taxes 324.1 326.1 Other liabilities 104.6 109.8 Total long term liabilities 789.1 709.5 Shareholders’ equity 366.9 338.2 Total liabilities and shareholders’ equity $1,360.8 $1,248.3 Liquidity and Debt Levels Cash increased $116.4 million YTD Total debt of $377.5 million Net Debt/ LTM EBITDA ratio of 0.8x Issued $100 million senior unsecured 30-year notes on January 28, 2014 $65.5 million net contribution to CCF in 3Q14 ($27.5 million Cash, $38.0 million Receivables) |
|
|
EXISTING MATSON VALUE DRIVERS Hawaii trade poised for multi-year construction cycle increases and significant longer-term upside from investment in new Aloha class vessels Premium China rates showing continued strength Guam volume steady with incremental potential Logistics and SSAT businesses improving, with stronger outlooks PENDING ALASKA ACQUISITION VALUE DRIVERS Immediate EPS and cash flow accretion Business integration and investment milestones lead to greater accretion within 2 years post-closing Attractive Alaska market increases long-term growth prospects Multiple Near-term and Longer-Term Value Creation Catalysts Multiple catalysts driving shareholder value creation over next several years |
|
|
17 17 Appendix |
|
|
Use of Non-GAAP Measures Matson reports financial results in accordance with U.S. generally accepted accounting principles (“GAAP”). The Company also considers other non-GAAP measures to evaluate performance, make day-to-day operating decisions, help investors understand our ability to incur and service debt and to make capital expenditures, and to understand period-over-period operating results separate and apart from items that may, or could, have a disproportional positive or negative impact on results in any particular period. These non-GAAP measures include, but are not limited to, Earnings Before Interest, Depreciation and Amortization (“EBITDA”), Return on Invested Capital (“ROIC”), Free Cash Flow per Share, and Net Debt/EBITDA. The Company calculates EBITDA as the sum of net income, less income or loss from discontinued operations, plus income tax expense, interest expense and depreciation and amortization. EBITDA should not be considered as an alternative to net income (as determined in accordance with GAAP), as an indicator of our operating performance, or to cash flows from operating activities (as determined in accordance with GAAP) as a measure of liquidity. Our calculation of EBITDA may not be comparable to EBITDA as calculated by other companies, this calculation of EBITDA is not identical to EBITDA used by our lenders to determine financial covenant compliance. The Company defines ROIC as Net Income less Income or Loss from Discontinued Operations plus tax effected Interest Expense divided by Average Total Debt plus Average Shareholders’ Equity. Our calculation of ROIC may not be comparable to ROIC as calculated by other companies. |

|
|
Freight Super Cycles in Hawaii Source: Matson, Inc. Super-cycles have characterized Matson container volume Emerging from bottom of cycle |
|
|
Delivery expected in 3Q/4Q 2018 First ship named in honor of Senator Inouye Introducing the Aloha Class Two 3600 TEU dual fuel, LNG capable containerships from Aker Contract price $418 million |

|
|
Aloha Class Specifications Green Ship Technology 3600 TEU capacity Optimized speed to ensure cargo reliability Additional 45-foot capacity Additional reefer outlets Cell guide spacing (constr. materials) Neighbor Island accessible Fuel efficient hull Dual fuel engines, conventional fuel oils or LNG Double hull fuel tanks State of the art ballast water system Reduced emissions Shore power equipped Future Hawaii Freight Demand |
|
|
Aloha Class – LNG Capable Potentially cheaper source of fuel Dual fuel engines part of vessel design Additional ~$20 million per vessel to complete LNG installation Decision will be driven by LNG availability at the US West Coast ports |
|
|
Aloha Class – Compelling Investment Significantly lowers cost per TEU in Hawaii fleet Cost efficiencies driven by: Maintaining 9-ship deployment at significantly higher volumes Lower operating costs of modern vessels Lower fuel consumption – ~30% on a per TEU basis using conventional fuel oils Lower crewing, maintenance & repair, and dry-docking costs Attractive ROIC investment 4Q 2013 2014 2015 + 2016 2017 + 2018 Estimated Installment Payment Schedule (excluding owners’ items and capitalized interest) ~2% - ~22% ~76% |
|
|
Cash Generation and Uses of Cash * LTM = Last Twelve Months as of September 30, 2014; Does not include $100 million financing in January 2014 or $8.1 million in Other sources of Cash |

|
|
EBITDA and Capex EBITDA1, 2 (in $ Millions) 1 EDITDA and capital expenditure information extracted from previously filed Form 10-Ks which include other income and exclude intercompany income. 2Operating Income is from continuing operations. 2011 expenses included CLX2 costs of $7.1 million primarily related to container repositioning that did not qualify for discontinued operations treatment. Capital Expenditures1 (in $ Millions) 2003-2013 Average excluding new Vessels = $41.2 million See the Appendix for a reconciliation of GAAP to non-GAAP for Financial Metrics * LTM = Last Twelve Months as of September 30, 2014 |
|
|
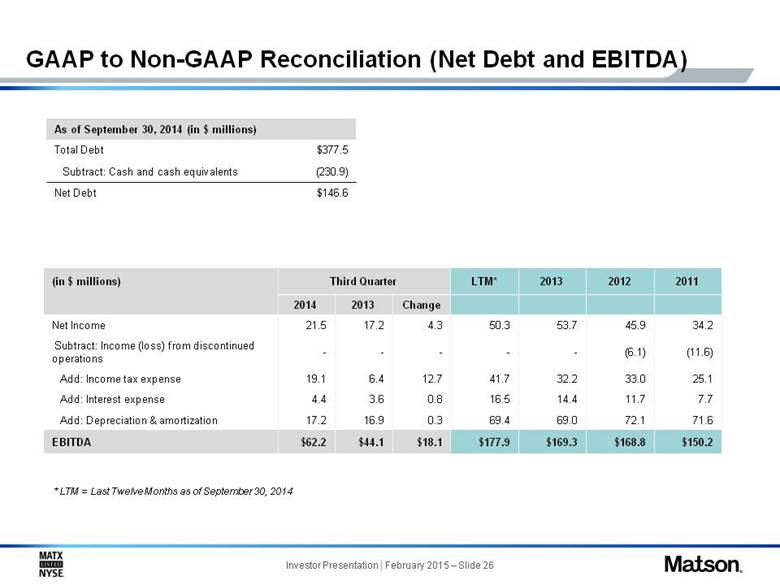
GAAP to Non-GAAP Reconciliation (Net Debt and EBITDA) (in $ millions) Third Quarter LTM* 2013 2012 2011 2014 2013 Change Net Income 21.5 17.2 4.3 50.3 53.7 45.9 34.2 Subtract: Income (loss) from discontinued operations - - - - - (6.1) (11.6) Add: Income tax expense 19.1 6.4 12.7 41.7 32.2 33.0 25.1 Add: Interest expense 4.4 3.6 0.8 16.5 14.4 11.7 7.7 Add: Depreciation & amortization 17.2 16.9 0.3 69.4 69.0 72.1 71.6 EBITDA $62.2 $44.1 $18.1 $177.9 $169.3 $168.8 $150.2 As of September 30, 2014 (in $ millions) Total Debt $377.5 Subtract: Cash and cash equivalents (230.9) Net Debt $146.6 * LTM = Last Twelve Months as of September 30, 2014 |
|
|
GAAP to Non-GAAP Reconciliation (EBITDA) (in $ millions) 2002 2003 2004 2005 2006 2007 2008 2009 2010 Segment Operating Income Excluding Discontinued Ops 45.5 97.5 119.0 142.6 126.8 148.0 124.1 64.5 125.4 Segment Depreciation and Amortization 51.2 51.9 58.0 60.9 59.6 65.2 68.5 70.6 70.8 EBITDA 96.7 149.4 177.0 203.5 186.4 213.2 192.6 135.1 196.2 More detailed information is available in previously filed Form 10-Ks and 10-Qs |
|
|
GAAP to Non-GAAP Reconciliation (ROIC) (in $ millions) Year Ended 2013 2012 (2) Net Income 53.7 45.9 Subtract: Loss from discontinued operations - (6.1) Add: Interest expense (tax effected)1 9.0 7.2 Total Return 62.7 59.2 Average Total Debt 302.6 319.1 Average Shareholders’ Equity 309.1 279.9 Average Total Invested Capital 611.7 599.0 ROIC (Total Return/Total Invested Capital) 10.3% 9.9% The effective tax rate for 2013 is 37.5% and 38.8% for 2012 The 2012 calculation is based on total invested capital as of December 31, 2012 due to the timing of the Separation. |