Attached files
| file | filename |
|---|---|
| 8-K - 8-K - Invesco Mortgage Capital Inc. | ivr201502-8kmain.htm |

Invesco Mortgage Capital Inc. 16th Annual Credit Suisse Financial Services Forum February 10, 2015 Richard King President & Chief Executive Officer John Anzalone Chief Investment Officer

Forward-looking statements This presentation, and comments made in the associated conference today, may include “forward-looking statements” within the meaning of the U.S. securities laws as defined in the Private Securities Litigation Reform Act of 1995, and such statements are intended to be covered by the safe harbor provided by the same. Forward-looking statements include our views on the risk positioning of our portfolio, domestic and global market conditions (including the residential and commercial real estate market), the market for our target assets, mortgage reform programs, the positioning of our portfolio to meet current or future economic conditions, our core earnings, our views on the change in our book value and our views on comprehensive income, economic return, our ability to continue performance trends, the stability of portfolio yields, our views on interest rates, credit spreads, prepayment trends, financing sources , cost of funds, our views on leverage and equity allocation. In addition, words such as “believes,” “expects,” “anticipates,” “intends,” “plans,” “estimates,” “projects,” “forecasts,” and future or conditional verbs such as “will,” “may,” “could,” “should,” and “would” as well as any other statement that necessarily depends on future events, are intended to identify forward-looking statements. Forward-looking statements are not guarantees, and they involve risks, uncertainties and assumptions. There can be no assurance that actual results will not differ materially from our expectations. We caution investors not to rely unduly on any forward-looking statements and urge you to carefully consider the risks identified under the captions “Risk Factors,” “Forward- Looking Statements” and “Management’s Discussion and Analysis of Financial Condition and Results of Operations” in our annual report on Form 10-K and quarterly reports on Form 10-Q, which are available on the Securities and Exchange Commission’s website at www.sec.gov. All written or oral forward-looking statements that we make, or that are attributable to us, are expressly qualified by this cautionary notice. We expressly disclaim any obligation to update the information in any public disclosure if any forward- looking statement later turns out to be inaccurate. A credit rating is an assessment provided by Nationally Recognized Statistical Ratings Organization (NRSRO) of the creditworthiness of an issuer with respect to debt obligations, including specific securities, money market instruments or other debts. The ratings will generally range from AAA (highest) to D (lowest). For more information on rating methodologies, please visit the following NRSRO websites: www.standardandpoors. com and select "Understanding Ratings" under Rating Resources on the homepage; www.moodys.com and select "Rating Methodologies" under Research and Ratings on the homepage; www.fitchratings.com and select "Ratings Definitions" on the homepage. All charts and tables sourced from Invesco Mortgage Capital as of 9/30/14 unless otherwise stated. This presentation is for informational purposes only and is not an offer to buy or sell any financial instrument. 2

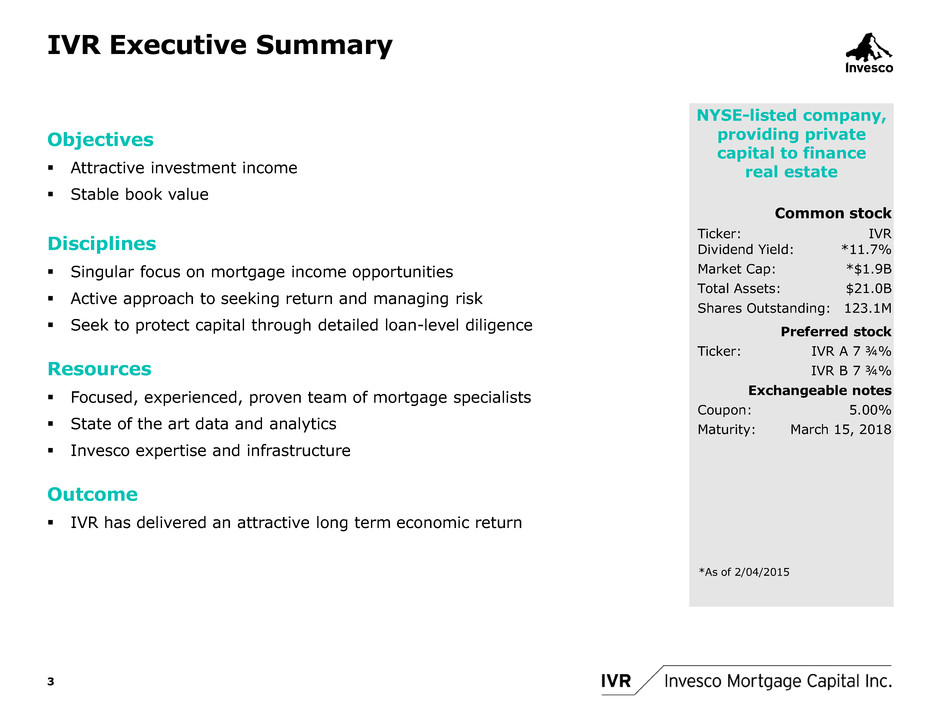
IVR Executive Summary Objectives Attractive investment income Stable book value Disciplines Singular focus on mortgage income opportunities Active approach to seeking return and managing risk Seek to protect capital through detailed loan-level diligence Resources Focused, experienced, proven team of mortgage specialists State of the art data and analytics Invesco expertise and infrastructure Outcome IVR has delivered an attractive long term economic return 3 NYSE-listed company, providing private capital to finance real estate Common stock Ticker: IVR Dividend Yield: *11.7% Market Cap: *$1.9B Total Assets: $21.0B Shares Outstanding: 123.1M Preferred stock Ticker: IVR A 7 ¾% IVR B 7 ¾% Exchangeable notes Coupon: 5.00% Maturity: March 15, 2018 *As of 2/04/2015

IVR Strategy Active approach to seeking return and managing risk Reduced sensitivity to changes in interest rates Higher cash flow stability in our assets makes it easier to hedge risk Reduction of 30 year mortgage backed securities (MBS) dramatically reduced prepayment risk and cash flow variability We expect interest rate volatility will be higher in 2015 vs. the last few years Reduction in allocation to Agency MBS has been well timed – The weighting of 30 Yr. MBS 4% and lower fell from 36% to 12% of IVR assets from 2Q 2013 through 3Q 2014 – Our strategy had been to sell into strength while the Fed was buying 4 Goals: • Reduced interest rate risk • Higher cash flow stability • More effective hedging to retain more yield • Book value stability FNMA 30 Yr. 3.5% yield spread over the interest rate swap curve (1) (1) Source : Barclays Live, Libor ZV spread, February 3, 2015

IVR Strategy Active approach to seeking return and managing risk Increased exposure to newly underwritten loans Examples of credit assets we purchase – High credit quality commercial mortgage backed securities (CMBS) with cash flow stability – Retained subordinates on residential securitizations – GSE Credit risk transfer securities – Super-enhanced re-performing legacy loan securitizations Mortgage credit has significantly outperformed Agency MBS and other credit sectors early in 2015(1) Improved balance sheet Created captive insurer member of the Federal Home Loan Bank Indianapolis (FHLBI) – FHLBI borrowing capacity raised to $2.5B in the 4th quarter of 2014 Securitization financing also reduced repo borrowings Avoided problem spots Ocwen exposure is low in legacy prime & alt-a, and zero in post crisis securitizations Drop in interest rates and regulatory actions exposed risk in crowded servicing strategies 5 Goals: • Credit quality: residential loan underwriting is pristine • Stronger balance sheet and expanded financing sources • Limited servicing risk (1) Source : Barclays Live

IVR Strategy Active approach to seeking return and managing risk 1/3rd of our equity is invested in debt backed by Commercial Real Estate (CRE)(1) Strong fundamentals support CRE loans and CMBS – Improving rents and occupancy rates – CRE valuations are supported by – the domestic economy – the low interest rate environment – minimal direct exposure to energy Focus on floating rate loan origination limits duration Significant advantages in CMBS – Minimal prepayment and extension risk via – Lockout, defeasance, & penalties protect our yield – Limited extension from prepay slowdown – Newly underwritten deals have lower LTV(2), higher DSCR(3), and higher credit support vs CMBS 1.0 – Liquidity and issuance have increased – Financing is attractive via repo and advances from FHLB – Ability to find relative value across credit and term structure (1) % of IVR equity in CMBS, commercial real estate loans, and JV interests in CRE as of 9/30/2014 (2) LTV (loan to value ratio) (3) DSCR (debt service coverage ratio) 6 Advantages: • Cash flow stability • Positive fundamentals • Attractive yield • Attractive financing

The IVR Portfolio

Portfolio Update 8 Highlights: Highly diversified portfolio – Residential & commercial – Agency & credit – New issue & legacy 2/3rds of equity allocated to credit – Fundamentals remain strong – Significantly less convexity risk than agency MBS Limited exposure to interest rates – Modeled equity duration of 5.29 years – Duration gap of 0.70 years – Empirical duration of ~0 years Leverage at 6.7x on a consolidated basis – Repo leverage is 5.2x(1) (1) See non-GAAP reconciliation on slide 15 Source: Invesco Mortgage Capital, as of September 30, 2014

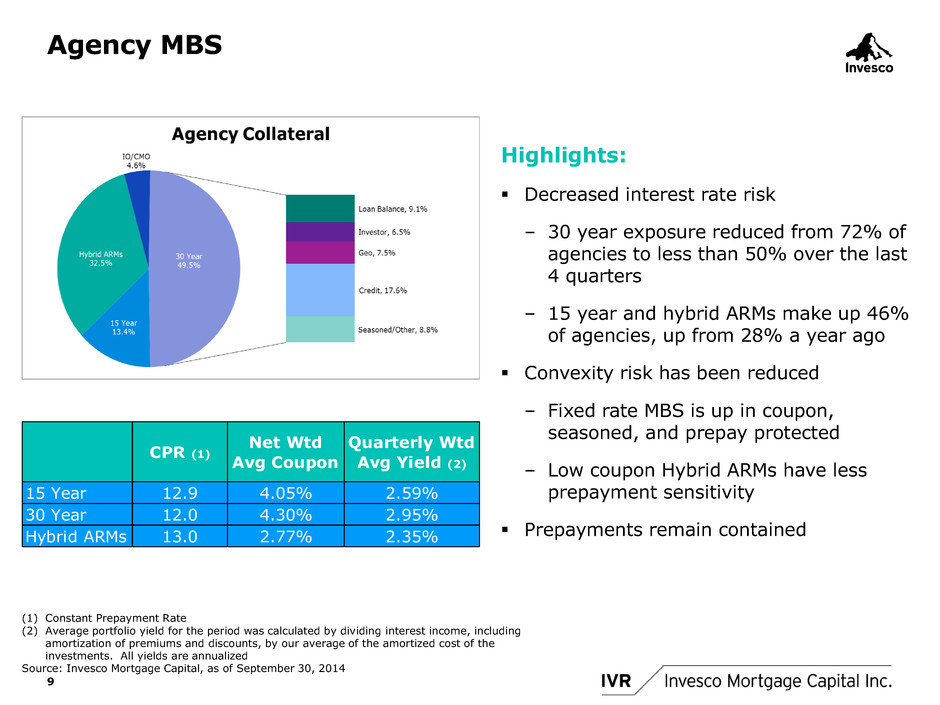
Agency MBS 9 Highlights: Decreased interest rate risk – 30 year exposure reduced from 72% of agencies to less than 50% over the last 4 quarters – 15 year and hybrid ARMs make up 46% of agencies, up from 28% a year ago Convexity risk has been reduced – Fixed rate MBS is up in coupon, seasoned, and prepay protected – Low coupon Hybrid ARMs have less prepayment sensitivity Prepayments remain contained (1) Constant Prepayment Rate (2) Average portfolio yield for the period was calculated by dividing interest income, including amortization of premiums and discounts, by our average of the amortized cost of the investments. All yields are annualized Source: Invesco Mortgage Capital, as of September 30, 2014 CPR (1) Net Wtd Avg Coupon Quarterly Wtd Avg Yield (2) 15 Year 12.9 4.05% 2.59% 30 Year 12.0 4.30% 2.95% Hybrid ARMs 13.0 2.77% 2.35%

Residential Mortgage Credit 10 Highlights: Senior Re-remics – Limited duration – Short cashflow – Top of capital structure Legacy Residential Mortgage Backed Securities (RMBS) – Limited duration – Top of capital structure – Upside exposure to improved fundamentals Re-performing RMBS – Limited duration – Short cashflow – Top of capital structure Credit Risk Transfer – Limited duration – Newly originated, high quality loans New issue RMBS – Newly originated, high quality loans – Non-recourse financing (1) Average book yield for the three month ending 9/30/14 was calculated by dividing interest income, including amortization of premiums and discounts, by our average of the amortized cost of the investments. All yields are annualized Source: Invesco Mortgage Capital, as of September 30, 2014 Duration Yield (1) Re-Remic 0.7 3.9% Legacy 0.8 4.0% Subprime / RePerforming 1.9 3.8% New Issue 4.8 4.6% Credit Risk Transfer 0.1 3.9%

Commercial Mortgage Credit Highlights: Legacy CMBS – 2005-7 mezzanine and junior AAA, short duration, improving fundamentals Post 2010 A/BBB – 2010-13 production, relatively strong underwriting – Underlying property price appreciation Post 2010 AAA/AA – Predominantly 2012-14 production with substantial subordination – Financed through captive CRE Loan Origination – Floating rate, attractive ROE – Pipeline continues to build 11 (1) Average book yield for the three months ending 9/30/14 was calculated by dividing interest income, including amortization of premiums and discounts, by our average of the amortized cost of the investments. All yields are annualized Source: Invesco Mortgage Capital, as of September 30, 2014; Minimum rating by one or more of the nationally recognized statistical rating organizations Duration Yield (1) Agency Unwrapped 5.2 5.50% Legacy 1.3 5.22 Post 2010 AAA/AA 7.3 3.79% Post 2010 A/BBB 5.8 5.23 Cusip Mezz 0.6 5.25% CRE Loans 0.1 8.44

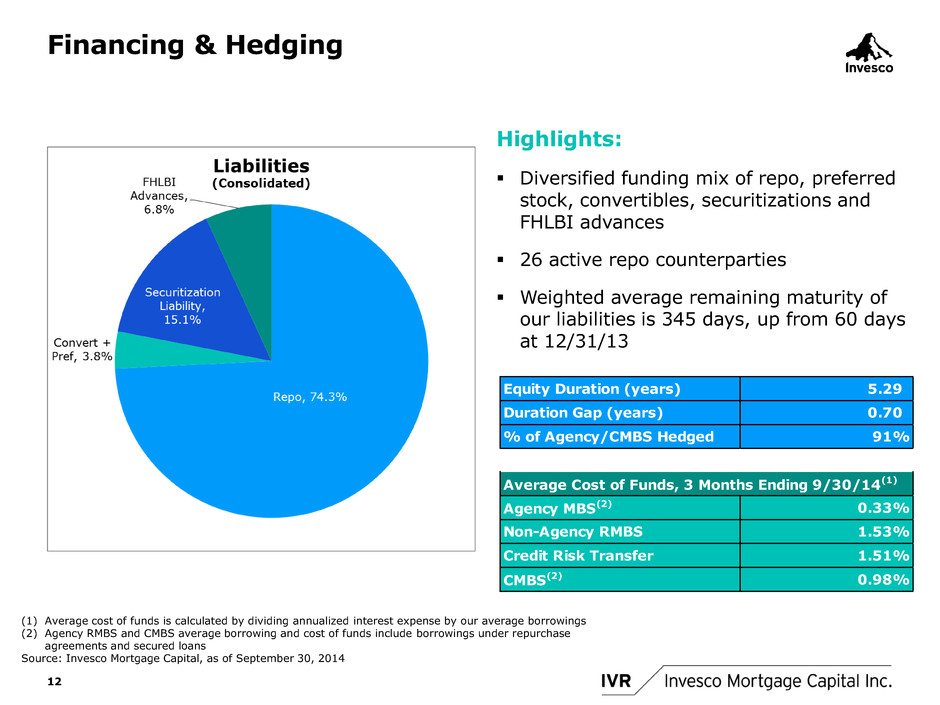
Financing & Hedging Highlights: Diversified funding mix of repo, preferred stock, convertibles, securitizations and FHLBI advances 26 active repo counterparties Weighted average remaining maturity of our liabilities is 345 days, up from 60 days at 12/31/13 12 (1) Average cost of funds is calculated by dividing annualized interest expense by our average borrowings (2) Agency RMBS and CMBS average borrowing and cost of funds include borrowings under repurchase agreements and secured loans Source: Invesco Mortgage Capital, as of September 30, 2014 Equity Duration (years) 5.29 Duration Gap (years) 0.70 % of Agency/CMBS Hedged 91%Average Cost of Funds, 3 Months Ending 9/30/14(1) Agency MBS(2) 0.33% Non-Agency RMBS 1.53% Credit Risk Transfer 1.51% CMBS(2) 0.98%

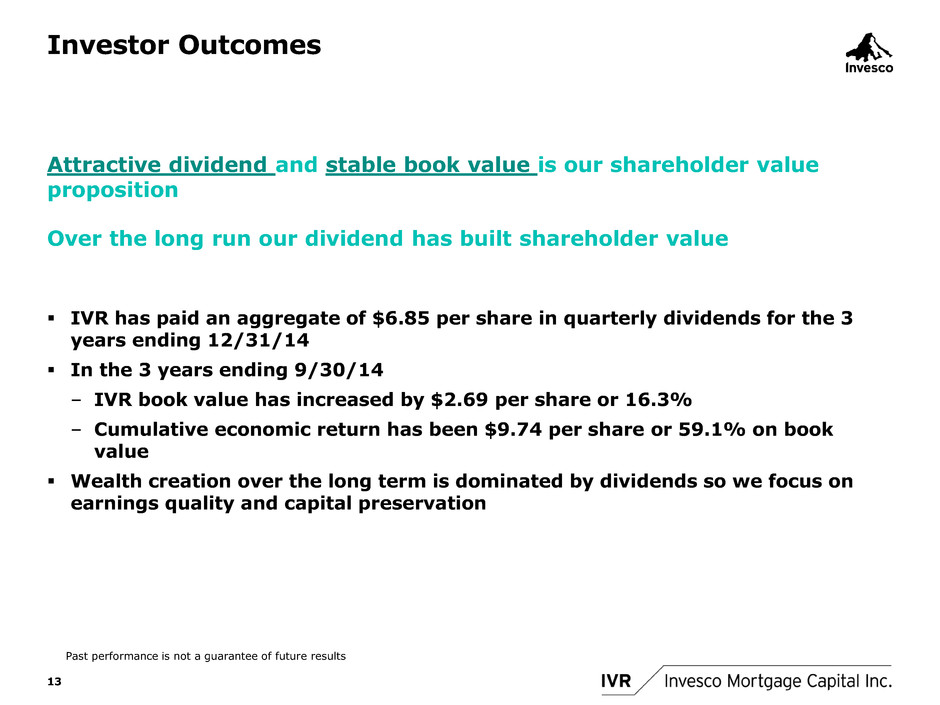
Investor Outcomes Attractive dividend and stable book value is our shareholder value proposition Over the long run our dividend has built shareholder value IVR has paid an aggregate of $6.85 per share in quarterly dividends for the 3 years ending 12/31/14 In the 3 years ending 9/30/14 – IVR book value has increased by $2.69 per share or 16.3% – Cumulative economic return has been $9.74 per share or 59.1% on book value Wealth creation over the long term is dominated by dividends so we focus on earnings quality and capital preservation 13 Past performance is not a guarantee of future results

Appendix — Non-GAAP Financial Information In addition to the results presented in accordance with U.S. GAAP, this presentation contains the non-GAAP financial measures of “core earnings”. The Company’s management uses core earnings in its internal analysis of results and believes this information is useful to investors for the reasons explained below. These non-GAAP financial measures should not be considered as substitutes for any measures derived in accordance with U.S. GAAP and may not be comparable to other similarly titled measures of other companies. An analysis of any non-GAAP financial measure should be made in conjunction with results presented in accordance with U.S. GAAP. Additional reconciling items may be added to the non-GAAP measures if deemed appropriate. The Company calculates core earnings as U.S. GAAP net income attributable to common shareholders adjusted for gain (loss) on sale of investments, net, realized gain on interest rate derivative instruments (excluding contractual net interest on interest rate swaps), unrealized loss on interest rate derivative instruments, amortization of deferred swap losses from de-designation and adjustments attributable to non-controlling interest. The Company believes the presentation of core earnings allows investors to evaluate and compare the performance of the Company to that of its peers because core earnings measures investment portfolio performance over multiple reporting periods by removing realized and unrealized gains and losses. The Company records changes in the valuation of its investment portfolio, and through December 31, 2013 certain interest rate swaps, in other comprehensive income. Effective December 31, 2013, the Company elected to discontinue hedge accounting for its interest rate swaps. As a result of its election, starting January 1, 2014, the change in market value of its interest rate swaps and the amortization of deferred swap losses remaining in other comprehensive income at December 31, 2013 are included in U.S. GAAP net income. In addition, the Company uses swaptions, invests in to-be-announced securities and U.S. Treasury futures that do not qualify under U.S. GAAP for inclusion in other comprehensive income, and, as such, the changes in valuation are recorded in the period in which they occur. For internal portfolio analysis, the Company’s management deducts these gains and losses from U.S. GAAP net income to provide a consistent view of investment portfolio performance across reporting periods. As such, the Company believes that the disclosure of core earnings is useful and meaningful to its investors. However, the Company cautions that core earnings should not be considered as an alternative to net income (determined in accordance with U.S. GAAP), or an indication of the Company's cash flow from operating activities (determined in accordance with U.S. GAAP), a measure of the Company's liquidity, or an indication of amounts available to fund its cash needs, including its ability to make cash distributions. 14 Reconciliation of U.S. GAAP net income attributable to common shareholders to core earnings $ in thousands, except per share data September 30, 2014 June 30, 2014 September 30, 2013 September 30, 2014 September 30, 2013 Net income (loss) attributable to common shareholders 30,672 (94,052) (8,686) (137,820) 214,152 Adjustments ( ain) Loss on sale of investments, net 47,952 20,766 69,323 80,436 56,919 Realiz d (gain) loss on derivative instruments (excluding c ct l net interest on interest rate swaps of $50,446, $52, 05, $0, $154,092 and $0, respectively) 1,016 15,037 (39,075) 34,877 (66,234) U realiz (gain) loss on interest rate derivative instruments (47,758) 100,574 45,962 133,863 21,810 L reign currency transactions 1,479 - - - - Amortizat n of deferred swap losses from de-designation 21,227 21,532 - 64,055 - Subtotal 23,916 157,909 76,210 314,710 12,495 Adjustment attributable to non-controlling interest (274) (1,807) (795) (3,592) (132) Core earnings 54,314 62,050 66,729 173,298 226,515 Basic earnings (loss) per common share 0.25 (0.76) (0.06) (1.12) 1.61 Core earnings per share attributable to common shareholders 0.44 0.50 0.49 1.41 1.70 Three Months Ended Nine Months Ended

Appendix — Non-GAAP Financial Information 15 Source: Invesco Mortgage Capital, as of September 30, 2014
