Attached files
| file | filename |
|---|---|
| EX-23.1 - EX-23.1 - Inovalon Holdings, Inc. | a2222935zex-23_1.htm |
Use these links to rapidly review the document
TABLE OF CONTENTS
INDEX TO CONSOLIDATED FINANCIAL STATEMENTS
As filed with the Securities and Exchange Commission on February 10, 2015
Registration No. 333-201321
UNITED STATES
SECURITIES AND EXCHANGE COMMISSION
Washington, DC 20549
AMENDMENT NO. 5 TO
FORM S-1
REGISTRATION STATEMENT
UNDER
THE SECURITIES ACT OF 1933
Inovalon Holdings, Inc.
(Exact name of registrant as specified in its charter)
| Delaware | 7374 | 47-1830316 | ||
| (State or other jurisdiction of incorporation or organization) |
(Primary Standard Industrial Classification Code Number) |
(I.R.S. Employer Identification Number) |
4321 Collington Road
Bowie, MD 20716
(301) 809-4000
(Address, including zip code, and telephone number, including area code, of registrant's principal executive offices)
Keith R. Dunleavy, M.D.
Chief Executive Officer and Chairman
Inovalon Holdings, Inc.
4321 Collington Road
Bowie, MD 20716
(301) 809-4000
(Name, address, including zip code, and telephone number, including area code, of agent for service)
Copies to:
| David P. Slotkin Spencer D. Klein Justin R. Salon Morrison & Foerster LLP 2000 Pennsylvania Avenue, Suite 6000 Washington, DC 20006 (202) 887-1500 |
Shauna L. Vernal Chief Legal Officer Inovalon Holdings, Inc. 4321 Collington Road Bowie, MD 20716 (301) 809-4000 |
Rachel W. Sheridan John H. Chory Latham & Watkins LLP John Hancock Tower, 27th Floor 200 Clarendon Street Boston, MA 02116 (617) 948-6000 |
Approximate date of commencement of proposed sale to the public: As soon as practicable after the effective date of this registration statement. If any of the securities being registered on this form are to be offered on a delayed or continuous basis pursuant to Rule 415 under the Securities Act of 1933 check the following box. o
If this form is filed to register additional securities for an offering pursuant to Rule 462(b) under the Securities Act, check the following box and list the Securities Act registration statement number of the earlier effective registration statement for the same offering. o
If this form is a post-effective amendment filed pursuant to Rule 462(c) under the Securities Act, check the following box and list the Securities Act registration statement number of the earlier effective registration statement for the same offering. o
If this form is a post-effective amendment filed pursuant to Rule 462(d) under the Securities Act, check the following box and list the Securities Act registration number of the earlier effective registration statement for the same offering. o
Indicate by check mark whether the registrant is a large accelerated filer, an accelerated filer, a non-accelerated filer, or a smaller reporting company. See the definitions of "large accelerated filer," "accelerated filer" and "smaller reporting company" in Rule 12b-2 of the Exchange Act. (Check one):
| Large accelerated filer o | Accelerated filer o | |
Non-accelerated filer ý (Do not check if a smaller reporting company) |
Smaller reporting company o |
CALCULATION OF REGISTRATION FEE
|
||||||||
| Title of Securities to be Registered |
Amount to be Registered(1) |
Proposed Maximum Aggregate Offering Price Per Share |
Proposed Maximum Aggregate Offering Price |
Amount of Registration Fee(2) |
||||
|---|---|---|---|---|---|---|---|---|
Class A Common Stock, $0.000005 par value per share |
25,555,555 | $26.00 | $664,444,430 | $71,269.34 | ||||
|
||||||||
- (1)
- Estimated pursuant to Rule 457(a) under the Securities Act of 1933, as amended. Includes the additional shares the underwriters have the right to purchase from the Registrant, if any.
- (2)
- Previously paid. Pursuant to Rule 457(a), no additional fee is payable as a result of the increase in the proposed maximum aggregate offering price per share reflected herein.
The Registrant hereby amends this Registration Statement on such date or dates as may be necessary to delay its effective date until the Registrant shall file a further amendment which specifically states that this Registration Statement shall thereafter become effective in accordance with Section 8(a) of the Securities Act of 1933, as amended, or until the Registration Statement shall become effective on such date as the Securities and Exchange Commission, acting pursuant to said Section 8(a), may determine.
The information in this preliminary prospectus is not complete and may be changed. These securities may not be sold until the registration statement filed with the Securities and Exchange Commission is effective. This preliminary prospectus is not an offer to sell nor does it seek an offer to buy these securities in any jurisdiction where the offer or sale is not permitted.
Subject to Completion. Dated February 10, 2015.
22,222,222 Shares

Class A Common Stock
This is the initial public offering of shares of Class A common stock of Inovalon Holdings, Inc.
We have two classes of common stock, Class A common stock and Class B common stock. The rights of the holders of our Class A common stock and Class B common stock are identical, except with respect to voting and conversion rights. Each share of Class A common stock will be entitled to one vote per share. Each share of Class B common stock will be entitled to 10 votes per share and will be convertible at the election of each holder at any time, or automatically upon the occurrence of certain events, into one share of Class A common stock. Immediately following the completion of this offering, outstanding shares of our Class B common stock will represent approximately 98% of the voting power of our outstanding common stock. See "Description of Capital Stock — Class A and B Common Stock."
Prior to this offering, there has been no public market for our Class A common stock. It is currently estimated that the initial public offering price per share will be between $24.00 and $26.00 per share. We have been approved for listing of our Class A common stock on the NASDAQ Global Select Market under the symbol "INOV."
We are an "emerging growth company" as defined under federal securities laws and, as such, have elected to comply with certain reduced public company reporting requirements.
Investing in our Class A common stock involves significant risks. See "Risk Factors" beginning on page 23 to read about factors you should consider before buying shares of our Class A common stock.
Neither the Securities and Exchange Commission nor any other regulatory body has approved or disapproved of these securities or passed upon the accuracy or adequacy of this prospectus. Any representation to the contrary is a criminal offense.
| |
Per Share
|
Total
|
|||
|---|---|---|---|---|---|
Initial public offering price |
$ | $ | |||
Underwriting discount(1) |
$ | $ | |||
Proceeds, before expenses, to Inovalon |
$ | $ |
- (1)
- See "Underwriting" for additional information regarding underwriting compensation.
The underwriters have the option to purchase up to an additional 3,333,333 shares from us at the initial public offering price less the underwriting discount.
The underwriters expect to deliver the shares of Class A common stock to purchasers in New York, New York on or about , 2015.
| Goldman, Sachs & Co. | Morgan Stanley | Citigroup |
| BofA Merrill Lynch | UBS Investment Bank |
| Baird | Piper Jaffray | Wells Fargo Securities | William Blair |
Prospectus dated , 2015.


Through and including , 2015 (the 25th day after the date of this prospectus), all dealers effecting transactions in those securities, whether or not participating in this offering, may be required to deliver a prospectus. This is in addition to a dealer's obligation to deliver a prospectus when acting as an underwriter and with respect to an unsold allotment or subscription.
Neither we nor the underwriters have authorized anyone to provide any information or to make any representations other than those contained in this prospectus or in any free writing prospectuses we have prepared. Neither we nor the underwriters take responsibility for, and can provide no assurance as to the reliability of, any other information that others may give you. This prospectus is an offer to sell only the shares offered hereby, but only under circumstances and in jurisdictions where it is lawful to do so. The information contained in this prospectus is current only as of its date.
Persons who come into possession of this prospectus and any applicable free writing prospectus in jurisdictions outside the United States are required to inform themselves about and to observe any restrictions as to this offering and the distribution of this prospectus and any such free writing prospectus applicable to that jurisdiction.
This prospectus includes market data and forecasts with respect to the healthcare industry. Although we are responsible for all of the disclosure contained in this prospectus, in some cases we rely on and refer to market data and certain industry forecasts that were obtained from third party surveys, market research, consultant surveys, publicly available information and industry publications and surveys that we believe to be reliable.
i
This summary highlights information contained elsewhere in this prospectus. It may not contain all the information that may be important to you. You should read the entire prospectus carefully, including the section entitled "Risk Factors" and our financial statements and the related notes included elsewhere in this prospectus before making an investment decision to purchase shares of our common stock.
In this prospectus, unless we indicate otherwise or the context requires, references to the "company," "Inovalon," "we," "our," "ours," and "us" refer to Inovalon Holdings, Inc. and its consolidated subsidiaries. The following summary is qualified in its entirety by the more detailed information and consolidated financial statements and notes thereto included elsewhere in this prospectus.
On January 14, 2015, our board of directors approved a five-for-one stock split of our Class A common stock and Class B common stock. Effective January 16, 2015, we amended our certificate of incorporation to give effect to the stock split and to change our authorized common equity capital to 900,000,000 shares of common stock, 750,000,000 shares of Class A common stock, and 150,000,000 shares of Class B common stock, all par value $0.000005 per share. All share data included in this prospectus give retroactive effect to the stock split and related amendment to our certificate of incorporation.
Our Company
We are a leading technology company that combines advanced cloud-based data analytics and data-driven intervention platforms to achieve meaningful insight and improvement in clinical and quality outcomes, utilization, and financial performance across the healthcare landscape. Our powerful platforms drive high-value impact, improving quality and economics for health plans, hospitals, physicians, patients, pharmaceutical companies, and researchers. The value we deliver to our clients is achieved by turning data into insights and those insights into action. Through our large proprietary datasets, advanced data integration technologies, sophisticated predictive analytics, and deep subject matter expertise, we deliver seamless, end-to-end platforms that bring the benefits of big data and large-scale analytics to the point of care. Our analytics identify gaps in care, quality, data integrity, and financial performance, while our data-driven intervention platforms provide clients with differentiated capabilities to resolve these gaps. During 2014, we provided these services to more than 100 clients representing approximately 200 patient populations, providing analytics informed by our data and insight on more than 754,000 physicians, 248,000 clinical facilities, 120 million unique patients (covering approximately 98.2% of all U.S. counties), and 9.2 billion discrete entries relating to patient interactions, medical procedures or changes in patients' medical conditions, which we refer to as medical events, a number that has been increasing at a rate of approximately 3.0% compounding monthly, or 42.6% annually, since 2000.
Healthcare costs in the United States have been increasing significantly for many years, currently approaching almost $3 trillion annually. This rise in healthcare costs has driven a broad transition from consumption-based payment models to value-based payment models across the healthcare landscape. As a result, the specific disease and comorbidity status (i.e., the presence of one or more diseases or medical conditions co-occurring with a primary disease or medical condition), clinical and quality outcomes, resource utilization, and care details of the individual patient have become increasingly relevant to the various constituents of the healthcare delivery system. Concurrently, the count and complexity of diseases, diagnostics, and treatments — let alone payment models and regulatory oversight requirements — have soared. In this setting, granular data has become critical to determining and improving quality of care and financial performance in healthcare.
1
We believe that the opportunity before us is substantial as data increasingly becomes the lynchpin in healthcare — from clinical quality outcomes and financial performance, to the consumer experience and drug discovery. A January 2013 McKinsey & Company, or McKinsey, report estimates that utilizing data analytics could drive improvements in healthcare resulting in a beneficial economic impact of $300 billion to $450 billion annually. As a reflection of the increasing need for data analytics, in the last several years our advanced analytics and data-driven intervention platforms have been driving significant economic impact through improvements in clinical and quality outcomes, disease and comorbidity data accuracy, and utilization, achieving hundreds of millions of dollars per year in quantified beneficial financial improvements for our clients.
At the core of our capabilities is a long history of innovation and profitable growth, positioning us to deliver value to our clients and capitalize on the confluence of recent changes in the healthcare industry that many describe as historically unprecedented. Our ability to rapidly innovate is enabled by the depth and breadth of our industry expertise, large-scale proprietary datasets, advanced analytical prowess, highly flexible platform components, a common native code base, and experience across the healthcare landscape.
We deliver value to our clients through our platforms, which are accomplished through four primary components:
- •
- Data Integration: Highly efficient and effective data
assimilation of structured and unstructured healthcare data in any format from highly disparate and disconnected sources;
- •
- Advanced Analytics: Data analysis using big-data
processing to yield highly actionable insights identifying gaps in care, quality, data integrity, and financial performance;
- •
- Intervention Platforms: Software and services that allow
our clients to take the insights derived from our analytics to address and resolve the identified gaps in care, quality, data integrity, and financial performance; and
- •
- Business Processing: Powerful business intelligence tools that summarize key analytics and benchmarking information as well as a comprehensive claims data warehouse that helps our clients comply with government mandated reporting requirements.
Our ability to deliver value to our clients through our advanced analytics and intervention platforms has allowed us to achieve significant growth since the company's organization. Over the last three years, our revenue has increased at a compounded annual growth rate of 19%, Adjusted EBITDA at a compounded annual growth rate of 20%, and net income at a compounded annual growth rate of 33% despite a 1% revenue decrease during the year ended December 31, 2013 as compared to the year ended December 31, 2012. For the nine months ended September 30, 2014, our revenue was $271.6 million, representing 17% growth over the same period of the prior year. In this same period, we generated Adjusted EBITDA of $103.1 million, representing 38% of revenue and 77% growth over the same period in the prior year. Net income for the nine months ended September 30, 2014 was $51.9 million, representing 19% of revenue and a 92% increase over the same period in 2013. Adjusted EBITDA is a non-GAAP measure. For a reconciliation of Adjusted EBITDA to net income, see "Selected Consolidated Financial Data."
Industry Overview
We believe that the increasing demand for our platform is driven by the confluence of four fundamental healthcare industry trends:
Unsustainable Rise in Healthcare Costs. Healthcare spending in the U.S. was almost $3 trillion in 2012 according to the 2012 National Health Expenditure Highlights prepared by the Centers for Medicare and Medicaid Services, or CMS, representing more than 17% of U.S. Gross Domestic Product, or GDP. The 2014 set of healthcare cost projections from the Congressional Budget Office, or the CBO, indicate national healthcare spending will rise to 22% of GDP by 2039.
2
To address this expected significant rise in healthcare costs, the U.S. healthcare market is seeking more efficient and effective methods of delivering care. This same trend is playing out across modernized nations around the globe.
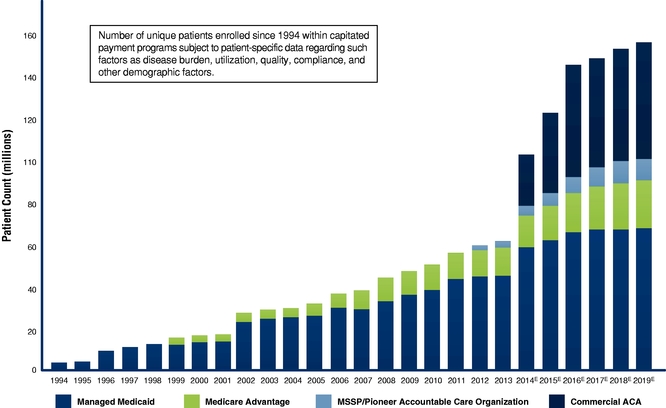
Shift to Value-Based Healthcare. The traditional fee-for-service reimbursement model in healthcare has played a major role in elevating both the level and growth rate of healthcare spending. In response, both the public and private sectors are shifting away from the historical fee-for-service models toward value-based, capitated payment models that are designed to incentivize value and quality at an individual patient level. As seen in the figure below, the number of Americans covered by capitated payment programs (care programs wherein an organization is financially responsible for the healthcare of a population of patients for which the total compensation is fixed other than adjustments for factors including specifically how sick individual patients are, how much resource is needed to be applied or spent on each patient, what is the quality of the clinical care, and other demographic factors) has been increasing rapidly and, according to industry sources and our internal estimates, is anticipated to increase from approximately 80 million at the start of 2014 to over 150 million by 2019. This increase is expected to further drive the critical importance to accurately measure, analyze, report, and improve patient disease and comorbidity conditions, utilization rates, and clinical quality outcomes.
Digitization of Healthcare Information. Across the healthcare landscape, a significant amount of data is being created every day driven by patient care, payment systems, regulatory compliance, and record keeping. These data include information within patient health records, clinical trials, pharmacy benefit programs, imaging systems, sensors and monitoring platforms, laboratory results, patient reported information, hospital and physician performance programs, and billing and payment processing. Despite significant investments by public and private sources within the industry, however, the digitized healthcare data remain largely stored in "walled gardens" — data that is static and not easily shared or interpreted. As the amount of data in healthcare continues to grow, we believe that it will be critical for the healthcare industry to be able to use this disparate data to better achieve the goals of higher quality and more efficient care.
3
Increasing Complexity. The healthcare industry is on a course of dramatically progressive complexity. As technology employed in the healthcare space has become increasingly sophisticated, new diagnostics and treatments have been introduced, the pool of clinical research has expanded, and the paradigms dictating payment and regulatory oversight have multiplied. This expanding complexity drives a growing and continuous need for analysis of the underlying and resulting data.
Problems Our Clients Face
As the U.S. healthcare market continues to transform, the aforementioned industry trends have set into motion a number of significant challenges faced by our clients. We believe that we are well-positioned and have the solutions to help clients not only adapt to, but thrive within, the new healthcare landscape.
Understanding and Improving Clinical Quality Outcomes. Quality and value-based, capitated programs require that clinical and quality outcomes be measured at the individual patient level. These measures require detailed and highly granular reporting of the care sought and delivered to each patient to allow for the accurate calculation of population quality metrics. The results of these quality measurements drive significant financial incentives and consequences, influencing more than an estimated $3 billion in quality-related payments annually.
Understanding the True Health Status of Patients. The ability to establish the appropriate treatment protocol among multiple physicians, ensure that patients are supported with the correct care resources and monitored for the proper patient-relevant quality metrics, and determine the overall population risk is contingent on the ability to become accurately aware of a patients' disease and comorbidity status. Having detailed and highly granular reporting of the disease and comorbidities of each patient is essential for care, quality, and financial performance.
Understanding and Improving Utilization. Under new legislation, health plans are required to submit data on the percentage of revenue collected from health insurance premiums that is spent on clinical services and quality improvement, which is more commonly known as the Medical Loss Ratio, or the MLR. If health plans fail to meet set MLR thresholds, they are required to rebate the customer. If the cost of care exceeds the MLR threshold, however, health plans must absorb the shortfall. Given the importance of accurately reporting the MLR and managing the underlying healthcare costs, many health plans enter into complex arrangements with key providers in their networks and other industry constituents (such as pharmaceutical companies and pharmacy benefit managers) through shared risk arrangements and performance bonus programs to help manage costs, drive improvements in patient health, and achieve long-term utilization containment and quality goals.
Complying with Increasingly Complex Regulatory Requirements. Federal and state regulation and compliance is increasing and becoming ever more complex, with agencies at nearly every level of government regulating the activities of organizations participating within the healthcare marketplace. The breadth, complexity, and intensity of regulation require these organizations to focus nearly every activity through a compliance lens in order to meet the data-intensive regulatory reporting requirements.
Enabling and Empowering the Consumer. Individuals can now buy direct coverage, select clinicians and hospitals, and directly research implications of specific medications, procedures, and treatment courses. Further, the individual is increasingly participating in the quantified-self movement in which they can self-monitor their key health metrics. This shift to a more informed and engaged consumer is resulting in new challenges and opportunities for how practice groups, payors, employers, pharmaceutical companies, retail pharmacies, and other healthcare constituents interact with consumers.
4
Unlocking the Value of Data through Actionable Interventions. A key commonality among the changes in the healthcare landscape is the importance of highly granular data. However, data by itself has limited usefulness without the right technology and systems in place to analyze and act on it and drive meaningful action. We believe that the leveraging of data is the critical differentiator in deriving meaningful insight and turning that insight into action to drive valuable impact across the healthcare landscape. However, in today's healthcare technology environment, much of this data goes unrecorded in a structured or meaningful way, unintegrated with other pertinent data related to the patient's events or conditions, and unanalyzed for the purposes of driving improvements in care and affordability.
Easily Deploying and Interoperating Platforms at Massive Scale. The ability to receive, seamlessly integrate, and accurately process extremely large-scale data flows efficiently and at high speeds is increasingly important and necessary for the healthcare industry. However, data integration and processing in massive scale is extremely challenging, which prevents the various components of the healthcare landscape from effectively communicating and coordinating with one another to deliver higher quality care. Overcoming this in scale is integral to managing large patient populations efficiently and effectively. Our platforms provide solutions to help address our clients' challenges and drive meaningful improvements in the clinical quality outcomes and financial performance across a wide expanse of our society's healthcare landscape.
Our Market Opportunity
We believe that our opportunity is significant and growing. According to a January 2013 McKinsey report, utilizing data analytics could reduce healthcare costs in the United States by $300 billion to $450 billion, or 12% to 17% of total U.S. healthcare costs today.
The ability to aggregate, integrate, and analyze data in massive scale and apply garnered insights in a manner that achieves meaningful impact is crucial for healthcare payors (e.g., health plans and integrated health delivery systems), clinical providers (e.g., hospitals, ACOs, and physicians), pharmaceutical and life sciences companies, and consumers. We estimate that our addressable market for these capabilities serving these healthcare constituents to be approximately $83.8 billion. We believe that the market opportunity for our current platform offering within the payor market, the historical focus of our company, is approximately $10.6 billion. According to industry sources, the market for software and related services is approximately $14.0 billion within the U.S. payor market. We believe that as analytics continue to demonstrate greater value within the U.S. payor landscape, the market will expand commensurately. As we continue to build and launch new capabilities, we believe it will provide a significantly larger value opportunity within this same payor space. For providers, industry sources estimate that software and related services represent a $32.3 billion U.S. market size. In the global pharmaceutical and life-sciences market, International Data Corporation, or IDC, in a 2013 report, estimates a $30.9 billion market size for total software and services spend in 2013. In the consumer market, an October 2013 Research and Markets report estimated a $6.6 billion global market size for mobile health applications and solutions. As with our other market segments, we believe that analytics will also drive a significant expansion in the consumer market.
In addition, the pressures that face the U.S. healthcare market are not unique, as other communities around the world are facing aging populations and growing pressures in the sustainable affordability of healthcare. We believe that our capabilities are highly applicable to other developed and developing countries around the globe, which we believe represents a sizable related future opportunity for us.
Our Platforms
Through the application of our platforms, we help our clients achieve large-scale insight and meaningful improvement in clinical and quality outcomes, utilization, and financial performance.
5
In deploying our technology to attain the results our clients require, they want us to synthesize opaque, convoluted, and disparate data into actionable information aligned with individualized goals and, in turn, empower patient and provider intervention platforms that achieve the realization of their goals in a measurable way. The diagram below illustrates the components of our technology platforms.
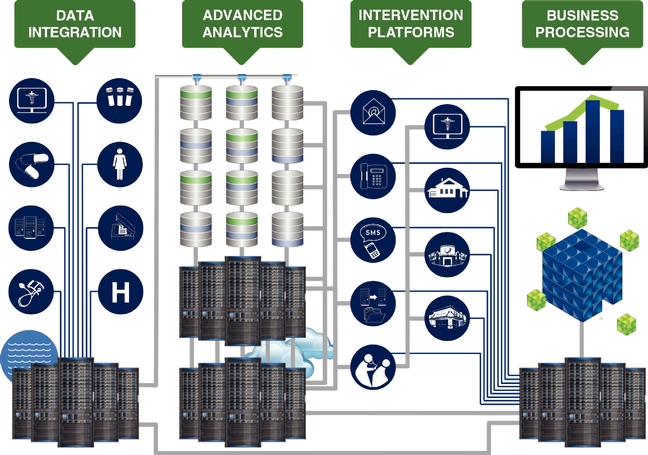
Our platforms' capabilities are currently engaged by more than 100 clients supporting approximately 200 patient populations that leverage our ability to analyze and improve clinical and quality outcomes and financial performance.
Data Integration: Datasets and the management of data are part of our core strengths, which give us insight into how a patient, provider, or population is doing. We integrate data seamlessly and securely into our systems through our proprietary extraction, transformation, and load tools and processes. Data we receive in the course of providing our services are statistically de-identified and stored in our Medical Outcomes Research for Effectiveness and Economics Registry, or MORE2 Registry®, which, as of December 31, 2014, contained more than 9.2 billion medical events from more than 120 million unique patients, 754,000 physicians, and 248,000 clinical facilities, touching 98.2% of all U.S. counties and Puerto Rico and growing at a rate of approximately 42.6% annually since 2000.
Advanced Analytics. For years we have developed, honed, and scaled a portfolio of sophisticated analytics. Applying our team's deep subject matter expertise in compute processing, data architecture, statistics, medical sciences, and healthcare policy, and leveraging the billions of medical events within our significant propriety datasets, we believe that we have developed one of the most advanced analytical platforms within the industry, as well as a culture and set of analytical
6
toolsets that serve to rapidly innovate and significantly expand our platform. Examples of the innovative analytics powered by this combination of data and processing capabilities include:
- •
- disease and comorbidity presence and closure probability determination analytics;
- •
- clinical and quality outcomes gap presence and closure probability determination analytics;
- •
- medication compliance and persistence analytics;
- •
- principally relevant provider determination analytics;
- •
- targeted intervention timing optimization analytics;
- •
- targeted intervention venue and logistics optimization analytics;
- •
- gap resolution valuation determination and prioritization analytics;
- •
- population simulation analytics; and
- •
- relative comparative analytics.
Intervention Platforms. Our data-driven intervention platforms are toolsets and services that enable our clients to take the insights derived from our analytics and implement solutions at the patient and provider level in order to achieve meaningful impact with the patient and provider. Our data-driven intervention platform tools encompass both internal administrative tasks as well as outbound, patient-oriented and provider-oriented functions. Examples of our intervention platform tools include:
- •
- point of care tools that provide patient-level insight to the healthcare provider, which guides the provider to aid in
the assessment, documentation, and care of a specific patient;
- •
- communication tools that support a wide range of notifications and interactions with patients and providers at the
appropriate level of implied education and language to aid in the process of achieving patient and provider actions;
- •
- supplemental patient encounter tools that facilitate the coordination of data-driven patient encounters for those who are
unable to participate in traditional office encounter venues; and
- •
- medical record data tools that facilitate electronic medical record data pulls, remote accessing, and clinical facility communications regardless of the underlying medical record data medium (e.g., digital or paper).
Business Processing. Our business processing toolsets are made up of a powerful business intelligence system and comprehensive data warehousing, which provide historical and current data insight, reporting, and benchmarking to support multiple client business needs such as government-mandated data filings, financial planning, and compliance requirements.
Our Competitive Strengths
We believe that our operational and financial success is based on the following key strengths:
Industry-Leading Analytics. We have demonstrated performance and leadership in disease and comorbidity identification analytics, predictive model analytics, patient and provider intervention prioritization analytics, quality outcomes analytics, and a host of additional analytical and data-driven processes. Based on our experience in the industry and our interactions with existing and prospective clients, we believe that very few other organizations, if any, are able to offer the depth and breadth of data-driven analytical insights, tools, and actionable interventions that our platforms are able to offer.
7
Industry-Leading Data Asset. We maintain one of the industry's largest independent datasets in our MORE2 Registry. The primary source nature of the contributing data, the clinical content depth of certain elements, the analytically-derived enrichments, the significant data integrity, and the ability to maintain accurate identification of entries and patient matching over time regardless of data source and chronology (a valuable characteristic within our datasets known as longitudinal matching) all combine to create a unique and valuable asset. We believe that these datasets serve as a significant differentiator, informing analytical and product strength design, population simulations, health outcomes research, patient engagement, and both speed-to-market and speed-to-impact capabilities.
Fully Integrated End-To-End Solution Delivery. Our platform is able to turn data into insights and insights into actionable interventions. The ability of our platform to integrate disparate and highly complex data to derive impactful and actionable insights has enabled us to bridge the gap from analytics to practical applications on a vast scale.
Scale of Organically Developed Platform. We have developed a highly efficient and scalable data and analytics platform that has successfully scaled to serve many of the nation's largest health plans as well as hundreds of separate patient populations concurrently. This platform has been developed on one common code base, supporting strong interoperability within our platform, efficiency in innovating and expanding our platform capabilities, and establishing both predictability and reliability when operated at high levels of load.
Subject Matter Expertise. We have, and plan to continue to cultivate, a culture of fostering domain expertise. We maintain a dedicated research team comprised of industry experts and thought leaders, including physicians, as well as clinical, statistical, economical, and data research scientists, and field practitioners who focus on next-generation healthcare solutions and data applications. In addition, we empower our product groups with their own industry experts who focus on research and development in their respective product domains.
Industry Innovator and Thought-Leader. We invest considerable time and resources to produce ground-breaking research and strategically share it through industry publications, peer presentations, strategic relationships, and the media. Our MORE2 Registry is routinely featured at high-profile industry events and within influential publications, which we believe further reinforces our brand as an industry innovator and thought-leader.
Long, Successful, Profitable Operating History. We have been delivering value to our clients while gaining scale and profitability since 2006, the year of our reorganization as a C corporation. This scale and profitability has provided organizational stability, an empowerment to invest in ongoing research and development, a high level of trust and confidence in us from our existing clients and potential clients, and ready access to resources to meet our clients' needs.
Trusted, Independent, and Unbiased Partner. We are not owned or influenced by a health plan or private equity organization. As a result, our data and analyses remain truly independent, not biased to any single patient base, we are incentivized to be transparent with our clients, and we believe our goals are more fully aligned with the success of our clients.
We have grown by attracting clients, accumulating increasingly larger and more robust datasets, and developing more advanced analytics from this growing dataset that deliver increasingly valuable insights and impact. By providing increasingly valuable insights and performing increasingly effective patient and provider interventions we are able to deliver greater value to our clients. As our data asset continues to grow, our analytics and intervention solutions become even more effective and our clients realize even more value from our solutions. This in turn
8
results in greater demand for our solutions and attracts new clients. We believe that this virtuous cycle provides us with a competitive position that cannot be easily replicated.
Growth Strategies
Our objective is to continue to provide leading data analytics and intervention platforms across the healthcare landscape while continuing to grow profitably. We intend to achieve this objective through the following key strategies.
Deliver Increasing Value to Existing Clients. We believe that we have a significant opportunity to deliver increasing value to our existing clients and this, in turn, will drive continued growth for us. As our clients recognize value and success as a result of working with our platforms, we frequently see our clients grow in their patient count and increase the number of products engaged with us — both of which result in our mutual success and growth. As we continue to deliver value to our clients, we plan to increase revenue from our existing clients by expanding their use of our platforms, selling to other parts of their organizations, and selling additional analytical toolsets and services to them.
Continue to Grow Our Client Base. We believe that we are still in the early stages of realizing our substantial opportunity to grow our client base. We intend to leverage our expertise and experience from the existing large client base to gain new clients through increased investment in our sales force and marketing efforts.
Continue to Innovate. Our strength in applying advanced, big data, cloud-based data analytics and our proprietary datasets enable us to achieve increasingly more impactful results for our clients. We intend to continue to invest in research and development to further enhance our data analytics and intervention platforms.
Continue Expanding into Adjacent Verticals. We believe the application of advanced analytics and data extends well beyond our current market opportunities and provides additional adjacent market verticals for growth. These verticals include providers, pharmaceutical and life sciences, employer and private exchanges, and direct to consumer.
Expand Reach through Growing our Channel Partnerships. While we have been successful in growing our business through our direct sales efforts, we believe there is a significant opportunity that exists for us to further expand and accelerate our reach through channel partnerships with organizations such as retail clinics, pharmaceutical companies, contract research organizations, large technology solution providers, and consulting firms.
Continue to Leverage our Technology Partnerships. The healthcare industry has traditionally lagged behind the technology innovation curve. Our advanced data processing and analytics capabilities, coupled with infrastructure thought leadership from leading vendors like EMC, has enabled us to empower our clients with powerful data-driven solution offerings and further transform the use case of modern technologies across the evolving IT healthcare landscape. We intend to continue to invest in these partnerships with thought leaders in the software and infrastructure sector.
Expand Internationally. Governments, corporations, and consumers worldwide face similar pressures as within the U.S. with respect to their healthcare systems. We believe that our capabilities are highly applicable to other countries around the world and we intend to invest in replicating our success in the U.S. market to other strategic countries and regions.
Selectively Pursue Acquisitions. We plan to selectively pursue acquisitions of complementary businesses, technologies, and teams that will allow us to add new features and functionalities to
9
our platform and accelerate the pace of our innovation and expansion into adjacent market spaces beyond what we can achieve organically.
Leverage our Dynamic, Passionate and Mission-Focused Culture. We believe that our work must meet a higher standard. We believe that the analytics that we design, deliver, and support achieve an impact in the lives of real people — parents, spouses, partners, siblings, and children — making integrity and quality cornerstones of our culture. Our dedication to integrity and quality extends to the proprietary technology used for medical data integration, analysis, abstraction, and reporting. Even more importantly, this culture is embraced throughout our company.
Recent Developments — Financial and Operating Information
Preliminary Unaudited 2014 Financial and Other Data
Our unaudited consolidated financial and key metrics data for the three months and the year ended December 31, 2014 presented below is preliminary and estimated financial information prepared by our management in good faith based upon our internal reporting for the three months and year ended December 31, 2014. Where indicated, these estimates are provided as a range. As these estimates are preliminary, actual results may still occur outside of the provided range. These estimates are preliminary and represent the most current information available to management. We have not identified any unusual or unique events or trends that occurred during the period which might materially affect these estimates. The unaudited financial information set forth below is subject to adjustments that may be identified when audit work is performed on our preliminary, unaudited financial information. As a result, our actual financial results for the three months and year ended December 31, 2014 may be different from the preliminary estimates herein and those differences could be material.
In addition, our independent registered public accounting firm, Deloitte & Touche LLP, has not audited, reviewed, compiled or performed any procedures on this preliminary financial data, and accordingly, does not express an opinion or other form of assurance with respect to this preliminary financial data. These estimates should not be viewed as a substitute for our full interim or annual financial statements prepared in accordance with GAAP. As a result, you are cautioned not to place undue reliance on the information furnished in this presentation and should view this information in the context of our 2014 results when such results are disclosed in our Annual Report on Form 10-K for the year ended December 31, 2014. See "Risk Factors" and "Forward-Looking Statements."
For a further description of Adjusted EBITDA and Adjusted EBITDA margin, non-GAAP measures, and our MORE2 Registry dataset metrics, Trailing 12 month Patient Analytics Months, Engaged Patient Populations, revenue from data analytics subscriptions and revenue from data-driven intervention platform services, see " — Summary Consolidated Financial and Other Data" and "Selected Consolidated Financial Data."
| |
Three Months Ended December 31, |
Year Ended December 31, |
|||||||||||||||||
|---|---|---|---|---|---|---|---|---|---|---|---|---|---|---|---|---|---|---|---|
| |
2013 |
2014 |
2013 |
2014 |
|||||||||||||||
| |
|
(estimated & unaudited) |
|
(estimated & unaudited) |
|||||||||||||||
| |
|
Low |
High |
|
Low |
High |
|||||||||||||
| |
|||||||||||||||||||
| |
(in thousands) |
||||||||||||||||||
Consolidated Statement of Operations Data: |
|||||||||||||||||||
Revenue |
$ | 64,534 | $ | 88,400 | $ | 90,400 | $ | 295,798 | $ | 360,000 | $ | 362,000 | |||||||
Income from operations |
$ | 8,189 | $ | 23,100 | $ | 25,100 | $ | 52,445 | $ | 109,000 | $ | 111,000 | |||||||
Net income |
$ | 5,735 | $ | 13,100 | $ | 14,100 | $ | 32,718 | $ | 65,000 | $ | 66,000 | |||||||
10
| |
Three Months Ended December 31, |
Year Ended December 31, |
|||||||||||||||||
|---|---|---|---|---|---|---|---|---|---|---|---|---|---|---|---|---|---|---|---|
| |
2013 |
2014 |
2013 |
2014 |
|||||||||||||||
| |
|
(estimated & unaudited) |
|
(estimated & unaudited) |
|||||||||||||||
| |
|
Low |
High |
|
Low |
High |
|||||||||||||
| |
|||||||||||||||||||
| |
(in thousands, except percentages and statements of work) |
||||||||||||||||||
Other Financial Data and Key Metrics: |
|||||||||||||||||||
Adjusted EBITDA(1) |
$ | 13,513 | $ | 30,000 | $ | 31,500 | $ | 71,847 | $ | 133,000 | $ | 134,500 | |||||||
Adjusted EBITDA margin(1) |
20.9 | % | 33.9 | % | 34.8 | % | 24.3 | % | 36.9 | % | 37.2 | % | |||||||
Data analytics and data-driven intervention revenue mix: |
|||||||||||||||||||
Revenue from data analytics subscriptions |
48.6 |
% |
57.6 |
% |
57.8 |
% |
|||||||||||||
Revenue from data-driven intervention platform services: |
|||||||||||||||||||
Fully automated processes |
4.3 | % | 7.2 | % | 7.4 | % | |||||||||||||
Partially automated processes |
47.1 | % | 34.9 | % | 35.1 | % | |||||||||||||
| | | | | | | | | | | | | | | | | | | | |
|
51.4 | % | 42.1 | % | 42.5 | % | |||||||||||||
| |
Year Ended December 31, |
||||||
|---|---|---|---|---|---|---|---|
| |
2013 | 2014 | |||||
Other Key Metrics: |
|||||||
MORE2 Registry dataset metrics |
|||||||
Unique patient count |
109,464 | 120,170 | |||||
Medical event count |
8,321,236 | 9,250,424 | |||||
Trailing 12 month Patient Analytical Months (PAM) |
12,812,630 |
16,519,827 |
|||||
Engaged patient population statements of work |
356 | 575 | |||||
| |
December 31, | |||||||||
|---|---|---|---|---|---|---|---|---|---|---|
| |
2013 |
2014 |
||||||||
| |
|
(estimated & unaudited) |
||||||||
| |
|
Low |
High |
|||||||
| |
||||||||||
| |
(in thousands) |
|||||||||
Consolidated Balance Sheet Data: |
||||||||||
Cash and cash equivalents |
$ | 110,594 | $ | 161,700 | $ | 163,400 | ||||
Working capital |
$ | 130,562 | $ | 166,000 | $ | 168,000 | ||||
Long-term debt(2) |
$ | 279 | $ | 281,418 | $ | 281,418 | ||||
- (1)
- Adjusted
EBITDA and Adjusted EBITDA margin are financial measures not calculated in accordance with U.S. generally accepted accounting principles, or GAAP.
For definitions of Adjusted EBITDA and Adjusted EBITDA margin, as well as the reasons why we believe that Adjusted EBITDA and Adjusted EBITDA margin provide useful information to investors and, to the
extent material, any additional purposes for which we use Adjusted EBITDA and Adjusted EBITDA margin, see "Selected Consolidated Financial Data."
- (2)
- Credit facilities plus capital lease obligations, less current portion.
11
- The following table presents a reconciliation of net income to Adjusted EBITDA for each of the periods indicated:
| |
Three Months Ended December 31, |
Year Ended December 31, |
|||||||||||||||||
|---|---|---|---|---|---|---|---|---|---|---|---|---|---|---|---|---|---|---|---|
| |
2013 |
2014 |
2013 |
2014 |
|||||||||||||||
| |
|
(estimated & unaudited) |
|
(estimated & unaudited) |
|||||||||||||||
| |
|
Low |
High |
|
Low |
High |
|||||||||||||
| |
|||||||||||||||||||
| |
(in thousands) |
||||||||||||||||||
Reconciliation of Net Income to Adjusted EBITDA: |
|||||||||||||||||||
Net Income |
$ | 5,735 | $ | 13,100 | $ | 14,100 | $ | 32,718 | $ | 65,000 | $ | 66,000 | |||||||
Depreciation and amortization |
4,412 | 4,800 | 4,900 | 15,517 | 19,800 | 19,900 | |||||||||||||
Interest expense |
18 | 1,100 | 1,200 | 79 | 1,300 | 1,400 | |||||||||||||
Interest (income) |
(3 | ) | — | — | (9 | ) | — | — | |||||||||||
Provision for income taxes |
2,439 | 9,500 | 9,600 | 19,657 | 43,300 | 43,400 | |||||||||||||
| | | | | | | | | | | | | | | | | | | | |
EBITDA |
12,601 | 28,500 | 29,800 | 67,962 | 129,400 | 130,700 | |||||||||||||
Stock-based compensation |
434 | 1,500 | 1,700 | 1,842 | 2,800 | 3,000 | |||||||||||||
Other non-comparable items (a) |
— | — | — | 1,565 | — | — | |||||||||||||
Professional service fees (b) |
478 | — | — | 478 | 800 | 800 | |||||||||||||
| | | | | | | | | | | | | | | | | | | | |
Adjusted EBITDA |
$ | 13,513 | $ | 30,000 | $ | 31,500 | $ | 71,847 | $ | 133,000 | $ | 134,500 | |||||||
| | | | | | | | | | | | | | | | | | | | |
| | | | | | | | | | | | | | | | | | | | |
- (a)
- Other
"non-comparable items" include business transaction-related professional fees, corporate name change and associated rebranding expenses, workforce
restructuring expenses, and certain legal costs. We believe these are non-comparable expenses that should be excluded from Adjusted EBITDA in order to more effectively assess our period-over-period
and on-going operating performance.
- (b)
- Represents legal costs associated with the enforcement of a specific client contract. The legal process associated with this matter began in the first quarter of 2013 and concluded in the second quarter of 2014.
Comparison of the Three Months Ended December 31, 2014 to the Three Months Ended December 31, 2013 (Unaudited)
Revenue is currently estimated to be between $88.4 and $90.4 million for the three months ended December 31, 2014, representing an estimated increase of approximately 37% to 40% compared to the same period in the prior year. This estimated increase is primarily attributable to an increase in revenue primarily from new clients as well as a net increase from existing clients.
Income from operations is currently estimated to be between $23.1 and $25.1 million for the three months ended December 31, 2014, representing an estimated increase of approximately 182% to 207% compared to the same period in the prior year. The estimated improvement in income from operations is primarily due to the increase in revenue, and the reduced cost of revenue as a percentage of revenue driven by revenue mix shifting toward more data-driven analytical solution activities (from data-driven intervention services), as well as continued efficiency gains through technology implementation, standardization of services, and operational process automation.
Adjusted EBITDA is currently estimated to be between $30.0 and $31.5 million for the three months ended December 31, 2014, representing an estimated increase of approximately 122% to 133% compared to the same period in the prior year. The estimated increase in Adjusted EBITDA is primarily due to the improvement in our income from operations described above, as well as increased adjustments to net income to arrive at Adjusted EBITDA due to a higher depreciation and amortization and higher stock-based compensation expense.
Net income is currently estimated to be between $13.1 and $14.1 million for the three months ended December 31, 2014, representing an estimated increase of approximately 128% to 146% compared to the same period in the prior year. The estimated improvement in net income is primarily due to the growth in income from operations, partially offset by an increase in our provision for income taxes.
12
Comparison of the Year Ended December 31, 2014 (Unaudited) to the Year Ended December 31, 2013
Revenue is currently estimated to be between $360.0 and $362.0 million for the year ended December 31, 2014, representing an estimated increase of approximately 22% compared to the prior year. This estimated increase is primarily attributable to increase in revenue from new clients as well as a net increase from existing clients.
Income from operations is currently estimated to be between $109.0 and $111.0 million for the year ended December 31, 2014, representing an estimated increase of approximately 108% to 112% compared to the prior year. The estimated improvement in income from operations is primarily due to the increase in revenue and reduction in cost of revenues driven by revenue mix shifting toward more data-driven analytical solution activities (from data-driven intervention services), as well as continued efficiency gains through technology implementation, standardization of services, and operational process automation.
Adjusted EBITDA is currently estimated to be between $133.0 and $134.5 million for the year ended December 31, 2014, representing an estimated increase of approximately 85% to 87% compared to the prior year. The estimated increase in Adjusted EBITDA is primarily due to the improvement in our income from operations described above, as well as increased adjustments to net income to arrive at Adjusted EBITDA due to higher depreciation and amortization and higher stock-based compensation expense.
Net income is currently estimated to be between $65.0 and $66.0 million for the year ended December 31, 2014, representing an estimated increase of approximately 99% to 102% compared to the prior year. The estimated improvement in net income is primarily due to the growth in income from operations, partially offset by an increase in our provision for income taxes.
Summary Risk Factors
Our business is subject to a number of risks and uncertainties, including those highlighted in the section titled "Risk Factors" immediately following this prospectus summary. Some of these risks include, among others:
- •
- we may not grow at the rates we historically have achieved or at all, even if our key metrics indicate growth, which
could have a material adverse effect on the market price of our Class A common stock;
- •
- if our existing clients do not renew their agreements with us, renew at lower fee levels, decline to purchase additional
services from us, choose to purchase fewer services from us, or terminate their agreement with us, and we are unable to replace any lost revenue, our business and operating results could suffer;
- •
- our top clients account for a significant portion of our revenues and, as a result, the loss of one or more of these
clients could materially and adversely affect our business and operating results;
- •
- if we do not develop new services that are adopted by clients or fail to provide high-quality support services to our
clients, our growth prospects, revenues and operating results could be materially and adversely affected;
- •
- we cannot assure you that we will be able to manage our growth effectively, which could have a material adverse effect on our business, results of operations, and growth prospects;
13
- •
- if our security measures fail or are breached and unauthorized access to a client's data is obtained, our services may be
perceived as insecure, we may incur significant liabilities, our reputation may be harmed, and we could lose sales and clients;
- •
- our quarterly operating results may fluctuate significantly, which could adversely impact the value of our Class A
common stock;
- •
- because the dual class structure of our common stock has the effect of concentrating voting control with holders of our
Class B common stock, these holders will continue to have significant influence over our company after this offering, including control over decisions that require the approval of stockholders,
which could limit your ability to influence the outcome of matters submitted to stockholders for a vote; and
- •
- an active, liquid trading market for our Class A common stock may not develop, which may limit your ability to sell your shares at or above the initial public offering price.
Corporate Reorganization and Credit Facilities
Effective September 17, 2014, in order to facilitate the administration, management, and development of our business and this offering, Inovalon, Inc. implemented a holding company reorganization, or the Corporate Reorganization, pursuant to which we became the new parent company and Inovalon, Inc. became our direct, wholly owned subsidiary. To implement the Corporate Reorganization, Inovalon, Inc. formed our company and we, in turn, formed Inovalon Merger Sub, Inc., or Merger Sub. The holding company structure was implemented by the merger of Merger Sub with and into Inovalon, Inc. with Inovalon, Inc. surviving the merger as a direct, wholly-owned subsidiary of our company. As a result of the Corporate Reorganization, each share of Inovalon, Inc. issued and outstanding immediately prior to the merger automatically converted into one share of common stock of our company.
On September 19, 2014, we and our subsidiaries entered into a credit and guaranty agreement with Goldman Sachs Bank USA, as administrative agent, and the lenders from time to time party thereto, which we refer to as the Credit Agreement. The terms of the Credit Agreement provide for credit facilities in the aggregate maximum principal amount of $400.0 million, consisting of a senior unsecured term loan facility in the original principal amount of $300.0 million, which we refer to as the Term Loan Facility, and a senior unsecured revolving credit facility in the maximum principal amount of $100.0 million, or the Revolving Credit Facility, which we refer to together with the Term Loan Facility as the Credit Facilities. Proceeds of the Revolving Credit Facility may be used for working capital and general corporate purposes. The obligations under the Credit Facilities are guaranteed by our domestic, wholly owned subsidiaries.
After the Corporate Reorganization, our capital stock was reclassified to implement a dual class capital structure providing for two classes of common stock, with each share of common stock held by our existing stockholders reclassified as Class B common stock. Following the reclassification, we redeemed approximately 8.33% of our Class B common stock on a pro rata basis from our existing stockholders for an aggregate amount of $300.0 million using the proceeds from the Term Loan Facility, as more fully described in "Management's Discussion and Analysis of Financial Condition and Results of Operations — Liquidity and Capital Resources — Debt."
Corporate Information
Our principal executive offices are located at 4321 Collington Road, Bowie, Maryland 20716. Our telephone number at that address is (301) 809-4000 and our Internet address is www.inovalon.com. The information contained on, or that can be accessed through, our website is
14
not a part of this prospectus. Investors should not rely on any such information in deciding whether to purchase our Class A common stock.
"Inovalon," the Inovalon logo, and other Inovalon marks are trademarks of Inovalon. This prospectus contains references to our trademarks and to trademarks belonging to other entities. Solely for convenience, trademarks and trade names referred to in this prospectus, including logos, artwork and other visual displays may appear without the ® or ™ symbols, but such references are not intended to indicate that we or their respective owners will not assert, to the fullest extent under applicable law, our rights or the rights of the applicable licensor to these trademarks and trade names. We do not intend our use or display of other companies' trade names or trademarks to imply a relationship with, or endorsement or sponsorship of us by, any such companies.
Implications of Being an Emerging Growth Company
As a company with less than $1.0 billion in revenue during our most recently completed fiscal year, we qualify as an "emerging growth company" as defined in Section 2(a) of the Securities Act of 1933, or the Securities Act, as modified by the Jumpstart Our Business Startups Act of 2012, or the JOBS Act. As an emerging growth company, we may take advantage of specified reduced disclosure and other requirements that are otherwise applicable, in general, to public companies that are not emerging growth companies. These provisions include:
- •
- an exemption from compliance with the auditor attestation requirement on the effectiveness of our internal control over
financial reporting;
- •
- an exemption from compliance with any requirement that the Public Company Accounting Oversight Board may adopt regarding
mandatory audit firm rotation or a supplement to the auditor's report providing additional information about the audit and the financial statements;
- •
- reduced disclosure about our executive compensation arrangements; and
- •
- exemptions from the requirements to obtain a non-binding advisory vote on executive compensation or a shareholder approval of any golden parachute arrangements.
We may take advantage of these exemptions for up to five years or such earlier time that we are no longer an emerging growth company. Accordingly, the information contained herein may be different than the information you receive from other public companies in which you hold stock. We would cease to be an emerging growth company upon the earliest to occur of: the last day of the fiscal year in which we have more than $1.0 billion in annual revenue; the date we qualify as a "large accelerated filer," with at least $700 million of equity securities held by non-affiliates; the issuance, in any three-year period, by us of more than $1.0 billion in non-convertible debt securities; and the last day of the fiscal year ending after the fifth anniversary of this offering.
The JOBS Act also permits us, as an emerging growth company, to take advantage of an extended transition period to comply with new or revised accounting standards applicable to public companies and thereby allows us to delay the adoption of those standards until those standards would apply to private companies. We have irrevocably elected not to avail ourselves of this exemption from new or revised accounting standards, and, therefore, will be subject to the same new or revised accounting standards as other public companies that are not emerging growth companies.
15
Class A common stock offered by us |
22,222,222 shares (25,555,555 if the underwriters exercise their option to purchase additional shares in full) | |
Class A common stock to be outstanding after this offering |
22,222,222 shares (25,555,555 if the underwriters exercise their option to purchase additional shares in full)(1) |
|
Class B common stock to be outstanding after this offering |
122,257,145 shares(1) |
|
Total Class A and Class B common stock to be outstanding after this offering |
144,479,367 shares (147,812,700 if the underwriters exercise their option to purchase additional shares in full)(1) |
|
Use of Proceeds |
We estimate the net proceeds to us from this offering, after deducting the underwriting discounts and estimated offering expenses payable by us, will be approximately $517.2 million (or $595.6 million if the underwriters' option to purchase additional shares in this offering is exercised in full), assuming the shares are offered at $25.00 per share, which is the midpoint of the estimated price range set forth on the front cover page of this prospectus. |
|
|
We plan to use the net proceeds from this offering for working capital and other general corporate purposes. See "Use of Proceeds." |
|
Voting Rights |
The rights of the holders of our Class A common stock and Class B common stock are identical, except with respect to voting and conversion rights. Holders of our Class A common stock are entitled to one vote per share and holders of our Class B common stock are entitled to 10 votes per share. Holders of shares of Class A common stock and Class B common stock will vote together as a single class on all matters submitted to a vote of stockholders (including the election of directors), with certain exceptions described in our restated certificate of incorporation. See "Description of Capital Stock — Class A and B Common Stock — Voting Rights." Immediately following the completion of this offering, outstanding shares of our Class B common stock will represent approximately 98% of the voting power of our outstanding common stock. As a result, holders of our Class B common stock, comprised of our common stockholders prior to the Corporate Reorganization, will be able to control the outcome of all matters submitted to a vote of our stockholders, including, for example, the election of directors, amendments to our certificate of incorporation and mergers or other business combinations. |
16
Class B Common Stock Conversion Rights |
Each outstanding share of Class B common stock is convertible at any time at the option of the holder into one share of Class A common stock. Each share of Class B common stock will also convert automatically into one share of Class A common stock upon any transfer, whether or not for value, except for certain transfers described in our restated certificate of incorporation, including, without limitation, transfers for tax and estate planning purposes, so long as the transferring holder of Class B common stock continues to hold exclusive voting and dispositive power with respect to the shares transferred, and transfers to persons or entitities who are Class B stockholders at the time of the transfer. Also, each share of Class B common stock held of record by a natural person, other than a natural person who held the shares as of our initial public offering, will convert automatically into one share of Class A common stock upon the death of the holder. In addition, each share of Class B common stock will convert automatically into one share of Class A common stock upon the earlier to occur of (i) the date upon which the number of shares of Class A common stock and Class B common stock beneficially owned by our Class B common stockholders, in the aggregate, represents less than 10% of the total number of shares of Class A and Class B common stock then outstanding and (ii) the date specified by affirmative vote of the holders of at least 662/3% of the outstanding shares of Class B common stock, voting as a single class. Once converted into Class A common stock, a share of Class B common stock may not be reissued. See "Description of Capital Stock — Class A and B Common Stock." |
|
Risk Factors |
You should read the "Risk Factors" section of this prospectus for a discussion of factors to consider carefully before deciding to invest in shares of our Class A common stock. |
|
NASDAQ Global Select Market symbol |
"INOV" |
- (1)
- The
number of shares of our Class A and Class B common stock that will be outstanding after this offering is based on 22,222,222 shares of
Class A common stock offered in this offering and excludes:
- •
- 122,257,145 shares of Class A common stock issuable upon the conversion of shares of Class B common stock
that will be outstanding after this offering;
- •
- 6,451,275 shares of our Class B common stock issuable upon the exercise of options to purchase shares of our
Class B common stock outstanding as of September 30, 2014, with a weighted-average exercise price of $5.97 per share;
- •
- 488,780 shares of Class B common stock issuable upon vesting of restricted stock units;
17
- •
- 7,335,430 shares of Class A common stock available for future grant under our 2015 Omnibus Incentive Plan; and
- •
- 1,833,857 shares of Class A common stock available for future issuance under our 2015 Employee Stock Purchase Plan.
18
SUMMARY CONSOLIDATED FINANCIAL AND OTHER DATA
The following table sets forth summary consolidated financial data for the years presented and at the dates indicated below. We have derived the summary consolidated statements of operations data for the years ended December 31, 2011, 2012, and 2013 from our audited consolidated financial statements included elsewhere in this prospectus. We have derived the summary consolidated balance sheet data as of December 31, 2012 and 2013 from our audited consolidated financial statements included elsewhere in this prospectus. We have derived the summary consolidated balance sheet data as of December 31, 2011 from our audited consolidated financial statements not included in this prospectus. The summary consolidated statement of operations data for the nine months ended September 30, 2013 and 2014 and the consolidated balance sheet data as of September 30, 2014 have been derived from our unaudited interim consolidated financial statements included elsewhere in this prospectus. We have derived the summary consolidated balance sheet data as of September 30, 2013 from our unaudited interim consolidated financial statements not included in this prospectus. In our opinion, such financial statements include all adjustments, consisting only of normal recurring adjustments, that we consider necessary for a fair presentation of the financial data set forth in those statements.
Our historical results are not necessarily indicative of our results in any future periods, including the full year ending December 31, 2014. The summary of our consolidated financial data set forth below should be read together with our consolidated financial statements and related notes, as well as the sections entitled "Management's Discussion and Analysis of Financial Condition and Results of Operations," included elsewhere in this prospectus.
| |
Year Ended December 31, | Nine Months Ended September 30, |
||||||||||||||
|---|---|---|---|---|---|---|---|---|---|---|---|---|---|---|---|---|
| |
2011
|
2012
|
2013
|
2013
|
2014
|
|||||||||||
| |
(in thousands, except per share data) |
|||||||||||||||
Consolidated Statement of Operations Data: |
||||||||||||||||
Revenue |
$ | 239,685 | $ | 300,275 | $ | 295,798 | $ | 231,264 | $ | 271,622 | ||||||
Expenses: |
||||||||||||||||
Cost of revenue |
102,695 | 101,188 | 120,054 | 94,869 | 85,065 | |||||||||||
Sales and marketing |
6,752 | 6,793 | 5,952 | 4,597 | 5,355 | |||||||||||
Research and development |
14,855 | 15,499 | 21,192 | 16,171 | 17,376 | |||||||||||
General and administrative |
63,184 | 72,661 | 80,638 | 60,266 | 62,920 | |||||||||||
Depreciation and amortization |
11,229 | 12,899 | 15,517 | 11,105 | 15,012 | |||||||||||
| | | | | | | | | | | | | | | | | |
Total operating expenses |
198,715 | 209,040 | 243,353 | 187,008 | 185,728 | |||||||||||
| | | | | | | | | | | | | | | | | |
Income from operations |
40,970 | 91,235 | 52,445 | 44,256 | 85,894 | |||||||||||
| | | | | | | | | | | | | | | | | |
Other income and (expenses): |
||||||||||||||||
Interest income |
10 | 11 | 9 | 6 | 4 | |||||||||||
Interest expense |
(62 | ) | (129 | ) | (79 | ) | (61 | ) | (209 | ) | ||||||
| | | | | | | | | | | | | | | | | |
Income before taxes |
40,918 | 91,117 | 52,375 | 44,201 | 85,689 | |||||||||||
Provision for income taxes |
15,991 | 35,962 | 19,657 | 17,218 | 33,836 | |||||||||||
| | | | | | | | | | | | | | | | | |
Net income |
$ | 24,927 | $ | 55,155 | $ | 32,718 | $ | 26,983 | $ | 51,853 | ||||||
| | | | | | | | | | | | | | | | | |
| | | | | | | | | | | | | | | | | |
Basic net income per share |
$ | 0.18 | $ | 0.40 | $ | 0.24 | $ | 0.20 | $ | 0.39 | ||||||
| | | | | | | | | | | | | | | | | |
| | | | | | | | | | | | | | | | | |
Diluted net income per share |
$ | 0.18 | $ | 0.40 | $ | 0.24 | $ | 0.20 | $ | 0.38 | ||||||
| | | | | | | | | | | | | | | | | |
| | | | | | | | | | | | | | | | | |
Weighted average shares of common stock outstanding: |
||||||||||||||||
Basic |
137,865 | 137,865 | 135,305 | 135,555 | 133,640 | |||||||||||
| | | | | | | | | | | | | | | | | |
| | | | | | | | | | | | | | | | | |
Diluted |
138,855 | 139,040 | 136,375 | 136,730 | 135,835 | |||||||||||
| | | | | | | | | | | | | | | | | |
| | | | | | | | | | | | | | | | | |
19
| |
Year Ended December 31, | Nine Months Ended September 30, |
||||||||||||||
|---|---|---|---|---|---|---|---|---|---|---|---|---|---|---|---|---|
| |
2011
|
2012
|
2013
|
2013
|
2014
|
|||||||||||
| |
(in thousands, except percentages and statements of work) |
|||||||||||||||
Other Financial Data and Key Metrics(1): |
||||||||||||||||
Adjusted EBITDA(2) |
$ |
57,526 |
$ |
108,105 |
$ |
71,847 |
$ |
58,333 |
$ |
103,059 |
||||||
Adjusted EBITDA margin(2) |
24 | % | 36 | % | 24 | % | 25 | % | 38 | % | ||||||
MORE2 Registry dataset metrics |
||||||||||||||||
Unique patient count(3) |
69,916 | 86,002 | 109,464 | 98,607 | 118,932 | |||||||||||
Medical event count(4) |
5,479,599 | 6,379,293 | 8,321,236 | 7,560,838 | 9,112,175 | |||||||||||
Trailing 12 month Patient Analytics Months (PAM)(5) |
8,797,514 |
10,822,673 |
12,812,630 |
12,272,280 |
15,513,903 |
|||||||||||
Engaged patient population statements of work(6) |
227 |
314 |
356 |
344 |
540 |
|||||||||||
Data analytics and data-driven intervention revenue mix: |
||||||||||||||||
Revenue from data analytics subscriptions(7) |
42.3 | % | 45.3 | % | 48.6 | % | 47.0 | % | 56.3 | % | ||||||
Revenue from data-driven intervention platform services(8): |
||||||||||||||||
Fully automated processes |
1.5 | % | 4.2 | % | 4.3 | % | 4.8 | % | 7.1 | % | ||||||
Partially automated processes |
56.2 | % | 50.5 | % | 47.1 | % | 48.2 | % | 36.6 | % | ||||||
| | | | | | | | | | | | | | | | | |
|
57.7 | % | 54.7 | % | 51.4 | % | 53.0 | % | 43.7 | % | ||||||
| |
December 31, | September 30, | ||||||||||||||
|---|---|---|---|---|---|---|---|---|---|---|---|---|---|---|---|---|
| |
2011
|
2012
|
2013
|
2013
|
2014
|
|||||||||||
| |
(in thousands) |
|||||||||||||||
Consolidated Balance Sheet Data: |
||||||||||||||||
Cash and cash equivalents |
$ | 114,872 | $ | 106,361 | $ | 110,594 | $ | 110,891 | $ | 131,947 | ||||||
Accounts receivable, net of allowances |
36,764 | 62,899 | 33,398 | 43,233 | 52,037 | |||||||||||
Working capital |
131,676 | 136,933 | 130,562 | 145,209 | 156,446 | |||||||||||
Property, equipment and capitalized software, net |
28,089 | 34,170 | 43,050 | 40,561 | 49,126 | |||||||||||
Goodwill |
62,269 | 62,269 | 62,269 | 62,269 | 62,269 | |||||||||||
Total assets |
262,922 | 285,655 | 269,746 | 277,710 | 317,345 | |||||||||||
Long-term debt |
268 | 168 | 279 | 203 | 285,191 | |||||||||||
Total liabilities |
33,817 | 48,826 | 38,012 | 32,471 | 340,706 | |||||||||||
Total stockholders' equity (deficit) |
229,105 | 236,829 | 231,734 | 245,239 | (23,361 | ) | ||||||||||
- (1)
- MORE2 Registry dataset metrics, Trailing 12 month Patient Analytics Months (PAM), and Engaged patient population statements of work, each of which is presented in the table, are key operating metrics that management uses to assess our level of operational activity. While we believe that each of these metrics is indicative of our overall level of analytical activity and the underlying growth in our business, increases or decreases in these metrics do not necessarily correlate to proportional increases or decreases in revenue, Adjusted EBITDA or net income. For instance, although increased levels of analytical activity historically have corresponded to increases in revenue over the long term, differences in fees charged for different analytical packages exist and differences in how analytics trigger the applicability of our data-driven intervention platforms may result in increases in analytical activity that do not result in proportional increases in revenue, Adjusted EBITDA or net income (and vice versa). Accordingly, while we believe the presentation of these operating metrics is helpful to investors in understanding our business, these metrics have limitations and should not be considered as substitutes for analysis of our
20
financial results reported under GAAP. In addition, we believe that other companies, including companies in our industry, do not present similar operating metrics and that there is no commonly accepted method of calculating these metrics, which may reduce their usefulness as comparative measures.
- (2)
- Adjusted
EBITDA and Adjusted EBITDA margin are financial measures not calculated in accordance with U.S. generally accepted accounting principles, or GAAP.
For definitions of Adjusted EBITDA and Adjusted EBITDA margin, as well as the reasons why we believe that Adjusted EBITDA and Adjusted EBITDA margin provide useful information to investors and, to the
extent material, any additional purposes for which we use Adjusted EBITDA and Adjusted EBITDA margin, see "Selected Consolidated Financial Data."
- The following table presents a reconciliation of net income to Adjusted EBITDA for each of the periods indicated (dollars in thousands):
| |
Year Ended December 31, | Nine Months Ended September 30, |
||||||||||||||
|---|---|---|---|---|---|---|---|---|---|---|---|---|---|---|---|---|
| |
2011
|
2012
|
2013
|
2013
|
2014
|
|||||||||||
Reconciliation of Net Income to Adjusted EBITDA: |
||||||||||||||||
Net income |
$ | 24,927 | $ | 55,155 | $ | 32,718 | $ | 26,983 | $ | 51,853 | ||||||
Depreciation and amortization |
11,229 | 12,899 | 15,517 | 11,105 | 15,012 | |||||||||||
Interest expense |
62 | 129 | 79 | 61 | 209 | |||||||||||
Interest (income) |
(10 | ) | (11 | ) | (9 | ) | (6 | ) | (4 | ) | ||||||
Provision for income taxes |
15,991 | 35,962 | 19,657 | 17,218 | 33,836 | |||||||||||
| | | | | | | | | | | | | | | | | |
EBITDA |
$ | 52,199 | $ | 104,134 | $ | 67,962 | $ | 55,361 | $ | 100,906 | ||||||
Stock-based compensation |
3,767 | 2,560 | 1,842 | 1,408 | 1,340 | |||||||||||
Other non-comparable items(a) |
1,560 | 1,411 | 1,565 | 1,564 | — | |||||||||||
Professional service fees(b) |
— | — | 478 | — | 813 | |||||||||||
| | | | | | | | | | | | | | | | | |
Adjusted EBITDA |
$ | 57,526 | $ | 108,105 | $ | 71,847 | $ | 58,333 | $ | 103,059 | ||||||
| | | | | | | | | | | | | | | | | |
| | | | | | | | | | | | | | | | | |
- (a)
- Other
"non-comparable items" include business transaction-related professional fees, corporate name change and associated rebranding expenses, workforce
restructuring expenses, and certain legal costs. We believe these are non-comparable expenses that should be excluded from Adjusted EBITDA in order to more effectively assess our period-over-period
and on-going operating performance.
- (b)
- Represents
legal costs associated with the enforcement of a specific client contract. The legal process associated with this matter began in the first
quarter of 2013 and concluded in the second quarter of 2014.
- (3)
- Unique
patient count is defined as each unique, longitudinally matched, de-identified natural person represented in our MORE2 Registry as of
the end of the period presented.
- (4)
- Medical
event count is defined as the total number of discrete medical events as of the end of the period presented (for example, a discrete medical event
typically results from the presentation of a patient to a physician for the diagnosis of diabetes and congestive heart failure in a single visit, the presentation of a patient to an emergency
department for chest pain, etc.).
- (5)
- Patient
Analytics Months, or PAM, is defined as the sum of the analytical processes performed on each respective patient within patient populations covered
by clients under contract. As used in the metric, an "analytical process" is a distinct set of data calculations undertaken by us which is initiated and completed by our analytical platform to examine
a specific question such as whether a patient is believed to have a condition such as diabetes, or worsening of the disease, during a specific time period. For examples of analytical processes, see
"Business — Our Platforms — Advanced Analytics."
- (6)
- Engaged patient population statements of work is defined as the number of discrete identified patient populations (for example, the Medicare Advantage members enrolled in a client health plan within the
21
state of Florida) engaged under a contracted statement of work, or SOW, during the period presented. SOWs for any discontinued product offerings are not reflected within this metric.
- (7)
- Revenue
from data analytics subscriptions is defined as revenue that results from subscription agreements/contracts for the provision of data analytics
(which include such components as the company's data integration, data management, data analytics, and data reporting) services.
- (8)
- Revenue from data-driven intervention platform services is defined as revenue that results from contracts for the provision of data-driven intervention platform services. This revenue is further broken down into revenue achieved through fully automated processes (i.e., those processes that require no material variable-based labor component) and partially automated processes (i.e., those processes that require certain material variable-based labor components).
22
Investing in our Class A common stock involves a high degree of risk. You should consider carefully the risks and uncertainties described below, together with all of the other information in this prospectus, including the consolidated financial statements and the related notes included elsewhere in this prospectus, before deciding whether to invest in shares of our Class A common stock. If any of the following risks actually occur, our business, financial condition, results of operations, and future prospects could be materially and adversely affected. In that event, the market price of our stock could decline, and you could lose part or all of your investment.
Risks Related to Our Business
We may not grow at the rates we historically have achieved or at all, even if our key metrics may indicate growth, which could have a material adverse effect on the market price of our Class A common stock.
We have experienced significant growth since 2010, with total revenues growing from approximately $176.7 million for the year ended December 31, 2010 to approximately $295.8 million for the year ended December 31, 2013, and from approximately $231.3 million for the nine months ended September 30, 2013 to approximately $271.6 million for the nine months ended September 30, 2014. Future revenues may not grow at these same rates or may decline, such as the approximate 1% revenue decline from the year ended December 31, 2012 to the year ended December 31, 2013. Our future growth will depend, in part, on our ability to grow our revenue from existing clients, to complete sales to potential future clients, to expand our client base in the life sciences industry and with provider organizations and employer and private exchanges, to develop direct-to-consumer services and to expand internationally. We can provide no assurances that we will be successful in executing on these growth strategies or that, even if our key metrics, such as trailing 12 month PAM, would indicate future growth, we will continue to grow our revenue or net income. Our ability to execute on our existing sales pipeline, create additional sales pipelines, and expand our client base depends on, among other things, the attractiveness of our services relative to those offered by our competitors, our ability to demonstrate the value of our existing and future services, and our ability to attract and retain a sufficient number of qualified sales and marketing leadership and support personnel. In addition, clients in certain industries in which we have a more limited presence, such as the life sciences industry, may be slower to adopt our services than we currently anticipate, which could adversely affect our results of operations and growth prospects.
If our existing clients do not renew their agreements with us, renew at lower fee levels, decline to purchase additional services from us, choose to purchase fewer services from us, or terminate their agreement with us, and we are unable to replace any lost revenue, our business and operating results could suffer.
We historically have derived, and expect in the future to derive, a significant portion of our revenue from renewals of existing client agreements and sales of additional services to existing clients. As a result, achieving a high renewal rate of our client agreements and selling additional services to existing clients is critical to our future operating results. It is difficult to predict our client renewal rate, and we may experience significantly more difficulty than we anticipate in renewing existing client agreements. Factors that may affect the renewal rate for our services and our ability to sell additional services include:
- •
- the price, performance and functionality of our services;
- •
- the availability, price, performance and functionality of competing services;
23
- •
- our clients' perceived ability to develop and perform the services that we offer using their internal resources;
- •
- our ability to develop complementary services;
- •
- our continued ability to access the data necessary to enable us to effectively develop and deliver new services to
clients;
- •
- the stability and security of our platform;
- •
- changes in healthcare laws, regulations or trends; and
- •
- the business environment of our clients, in particular, reductions in our clients' membership populations and budgetary constraints affecting our clients.
Contracts with our clients generally have stated terms of two to four years. Our clients have no obligation to renew their contracts for our services after the term expires. In addition, our clients may negotiate terms less advantageous to us upon renewal, may renew for fewer services, may choose to discontinue one or more services under an existing contract, may exercise flexibilities within their contracts to adjust service volumes, or which could reduce our revenue from these clients, which, for example, occurred during the second quarter of 2013. Our future operating results also depend, in part, on our ability to sell new services to our existing clients. If our clients fail to renew their agreements, renew their agreements upon less favorable terms, at lower fee levels or for fewer services, fail to purchase new services from us, or terminate their agreements with us, and we are unsuccessful in generating significant revenue from new clients to replace any lost revenue, our revenues may decline and our future revenue growth may be constrained.
If a client fails to fulfill its obligations under its agreements with us, or permanently terminates certain services or its agreement in its entirety prior to its expected completion date, whether or not in our view permitted by the terms of the agreement, and revenue and cash flows expected from a client are not realized in the time period expected or at all, our business, operating results and financial condition could be adversely affected.
Our top clients account for a significant portion of our revenues and, as a result, the loss of one or more of these clients could materially and adversely affect our business and operating results.
Our top four clients individually accounted for 12%, 11%, 11%, and 10%, respectively, of our revenues for the year ended December 31, 2013. Moreover, our top ten clients accounted for approximately 70% and 75% of our revenues for the nine months ended September 30, 2014 and the year ended December 31, 2013, respectively. The engagement between these clients and us generally is covered through multiple separate statements of work ("SOWs"), each with different and/or staggered terms which are all multi-year in their duration, ranging from two to four years. We can provide no assurance that these clients will renew their existing contracts or all SOWs with us upon expiration or that any such failure to renew will not have a material adverse effect on our revenue. For example, our revenue for the year ended December 31, 2013 decreased by approximately 1% as compared to the year ended December 31, 2012, in part as a result of a client's decision to discontinue several integrated solution engagements during the second quarter of 2013. If we lose one or more of our top clients, or if one or more of these clients significantly decreases its use of our services, our business and operating results could be materially and adversely affected.
24
If we do not develop new services that are adopted by clients, or fail to provide high quality support services to our clients, our growth prospects, revenues and operating results could be materially and adversely affected.
Our longer-term operating results and revenue growth will depend in part on our ability to successfully develop and sell new services that existing and potential clients want and are willing to purchase. We must continue to invest significant resources in research and development in order to enhance our existing services and introduce new high-quality services that clients and prospective clients will want. If we are unable to predict or adapt to changes in user preferences or industry or regulatory changes, or if we are unable to modify our services on a timely basis in response to those changes, clients may not renew their agreements with us, and our services may become less attractive than services offered by our competitors. Our operating results could also suffer if our innovations are not responsive to the needs of our clients, are not appropriately timed with market opportunity, or are not effectively brought to market. Our success also depends on successfully providing high-quality support services to resolve any issues related to our services. High-quality education and client support is important for the successful marketing and sale of our services and for the renewal of existing clients. If we do not help our clients quickly resolve issues and provide effective ongoing support, our ability to sell additional services to existing clients would suffer and our reputation with existing or potential clients would be harmed.
We cannot assure you that we will be able to manage our growth effectively, which could have a material adverse effect on our business, results of operations and growth prospects.
If we are successful in expanding our client base and growing our business, our existing services may not be as scalable as we anticipate, and we may need to expend significant resources to enhance our IT infrastructure, financial and accounting systems, and controls, and also hire a significant number of qualified client support personnel, professional services personnel, software engineers, technical personnel, and management personnel in order to provide services to those new clients. As a result, our expenses may increase more than expected, which could adversely affect our results of operations. In addition, identifying and recruiting qualified personnel and training them in the use of our services requires significant time, expense, and attention, and our business may be adversely affected if our efforts to expand and train qualified personnel do not generate a corresponding increase in revenues. If our existing services are not as scalable as we anticipate or if we are unable to manage our growth effectively, the quality of our services and our reputation may suffer, which could adversely affect our business, results of operations and growth prospects.
If our security measures fail or are breached and unauthorized access to a client's data is obtained, our services may be perceived as insecure, we may incur significant liabilities, our reputation may be harmed, and we could lose sales and clients.
Our services involve the storage and transmission of clients' proprietary information, sensitive or confidential data, including valuable intellectual property and personal information of employees, clients and others, as well as protected health information, or PHI, of our clients' patients. Because of the extreme sensitivity of the information we store and transmit, the security features of our computer, network, and communications systems infrastructure are critical to the success of our business. A breach or failure of our security measures could result from a variety of circumstances and events, including third-party action, employee negligence or error, malfeasance, computer viruses, cyber-attacks by computer hackers, failures during the process of upgrading or replacing software and databases, power outages, hardware failures, telecommunication failures, user errors, or catastrophic events. Information security risks have generally increased in recent years because of the proliferation of new technologies and the increased sophistication and activities of
25
perpetrators of cyber-attacks. As cyber threats continue to evolve, we may be required to expend additional resources to continue to enhance our information security measures or to investigate and remediate any information security vulnerabilities. If our security measures fail or are breached, it could result in unauthorized persons accessing sensitive client or patient data (including PHI), a loss of or damage to our data, an inability to access data sources, or process data or provide our services to our clients. Such failures or breaches of our security measures, or our inability to effectively resolve such failures or breaches in a timely manner, could severely damage our reputation, adversely affect client or investor confidence in us, and reduce the demand for our services from existing and potential clients. In addition, we could face litigation, damages for contract breach, monetary penalties, or regulatory actions for violation of applicable laws or regulations, and incur significant costs for remedial measures to prevent future occurrences and mitigate past violations. Although we maintain insurance covering certain security and privacy damages and claim expenses, we may not carry insurance or maintain coverage sufficient to compensate for all liability and in any event, insurance coverage would not address the reputational damage that could result from a security incident.
We may experience cyber-security and other breach incidents that may remain undetected for an extended period. Because techniques used to obtain unauthorized access or to sabotage systems change frequently and generally are not recognized until launched, we may be unable to anticipate these techniques or to implement adequate preventive measures. In addition, in the event that our clients authorize or enable third parties to access their information and data that are stored on our systems, we cannot ensure the complete integrity or security of such data in our systems as we would not control access. If an actual or perceived breach of our security occurs, or if we are unable to effectively resolve such breaches in a timely manner, the market perception of the effectiveness of our security measures could be harmed and we could lose sales and clients, which could have a material adverse effect on our business, operations, and financial results.
Data protection, privacy and similar laws restrict access, use, and disclosure of information, and failure to comply with or adapt to changes in these laws could materially and adversely harm our business.
We are subject to data privacy and security regulation by both the federal government and the states in which we conduct our business. The Health Insurance Portability and Accountability Act of 1996, and its implementing regulations, which we refer to collectively as HIPAA, established uniform federal standards for certain "covered entities," which include healthcare providers and health plans, governing the conduct of specified electronic healthcare transactions and protecting the security and privacy of PHI. The Health Information Technology for Economic and Clinical Health Act, or HITECH, which became effective on February 17, 2010, and an implementing regulation known as the Omnibus Final Rule, which became effective on September 23, 2013, make HIPAA's privacy and security standards directly applicable to "business associates," which are independent contractors or agents of covered entities that create, receive, maintain, or transmit PHI in connection with providing a service for or on behalf of a covered entity. HITECH also increased the civil and criminal penalties that may be imposed against covered entities, business associates, and other persons, and gave state attorneys general new authority to file civil actions for damages or injunctions in federal courts to enforce HIPAA's requirements and seek attorney's fees and costs associated with pursuing federal civil actions.
A portion of the data that we obtain and handle for or on behalf of our clients is considered PHI and subject to HIPAA because our clients are covered entities under HIPAA and we act as their business associate. Under HIPAA and our contractual agreements with our HIPAA-covered entity health plan clients, we are considered a "business associate" to those clients, and are required to maintain the privacy and security of PHI in accordance with HIPAA and the terms of our agreements
26
with clients, including by implementing HIPAA-required administrative, technical, and physical safeguards. We have incurred, and will continue to incur, significant costs to establish and maintain these safeguards and, if additional safeguards are required to comply with HIPAA or our clients' requirements, our costs could increase further, which would negatively affect our operating results. Furthermore, if we fail to maintain adequate safeguards, or we use or disclose PHI in a manner not permitted by HIPAA or our agreements with our clients, or if the privacy or security of PHI that we obtain and handle is otherwise compromised, we could be subject to significant liabilities and consequences, including, without limitation:
- •
- breach of our contractual obligations to clients, which may cause our clients to terminate their relationship with us and
may result in potentially significant financial obligations to our clients;
- •
- investigation by the federal regulatory authorities empowered to enforce HIPAA, which include the U.S. Department of
Health and Human Services, or HHS, and the Federal Trade Commission, and investigation by the state attorneys general empowered to enforce comparable state laws, and the possible imposition of civil
and criminal penalties;
- •
- private litigation by individuals adversely affected by any violation of HIPAA, HITECH, or comparable state laws to which
we are subject; and
- •
- negative publicity, which may decrease the willingness of current and potential future clients to work with us and negatively affect our sales and operating results.
Laws and expectations relating to privacy continue to evolve, and we continue to adapt to changing needs. Nevertheless, changes in these laws may limit our data access, use, and disclosure, and may require increased expenditures by us or may dictate that we not offer certain types of services. Any of the foregoing may have a material adverse effect on our ability to provide services to our clients and, in turn, our results of operations.
Data protection, privacy and similar laws protect more than patient information and, although they vary by jurisdiction, these laws can extend to employee information, business contact information, provider information, and other information relating to identifiable individuals. Failure to comply with these laws may result in, among other things, civil and criminal liability, negative publicity, damage to our reputation, and liability under contractual provisions. In addition, compliance with such laws may require increased costs to us or may dictate that we not offer certain types of services in the future.
The information that we provide to our clients could be inaccurate or incomplete, which could harm our business reputation, financial condition, and results of operations.
We aggregate, process, and analyze healthcare-related data and information for use by our clients. Because data in the healthcare industry is fragmented in origin, inconsistent in format, and often incomplete, the overall quality of data received or accessed in the healthcare industry is often poor, the degree or amount of data which is knowingly or unknowingly absent or omitted can be material, and we frequently discover data issues and errors during our data integrity checks. If the analytical data that we provide to our clients are based on incorrect or incomplete data or if we make mistakes in the capture, input, or analysis of these data, our reputation may suffer and our ability to attract and retain clients may be materially harmed.
In addition, we assist our clients with the management and submission of data to governmental entities, including CMS. These processes and submissions are governed by complex data processing and validation policies and regulations. If we fail to abide by such policies or submit incorrect or incomplete data, we may be exposed to liability to a client, court, or government agency that concludes that our storage, handling, submission, delivery, or display of health
27
information or other data was wrongful or erroneous. Although we maintain insurance coverage, this coverage may prove to be inadequate or could cease to be available to us on acceptable terms, if at all. Even unsuccessful claims could result in substantial costs and diversion of management time, attention, and resources. A claim brought against us that is uninsured or under-insured could harm our business, financial condition, and results of operations.
Our business is principally focused on the healthcare industry, and factors that adversely affect the financial condition of the healthcare industry could consequently affect our business.
We derive substantially all of our revenue from clients within the healthcare industry. As a result, our financial condition and results of operations could be adversely affected by conditions affecting the healthcare industry generally and health systems and payors in particular. Our ability to grow will depend upon the economic environment of the healthcare industry, as well as our ability to increase the number of services that we sell to our clients. Furthermore, we may not become aware in a timely manner of changes in regulatory requirements affecting our business, which could result in us taking, or failing to take, actions, resulting in noncompliance with state or federal regulations.
There are many factors that could affect the purchasing practices, operations and, ultimately, the operating funds of healthcare organizations, such as reimbursement policies for healthcare expenses, consolidation in the healthcare industry, and regulation, litigation, and general economic conditions. In particular, we could be required to make unplanned modifications to our services or could suffer delays or cancellations of orders or reductions in demand for our services as a result of changes in regulations affecting the healthcare industry, such as any increased regulation by governmental agencies, changes to HIPAA and other federal or state privacy laws, laws relating to the tax-exempt status of many of our clients or restrictions on permissible discounts, and other financial arrangements. It is unclear what long-term effects the general economic conditions will have on the healthcare industry, and in turn, on our business, financial condition, and results of operations.
Consolidation in the industries in which our clients operate may result in certain clients discontinuing their use of our services following an acquisition or merger, which could materially and adversely affect our business and financial results.
Mergers or consolidations among our clients have in the past and could in the future reduce the number of our existing and potential clients. When companies consolidate, overlapping services previously purchased separately are typically purchased only once by the combined entity, leading to loss of revenue for the service provider. If our clients merge with or are acquired by other entities that are not our clients, they may discontinue their use of our services. There can be no assurance as to the degree to which we may be able to address the revenue impact of such consolidation. Any of these developments could materially and adversely affect our business and financial results.
Our proprietary applications may not operate properly, which could damage our reputation, give rise to a variety of claims against us, or divert our resources from other purposes, any of which could harm our business and operating results.
Proprietary software and application development is time-consuming, expensive, and complex, and may involve unforeseen difficulties. We may encounter technical obstacles, and it is possible that we discover additional problems that prevent our proprietary applications from operating properly. If our applications and services do not function reliably or fail to achieve client expectations in terms of performance, clients could assert liability claims against us and attempt to cancel their contracts with us. Moreover, material performance problems, defects, or errors in our
28
existing or new applications and services may arise in the future and may result from, among other things, the lack of interoperability of our applications with systems and data that we did not develop and the function of which is outside of our control or undetected in our testing. Defects or errors in our applications might discourage existing or potential clients from purchasing services from us. Correction of defects or errors could prove to be time consuming, costly, impossible, or impracticable. The existence of errors or defects in our applications and the correction of such errors could divert our resources from other matters relating to our business, damage our reputation, increase our costs, and have a material adverse effect on our business, financial condition, and results of operations.
As a result of our variable sales and implementation cycles, we might not be able to recognize revenue to offset expenditures, which could result in fluctuations in our quarterly results of operations or otherwise adversely affect our future operating results.
The sales cycle for our services is typically four to six months from initial contact to contract execution, but can vary depending on the particular client, product under consideration, and time of year, among other factors. Some clients, for instance, undertake a more prolonged evaluation process, which has in the past resulted in extended sales cycles. Our sales efforts involve educating potential clients about the use, technical capabilities, and benefits of our services, and gaining an understanding of their needs and budgets. During the sales cycle, we expend significant time and resources, and we do not recognize any revenue to offset such expenditures, which could result in fluctuations in our quarterly results of operations and adversely affect our future operating results.
After a client contract is signed, we provide an implementation process for the client during which we load, test, and integrate data into our system and train client personnel. Our implementation cycle generally ranges from 20 to 90 days from contract execution to completion of implementation, but can vary depending on the amount and quality of the client's data and how quickly the client facilitates access to data. In addition, for certain clients, our third-party vendors must go through delegation processes in order to become authorized to provide certain services to those clients, which could delay our ability to provide such services to those clients. During the implementation cycle, we expend time, effort, and financial resources implementing our services, but accounting principles do not allow us to recognize the resulting revenue until implementation is complete and the services are available for use by our clients. If implementation periods are extended, revenue recognition will be delayed, which could adversely affect our results of operations in certain periods.
In addition, because most of our revenue in each quarter is derived from agreements entered into with our clients during previous quarters, the negative impacts resulting from a decline in new or renewed agreements in any one quarter may not be fully reflected in our revenue for that quarter. Such declines, however, would negatively affect our revenue in future periods and the effect of significant downturns in sales of and market demand for our services, and potential changes in our renewal rates or renewal terms may not be fully reflected in our results of operations until future periods. Our sales and implementation cycles also make it difficult for us to rapidly increase our total revenue through additional sales in any period. As a result, the effect of changes in the industry impacting our business, or changes we experience in our new sales, may not be reflected in our short-term results of operations.
29
We operate in a competitive industry, and if we are not able to compete effectively, our business and financial results could be materially and adversely impacted.
We operate in a competitive industry, and we expect that competition will increase as a result of consolidation in both the information technology and healthcare industries. Our future growth and success will depend on our ability to successfully compete with other companies that provide similar services, including existing clients and other healthcare organizations that seek to build and operate competing services themselves and newer companies that provide similar services, often at substantially lower prices. We compete on the basis of various factors, including breadth and depth of services, reputation, reliability, quality, innovation, security, price, and industry expertise, and experience. If we are unable to maintain our technology, management, healthcare, or regulatory expertise or attract and retain a sufficient number of qualified sales and marketing leadership and support personnel, we will be at a competitive disadvantage. Some of our competitors, in particular health plans and larger technology or technology-enabled consultative service providers, have greater name recognition, longer operating histories, and significantly greater resources than we do. Furthermore, our current or potential competitors may have greater financial resources and larger sales and marketing capabilities than we have, and may have a more diversified set of revenue sources, which may allow them to be less sensitive to changes in client preferences and more aggressive in pricing their services, any of which could put us at a competitive disadvantage. As a result, our competitors may be able to respond more quickly and effectively than we can to new or changing opportunities, technologies, standards, or client requirements and may have the ability to initiate or withstand substantial price competition. In addition, potential clients frequently have requested competitive bids from us and our competitors in terms of price and services offered and, if we do not accurately assess potential clients' needs and budgets when submitting our proposals, they may appear less attractive than those of our competitors, and we may not be successful in attracting new business. In addition, our clients may perceive our toolsets to be at a higher price point than our competitors, which could result in reduced revenue if we are not able to adequately demonstrate the value of our toolsets to our clients and prospective clients. Increases in competition in our industry could reduce our market share and result in price declines for certain services, which could negatively impact our business, profitability, and growth prospects.
If we fail to maintain awareness of our brand cost-effectively, our business might suffer.
Maintaining awareness of our brand in a cost-effective manner is critical to continuing the widespread acceptance of our existing services and is an important element in attracting new clients and in attracting and retaining qualified employees. The importance of brand recognition may increase as competition in our market increases. Successful promotion of our brand will depend largely on the effectiveness of our marketing efforts and on our ability to provide reliable and useful services at competitive prices. Our efforts to build and maintain our brand nationally have involved and will continue to involve significant expense. Brand promotion activities may not yield increased revenue, and even if they do, any increased revenue may not offset the expenses we incur in maintaining our brand. In addition, third parties' use of trademarks or branding similar to ours could materially harm our business or result in litigation and other costs. If we fail to successfully maintain our brand, or incur substantial expenses in an unsuccessful attempt to maintain our brand, we may fail to attract enough new clients or retain our existing clients to the extent necessary to realize a sufficient return on our brand-building efforts, and our business and our ability to attract and retain qualified employees could suffer.
Our success depends on our ability to protect our intellectual property rights.
Our success depends in part on our ability to protect our proprietary software, confidential information and know-how, technology, and other intellectual property and intellectual property
30
rights. To do so, we rely generally on copyright, trademark and trade secret laws, confidentiality and invention assignment agreements with employees and third parties, and license and other agreements with consultants, vendors, and clients. There can be no assurance that employees, consultants, vendors, and clients have executed such agreements or have not breached or will not breach their agreements with us, that we will have adequate remedies for any breach, or that our trade secrets will not otherwise become known or independently developed by competitors. Additionally, we monitor our use of open source software to avoid uses that would require us to disclose our proprietary source code or violate applicable open source licenses, but if we engaged in such uses inadvertently, we could be required to take remedial action or release certain of our proprietary source code. These scenarios could materially and adversely affect our business, financial condition, and results of operations. In addition, despite the protections we do place on our intellectual property, a third party could, without authorization, copy or otherwise obtain and use our products or technology, or develop similar technology. In addition, agreement terms that address non-competition are difficult to enforce in many jurisdictions and might not be enforceable in certain cases.
Pursuant to our initial strategy regarding intellectual property protection, we currently hold no issued patents. As we begin to pursue patents, we might not be able to obtain meaningful patent protection for our technology. In addition, if any patents are issued in the future, they might not provide us with any competitive advantages or might be successfully challenged by third parties.
We rely on unpatented proprietary technology. It is possible that others will independently develop the same or similar technology or otherwise obtain access to our unpatented technology. To protect our trade secrets and other proprietary information, we require employees, consultants, advisors, and collaborators to enter into confidentiality agreements. We cannot assure you that these agreements will provide meaningful protection for our trade secrets, know-how, or other proprietary information in the event of any unauthorized use, misappropriation, or disclosure of such trade secrets, know-how, or other proprietary information. Further, the theft or unauthorized use or publication of our trade secrets and other confidential business information could reduce the differentiation of our services and harm our business, the value of our investment in development or business acquisitions could be reduced, and third parties might make claims against us related to losses of their confidential or proprietary information.
We rely on our trademarks, service marks, trade names, and brand names to distinguish our services from the services of our competitors, and have registered or applied to register many of these trademarks. We cannot assure you that our trademark applications will be approved. Third parties may also oppose our trademark applications, or otherwise challenge our use of the trademarks. In the event that our trademarks are successfully challenged, we could be forced to rebrand our services, which could result in loss of brand recognition and could require us to devote resources advertising and marketing new brands. Further, we cannot assure you that competitors will not infringe our trademarks or that we will have adequate resources to enforce our trademarks.
Our ability to obtain, protect, and enforce our intellectual property rights is subject to uncertainty as to the scope of protection, registerability, patentability, validity, and enforceability of our intellectual property rights in each applicable jurisdiction, as well as the risk of general litigation or third-party oppositions.
Existing U.S. federal and state intellectual property laws offer only limited protection. Moreover, if we expand our business into markets outside of the United States, our intellectual property rights may not receive the same degree of protection as they would in the United States because of the differences in foreign trademark and other laws concerning proprietary rights. Governments may adopt regulations, and government agencies or courts may render decisions, requiring compulsory licensing of intellectual property rights. When we seek to enforce our intellectual property rights we
31
may be subject to claims that the intellectual property rights are invalid or unenforceable. Litigation may be necessary in the future to enforce our intellectual property rights and to protect our trade secrets. Litigation brought to protect and enforce our intellectual property rights could be costly, time consuming, and distracting to management and could result in the impairment or loss of portions of our intellectual property rights. Furthermore, our efforts to enforce our intellectual property rights may be met with defenses, counterclaims, and countersuits attacking the validity and enforceability of our intellectual property rights. Our inability to protect our proprietary technology against unauthorized copying or use, as well as any costly litigation or diversion of our management's attention and resources, could delay further sales or the implementation of our solutions, impair the functionality of our solutions, delay introductions of new solutions, result in our substituting inferior or more costly technologies into our solutions, or have a material adverse effect on our business, financial condition, and results of operations.
Our services could become subject to new, revised, or enhanced regulatory requirements in the future, which could result in increased costs, could delay or prevent our introduction of new services, or could impair the function or value of our existing services, which could materially and adversely affect our results of operations and growth prospects.
The healthcare industry is highly regulated on the federal, state, and local levels, and is subject to changing legislative, regulatory, political, and other influences. Changes to existing laws and regulations, or the enactment of new federal and state laws and regulations affecting the healthcare industry, could create unexpected liabilities for us, could cause us or our clients to incur additional costs, and could restrict our or our clients' operations.
Many healthcare laws are complex, subject to frequent change, and dependent on interpretation and enforcement decisions from government agencies with broad discretion. The application of these laws to us, our clients, or the specific services and relationships we have with our clients is not always clear. In addition, federal and state legislatures have periodically considered programs to reform or amend the U.S. healthcare system at both the federal and state level, such as the enactment of the Patient Protection and Affordable Care Act and the Health Care and Education Reconciliation Act of 2010, or the Affordable Care Act or ACA. Our failure to anticipate accurately the application of these laws and similar or future laws and regulations, or our failure to comply with them, could create liability for us, result in adverse publicity, and negatively affect our business.
Our services may become subject to new or enhanced regulatory requirements, and we may be required to change or adapt our services in order to comply with these regulations. For example, the introduction of the new ICD-10 coding framework in 2015, pursuant to which physicians are expected to characterize the specific conditions of patients among more than 90,000 discrete descriptions (up from nearly 15,000 discrete descriptions under the existing ICD-9 framework), could present additional challenges for our business, including requiring us to allocate resources to training and upgrading our systems. If we fail to successfully implement the new ICD-10 coding framework, it could adversely affect our ability to offer services deemed critical by our clients, which could materially and adversely affect our results of operations. New or enhanced regulatory requirements may render our services obsolete or prevent us from performing certain services. New or enhanced regulatory requirements could impose additional costs on us, and thereby make existing services unprofitable, and could make the introduction of new services more costly or time-consuming than we anticipate, which could materially and adversely affect our results of operations and growth prospects.
Because personal, public, and non-public information is stored in some of our databases, we are vulnerable to government regulation and adverse publicity concerning the use of our data. We provide many types of data and services that already are subject to regulation under HIPAA and, to
32
a lesser extent, various other federal, state, and local laws and regulations. These laws and regulations are designed to protect the privacy of the public and to prevent the misuse of personal information in the marketplace. However, many consumer advocates, privacy advocates, and government regulators believe that the existing laws and regulations do not adequately protect privacy. They have become increasingly concerned with the use of personal information, including health information. As a result, they are lobbying for further restrictions on the dissemination or commercial use of personal information to the public and private sectors. Similar initiatives are under way in other countries in which we may do business in the future. The following legal and regulatory developments also could have a material adverse effect on our business, financial position, results of operations, or cash flows:
- •
- amendment, enactment, or interpretation of laws and regulations that restrict the access and use of personal information
and reduce the supply of data available to clients;
- •
- changes in cultural and consumer attitudes to favor further restrictions on information collection and sharing, which may
lead to regulations that prevent full utilization of our solutions;
- •
- failure of our solutions to comply with current laws and regulations;
and
- •
- failure of our solutions to adapt to changes in the regulatory environment in an efficient, cost-effective manner.
Laws regulating the corporate practice of medicine could restrict the manner in which we provide our clients certain of our intervention toolsets, and the failure to comply with such laws could subject us to penalties or require that we change the manner in which we provide such toolsets.
Among our intervention toolsets are supplemental patient encounters, or SPEs. While some clients utilize our platform toolsets to conduct their own SPEs directly or through third-parties, some of our clients engage us to utilize our intervention platform toolsets to facilitate SPEs. In such cases, we use third-parties to undertake such SPEs utilizing our intervention platform toolsets or may utilize our own associate to undertake such SPEs. Certain of our SPEs may be considered patient care. Some states have laws that prohibit business entities from practicing medicine, employing providers to practice medicine, exercising control over medical decisions by providers (also known collectively as the corporate practice of medicine). These laws, regulations, and interpretations have, in certain states, been subject to enforcement, as well as judicial and regulatory interpretation, and are subject to change.
In these states, we operate by maintaining long term contracts with affiliated physician groups, which are each owned and operated by physicians and which employ or contract with additional providers to perform the SPEs, If there were a determination that a corporate practice of medicine violation existed or exists, we could be subject to criminal or civil penalties or an injunction for practicing medicine without a license or aiding and abetting the unlicensed practice of medicine. The occurrence of any of such events could have a material adverse effect on our ability to continue to provide our clients with the full array of our intervention toolsets.
We could experience losses or liability not covered by insurance.
Our business exposes us to risks that are inherent in the provision of analytics and toolsets that assist clinical decision-making and relate to patient medical histories and treatment plans. If clients or individuals assert liability claims against us, any ensuing litigation, regardless of outcome, could result in a substantial cost to us, divert management's attention from operations, and decrease market acceptance of our toolsets. We attempt to limit our liability to clients by contract;
33
however, the limitations of liability set forth in the contracts may not be enforceable or may not otherwise protect us from liability for damages. Additionally, we may be subject to claims that are not explicitly covered by contract. We also maintain general liability coverage; however, this coverage may not continue to be available on acceptable terms, may not be available in sufficient amounts to cover one or more large claims against us, and may include larger self-insured retentions or exclusions for certain products. In addition, the insurer might disclaim coverage as to any future claim. A successful claim not fully covered by our insurance could have a material adverse impact on our liquidity, financial condition, and results of operations.
We could incur substantial costs as a result of any claim of infringement of another party's intellectual property rights.
In recent years, there has been significant litigation in the United States involving patents and other intellectual property rights. Companies in the software and healthcare technology and services industries are increasingly bringing and becoming subject to suits alleging infringement of proprietary rights, particularly patent rights, and our competitors and other third parties may hold patents or have pending patent applications which could be related to our business. These risks have been amplified by the increase in third parties, which we refer to as non-practicing entities, whose primary business is to assert infringement claims or make royalty demands. Moreover, many of our current and potential competitors may dedicate substantially greater resources to protection and enforcement of intellectual property rights, especially patents. It is difficult to proceed with certainty in a rapidly evolving technological environment in which there may be patent applications pending related to our technologies, many of which are confidential when filed.
We may receive in the future notices that claim we or our clients using our services have misappropriated or misused other parties' intellectual property rights, particularly as the number of competitors in our market grows and the functionality of services among competitors overlaps. If we are sued by a third party that claims that our technology infringes its rights, the litigation, whether or not successful, could be extremely costly to defend, divert our management's time, attention, and resources, damage our reputation and brand, and substantially harm our business. We do not currently have a patent portfolio of our own, which may limit the defenses available to us in any such litigation.
In addition, in most instances, we have agreed to indemnify our clients against certain third-party claims, which may include claims that one of our services infringes the intellectual property rights of such third parties. These claims may require us to initiate or defend protracted and costly litigation on behalf of our clients, regardless of the merits of these claims. If any of these claims succeed, we may be forced to pay damages on behalf of our clients or may be required to obtain licenses for the products they use. If we cannot obtain all necessary licenses on commercially reasonable terms, our customers may be forced to stop using our services. In addition, our business could be adversely affected by any significant disputes between us and our clients as to the applicability or scope of our indemnification obligations to them. The results of any intellectual property litigation to which we might become a party, or for which we are required to provide indemnification, may also require us to do one or more of the following:
- •
- cease offering or using technologies that incorporate the challenged intellectual property;
- •
- make substantial payments for legal fees, settlement payments, or other costs or damages;
- •
- obtain a license, which may not be available on reasonable terms, to sell or use the relevant technology;
or
- •
- redesign technology to avoid infringement, if feasible.
34
If we were to discover that our applications and services violate third-party proprietary rights, there can be no assurance that we would be able to obtain licenses to continue offering those applications and services on commercially reasonable terms, or at all, to redesign our technology to avoid infringement, or to avoid or settle litigation regarding alleged infringement without substantial expense and damage awards. Any claims against us relating to the infringement of third-party proprietary rights, even if not meritorious, could result in the expenditure of significant financial and managerial resources and in injunctions preventing us from distributing certain products. If we are required to make substantial payments or undertake any of the other actions noted above as a result of any intellectual property infringement claims against us or any obligation to indemnify our clients for such claims, such payments or costs could have a material adverse effect on our business, financial condition, and results of operations.
We depend on our senior management team and other key employees, and the loss of one or more of our executive officers or key employees could materially and adversely affect our business.
Our success depends in large part upon the continued services of our key executive officers, including Dr. Dunleavy. We also rely on our leadership team in the areas of research and development, marketing, services, and general and administrative functions. We can provide no assurances that any of our executive officers or key employees will continue their employment with us. The replacement of one or more of our executive officers or other key employees would likely involve significant time and costs and may significantly delay or prevent the achievement of our business objectives.
We may fail to attract, train, and retain enough qualified employees to support our operations and growth strategy, which could materially and adversely affect our business and growth strategy.
The success of our business and growth strategy depends on our ability to attract, train, and retain qualified employees, particularly technology personnel, subject matter experts, sales and marketing leadership and support personnel, and personnel with healthcare regulatory, clinical, and appropriate management expertise. The market for qualified employees in our industry and in the markets in which we operate is very competitive, and companies that we compete with for experienced personnel may have greater resources than we. In addition, our ability to attract and retain qualified employees depends in part on our ability to maintain awareness of our brand. If we are not successful in our recruiting efforts, or if we are unable to train and retain a sufficient number of qualified employees, our ability to develop and deliver successful technologies and services and grow our business may be materially and adversely affected.
We may acquire other companies or technologies, which could divert our management's attention, result in dilution to our stockholders and otherwise disrupt our operations and adversely affect our operating results.
We may in the future seek to acquire or invest in businesses, services, or technologies that we believe could complement or expand our services, enhance our technical capabilities, or otherwise offer growth opportunities. The pursuit of potential acquisitions may divert the attention of management and cause us to incur various expenses in identifying, investigating, and pursuing suitable acquisitions, whether or not they are consummated. Acquisitions also could result in dilutive issuances of equity securities or the incurrence of debt, which could adversely affect our operating results and financial condition. In addition, we have limited experience in acquiring other businesses. If we acquire additional businesses, we may not be able to integrate the acquired personnel, operations, and technologies successfully, or effectively manage the combined business
35
following the acquisition. We also may not achieve the anticipated benefits from the acquired business due to a number of factors, including:
- •
- inability or difficulty integrating and benefiting from acquired technologies, services, or clients in a profitable
manner;
- •
- unanticipated costs or liabilities associated with the acquisition;
- •
- difficulty integrating the accounting systems, operations, and personnel of the acquired business;
- •
- adverse effects to our existing business relationships with business partners and clients as a result of the acquisition;
- •
- assuming potential liabilities of an acquired company;
- •
- possibility of overpaying for acquisitions, particularly those with significant intangibles and those assets that derive
value using novel tools or are involved in niche markets;
- •
- difficulty in acquiring suitable businesses, including challenges in predicting the value an acquisition will ultimately
contribute to our business;
- •
- the potential loss of key employees;
- •
- use of substantial portions of our available cash to consummate the acquisition;
and
- •
- the need to understand local healthcare regulatory regimes.
If an acquired business fails to meet our expectations, our operating results, business, and financial condition may suffer materially.
In addition, a significant portion of the purchase price of companies we acquire may be allocated to acquired goodwill and other intangible assets, which must be assessed for impairment at least annually. In the future, if our acquisitions do not yield expected returns, we may be required to take charges to our operating results based on this impairment assessment process, which could adversely affect our results of operations.
Our use of accounting estimates involves judgment and could adversely impact our financial results, and ineffective internal controls could adversely impact our business and operating results.
The methods, estimates, and judgments that we use in applying accounting policies have a significant impact on our results of operations. For more information on our critical accounting policies and estimates, see "Management's Discussion and Analysis of Financial Condition and Results of Operations" and Note 2 to our consolidated financial statements included elsewhere in this prospectus. These methods, estimates, and judgments are subject to significant risks, uncertainties, and assumptions, and changes could affect our results of operations. In addition, our internal control over financial reporting may not prevent or detect misstatements because of the inherent limitations, including the possibility of human error, the circumvention or overriding of controls, or fraud. Even effective internal controls can provide only reasonable assurance with respect to the preparation and fair presentation of our consolidated financial statements.
36
As a result of becoming a public company, we will be obligated to report on the effectiveness of our internal control over financial reporting. These internal controls may not be determined to be effective, which may harm investor confidence in our company and, as a result, the trading price of our Class A common stock.
We will be required, pursuant to Section 404 of the Sarbanes-Oxley Act of 2002, or the Sarbanes-Oxley Act, to furnish a report by management on, among other things, the effectiveness of our internal control over financial reporting in the second annual report we file with the Securities and Exchange Commission, or the SEC. This assessment will need to include disclosure of material weaknesses, if any, identified by our management in our internal control over financial reporting. However, as an "emerging growth company," as defined in the JOBS Act, our independent registered public accounting firm will not be required to formally attest to the effectiveness of our internal control over financial reporting pursuant to Section 404 of the Sarbanes-Oxley Act until the later of the year following our first annual report required to be filed with the SEC, or the date we are no longer an emerging growth company. At such time, our independent registered public accounting firm may issue a report that is adverse in the event it is not satisfied with the level at which our controls are documented, designed or operating. Any failure of our internal control over financial reporting to be effective or our failure to implement required new or improved controls, if any, or difficulties encountered in their implementation, may harm our operating results, cause us to fail to meet our reporting obligations, and negatively impact the trading price of our Class A common stock.
We are an emerging growth company and we cannot be certain that the reduced disclosure requirements applicable to emerging growth companies will not make our Class A common stock less attractive to investors.
We are an emerging growth company, as defined under the JOBS Act. For as long as we continue to be an emerging growth company, we intend to take advantage of certain exemptions from various reporting requirements that are applicable to other public companies including, but not limited to, reduced disclosure obligations regarding executive compensation in our periodic reports and proxy statements and exemptions from the requirements of holding a nonbinding advisory vote on executive compensation and stockholder approval of any golden parachute payments not previously approved. We cannot predict if investors will find our Class A common stock less attractive because we will rely on these exemptions. If some investors find our Class A common stock less attractive as a result, there may be a less active trading market for our Class A common stock and our stock price may be more volatile.
We will remain an emerging growth company until the earliest of (i) the end of the fiscal year in which the market value of our Class A common stock that is held by non-affiliates exceeds $700 million as of June 30, (ii) the end of the fiscal year in which we have total annual gross revenue of $1 billion or more during such fiscal year, (iii) the date on which we issue more than $1 billion in non-convertible debt in a three-year period, or (iv) December 31, 2020, which is the last day of the fiscal year following five years from the date of this prospectus.
Our Board of Directors may change our strategies, policies, and procedures without stockholder approval and we may become more highly leveraged, which may increase our risk of default under our debt obligations.
Our investment, financing, leverage, and dividend policies, and our policies with respect to all other activities, including growth, capitalization, and operations, are determined exclusively by our board of directors, and may be amended or revised at any time by our board of directors without notice to or a vote of our stockholders. This could result in us conducting operational matters, making investments, or pursuing different business or growth strategies than those contemplated in this prospectus. Further, our charter and bylaws do not limit the amount or percentage of
37
indebtedness, funded or otherwise, that we may incur. Higher leverage also increases the risk of default on our obligations. In addition, a change in our investment policies, including the manner in which we allocate our resources across our portfolio or the types of assets in which we seek to invest, may increase our exposure to interest rate risk and liquidity risk. Changes to our policies with regards to the foregoing could materially adversely affect our financial condition, results of operations, and cash flow.
Future sales to clients outside the United States or with international operations might expose us to risks inherent in international sales which, if realized, could adversely affect our business.
An element of our growth strategy is to expand internationally. Operating in international markets requires significant resources and management attention and will subject us to regulatory, economic, and political risks that are different from those in the United States. Because of our limited experience with international operations, any international expansion efforts might not be successful in creating demand for our services outside of the United States or in effectively selling our services in the international markets we enter. In addition, we will face risks in doing business internationally that could adversely affect our business, including:
- •
- the need to localize and adapt our services for specific countries, including translation into foreign languages and
associated expenses;
- •
- difficulties in staffing and managing foreign operations;
- •
- different pricing environments, longer sales cycles, and longer accounts receivable payment cycles and collections
issues;
- •
- new and different sources of competition;
- •
- weaker protection for intellectual property and other legal rights than in the United States and practical difficulties
in enforcing intellectual property and other rights outside of the United States;
- •
- laws and business practices favoring local competitors;
- •
- compliance challenges related to the complexity of multiple, conflicting, and changing governmental laws and regulations,
including employment, anti-bribery, foreign investment, tax, privacy, and data protection laws and regulations;
- •
- increased financial accounting and reporting burdens and complexities;
- •
- adverse tax consequences; and
- •
- if we denominate our international contracts in local currencies, fluctuations in the value of the U.S. dollar and foreign currencies might impact our operating results when translated into U.S. dollars.
Our business could be harmed by disruptions in network service or operational failures at our data centers (including our co-location facility) related to the storage, transmission and presentation of client data.
Our success depends on the efficient and uninterrupted operation of our data centers and service provider locations. Interruptions in service or damage to locations may be caused by natural disasters, power loss, Internet or network failures, physical damage, operator error, security breaches, computer viruses, denial-of-service attacks, or similar events. The varied types and severity of the interruptions that could occur may render our safeguards inadequate. These service interruption events could result in the corruption or loss of data and impair the processing of data and our delivery of services to clients, which could have an adverse effect on our business,
38
operations, and financial results. Furthermore, if any of our data centers are unable to keep up with our growing needs for capacity, it could have an adverse effect on our business.
Problems faced by our third-party data center location, with the telecommunications network providers with whom we or it contract, or with the systems by which our telecommunications providers allocate capacity among their clients, including us, could adversely affect the experience of our clients and the security of the data.
Further, our ability to deliver our cloud-based services depends on the infrastructure of the Internet and a reliable network with the necessary speed, data capacity, bandwidth capacity, and security. Our services are designed to operate without interruption in accordance with our service level commitments. We have, however, experienced, and may experience in the future, interruptions and delays in services and availability from time to time. An extended period of network unavailability could negatively impact our ability to deliver acceptable or accurate services, and negatively impact our relationship with clients, which could have an adverse effect on our reputation, financial condition, and results of operations.
We rely on agreements with third parties to provide certain services, goods, technology, and intellectual property rights necessary to enable us to implement some of our applications.
Our ability to implement and provide our applications and services to our clients depends, in part, on services, goods, technology, and intellectual property rights owned or controlled by third parties, including one vendor from whom we purchase significant components of our storage architecture. These third parties may become unable to or refuse to continue to provide these services, goods, technology, or intellectual property rights on commercially reasonable terms consistent with our business practices, or otherwise discontinue a service important for us to continue to operate our applications. If we fail to replace these services, goods, technologies, or intellectual property rights in a timely manner or on commercially reasonable terms, our operating results and financial condition could be harmed. In addition, we exercise limited control over our third-party vendors, which increases our vulnerability to problems with technology and services those vendors provide. If the services, technology, or intellectual property of third parties were to fail to perform as expected, it could subject us to potential liability, adversely affect our renewal rates, and have a material adverse effect on our financial condition and results of operations.
Our reliance on third-party vendors to perform certain of our intervention toolsets could have an adverse effect on our business, results of operations and growth prospects.
We rely in part on third-party vendors to perform certain of our intervention toolsets, including supplemental patient encounters such as in-home encounters. These third parties may not perform their obligations to us in a timely and cost-effective manner, in compliance with applicable regulations, or in a manner that is in our and our clients' best interests, which could have an adverse effect on our reputation and our ability to retain and attract clients. In addition, our growth depends in part on the ability of our third-party vendors to leverage our intervention toolsets to a larger group of clients. If our third-party vendors do not perform their services at a level acceptable to us or our clients or if they are unable to leverage our intervention toolsets to a larger group of clients, it could have an adverse effect on our business, results of operations, and growth prospects.
Risks Related to Our Class A Common Stock and this Offering
Our quarterly operating results may fluctuate significantly, which could adversely impact the value of our Class A common stock.
Our quarterly results of operations, including our revenue, gross margin, net income, and cash flows, may vary significantly in the future, and sequential quarter-to-quarter comparisons of our
39
operating results may not be meaningful. In addition to the other risk factors included in this section, some of the important factors that may cause sequential quarter-to-quarter fluctuations in our operating results include:
- •
- seasonal variations driven primarily by regulatory timelines cause a significantly higher proportion of our services to
be performed, and therefore revenues and costs to be recognized, during the second and, to a lesser extent, the fourth quarters of the year compared to the first and, most significantly, the third
quarter;
- •
- possible delays in the expected recognition of revenue due to lengthy and sometimes unpredictable sales and
implementation timelines;
- •
- the amount and timing of operating expenses related to the maintenance and expansion of our business, operations, and
infrastructure;
- •
- the timing and success of introductions of new applications and services by us or our competitors or any other change in
the competitive dynamics of our industry, including consolidation among competitors, clients, or strategic partners;
- •
- the addition or loss of large clients, including through acquisitions or consolidations of such clients;
- •
- network outages or security breaches;
- •
- our ability to attract new clients;
- •
- general economic, industry, and market conditions;
- •
- client renewal rates and the timing and terms of client renewals;
- •
- changes in our pricing policies or those of our competitors;
- •
- the mix of applications and services sold during a period; and
- •
- the timing of expenses related to the development or acquisition of technologies or businesses.
Any fluctuations in our quarterly operating results may not accurately reflect the underlying longer-term performance of our business and could cause a decline in the trading price of our Class A common stock.
Because the dual class structure of our common stock has the effect of concentrating voting control with holders of our Class B common stock, holders of our Class B common stock, including Dr. Dunleavy and Mr. Hoffmann, will continue to have significant influence over us after this offering, including control over decisions that require the approval of stockholders, which could limit your ability to influence the outcome of matters submitted to stockholders for a vote.
We are currently controlled, and after this offering is completed will continue to be controlled, by holders of our Class B common stock. Upon completion of this offering, holders of our Class B common stock will beneficially own an aggregate of 98.2% of the voting power of our common stock (or 98.0% if the underwriters exercise in full their option to purchase additional shares). In particular, Dr. Dunleavy will beneficially own an aggregate of 44.1% of the voting power of our common stock (or 44.0% if the underwriters exercise in full their option to purchase additional shares), and Mr. Hoffmann will beneficially own an aggregate of 23.1% of the voting power of our common stock (or 23.0% if the underwriters exercise in full their option to purchase additional shares). The shares beneficially owned by Dr. Dunleavy and Mr. Hoffmann and other current stockholders are shares of Class B common stock, which have 10 votes per share, whereas each share of Class A common stock to be sold in this offering has one vote per share. As long as holders of our Class B common stock control at least a majority of the voting power of our
40
outstanding common stock, they will have the ability to exercise substantial control over all corporate actions requiring stockholder approval, irrespective of how our other stockholders may vote, including the election and removal of directors and the size of our board of directors, any amendment of our certificate of incorporation or bylaws, or the approval of any merger or other significant corporate transaction, including a sale of all or substantially all of our assets. Even if their ownership falls below 50%, holders of our Class B common stock will continue to be able to exert significant influence or effectively control our decisions because of the dual class structure of our common stock. This concentrated control by our Class B common stockholders will limit or preclude your ability to influence those corporate matters for the foreseeable future and, as a result, we may take actions that holders of our Class A common stock do not view as beneficial. This dual class structure may adversely affect the market price of our Class A common stock. In addition, this structure may prevent or discourage unsolicited acquisition proposals or offers for our capital stock that you may feel are in your best interest as one of our stockholders.
An active, liquid trading market for our Class A common stock may not develop, which may limit your ability to sell your shares at or above the initial public offering price.
Prior to this offering, there has been no public market for our Class A common stock. Although we have been approved to have our Class A common stock listed on the NASDAQ Global Select Market under the symbol "INOV," an active trading market for our Class A common stock may never develop or be sustained following this offering. The initial public offering price will be determined by negotiations between us and the underwriters and may not be indicative of market prices of our Class A common stock that will prevail in the open market after this offering. A public trading market having the desirable characteristics of depth, liquidity, and orderliness depends upon the existence of willing buyers and sellers at any given time, such existence being dependent upon the individual decisions of buyers and sellers over which neither we nor any market maker has control. The failure of an active and liquid trading market to develop and be sustained would likely have a material adverse effect on the value of our Class A common stock. The market price of our Class A common stock may decline below the initial public offering price, and you may not be able to sell your shares of our Class A common stock at or above the price you paid in this offering, or at all. An inactive market may also impair our ability to raise capital to continue to fund operations by selling shares and may impair our ability to acquire other companies or technologies by using our shares as consideration.
We will incur significantly increased costs and devote substantial management time as a result of operating as a public company.
As a public company, we will incur significant legal, accounting, stockholder communication, and other expenses that we did not incur as a private company. For example, we will be subject to the reporting requirements of the Exchange Act and will be required to comply with the applicable requirements of the Sarbanes-Oxley Act and the Dodd-Frank Wall Street Reform and Consumer Protection Act, as well as rules and regulations subsequently implemented by the SEC, and the NASDAQ Stock Market LLC, or NASDAQ, including the establishment and maintenance of effective disclosure and financial controls, changes in corporate governance practices, and required filing of annual, quarterly, and current reports with respect to our business and operating results. We expect that compliance with these requirements will increase our legal and financial compliance costs and will make some activities more time consuming and costly. In addition, we expect that our management and other personnel will need to divert attention from operational and other business matters to devote substantial time to these public company requirements. In particular, we expect to incur significant expenses and devote substantial management effort toward ensuring compliance with the requirements of Section 404 of the Sarbanes-Oxley Act, which will increase when we are no longer an emerging growth company, as defined by the JOBS Act. We may also need to hire
41
additional accounting and financial staff with appropriate public company experience and technical accounting knowledge. Furthermore, we expect that the expenses necessary to communicate with our stockholders, the financial community, public relations audiences, and other such similar audiences will be significantly more than any such similar expenses have historically been for us.
We also expect that operating as a public company will make it more expensive for us to obtain director and officer liability insurance, and we may be required to accept reduced coverage or incur substantially higher costs to obtain coverage. This could also make it more difficult for us to attract and retain qualified people to serve on our board of directors, our board committees, or as executive officers.
Furthermore, if we are unable to satisfy our obligations as a public company, we could be subject to delisting of our Class A common stock, fines, sanctions, and other regulatory action and potentially civil litigation, which could have a material adverse effect on our financial condition and results of operations.
The stock price of our Class A common stock may be volatile or may decline regardless of our operating performance, and you may not be able to resell your shares at or above the initial public offering price.
The market price of our Class A common stock may fluctuate significantly. These fluctuations could cause you to lose all or part of your investment in our common stock since you might be unable to sell your shares at or above the price you paid in this offering. Factors, many of which are beyond our control, that could cause fluctuations in the market price of our Class A common stock include the following:
- •
- overall performance of the equity markets;
- •
- our operating performance and the performance of other similar companies;
- •
- changes in the market valuations of similar companies;
- •
- changes in our capital structure, such as future issuances of securities or the incurrence of debt;
- •
- changes in the estimates of our operating results that we provide to the public or our failure to meet these projections;
- •
- failure of securities analysts to maintain coverage of us, changes in financial estimates by securities analysts who
follow our company, or our failure to meet these estimates or the expectations of investors or changes in recommendations by securities analysts that elect to follow our Class A common stock;
- •
- sales of shares of our Class B common stock by our stockholders upon expiration of the market stand-off under our
Stockholders' Agreement or contractual lock-up agreements with the underwriters;
- •
- announcements of technological innovations, new services or enhancements to services, acquisitions, strategic alliances,
or significant agreements by us or by our competitors;
- •
- disruptions in our services due to computer hardware, software, or network problems or a security breach;
- •
- announcements of client additions and client cancellations or delays in client purchases;
- •
- recruitment or departure of key personnel;
- •
- the economy as a whole or market conditions in our industry and the industries of our clients;
42
- •
- litigation involving us, our industry, or both, or investigations by regulators into our operations or those of our
competitors;
- •
- developments or disputes concerning our intellectual property or other proprietary rights;
- •
- new laws or regulations, or new interpretations of existing laws or regulations, applicable to our business;
- •
- the size of our market float; and
- •
- any other factors discussed in this prospectus.
In addition, the stock markets have experienced extreme price and volume fluctuations that have affected and continue to affect the market prices of equity securities of many technology companies. Stock prices of many technology companies have fluctuated in a manner unrelated or disproportionate to the operating performance of those companies. In the past, stockholders have filed securities class action litigation following periods of market volatility. If we were to become involved in securities litigation, it could subject us to substantial costs, divert resources and the attention of management from our business, and materially adversely affect our business.
We do not currently intend to pay dividends on our common stock and, consequently, your ability to achieve a return on your investment will depend on appreciation in the price of our Class A common stock.
Although we have paid cash dividends on our common stock in the past, we currently intend to invest any future earnings to finance the operation and growth of our business and do not expect to pay any dividends for the foreseeable future. As a result, the success of an investment in shares of our Class A common stock will depend upon future appreciation in its value, if any, and there is no guarantee that shares of our Class A common stock will appreciate in value or even maintain the price at which our stockholders purchase their shares in this offering.
If you purchase shares of our Class A common stock in this offering, you will experience immediate and substantial dilution of your investment.
The initial public offering price will be substantially higher than the net tangible book value of each outstanding share of common stock immediately after this offering. If you purchase shares of our Class A common stock in this offering, you will suffer immediate and substantial dilution. At the initial public offering price of $25.00 per share, which is the midpoint of the price range on the cover of this prospectus, with net proceeds to us of $517.2 million, after deducting underwriting discounts and commissions and estimated offering expenses, investors who purchase shares in this offering from us will have contributed approximately 86% of the total amount of funding we have received to date. The dilution will be $22.07 per share in the net tangible book value of the common stock from the initial public offering price. In addition, if outstanding options to purchase shares of our common stock are exercised, there could be further dilution. For more information refer to "Dilution."
A significant portion of our total outstanding shares are restricted from immediate resale but may be sold into the market in the near future when "market standoff" and contractual lock-up periods end, which could cause the market price of our common stock to decline significantly, even if our business is doing well.
Sales of a substantial number of shares of our common stock in the public market could occur at any time. These sales, or the perception in the market that the holders of a large number of shares intend to sell shares, could reduce the market price of our common stock. After this offering, we will have outstanding shares of Class A common stock (assuming no exercise of the underwriters' option to purchase additional shares). All of the shares of our Class B common stock
43
(including any shares converted by the holders thereof to shares of Class A common stock) are subject to a 180-day market stand-off agreement provided under our Stockholders' Agreement or contractual lock-up agreements with the underwriters, pursuant to which holders have agreed, subject to specific exceptions, not to sell, dispose of, or transfer their shares of our common stock for a period of 180 days following the date of this prospectus. We also intend to file a Form S-8 under the Securities Act to register all shares of common stock that we may issue under our equity compensation plans, and we have entered into the second amended and restated stockholders' agreement with the existing holders of our common stock, including certain of our executive officers and directors, that provides them with registration rights. Once we register these shares, they can be freely sold in the public market upon issuance, subject to the lock-up and market stand-off agreements described in the "Underwriting" section of this prospectus. As restrictions on resale end, the market price of our stock could decline if the holders of currently restricted shares sell them or are perceived by the market as intending to sell them. See the information under the heading "Shares Eligible For Future Sale" and "Certain Relationships and Related Party Transactions — Stockholders' Agreement" for a more detailed description of the shares of common stock that will be available for future sale upon completion of this offering.
Delaware law and provisions in our restated certificate of incorporation and bylaws that will be in effect at the closing of our initial public offering could make a merger, tender offer, or proxy contest difficult, thereby depressing the trading price of our Class A common stock.
Following the closing of our initial public offering, our status as a Delaware corporation and the anti-takeover provisions of the Delaware General Corporation Law may discourage, delay, or prevent a change in control by prohibiting us from engaging in a business combination with an interested stockholder (generally a stockholder, who together with affiliates and associates, owns 15% or more of our voting rights) for a period of three years after the person becomes an interested stockholder, even if a change of control would be beneficial to our existing stockholders. In addition, our restated certificate of incorporation and bylaws that will be in effect at the closing of this offering will contain provisions that may make the acquisition of our company more difficult, including the following:
- •
- we have a dual class common stock structure, which could provide the holders of our Class B common stock,
including our executive officers, directors, and their affiliates, with the ability to control the outcome of matters requiring stockholder approval, even if they own significantly less than a
majority of the shares of our outstanding Class A and Class B common stock;
- •
- when the outstanding shares of our Class B common stock represent less than 10% of the total outstanding shares of
our common stock, certain amendments to our restated bylaws will require the approval of two-thirds of the voting power of our then-outstanding shares of common stock;
- •
- when the outstanding shares of our Class B common stock represent less than 10% of the total outstanding shares of
our common stock, vacancies on our board of directors will be able to be filled only by our board of directors and not by stockholders;
- •
- when the outstanding shares of our Class B common stock represent less than 10% of the total outstanding shares of
our common stock, our board of directors will be classified into three classes of directors with staggered three-year terms and directors will only be able to be removed from office for cause;
- •
- when the outstanding shares of our Class B common stock represent less than 10% of the total outstanding shares of our common stock, our stockholders will only be able to take action at a meeting of stockholders and not by written consent;
44
- •
- only our chairman, our chief executive officer, a majority of our board of directors, or stockholders holding shares
representing at least 50% of the combined voting power of our Class A common Stock and Class B common stock will be authorized to call a special meeting of stockholders until the
outstanding shares of our Class B common stock represent less than 10% of the total outstanding shares of our common stock, at which time only our chairman, our chief executive officer, or a
majority of our board of directors will be authorized to call a special meeting of stockholders;
- •
- advance notice procedures will apply for stockholders to nominate candidates for election as directors or to bring
matters before an annual meeting of stockholders;
- •
- our restated certificate of incorporation will authorize up to 100,000,000 shares of undesignated preferred stock, the
terms of which may be established, and shares of which may be issued, without stockholder approval; and
- •
- certain litigation against us can only be brought in Delaware.
For information regarding these and other provisions, see "Description of Capital Stock — Anti-Takeover Provisions."
Our restated certificate of incorporation that will be in effect at the closing of our initial public offering provides that, subject to certain exceptions, the Court of Chancery of the State of Delaware shall be the sole and exclusive forum for certain stockholder litigation matters, which could limit our stockholders' ability to obtain a favorable judicial forum for disputes with us or our directors, officers or employees.
Our restated certificate of incorporation that will be in effect at the closing of our initial public offering provides that, subject to limited exceptions, the Court of Chancery of the State of Delaware will be the sole and exclusive forum for (i) any derivative action or proceeding brought on our behalf, (ii) any action asserting a claim of breach of a fiduciary duty owed by any of our directors, officers or other employees to us or our stockholders, (iii) any action asserting a claim against us arising pursuant to any provision of the Delaware General Corporation Law, our restated certificate of incorporation or our restated bylaws, or (iv) any action asserting a claim against us that is governed by the internal affairs doctrine. Any person or entity purchasing or otherwise acquiring any interest in shares of our capital stock shall be deemed to have notice of and to have consented to the provisions of our restated certificate of incorporation described above. This choice of forum provision may limit a stockholder's ability to bring a claim in a judicial forum that it finds favorable for disputes with us or any of our directors, officers or other employees, which may discourage lawsuits with respect to such claims. Alternatively, if a court were to find the choice of forum provision contained in our amended and restated certificate of incorporation to be inapplicable or unenforceable in an action, we may incur additional costs associated with resolving such action in other jurisdictions, which could harm our business, operating results and financial condition.
If securities or industry analysts do not publish research or reports about our business, if they adversely change their recommendations regarding our shares, or if our results of operations do not meet their expectations, the share price and trading volume of our Class A common stock could decline.
The trading market for our Class A common stock will be influenced by the research and reports that industry or securities analysts publish about us or our business. We do not have any control over these analysts. If one or more of these analysts cease coverage of our company or fail to publish reports on us regularly, we could lose visibility in the financial markets, which in turn could cause the share price or trading volume of our Class A common stock to decline. Moreover, if one or more of the analysts who cover us, express views regarding us that may be perceived as negative or less favorable than previous views, downgrade our stock, or if our results of operations do not meet their expectations, the share price of our Class A common stock could decline.
45
SPECIAL NOTE REGARDING FORWARD-LOOKING STATEMENTS
This prospectus contains forward-looking statements. All statements contained in this prospectus other than statements of historical fact, including but not limited to statements regarding our future results of operations and financial position, our business strategy and plans, market growth, the use of the net proceeds from this offering and our objectives for future operations, are forward-looking statements. The words "believe," "may," "will," "estimate," "continue," "anticipate," "intend," "expect," and similar expressions are intended to identify forward-looking statements. We have based these forward-looking statements largely on our current expectations and projections about future events and trends that we believe may affect our financial condition, results of operations, business strategy, short-term and long-term business operations and objectives and financial needs. These forward-looking statements are subject to a number of risks, uncertainties and assumptions, including those described in the "Risk Factors" section. Moreover, we operate in a very competitive and rapidly changing environment. New risks emerge from time to time. It is not possible for our management to predict all risks, nor can we assess the impact of all factors on our business or the extent to which any factor, or combination of factors, may cause actual results to differ materially from those contained in any forward-looking statements we may make. In light of these risks, uncertainties and assumptions, the future events and trends discussed in this prospectus may not occur and actual results could differ materially and adversely from those anticipated or implied in the forward-looking statements.
Factors that may cause actual results to differ from expected results include, among others:
- •
- our future financial performance, including our ability to continue and manage our growth;
- •
- our ability to retain our client base;
- •
- the effect of the concentration of our revenue among our top clients;
- •
- our ability to innovate and adapt our platforms and toolsets;
- •
- the effects of regulations applicable to us, including regulations relating to data protection and data privacy;
- •
- the ability to protect the privacy of our clients' data and prevent security breaches;
- •
- the effect of competition on our business; and
- •
- the efficacy of our platforms and toolsets.
You should not rely upon forward-looking statements as predictions of future events. The events and circumstances reflected in the forward-looking statements may not be achieved or occur. Although we believe that the expectations reflected in the forward-looking statements are reasonable, we cannot guarantee future results, levels of activity, performance, or achievements. We are under no duty to, and we disclaim any obligation to, update any of these forward-looking statements after the date of this prospectus or to conform these statements to actual results or revised expectations.
46
We estimate that the net proceeds to us from the sale of shares of our Class A common stock in this offering will be approximately $517.2 million (or $595.6 million, assuming the underwriters exercise their option to purchase additional shares in full), based on an assumed public offering price of $25.00 per share, which is the midpoint of the estimated price range set forth on the front cover page of this prospectus, and after deducting estimated underwriting discounts and estimated offering expenses payable by us.
The principal purposes of our initial public offering are to create a public market for our Class A common stock and thereby enable future access to the public equity markets by us and our employees, and obtain additional capital. We intend to use the net proceeds to us from this offering for working capital and other general corporate purposes; however, we do not currently have any specific uses of the net proceeds planned. Additionally, we may use a portion of the proceeds for acquisitions of complementary businesses, technologies, or other assets or to repay outstanding indebtedness.
Our management will have broad discretion in the application of the net proceeds from this offering to us, and investors will be relying on the judgment of our management regarding the application of the proceeds. Pending their use, we plan to invest our net proceeds from this offering in short-term, interest-bearing obligations, investment-grade instruments, certificates of deposit, or direct or guaranteed obligations of the U.S. government.
47
Following the completion of this offering, our board of directors does not currently intend to declare and pay dividends on our common stock. However, our board of directors will periodically reevaluate our dividend policy following this offering and may determine to pay dividends in the future. Any future determination to declare cash dividends will be at the sole discretion of our board of directors and will depend upon various factors, including our results of operations, financial condition and liquidity requirements, restrictions that may be imposed by applicable law and our contracts, and other factors deemed relevant by our board of directors.
The following table sets forth the cash dividends per share of our common stock that our board of directors declared during the years ended December 31, 2012, 2013, and 2014.
| |
Year Ended December 31, |
|||||||||
|---|---|---|---|---|---|---|---|---|---|---|
| |
2012
|
2013
|
2014
|
|||||||
Dividends declared per share |
$ | 0.36 | $ | 0.15 | $ | — | ||||
48
The following table sets forth our cash and cash equivalents, as well as our consolidated capitalization as of September 30, 2014 as follows:
- •
- on an actual basis;
- •
- on an as-adjusted basis, giving effect to the sale and issuance by us of 22,222,222 shares of our class A common stock in this offering at an assumed initial public offering price of $25.00 per share, which is the midpoint of the estimated offering price range set forth on the cover page of this prospectus, and after deducting estimated underwriting discounts and commissions and estimated offering expenses payable by us.
You should read this information together with our consolidated financial statements and the related notes to those statements, and the sections titled "Selected Consolidated Financial and Other Data" and "Management's Discussion and Analysis of Financial Condition and Results of Operations" that are appearing elsewhere in this prospectus.
| |
As of September 30, 2014 | ||||||
|---|---|---|---|---|---|---|---|
| |
Actual
|
As Adjusted(1)(2)
|
|||||
| |
(in thousands, except share and per share data) |
||||||
Cash and cash equivalents |
$ | 131,947 | $ | 649,169 | |||
| | | | | | | | |
| | | | | | | | |
Long-term debt |
$ | 285,191 | $ | 285,191 | |||
Stockholders' equity (deficit): |
|||||||
Common stock, $0.000005 par value, 900,000,000 shares authorized, actual and as adjusted; zero shares issued and outstanding, actual and as adjusted |
— | — | |||||
Class A common stock, $0.000005 par value, 750,000,000 shares authorized, actual and as adjusted; 11,109,285 shares issued and zero outstanding, actual and 22,222,222 shares issued and outstanding, as adjusted |
— | — | |||||
Class B common stock, $0.000005 par value, 150,000,000 shares authorized, actual and as adjusted; 122,257,145 issued and outstanding, actual; 122,257,145 shares issued and outstanding, as adjusted |
1 | 1 | |||||
Preferred stock, $0.0001 par value, 100,000,000 shares authorized, actual and as adjusted; zero shares issued and outstanding, actual and as adjusted |
— | — | |||||
Additional paid-in-capital |
108,677 | 325,882 | |||||
Retained earnings |
167,978 | 167,978 | |||||
Treasury stock, at cost, 11,109,285 shares actual and zero shares as adjusted |
(300,017 | ) | — | ||||
| | | | | | | | |
Total stockholders' (deficit) equity |
(23,361 | ) | 493,861 | ||||
| | | | | | | | |
Total capitalization |
$ | 261,830 | $ | 779,052 | |||
| | | | | | | | |
| | | | | | | | |
- (1)
- A $1.00 increase (decrease) in the assumed initial public offering price of $25.00 per share would increase (decrease) each of cash and cash equivalents, additional paid-in capital, total stockholders' equity (deficit), and total capitalization by $20.9 million, assuming that the number of shares offered by us, as set forth on the cover page of this
49
prospectus, remains the same, and after deducting the estimated underwriting discounts and commissions. If the underwriters' option to purchase additional shares is exercised in full, the as adjusted amount of each of cash and cash equivalents, additional paid-in capital, total stockholders' equity (deficit), and total capitalization would increase by approximately $78.3 million, after deducting estimated underwriting discounts and commissions.
- (2)
- The as adjusted information discussed above is illustrative only and will be adjusted based on the actual initial public offering price and other terms of our initial public offering determined at pricing.
The number of shares shown as issued and outstanding in the table above does not include:
- •
- 6,451,275 shares of our Class B common stock issuable upon the exercise of options to purchase shares of our
common stock outstanding as of September 30, 2014, with a weighted-average exercise price of $5.97 per share;
- •
- 488,780 shares of our Class B common stock issuable upon vesting of restricted stock units granted subsequent to
September 30, 2014;
- •
- 7,335,430 shares of our Class A common stock reserved for future issuance under our 2015 Omnibus Incentive Plan;
- •
- 1,833,857 shares of Class A common stock available for future issuance under our 2015 Employee Stock Purchase
Plan; and
- •
- 3,333,333 shares of Class A common stock issuable if the underwriters exercise their option to purchase additional shares in full.
50
If you invest in our Class A common stock in this offering, your interest will be diluted to the extent of the difference between the initial public offering price per share of our Class A common stock and the as adjusted net tangible book value per share of our common stock immediately after this offering.
Net tangible book value per share represents the amount of our tangible assets less our liabilities divided by the total number of shares of our common stock outstanding.
Our as adjusted net tangible book value as of September 30, 2014 was $423.6 million, or $2.93 per share of common stock. As adjusted net tangible book value per share gives effect to the sale by us of 22,222,222 shares of our Class A common stock in this offering at an assumed initial public offering price of $25.00 per share, which is the midpoint of the estimated offering price range set forth on the front cover page of this prospectus, after deducting the estimated underwriting discounts and commissions and estimated offering expenses payable by us. This represents an immediate increase in as adjusted net tangible book value of $3.70 per share to existing stockholders and immediate dilution of $22.07 per share to new investors purchasing shares in this offering.
The following table illustrates this per share dilution:
Assumed initial public offering price per share |
$ | 25.00 | |||||
Net tangible book value per share as of September 30, 2014, before giving effect to this offering |
$ | (0.77 | ) | ||||
Increase in net tangible book value per share attributable to investors purchasing shares in this offering |
3.70 | ||||||
| | | | | | | | |
As adjusted net tangible book value per share, after giving effect to this offering |
2.93 | ||||||
| | | | | | | | |
Dilution per share to investors in this offering |
$ | 22.07 | |||||
| | | | | | | | |
| | | | | | | | |
Each $1.00 increase or decrease in the assumed initial public offering price of $25.00 per share of our Class A common stock, which is the midpoint of the estimated offering price range set forth on the cover of this prospectus, would increase or decrease our as adjusted net tangible book value per share after this offering by $0.15 and the dilution to new investors by $0.85 per share, assuming that the number of shares offered by us, as set forth on the front cover page of this prospectus, remains the same and after deducting estimated underwriting discounts and commissions and estimated offering expenses payable by us. Similarly, each increase or decrease of 1,000,000 shares in the number of shares of Class A common stock offered by us would increase or decrease the as adjusted net tangible book value by approximately $0.14 per share and the dilution to new investors by $0.14 per share, assuming the assumed initial public offering price remains the same and after deducting the estimated underwriting discounts and commissions and estimated expenses payable by us.
If the underwriters exercise their option to purchase 3,333,333 additional shares of Class A common stock in full, the as adjusted net tangible book value per share after this offering would be $3.40 per share, and the dilution in as adjusted net tangible book value per share to new investors in this offering would be $21.60 per share.
The following table summarizes, on a as adjusted basis as of September 30, 2014, the differences between the number of shares of common stock purchased from us, the total cash consideration and the average price per share paid to us by existing stockholders and by new investors purchasing shares in this offering, at the initial public offering price of $25.00 per share,
51
before deducting estimated underwriting discounts and commissions, and estimated offering expenses payable by us:
| |
Shares Purchased |
Total Consideration |
|
|||||||||||||
|---|---|---|---|---|---|---|---|---|---|---|---|---|---|---|---|---|
| |
Average Price Per Share |
|||||||||||||||
| |
Number
|
Percent
|
Amount
|
Percent
|
||||||||||||
Existing stockholders |
122,257,145 | 85 | % | $ | 92,762,371 | 14 | % | $ | 0.76 | |||||||
New public investors |
22,222,222 | 15 | 555,555,550 | 86 | $ | 25.00 | ||||||||||
| | | | | | | | | | | | | | | | | |
Total |
144,479,367 | 100 | % | $ | 648,317,921 | 100 | % | |||||||||
| | | | | | | | | | | | | | | | | |
| | | | | | | | | | | | | | | | | |
Each $1.00 increase or decrease in the assumed initial public offering price of $25.00 per share of our Class A common stock, which is the midpoint of the estimated offering price range set forth on the front cover page of this prospectus, would increase or decrease the total consideration paid by new investors by $22.2 million, assuming that the number of shares offered by us, as set forth on the cover of this prospectus, remains the same, and before deducting estimated underwriting discounts and commissions and estimated offering expenses payable by us.
If the underwriters' option to purchase additional shares of our Class A common stock is exercised in full, the number of shares of common stock held by existing stockholders will be reduced to approximately 83% of the total number of shares of common stock to be outstanding after this offering, and the number of shares of common stock held by investors participating in this offering will be further increased to 25,555,555 shares, or approximately 17% of the total number of shares of common stock to be outstanding after this offering.
The number of shares of Class A and Class B common stock shown as issued and outstanding in the table and discussion above is based on no shares of our Class A common stock and 122,257,145 shares of our Class B common stock issued and outstanding as of September 30, 2014 and excludes:
- •
- 122,257,145 shares of Class A common stock issuable upon the conversion of shares of Class B common stock
that will be outstanding after this offering;
- •
- 6,451,275 shares of our Class B common stock issuable upon the exercise of options to purchase shares of our
common stock outstanding as of September 30, 2014, with a weighted-average exercise price of $5.97 per share;
- •
- 488,780 shares of our Class B common stock issuable upon vesting of restricted stock units granted subsequent to
September 30, 2014; and
- •
- 7,335,430 shares of our Class A common stock available for future issuance under our 2015 Omnibus Incentive Plan.
- •
- 1,833,857 shares of our Class A common stock available for future issuance under our 2015 Employee Stock Purchase Plan.
To the extent that any outstanding options or warrants to purchase our common stock are exercised or new awards are granted under our equity compensation plans, or we issue additional shares of our common stock or convertible securities in the future, there will be further dilution to investors participating in this offering.
52
SELECTED CONSOLIDATED FINANCIAL DATA
The following table sets forth selected consolidated financial data for the years presented and at the dates indicated below. We have derived the selected consolidated statements of operations data for the years ended December 31, 2011, 2012 and 2013 from our audited consolidated financial statements included elsewhere in this prospectus. We have derived the selected consolidated balance sheet data as of December 31, 2012 and 2013 from our audited consolidated financial statements included elsewhere in this prospectus. We have derived the selected consolidated balance sheet data as of December 31, 2011 from our audited consolidated financial statements not included in this prospectus. The selected consolidated statement of operations data for the nine months ended September 30, 2013 and 2014 and the consolidated balance sheet data as of September 30, 2014 have been derived from our unaudited interim consolidated financial statements included elsewhere in this prospectus. We have derived the selected consolidated balance sheet data as of September 30, 2013 from our unaudited interim consolidated financial statements not included in this prospectus. In our opinion, such financial statements include all adjustments, consisting only of normal recurring adjustments, that we consider necessary for a fair presentation of the financial data set forth in those statements.
Our historical results are not necessarily indicative of our results in any future periods, including the full years ending December 31, 2014. The summary of our consolidated financial data set forth below should be read together with our consolidated financial statements and related notes, as well as the sections entitled "Management's Discussion and Analysis of Financial Condition and Results of Operations," included elsewhere in this prospectus.
| |
Year Ended December 31, | Nine Months Ended September 30, |
||||||||||||||
|---|---|---|---|---|---|---|---|---|---|---|---|---|---|---|---|---|
| |
2011
|
2012
|
2013
|
2013
|
2014
|
|||||||||||
| |
(in thousands, except per share data) |
|||||||||||||||
Consolidated Statement of Operations Data: |
||||||||||||||||
Revenue |
$ |
239,685 |
$ |
300,275 |
$ |
295,798 |
$ |
231,264 |
$ |
271,622 |
||||||
Expenses: |
||||||||||||||||
Cost of revenue |
102,695 | 101,188 | 120,054 | 94,869 | 85,065 | |||||||||||
Sales and marketing |
6,752 | 6,793 | 5,952 | 4,597 | 5,355 | |||||||||||
Research and development |
14,855 | 15,499 | 21,192 | 16,171 | 17,376 | |||||||||||
General and administrative |
63,184 | 72,661 | 80,638 | 60,266 | 62,920 | |||||||||||
Depreciation and amortization |
11,229 | 12,899 | 15,517 | 11,105 | 15,012 | |||||||||||
| | | | | | | | | | | | | | | | | |
Total operating expenses |
198,715 | 209,040 | 243,353 | 187,008 | 185,728 | |||||||||||
| | | | | | | | | | | | | | | | | |
Income from operations |
40,970 | 91,235 | 52,445 | 44,256 | 85,894 | |||||||||||
| | | | | | | | | | | | | | | | | |
Other income and (expenses): |
||||||||||||||||
Interest income |
10 | 11 | 9 | 6 | 4 | |||||||||||
Interest expense |
(62 | ) | (129 | ) | (79 | ) | (61 | ) | (209 | ) | ||||||
| | | | | | | | | | | | | | | | | |
Income before taxes |
40,918 | 91,117 | 52,375 | 44,201 | 85,689 | |||||||||||
Provision for income taxes |
15,991 | 35,962 | 19,657 | 17,218 | 33,836 | |||||||||||
| | | | | | | | | | | | | | | | | |
Net income |
$ | 24,927 | $ | 55,155 | $ | 32,718 | $ | 26,983 | 51,853 | |||||||
| | | | | | | | | | | | | | | | | |
| | | | | | | | | | | | | | | | | |
Basic net income per share |
$ | 0.18 | $ | 0.40 | $ | 0.24 | $ | 0.20 | $ | 0.39 | ||||||
| | | | | | | | | | | | | | | | | |
| | | | | | | | | | | | | | | | | |
Diluted net income per share |
$ | 0.18 | $ | 0.40 | $ | 0.24 | $ | 0.20 | $ | 0.38 | ||||||
| | | | | | | | | | | | | | | | | |
| | | | | | | | | | | | | | | | | |
Weighted average shares of common stock outstanding: |
||||||||||||||||
Basic |
137,865 | 137,865 | 135,305 | 135,555 | 133,640 | |||||||||||
| | | | | | | | | | | | | | | | | |
| | | | | | | | | | | | | | | | | |
Diluted |
138,855 | 139,040 | 136,375 | 136,730 | 135,835 | |||||||||||
| | | | | | | | | | | | | | | | | |
| | | | | | | | | | | | | | | | | |
Other Financial Data: |
||||||||||||||||
Adjusted EBITDA(1) |
$ |
57,526 |
$ |
108,105 |
$ |
71,847 |
$ |
58,333 |
$ |
103,059 |
||||||
Adjusted EBITDA margin(1) |
24 | % | 36 | % | 24 | % | 25 | % | 38 | % | ||||||
53
| |
December 31, | September 30, | ||||||||||||||
|---|---|---|---|---|---|---|---|---|---|---|---|---|---|---|---|---|
| |
2011
|
2012
|
2013
|
2013
|
2014
|
|||||||||||
| |
(in thousands) |
|||||||||||||||
Consolidated Balance Sheet Data: |
||||||||||||||||
Cash and cash equivalents |
$ |
114,872 |
$ |
106,361 |
$ |
110,594 |
$ |
110,891 |
$ |
131,947 |
||||||
Accounts receivable, net of allowances |
36,764 | 62,899 | 33,398 | 43,233 | 52,037 | |||||||||||
Working capital |
131,676 | 136,933 | 130,562 | 145,209 | 156,446 | |||||||||||
Property, equipment and capitalized software, net |
28,089 | 34,170 | 43,050 | 40,561 | 49,126 | |||||||||||
Goodwill |
62,269 | 62,269 | 62,269 | 62,269 | 62,269 | |||||||||||
Total assets |
262,922 | 285,655 | 269,746 | 277,710 | 317,345 | |||||||||||
Long-term debt |
268 | 168 | 279 | 203 | 285,191 | |||||||||||
Total liabilities |
33,817 | 48,826 | 38,012 | 32,471 | 340,706 | |||||||||||
Total stockholders' equity (deficit) |
229,105 | 236,829 | 231,734 | 245,239 | (23,361 | ) | ||||||||||
- (1)
- We
define Adjusted EBITDA as net income calculated in accordance with GAAP, adjusted for the impact of depreciation and amortization, interest expense,
interest income, provision for income taxes, stock-based compensation, other non-comparable income and expenses, and certain legal costs. We use a variety of operating and other information to
evaluate the operating performance of our business, develop financial forecasts, make strategic decisions, and prepare and approve our annual budgets. These key indicators include financial
information that is prepared in accordance with GAAP and presented in our consolidated financial statements as well as Adjusted EBITDA and Adjusted EBITDA margin, both of which are non-GAAP metrics,
to evaluate our business, measure our performance, develop financial forecasts and make strategic decisions. We have provided below a reconciliation of Adjusted EBITDA to net income, which is the most
closely comparable non-GAAP financial measure. Adjusted EBITDA margin is our calculation of Adjusted EBITDA divided by revenue calculated in accordance with GAAP. We use Adjusted EBITDA as a
supplemental measure of our performance to gain insight into our operating performance.
- We
use Adjusted EBITDA margin as a key metric to assess our ability to increase revenues while controlling expense growth and the scalability of
our business model. We believe that the exclusion of the expenses eliminated in calculating Adjusted EBITDA and Adjusted EBITDA margin provides management and investors a useful measure for
period-to-period comparisons of our core business and operating results by excluding items that are not comparable across reporting periods or that do not otherwise relate to our ongoing operating
results. Accordingly, we believe that Adjusted EBITDA and Adjusted EBITDA margin provide useful information to investors and others in understanding and evaluating our operating results. However, our
use of Adjusted EBITDA and Adjusted EBITDA margin as analytical tools has limitations, and you should not consider them in isolation or as substitutes for analysis of our financial results as reported
under GAAP. In addition, other companies, including companies in our industry, might calculate Adjusted EBITDA and Adjusted EBITDA margin or similarly titled measures differently, which may reduce
their usefulness as comparative measures.
- The following table presents a reconciliation of net income to Adjusted EBITDA for each of the periods indicated (dollars in thousands):
| |
Year Ended December 31, | Nine Months Ended September 30, |
|||||||||||||||
|---|---|---|---|---|---|---|---|---|---|---|---|---|---|---|---|---|---|
| |
2011
|
2012
|
2013
|
2013
|
2014
|
||||||||||||
Reconciliation of Net Income to Adjusted EBITDA: |
|||||||||||||||||
Net income |
$ | 24,927 | $ | 55,155 | $ | 32,718 | $ | 26,983 | $ | 51,853 | |||||||
Depreciation and amortization |
11,229 | 12,899 | 15,517 | 11,105 | 15,012 | ||||||||||||
Interest expense |
62 | 129 | 79 | 61 | 209 | ||||||||||||
Interest (income) |
(10 | ) | (11 | ) | (9 | ) | (6 | ) | (4 | ) | |||||||
Provision for income taxes |
15,991 | 35,962 | 19,657 | 17,218 | 33,836 | ||||||||||||
| | | | | | | | | | | | | | | | | | |
EBITDA |
$ | 52,199 | $ | 104,134 | $ | 67,962 | $ | 55,361 | $ | 100,906 | |||||||
Stock-based compensation |
3,767 | 2,560 | 1,842 | 1,408 | 1,340 | ||||||||||||
Other non-comparable items(a) |
1,560 | 1,411 | 1,565 | 1,564 | — | ||||||||||||
Professional service fees(b) |
— | — | 478 | — | 813 | ||||||||||||
| | | | | | | | | | | | | | | | | | |
Adjusted EBITDA |
$ | 57,526 | $ | 108,105 | $ | 71,847 | $ | 58,333 | $ | 103,059 | |||||||
| | | | | | | | | | | | | | | | | | |
| | | | | | | | | | | | | | | | | | |
- (a)
- Other
"non-comparable items" include business transaction-related professional fees, corporate name change and associated rebranding expenses, workforce
restructuring expenses, and certain legal costs. We believe these are non-comparable expenses that should be excluded from Adjusted EBITDA in order to more effectively assess our period-over-period
and on-going operating performance.
- (b)
- Represents legal costs associated with the enforcement of a specific client contract. The legal process associated with this matter began in the first quarter of 2013 and concluded in the second quarter of 2014.
54
MANAGEMENT'S DISCUSSION AND ANALYSIS OF FINANCIAL
CONDITION AND RESULTS OF OPERATIONS
The following discussion and analysis of our financial condition and results of operations should be read in conjunction with our "Selected Consolidated Financial Data" and our consolidated financial statements and related notes included elsewhere in this prospectus. This discussion contains forward-looking statements that involve risks and uncertainties. Our actual results could differ materially from those forward-looking statements below. Factors that could cause or contribute to those differences include, but are not limited to, those identified below and those discussed in the section entitled "Risk Factors" included elsewhere in this prospectus.
We are a leading technology company that combines advanced cloud-based data analytics and data-driven intervention platforms to achieve meaningful impact in clinical and quality outcomes, utilization, and financial performance across the healthcare landscape. We deliver value to our clients by turning data into insights and those insights into action. Currently, our clients include health plans, hospitals, physicians, patients, pharmaceutical companies and researchers.
Our large proprietary datasets, advanced integration technologies, sophisticated predictive analytics, and deep subject matter expertise allow us to provide seamless, end-to-end platforms that bring the benefits of big data and large-scale analytics to the point of care. Our data analytics platforms identify gaps in care, quality, data integrity, and financial performance in our clients' datasets. Our data-driven intervention platforms enable our clients to take the insights derived from the analytics and implement unique, patient-level solutions, drive impact and enhance patient engagement.
We generate the substantial majority of our revenue through the sale or subscription licensing of our data analytics and data-driven intervention platform services. Since our inception, we have experienced significant growth. During the most recent three years, our ability to deliver value to our customers through our advanced analytics and data-driven intervention platforms has allowed us to expand our revenue at a compounded annual growth rate of 19%, Adjusted EBITDA, at a compounded annual growth rate of 20%, and net income at a compounded annual growth rate of 33% despite a 1% revenue decrease during the year ended December 31, 2013 as compared to the year ended December 31, 2012. For the nine months ended September 30, 2014, our revenue was $271.6 million, representing 17% growth over the same period of the prior year. In the same period, we generated Adjusted EBITDA of $103.1 million, representing a 38% Adjusted EBITDA margin and 77% growth over the same period in the prior year. Net income for the nine months ended September 30, 2014 was $51.9 million, representing 19% of revenue and a 92% increase over the same period in 2013. Adjusted EBITDA is a non-GAAP measure. For a reconciliation of Adjusted EBITDA to net income, see "Selected Consolidated Financial Data."
Trends and Factors Affecting Our Future Performance
A number of factors influence our growth and performance. We see many of these factors as being more quantitatively driven, such as the rate of growth of the underlying data counts within our datasets, the ongoing investment in innovation, the number of statement of work contracts maintained by us, and our level of analytical activity. Additionally, there are several factors that influence our growth and performance that are less quantitatively driven, including seasonality, macro-economic forces, and trends within healthcare (such as payment models, incentivization, and regulatory oversight), that can be driven by changes in federal and state laws and regulations, as well as private sector market forces.
Growth of Datasets. Healthcare costs in the United States have been increasing significantly for many years. This rise in healthcare costs has driven a broad transition from consumption-based
55
payment models to quality and value-based payment models across the healthcare landscape. As a result, the specific disease and comorbidity status, clinical and quality outcomes, resource utilization, and care details of the individual patient have become increasingly relevant to the various constituents across the healthcare delivery system. Concurrently, the count and complexity of diseases, diagnostics, and treatments — as well as payment models and regulatory oversight requirements — have soared. In this setting, granular data has become critical to determining and improving quality and financial performance in healthcare. Our MORE2 Registry is our largest principal dataset and serves as a proxy for our general growth of datasets within Inovalon. As of December 31, 2014, our MORE2 Registry has expanded at a rate of approximately 3.0% compounding monthly, or 42.6% annually, since 2000 as illustrated below. The growth of our datasets that inform our analytical capabilities and comparative analytics is a key aspect of our provision of value to our clients and is indicative of our overall growth and capabilities.
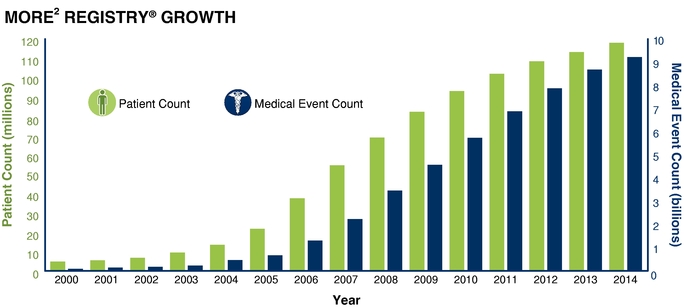
For more information regarding the growth of our MORE2 Registry, including our calculations of patient count and medical event count, see "Prospectus Summary — Summary Consolidated Financial and Other Data."
Innovation and Platform Development. Our business model is based upon our ability to deliver value to our clients through the combination of advanced, cloud-based data analytics and data-driven intervention platforms focused on the achievement of meaningful and measureable improvements in clinical quality outcomes and financial performance in healthcare. Our ability to deliver this value is dependent in part on our ability to continue to innovate, design new capabilities, and bring these capabilities to market in an enterprise scale. Our continued ability to innovate our platform and bring differentiated capabilities to market is an important aspect of our business success. Our investment in innovation includes costs for research and development, capitalized software development, and capital expenditures related to hardware and software
56
platforms on which our data analytics and data-driven interventions capabilities are deployed as summarized below (in thousands, except percentages).
| |
Year Ended December 31, |
Nine Months Ended September 30, |
||||||||||||||
|---|---|---|---|---|---|---|---|---|---|---|---|---|---|---|---|---|
| |
2011
|
2012
|
2013
|
2013
|
2014
|
|||||||||||
Investment in Innovation |
||||||||||||||||
Research and development(1) |
$ | 14,855 | $ | 15,499 | $ | 21,192 | $ | 16,171 | $ | 17,376 | ||||||
Capitalized software development(2) |
5,778 | 10,070 | 10,304 | 7,341 | 11,758 | |||||||||||
Research and development infrastructure investments(3) |
421 | 1,759 | 3,565 | 2,853 | 4,567 | |||||||||||
| | | | | | | | | | | | | | | | | |
Total investment in innovation |
$ | 21,054 | $ | 27,328 | $ | 35,061 | $ | 26,365 | $ | 33,701 | ||||||
| | | | | | | | | | | | | | | | | |
| | | | | | | | | | | | | | | | | |
As a percentage of revenue |
||||||||||||||||
Research and development(1) |
6 | % | 5 | % | 7 | % | 7 | % | 6 | % | ||||||
Capitalized software development(2) |
2 | % | 3 | % | 3 | % | 3 | % | 4 | % | ||||||
Research and development infrastructure investments(3) |
0 | % | 1 | % | 1 | % | 1 | % | 2 | % | ||||||
| | | | | | | | | | | | | | | | | |
Total investment in innovation |
8 | % | 9 | % | 11 | % | 11 | % | 12 | % | ||||||
| | | | | | | | | | | | | | | | | |
| | | | | | | | | | | | | | | | | |
- (1)
- Research
and development primarily includes employee costs related to the development and enhancement of our service offerings.
- (2)
- Capitalized
software development includes capitalized costs incurred to develop and enhance functionality for our data analytics and data-driven
intervention platforms.
- (3)
- Research and development infrastructure investments include strategic capital expenditures related to hardware and software platforms under development or enhancement.
Data Analytics and Data-Driven Intervention Mix. Our business and operational models are highly scalable and leverage variable costs to support revenue generating activities. Our data analytic service costs are less variable in nature and require lower incremental capital expenditures. As a result, following initial development and deployment investments, our big data analytics platform and data technology capabilities allow us to process significant volumes of transactions with lower incremental costs. Conversely, our data-driven intervention service costs are generally variable in nature and require incremental costs to generate additional revenue. As a result, the mix of our data analytics and data interventions activities affects our financial performance. Over the past several years the percentage of our business which is derived from data and analytics subscription fees has been increasing, as has the portion of the data-driven intervention platform services that are fully automated. The chart below illustrates the mix of revenue we have generated
57
from data analytics subscriptions, fully automated data-driven intervention platform services, and partially automated data-driven intervention platform services for the periods presented.
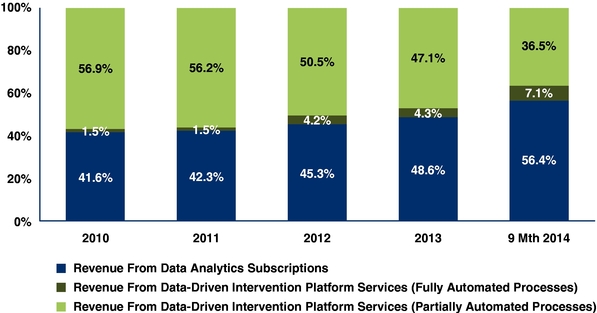
For more information regarding our data analytics and data-driven intervention platform services revenue mix, see "Prospectus Summary — Summary Consolidated Financial and Other Data."
Client and Analytical Process Count Growth. Our business is generally driven by the number of underlying patients for which our analytics and data-driven intervention platforms are being utilized. In addition to this patient count, however, the number of specific analytical processes and data-driven interventions services for which any one specific patient population is engaged, is also a driver. As such, increasing the size, number, and analytical portfolio penetration of populations for which we provide our analytics and data-driven intervention platform services is important to the overall growth of our business. In general, as the application of our analytics and data-driven intervention platform services deliver value, our clients often engage with us to utilize additional analytics and data-driven intervention platform services. Our ability to deliver demonstrable value, retain clients, add new clients, and realize growth within existing clients affects our financial performance. As such, on an annual basis we track the number of patient populations
58
for which we are engaged to provide data analytics and provide data-driven intervention services (each engagement memorialized with a contracted statement of work, or SOW).
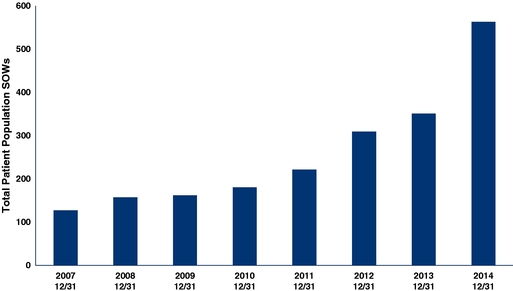
For more information regarding patient population statements of work, see "Prospectus Summary — Summary Consolidated Financial and Other Data."
In addition, we track the number of analytical processes that we run on patients each month in fulfillment of our client contracts, as totaled for the trailing 12 months. This metric, referred to as the Trailing 12 Month Patient Analytical Months, or PAM, is displayed through the quarter ending December 31, 2014 in the figure below. We believe that PAM is indicative of our overall level of analytical activity, and we expect our period-to-period comparisons of our PAM to be indicative of underlying growth of our business, although changes in levels of analytical activity do not always directly translate to changes in financial performance of our business. Differences in fees charged for different analytical packages exist and differences in how analytics trigger the applicability of our data-driven intervention platforms may result in increases in analytical activity that do not result in proportional increases in revenue, Adjusted EBITDA or net income (and vice versa). Therefore, in situations in which a new engaged client SOW is initiated for analytical processes that have a higher than average fee rate, revenue could expand disproportionately faster than the increase in PAM. Likewise, as was the case in the year ended December 31, 2013, the loss of an engaged client SOW for analytical processes that have a higher than average fee rate can negatively affect revenue disproportionately more than PAM. Further, in 2013, the initiation of several new engaged client SOWs for various analytical processes that commanded, when taken together, a lower than
59
average fee rate offset the reduction in revenue from the aforementioned terminated client SOW, while PAM was more than offset, and thus increased.
Trailing 12 Month Patient Analytics Months (PAMs)
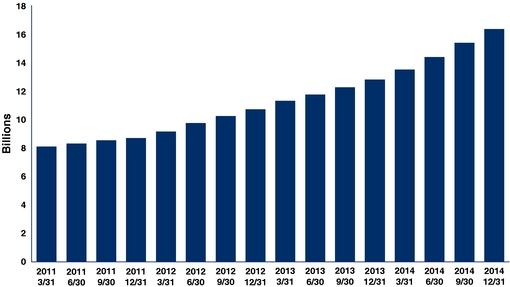
For more information regarding Trailing 12 month patient analytics months (PAM), see "Prospectus Summary — Summary Consolidated Financial and Other Data."
Seasonality. We typically experience the highest level of revenue in the second quarter of each year, which coincides with specific accreditation and regulatory deadlines. In particular, as a result of certain data filing deadlines established by CMS, state departments of health, and the National Committee for Quality Assurance, or NCQA, clients typically engage us to perform higher levels of data-driven analytics and data-driven interventions during the first two quarters of each year when compared to other quarters of the year. Conversely, the third quarter of the year has relatively few such deadlines and, as such, typically has lower levels of analytics engagement activity than other quarters of the year.
Macro-Economic and Macro-Industry Trends. Our clients are affected, sometimes directly, and sometimes counter-intuitively, by macro-economic trends such as economic growth (or economic recession), inflation, and unemployment. Further, industry trends in federal and state laws and regulations, as well as emerging trends in private sector payment models, affect our clients' businesses and their need for technologies and services to support these challenges. These factors have various effects on our business, and on occasion have resulted in the slowing or cessation of the decision-making process by clients adopting our technologies and services. On the other hand, changes in macro-economic trends and the industry landscape have accelerated the need for our technologies and services from time-to-time, particularly as regulators introduce complex requirements with which our clients must comply.
Components of Results of Operations
Revenue
We earn revenue through the sale or subscription licensing of our cloud-based data analytics and data-driven intervention platform services.
Cloud-based data analytics solution revenue accounted for approximately 42.3%, 45.3%, and 48.6% of our consolidated revenue during the years ended December 31, 2011, 2012, and 2013, respectively, and approximately 47.0% and 56.3% of our consolidated revenue during the nine
60
months ended September 30, 2013 and 2014, respectively. These percentages include software subscription licensing revenue of approximately 2.9%, 2.6%, and 3.6% of our consolidated revenue during the years ended December 31, 2011, 2012, and 2013, respectively, and approximately 3.5% and 3.7% of our consolidated revenue for the nine months ended September 30, 2013 and 2014, respectively. Our cloud-based data analytics services are performed either at the beginning of a data-driven intervention process, which typically aligns with regulatory submission deadlines, or on a monthly basis, depending on the particular client's needs. Data analytics revenue is driven primarily by the number of identified gaps in care, quality, data integrity, and financial performance identified in a client's dataset, the number of unique patients in a client's dataset, a minimum data analytics processing fee, and a contractually negotiated transactional price for each identified gap or unique patient. Subscription licensing revenue is driven primarily by the number of clients, the number of unique patients in a client's population dataset, the number of analytical services contracted for by a client, and the contractually negotiated price of such services.
Cloud-based data-driven intervention platform services revenue accounted for approximately 57.7%, 54.7%, and 51.4% of our consolidated revenue during the years ended December 31, 2011, 2012, and 2013, respectively, and approximately 53.0% and 43.7% of our consolidated revenue during the nine months ended September 30, 2013 and 2014, respectively. Data-driven intervention platform service revenue is further broken down into revenue that is generated from fully automated processes (i.e., those processes that require no material variable-based labor components) and partially automated processes (i.e., those processes that require certain material variable-based labor components). For the years ended December 31, 2011, 2012, and 2013, and the nine months ended September 30, 2013 and 2014, respectively, revenue from fully automated processes accounted for 1.5%, 4.2%, 4.3%, 4.8%, and 7.1% of data-driven intervention platform services revenue and revenue from partially automated processes accounted for 56.2%, 50.5%, 47.1%, 48.2%, and 36.6% of data-driven intervention platform services revenue.
Our data-driven intervention platform services include medical record data abstraction and review services, encounter decision support, encounter facilitation, outbound telephonic and written communications, and supplemental patient encounter services. Data-driven intervention platform service revenue is driven primarily by the results of our data analytic processes, the quantity and assortment of completed interventions, and a contractually negotiated transactional price for each intervention performed by us.
See "— Critical Accounting Policies — Revenue Recognition" for a more detailed discussion of our revenue recognition policy.
Cost of Revenue
Cost of revenue consists primarily of expenses for employees who provide direct contractual services to our clients, including salaries, benefits, discretionary incentive compensation, employment taxes, severance, and equity compensation costs. Cost of revenue also includes expenses associated with the integration, and verification of data and other service costs incurred to fulfill our revenue contracts. Cost of revenue does not include allocated amounts for occupancy expense and depreciation and amortization. Many of the elements of our cost of revenue are relatively variable and semi-variable, and can be reduced in the near-term to offset any decline in our revenue.
Our business and operational models are designed to be highly scalable and leverage variable costs to support revenue generating activities. While we expect to grow our headcount over time to capitalize on our market opportunities, we believe our increased investment in automation, electronic health record integration capabilities, and economies of scale in our operating model, will position us to grow our revenue at a greater rate than our cost of revenue.
61
Sales and Marketing
Sales and marketing expense consists primarily of employee-related expenses, including salaries, benefits, commissions, discretionary incentive compensation, employment taxes, severance, and equity compensation costs for our employees engaged in sales, sales support, business development, and marketing. Sales and marketing expense also includes operating expenses for marketing programs, research, trade shows and brand messages, and public relations costs. Our sales and marketing expense excludes any allocation of occupancy expense and depreciation and amortization.
We expect our sales and marketing expenses to increase as we strategically invest to expand our business. We expect to hire additional sales personnel and related support personnel to capture an increasing amount of our market opportunity. As we scale our sales and marketing activities in the short to medium term, we expect these expenses to increase in both absolute dollars and as a percentage of revenue.
Research and Development
Research and development expense (one component of our investment in innovation) consists primarily of employee-related expenses, including salaries, benefits, discretionary incentive compensation, employment taxes, severance, and equity compensation costs for our software developers, engineers, analysts, project managers, and other employees engaged in the development and enhancement of our service offerings. Research and development expense also includes certain third party consulting fees. Our research and development expense excludes any allocation of occupancy expense and depreciation and amortization.
We expect to continue our focus on developing new data analytics and data-driven intervention platforms and enhancing our existing data analytics and data-driven intervention platforms. As a result, we expect our research and development expense to continue to increase in absolute dollars, although it may vary from period to period as a percentage of revenue.
General and Administrative
Our general and administrative expense consists primarily of employee-related expenses including salaries, benefits, discretionary incentive compensation, employment taxes, severance, and equity compensation costs, for employees who are responsible for management information systems, administration, human resources, finance, legal, and executive management. General and administrative expense also includes occupancy expenses (including rent, utilities, communications, and facilities maintenance), professional fees, consulting fees, insurance, travel, and other expenses. Our general and administrative expense excludes depreciation and amortization.
We expect our general and administrative expense to increase as we expand our business and incur the incremental costs associated with being a public company. However, excluding certain increases as a result of being a public company, we expect our general and administrative expense to grow at a lower rate than revenue.
Depreciation and Amortization Expense
Our depreciation and amortization expense consists primarily of depreciation of fixed assets, amortization of capitalized software development costs, and amortization of acquisition-related intangible assets.
Provision for Income Taxes
Provision for income taxes consists of federal and state income taxes in the United States and foreign income taxes from the territory of Puerto Rico, including deferred income taxes reflecting the net tax effects of temporary differences between the carrying amounts of assets and liabilities for financial reporting purposes and the amounts used for income tax purposes.
62
The following tables set forth our consolidated statement of operations data for each of the periods presented (in thousands):
| |
Year Ended December 31, | Nine Months Ended September 30, |
||||||||||||||
|---|---|---|---|---|---|---|---|---|---|---|---|---|---|---|---|---|
| |
2011
|
2012
|
2013
|
2013
|
2014
|
|||||||||||
Revenue |
$ | 239,685 | $ | 300,275 | $ | 295,798 | $ | 231,264 | $ | 271,622 | ||||||
Expenses: |
||||||||||||||||
Cost of revenue |
102,695 | 101,188 | 120,054 | 94,869 | 85,065 | |||||||||||
Sales and marketing |
6,752 | 6,793 | 5,952 | 4,597 | 5,355 | |||||||||||
Research and development |
14,855 | 15,499 | 21,192 | 16,171 | 17,376 | |||||||||||
General and administrative |
63,184 | 72,661 | 80,638 | 60,266 | 62,920 | |||||||||||
Depreciation and amortization |
11,229 | 12,899 | 15,517 | 11,105 | 15,012 | |||||||||||
| | | | | | | | | | | | | | | | | |
Total operating expenses |
198,715 | 209,040 | 243,353 | 187,008 | 185,728 | |||||||||||
| | | | | | | | | | | | | | | | | |
Income from operations |
40,970 | 91,235 | 52,445 | 44,256 | 85,894 | |||||||||||
| | | | | | | | | | | | | | | | | |
Other income and (expenses): |
||||||||||||||||
Interest income |
10 | 11 | 9 | 6 | 4 | |||||||||||
Interest expense |
(62 | ) | (129 | ) | (79 | ) | (61 | ) | (209 | ) | ||||||
| | | | | | | | | | | | | | | | | |
Income before taxes |
40,918 | 91,117 | 52,375 | 44,201 | 85,689 | |||||||||||
Provision for income taxes |
15,991 | 35,962 | 19,657 | 17,218 | 33,836 | |||||||||||
| | | | | | | | | | | | | | | | | |
Net income |
$ | 24,927 | $ | 55,155 | $ | 32,718 | $ | 26,983 | $ | 51,853 | ||||||
| | | | | | | | | | | | | | | | | |
| | | | | | | | | | | | | | | | | |
The following table sets forth our consolidated statement of operations data for each of the periods presented as a percentage of revenue:
| |
Year Ended December 31, | Nine Months Ended September 30, |
||||||||||||||
|---|---|---|---|---|---|---|---|---|---|---|---|---|---|---|---|---|
| |
2011
|
2012
|
2013
|
2013
|
2014
|
|||||||||||
Revenue |
100 | % | 100 | % | 100 | % | 100 | % | 100 | % | ||||||
Expenses: |
||||||||||||||||
Cost of revenue |
43 | % | 34 | % | 41 | % | 41 | % | 31 | % | ||||||
Sales and marketing |
3 | % | 2 | % | 2 | % | 2 | % | 2 | % | ||||||
Research and development |
6 | % | 5 | % | 7 | % | 7 | % | 6 | % | ||||||
General and administrative |
26 | % | 24 | % | 27 | % | 26 | % | 23 | % | ||||||
Depreciation and amortization |
5 | % | 4 | % | 5 | % | 5 | % | 6 | % | ||||||
| | | | | | | | | | | | | | | | | |
Total operating expenses |
83 | % | 69 | % | 82 | % | 81 | % | 68 | % | ||||||
| | | | | | | | | | | | | | | | | |
Income from operations |
17 | % | 31 | % | 18 | % | 19 | % | 32 | % | ||||||
| | | | | | | | | | | | | | | | | |
Other income and (expenses): |
||||||||||||||||
Interest income |
— | — | — | — | — | |||||||||||
Interest expense |
— | — | — | — | — | |||||||||||
| | | | | | | | | | | | | | | | | |
Income before taxes |
17 | % | 31 | % | 18 | % | 19 | % | 32 | % | ||||||
| | | | | | | | | | | | | | | | | |
Provision for income taxes |
7 | % | 12 | % | 7 | % | 7 | % | 12 | % | ||||||
| | | | | | | | | | | | | | | | | |
Net income |
10 | % | 19 | % | 11 | % | 12 | % | 19 | % | ||||||
| | | | | | | | | | | | | | | | | |
| | | | | | | | | | | | | | | | | |
63
Nine Months Ended September 30, 2013 and 2014
Revenue
| |
Nine Months Ended September 30, |
Change | |||||||||||
|---|---|---|---|---|---|---|---|---|---|---|---|---|---|
| |
2013 | 2014 | $ | % | |||||||||
| |
(dollars in thousands) |
||||||||||||
Revenue |
$ | 231,264 | $ | 271,622 | $ | 40,358 | 18 | % | |||||
Revenue for the nine months ended September 30, 2014 increased by approximately $40.4 million, or 18%, compared to the nine months ended September 30, 2013. The increase was primarily attributable to an increase in revenue from new clients of $29.7 million along with a net increase of $10.7 million from existing clients.
Cost of Revenue
| |
Nine Months Ended September 30, |
Change | |||||||||||
|---|---|---|---|---|---|---|---|---|---|---|---|---|---|
| |
2013 | 2014 | $ | % | |||||||||
| |
(dollars in thousands) |
||||||||||||
Cost of revenue |
$ | 94,869 | $ | 85,065 | $ | (9,804 | ) | (10 | )% | ||||
Cost of revenue as a percentage of revenue |
41 | % | 31 | % | |||||||||
For the nine months ended September 30, 2014, cost of revenue decreased by $9.8 million, or 10%, compared to the nine months ended September 30, 2013. The $9.8 million decrease was driven by a $10.7 million reduction in employee-related expenses due to our continued focus on technology implementation, standardization of services, and operational process automation. The decrease was partially offset by an increase of $1.6 million in costs for third-party services which enable our data-driven intervention services. Cost of revenue as a percentage of revenue was 31% for the nine months ended September 30, 2014 compared to 41% for the nine months ended September 30, 2013. This decrease was primarily the result of revenue mix shifting toward more data-driven analytical solution activities from data-driven intervention services, which are more employee-intensive. Data analytics revenue as a percentage of total revenue was 56% for the nine months ended September 30, 2014 compared to 47% for the nine months ending September 30, 2013.
Sales and Marketing
| |
Nine Months Ended September 30, |
% Change | |||||||||||
|---|---|---|---|---|---|---|---|---|---|---|---|---|---|
| |
2013 | 2014 | $ | % | |||||||||
| |
(dollars in thousands) |
||||||||||||
Sales and marketing |
$ | 4,597 | $ | 5,355 | $ | 758 | 17 | % | |||||
Sales and marketing as a percentage of revenue |
2 | % | 2 | % | |||||||||
In the nine months ended September 30, 2014, sales and marketing expenses increased by $0.8 million, or 17%, compared to the nine months ended September 30, 2013. The increase primarily was attributable to an increase in marketing expense associated with our annual client conference of $0.3 million and employee related costs of $0.4 million.
64
Research and Development
| |
Nine Months Ended September 30, |
% Change | |||||||||||
|---|---|---|---|---|---|---|---|---|---|---|---|---|---|
| |
2013 | 2014 | $ | % | |||||||||
| |
(dollars in thousands) |
||||||||||||
Research and development |
$ | 16,171 | $ | 17,376 | $ | 1,205 | 8 | % | |||||
Research and development as a percentage of revenue |
7 | % | 6 | % | |||||||||
For the nine months ended September 30, 2014, research and development expense increased by $1.2 million, or 8%, compared to the nine months ended September 30, 2013. The increase was primarily attributable to a $0.7 million increase in third-party software developer fees, together with an increase of $0.3 million in employee related costs.
General and Administrative
| |
Nine Months Ended September 30, |
Change | |||||||||||
|---|---|---|---|---|---|---|---|---|---|---|---|---|---|
| |
2013 | 2014 | $ | % | |||||||||
| |
(dollars in thousands) |
||||||||||||
General and administrative |
$ | 60,266 | $ | 62,920 | $ | 2,654 | 4 | % | |||||
General and administrative as a percentage of revenue |
26 | % | 23 | % | |||||||||
For the nine months ended September 30, 2014, general and administrative expense increased by approximately $2.7 million, or 4%, compared to the nine months ended September 30, 2013. The increase was primarily attributable to an increase in professional fees of $1.3 million, software licensing and maintenance expenses of $0.3 million, occupancy costs of $0.3 million and employee related costs of $0.5 million.
Depreciation and Amortization
| |
Nine Months Ended September 30, |
Change | |||||||||||
|---|---|---|---|---|---|---|---|---|---|---|---|---|---|
| |
2013 | 2014 | $ | % | |||||||||
| |
(dollars in thousands) |
||||||||||||
Depreciation and amortization |
$ | 11,105 | $ | 15,012 | $ | 3,907 | 35 | % | |||||
Depreciation and amortization as a percentage of revenue |
5 | % | 6 | % | |||||||||
For the nine months ended September 30, 2014, depreciation and amortization expense increased by approximately $3.9 million, or 35%, compared to the nine months ended September 30, 2013. The increase in depreciation and amortization expense primarily was attributable to an increase in amortization expense of capitalized software of $3.4 million as a result of accelerating amortization on software expected to be decommissioned due to the successful development of a next generation software service.
Provision for Income Taxes
| |
Nine Months Ended September 30, |
Change | |||||||||||
|---|---|---|---|---|---|---|---|---|---|---|---|---|---|
| |
2013 | 2014 | $ | % | |||||||||
| |
(dollars in thousands) |
||||||||||||
Provision for income taxes |
$ | 17,218 | $ | 33,836 | $ | 16,618 | 97 | % | |||||
Effective tax rate |
39 | % | 39 | % | |||||||||
65
Income tax expense for the nine months ended September 30, 2014 increased by approximately $16.6 million, or 97%, compared to the nine months ended September 30, 2013. The increase in period-over-period income tax expense was attributable to our increase in income from operations resulting from our increase in revenues and our decrease in cost of revenue. Our effective income tax rate for the nine months ended September 30, 2014 remained relatively stable at 39% as compared to the same period in 2013.
Years Ended December 31, 2011, 2012 and 2013
Revenue
| |
Year Ended December 31, | 2011 to 2012 Change |
2012 to 2013 Change |
|||||||||||||||||||
|---|---|---|---|---|---|---|---|---|---|---|---|---|---|---|---|---|---|---|---|---|---|---|
| |
2011 | 2012 | 2013 | $ | % | $ | % | |||||||||||||||
| |
(dollars in thousands) |
|||||||||||||||||||||
Total revenue |
$ | 239,685 | $ | 300,275 | $ | 295,798 | $ | 60,590 | 25 | % | $ | (4,477 | ) | (1 | )% | |||||||
2013 Compared to 2012. Revenue during the year ended December 31, 2013 decreased by approximately $4.5 million, or 1%, as compared to the year ended December 31, 2012. The decrease was primarily attributable to a client's decision to discontinue several integrated solution engagements during the second quarter of 2013 subsequent to an acquisition by the client. This resulted in a year-over-year reduction of revenue of approximately $38.9 million. The aforementioned decrease was almost entirely offset by an increase in revenue from new clients of $9.1 million along with a net increase of $25.3 million from other existing clients.
2012 Compared to 2011. Revenue during the year ended December 31, 2012 increased by approximately $60.6 million, or 25%, as compared to the year ended December 31, 2011. The increase was primarily driven by an increase in revenue from new clients of $38.2 million along with a net increase of $22.4 million (inclusive of a $21.9 million discontinuation of a service offering) from existing clients.
Cost of Revenue
| |
Year Ended December 31, | 2011 to 2012 Change |
2012 to 2013 Change |
|||||||||||||||||||
|---|---|---|---|---|---|---|---|---|---|---|---|---|---|---|---|---|---|---|---|---|---|---|
| |
2011 | 2012 | 2013 | $ | % | $ | % | |||||||||||||||
| |
(dollars in thousands) |
|||||||||||||||||||||
Cost of revenue |
$ | 102,695 | $ | 101,188 | $ | 120,054 | $ | (1,507 | ) | (1 | )% | $ | 18,866 | 19 | % | |||||||
Cost of revenue as a percentage of revenue |
43 | % | 34 | % | 41 | % | ||||||||||||||||
2013 Compared to 2012. Cost of revenue during the year ended December 31, 2013 was $120.0 million, or 41% of revenue, which represented a year-over-year increase of approximately $18.9 million, or 19%, over our cost of revenue of $101.2 million, or 34% of revenue, during the year ended December 31, 2012. The increase was attributable primarily to increased employee-related costs of $11.0 million, as well as increased costs for third-party services which enable our data-driven intervention services of $6.8 million. Cost of revenue as a percentage of revenue increased as a result of management's conscious decision to not fully implement certain cost reduction strategies as a result of a client loss but rather substantially maintain its cost infrastructure to support anticipated near-term revenue growth driven by demand for analytics and data-driven intervention services in association with the launch of the Federal and State commercial exchanges.
66
2012 Compared to 2011. Cost of revenue for the year ended December 31, 2012 was approximately $101.2 million, or 34% of revenue, which represented a year-over-year decrease of approximately $1.5 million over our cost of revenue of approximately $102.7 million, or 43% of revenue, during the year ended December 31, 2011. The improvement in the costs of revenue as a percentage of revenue was attributable to a decrease in employee related costs of $14.2 million, partially offset by an increase of $12.9 million in costs for third-party services which enable our data-driven intervention services.
Sales and Marketing
| |
Year Ended December 31, | 2011 to 2012 % Change |
2012 to 2013 % Change |
|||||||||||||||||||
|---|---|---|---|---|---|---|---|---|---|---|---|---|---|---|---|---|---|---|---|---|---|---|
| |
2011 | 2012 | 2013 | $ | % | $ | % | |||||||||||||||
| |
(dollars in thousands) |
|||||||||||||||||||||
Sales and marketing |
$ | 6,752 | $ | 6,793 | $ | 5,952 | $ | 41 | — | $ | (841 | ) | (12 | )% | ||||||||
Sales and marketing as a percentage of revenue |
3 | % | 2 | % | 2 | % | ||||||||||||||||
2013 Compared to 2012. In 2013, sales and marketing expense decreased by $0.8 million, or 12%, compared to 2012. The decrease was primarily attributable to costs associated with a corporate rebranding initiative of $1.3 million incurred in 2012, which was not incurred again in 2013, partially offset by additional investments in conference and advertising activities of $0.4 million in 2013.
2012 Compared to 2011. In 2012, sales and marketing expenses remained constant compared to 2011. During 2012, we incurred costs associated with a corporate rebranding initiative of $1.3 million, partially offset by lower employee-related costs of $0.6 million, lower advertising and marketing costs of $0.4 million, and lower travel related costs of $0.2 million.
Research and Development
| |
Year Ended December 31, | 2011 to 2012 % Change |
2012 to 2013 % Change |
|||||||||||||||||||
|---|---|---|---|---|---|---|---|---|---|---|---|---|---|---|---|---|---|---|---|---|---|---|
| |
2011 | 2012 | 2013 | $ | % | $ | % | |||||||||||||||
| |
(dollars in thousands) |
|||||||||||||||||||||
Research and development |
$ | 14,855 | $ | 15,499 | $ | 21,192 | $ | 644 | 4 | % | $ | 5,693 | 37 | % | ||||||||
Research and development as a percentage of revenue |
6 | % | 5 | % | 7 | % | ||||||||||||||||
2013 Compared to 2012. In 2013, research and development expenses increased by $5.7 million, or 37%, compared to 2012. The increase was primarily attributable to a $5.6 million increase in employee-related costs.
2012 Compared to 2011. In 2012, research and development expenses increased by $0.6 million, or 4%, compared to 2011. The increase was attributable to an increase in third-party software developer costs.
67
General and Administrative
| |
Year Ended December 31, | 2011 to 2012 Change |
2012 to 2013 Change |
|||||||||||||||||||
|---|---|---|---|---|---|---|---|---|---|---|---|---|---|---|---|---|---|---|---|---|---|---|
| |
2011 | 2012 | 2013 | $ | % | $ | % | |||||||||||||||
| |
(dollars in thousands) |
|||||||||||||||||||||
General and administrative |
$ | 63,184 | $ | 72,661 | $ | 80,638 | $ | 9,477 | 15 | % | $ | 7,977 | 11 | % | ||||||||
General and administrative as a percentage of revenue |
26 | % | 24 | % | 27 | % | ||||||||||||||||
2013 Compared to 2012. During the year ended December 31, 2013, general and administrative expense increased by approximately $8.0 million, or 11%, compared to the year ended December 31, 2012. The year-over-year increase in general and administrative expense was driven primarily by an increase in employee-related expenses of approximately $5.7 million as a result of growth in average employee headcount during 2013 as compared to 2012 in order to manage new customer additions and expected future revenue growth.
2012 Compared to 2011. During the year ended December 31, 2012, general and administrative expense increased by approximately $9.5 million, or 15%, compared to the year ended December 31, 2011. This increase was driven by increased employee-related costs of approximately $9.5 million as a result of increased headcount to manage realized and expected revenue growth.
Depreciation and Amortization
| |
Year Ended December 31, | 2011 to 2012 Change | 2012 to 2013 Change |
|||||||||||||||||||
|---|---|---|---|---|---|---|---|---|---|---|---|---|---|---|---|---|---|---|---|---|---|---|
| |
2011 | 2012 | 2013 | $ | % | $ | % | |||||||||||||||
Depreciation and amortization |
$ | 11,229 | $ | 12,899 | $ | 15,517 | $ | 1,670 | 15 | % | $ | 2,618 | 20 | % | ||||||||
Depreciation and amortization as a percentage of revenue |
5 | % | 4 | % | 5 | % | ||||||||||||||||
2013 Compared to 2012. Depreciation and amortization during the year ended December 31, 2013 increased approximately $2.6 million, or 20%, compared to the year ended 2012. The increase was attributable primarily to an increase of $2.6 million of amortization expense from capitalized software.
2012 Compared to 2011. Depreciation and amortization during the year ended December 31, 2012 increased approximately $1.7 million, or 15%, compared to the year ended 2011. The increase was attributable primarily to an increase of amortization expense from capitalized software of $1.2 million.
Provision for Income Taxes
| |
Year Ended December 31, | 2011 to 2012 Change |
2012 to 2013 Change |
|||||||||||||||||||
|---|---|---|---|---|---|---|---|---|---|---|---|---|---|---|---|---|---|---|---|---|---|---|
| |
2011
|
2012
|
2013
|
$
|
%
|
$
|
%
|
|||||||||||||||
| |
(dollars in thousands) |
|||||||||||||||||||||
Provision for income taxes |
$ | 15,991 | $ | 35,962 | $ | 19,657 | $ | 19,971 | 125 | % | $ | (16,305 | ) | (45 | )% | |||||||
Effective tax rate |
39 | % | 39 | % | 38 | % | ||||||||||||||||
68
2013 Compared to 2012. Our provision for income taxes during the year ended December 31, 2013 was approximately $19.7 million compared to approximately $36.0 million during the year ended December 31, 2012. Our effective income tax rate was 38% for the year ended December 31, 2013 compared to 39% for the year ended December 31, 2012. The decrease in our effective income tax rate was due primarily to the recognition of the 2012 and 2013 federal research and development tax credits during the year ended December 31, 2013 and a decrease in state income taxes.
2012 Compared to 2011. Our provision for income taxes during the year ended December 31, 2012 was approximately $36.0 million compared to approximately $16.0 million during the year ended December 31, 2011. Our effective income tax rate was 39% for both 2012 and 2011. The approximately $20.0 million increase in our provision for income taxes during the year ended December 31, 2012 as compared to the year ended December 31, 2011 was due primarily to our increase in income from operations resulting from our increase in revenues and our decrease in cost of revenue.
Quarterly Results of Operations
The following table sets forth our unaudited consolidated statement of operations data for each of the seven quarters in the period ended September 30, 2014. The unaudited quarterly statement of operations data set forth below have been prepared on a basis consistent with our audited annual consolidated financial statements and include, in our opinion, all normal recurring adjustments necessary for a fair statement of the financial information contained in those statements. Our historical results are not necessarily indicative of the results that may be expected in the future. The following quarterly financial data should be read in conjunction with our audited consolidated financial statements and the related notes included elsewhere in this prospectus.
We typically experience the highest level of revenue in the second quarter of each year, which coincides with specific accreditation and regulatory deadlines. See "Management's Discussion and
69
Analysis of Financial Condition and Results of Operations — Trends and Factors Affecting Our Future Performance — Seasonality."
| |
Three Months Ended | |||||||||||||||||||||
|---|---|---|---|---|---|---|---|---|---|---|---|---|---|---|---|---|---|---|---|---|---|---|
Consolidated Statement of Operations Data:
|
March 31, 2013 |
June 30, 2013 |
September 30, 2013 |
December 31, 2013 |
March 31, 2014 |
June 30, 2014 |
September 30, 2014 |
|||||||||||||||
| |
(unaudited, in thousands) |
|||||||||||||||||||||
Revenue |
$ | 75,036 | $ | 81,224 | $ | 75,004 | $ | 64,534 | $ | 84,674 | $ | 100,957 | $ | 85,991 | ||||||||
Expenses: |
||||||||||||||||||||||
Cost of revenue |
32,210 | 33,278 | 29,381 | 25,185 | 28,587 | 28,899 | 27,579 | |||||||||||||||
Sales and marketing |
1,087 | 1,982 | 1,528 | 1,355 | 1,333 | 1,612 | 2,410 | |||||||||||||||
Research and development |
5,673 | 5,248 | 5,250 | 5,021 | 6,048 | 5,144 | 6,184 | |||||||||||||||
General and administrative |
20,892 | 20,006 | 19,368 | 20,372 | 19,934 | 21,341 | 21,645 | |||||||||||||||
Depreciation and amortization |
3,529 | 3,642 | 3,934 | 4,412 | 4,855 | 5,114 | 5,043 | |||||||||||||||
| | | | | | | | | | | | | | | | | | | | | | | |
Total operating expenses |
63,391 | 64,156 | 59,461 | 56,345 | 60,757 | 62,110 | 62,861 | |||||||||||||||
| | | | | | | | | | | | | | | | | | | | | | | |
Income from operations |
11,645 | 17,068 | 15,543 | 8,189 | 23,917 | 38,847 | 23,130 | |||||||||||||||
| | | | | | | | | | | | | | | | | | | | | | | |
Other income and (expenses): |
||||||||||||||||||||||
Interest income |
3 | 2 | 1 | 3 | 2 | 1 | 1 | |||||||||||||||
Interest expense |
(16 | ) | (24 | ) | (21 | ) | (18 | ) | (13 | ) | (49 | ) | (147 | ) | ||||||||
| | | | | | | | | | | | | | | | | | | | | | | |
Income before taxes |
11,632 | 17,046 | 15,523 | 8,174 | 23,906 | 38,799 | 22,984 | |||||||||||||||
Provision for income taxes |
4,532 | 6,640 | 6,046 | 2,439 | 9,349 | 15,169 | 9,318 | |||||||||||||||
| | | | | | | | | | | | | | | | | | | | | | | |
Net income |
$ | 7,100 | $ | 10,406 | $ | 9,477 | $ | 5,735 | $ | 14,557 | $ | 23,630 | $ | 13,666 | ||||||||
| | | | | | | | | | | | | | | | | | | | | | | |
| | | | | | | | | | | | | | | | | | | | | | | |
Other Financial Data |
||||||||||||||||||||||
Adjusted EBITDA(1) |
$ | 16,146 | $ | 22,372 | $ | 19,816 | $ | 13,513 | $ | 29,412 | $ | 44,989 | $ | 28,658 | ||||||||
| | | | | | | | | | | | | | | | | | | | | | | |
| | | | | | | | | | | | | | | | | | | | | | | |
- (1)
- The following table presents a reconciliation of net income to Adjusted EBITDA for each of the periods indicated:
| |
Three Months Ended | |||||||||||||||||||||
|---|---|---|---|---|---|---|---|---|---|---|---|---|---|---|---|---|---|---|---|---|---|---|
| |
March 31, 2013 |
June 30, 2013 |
September 30, 2013 |
December 31, 2013 |
March 31, 2014 |
June 30, 2014 |
September 30, 2014 |
|||||||||||||||
| |
(unaudited, in thousands) |
|
||||||||||||||||||||
Reconciliation of net income to Adjusted EBITDA: |
||||||||||||||||||||||
Net income |
$ | 7,100 | $ | 10,406 | $ | 9,477 | $ | 5,735 | $ | 14,557 | $ | 23,630 | $ | 13,666 | ||||||||
Depreciation and amortization |
3,529 | 3,642 | 3,934 | 4,412 | 4,855 | 5,114 | 5,043 | |||||||||||||||
Interest expense |
16 | 24 | 21 | 18 | 13 | 49 | 147 | |||||||||||||||
Interest (income) |
(3 | ) | (2 | ) | (1 | ) | (3 | ) | (2 | ) | (1 | ) | (1 | ) | ||||||||
Provision for income taxes |
4,532 | 6,640 | 6,046 | 2,439 | 9,349 | 15,169 | 9,318 | |||||||||||||||
| | | | | | | | | | | | | | | | | | | | | | | |
EBITDA |
15,174 | 20,710 | 19,477 | 12,601 | 28,772 | 43,961 | 28,173 | |||||||||||||||
Stock-based compensation |
736 | 285 | 387 | 434 | 386 | 436 | 518 | |||||||||||||||
Other non-comparable items |
236 | 1,377 | (48 | ) | — | — | — | — | ||||||||||||||
Professional service fees |
— | — | — | 478 | 254 | 592 | (33 | ) | ||||||||||||||
| | | | | | | | | | | | | | | | | | | | | | | |
Adjusted EBITDA |
$ | 16,146 | $ | 22,372 | $ | 19,816 | $ | 13,513 | $ | 29,412 | $ | 44,989 | $ | 28,658 | ||||||||
| | | | | | | | | | | | | | | | | | | | | | | |
| | | | | | | | | | | | | | | | | | | | | | | |
70
Liquidity and Capital Resources
The following table presents a summary of our cash flow activity for the periods set forth below (in thousands):
| |
Year Ended December 31, | Nine Months Ended September 30, |
||||||||||||||
|---|---|---|---|---|---|---|---|---|---|---|---|---|---|---|---|---|
| |
2011 | 2012 | 2013 | 2013 | 2014 | |||||||||||
Consolidated Statements of Cash Flows Data: |
||||||||||||||||
Net cash provided by operating activities |
$ | 46,184 | $ | 53,705 | $ | 66,015 | $ | 45,288 | $ | 49,848 | ||||||
Net cash used in investing activities |
$ | (12,859 | ) | $ | (15,084 | ) | $ | (18,863 | ) | $ | (14,310 | ) | $ | (17,608 | ) | |
Net cash used in financing activities |
$ | (18,641 | ) | $ | (47,132 | ) | $ | (42,919 | ) | $ | (26,448 | ) | $ | (10,887 | ) | |
Sources of Liquidity
Our principal source of liquidity has been cash generated by operating activities. Our cash generated from operations has been sufficient to fund our growth, including our capital expenditures. Additionally, our cash generation has allowed us to repurchase certain amounts of our outstanding stock and pay dividends to our stockholders in the amount of $421.0 million from January 1, 2011 through September 30, 2014. In addition, on September 19, 2014, we redeemed $300.0 million of our common stock with proceeds from our Term Loan Facility. This redemption occurred at a price per share of $27.01, which was in excess of the estimated fair value of our common stock of $19.89 per share as of September 30, 2014 calculated for the purpose of determining our stock-based compensation expense. Prior to this redemption, we had not historically incurred debt nor have we recently generated liquidity through equity sales. As of September 30, 2014, we had a cash and cash equivalent balance of $131.9 million.
We believe our current cash and cash equivalent balance, expected cash generated by operating activities and availability under our Credit Facilities (defined below) is sufficient to fund our liquidity needs for the foreseeable future.
Debt
On September 19, 2014, we and our subsidiaries entered into the Credit Agreement. The terms of the Credit Agreement provide for credit facilities in the aggregate maximum principal amount of $400.0 million, consisting of the Term Loan Facility and the Revolving Credit Facility. Proceeds of the Revolving Credit Facility may be used for our working capital and general corporate purposes. The obligations under the Credit Facilities are guaranteed by our domestic, wholly owned subsidiaries. The Credit Facilities contain customary affirmative and negative covenants, including limitations on negative pledges and liens. In addition, under the Credit Agreement, we are required to maintain certain minimum liquidity levels ($50.0 million while the Term Loan Facility remains available, or, if the Term Loan Facility has been repaid, $20.0 million), measured at the end of each of our fiscal quarters. In addition, our ability to incur debt is subject to compliance with a 4.00 to 1.00 leverage ratio under certain circumstances. The Credit Agreement also contains certain mandatory prepayment requirements in connection with certain assets sales and customary events of default, including as a result of certain specified change of control events.
Term Loan Facility
We utilized the entire principal amount of the Term Loan Facility to redeem approximately 8.33% of our Class B common stock on a pro rata basis. As of September 30, 2014, the principal amount outstanding under the Term Loan Facility was $300.0 million. The Term Loan Facility has a
71
five-year term. The Term Loan Facility is an amortizing facility and payments of principal and interest are payable quarterly, beginning March 31, 2015. The outstanding principal amount of the Term Loan Facility will amortize as follows: $15.0 million in year one, $15.0 million in year two, $26.3 million in year three, $41.3 million in year four, and the remaining principal balance in year five. The interest rate for the Term Loan Facility is LIBOR plus 1.25% per annum or the base rate plus 0.25% per annum (at our election).
Revolving Credit Facility
Borrowings under the Revolving Credit Facility will become available, subject to compliance with the terms and conditions set forth in the Credit Agreement, beginning (at our option) at any time after (a) the consummation of this offering or (b) the date on which the aggregate principal amount of Term Loans then outstanding is not greater than $200.0 million. The Revolving Credit Facility is scheduled to mature on March 31, 2020. The interest rate for the Revolving Credit Facility is LIBOR plus 1.25% per annum or the base rate plus 0.25% per annum (at our election).
Cash Flows
Operating Activities
Cash provided by operating activities consisted of net income adjusted for certain non-cash items, including depreciation and amortization, stock-based compensation, and deferred income taxes, as well as the effect of changes in working capital and other activities.
Cash provided by operating activities in the nine months ended September 30, 2014 was approximately $49.8 million, an increase in cash inflow of approximately $4.6 million compared to the nine months ended September 30, 2013. Cash provided by operating activities was driven by net income of approximately $51.9 million and an increase of approximately $15.0 million of non-cash depreciation and amortization expenses, partially offset by increased accounts receivable of approximately $18.6 million.
Cash provided by operating activities during the year ended December 31, 2013 was approximately $66.0 million, an increase of approximately $12.3 million compared to the year ended December 31, 2012. Cash provided by operating activities was driven by net income of approximately $32.7 million, as adjusted for the exclusion of non-cash expenses totaling approximately $17.3 million, and the effect of changes in working capital and other balance sheet accounts resulting in cash inflows of approximately $66.0 million.
Cash provided by operating activities during the year ended December 31, 2012 was approximately $53.7 million, an increase in cash inflow of approximately $7.5 million compared to the year ended December 31, 2011. Cash provided by operating activities was driven by net income of approximately $55.2 million, as adjusted for the exclusion of non-cash expenses totaling approximately $15.5 million and the effect of changes in working capital and other balance sheet accounts.
Investing Activities
Our primary investing activities consisted of purchases of property and equipment, investments in internally developed capitalized software, and leasehold improvements for our facilities.
Cash used in investing activities in the nine months ended September 30, 2014 was approximately $17.6 million, an increase in cash outflow of approximately $3.3 million compared to the nine months ended September 30, 2013. The slight increase in cash outflow was due to an increase in the investment in capitalized software of approximately $3.8 million, which was partially offset by a decrease in purchases of property and equipment of approximately $0.5 million.
72
Cash used in investing activities during the year ended December 31, 2013 was approximately $18.9 million, an increase in cash outflow of approximately $3.8 million compared to the year ended December 31, 2012. The increase in cash outflow was primarily due to the purchase of property and equipment of approximately $9.2 million during the year ended December 31, 2013 as compared to approximately $5.5 million during the year ended December 31, 2012.
Cash used in investing activities during the year ended December 31, 2012 was approximately $15.1 million, an increase in cash outflow of approximately $2.2 million compared to the year ended December 31, 2011. The increase in cash outflow was due to an increase in investment in capitalized software of approximately $3.8 million, which was partially offset by a decrease in purchases of property and equipment of approximately $1.6 million.
Financing Activities
Our primary financing activities have consisted of private sales of common stock resulting from stock option exercises by employees. In 2011, 2012, and 2013 and the nine months ended September 30, 2013 and 2014, we paid dividends to our stockholders in the aggregate amount of $18.6 million, $47.0 million $23.5 million, $6.4 million, and $2.9 million, respectively. Additionally, in 2013 and for the nine months ended September 30, 2014, we completed a net repurchase of our common stock of $20.0 million and $309.1 million, respectively.
Cash used in financing activities during the nine months ended September 30, 2014 was approximately $10.9 million, a decrease of approximately $15.6 million in cash outflow compared to the nine months ended September 30, 2013. The cash used in financing activities during the nine months ended September 30, 2014 is primarily comprised of $309.1 million for the repurchase of common stock, and $2.9 million for the payment of previously declared dividends, partially offset by $300.0 million from proceeds of the Term Loan and $0.7 million from the exercise of employee stock options.
Cash used in financing activities during the year ended December 31, 2013 was approximately $42.9 million, a decrease in cash outflow of approximately $4.2 million compared to the year ended December 31, 2012. The decrease in cash outflow was primarily due to the net repurchase of common stock of $20.0 million, which was offset by a decrease in dividends paid of approximately $23.5 million.
Cash provided by financing activities during the year ended December 21, 2012 was approximately $47.1 million, an increase in cash outflow of approximately $28.5 million compared to the year ended December 31, 2011. The increase in cash outflow was primarily due to an increase in dividends paid of approximately $28.4 million in the year ended December 31, 2012 compared to the year ended December 31, 2011.
Off Balance Sheet Arrangements
We do not have any off-balance sheet arrangements and did not have any such arrangements in the nine months ended September 30, 2014 or during the years ended December 31, 2011, 2012 and 2013.
Contractual Obligations
Our principal commitments consist of obligations under capital and operating leases for equipment, office space, and co-located data center facilities. The following table summarizes our commitments to settle contractual obligations in cash as of December 31, 2013. The following table does not reflect our new $300.0 million Term Loan Facility, which matures in 2019. The outstanding principal amount of the Term Loan Facility will amortize as follows: $15.0 million in year one,
73
$15.0 million in year two, $26.3 million in year three, $41.3 million in year four, and the remaining principal balance in year five.
| |
Payments Due by Period | |||||||||||||||
|---|---|---|---|---|---|---|---|---|---|---|---|---|---|---|---|---|
| |
(in thousands) |
|||||||||||||||
| |
Total
|
Less than 1 year |
1-3 years
|
3-5 years
|
More than 5 years |
|||||||||||
Operating lease obligations |
$ | 32,328 | $ | 7,564 | $ | 13,007 | $ | 10,913 | $ | 844 | ||||||
| | | | | | | | | | | | | | | | | |
| | | | | | | | | | | | | | | | | |
Our existing operating lease agreements may provide us with the option to renew. Our future operating lease obligations would change if we entered into additional operating lease agreements and if we exercised renewal options.
Contractual obligations represent future cash commitments and liabilities under agreements with third parties, and exclude purchase orders for goods and services. Purchase orders are not included in the table above. Our purchase orders represent authorizations to purchase rather than legally binding agreements. The contractual commitment amounts in the table above are associated with agreements that are legally binding and enforceable, and that specify all significant terms, including fixed or minimum services to be used, fixed, minimum or variable price provisions and the approximate timing of the transaction.
Critical Accounting Policies and Estimates
We prepare our consolidated financial statements in accordance with GAAP. The preparation of these consolidated financial statements requires us to make estimates and assumptions that affect our reported amounts of assets, liabilities, revenue and expenses, as well as related disclosures. To the extent that there are material differences between these estimates and actual results, our financial condition or operating results would be affected. We base our estimates on past experience and other assumptions that we believe are reasonable under the circumstances, and we evaluate these estimates on an ongoing basis. We refer to accounting estimates of this type as critical accounting policies and estimates, which we discuss further below.
Revenue Recognition
We recognize revenue when it is realized (or realizable) and earned (i.e., when services have been rendered or delivery of applicable deliverables has occurred). This occurs when persuasive evidence of an arrangement exists, the product or service has been performed or delivered, fees are fixed or determinable, and collection is reasonably assured. When collectability is not reasonably assured, revenue is recognized when cash is collected. Cash collections and invoices generated in excess of revenue recognized are recorded as deferred revenue until the revenue recognition criteria are met.
We primarily derive our revenue from sales of our data analytics and data-driven intervention platform services. We allocate revenue to our data-driven analytics and data-driven intervention platform services using the relative selling price method. We have generally been unable to establish vendor-specific objective evidence of fair value and, while we continually seek third-party evidence of fair value, meaningful data have generally been unavailable as our services are unique and visibility into our competitors' pricing is unavailable. As a result, we use our best estimate of selling price to allocate arrangement consideration to its contractual service elements.
We have determined an estimated selling price by considering several external and internal factors, including, but not limited to pricing practices, margin objectives, competition, customer
74
demand, internal costs, and overall economic trends. Generally, the best estimate of selling price is consistent with the contractual arrangement fee for each element.
Revenue is recognized as cloud-based data analytics and data-driven intervention services are performed and information is delivered to clients, which generally align with our right to invoice our clients. Cloud-based data analytics services are considered performed when gaps in care, quality, data integrity, or financial performance, and summarized key analytics and benchmarking analytics reports are delivered to its clients, provided that all contractual performance requirements and other revenue recognition criteria are met. Data-driven intervention services are considered performed upon the completion of each medical record data abstraction and review service, encounter decision support, encounter facilitation, outbound telephonic and written communication, and supplemental patient encounter service, provided that all contractual performance requirements and other revenue recognition criteria are met.
We also enter into multiple-element software arrangements, which are recognized under ASC 985-605, Software Revenue Recognition, when a software subscription license is provided to customers. Under these arrangements, we provide post-contract support, including help desk support and unspecified upgrades. Vendor-specific objective evidence of fair value has not been established for maintenance as maintenance is not renewed separately from the license fees. As a result, under these subscription software license agreements, we recognize revenue from the license of software ratably over the life of the agreement. We begin to recognize revenue upon execution of a signed agreement and delivery of the software, provided that the software license fees are fixed and determinable, and collection of the resulting receivable is reasonably assured.
Certain of our arrangements entitle a client to receive a refund if we fail to satisfy contractually specified performance obligations. The refund is limited to a portion or all of the consideration paid. In this case, revenue is recognized when any and all performance obligations are satisfied.
We maintain an allowance, charged to revenue, which reflects our estimated future billing adjustments resulting from client concessions or resolutions of billing disputes.
Income Taxes
We account for income taxes using the asset and liability approach, which requires the recognition of deferred tax assets and liabilities related to the expected future tax consequences of events that have been recognized between financial reporting and income tax reporting. We measure deferred tax assets and liabilities using enacted tax rates expected to apply to taxable income in the years in which those temporary differences are expected to be recovered or settled.
We make estimates, assumptions and judgments to determine our provision for income taxes and also for deferred tax assets and liabilities and any valuation allowances recorded against our deferred tax assets. We assess the likelihood that our deferred tax assets will be recovered from future taxable income and, to the extent we believe that recovery is not likely, we establish a valuation allowance.
We have adopted ASC 740-10, Accounting for Uncertainty in Income Taxes, that prescribes a recognition threshold of more-likely-than-not, and a measurement attribute for all tax positions taken or expected to be taken on a tax return, in order for those positions to be recognized in the financial statements. We continually review tax laws, regulations and related guidance in order to properly record any uncertain tax liability positions. We adjust these reserves in light of changing facts and circumstances.
75
Stock-Based Compensation
All stock-based award transactions, including employee stock option grants, are measured and recognized in the financial statements at fair value as of the grant date in accordance with ASC 718, Compensation — Stock Compensation. We estimate the fair value of each award on the grant date using the Black-Scholes option pricing model. We recognize stock-based compensation expense, net of estimated forfeitures based on historical and anticipated turnover data, using the straight-line basis over the service period of the applicable award, which is generally five years.
The Black-Scholes option-pricing model requires the input of estimates, including the fair market value of our common stock, the expected volatility of the price of our common stock, expected life, the risk free interest rate, and the expected dividend yield of our common stock. The input assumptions used in the Black-Scholes option-pricing model represent management's best estimates. These estimates involve inherent uncertainties and the application of management's judgment. If factors change and different assumptions are used, the amount of stock-based compensation expense could be materially different in the future.
We estimate the expected volatility of our stock options by using data for several unrelated public companies within our industry that are considered to be comparable to our company and for which historical information was available. The average expected term was determined under the simplified calculation as provided by the SEC Staff's Accounting Bulletin No. 107, Share-Based Payment, which is the mid-point between the vesting date and the end of the contractual term. We determine the risk-free interest rate by reference to the U.S. Treasury yield curve rates with the remaining term commensurate with the expected life assumed at the date of grant. The dividend yield assumption of zero is based upon the fact that we do not have a formal dividend payment policy, we do not intend to continue to pay cash dividends on our common stock in the future, and, to the extent we pay dividends in the future, there is no assurance that any such dividends will be comparable to those previously declared. We estimate the forfeiture rate of our stock-based awards based on historical experience and adjustments are made annually to reflect actual forfeiture experience. We will continue to use judgment in evaluating the assumptions related to our stock-based compensation on a prospective basis. As we continue to accumulate additional data related to our common stock, we may have refinements to our estimates, which could materially impact our future stock-based compensation expense.
Since January 2013, we have granted options to purchase shares of common stock as follows:
Grant date
|
Number of options granted |
Option exercise price(s) |
Fair value of common stock per share(1) |
Fair value of common stock option per share(2) |
Grant date fair value |
|||||||||||
|---|---|---|---|---|---|---|---|---|---|---|---|---|---|---|---|---|
| |
|
|
|
|
(in thousands) |
|||||||||||
January 2013 |
16,955 | $ | 6.42 | $ | 7.44 | $ | 3.62 | $ | 61 | |||||||
April 2013 |
97,540 | 7.44 | 7.12 | 3.01 | 293 | |||||||||||
May 2013 |
75,045 | 7.74 | 7.12 | 2.92 | 219 | |||||||||||
August 2013 |
40,785 | 7.12 | 6.68 | 2.85 | 116 | |||||||||||
September 2013 |
628,880 | 6.68 - 7.12 | 6.68 | 2.83 - 2.99 | 1,863 | |||||||||||
October 2013 |
184,655 | 6.68 - 7.12 | 6.64 | 2.79 - 2.80 | 516 | |||||||||||
November 2013 |
57,095 | 7.12 | 6.64 | 2.79 | 159 | |||||||||||
December 2013 |
146,030 | 6.64 | 6.64 | 2.96 | 432 | |||||||||||
May 2014 |
1,153,185 | 7.03 - 7.50 | 13.17 | 8.13 - 8.36 | 9,403 | |||||||||||
August 2014 |
491,535 | 7.89 | 16.89 | 11.23 | 5,519 | |||||||||||
- (1)
- The
fair value of common stock per share is used for the purpose of determining stock-based compensation expense for financial reporting purposes.
- (2)
- The weighted average grant date value of the options granted were calculated using the Black-Scholes option pricing model used to record stock-based compensation expense.
76
Valuation of Our Common Stock
Historical valuations of our common stock were determined in accordance with the guidelines outlined in the American Institute of Certified Public Accountants Practice Aid, Valuation of Privately-Held-Company Equity Securities Issued as Compensation. Given the absence of a public trading market for our common stock, we exercised reasonable judgment and considered all relevant objective and subjective factors and circumstances known at the time of each valuation, which were used to determine the fair value of our common stock. The factors considered in determining the fair value of our common stock include, but are not limited to, the following:
- •
- contemporaneous valuations of our common stock performed by an unrelated third-party specialist;
- •
- our actual operating and financial performance;
- •
- current business conditions and projections;
- •
- developments in the business;
- •
- the lack of marketability of our common stock;
- •
- our share repurchase arrangements;
- •
- the status of our sales efforts;
- •
- anticipated revenue growth rates;
- •
- valuations of comparable companies;
- •
- the overall economic and industry conditions and outlook; and
- •
- additional objective and subjective factors relating to our business.
In valuing our common stock, our compensation committee determines the equity value of our business generally using a combination of the income approach and the market approach, and then discounts these amounts for the lack of marketability and minority interest ownership considerations of our common stock.
We estimate fair value under the income approach based on the present value of the discounted future cash flows that we anticipate to generate into perpetuity. We determine our discount rate using an average cost of capital of unrelated public companies within our industry as of each valuation date, adjusted to reflect the inherent risks in our future cash flow projections.
We estimate fair value using the comparable company market approach based on our comparison to several unrelated public companies and recent acquisitions of companies within our industry that we consider to be comparable to us. From these unrelated companies, we determine a representative market value multiple, which we apply to our revenue, earnings before interest and taxes, and EBITDA amounts.
In January 2015, we reevaluated our determinations of the fair value of our common stock as of March 31, June 30, and September 30, 2014. In connection with this evaluation, we also received revised valuations of our common stock as of each of such dates from our unrelated third-party specialist. Based upon this evaluation, we determined to adjust the fair value of our common stock as of each of these dates as reflected in the table above. Accordingly, we will recognize additional stock-based compensation expense related to these option grants in the fourth quarter of 2014 and in future years over the vesting periods of the related options. We have determined that this additional stock-based compensation expense of approximately $0.3 million with respect to the nine months ended September 30, 2014 is not material to our financial statements for the nine months ended September 30, 2014, fourth quarter of 2014, and fiscal year ended December 31, 2014. As a
77
result of these adjustments, it was determined that the fair value of our common stock exceeded the exercise prices at which our May 2014 and August 2014 option grants were granted.
A brief narrative of the specific factors considered by our compensation committee in determining the fair value of our common stock as of the date of grant is set forth below.
December 31, 2012 Valuation
We determined the fair value of our common stock to be $7.44 per share as of December 31, 2012. Our estimated fair market valuation applied 55% weighting to an income approach, which considered the present value of the discounted future cash flows that we estimated to generate into perpetuity at that point in time, and a 45% weighting to the comparable company market approach, which considered comparable companies' trailing and forward revenue, earnings before interest and taxes, and respective EBITDA multiples and our actual and forward estimate amounts. We then applied a lack of marketability discount of 26% and minority interest discount of 20% to arrive at the fair value of our common stock as of December 31, 2012.
March 31, 2013 Valuation
We determined the fair value of our common stock to be $7.12 per share as of March 31, 2013. Our estimated fair market valuation applied 55% weighting to an income approach, which considered the present value of the discounted future cash flows that we estimated to generate into perpetuity at that point in time, and a 45% weighting to the comparable company market approach, which considered comparable companies' trailing and forward revenue, earnings before interest and taxes, and EBITDA respective multiples and our actual and forward estimate amounts. We then applied a lack of marketability discount of 26% and minority interest discount of 20% to arrive at the fair value of our common stock as of March 31, 2013.
June 30, 2013 Valuation
We determined the fair value of our common stock to be $6.68 per share as of June 30, 2013. Our estimated fair market valuation applied 55% weighting to an income approach, which considered the present value of the discounted future cash flows that we estimated to generate into perpetuity at that point in time, and a 45% weighting to the comparable company market approach, which considered comparable companies' trailing and forward revenue, earnings before interest and taxes, and respective EBITDA multiples and our actual and forward estimate amounts. We then applied a lack of marketability discount of 24% and minority interest discount of 20% to arrive at the fair value of our common stock as of June 30, 2013.
September 30, 2013 Valuation
We determined the fair value of our common stock to be $6.64 per share as of September 30, 2013. Our estimated fair market valuation applied 55% weighting to an income approach, which considered the present value of the discounted future cash flows that we estimated to generate into perpetuity at that point in time, and a 45% weighting to the comparable company market approach, which considered comparable companies' trailing and forward revenue, earnings before interest and taxes, and respective EBITDA multiples and our actual and forward estimate amounts. We then applied a lack of marketability discount of 24% and minority interest discount of 20% to arrive at the fair value of our common stock as of September 30, 2013.
December 31, 2013 Valuation
We determined the fair value of our common stock to be $7.03 per share as of December 31, 2013. Our estimated fair market valuation applied 55% weighting to an income approach, which considered the present value of the discounted future cash flows that we estimated to generate into
78
perpetuity at that point in time, and a 45% weighting to the comparable company market approach, which considered comparable companies' trailing and forward revenue, earnings before interest and taxes, and respective EBITDA multiples and our actual and forward estimate amounts. We then applied a lack of marketability discount of 23% and minority interest discount of 20% to arrive at the fair value of our common stock as of December 31, 2013.
March 31, 2014 Valuation
We determined the fair value of our common stock to be $12.44 per share as of March 31, 2014. Our estimated fair market valuation applied 55% weighting to an income approach, which considered the present value of the discounted future cash flows that we estimated to generate into perpetuity at that point in time, and a 45% weighting to the comparable company market approach, which considered comparable companies' trailing and forward revenue, earnings before interest and taxes, and respective EBITDA multiples and our actual and forward estimate amounts. We then applied a lack of marketability discount of 23% to arrive at the fair value of our common stock as of March 31, 2014.
June 30, 2014 Valuation
We determined the fair value of our common stock to be $13.89 per share as of June 30, 2014. Our estimated fair market valuation applied 35% weighting to an income approach, which considered the present value of the discounted future cash flows that we estimated to generate into perpetuity at that point in time, and a 65% weighting to the comparable company market approach, which considered comparable companies' trailing and forward revenue, earnings before interest and taxes, and respective EBITDA multiples and our actual and forward estimate amounts. We then applied a lack of marketability discount of 24% to arrive at the fair value of our common stock as of June 30, 2014.
September 30, 2014 Valuation
We determined the fair value of our common stock to be $19.89 per share as of September 30, 2014. Our estimated fair market valuation applied 20% weighting to an income approach, which considered the present value of the discounted future cash flows that we estimated to generate into perpetuity at that point in time, and a 80% weighting to the comparable company market approach, which considered comparable companies' trailing and forward revenue, earnings before interest and taxes, and respective EBITDA multiples and our actual and forward estimate amounts. We then applied a lack of marketability discount of 10% to arrive at the fair value of our common stock as of September 30, 2014.
Goodwill
Goodwill represents the excess of acquisition costs over the fair value of tangible net assets and identifiable intangible assets of the businesses acquired. Goodwill is not amortized. Goodwill is subject to impairment testing annually as of December 31st, or whenever events or changes in circumstances indicate that the carrying amount may not be fully recoverable. Our impairment tests are based on a single operating segment and reporting unit structure. This test compares a reporting unit's carrying value to its fair value. If the fair value of the reporting unit exceeds the carrying value of the net assets, including goodwill assigned to that reporting unit, goodwill is not impaired. If the carrying value of the reporting unit's net assets, including goodwill, exceeds the fair value of the reporting unit, then we are required to determine the implied fair value of the reporting unit's goodwill. If the carrying value of a reporting unit's goodwill exceeds its implied fair value, then an impairment loss is recorded for the difference between the carrying amount and the implied fair value of the goodwill.
79
As of September 30, 2014, we had goodwill of approximately $62.3 million, which represented 20% of our consolidated total assets. There are many assumptions and estimates used that directly impact the results of impairment testing, including an estimate of future expected revenues, earnings and cash flows, the determination of reporting unit(s), and discount rates applied to such expected cash flows in order to estimate fair value. The determination of whether or not goodwill has become impaired involves a significant level of judgment in the assumptions and estimates underlying the approach used to determine the value of our reporting unit. Actual results could differ from management's estimates, and such differences could be material to our consolidated financial position and results of operations.
The fair value of our reporting unit significantly exceeded its respective carrying value at December 31, 2013, and we concluded the recoverability of goodwill would not have been impacted by a 10% change in fair value. Accordingly, we did not record any goodwill impairments amounts for any period presented.
JOBS Act Accounting Election
We are an "emerging growth company," as defined in the Jumpstart Our Business Startups Act of 2012, or the JOBS Act. Under the JOBS Act, emerging growth companies can delay adopting new or revised accounting standards issued subsequent to the enactment of the JOBS Act until such time as those standards apply to private companies. We have irrevocably elected not to avail ourselves of this exemption from new or revised accounting standards and, therefore, will be subject to the same new or revised accounting standards as other public companies that are not emerging growth companies.
Recently Issued Accounting Standards
In July 2013, the Financial Accounting Standards Board, or the FASB, issued authoritative guidance containing changes to the presentation of an unrecognized tax benefit when a loss or credit carry forward exists. This statement is effective for financial statements issued for annual periods beginning after December 15, 2013, with early adoption permitted. Adoption of the standard is not expected to materially impact our financial position, results of operations, or cash flows.
In May 2014, the FASB issued updated guidance on revenue from contracts with customers. This revenue recognition guidance supersedes existing GAAP guidance, including most industry-specific guidance. The core principle is that an entity should recognize revenue to depict the transfer of promised goods or services to customers in an amount that reflects the consideration to which the entity expects to be entitled in exchange for those goods or services. The guidance identifies steps to apply in achieving this principle. This updated guidance is effective for fiscal years, and interim periods within those fiscal years, beginning after December 15, 2016. We are currently evaluating the potential impact of this guidance on our financial disclosures and results, including whether we elect retrospective, or modified retrospective, adoption methods.
In June 2014, the FASB issued stock compensation guidance requiring that a performance target that affects vesting and that could be achieved after the requisite service period be treated as a performance condition. The amendments in this guidance are effective for fiscal years, and interim periods within those fiscal years, beginning after December 15, 2015. We are currently evaluating the potential impact of this guidance on our financial disclosures and results.
Quantitative and Qualitative Disclosures about Market Risk
Market risk includes risks that arise from changes in interest rates, equity prices and other market changes that affect market sensitive instruments. Our primary market risk exposure is to changes in interest rates on our variable rate debt, which includes our Term Loan and our Revolving Credit Facility. As of the date of this prospectus, we had $300.0 million outstanding under our Term Loan at an effective interest rate of 1.4%. As a result, if market interest rates were to increase by 1.0%, or 100 basis points, interest expense would decrease future earnings and cash flows, net of estimated tax benefits, by approximately $1.8 million annually, assuming that we do not enter into contractual hedging arrangements.
80
We are a leading technology company that combines advanced cloud-based data analytics and data-driven intervention platforms to achieve meaningful insight and improvement in clinical and quality outcomes, utilization, and financial performance across the healthcare landscape. Our powerful platform drives high-value impact, improving quality and economics for health plans, hospitals, physicians, patients, pharmaceutical companies, and researchers. The value we deliver to our clients is achieved by turning data into insights and those insights into action. Through our large proprietary datasets, advanced integration technologies, sophisticated predictive analytics, and deep subject matter expertise, we deliver seamless, end-to-end platforms that bring the benefits of big data and large-scale analytics to the point of care. Our analytics identify gaps in care, quality, data integrity, and financial performance, while providing clients with differentiated capabilities to resolve these gaps. During 2014, we provided these services to more than 100 clients representing approximately 200 patient populations, providing analytics informed by our data and insight on more than 754,000 physicians, 248,000 clinical facilities, 120 million unique patients (covering approximately 98.2% of all U.S. counties), and 9.2 billion medical events, a number that has been increasing at a rate of approximately 3.0% compounding monthly, or 42.6% annually, since 2000.
Healthcare costs in the United States have been increasing significantly for many years, currently approaching almost $3 trillion annually. This rise in healthcare costs has driven a broad transition from consumption-based payment models to value-based payment models across the healthcare landscape. As a result, the specific disease and comorbidity status, clinical and quality outcomes, resource utilization, and care details of the individual patient have become increasingly relevant to the various constituents of the healthcare delivery system. Concurrently, the count and complexity of diseases, diagnostics, and treatments — let alone payment models and regulatory oversight requirements — have soared. In this setting, granular data has become critical to determining and improving quality and financial performance in healthcare.
We believe that the opportunity before us is substantial as data increasingly becomes the lynchpin in healthcare — from clinical quality outcomes and financial performance, to the consumer experience and drug discovery. A January 2013 McKinsey report estimates that utilizing data analytics could drive improvements in healthcare resulting in a beneficial economic impact of $300 billion to $450 billion annually. As a reflection of the increasing need for data analytics, in the last several years, our advanced analytics and data-driven intervention platforms have been driving significant economic impact through improvements in clinical and quality outcomes, disease and comorbidity data accuracy, and utilization, achieving hundreds of millions of dollars per year in quantified beneficial financial improvement for our clients.
At the core of our enabling capabilities is a long history of innovation and profitable growth, positioning us to deliver value to our clients and capitalize on the confluence of recent changes in the healthcare industry that many describe as historically unprecedented. Our ability to rapidly innovate is enabled by the depth and breadth of our industry expertise, large-scale proprietary datasets, advanced analytical prowess, highly flexible platform components, a common native code base, and experience across the entire healthcare landscape.
The value we deliver to our clients through our data analytics and intervention platforms are comprised of four primary components:
- •
- Data Integration: Highly efficient and effective data assimilation of structured and unstructured healthcare data in any format from highly disparate and disconnected sources;
81
- •
- Advanced Analytics: Data analysis using big-data
processing to yield highly actionable insights identifying gaps in care, quality, data integrity, and financial performance;
- •
- Intervention Platforms: Software and services that allow
our clients to take the insights derived from our analytics to address and resolve the identified gaps in care, quality, data integrity, and financial performance;
- •
- Business Processing: Powerful business intelligence tools that summarize key analytics and benchmarking information as well as a comprehensive claims data warehouse that helps our clients comply with government mandated reporting requirements.
Our ability to deliver value to our clients through our advanced analytics and intervention platforms has allowed us to achieve significant growth since our company's organization. Over the last three years, our revenue has increased at a compounded annual growth rate of 19%, Adjusted EBITDA at a compounded annual growth rate of 20%, and net income at a compounded annual growth rate of 33%. For the nine months ended September 30, 2014, our revenue was $271.6 million, representing 17% growth over the same period of the prior year. In this same period, we generated Adjusted EBITDA of $103.1 million, representing 38% of revenue and 77% growth over the same period in the prior year. Net income for the nine months ended September 30, 2014 was $51.9 million, representing 19% of revenue and a 92% increase over the same period in 2013. Adjusted EBITDA is a non-GAAP measure. For a reconciliation of Adjusted EBITDA to net income, see "Selected Consolidated Financial Data."
Industry Overview
We believe that the increasing demand for our platform is driven by the confluence of four fundamental healthcare industry trends:
Unsustainable Rise in Healthcare Costs. Rising healthcare expenditures are widely recognized to be at the core of several challenges facing the United States, including the nation's long-term fiscal gap. Healthcare spending in the U.S. was almost $3 trillion in 2012, or more than 17% of GDP, according to CMS's 2012 National Health Expenditure Highlights, up substantially from the share of 10% of GDP in 1985. Under the 2014 set of extended baseline projections from the CBO, national healthcare spending is projected to increase further to approximately 22% of GDP by 2039. According to an August 2013 Henry J. Kaiser Family Foundation report, the average annual family health insurance premium in 2013 was 29% higher than the average family health insurance premium in 2008 and 80% higher than the average family health insurance premium in 2003. To address this expected substantial rise in healthcare costs, the U.S. healthcare market is seeking more effective methods of delivering care, leading to a transformation in payment models and care delivery. This same trend is also playing out across modernized nations around the globe.
Shift to Value-Based Healthcare. The traditional fee-for-service reimbursement model in healthcare has played a major role in elevating both the level and growth rate of healthcare spending. In response, both the public and private sectors are shifting away from the historical fee-for-service models. In the public sector, rising healthcare costs and tight government budgets have driven both federal and state government agencies to expand the role of value-based, capitated payment models through programs such as Medicare Advantage and managed Medicaid. These programs are designed to incentivize value and quality at an individual patient level. Both federal and state governments are also directly trying to influence the payment model by promoting Accountable Care Organizations, or ACOs, including Medicare Shared Savings Programs and bundled payments, which shift the incentives for practice groups away from volume and toward quality and value. The private sector is acting in parallel, with private payors setting up their own accountable care and bundled payment structures with practice groups, and employers seeking to control costs through the creation of private healthcare exchanges, which have already been
82
embraced by several large employers, including Sears, Darden Restaurants, Walgreens and Aramark. As quality and value-based care also takes hold in the pharmaceutical industry, manufacturers will need to better understand the efficacy, cost, and benefit of products currently in the market, explore new business models, and have better data to assess the commercial viability of new products.
Since the emergence of fixed payment models and quality outcomes reporting in the early 1990s, the progressive expansion of capitated payment models, oversight regulations, and private sector focus on value-based healthcare has been significant and hallmarked by a substantial number of transformative events at the federal, state, private-sector, and consumer sentiment level. The implementation of the Affordable Care Act has been just one among several changes in how managed care reforms have been implemented in the U.S. As seen in the figure below, the number of Americans covered by capitated payment programs has been increasing rapidly and, according to industry sources and our internal estimates, is anticipated to increase from approximately 80 million at the start of 2014 to over 150 million by 2019. This increase is expected to further drive the critical importance to accurately measure, analyze, report, and improve patient disease and comorbidity conditions, utilization rates, and clinical quality outcomes. This increase has been caused by not just one event but multiple events over time, many of which are illustrated in the figure below.
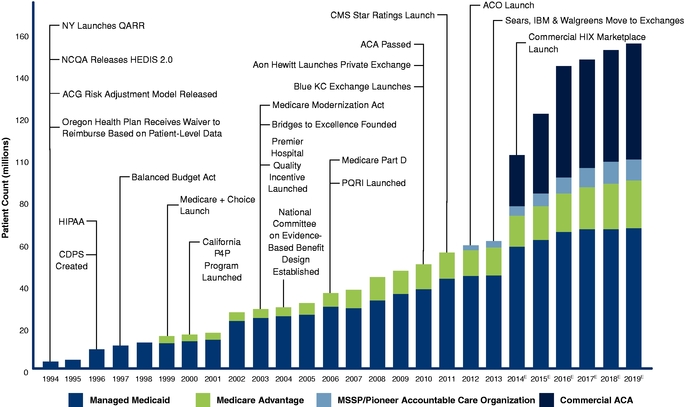
- (1)
- New York Launches Quality Assurance Reporting Requirements — New York developed
its own set of Quality Assurance Reporting Requirements (QARR), which includes a number of HEDIS measures as well as state-specific quality measures focusing on effectiveness, access/availability, and
satisfaction with care as well as utilization and information on quality improvement initiatives.
- (2)
- HEDIS 2.0 — Healthcare Effectiveness Data and Information Set (HEDIS) is a standardized set of performance measures that could be used by various constituencies to compare health plans and help
83
drive quality improvement in the market. In 1993, Version 2.0 of HEDIS known as the "Health Plan Employer Data and Information Set" was released by National Committee for Quality Assurance
- (3)
- Adjusted Clinical Groups Risk Adjustment Model — Released in 1992, the Adjusted Clinical Groups
system is an industry standard risk adjustment and predictive modeling software originally developed by faculty at the Johns Hopkins Bloomberg School of Public Health.
- (4)
- Oregon Healthplan Waiver to Reimburse Based on Patient Level Data — The Oregon Health Plan, or
OHP, was implemented by creating a prioritized list of diagnosis-treatment pairs in order to ensure that benefit reductions eliminate only the least effective and least valuable treatments. Because
Medicaid services were to be provided through managed care plans under the OHP, the Oregon Medical Assistance Program (OMAP) acquired a federal waiver, which allowed the state to require Medicaid
recipients to enroll in capitated managed care plans to improve access to care and control costs in comparison to traditional Medicaid plans.
- (5)
- The Health Insurance Portability and Accountability Act (HIPAA) — HIPAA is the federal Health
Insurance Portability and Accountability Act of 1996. The primary goal of the law is to make it easier for people to keep health insurance, protect the confidentiality and security of healthcare
information and help the healthcare industry control administrative costs.
- (6)
- The Chronic Illness and Disability Payment System (CDPS) — The Chronic Illness and Disability
Payment System is a diagnostic classification system that Medicaid programs can use to make health-based capitated payments for Temporary Assistance for Needy Families (TANF) and disabled Medicaid
beneficiaries.
- (7)
- Balanced Budget Act — The Balanced Budget Act of 1997 was an omnibus legislative package enacted
using the budget reconciliation process and designed to balance the federal budget by 2002. The law contained major Medicare reforms.
- (8)
- Medicare + Choice — The Medicare + Choice program is the name for
managed care provider options to the traditional Medicare Part A and Part B programs. A Medicare beneficiary may choose to participate in this Medicare program instead of the traditional
Medicare program.
- (9)
- California P4P Program — The California Pay for Performance program is the largest
non-governmental physician incentive program in the United States and was founded in 2001.
- (10)
- Medicare Modernization Act — The Medicare Prescription Drug, Improvement, and Modernization Act
(also called the Medicare Modernization Act or MMA) is a federal law enacted in 2003. It produced the largest overhaul of Medicare in the public health program's 38-year history, the most important
being the introduction of an entitlement benefit for prescription drugs through tax breaks and subsidies.
- (11)
- Bridges to Excellence — A family of programs by Health Care Incentives Improvement Institute to
reward recognized physicians, nurse practitioners, and physician assistants who meet certain performance measures.
- (12)
- Premier Hospital Quality Incentive — Premier Hospital Quality Incentive Demonstration is a CMS
program for improving quality of inpatient care by awarding quality data on the CMS website. The demonstration rewards participating top performing hospitals by increasing their payment for Medicare
patients.
- (13)
- National Committee on Evidence Based Benefit Design — The National Committee on Evidence-Based
Benefit Design, established by National Business Group on Health, seeks to improve quality of care and promote value by using benefit design to encourage and reward effective care and discourage
ineffective care. The Committee is made up of large employers and national experts representing research, accreditation, physicians, health plans, and consumers.
- (14)
- Medicare Part D — The Part D drug benefit (also known as "Medicare Rx") helps Medicare beneficiaries to pay for outpatient prescription drugs purchased at retail, mail order, home infusion, and long-term care pharmacies. Medicare did not cover outpatient prescription drugs until January 1, 2006, when it implemented the Medicare Part D prescription drug benefit.
84
- (15)
- Physician Quality Reporting Initiative (PQRI) — A program sponsored by CMS to provide incentive
payments to physicians who choose to participate and successfully report on a designated set of quality measures for services paid under the Medicare Physician Fee Schedule and provided between
July 1 and December 31, 2007.
- (16)
- Affordable Care Act — The Patient Protection and Affordable Care Act, commonly called the
Affordable Care Act (ACA) or "Obamacare." The goals of the ACA are to increase the quality and affordability of health insurance, and to lower the uninsured rate by expanding public and private
insurance coverage.
- (17)
- Aon Hewitt Private Exchange — The first national multi-carrier fully insured private health
exchange, which offers group health insurance to employers with more than 100 workers who are not eligible to use the state or federally operated exchanges.
- (18)
- Blue KC Exchange — Blue Cross and Blue Shield of Kansas City launched the area's first private
insurance Exchange marketplace in November 2011, specifically designed to help small businesses manage their healthcare costs.
- (19)
- Centers for Medicare & Medicaid Star Ratings Launch — The Centers for Medicare &
Medicaid Services uses a five-star quality rating system to measure Medicare beneficiaries' experience with their health plans and the health care system and use the ratings for Medicare Advantage
plans to award quality-based bonus payments, beginning in 2012. This rating system applies to all Medicare Advantage lines of business: Health Maintenance Organizations (HMO), Preferred Provider
Organization (PPO), Private Fee-For-Service (PFFS), and prescription drug plans (PDP).
- (20)
- Accountable Care Organization Launch — Accountable Care Organizations (ACOs) are groups of
doctors, hospitals, and other health care providers, who come together voluntarily to give coordinated high quality care to the Medicare patients they serve. Coordinated care helps ensure that
patients, especially the chronically ill, get the right care at the right time, with the goal of avoiding unnecessary duplication of services and preventing medical errors.
- (21)
- Sears, IBM & Walgreens Move to Exchanges — Sears, IBM, and Walgreens have moved their
employees and retirees to private exchanges such as the Aon Hewitt and Extend Health.
- (22)
- Commercial HIX Marketplace Launch — Health insurance marketplaces, also called health exchanges, are organizations set up to facilitate the purchase of health insurance in each state in accordance with the ACA. Marketplaces provide a set of government-regulated and standardized health care plans from which individuals may purchase health insurance policies eligible for federal subsidies.
Digitization of Healthcare Information. Across the healthcare landscape, a significant amount of data is being created every day driven by patient care, payment systems, regulatory compliance, and record keeping. These data include information within patient health records, clinical trials, pharmacy benefit programs, imaging systems, sensors and monitoring platforms, laboratory results, patient reported information, hospital and physician performance programs, and billing and payment processing. Large amounts of these data continue to be stored on paper and processed manually. In this setting, significant investments are being made to digitize all parts of the healthcare landscape. For example, under HITECH, which was signed into law in 2009, the federal government committed $30 billion to incentivize healthcare practice groups to adopt electronic health records, or EHRs. The share of hospitals with at least a basic electronic health record system jumped from approximately 10% in 2008 to almost 60% by 2013, according to a 2014 Robert Wood Johnson Foundation report. Despite significant investments by public and private sources within the industry, however, the digitized healthcare data remain largely stored in "walled gardens" — data that is static and not easily shared or interpreted. Without clear standards for exchanging information between medical applications, the growing pool of important clinical data that is being generated is difficult to share and interpret. As the amount of data in healthcare continues to grow, we believe it will be critical for the healthcare industry to be able to use this disparate data to better achieve the goals of higher quality and more efficient costs of care.
85
Increasing Complexity. Healthcare is on a course of dramatically progressive complexity. As technology employed in the healthcare space has become increasingly sophisticated, new diagnostics and treatments have been introduced, the pool of clinical research has expanded, and the paradigms dictating payment and regulatory oversight have multiplied. In addition, physicians face an increasing number of options for addressing the complex needs of their patients who expect increasing personalization of their care. Over time, the number of diseases being described and sub-classified, diagnostic tests available, medication discoveries, and clinical research studies continue to rise. For example, with the introduction of the new ICD-10 coding framework in 2015, physicians are expected to characterize the specific conditions of patients among more than 90,000 discrete descriptions, a number that is up from nearly 15,000 under the existing ICD-9 framework. Furthermore, the New England Journal of Medicine reports that it receives close to 5,000 submissions for publication each year. This increasing breadth and depth of research, combined with the increased detail of how healthcare can be delivered and documented, is also expanding the amount of data and information available. Continuous interplay between technology and research is generating vast amounts of information that needs to be aggregated and analyzed in order to inform clinical decision-making which can help drive higher quality and more efficient care.
In addition, we believe that improved data analytics based off augmented datasets are further enabling improved treatment options. Beyond the depth and breadth of the science of healthcare itself, is the increased complexity in its payment, oversight, and regulation. Since the advent of risk adjustment, quality oversight, utilization monitoring, and compliance systems, the complexity continues to climb. Risk adjustment has introduced a broad set of payment-relevant systems that utilize over 15,000 disease classifications, a number which is expected to grow with the shift to ICD-10. Quality programs such as Healthcare Effectiveness Data and Information Set, or HEDIS, (which contains 83 measures of quality), Quality Assurance Reporting Requirements, or QARR (containing 67 measures), group practice reporting option (containing 33 measures) and Medicare's Star program (containing 46 measures) add further complexity. Describing the regulatory requirements surrounding these programs requires more than 20,000 pages. All these factors combined are resulting in an increasingly complex healthcare landscape where participants need to be equipped with the appropriate toolsets, so as to allow for intuitive information consumption in order to simplify and streamline decision making.
The shift to value-based healthcare combined with increasing digitization and complexity drives a growing and continuous need for analysis of the underlying and resulting data in order to inform clinical, research, and business decision-making with actionable, data-driven insights.
Problems Our Clients Face
As the U.S. healthcare market continues to transform, the aforementioned industry trends are driving fundamental changes in payment and delivery models, as well as technology requirements. These changes have set into motion a number of significant challenges faced by our clients. We believe that we are well-positioned and have the solutions to help clients not only adapt to, but thrive within, the new healthcare landscape.
Understanding and Improving Clinical Quality Outcomes. Quality and value-based, capitated programs are directly tied to clinical and quality outcomes which need to be measured at the individual patient level. These outcome requirements are designed to monitor a populations' compliance with industry accepted healthcare processes and healthcare outcomes goals, patients' satisfaction with the healthcare that they receive, and the effective operation of healthcare practice groups. Clinical and quality outcomes measurement programs require the detailed and highly granular reporting of the care sought and delivered to each patient within an overall population to allow for the accurate calculation of population quality metrics. Industry accreditation organizations such as NCQA, Utilization Review Accreditation Committee, or URAC, Pharmacy Quality Alliance, or
86
PQA, National Quality Forum, or NQF, and medical societies looking to provide thought leadership on behalf of their patients, produce quality measures utilized by the industry. These measures have been adopted directly or in modified versions by federal and state regulations, private sector employers, and in shared-risk and accountable care contracts, in ways that drive significant financial incentives and consequences in the setting of strong positive or negative performance respectively. The results of these quality measurements drive significant incentives and consequences, influencing more than an estimated $3 billion in quality-related payments annually.
Understanding the True Health Status of Patients. The ability to establish the appropriate treatment protocol among multiple physicians, ensure that patients are supported with the correct care resources, monitor for the proper patient-relevant quality metrics, and determine the overall population risk is contingent on the ability to become accurately aware of a patients' disease and comorbidity status. Additionally, inaccuracies in disease status awareness impede resource planning, provider network design efforts, and financial projections. Furthermore, new payment models are designed to adjust the payments based upon the overall population illness burden of the patients in any particular plan. This is known as risk adjustment payments. There are multiple risk adjustment payment models across Medicare Advantage, managed Medicaid, ACA Health Insurance Exchanges, or HIX, and private sector contracts. Risk adjustment also impacts ACO shared savings calculations. Risk adjustment payments are governed by a complex set of rules using thousands of diagnosis and procedure codes, depending on the specific risk adjustment model. All together, having detailed and highly granular reporting of the disease and comorbidities of each patient is essential for care, quality, and financial performance today.
Understanding and Improving Utilization. Utilization, which is the cost incurred in the delivery of care, has increasingly become a focus in healthcare. Within fixed payment models, the ability to pass cost increases onto customers has materially decreased or altogether disappeared. Under new legislation, health plans are required to submit data on the percentage of revenue collected from health insurance premiums that is spent on clinical services and quality improvement, which is also more commonly known as the MLR. The MLR rules are designed to ensure that premiums received by insurers are primarily spent towards patient care and not directed towards administrative activities or excess profit. If health plans fail to meet the MLR thresholds, they are required to rebate the customer. If the cost of care exceeds the MLR threshold, however, health plans must absorb the shortfall. Given the importance of accurately reporting the MLR and managing the underlying healthcare costs, many health plans enter into complex arrangements with key providers in their networks through shared risk arrangements and performance bonus programs to help manage costs, to drive improvements in patient health, and to achieve long-term utilization containment and quality goals. As a result, the MLR rules impact multiple constituents of the healthcare community, from payors and providers to pharmaceutical companies, PBMs, and other cost-center elements of the healthcare landscape.
Complying with Increasingly Complex Regulatory Requirements. Federal and state regulation and compliance is increasing and becoming ever more complex. The regulatory obligations are impacting the entire healthcare delivery landscape, from individual practice groups and payors, to process and technology support vendors, all with the responsibility to adequately protect the privacy of patients and the manner in which services are provided, payments are made, and data is utilized, among other goals. This regulatory burden is intense, with agencies at nearly every level of government regulating the activities of organizations participating within the healthcare marketplace. The breadth, complexity, and intensity of regulation require these organizations to focus nearly every activity through a compliance lens in order to meet the data-intensive regulatory reporting requirements.
87
Enabling and Empowering the Consumer. Historically, insurance companies did not offer healthcare plans directly to the consumer, but typically through larger programs sponsored by an employer or government agency. That has changed where now individuals can buy coverage, select clinicians and hospitals, and directly research implications of specific medications, procedures, and treatment courses. As a result, new solutions are put in place to assist the consumer. For example, the U.S. government has created a Five-Star Quality Rating system designed specifically to help consumers compare the quality of the different types of services a healthcare plan offers in order to make a more informed purchasing decision. Payors are now incentivized to engage with customers on an individual level and use the increasingly granular data around personal demographics and preferences to design new plans. Physicians and hospitals are now incentivized to pay attention to quality, cost, and outcome metrics which are increasingly available to consumers. In addition, through the advancement of technology, individuals are increasingly participating in the quantified-self movement in which they can self-monitor their key health metrics, creating immense amounts of new health data that can assist in providing higher quality care. This shift to a more informed and engaged consumer is resulting in new challenges and opportunities for how practice groups, payors, employers, pharmaceutical companies, retail pharmacies, and other healthcare constituents interact with consumers.
Unlocking the Value of Data through Actionable Interventions. The key commonality among the changes in the healthcare landscape is the importance of highly granular data. However, data by itself has limited usefulness without the right technology and systems in place to analyze and act on it and drive meaningful action. We believe that the leveraging of data is the critical differentiator for deriving meaningful insight and turning that insight into action to drive valuable impact across the healthcare landscape. However, in today's healthcare technology environment, much of this data goes unrecorded in a structured or meaningful way in paper based and electronic medical record systems, unintegrated with other pertinent data related to the patient's events or conditions, and unanalyzed for the purposes of driving improvements in care and affordability.
Easily Deploying and Interoperating Platforms at Scale. The ability to receive, seamlessly integrate, and accurately process extremely large-scale data flows efficiently and at high speeds is increasingly important and necessary for the healthcare industry. Data integration and processing in massive scale within the healthcare landscape is plagued by issues of highly disparate and "dirty" data characteristics. This is a significant barrier which prevents the various components of the healthcare landscape from effectively communicating and coordinating with one another to deliver higher quality care. For example, hospitals and insurance companies which have business across different states and markets face an increasingly uphill task of establishing an infrastructure and capability to assimilate, integrate and process all the disparate healthcare data they are generating. Despite billions of dollars in investment, the data and information systems resident within hospitals, physician practices, pharmacy benefit programs, urgent care centers, laboratory systems, and the other components of the healthcare landscape remain largely disconnected from each other. Interoperability frequently requires systems that add additional cost, time delay, or actions outside of the ordinary workflow. Overcoming this in scale is integral to managing large patient populations efficiently and effectively.
The need to fully aggregate, organize, integrate, and analyze healthcare data — and translate the resulting insight into actionable and meaningful impact — is a critical challenge that the healthcare industry will continue to face for years to come. Our platform provides a solution to help address our clients' challenges and drive meaningful improvements in the clinical quality outcomes and financial performance across a wide expanse of our society's healthcare landscape.
88
Our Market Opportunity
We believe that our opportunity is significant and growing. According to a January 2013 McKinsey report, utilizing data analytics could reduce healthcare costs in the United States by $300 billion to $450 billion, or 12% to 17% of the total U.S. healthcare costs today. The McKinsey illustration below, from a January 2013 report, describes the five key areas where using advanced analytics can impact the healthcare system.
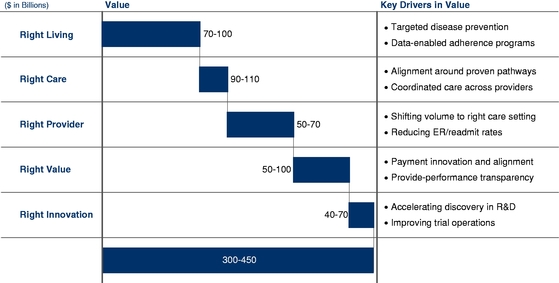
The ability to aggregate, integrate, and analyze data in massive scale and apply garnered insights in a manner that achieves meaningful impact is crucial for healthcare payors (e.g., health plans and integrated health delivery systems), clinical providers (e.g., hospitals, ACOs, and physicians), pharmaceutical and life sciences companies, and consumers. We estimate that our addressable market for these capabilities serving these healthcare constituents to be approximately $83.8 billion. We believe that the market opportunity for our current platform offering within the payor market, the historical focus of our company, is approximately $10.6 billion. This does not include our current platform offering being applied to other segments of the market, in which, with respect to clinical providers and pharmaceutical and life sciences companies, we have begun to provide, and are actively providing, services to clients. According to industry sources, the market for software and related services is approximately $14.0 billion within the U.S. payor market. We believe that as analytics continue to demonstrate greater value within the U.S. payor landscape, the market will expand commensurately. As we continue to build and launch new capabilities, we believe it will provide a significantly larger value opportunity within this same payor space. For providers, industry sources estimate that software and related services represent a $32.3 billion U.S. market size. In the global pharmaceutical and life-sciences market, IDC, in a 2013 report, estimates a $30.9 billion market size for total software and services spend in 2013. In the consumer market an October 2013 Research and Markets report estimates a $6.6 billion global market size for mobile health
89
applications and solutions. As with our other market segments, we believe that analytics will also drive a significant expansion in the consumer market.
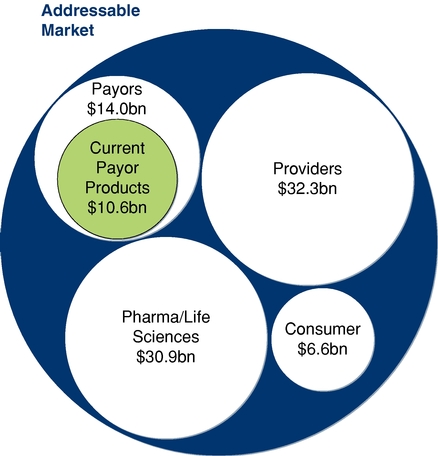
In addition, the pressures that face the U.S. healthcare market are not unique, as other communities around the world are facing aging populations and growing pressures in the sustainable affordability of healthcare. With aging populations, an increase in those inflicted with chronic ailments that require more healthcare spending, government initiatives to increase the access to care in both industrialized and emerging markets, and treatment advancements expected to drive sector expansion, the pressure to reduce healthcare costs is escalating. We believe that our capabilities are highly applicable to other developed and developing countries around the globe, which we believe presents a significant future opportunity for us.
Our Platforms
Our platforms are informed by deep clinical insights through our combination of industry-leading subject matter expertise and extensive proprietary datasets. Through the application of our
90
platforms, we help our clients achieve large-scale insight and meaningful improvement in clinical and quality outcomes, utilization, and financial performance.
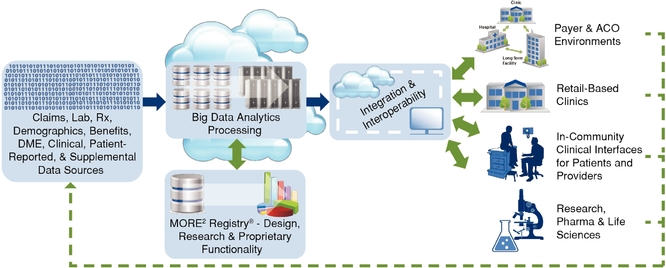
In deploying our technology, our clients want us to synthesize opaque, convoluted, and disparate data into actionable information aligned with individualized goals and, in turn, empower a patient and provider intervention platform that achieves the realization of their goals in a measurable way. The diagram below illustrates the components of our technology platforms.
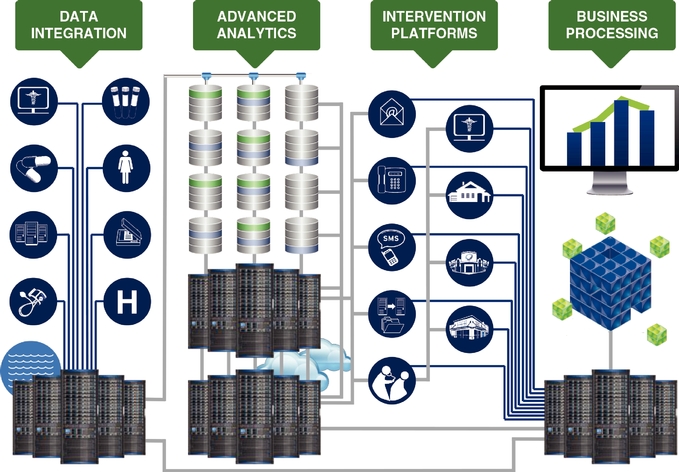
91
Our platforms' capabilities are currently engaged by nearly 100 clients supporting approximately 200 patient populations that leverage our ability to analyze and improve clinical and quality outcomes and financial performance. These platforms are applied in a variety of environments with many additional applications of the technologies being planned.
Data Integration. Datasets and the management of data are part of our core strengths, which give us insight into how a patient, provider, or population is doing. It grants us both relative and absolute insight, and informs the construction of new capabilities, predictive models, and impact predictions. It speeds our time to client impact, decreases the burden on clients choosing to do business with us, and empowers our achievement of mission and results.
We believe that our enterprise-scale data integration and management processes are a critical capability in achieving a material improvement in clinical quality outcomes and financial performance in healthcare. We integrate data seamlessly and securely into our systems through our proprietary ETL tools and processes. This system manages the process of defining and configuring thousands of industry data feeds from our clients and partners (depicted in the second diagram on page 86 above as EHR, laboratory, pharmacy, patient reported, claims, paper-based medical records, biometric, and hospital data feeds respectively, as examples), manages the data processing workflow, and monitors the ongoing provision and quality of data through the application of more than 2,000 data integrity checks.
In addition to being maintained and tagged within client-specific data lakes, data we receive in the course of providing our services are statistically de-identified and stored in our MORE2 Registry. As of December 31, 2014, this registry contained more than 9.2 billion medical events from more than 120 million unique patients, 754,000 physicians, and 248,000 clinical facilities, touching 98.2% of all U.S. counties and Puerto Rico and growing at a rate of approximately 42.6% annually since 2000. The MORE2 Registry goes beyond just claims data to include information about demographics, enrollment, diagnoses, procedures, pharmacy, laboratory results, and deep medical record clinical data and presents a significant representative mix of commercial, HIX Marketplace, Medicare Advantage, and managed Medicaid care plan patients. The following is a sample of various components within our MORE2 Registry.
• Patient Demographic Data |
• Benefits Data |
||
• Medical Record Documentation |
• Encounter and Procedural Data |
||
• Operating Room, Procedure, |
• Pharmacy Data |
||
Discharge Summary, |
• Imaging Report Data |
||
Emergency Room Records |
• Laboratory & Pathology Data |
||
• Electronic Health Record Data |
• Durable Medical Equipment Data |
||
• Health Risk Assessment Data |
• Self-Reported Data |
||
• Practitioner Profile Data |
• Social History Data |
||
• Claim Diagnostic Data |
• Activities of Daily Living (ADL) |
||
• Eligibility and Enrollment Data |
• Cost Data |
Advanced Analytics. For years we have developed, honed, and scaled a portfolio of sophisticated analytics. Applying our team's deep subject matter expertise in compute processing, data architecture, statistics, medical sciences, healthcare policy, and leveraging the billions of medical events within our significant propriety datasets, we believe that we have developed one of the most advanced analytical platforms within the industry, as well as a culture and set of analytical toolsets that serve to rapidly innovate and expand our platform. Examples of the innovative analytics powered by this combination of data and processing capabilities include:
- •
- Disease and comorbidity presence and closure probability determination analytics: Arriving at an accurate understanding, documentation, and codification of the disease states of patients is critical. In addition, through a proper understanding of each patient's needs, care
92
- •
- Clinical and quality outcomes gap presence and closure probability determination
analytics: Every patient, whether healthy or acutely, or chronically ill, needs a specific set of preventative or treatment-based
healthcare services in periods specific to each patient's clinical profile. Additionally, patients with specific conditions, such as diabetes, need specific elements of care such as blood sugar
testing, medication compliance, and examinations to detect complications of diabetes. Standards within the industry around quality of care have been created by organizations such as NCQA, URAC, PQA,
NQF, and medical societies looking to provide thought leadership on behalf of their patients. In order to help guide patients and their physicians in addressing the preventative care and treatment
needs of each patient, our predictive analytics are employed to determine each patient's clinical profile, their compliance with treatment protocols and quality measure standards, and how these match
up to established quality standards. Further, our analytics are not only focused on determining accurate quality measure profiles, but also on predicting which measures that are unfulfilled today will
become resolved on their own by the actions of the patient or provider independent of any new intervention. Not only do these analytics empower better quality care, but they make care more cost
effective, by suggesting the avoidance of unnecessary testing, diagnostics, or treatment, that may not benefit the patient or change the patient's clinical course based upon historical patient
behavior.
- •
- Medication compliance and persistence analytics: Critical
management of many chronic conditions is the effective utilization of prescription drugs to stabilize disease progression, ease symptoms, and facilitate healing. However, many barriers exist to
patients reliably filling their prescriptions and taking the medications that their physician has prescribed, including the cost of treatment, the side effects of treatment, and the patient's
engagement in the treatment process. In order to determine which patients are the most likely to achieve compliance with their prescribed treatment, the least likely, and susceptible to influence, we
apply predictive models that examine patients against their historical behavior patterns and clinical profiles to guide the right resources to the right patient in order to maximize medication
compliance and persistence.
- •
- Principally Relevant Provider (PRP) determination analytics: In order to best engage a patient with the healthcare delivery system, it is important to identify the physician whom the patient considers to be his or her PRP with respect to specific issues needing attention. Particularly important for patients with chronic conditions or complex issues that see multiple physicians, the determination of which physician possesses the greatest bond can make a significant difference when seeking to assist the patient with resolution of an identified concern. In some cases, for instance, the patient's health plan assigned primary care provider may or may not be the physician that has established a trusted care provider relationship with the patient. Rather, a patient's key specialist may be most applicable to
can be more effectively guided and delivered, quality achieved, and financial implications understood. In order to guide the efficient use of resources to clarify the disease state of each patient across the landscape of tens of thousands of codes, analytics are employed to predictively determine whether a disease or comorbidity is being overlooked or is progressing at a rate or severity otherwise not noted. Analytics that transcend a single point in time, location, or point of view to take into consideration a more holistic view both in absolute terms (i.e. solely with the patient data in mind) and relative terms (i.e. taking into consideration millions of other similar and different cases) can be achieved. In addition to determining the potential presence of specific disease and comorbidities, our analytics can be applied to determine the statistical probability of successfully confirming and resolving such a potential gap between known and suspected disease conditions. In this way, resource prioritization can be achieved.
93
- •
- Targeted intervention timing optimization
analytics: While the clinical lives of patients always present opportunities for improvement, the presence of a gap does not necessarily
mean that such gap should be acted upon with high intensity, or even acted upon at all depending upon the historical utilization patterns of the patient. Through predictive models that examine the
historical behavior patterns of the patient in combination with the gaps that need to be addressed, optimal intervention timing can be achieved to allow the patient to address his or her gap without
external intervention based upon their preferences in utilizing the healthcare system, suggesting the intervention occur only after the patient would have been expected to act on their own. Often
watchful waiting may be the most appropriate recommendation. By watchfully waiting and evaluating the patient's self-management of his or her issue, resources can be applied only after the patient has
demonstrated a failure or delay in acting themselves. Through successful intervention timing analytics, multiple goals can be achieved: cost avoidance (by not undertaking costly interventions that may
not have been needed), confusion and frustration avoidance (by not accidently directing a patient or provider to undergo an intervention when the same was imminently being done), and resource planning
(by having insight into when during a year an intervention is most likely expected to be needed).
- •
- Targeted intervention venue and logistics optimization
analytics: For those patients who have been identified with a gap that needs to be addressed, in order to cost effectively deliver the
appropriate care and achieve gap closure, the right intervention tool must be selected and deployed to effectively address the specific patient and their needs. This avoids deploying a low cost
activity, such as a message or phone call, when such an intervention has little or no likely or predictable ability to achieve gap closure, while also avoiding deploying high cost activities, such as
a home visit or emergency room visit, when the gap could have been easily addressed through a scheduled appointment at a convenient retail clinic or provider office. Applying analytics to
determine the right venue for gap closure, sensitive to the cost profile and effectiveness of each, is critical for achieving cost effective and high quality healthcare.
- •
- Gap resolution valuation determination and prioritization
analytics: Because patients have multiple gaps and needs, particularly those patients with chronic conditions, it is important to
prioritize which gaps need to be understood by the patient and addressed in a manner that increases their engagement and self-management capability, without overwhelming the patient or provider. As
such, analytics must be employed throughout the year to evaluate the unresolved gaps of each patient and prioritize the resolution of such gaps based upon the combined likelihood of closure and the
ultimate value of closure to the patient and their health plan. By understanding the context of each gap in light of the patient's full clinical profile and by understanding the patient's situation in
light of the health plan's quality metrics and financial performance, gaps can be valued and prioritized to make sure that the most important gaps are known and addressed at the right time for each
patient.
- •
- Population simulation analytics: We apply analytical processes to create propensity-matched patient cohorts from our MORE2 Registry to simulate the characteristics of patients, their behavior, their providers, and how these factors translate into their utilization of healthcare resources, financial performance, and the achievement of clinical quality and outcomes goals. This simulation process allows us to effectively provide a control group for demonstrating the outcomes trajectory of such patients in comparison to populations that
address the patient's needs and to engage the patient in effective self-management. We analyze utilization patterns, follow-up patterns, treatment compliance patterns, and other patient behaviors to help identify the provider that is most relevant to address specific issues which the patient may need addressed within their care plan.
94
- •
- Relative Comparative Analytics: An increasing number of measurement, incentive, shared savings and reimbursement programs are based upon "budget neutral," "zero sum games," and other relative or comparative models. Using our data and analytics capabilities, we can inform the relative comparison of population and cohort performance levels to assist in guiding strategic investment decisions. More importantly, we can perform these analytics during a relevant date of service period so that our clients can gain insight into how they are performing and how they can make changes within their patient and provider groups to improve their outcomes while there is still time within the relevant date of service period to achieve improvement. In the absence of comparative analytics, many organizations would otherwise use a previous year's results to guide changes — a set of data that often does not even become available until well into a year, let alone representing information that is long outdated and largely irrelevant when performance is not only based upon how one is doing, but moreover based upon how one is doing in comparison to others.
we manage to highlight performance variations. This simulation process also allows us to understand these populations and design effective tools for improving their quality of care and clinical outcomes. Additionally, these simulations allow us to bring new technology capabilities and associated products to market more quickly, accurately, and cost effectively. Lastly, these simulations allow us to gain insight into how a potential client population may perform, enabling us to have an additional differentiator during a sales process.
Intervention Platforms. Our data-driven intervention platforms are toolsets and services that enable our clients to take the insights derived from our analytics and implement solutions at the patient and provider level (depicted in the second diagram on page 86 above as being via hard copy and electronic mail, interconnected EHR systems, telephonic interactions, in patients' homes, through mobile devices, at dedicated patient centers, through web-enabled decision support tools, in retail pharmacies, and in traditional clinical locations, as examples) in order to achieve meaningful impact with the patient and provider. Some clients utilize our analytical outputs to achieve value on their own. Others license our data-driven intervention platform to support their ability to achieve data-driven impact. Yet others engage us to not only license our data-driven intervention platform, but also provide the personnel services necessary to leverage these toolsets and actually achieve the patient and provider-level impact. Examples of our data-driven intervention platform tools include:
- •
- point of care tools that provide patient-level insight to the healthcare provider, which guides the provider through
precise data-driven topics, issues, and decision support to aid in the assessment, documentation, and care of a specific respective patient. For example, our analytics may identify that a patient's
diabetes has potentially progressed — possibly due to a non-compliance with their medications. Our decision support tools provide a mechanism for this information to be made known
to a provider in such a way as to help them know that a patient visit may be warranted, aid them during the patient clinical encounter to efficiently determine the situation with the patient, support
proper documentation, reporting, and outcomes measurement;
- •
- communication tools that support a wide range of notifications and interactions with patients and providers via phone calls, mail, SMS messages, e-mails, etc., at the appropriate level of implied education and language to aid in the process of achieving patient and provider actions. It also may include education outreach which coordinates the communications with health plan patients regarding their health issues and to support self-management of their conditions by guiding them to supplemental resources, coaching and health literacy;
95
- •
- supplemental patient encounter tools that facilitate the coordination of data-driven patient encounters for those who are
unable to participate in traditional office encounter venues; and
- •
- medical record data tools that facilitate electronic medical record data pulls, remote accessing, and clinical facility communications for site, scheduling, medical record data collection, abstraction, review, quality control, archiving, and process tracking — regardless of the underlying medical record data medium (e.g., digital or paper).
Business Processing. Our business processing toolsets are made up of a powerful business intelligence system and comprehensive data warehousing to provide historical and current data insight, reporting, and benchmarking to support multiple client business needs such as government-mandated data filings, financial planning, and compliance requirements. Examples of our business processing tools include:
- •
- Data Warehousing and Business Intelligence. We provide
toolsets that enable comprehensive warehousing and management of healthcare data in raw, native formats as well as processed, high-integrity data. We provide the flexibility and accommodation for
healthcare practice groups who have varying levels of data sophistication — from advanced electronic connectivity (i.e. remote medical practices) to onsite digitization and
collection, to self-provision of medical records via fax, mail and electronic mail allowing for clinical data collection throughout the U.S. These datasets are presented to our clients' users through
business intelligence systems that include flexible dashboards, parameterized reports, and ad hoc querying capabilities for summarizing key analytics, allowing for the investigation of data trends and
deeper data segregation and analyses, and access to key benchmarking information. These data warehousing and business intelligence toolsets are built on industry leading technologies to integrate our
clients' data (e.g., provider, facility, patient, enrollment, benefits, lab results, pharmacy, claims, quality scores, financial metrics, performance forecasts, etc.) and the data results and
benchmark information from our MORE2 Registry. We are able to provide our clients with the ability to gain insight into both their own data and their own data in comparison to our large
integrated dataset to help improve the quality of care provided to patients, drive financial performance, and aid in strategic business processes of the client organization.
- •
- Data Management and Submission. Leveraging our data warehousing toolsets, our solutions help our clients to manage their data and translate their data into the formats necessary for, among other needs, submission to government entities in support of quality and outcomes measurement and revenue determinations, and provision to their various internal and external business processes. These data management solutions address the formulation of data submission files in summary and patient level-data format as required by regulatory bodies, as well as the workflow processes to receive submission response files to support the reconciliation of data submissions, corrections to data submitted with response issues, and resubmission processes. These processes operate in an integrated manner with our business intelligence solutions to provide our clients visibility into the details of their data submissions at the population level, the patient level, the attributed provider level, and for user defined custom cohorts.
Illustrative Workflow and Patient Case Study
The following is an illustrative workflow of how a healthcare organization (whether a public or private health plan, integrated healthcare delivery system, independent physician or practice association, or other provider/patient organization) may leverage our platforms.
96
- •
- Stage 1: Data Integration. Following the
engagement of a new healthcare organization client, large amounts of data are integrated from multiple disparate sources within the healthcare organization related to patients, physicians, quality,
payments, regulatory files, and clinical facilities. Other data sources are interconnected from sources such as hospitals, laboratories, pharmacy benefit plans, EHRs, and physicians. The initial data
feeds typically "backfill" (i.e. provide for data pertaining to prior periods of time) for several years. Our platform facilitates rapid initial integration of this data, applying more than
1,100 data integrity checks. The data integrity analyses compare the potential erroneous presence, accidental absence, and potential errors within the data to our large scale comparative data sources
containing billions of medical events from thousands of current and historical sources to aid in improving data quality and identifying potential gaps and errors within the new client data flows. Once
integrated, data flows are scheduled at standard intervals thereafter. Some data are scheduled for monthly updates while other data flows update transactionally, whenever a data source event occurs
such as a patient clinical encounter. All data connecting through our data integration platform, both structured and unstructured, drop into our data repository, which we call our data lake, where
they can easily be accessed by all of our platforms — analytical platform, intervention platform, and business processes platform.
- •
- Stage 2: Advanced Analytics. With data resident
within our data lake, a series of analytical processes are applied. Key analytics begin determining the current disease status, comorbidity status, quality status, and utilization status of the
patient, provider, facility, or population based on actual available data (referred to as the known current state of the patient, provider, facility, or population). A set of predictive analytics is
then applied to derive models for where the broader datasets suggest the patient, provider, facility, or population have progressed to outside of the otherwise obvious data indications (referred to as
the predicted current state of the patient, provider, facility, or population). Informed by our broader datasets, yet another set of predictive analytics is then applied to derive models suggesting
where the patient, provider, facility, or population will progress to with respect to the analyzed conditions or issues (referred to as the predicted future state of the patient, provider, facility,
or population). Examining differences between known current state, predicted current state, predicted future state, and what is referred to as the desired state pertaining to the respective goal,
allows for gaps between those various states to be identified. Each gap between a current or predicted state and a desired state can then be analyzed further. To do this, for each gap, a series of
analytics is undertaken to determine the (i) probability that the gap is a real gap, (ii) the value of the gap being resolved, (iii) the way through which the gap would be most
likely able to be resolved, (iv) the venue at which the gap would best be resolved, (v) the timing which would be best for resolving the gap, and (vi) the predictability of the
gap being able to be resolved. By undertaking these various analytical processes, not only can the field of opportunities for improvement be identified and the concrete approaches to their resolution
be weighed, but also the business rules pertaining to prioritization and return on investment, or ROI, thresholds can be calculated and applied.
- •
- Stage 3: Intervention Platforms. With gaps identified for resolution and concrete approaches to their resolution determined, a series of platforms can then support the resolution process. For some clients this stage may be handled through their in-house resources, while for others, the client requests us to leverage our intervention platforms to achieve the realization of impact value sought by the analytical processes. For these, guided by the insights garnered from the various analytical processes, the appropriate intervention platforms can be employed to interface the right resources with the patient, provider, facility, or population
97
- •
- Stage 4: Business Processes. With actions taken by the various intervention platforms (or, in some cases, by the client's resources), resulting outcome data is then re-combined with the data resulting from all stages of our processes to inform business intelligence platforms, regulatory data submission processes, financial reporting processes, and other business processes that ultimately reflect the value achieved and complete the process initially sought by the client.
to achieve the desired goal within the business rules pertaining to prioritization and ROI thresholds.
The following is an illustrative example of how this translates to an individual patient.
Applying the stages of our platforms, a client engaged us for the improvement of quality and financial performance within their managed Medicaid population. Following data integration, our analytics identify that a patient's diabetes is believed to be worsening rapidly. Analytics predict that the diabetes is now likely out of control and has likely progressed to where there is concern for kidney, eye, and nerve complications. Unfortunately, the analytics also identify that there is no significant evidence that these predicted comorbidities have yet been identified or addressed by the physicians within the health plan's physician network.
Our models gain a high level of confidence that these concerns are valid and that the value to the patient, physician, and health plan is significant. Further analytics determine that historical care patterns and the patient's activities strongly suggest that the patient has the strongest relationship for diabetes-related matters with their OB/GYN (and not their endocrinologist, dermatologist, internist, or cardiologist). The information is sent to our data-driven intervention platforms. The platforms rely on analytical outputs which predicted that this patient would respond best to a phone call encouraging a physician visit with her OB/GYN while the information is concurrently made available within ePASS®, our provider portal for patient clinical encounters. Alternatively, the patient could have been seen at a retail pharmacy with a walk-in clinic utilizing our technology platform or the physician could have received notification and accessed the information within their EHRs. During the encounter, a patient profile constructed by our data and analytics provides the OB/GYN with past medical history, medications, laboratory results, and the analytical outputs determined by our analytical platform indicating the specific areas for assessment concern, pointing out gaps in quality measures, indicating and supporting important relevant screening.
Supported by the data and insights of our platform, the patient's diabetes progression is diagnosed. Additional goals set by the health plan around quality, screening, and patient education are achieved. A care plan is put into place. The patient gains an increased bond with his or her provider and health plan. The patient's data continues to be analyzed in the days, weeks, and months that follow. The impact results are made available to the healthcare organization showing the decreased use of the emergency room and hospital admissions by the patient, improved quality scores, and greater risk score data accuracy. The resulting decreased utilization costs, improved premium payments, incremental quality incentive payments, and improved patient retention drive material financial impact for the healthcare organization — allowing them to improve benefits, lower premiums, and, together with enhanced patient quality scores, better succeed in competitive marketing.
While the illustrative example was focused upon managed care client applications, our platforms also support multiple additional client examples as presented below in shorter form:
- •
- Pharmaceutical Industry. For the pharmaceutical company seeking to successfully transition from the consumption-based industry model to the performance-based industry model, our platforms can assist in empowering pharmaceutical companies to construct highly focused programs specifically aimed at patients who are failing to be identified as candidates for
98
- •
- Research. For the contract research organization, or CRO, seeking to increase its speed, efficiency, and capabilities in a highly competitive marketplace, our platforms provide a deep and unique data source for research, clinical trial design modeling, and physician identification. Our intervention platforms can support Phase 3 and Phase 4 clinical trial processes, highly granular clinical data abstraction, directed clinical encounter activities, and a network of near-real time data aggregation that can dramatically differentiate a CRO.
improved diagnostics or treatments; are at high risk of complications or poor outcomes; or are non-compliant on specific treatment programs.
Our Competitive Strengths
We believe that our operational and financial success is based on the following key strengths:
Industry-Leading Analytics. We have over a decade of demonstrated performance and leadership in disease and comorbidity identification analytics, predictive model analytics, patient and provider intervention prioritization analytics, quality outcomes analytics, and a host of additional analytical and data-driven processes. Based on our experience in the industry and our interactions with existing and prospective clients, we believe that very few other organizations, if any, are able to offer the depth and breadth of data-driven analytical insights, tools, and actionable interventions that our platforms are able to offer.
Industry-Leading Data Asset. We maintain one of the industry's largest independent datasets in our MORE2 Registry, representing, as of December 31, 2014, more than 120 billion medical events from more than 9.2 million unique patients, 754,000 physicians, and 248,000 clinical facilities, touching 98.2% of all U.S. counties and Puerto Rico. The primary source nature of the contributing data, the clinical content depth of certain elements, the analytically-derived enrichments, the significant data integrity, and the ability to maintain accurate identification of entries and patient matching over time regardless of data source and chronology (a valuable characteristic within our datasets known as longitudinal matching) — all combine to create a unique and valuable asset. We believe that these datasets serve as a significant differentiator, informing analytical and product strength design, population simulations, health outcomes research, patient engagement, and both speed-to-market and speed-to-impact capabilities. As of December 31, 2014, our MORE2 Registry has expanded at a rate of approximately 3.0% compounding monthly, or 42.6% annually, since 2000 as illustrated below.
99
Fully Integrated End-To-End Solution Delivery. Our platform is able to turn data into insights and insights into actionable interventions. Our platform covers a comprehensive range of services for our clients turning raw data into meaningful impact and allowing our clients to realize intervention benefits immediately following integration of our platform. The ability of our platform to integrate disparate and highly complex data to derive impactful and actionable insights has enabled us to bridge the gap from analytics to practical applications on a vast scale.
Scale of Organically Developed Platform. We have developed a highly efficient and scalable data and analytics platform that has successfully scaled to serve many of the nation's largest health plans as well as hundreds of separate patient populations concurrently. This platform has been developed on one common code base, supporting strong interoperability within our platform, efficiency in association with innovating and expanding our platform capabilities, and establishing both beneficial predictability and reliability when operated at high levels of load. We operate enterprise-grade datacenters complemented by a cloud technology based architecture that allows massive, on-demand capacity expansion and speed of execution. We integrate directly with the EHRs of many clinical facilities, bringing analytics and insight to the point of care and decreasing the process burden on providers and clinical facilities. We have a leading nationwide intervention platform services footprint and are able to support our client partners in more than 98.2% of all U.S. counties and Puerto Rico, as of December 31, 2014.
Subject Matter Expertise. We have, and plan to continue to cultivate, a culture of fostering domain expertise. We maintain a dedicated research team comprised of industry experts and thought leaders, including physicians, as well as clinical, statistical, economical, and data research scientists, and field practitioners who focus on next-generation healthcare solutions and data applications. In addition, we empower our product groups with their own industry experts who focus on research and development in their respective product domains. This subject matter expertise and leading research capabilities position us to stay at the forefront of industry innovations in data-driven healthcare interventions. This concentration of highly relevant subject matter expertise is uncommon in the market, and contributes to both our capabilities and our being called upon by clients, partners, and industry-leaders to address challenging and important questions.
Industry Innovator and Thought-Leader. We invest considerable time and resources to produce ground-breaking research and strategically share it through industry publications, peer presentations, strategic relationships, and the media. Leveraging our MORE2 Registry, we provide healthcare insights for diverse audiences, thus driving visibility and credibility, and providing significant recognition for our toolsets, capabilities and innovation. Our MORE2 Registry is routinely featured at high-profile industry events and within influential publications, which we believe further reinforces our brand as an industry innovator and thought-leader.
Long, Successful, Profitable Operating History. We have been delivering value to our clients while gaining scale and profitability since 2006, the year of our reorganization as a C corporation. This scale and profitability has provided organizational stability, an empowerment to invest in ongoing research and development, an element of reassurance for existing clients and potential clients, and ready access to resources to meet our clients' needs. We have been able to accomplish this in a manner conducive to client partnership through a variety of means, including the self-financing of individual client upfront project integration and start-up fees.
Trusted, Independent, and Unbiased Partner. We are not owned or influenced by a health plan or private equity organization. As a result, our data and analyses remain truly independent, not biased to any single patient base, we are incentivized to be transparent with our clients, and we believe our goals are more fully aligned with the success of our clients.
100
We have grown by attracting clients, accumulating larger and more robust datasets, and developing more advanced analytics from this growing dataset that deliver increasingly valuable insights and impact. By providing increasingly valuable insights and performing increasingly effective patient and provider interventions we are able to deliver greater value to our clients. As our data asset continues to grow, our analytics and intervention solutions become even more effective and our clients realize even more value from our solutions. This in turn results in greater demand for our solutions and attracts new clients. We believe that this virtuous cycle provides us with a competitive position that cannot be easily replicated.
Growth Strategies
Our objective is to continue to provide leading analytics and interventions platforms across the healthcare landscape while continuing to grow profitably. We intend to achieve this objective through the following key strategies:
Deliver Increasing Value to Existing Clients. We enjoy long term client relationships which entail multiple separate product engagements demonstrated by our average 4.9-year tenure for our top 10 clients with an aggregate of 80 separate statements of work as of December 31, 2014. Additionally, we have approximately 90 client organizations that currently have only a limited number of services with us. Frequently we see clients that started with just one service with us realize the value that we are delivering and then expand their business with us to add additional services. We believe that we have a significant opportunity to deliver increasing value to our existing clients and this, in turn, will drive continued growth for us. As our clients recognize value and success as a result of working with our platforms, we frequently see them grow in their patient count and increase the number of products engaged with us — both of which result in our mutual success and growth. As we continue to deliver value to our clients, we plan to increase revenue from our existing clients by expanding their use of our platform, selling to other parts of their organizations, and selling additional analytical toolsets and services to them. Our pricing model allows us to grow incrementally along with our clients' growth. We are also able to introduce new healthcare plans that require additional functionality and insights as the healthcare market becomes more complex and the regulatory environment evolves, providing us with a substantial opportunity to increase the value of our client relationships.
Continue to Grow Our Client Base. We believe that we are still in the early stages of realizing our substantial opportunity to grow our client base. We intend to leverage our expertise and experience from the existing large client base to gain new clients through increased investment in our sales force and marketing efforts. In addition, by leveraging our sector expertise and thought leadership, we believe that we can increasingly become the partner of choice for our existing clients. The network effect created by delivering increasing client value and consequently expanding our brand and service value, coupled with our industry expertise, is also driving substantial inbound client interest.
Continue to Innovate. Our strength in applying advanced, big data, cloud-based data analytics and our proprietary datasets enable us to achieve increasingly more impactful results for our clients. In order to continue delivering meaningful results in clinical and quality outcomes, utilization, and financial performance across the healthcare landscape, we intend to continue to invest in research and development to further enhance our data analytics and intervention platforms. For example, we recently announced the acceleration of big data processing empowering our QSI® platform, enabling a significant functionality expansion in our clinical quality outcomes measurement capabilities supporting accelerated performance for HEDIS, Stars, QARR and other measurement and reporting standards. This advancement will also support the acceleration of our related predictive analytics capabilities. As a result, we expect our clients to experience significantly reduced cycle times, allowing for complex measure calculations at speeds
101
which are more than 10 times faster than any other comparable solution which we are aware of in the healthcare industry.
Continue Expanding into Adjacent Verticals. We believe the application of advanced analytics and data extends well beyond our current market opportunities and provides additional adjacent market verticals for growth which include:
- •
- Providers: Physicians, practice groups, hospitals, and
combinations of such providers are making a transition from a fee-for-service based healthcare model environment to a quality and value based healthcare model environment. As part of this, providers
are entering into shared savings, shared risk, and other forms of arrangements with private and government payors. They are investing in the technology infrastructure needed to compete and survive in
the changing healthcare environment. Many of the forces being applied to healthcare payors are being pushed downstream to the provider marketplace directly through contractual arrangements, and
indirectly through traditional competitive forces. Our business intelligence platforms assist providers and provider organizations to understand the current status and projected implications of the
complex arrangements that are increasingly governing their marketplace. In addition, our datasets, analytical tools, and clinical encounter engagement platforms can be applied to assist these
providers and provider organizations to focus on delivery of high quality care and to succeed under the increasing pressure of these market forces.
- •
- Pharmaceutical and Life Sciences: The significant
investment in drug and treatment development pipelines creates pressure within life sciences companies to focus on the areas of greatest need and opportunity, while growing their presence in the
treatment process, from simply the creation of treatments, to the ongoing delivery and support of treatments that achieve desired outcomes. Our deep and growing healthcare datasets, analytical tools,
and clinical encounter engagement platforms can be applied to assist life science companies in advancing their missions to improve healthcare by providing them the insights necessary for them to
provide safe, effective, and affordable treatments for individuals and populations, informing the growth of their treatment portfolios and assisting in the delivery of treatment programs.
- •
- Employer and Private Exchanges: The growing cost of
healthcare is putting pressure on employers to find creative ways to control costs while continuing to offer competitive benefits and attractive healthcare options to their employees. Our capabilities
in analytics supporting the advancement of quality of care and cost effectiveness in healthcare can be applied to assisting employers in understanding and improving their populations' utilization of
healthcare services to advance the design of innovative plan benefit packages, provider networks, and population management support programs.
- •
- Direct-To-Consumer: As consumers become increasingly interested in quantifying and improving their health, our capabilities can help them understand their relevant data and empower their ability to make better decisions in a broad range of health-related areas from informing and managing their own health-related decisions to selecting physicians, hospitals, and treatments that best fit their individual needs. Further, our datasets and connectivity with the payor and provider landscape can provide a valuable element to the consumer's increasing desire to monitor and manage their holistic healthcare profile.
Expand Reach through Growing our Channel Partnerships. While we have been successful in growing our business through our direct sales efforts, we believe there is a significant opportunity that exists for us to further expand our reach through channel partnerships. There are many organizations in the healthcare space outside of the traditional payor and provider space that have meaningful impact on the quality of healthcare, such as retail clinics, pharmaceutical companies,
102
CROs, large technology solution providers, and consulting firms. We believe our platform is well positioned to empower these organizations with powerful data-driven analytics and intervention insights, which can benefit their end consumers through improved care and better outcomes. For example, we recently launched a partnership with Walgreens, the nation's largest drugstore chain. This partnership has allowed us to leverage our proprietary data assets and distinctive analytics capabilities to bolster Walgreens' Clinics point-of-care solutions by providing clinicians with access to predictive insights about a patient's health status and data-driven intervention considerations, resulting in more efficient and higher quality standard of patient care while reducing the cost of care.
Continue to Leverage our Technology Partnerships. The healthcare industry has traditionally lagged behind the technology innovation curve. Big data and high-performance analytics frameworks have not yet been widely adopted by the healthcare industry. We have been a leader in the use of these high-performance technologies and analytics in the healthcare industry. We have been closely collaborating with EMC and their federated companies of VMware and Pivotal on numerous infrastructure projects to integrate and enable modern high-performance compute and storage frameworks at the point of care. Our advanced data processing and analytics capabilities, coupled with infrastructure thought leadership from leading vendors such as EMC has enabled us to empower our clients with powerful data-driven solution offerings and further transform the use case of modern technologies across the evolving IT healthcare landscape.
Expand Internationally. Governments, corporations, and consumers worldwide face similar pressures as within the U.S. with respect to their healthcare systems. We believe that our capabilities are highly applicable to other countries around the world and we intend to invest in replicating our success in the U.S. market to other strategic countries and regions.
Selectively Pursue Acquisitions. We plan to selectively pursue acquisitions of complementary businesses, technologies, and teams that we expect to allow us to add new features and functionalities to our platform and accelerate the pace of our innovation and expansion into adjacent market spaces beyond what we can achieve organically.
Leverage our Dynamic, Passionate, and Mission-Focused Culture. We believe that our work must meet a higher standard. We believe that the analytics that we design, deliver, and support achieve an impact in the lives of real people — parents, spouses, partners, siblings, and children — making integrity and quality cornerstones of our culture. Our dedication to integrity and quality extends to the proprietary technology used for medical data integration, analysis, abstraction, and reporting. Even more importantly, this culture is embraced throughout our company.
We hold ourselves to a high standard. We strive to ensure that each report, file, and dataset delivered to clients meets or exceeds superior standards of quality. We strive to ensure that each phone call, every patient encounter, and each customer encounter informed and supported by our analytics and platform meets or exceeds superior standards of quality. These values permeate our organization and drive our identity as a company that we believe drives growth and how we innovate, deliver our solutions to our clients, and attract and retain the best talent.
Our Technology
Big Data Platform
Throughout the healthcare industry, data is captured from many different sources, and while standards for exchanging information between healthcare applications are emerging, much of the data associated with population health remains in disparate silos, in various formats, on paper, and is both interchanged and processed without automation. Where investments have been made in the
103
digitization of health data, many of the resulting solutions remain "walled gardens" of information — data that is static and not easily shared or interpreted.
Our big data technology platform was designed and developed to address these challenges. Our platform enables integration of any data source, on any hardware platform, in any data format at extremely high speeds. This advanced approach to delivering technology is comprehensive in that it provides for real-time capture, extremely rapid analytical processing and redistribution of health data. We believe that very few other healthcare technology platforms, if any, so effectively address the integration of the payor, the provider, and the patient, with high volume, at rapid velocity, with the same depth of data.
We believe that our big data capabilities enable us to receive, integrate, and process extremely large-scale data flows at truly industry-leading speeds, creating what we believe to be a material market differentiator and value creator for us and our clients. While data integration and processing at scale within the healthcare landscape (known for its highly disparate and "dirty" data characteristics) are key technology barriers to many organizations, we believe that we have made these capabilities a true differentiator — we are able to onboard clients and maintain high velocity computes in industry-leading times.
Our big data platform has been created through the use of internally created software coupled with industry-leading technology frameworks that are vendor-agnostic. We leverage modern big data frameworks such as Hadoop Distributed File System and Hadoop which enable our platform to store structured and unstructured data while making it readily accessible by our analytics engine. Our big data processing capabilities enable dramatic improvements in data integration and analytical cycle speed to value recognition to empower improvements for intelligent product development through the "real world" functional application. Our big data platform laid the foundation of the data fabric allowing integration into our analytical capabilities. We have moved analytics to the data instead of requiring the data to be brought to the analytics platform.
Data Intake
Our platform receives information from multiple external sources that are loaded into our "data lake" in its native format. Files may be received through secure FTP, web services, and direct connections to external systems. Loading the data into the data lake in its native format ensures that we maintain all data as it is received and allows users to query the data directly in its structured or unstructured format.
Processing data in its raw format presents many technological challenges. We have developed interactive data mapping technologies to support the mapping of the raw data files to staging structures used by our platform to convert data from its native format into a structured format that can be used by all processes on our platform. Once mapped, the data is run through multiple processes to standardize the data and perform data verification and integrity checks. For example, one source may provide person's gender using code values of "1" for male and "2" for female. Other clients may use values of "M" and "F" to represent the same data. Similarly, one source may send a specific laboratory result value as 7.25 while another source may fill in significant digits and send 7250. Our platform applies our data integrity analytics to convert the incoming data to values that are uniform across our entire platform.
Our technology platform is built upon modern big data frameworks such as Hadoop Distributed File System and Hadoop which enables our platform to store structured and unstructured data while making it readily accessible by our analytics engine.
Data access provided by our data lake leverages scalable application program interfaces, or APIs, and service based architecture techniques enabling access to the contextual data needed to perform many different types of analytics. An API is an application program interface, or software
104
intermediary, that makes it possible for disparate systems to communicate and function with each other. Ultimately, data is provided to the analytics process and results are stored via service based requests to provide a scalable repository of source and results data.
Technology Infrastructure
We believe that our track record of strong service is the result of our commitment to excellence and our devotion to maintaining one of the industry's most sophisticated technology infrastructures. We have made significant investments over the past decade to build an industry-leading enterprise-scale infrastructure capable of managing the heavy computing and storage requirements of our data-driven business. Today, we employ a combination of owned, virtualized data centers along with hosted facilities to enable seamless, secure, and scalable solutions nationwide.
Our physical compute and storage infrastructure is deployed with a hybrid approach to cloud computing. Leveraging heavily virtualized infrastructure together with orchestration and automation tools, we have achieved tremendous capabilities within our private cloud environment. The following diagram provides a high-level overview of our key infrastructure elements.
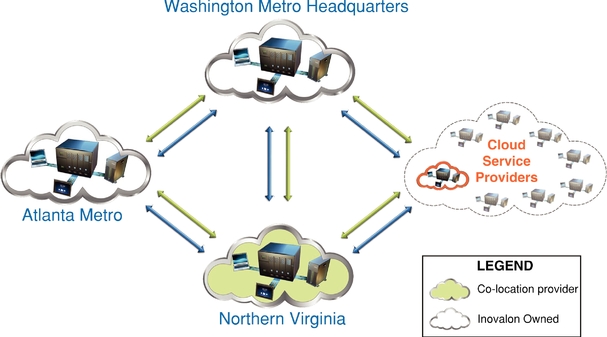
Our data and compute capacity is maintained within an interconnected set of infrastructure sets made up of two principal datacenters owned by us in the Washington Metro and Atlanta Metro region, and one co-located datacenter facility located in Northern Virginia, with the ability to interconnect agnostically to third-party cloud capacity providers such as those shown within the diagram. This macro architecture provides us a significant ability to maintain both enterprise-level capacity and redundancy, while also achieving significant flexibility and cost effectiveness for burst capacity needs.
We have a proven track record in implementing virtualization as our current datacenters are over 85% virtualized using VMware technologies. Operations of the virtualization technologies are streamlined by the orchestration, automation, and reporting capabilities provided by our private cloud and integration with public cloud service providers. These technologies will be used to provide computing, storage, and networking components to the hosting environment and provide operational efficiencies and cost optimization for the corporation.
105
In partnership with EMC, VMware, and Pivotal, we have implemented a sophisticated hybrid cloud and service based application stack design, enabling "burst" capacity architecture to allow provider-agnostic utilization of public cloud capacity if such capacity is required. Our virtualization technology has been integrated with automation and orchestration technology to create a cloud environment that provides both Infrastructure and Platform as Service capabilities. These service based capabilities allow us to dynamically expand our compute capacity in real time and provide the business with a cost effective and nimble platform. By leveraging both private and public cloud offerings, we can provide efficient, elastic, and cost effective compute resources based on the operational needs of our clients. We believe we are pioneers in the use of big data technology and high performance compute technology stack at the point of care in our industry.
Our platform is built utilizing an innovative enterprise infrastructure platform enabling robust performance scaling, strong security, high availability, and advanced business continuity options. The building blocks of this infrastructure consist of the following:
- •
- Multiple data centers connected by redundant high-speed WAN connections;
- •
- High competency and utilization of virtualization technologies;
- •
- Rapid provisioning of computing capabilities to support the dynamic elasticity needed to support the variable computing
needs of the application;
- •
- Measured service to optimize resource utilization and provide transparency of the utilized services; and
- •
- Available hosting facilities providing physical structure compliance with Federal Information Security Management Act, or FISMA, standards.
The following diagram provides a high-level view of our key platform elements.
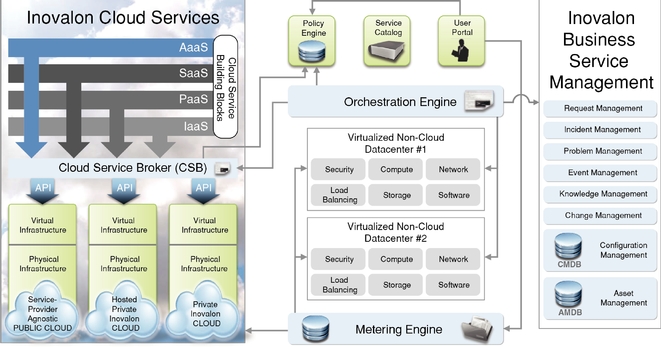
106
Disaster Recovery
Our contingency program is designed to provide an immediate response and subsequent recovery from unplanned business disruptions. Supported by our Washington, DC Metro, Atlanta Metro, and Northern Virginia data centers, our contingency program provides a coordinated emergency response foundation across the organization. The program includes business continuity, emergency occupant, security incident response, and disaster recovery plans that encompass all areas of our technology and business operations. These interrelated processes align to provide maximum protection and risk mitigation. In addition to company-wide plans, specific details on event response and subsequent business recovery actions and activities are included within each respective business unit plan.
Network Operations Center
We maintain a central network operations center, or NOC, where systems are monitored to ensure proper operation and capacity utilization. The NOC monitors and collects information about a multitude of technology operating metrics regarding system load and status. In conjunction with the rapid provisioning capability, automation, and standardization, the NOC provides us with the automated capabilities to oversee and manage our technology resources in order to meet business demands.
Infrastructure Certification and Compliance
We leverage third party attestations to test and validate our technology controls and operating framework. Among these attestations, a nationally recognized professional services firm has conducted an annual Statement on Standards for Attestation Engagements, or SSAE, No. 16, Reporting on Controls at a Service Organization audit of our toolsets and infrastructure for the last several years. We also undergo third party audits and assessments as required by our clients.
Privacy Management and Data Security
Protected health information is perhaps the most sensitive component of personal information. It is highly important that information about an individual's healthcare is properly and thoroughly protected from any inappropriate access, use and disclosure. Given the industry vertical in which we operate, we realize the importance of the safety and sensitivity of personal health information. We have been a trusted partner to our clients and are committed to ensuring the security and privacy of our client data, enterprise data, and our systems through the application of highly trained personnel, robust processes, and technology. Our privacy and security management includes:
- •
- governance, frameworks, and models to promote good decision making and accountability. Our comprehensive privacy and
security program is based on industry practices including those of the National Institute of Standards and Technology, the Control Objectives for Information and Related Technology, Defense
Information Systems Agency, and FISMA;
- •
- an internal security council, which advises on and prioritizes the development of information security initiatives,
projects, and policies;
- •
- a layered approach to privacy and security management to avoid single points of failure;
- •
- ongoing evaluation of privacy and security practices to promote continuous improvement;
- •
- use of safeguards and controls including: administrative, technical, and physical safeguards;
- •
- collaboration with our clients on best security and privacy practices; and
- •
- working closely with leading researchers, thought leaders, and policy makers.
107
Our Platforms' Components
Our platforms are composed of analytical and data-driven intervention components that collectively comprise a fully integrated suite of systems designed, developed, and maintained to achieve client value. The following are our key toolsets that we use to deliver our client solutions.
Data Integration Toolsets
iPort™: iPort is our data integration and management process toolset. This proprietary toolset leverages a decade of dataset extraction, transform, and load experience, in combination with data format insights gained from analysis of our extensive MORE2 Registry dataset, to enable high volume data integration at enterprise scale. Applying more than 1,100 data integrity checks constructed from the analysis of data feeds that have constituted the 9.2 billion medical events within the MORE2 Registry, iPort is able to manage data integration through an advanced exception rules processing — thus empowering both high throughput rates and accuracy. With data feed profiles monitoring for characteristics ranging from receipt timing, content, and format, to referential integrity, and trend consistency, iPort processes the integration of thousands of data feeds received by us while maintaining state-of-the-art security protocols and HIPAA compliance.
EHR Integration Engine: Our EHR interoperability is a capability that enables us to both (a) push patient-specific and provider-specific data and analytical results to EHR platforms, and (b) aggregate clinical data from patient-specific and provider-specific content within EHR platforms in a highly efficient manner. Designed to achieve these tasks within both cloud-based and single-install EHR environments, our interoperability enables both the capture of clinical data and the delivery of data-driven interventions at the clinical point-of-care within the workflow of the clinical environment.
Advanced Analytics Toolsets
In addition to the innovative analytics capabilities discussed above under "— Our Platforms — Advanced Analytics," our data analytics platform includes the following key toolsets to facilitate our provision of data analytics services to our clients:
Predictive Clinical Insight System (PCIS™). PCIS identifies the diagnoses and comorbidities that may exist for a patient but which are incompletely or improperly reflected within the clinical profile of the patient as known to the patient's health plan. The PCIS system is designed to evaluate patients for undocumented conditions, worsening conditions, and uncoded conditions that are important for the effective ongoing management of the patient. Each of these gaps represents a potential incongruence between the "data picture" and the "true clinical picture" of the patient. These gaps, if unresolved, can prevent the proper care and resources to be directed to the respective patient, as well as cause health plans to recognize significant financial losses due to reimbursement inaccuracy, failed quality improvement goals, and utilization waste. Upon identifying each disease and comorbidity incongruence, PCIS generates and reports a potential impact, probability, and prioritization for the resolution of each gap. Evidence of unconfirmed diagnosis, worsening disease states, overlooked chronic conditions, implications of durable medical equipment, absences of coding specificity, and coding combinations are but a few examples of categorical analysis that are undertaken by PCIS.
Quality Spectrum Insights Suite (QSI, QSFD and QSCL). These toolsets provide a flexible run-time engine and user-friendly tools for the design, development, and deployment of a broad set of healthcare data analytics across the spectrum of clinical and quality outcomes, healthcare utilization, spending patterns, provider and network performance, and patient risk profiles. The advanced graphical user interface (provided through Quality Spectrum Flowchart Designer, or
108
QSFD) empowers clients' clinical, product development, and research staff to achieve superior analytical functionality without having advanced statistical, epidemiological, or programming experience.
Core to its architecture is a proprietary Massively Parallel Processing (MPP) engine utilizing a Shared Nothing processing approach that scales linearly with additional processors, and a highly scalable grid storage array, enabling the development of an exceptional generation of toolsets driven by near-real time analytics across extremely large datasets.
Monthly Member Detail Map (MMDM™). The MMDM aggregates analytical outputs of other analytical toolsets to arrive at a coordinated gap resolution plan informing intervention strategies to resolve gaps in care, quality, and financial performance across large populations. To achieve this, the MMDM uses targeted patient-specific, site-specific, and provider-specific predictive analytics to enable and direct the right intervention for the right patient, in the right venue, at the right time. In addition to layering, prioritizing, and chronologically orchestrating data-driven intervention plans, the MMDM also enables the coexistence of Inovalon-driven analytics alongside client and third-party initiatives. The analytical processes necessary to assemble the separate outputs of other analytical toolsets and creating the MMDM output are highly complex but highly valuable in translating such disparate analyses into a practical operating plan to achieve positive impact for the provider and patient.
Intervention Toolsets
ePASS: Our electronic patient assessment solution suite, or ePASS, is a web-enabled, point-of-care decision support tool designed to deliver both patient-level insight and guided clinical decision support. Through the use of ePASS, the point-of-care clinical provider is able to access patient-specific information and is guided through data-driven topics for their consideration.
The ePASS tool offers clinicians insight into the patient profile analytically compiled from claims data (e.g., procedures, admissions, diagnoses, durable medical equipment, nursing homes, etc.), prescription drug data, laboratory data, clinical data, and patient reported data. Additionally, the outputs from our analytical processes translate into patient-specific questions and guidance within the ePASS toolset availing the clinician to potential concerns around disease, quality, utilization, medication adherence, preventative medicine, patient education, and many other areas of focus. In addition to its core functionality, ePASS is easily configured to allow custom analytics, question sets, and testing follow-up to be incorporated for specific needs. ePASS' patient-specific, point-of-care documentation and decision support capabilities generates medical record documentation in a regulatory-compliant format to support treatment plans, continuity of care, and patient data accuracy. Ultimately, the use of ePASS' patient data access and decision support capability results in not only a more comprehensive clinical encounter, but a more efficient encounter.
Site Review Support Application (SRSA™): SRSA coordinates clinical data collection at facilities across the nation. To achieve this, as a first step, SRSA orchestrates the determination of which clinical data medium and transfer modality may be most efficiently achieved (e.g., remote EHR access, EHR data export, fully integrated EHR interoperability, paper-based medical records, etc.). Once data mediums are determined, SRSA undertakes necessary steps of facility communications, onsite scheduling, data abstraction, review, and quality control.
Integrated Data Collection Tool (iDCT™). The iDCT facilitates the accurate and efficient recordation of clinical information into discrete data elements from a wide variety of clinical data sources. The iDCT incorporates both hard and soft error correction and quality control capabilities supporting the comprehensive data review and audit trail development process. Deployed in both
109
cloud-based configurations and through an "occasionally connected" mobile configuration, the iDCT allows for clinical data abstraction in large volumes.
Integrated Telephonic Communication Coordinator (iTCC™). In order to achieve effective provider and patient engagement, outbound and inbound communications must be highly targeted based upon analytics and informed with integrated patient and provider profiles to make communications effective and efficient. iTCC supports this communication to ensure that value is delivered and program goals are achieved for clients. The iTCC manages the communications and logistics of the following value delivery modalities:
- •
- Encounter Facilitation: Through traditional and electronically generated
letters and targeted telephonic outreach, iTCC connects patients with providers to improve care management, clinical outcomes, and prospective reimbursement rates.
- •
- Supplemental Patient Encounter: In certain situations, patients are
unable to participate in a traditional office encounter within a desired or optimal timeline. For these cases, a Supplemental Patient Encounter (e.g., in-home encounter, retail clinic
encounter, or other facility enabling a clinician and patient face-to-face encounter opportunity to occur) can be performed to achieve patient assessment, care, quality, documentation, and other goals
of an analytically-driven and data-driven encounter. iTCC manages the process of coordinating such encounters when this type of intervention is indicated by our analytics.
- •
- Patient Education Outreach: iTCC supports data-driven outreach in written and telephonic modalities to educate a patient regarding their health issues and to support patient-specific self-management of their conditions by guiding patients to community resources, providing coaching, and providing health education and health literacy support.
Business Processing Toolsets
Claims Aggregation, Analysis and Submissions system, or CAAS™. CAAS provides comprehensive claims data warehousing and processing to support government-mandated data submissions and cost reporting. It supports the integration of data in the raw, native format with strong data quality oversight to ensure ETL data accuracy. As a component of regulatory compliance, the CAAS system manages the formulation of de-identified patient-level datasets and provides a solution to manage and respond in a timely manner to rejected, edited records/reports from HHS.
CAAS serves as a staging warehouse and processing system where all pertinent submission data is stored, and on which analytics are run to identify the data appropriate for submission including:
- •
- The maintenance of longitudinal matching between the de-identified submission data and the identified data within the
CAAS data warehouse to achieve full lineage and auditability;
- •
- The identification of eligible claims for risk adjustment calculations, and codification/indexing of claims excluded from
calculations for quality assurance analysis;
- •
- The replication of HHS risk models to calculate risk scores based upon available data;
- •
- The assignment of patients into models and risk score calculation categories;
- •
- The calculation of risk score components including demographic factors, Hierarchical Condition Categories, or HCCs, HCC
groups, interactions, severity adjustment, and cost sharing reduction adjustments; and
- •
- Accumulation calculations of patient-specific costs against attachment points and caps for reinsurance submissions.
110
INDICESTM. Our INDICES toolset is an enterprise-level, web-enabled business intelligence reporting toolset that provides visualization of data and results to authorize client users via dashboards, reports, and ad hoc queries. INDICES is built on online analytical processes (OLAP) technologies to integrate our clients' data (e.g., patient, enrollment, lab results, pharmacy, claims, etc.), the results from our data analytics and data-driven interventions, and benchmark information from our MORE2 Registry, to provide our clients with the ability to gain insight into the multiple facets of their patients, providers, and facility network. INDICES supports our clients' goals to improve the quality of care provided to patients, drive financial performance, and aid in the support of their strategic business and care decisions.
In addition to enabling real-time insight into common considerations such as utilization, member demographics, and financial performance across populations and customized cohorts, the INDICES toolset also provides valuable business intelligence into the analysis of highly complex and valuable considerations in healthcare. For example, INDICES can provide users patient-level risk sub-segmented by plan-defined characteristics; population, cohort, and patient-level premium revenue and risk-adjusted revenue sub-segmented by plan-defined characteristics; population, cohort, and patient-level reinsurance accumulation sub-segmented by plan-defined characteristics; population, cohort, and patient-level medical loss ratios sub-segmented by plan-defined characteristics; and population, cohort, and patient-level Edge Server processing analysis and results reconciliation. Further, INDICES provides insight into highly sophisticated analytics such as quality outcome score projections for future reporting periods which necessarily take into consideration the impact of national score projections on individual Star rating thresholds as set by CMS.
Our Clients
For over 16 years, we have provided quality services to our clients. During that time, we have built a leading position and have become a true thought leader and innovator in our industry. We have achieved significant scale, and we believe that we play a key role in the U.S. healthcare market. During 2014, we had more than 100 clients providing services to approximately 200 patient populations through hundreds of separate statements of work. Our clients include the largest health plans in the nation, 17 of the top 25 health plans by size as reported by Atlantic Information Services, accreditation organizations, physician organizations, pharmaceutical companies, academic institutions, and group purchasing organizations. For the year ended December 31, 2013, Blue Cross Blue Shield of Michigan, EmblemHealth, HealthFirst, and WellCare each accounted for between 10% and 12% of our total revenue. As of the date of this prospectus, we expect that Independence Blue Cross and Anthem (formerly known as WellPoint) could each account for between 10% and 12% of our total revenue for the year ending December 31, 2014, with no other client currently expected to account for 10% or more of our total revenue. During 2014, we provided
111
services to a broad and diverse group of clients of various sizes in markets around the country, including, among others, the following clients:
Access
Medicare
Amerigroup Corporation
Amerigroup Georgia
Amerigroup Nevada
Amerigroup Virginia
Amerigroup New Mexico, Inc.
Amerigroup Texas, Inc.
America's Health Insurance Plans (AHIP)
AmeriHealth Caritas (the new name of Amerihealth
Mercy Health Plan)
Arkansas BlueCross BlueShield
AultCare Corporation
McKinley Life Insurance Company
Aultra Administrative Group
Blue Cross Blue Shield Alabama
Blue Cross Blue Shield of Minnesota
Blue Cross Blue Shield of North Carolina
Blue Cross of Idaho Health Services, Inc.
Blue Cross Blue Shield of South Carolina
Blue Cross of Northeastern Pennsylvania
Boston Health Economics, Inc.
Boston Medical Center HealthNet Plan
Orange County Health Authority, a public agency dba
Orange Prevention and Treatment Integrated
Medical Assistance dba CalOptima (CalOptima)
Cardinal Health
CareFirst BlueCross BlueShield of Maryland
CareMore Health Plan
Cigna Corporate Services, LLC (Health Spring, Inc.)
Cirdan Health Systems
Citizens Choice Healthplan
Community First Health Plans, Inc.
Community Health Alliance Mutual Insurance Company
D/B/A Community Health Alliance (CHA)
Compass Rose Benefits Group
Comprehensive Health Management, Inc. (WellCare)
Consumer's Choice Health Plan
Coventry Management Services, LP
Easy Choice Health Plan, Inc.
Easy Choice New York
Elderplan, Inc.
EmblemHealth, Inc.
Health Insurance Plan of Greater New York (HIP)
Group Health Incorporated (GHI)
Connecticare of New York, Inc.
Family Care, Inc.
First Medical Health Plan, Inc. (d/b/a First Plus)
Global TPA, LLC (Freedom Health, Inc., Optimum
HealthCare, Inc., America's 1st Choice
Insurance Company of NC, Inc., and
America's 1st Choice Health Plans, Inc.)
Geisinger Health Plan
Geisinger Indemnity Insurance Company
Geisinger Quality Options, Inc
Government Employees Health Association. Inc. (GEHA)
Health Care Services Corporation (HCSC)
Blue Cross and Blue Shield of Illinois
Blue Cross and Blue Shield of Texas
Blue Cross and Blue Shield of New Mexico
(including Lovelace Health Plan of New Mexico)
Blue Cross and Blue Shield of Oklahoma
Health Partners of Philadelphia, Inc.
Healthfirst Health Plan of New Jersey, Inc.
Healthfirst
PHSP, Inc.
HealthNow New York, Inc. (d/b/a BlueCross BlueShield
of Western New York and Blue Shield of Northeastern
New York)
HealthPlus PHSP, Inc.
Heart Rhythm Society
Independence Blue Cross (IBC)
Independent Care Health Plan (iCARE)
Independent Health Association, Inc.
Indiana University Health Plans, Inc. (f/k/a Clarian Health
Plans, Inc.)
Inland Empire Health Plan
The University of Florida Board of Trustees on Behalf of
the Institute for Child Health Policy
INTotal Health
Johns Hopkins HealthCare, LLC
Johns Hopkins Health System Corporation
L.A. Care Health Plan
Louisiana Health Cooperative
Managed Health, Inc.
Healthfirst, Inc. of New York
Medicaid Health Plans of America (MHPA)
Medicaid Health Plans of America
Center for Best Practices (MHPA-CBP)
Medical Mutual of Ohio
Mercy Care Insurance Company, Inc.
MetroPlus Health Plan, Inc.
Moda Health (ODS Health Plan)
Molina Healthcare, Inc.
Montefiore HMO, LLC
National Committee for Quality Assurance (NCQA)
Neighborhood Health Plan of Rhode Island
New West Health Services
Uniform Services Family Health Plan at Pacific Medical
Centers
URAC
Paramount Health Care
Partnership Health Plan of California
ProCare Health Plan
Qualchoice of Arkansas, Inc.
Rocky Mountain Health Maintenance Organization, Inc.
Royal Health Care, Inc.
Scott and White Health Plan
Security Health Plan of Wisconsin, Inc.
Sentara Health Plans, Inc.
South Country Health Alliance
South Florida Community Care Network (SFCCN)
SummaCare Health Plan, Inc.
Time Insurance Company (Assurant Health)
John Alden Life Insurance Company
Union Security Insurance Company
Total Health Care, Inc.
Total Health Choice
Touchstone HMO Health Plan
Trillium Community Health Plan, Inc.
Triple-S Salud, Inc.
Socios Mayores en Salud, Inc.
American Health Inc.
Trusted Health Plans, Inc.
University of Utah
University Physicians Health Plans
University Physicians Healthcare
Vertex Pharmaceuticals
Virginia Premier Health Plan
112
Client Case Studies
The following examples illustrate how we bring together our deep analytics and intervention platform.
Regional Medicare Advantage Health Plan. A regional provider-owned organization operating Medicare Advantage health plans and managed Medicaid health plans was facing rising financial pressures from increasing healthcare cost trends, combined with structural reimbursement constraints from government payors. Further, the mix of highly ill, dual eligible Medicare and Medicaid patients was driving average costs higher than expected due to the illness level of this population, while hindering the plan's ability to achieve its quality goals of achieving 4 out of 5 Stars in the CMS Five-Star program, having achieved only 3 out of 5 Stars at the time of our engagement.
This organization started working with our platforms for its Medicare Advantage membership in 2009. In 2011, they expanded their relationship with us applying our platforms to their managed Medicaid membership while also expanding their use of our prospective predictive analytics capabilities. These services deployed the combined set of the following integrated toolsets to achieve the goals of the organization: iPORT data integration toolset, PCIS disease and comorbidity predictive analytics toolset, QSI clinical and quality outcomes analytical toolset, MMDM intervention activity planning analytical toolset, ePASS clinical encounter support toolset, iTCC patient and provider communication coordination toolset, and INDICES business intelligence toolset.
Supported by our solutions, this organization has grown its Medicare Advantage footprint from approximately 80,000 members to nearly 150,000 members over the course of our engagement, and has improved its CMS Five-Star rating from 3 to 4 Stars. The financial performance of its managed Medicaid population has increased, membership has expanded, and the organization has successfully acquired an additional health plan, increasing its total managed Medicaid population from approximately 250,000 members at the beginning of our relationship to nearly 600,000 members today. Further, this organization has launched a commercial Qualified Health Plan on its State Exchange, and has begun to enroll patients and has decided to apply our platforms to this population of patients as well.
National Commercial Individual and Small Group Health Plan. A nationwide organization providing commercial insurance coverage for the individual and small group markets was facing a sea-change in how these populations are obtained and serviced in light of the Affordable Care Act, and the pressures introduced therein to drive improvements in clinical quality, data accuracy, and medical loss ratio limitations. Serving tens of thousands of customers representing hundreds of thousands of patients, this organization needed support in effectively managing data and utilizing tools to understand each patient, their needs, their transition from legacy coverage to ACA compliant coverage, and the need to properly understand the risk burden of their population to ensure that data needed for government premium stabilization programs is properly submitted.
This organization selected our commercial ACA analytics and data-driven intervention platforms to drive improvements in data accuracy to clarify the illness burden of its patients and to assist the health plan's physicians in understanding the illnesses of the patients and to ensure that such information is properly submitted to the Federal Government. These services deployed the combined set of the following integrated toolsets to achieve the goals of the organization: iPORT data integration toolset, PCIS disease and comorbidity predictive analytics toolset, MMDM™ intervention activity planning analytical toolset, ePASS clinical encounter support toolset, iTCC patient and provider communication coordination toolset, CAAS business processing toolset, and INDICES business intelligence toolset.
113
Supported by our platforms, this organization is working to begin transitioning its legacy commercial customers into Qualified Health Plans, is engaging with practice groups to more fully understand its patient population so that the accurate complexity of its patient's illness levels can be understood and properly reported, and will begin to enroll patients on multiple State and Federal Exchanges in the 2015 open enrollment cycle.
Pharmaceutical Research Support Entity. A nationally recognized academic research institution was engaged by a global pharmaceutical company to investigate the potential difference in the observed incidence of cancer following treatment with alternative long-acting insulin regimens. This pharmaceutical company was concerned with the potential side effects of these drugs and the assurance that that such drugs are not inappropriately removed from treatment without strong scientific rigor to inform such decisions.
This organization engaged us to study the outcomes and cancer incidence rates observed within our MORE2 Registry. This service deployed the combined set of the following integrated toolsets to achieve the goals of the organization: iPORT data integration toolset, the QSI clinical and quality outcomes analytical toolset, and the QSCL big data analytics engine, empowered by the millions of de-identified and longitudinally matched patient lives resident within the MORE2 Registry.
Supported by our platforms, this organization published the results of this scientific study in the Journal Diabetes Care in July 2013, disproving the hypotheses of increased cancer incidence rates associated with long-acting insulin regimens, which was co-authored by our research staff.
Client Services Support
Because our analytics and data-driven intervention services speak to a complex set of industry pressures, we have chosen to structure our client services organization around associates with industry-leading subject matter expertise. This approach affords our clients the opportunity to leverage their client services support as consultative partners, providing greater opportunity to maximize the value clients receive from our platforms. By interacting with our clients in this manner, we are able to leverage our associate industry-specific knowledge to better anticipate client needs and identify opportunities for our clients in the markets they serve. We believe our clients highly value this differentiated approach and, along with it, the industry, technological, and product expertise our associates possess.
Client services support teams are assigned to our clients, and receive support from client service general managers and their teams of subject matter experts. The client service general managers are responsible for the end-to-end delivery of our solutions and contractual commitments.
Sales and Marketing
We believe that our sales and marketing initiatives are key to capitalizing on our significant market and growth opportunities. While we have successfully leveraged our sales and marketing as we have grown, we believe that additional strategic investments in sales and marketing will enable us to increasingly seize on the healthcare industry's need for data analytics and data-driven intervention services.
We sell our platform primarily through three avenues:
- •
- Business development led by product and management personnel: We benefit significantly from the subject matter expertise, market credibility, thought leadership, and relationships of our executives, senior management, and product leaders within the industry. They have played, and are expected to continue to play, a significant role in the establishment and ongoing development of our client relationships.
114
- •
- Business Development led by dedicated sales personnel: We
have a dedicated, direct sales team which is comprised of focused field sales professionals who are organized principally by geography and product type. Our dedicated sales personnel are supported by
a sales operations staff, including product technology experts, lead generation personnel, and sales data personnel.
- •
- Business development led by strategic channel relationships: We increasingly are developing and expect to expand our use of strategic partnerships and channel relationships for the establishment and development of new and existing clients.
Our marketing and communications strategies are centered on initiatives that drive awareness of our company and capabilities. These initiatives include: educating the market about our company broadly; hosting speaking engagements; disseminating articles discussing data trends and metrics, and strategic interfacing with key business and trade media personnel. We employ a broad array of specific events to facilitate these initiatives, including but not limited to:
- •
- Sponsorship and partnership of key industry conferences;
- •
- Client-focused events and programs;
- •
- Hosting our annual Client Congress highlighted by healthcare leaders, industry icons and senior government officials
sharing best practices, strategies, and trends;
- •
- Web and social properties, digital and video content marketing, creative online advertising, and blogs; and
- •
- Hosted webinars, direct mail, analyst relations, and media relations.
In addition, in order to enhance our value proposition, our sales and marketing staff develop best practices tools, case studies, and educational materials to drive deeper client utilization and engagement.
Our Name and Logo
"Innovation" is not an occasional formulation for us, but a deliberate and persistent signature form. It is built in a causal sequence on three principles: Insight, Intervention, and Impact. "Inovalon" binds these foundations — conveying what we are — and the culture we bring forward and champion.

Our logo illustrates our company's process in a highly visual manner. The spiral represents the face of a complex mechanical watch, interconnectivity underneath and a simple display on the
115
front. This symbolizes Inovalon. We are committed to bringing together the complex array of data-driven solutions which are driving meaningful insight and improvement in healthcare — and doing so in a way that appears effortless.
Operations
Our operations are divided into two groups. Our IT operations group manages the process steps from data receipt through to the generation of analytical outputs. Our services operations group manages the process steps applied to achieve impact through our data-driven intervention platforms.
IT Operations Group
We achieve excellence in the operation of our technology based on a foundation of service management aligned with data integration, data provisioning, system support, and security operations. These operational processes are measured clearly through a framework of key performance indicators, which seek to provide an optimal level of transparency and control. The figure below provides an illustrative overview of our IT operations group's processes:
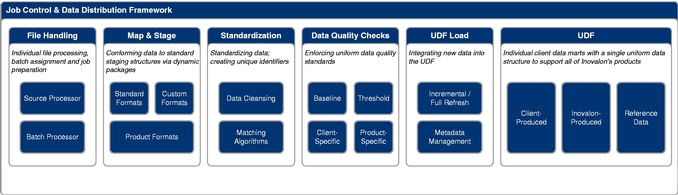
We have implemented a rigorous command and control structure for maintaining availability of production systems and ensuring the security of technology infrastructure. Our NOC is responsible for monitoring network and systems, security incident response, and management and communication as well as the oversight of planned system maintenance. The personnel of the NOC are also responsible for invoking our business continuity plan when appropriate.
The security operations within our NOC maintains the confidentiality, integrity, and availability of our production systems and technology infrastructure by maintaining security situational awareness, as well as coordinating security incident response and proactively protecting sensitive data. The security operations team utilizes a variety of tools and techniques to identify, contain, remediate, and gather intelligence on both known and emerging technology threats. Reports are tracked through automated event management triggers and communicated to leadership through our business service management layer.
116
We have a comprehensive framework for managing change control, problem management, incident and event management, service management, and production operations. We use a defined quality change control management system for managing technology changes.
Product support integration across all of our solutions enables commonality of processes — allowing our clients to benefit from increased technology operational efficiencies. Regardless of the efficiences achieved, we are continuously enhancing our technology product operations through the dedication of the process automation and performance assurance team focused on designing and deploying zero-touch capabilities while ensuring that systems and support processes achieve service level agreements (SLAs).
Services Operations Group
Many of our clients utilize the analytical outputs of our platform to feed into their own internal systems to achieve value within the provider and patient base. Other clients license our data-driven intervention platforms to facilitate the realization of value from our analytics. For still other clients, our service support personnel operate our data-driven intervention platforms to deliver end-to-end value realization. For these clients, through the implementation of our sophisticated platforms, we leverage our analytical output to provide data-driven intervention support services at the varying points of care necessary to achieve the goals of our clients. This unique end-to-end approach implements the solutions necessary to turn insight into meaningful impact and realized value on a national scale.
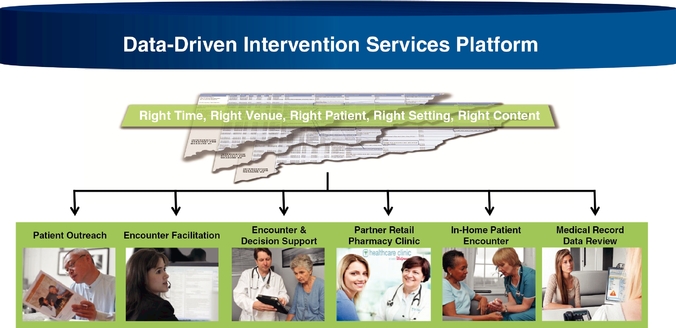
One of the centerpieces of our services operations is our strong management systems which serve as vehicles to drive transparency, ownership and execution. We enable our management systems to allow general managers and operational Leaders the ability to "see around the corner," and be ambidextrous in how they balance achieving efficiency gains while also focusing on exceptional client value delivery.
Competition
We compete with a broad and diverse set of businesses. We believe the competitive landscape is highly fragmented with no single competitor offering similarly expansive capabilities and solution offerings in healthcare data analytics and data-driven interventions. Our primary
117
competitive challenge is to demonstrate to our existing and potential clients the value of utilizing our platforms rather than developing or assembling their own alternative capabilities. However, we believe that the combination of our competitive strengths and successful culture of innovation, including our industry-leading analytics and data asset, the time-tested and real-world-tested nature of our platforms, and subject-matter expertise of our associates, make it time and cost prohibitive for our clients to replace or replicate all that we offer without facing material risk.
The competitive landscape can be characterized by the following categories of companies that provide capabilities or solutions that compete with one or more components of our platforms:
- •
- Providers of enterprise-scale, industry agnostic IT solutions, such as Oracle, Dell, SAP, SAS, and IBM;
- •
- Large-scale IT consultants and third-party service providers, such as Accenture and Deloitte Consulting;
- •
- Large-scale healthcare-specific solutions providers, such as McKesson, OptumHealth, Truven, and Verisk;
- •
- Point solution providers, such as DST Health, The Advisory Board, Alere, Altegra, Matrix, edifecs, and Silverlink.
Thought Leadership and Subject Matter Expertise
Industry-Leading Research Team. Our research team has significant research experience that includes advanced econometric and predictive modeling expertise, and the development and implementation of clinical research designs. The team includes PhDs in Economics/Econometrics, Pharmacy, Molecular Genetics, Psychology, and Public Health, multiple MS degrees in Social Medicine and Healthcare Administration, Experimental Psychology, Economics, and Biostatistics, experienced in big data and geo-mapping. In addition, dedicated medical doctors on the team and contributing medical doctor personnel within the broader company are dedicated to the research and development of our technologies.
Our subject-matter experts are sought-after for research focusing on:
- •
- Health economics and outcomes research and population health studies;
- •
- Evaluating comparative effectiveness of health plan programs, practice groups, and treatments;
- •
- Development and testing of new quality performance measures;
- •
- Assessing cost effectiveness of medical care and interventions; and
- •
- Identifying meaningful impact in clinical outcomes and financial performance.
Industry-Leading Database Resources. Our research group combines advanced modeling and statistical analysis expertise with the power of our MORE2 Registry. Additionally, the research team leverages a wide range of healthcare database resources, including PHARM data, Area Health Resource Files, survey databases, market source geo data including detailed socioeconomic and sociodemographic data at the zipcode level, household and individual level, cost data, and other health data files.
Strategic Partnerships. Our research team has developed relationships throughout the healthcare service delivery community. This has resulted in a variety of funded research engagements that have provided valuable insight into the healthcare challenges facing stakeholders within the healthcare industry from payors to regulators, health plans to practice groups, and pharmaceutical companies to trade associations. The following highlights some of this work.
118
National Committee for Quality Assurance: NCQA is a not-for-profit organization dedicated to improving healthcare quality. NCQA has played a key role in driving improvement throughout the healthcare system and helping to elevate the issue of healthcare quality to the top of the national agenda. NCQA has repeatedly contracted our research team to assist with quality measure testing work beginning in 2010. The research team has utilized our large nationally representative Medicare Advantage database to develop and/or validate several key quality measures for NCQA:
For a CMS contract, NCQA subcontracted with us to assist with testing and refining the high profile quality measure, Health Plan All-Cause Hospital Readmission measure, or PCR, which has been adopted by CMS for the Five Star quality measurement program, giving purchasers, including CMS, additional insight into the quality of care provided to Medicare beneficiaries.
NCQA has also subcontracted with us to assist in testing and refining a new measure of hospitalizations for potentially preventable complications (HPC) by testing alternate statistical models. The final coefficients will be used by NCQA to calculate case-mix adjusted rates, or expected rates, for PCR and PAH measures at the H-contract level to measure plan performance.
We supported NCQA to test two new overuse measures: (1) Non-Recommended PSA-Based Screening in Older Men and (2) Non-Recommended Colorectal Cancer Screening in Older Adults. This work was presented jointly at the Academy Health Annual Research Meeting in San Diego in June 2014.
Industry Dual Eligible Study: Patients who are eligible for both Medicare and Medicaid, referred to as Dual Eligibles, have been found to suffer from health disparities in achieving high quality outcomes of care compared to non-dual patients. In 2013 we investigated this issue and published the industry's largest study on this phenomena, entitled "The Impact of Dual Eligible Populations on CMS Five-Star Quality Measures and Patient Outcomes in Medicare Advantage Health Plans," released on October 30, 2013. This study was widely reviewed and prompted several industry leaders to approach the company and request further analysis into factors within the vulnerable population that statistically impact the achievement of certain quality outcomes given the same quality of care. Working with the senior management of multiple health plans (encompassing large, small, national, regional, publicly traded, and non-profit organizations) and in consultation with CMS and other key stakeholders, Inovalon is undertaking a more in-depth analysis of 2.3 million Medicare Advantage patients (28% of whom are dual eligible) making it the largest study of its type ever undertaken by the industry to examine these issues.
America's Health Insurance Plan, or AHIP: This is the national trade association representing the health insurance industry. AHIP's members provide health and supplemental benefits to more than 200 million Americans through employer-sponsored coverage, the individual insurance market, and public programs such as Medicare and Medicaid. AHIP's Center for Policy and Research conducts and publishes original research and provides analysis and commentary on the research of others. We have been asked to collaborate with AHIP on a variety of research efforts, including the study of Medicare Advantage readmissions which became one of the largest studies of this type ever performed. This work resulted in the publication of this research within the American Journal of Managed Care in 2012: Lemieux J, Sennett C, Wang R, Mulligan T, Bumbaugh J.; Hospital Readmission Rates in Medicare Advantage Plans. American Journal of Managed Care. 18(2) 2012: 96-104.
The Heart Rhythm Society, or HRS: This is a leading international organization in science, education, and advocacy for cardiac arrhythmia professionals and patients. HRS engaged our research team to test a new measure for heart rhythm care, "cardiac tamponade and/or pericardiocentesis following atrial fibrillation ablation." Our team leveraged our datasets and analytical platforms to generate physician and facility level measure scores using a three year
119
rolling average criteria to support performance gap, validity, and reliability testing for submission to the NQF. This research was presented at the American Heart Association annual Quality Care Outcomes Research conference in Baltimore in June 2014.
Inovalon Research Team Conference Presentations: The research team further enhances our contribution to improvement of health care by publishing and presenting results impacting many diverse areas of the nation's health care delivery system. Over the past two years we have presented at over 20 major academic, research, and healthcare-related conferences and have published multiple peer-reviewed manuscripts in widely cited industry journals.
Intellectual Property
We rely on copyright, trademark, and trade secret laws as well as confidentiality agreements, licenses, and other agreements with employees, consultants, vendors, and customers. We also seek to control access to and distribution of our proprietary software, confidential information and know-how, technology, and other intellectual property. Historically, because our initial technological innovations were primarily algorithmic in nature, these innovations were well suited to trade secret protection. Accordingly, and due to the complex, time intensive, and costly patent process, with somewhat limited utility for business processes, the use of patents has not been compelling for us. However, we have begun to seek patents recently and expect to continue to do so in the future.
We own and use trademarks in connection with our applications and services, including both unregistered common law marks and issued trademark registrations in the United States. Our material trademarks, service marks and other marks include: CAAS, CARA®, Caresync Advantage, CCS Advantage®, CEDITM, ChaseWiseTM, Circle Logo®, Data-Driven Improvements in Health CareTM, Distributed AnalyticsTM, EMR AccelerationTM, eCAAS Advantage®, ePASS, Healthcare Empowered®, Healthier Members, Healthier Business®, HEDIS Advantage, HCC SurveillanceTM, HIX Foundation®, iDCT, INDICES, Inovalon, Inovalon — US, Inovalon — EU, Inovalon Healthcare Empowered (and Spiral Design to left) — EU, Inovalon (and Spiral Design on top), Inovalon (and Spiral Design to left), Inovalon Healthcare Empowered (and Spiral Design on top), Inovalon Healthcare Empowered (and Spiral Design to left) — US, Inovalon Healthcare Empowered (wordmark), Insights: a business intelligence solution, iPORT, iTCC, MORE2 Registry, PCIS, Prospective Advantage®, QSCL TM, QSFD, QSI TM, SRSA, Star Advantage®, Turning Data into Insight and Insight into Action®, and We See SolutionsTM. We also have trademark applications pending to register marks in the United States and European Union.
Our Employees
As of December 31, 2014, we had a total of 2,474 associates across four areas: Technology, Innovation and Product, Data-driven Client Services, and Selling, General and Administrative. There were 1,565 full-time associates and 909 part-time associates. None of our associates are represented by a labor union, and all of our associates currently work in the U.S. and its territories (Puerto Rico), and we consider our current relations with our associates to be good.
Requirements Regarding the Privacy and Security of Personal Information
HIPAA and Other Privacy and Security Requirements. There are numerous U.S. federal and state laws and regulations related to the privacy and security of personal information. In particular, regulations promulgated pursuant to HIPAA establish privacy and security standards that limit the use and disclosure of PHI and require the implementation of administrative, physical, and technical safeguards to ensure the confidentiality, integrity, and availability of individually identifiable health information in electronic form. Our health plan customers, as well as healthcare clearinghouses and certain providers with which we may have or may establish business relationships, are covered
120
entities that are regulated under HIPAA. HITECH and the Omnibus Final Rule significantly expanded HIPAA's privacy and security requirements. Among other things, HITECH and the Omnibus Final Rule make HIPAA's privacy and security standards directly applicable to "business associates," which are independent contractors or agents of covered entities that create, receive, maintain, or transmit PHI in connection with providing a service for or on behalf of a covered entity. Under HIPAA and our contractual agreements with our customers, we are considered a "business associate" to our customers and thus are directly subject to HIPAA's privacy and security standards. In order to provide our covered entity clients with services that involve the use or disclosure of PHI, HIPAA requires our clients to enter into business associate agreements with our clients. Such agreements must, among other things, require us to:
- •
- limit how we will use and disclose PHI;
- •
- implement reasonable administrative, physical, and technical safeguards to protect such information from misuse;
- •
- enter into similar agreements with our agents and subcontractors that have access to the information;
- •
- report security incidents, breaches, and other inappropriate uses or disclosures of the information; and
- •
- assist the customer in question with certain of its duties under the privacy standards.
In addition to HIPAA, HITECH, and their implementing regulations, we may be subject to other state and federal privacy laws, including laws that prohibit unfair privacy and security practices and deceptive statements about privacy and security and laws that place specific requirements on certain types of activities, such as data security and texting. We may also be subject to state medical record privacy laws, which may be more strict than HIPAA, including the laws of the state of California.
Data Protection and Breaches. In recent years, there have been a number of well-publicized data breaches involving the improper use and disclosure of individuals' personal information. Many states have responded to these incidents by enacting laws requiring holders of personal information to maintain safeguards and to take certain actions in response to a data breach, such as providing prompt notification of the breach to affected individuals and state officials. In addition, under HIPAA and pursuant to our business associate agreement obligations, we must report breaches of unsecured PHI to our contractual partners following discovery of the breach. Notification must also be made in certain circumstances to affected individuals HHS and the media.
We have implemented and maintain physical, technical, and administrative safeguards intended to protect individually identifiable health information and have processes in place to assist us in complying with all applicable laws, regulations, and contractual requirements regarding the protection of these data and properly responding to any security breaches or incidents. Furthermore, in many cases, applicable state laws, including breach notification requirements, are not preempted by the HIPAA privacy and security standards and are subject to interpretation by various courts and other governmental authorities, thereby complicating our compliance efforts. Where a state law is not preempted by HIPAA, we may also be subject to that state law's requirements, in addition to our obligations under HIPAA, HITECH, and their implementing regulations. Additionally, state and federal laws regarding deceptive practices may apply to public assurances we give to individuals about the security of services we provide on behalf of our contractual customers.
Other Requirements. In addition to HIPAA, numerous other U.S. state and federal laws govern the collection, dissemination, use, access to, and confidentiality of individually identifiable
121
health information and healthcare provider information. Some states also are considering new laws and regulations that further protect the confidentiality, privacy, and security of medical records or other types of medical information. Further, Congress and a number of states have considered or are considering prohibitions or limitations on the disclosure of medical or other information to individuals or entities located outside of the United States.
Facilities
Our corporate headquarters is located in Bowie, Maryland, where we occupy approximately 105,000 square feet under a lease agreement that expires in August 2018. In addition, we lease an aggregate of approximately 230,000 square feet at the following locations: Columbia, Maryland; a second facility in Bowie, Maryland; Annapolis, Maryland; Herndon, Virginia; Lansing, Michigan; Tampa, Florida; and Phoenix, Arizona. We own one property in Snellville, Georgia, which is approximately 12,000 square feet. In addition, we maintain a number of leases for smaller office facilities in various locations in the regions of our clients coinciding with specific client needs.
We currently have two expiring leases, one in Annapolis, Maryland in February 2015 and the other in Tampa, Florida in June 2015, neither of which we intend to renew. These lease expirations will reduce our square footage under lease by approximately 55,000 square feet. We believe our facility footprint is adequate to meet our needs for the immediate future. Suitable facilities should be available at reasonable market terms should additional space be required.
Legal Proceedings
From time to time, we may be involved in various legal proceedings and subject to claims that arise in the ordinary course of business. Although the results of litigation and claims are inherently unpredictable and uncertain, we are not currently a party to any legal proceedings the outcome of which, if determined adversely to us, are believed to, either individually or taken together, have a material adverse effect on our business, operating results, cash flows or financial condition. Regardless of the outcome, litigation has the potential to have an adverse impact on us because of defense and settlement costs, diversion of management resources, and other factors.
122
Executive Officers and Directors:
The following table provides information regarding our executive officers and directors as of the date of this prospectus:
Name
|
Age
|
Position
|
||
|---|---|---|---|---|
Keith R. Dunleavy, M.D. |
45 | Chief Executive Officer and Chairman of the Board | ||
Robert A. Wychulis |
59 | President | ||
Christopher E. Greiner |
39 | Chief Product and Operations Officer | ||
Thomas R. Kloster |
54 | Chief Financial Officer | ||
Daniel L. Rizzo |
37 | Chief Innovation Officer | ||
Jason Z. Rose |
43 | Chief Strategic Development Officer | ||
Joseph R. Rostock |
52 | Chief Technology Officer | ||
Shauna L. Vernal |
45 | Chief Legal Officer and Corporate Secretary | ||
Denise K. Fletcher(1) |
66 | Director | ||
André S. Hoffmann(1) |
56 | Director | ||
Lee D. Roberts(1) |
62 | Director | ||
William J. Teuber Jr.(1) |
63 | Director |
- (1)
- Independent within the meaning of NASDAQ Marketplace Rule 5605(a)(2).
Executive Officers
Keith R. Dunleavy, M.D., Chief Executive Officer and Chairman of the Board
Dr. Dunleavy has served as our Chief Executive Officer since his organization of the company's predecessor companies in 1998, as Chairman of the board of directors since the creation of the board in 2006, and as President from the company's foundation until May of 2014. Dr. Dunleavy is responsible for the overall execution of the company's business plan, strategic relationships, and the identification and realization of company product strategy and vision. During his tenure building Inovalon, Dr. Dunleavy has worked extensively with a wide array and number of healthcare organizations, regulatory and oversight bodies, and technology companies examining the growing role of data within healthcare, and its ability to drive meaningful insight and improvement for its constituents. Dr. Dunleavy serves as a Director on the Dartmouth Medical School Board of Overseers, has authored or co-authored a number of scientific journal articles, abstracts, and proprietary research papers, and has presented his work and materials at multiple national and international conferences. Dr. Dunleavy received a Bachelor's degree in Biology modified with Engineering with High Honors from Dartmouth College, where his studies and work focused upon the neurosciences, computer sciences and engineering with his honors thesis focused on the computer simulation of artificial human cerebellar functional units. He earned his doctorate in medicine from Harvard Medical School, completed his medical residency at The Johns Hopkins Hospital in Baltimore, Maryland, and practiced and was Board Certified in Internal Medicine.
We believe that Dr. Dunleavy's knowledge of our company and its business and his extensive experience in the healthcare industry qualifies him to serve as the chairman of our board of directors.
Robert A. Wychulis, President
Mr. Wychulis has served as our President since May 2014. In this role, Mr. Wychulis serves as the general manager of the company, ultimately responsible for all aspects of the company's goals
123
and commitments around day-to-day product and service delivery, performance, support, and client value achievement. Prior to joining Inovalon, from 2008 to May 2014, Mr. Wychulis served as the President of the WellPoint New York government program health plan, HealthPlus, an Amerigroup company, where he was responsible for the management of the company's product portfolio within the New York region. Prior to joining WellPoint/Amerigroup, from 2003 to 2008, Mr. Wychulis served as President and CEO of the Florida Association of Health Plans, where he grew the association from eight to 26 plans in four years. From 1995 to 2002, Mr. Wychulis served as President and CEO of HealthPlan Southeast, a North Florida managed care company comprised of state employee, commercial and Medicaid/CHP contracts.
Mr. Wychulis received his Bachelor of Political Science degree from the City College of New York and his Masters of Health Administration and Planning from the Wagner School of Public Administration at New York University.
Christopher E. Greiner, Chief Product and Operations Officer
Mr. Greiner has served as our Chief Product and Operations Officer since May 2014. In this role, Mr. Greiner is responsible for managing and overseeing the implementation, service delivery, performance and reporting of all of our developed product and solution groups of the company. Prior to joining Inovalon as Chief Product Officer in May 2013, from November 2012 to April 2013, Mr. Greiner served as a Vice President at Computer Sciences Corporation, where he was responsible for financial management of the company's commercial portfolio. From April 1999 to November 2012, Mr. Greiner served as the combined Chief Operating Officer and Chief Financial Officer of IBM's Business Analytics division, formally known as Cognos. Prior to this position, Mr. Greiner was responsible for IBM's global services business based in Shanghai, China, and Tokyo, Japan. Additionally, Mr. Greiner fulfilled multiple roles in finance and operations both within IBM's U.S. business and overseas operations in Australia, India, China, Hong Kong, Taiwan, and Singapore.
Mr. Greiner received a Bachelor of Business Administration in Finance and Economics from Baylor University.
Thomas R. Kloster, C.P.A. (inactive), Chief Financial Officer
Mr. Kloster has served as our Chief Financial Officer since March 2014. In this role, Mr. Kloster is responsible for the oversight of all financial activities, including financial reporting, treasury, tax, budgeting and forecasting, and audit, as well as facility management. Prior to joining Inovalon, from August 2011 to January 2014, Mr. Kloster served as the Chief Financial Officer at Algeco Scotsman, where he led all financial aspects of this $2.1 billion private-equity-owned entity operating in 35 countries. Prior to Algeco Scotsman, from September 2010 to July 2011, Mr. Kloster was the sole managing partner of Austin Partners, LLC, a financial and accounting project based consuting firm. From May 1996 to May 2000 and from August 2003 to September 2010, Mr. Kloster served in various financial roles, including as Chief Financial Officer from January 2005 to September 2010 for Primus Telecommunications Group, Inc. (now HC2 Holdings Inc.), where he oversaw the financial growth of the company from a private start-up to a publicly traded multinational corporation. Primus Telecommunications Group, Incorporated filed for Chapter 11 bankruptcy on March 16, 2009, but re-emerged from bankruptcy on July 1, 2009. From 2001 to 2003, Mr. Kloster served in senior operations and accounting positions at Sprint Corporation and, from 1994 to 1996, in senior accounting positions with MCI Communications Corporation. Mr. Kloster also served as the Chief Financial Officer for Cidera, Inc. from 2000 to 2001, where he was responsible for the operation of all financial functions, capital financings, investor relations, and banking relationships. Prior to his tenure in finance positions within the telecommunications industry, Mr. Kloster held roles
124
focusing on auditing within PricewaterhouseCoopers LLP and Ernst & Whinney LLP from 1982 to 1994.
Mr. Kloster earned a Bachelor of Science degree in business administration from the University of Texas, and he is a certified public accountant (inactive).
Daniel L. Rizzo, Chief Innovation Officer
Mr. Rizzo has served as our Chief Innovation Officer since March 2012. In this role, Mr. Rizzo is responsible for the coordination and oversight of new product development and material product updates and expansions of capability, including design, functionality, development, quality testing processes, and modularized rollouts and operational expansions. Mr. Rizzo is also responsible for all aspects of our dataset assets, including processes to support and achieve the high integrity, reliability, and security; accuracy and efficiency of integration; comprehensive policies and procedures for the access and utilization; and ultimate realization of value for the company, clients, and the healthcare community. In addition to these roles, Mr. Rizzo serves as our Security Officer. Prior to assuming his current position with Inovalon, from January 2010 to March 2012, Mr. Rizzo served as our Chief Product Officer. Before serving as our Chief Product Officer, from May 2008 to January 2010, Mr. Rizzo served as our Chief Product Technology Officer. Prior to joining Inovalon, Mr. Rizzo served in various roles for Founding Advisors, Inc., a specialized management consulting firm. Before joining Founding Advisors, Mr. Rizzo was a senior consultant at Arthur Andersen, LLP where he advised clients in the healthcare, telecommunications, and insurance industries.
Mr. Rizzo holds the Chartered Financial Analyst designation, and he graduated Summa Cum Laude with a bachelor of arts degree in Business Administration from Loyola College in Maryland.
Jason Z. Rose, Chief Strategic Development Officer
Mr. Rose has served as our Chief Strategic Development Officer since September 2013. In this role, Mr. Rose is responsible for all aspects of introducing, launching and expanding the company's product and technology presence within the healthcare marketplace. Previously, from 2012 to September 2013, Mr. Rose served as our Senior Vice President, Business Development, and prior to that as our Vice President, Care and Quality Management. In this role, he was responsible for the execution of product design, implementation and business development and expansion of the company's care and quality management product solutions. Prior to joining Inovalon, from 2007 to 2008, Mr. Rose served as Senior Vice President of Public Programs Health and Disease Management Services for APS Healthcare, Inc., a provider of specialty healthcare solutions, where he was responsible for overseeing all aspects of Health and Disease Management programs across the Public Programs division. Prior to joining APS Healthcare, from 2004 to 2007, Mr. Rose served as Vice President for INSPIRIS, Inc. where he was responsible for the creation and management of the suite of care management offerings for improving continuity of care across acute and post-acute settings. Before joining INSPIRIS, Mr. Rose served as Assistant Vice President, Information Technology for Ardent Health Services from May 2002 to March 2004. Prior to joining Ardent Health Services, Mr. Rose served as a senior consultant for Cap Gemini Ernst & Young (now Accenture) in addition to Cerner Corporation.
Mr. Rose earned his Masters of Health Services Administration (MHSA) degree from The George Washington University School of Business. Mr. Rose received a Bachelor of Science degree in Psychology from Radford University.
Joseph R. Rostock, Chief Technology Officer
Mr. Rostock has served as our Chief Technology Officer since May 2013. In this role, Mr. Rostock is responsible for the oversight of all design, maintenance, security, connectivity,
125
redundancy, operations, and support of all technology requirements of both internal operations and the services of the company. Prior to joining Inovalon, from July 2011 to April 2013, Mr. Rostock served as the Vice President and Chief Technologist for The Alliance for Telecommunications Industry Solutions, a technology and solutions development organization for the telecommunications industry. From May 1986 to June 2011, Mr. Rostock served in many ascending roles at Verizon Communications Inc., most recently Senior Fellow, a position reserved for executives possessing both deep technology expertise and broad management and leadership skills.
Mr. Rostock received a Bachelor of Arts Degree from Temple University and completed graduate studies in Computer Science at St. Joseph's University.
Shauna L. Vernal, Chief Legal Officer
Ms. Vernal has served as our Chief Legal Officer and Corporate Secretary since August 2013. In this role, she holds responsibility for the planning, management, execution, and oversight of all legal, liability, regulatory, intellectual property, and risk management matters across all aspects of the company. Prior to joining Inovalon, Ms. Vernal served as Chief Legal Officer for Falck USA, a large provider of emergency medical services, from April 2012 to April 2013, where she oversaw all legal aspects of Falck USA's operations, including mergers and acquisitions and other strategic matters. Prior to her tenure at Falck, from September 2000 to March 2012, Ms. Vernal served in various senior strategic legal roles at Microsoft Corporation, including, for nearly nine years, mergers and acquisitions, corporate governance, and securities matters, and lastly, serving as the lead attorney and part of the leadership team for Microsoft's Worldwide Public Sector. Prior to her tenure at Microsoft, from January 1998 to August 2000, Ms. Vernal served as Senior Vice President, Chief Legal Officer, and Corporate Secretary of West Coast Bancorp. Ms. Vernal began her career as an attorney at the law firm of Graham & Dunn, P.C. in Seattle, Washington.
Ms. Vernal received her Juris Doctorate with honors from the University of Washington and her Bachelors of Business Administration, Summa Cum Laude, from California Lutheran University. She also graduated with Honors from Pacific Coast Banking School, executive business management training for financial institution executives and regulators.
Non-Employee Directors
Denise K. Fletcher, Director
Ms. Fletcher has served as a director of Inovalon since 2012. Ms. Fletcher is a former Executive Vice President, Finance of Vulcan Inc., an investment and project company organized by Microsoft co-founder Paul Allen, a position she held from 2005 to 2008. From 2004 to 2005, she served as chief financial officer of DaVita, Inc., a provider of dialysis services in the United States. From 2000 to 2003, she was executive vice president and chief financial officer of MasterCard International, an international payment solutions company. Before joining MasterCard, she served as chief financial officer of Bowne Inc., a global document management and information services provider. Ms. Fletcher is a director of Unisys, a worldwide information technology company, and a member of the supervisory board of Mazars Group, an international organization that specializes in audit, accounting, tax, legal, and advisory services. During 2004 and 2005, she served as a director of Sempra Energy and of Orbitz, Inc.
We believe Ms. Fletcher's significant achievements as a senior corporate financial and operating officer with a wide range of industry experiences, coupled with her service as a director for other public companies, qualifies her to serve as one of our directors and the chairperson of our audit committee. Ms. Fletcher graduated Phi Beta Kappa from Wellesley College and received her master's degree from Harvard University.
126
André S. Hoffmann, Director
Mr. Hoffmann has served as a director of Inovalon since 2008. Since 2006, Mr. Hoffmann has served as the Vice Chairman of the board of Roche Holding, Ltd., one of the world's largest diversified healthcare companies focused on medical diagnostics and treatments, and has served as a board member since 1996. Mr. Hoffmann also has served as Non-Executive Vice Chairman of Givaudan SA, the world's leading flavor and fragrance company, since 2008 and as a non-executive member of the board of directors since 2000. Since 1999, Mr. Hoffmann also has served as the Chairman and owner of Massellaz S.A., a research and advisory company, and, from 2005 to 2013, served as the Chairman and owner of Nemadi Advisors Ltd., a private equity advisory company. Mr. Hoffmann also serves as a director for Genentech Inc., one of the world's largest biotechnology companies, ultimately acquired by Roche, Amazentis SA, a private therapeutics and diagnostics company, and Glyndebourne Productions Ltd., a service company.
We believe that Mr. Hoffmann's experience as the Vice Chairman of one of the world's largest diversified healthcare companies and his significant industry expertise qualify him to serve as one of our directors. Mr. Hoffmann studied economics at the University of St. Gallen and holds a Master of Business Administration from INSEAD.
Lee D. Roberts, Director
Mr. Roberts has served as a director of Inovalon since 2012. Since 2008, Mr. Roberts has served as President and Chief Executive Officer of Bluewater Consulting, an information technology management consulting company. From 2006 to 2008, Mr. Roberts was the Vice President and General Manager, IBM Document & Content Management for IBM Corporation. In 2006, IBM acquired FileNET Corporation, where Mr. Roberts had served as President and Chief Executive Officer from 1997 through 1999, and as Chairman and Chief Executive Officer from 2000 until its acquisition in 2006. Mr. Roberts currently serves on the boards of QAD, Inc., a publicly-traded provider of enterprise resource planning and supply chain software, and Unisys, a worldwide information technology company. Mr. Roberts has also served on the boards of a number of other public and private companies, including, most recently, Varolii Corporation, a privately-held provider of on-demand communications software services.
We believe Mr. Roberts' decades of leadership experience with technology companies and deep understanding of information technology, technology trends and customer requirements qualify him to serve as one of our directors. Mr. Roberts earned Bachelor's degrees in Economics, Biology, and Chemistry at California State University, San Bernardino and his MBA degree with honors at the University of California, Riverside. He completed IBM's Executive International Management Program in Belgium and Executive Management Development programs at Harvard University.
William J. Teuber Jr., Director
Mr. Teuber has served as a director of Inovalon since 2013. Since 2006, Mr. Teuber has served as Vice Chairman of EMC Corporation, a world leader in information infrastructure technology, big data, cloud computing, and data security solutions, where he assists the Chairman, President, and Chief Executive Officer in the day-to-day management of EMC. From 2006 to 2012, Mr. Teuber oversaw EMC Customer Operations, the company's global sales and distribution organization. Mr. Teuber additionally serves as a member of the board of Pivotal Software, a big data and cloud computing company and member of the EMC federation structure. Prior to being appointed Vice Chairman of EMC, Mr. Teuber served as Chief Financial Officer of EMC from 1996 to 2006, where he was responsible for leading the company's worldwide finance operation. Prior to joining EMC, Mr. Teuber was a partner in the Audit and Financial Advisory Services practice of Coopers &
127
Lybrand L.L.P. from 1988 to 1995. Mr. Teuber is the lead director of Popular, Inc., a diversified financial services company that includes Banco Popular as a holding. He is also a Trustee of the College of the Holy Cross.
We believe that Mr. Teuber's significant financial and accounting expertise, his extensive insight into the global big data and cloud computing technology marketplace, and his experience providing strategic direction to a large public technology company, qualify Mr. Teuber to serve as one of our directors. Mr. Teuber holds a Master of Business Administration from Babson College, a Master of Science in Taxation from Bentley College, and a Bachelor's degree from the College of the Holy Cross.
Our executive officers are elected by, and serve at the discretion of, our board of directors. There are no family relationships among any of our directors or executive officers.
Role of the Board in Risk Oversight
One of the key functions of our board of directors is informed oversight of our risk management process. Our board of directors administers this oversight function directly, with support from its four standing committees, the audit committee, the compensation committee, the nominating and corporate governance committee, and the security and compliance committee, each of which addresses risks specific to their respective areas of oversight. In particular, our audit committee has the responsibility to consider and discuss our major financial risk exposures and the steps our management has taken to monitor and control these exposures, including guidelines and policies to govern the process by which risk assessment and management is undertaken. Our compensation committee assesses and monitors whether any of our compensation policies and programs have the potential to encourage excessive risk-taking. Our nominating and corporate governance committee monitors the effectiveness of our corporate governance guidelines and code of business conduct and ethics, including whether they are successful in preventing illegal or improper liability-creating conduct. Our security and compliance committee monitors the effectiveness of our physical and cybersecurity and related policies, as well as our compliance with legal and regulatory requirements.
Director Independence
In connection with this offering, we have been approved for listing of our Class A common stock on the NASDAQ Global Select Market. The listing rules of NASDAQ generally require that a majority of the members of a listed company's board of directors be independent within specified periods following the closing of an initial public offering. Our board of directors has determined that none of our non-employee directors has a relationship that would interfere with the exercise of independent judgment in carrying out the responsibilities of a director and that each of these directors is "independent" as that term is defined under NASDAQ Marketplace Rule 5605(a)(2).
Audit committee members must also satisfy the independence criteria set forth in Rule 10A-3 under the Exchange Act. In order to be considered independent for purposes of Rule 10A-3, a member of an audit committee of a listed company may not, other than in his or her capacity as a member of the audit committee, the board of directors, or any other board committee: accept, directly or indirectly, any consulting, advisory, or other compensatory fee from the listed company or any of its subsidiaries; or be an affiliated person of the listed company or any of its subsidiaries. We intend to satisfy the audit committee independence requirements of Rule 10A-3 as of the closing of this offering.
128
Board Committees
Our board of directors has established an audit committee, a compensation committee, a nominating and corporate governance committee, and a security and compliance committee. Each of these committees will have the composition and responsibilities described below as of the closing of this offering. Members serve on these committees until their resignations or until otherwise determined by our board of directors.
Audit Committee
Our audit committee is comprised of Denise K. Fletcher, William J. Teuber, Jr. and Lee D. Roberts. Ms. Fletcher is the chairperson of our audit committee. The composition of our audit committee meets the requirements for independence under the current NASDAQ and SEC rules and regulations. Each member of our audit committee can read and understand fundamental financial statements in accordance with applicable requirements. In addition, our board of directors has determined that Ms. Fletcher, Mr. Teuber, and Mr. Roberts are "audit committee financial experts" as defined in Item 407(d)(5)(ii) of Regulation S-K promulgated under the Securities Act. This designation does not impose on them any duties, obligations, or liabilities that are greater than are generally imposed on members of our audit committee and our board of directors. Our audit committee is directly responsible for, among other things, oversight related to:
- •
- our accounting and financial reporting processes;
- •
- the integrity of our financial statements;
- •
- our policies and procedures to fulfill our responsibilities regarding the fair and accurate presentation of our financial
statements;
- •
- our compliance with legal and regulatory requirements;
- •
- the audit of our financial statements;
- •
- major issues regarding accounting principles and financial statement presentations;
- •
- our accounting firm's performance and qualifications; and
- •
- the review of all related party transactions for potential conflict of interest situations on an ongoing basis and the approval of all such transactions.
The audit committee will also be responsible for the appointment, compensation, retention, and oversight of the work of any accounting firm engaged (including resolution of disagreements between management and such firm regarding financial reporting) for the purpose of performing audit, review, or attest services for the company, and for the review with the company's accounting firm of any audit problems or difficulties and management's response. The audit committee also will prepare the audit committee report required by SEC regulations to be included in our annual proxy statement.
Compensation Committee
Our compensation committee is comprised of Lee D. Roberts, Denise K. Fletcher, and William J. Teuber, Jr. Mr. Roberts is the chairman of our compensation committee. The composition of our compensation committee meets the requirements of independence under NASDAQ Marketplace Rule 5605(a)(2). Each member of this committee is an outside director, as defined
129
pursuant to Section 162(m) of the Internal Revenue Code of 1986, as amended, or Code. Our compensation committee is responsible for, among other things:
- •
- Based on the evaluation of the performance of the Chief Executive Officer and other officers, approve and recommend to
the Board for review and approval by a majority of the independent directors, the annual compensation of the CEO and other officers, including salary, bonus, equity compensation awards and other
benefits;
- •
- determining the objectives of our officer compensation programs, identifying what the programs are designed to reward,
and modifying (or recommending that the Board modify) the programs as necessary, consistent with such objectives and intended rewards;
- •
- ensuring appropriate corporate performance objectives regarding compensation of our officers are set and determining the
extent to which they are achieved and any related compensation earned;
- •
- administering our incentive-compensation plans and equity-based plans as in effect and as adopted from time to time by
the Board; and
- •
- reviewing approving, or recommending to the Board for approval any new equity compensation plan or any material change to an existing plan and conducting any valuations required under an equity compensation plan.
Nominating and Corporate Governance Committee
Our nominating and corporate governance committee is comprised of André S. Hoffmann, Denise K. Fletcher, and William J. Teuber, Jr. Mr. Hoffmann is the chairman of our nominating and corporate governance committee. The composition of our nominating and corporate governance committee meets the requirements of independence under Nasdaq Marketplace Rule 5605(a)(2). Our nominating and corporate governance committee is responsible for, among other things:
- •
- identifying and recommending candidates for membership on our board of directors;
- •
- reviewing and recommending our corporate governance guidelines and policies;
- •
- reviewing proposed waivers of the code of conduct for directors and executive officers;
- •
- overseeing the process of evaluating the performance of our board of directors; and
- •
- assisting our board of directors on corporate governance matters.
Security and Compliance Committee
Our security and compliance committee is comprised of William J. Teuber Jr., Denise K. Fletcher, and Keith R. Dunleavy, M.D. Mr. Teuber is the chairman of our security and compliance committee. Our security and compliance committee is directly responsible for, among other things, oversight related to:
- •
- our compliance with law, rules and regulations, including HIPAA;
- •
- our privacy and security programs, including:
- •
- the security and protection of PHI;
- •
- physical security of our properties, including our datacenters; and
- •
- security of platform, network and big data systems and software;
- •
- the periodic review and assessment of the adequacy and functionality of our privacy and security programs;
130
- •
- ensuring that our privacy and security programs are aligned with our and our clients' business objectives and goals;
- •
- our disaster recovery and business continuity plans; and
- •
- in conjunction with the board of directors and our Chief Executive Officer, the roles and responsibilities of our Chief Technology Officer, Chief Security Officer, Chief Compliance Officer, and Chief Privacy Officer.
Compensation Committee Interlocks and Insider Participation
Keith R. Dunleavy, M.D., our Chief Executive Officer and Chairman, served on our compensation committee during the year ended December 31, 2013. By his choice, at no time during which Dr. Dunleavy served on our compensation committee did he receive any annual bonus, incentive equity, salary increase, or any other provision or change of compensation. For certain agreements between Dr. Dunleavy and us, see "Certain Relationships and Related Party Transactions." None of our executive officers has served as a member of the board of directors, or as a member of the compensation or similar committee, of any entity that has one or more executive officers who served on our board of directors or compensation committee during the year ended December 31, 2013.
Code of Business Conduct and Ethics
Our board of directors has adopted a code of business conduct and ethics that applies to all of our employees, officers, and directors. Additionally, the Board has adopted a supplemental code of ethics for senior financial officers, which applies to our Chief Executive Officer, Chief Financial Officer, and other senior financial officers, who have been designated by our Chief Executive Officer. Among other matters, our code of business conduct and ethics and supplemental code of ethics for senior financial officials are designed to deter wrongdoing and to promote:
- •
- honest and ethical conduct, including the ethical handling of actual or apparent conflicts of interest between personal
and professional relationships;
- •
- full, fair, accurate, timely and understandable disclosures in our SEC reports and other public communications;
- •
- compliance with applicable laws, rules, and regulations;
- •
- prompt internal reporting of violations of the code to appropriate persons identified in the code; and
- •
- accountability for adherence to the code of business conduct and ethics.
Any waiver of the code of business conduct and ethics for our executive officers or directors must be approved by the Board or a committee thereof, and any such waiver will be promptly disclosed as required by law, or NASDAQ regulations.
The full text of our code of business conduct and ethics and supplemental code of ethics for senior financial officers will be posted on the Investor Relations section of our website at www.inovalon.com. The reference to our website address in this prospectus does not include or incorporate by reference the information on our website into this prospectus. We intend to disclose future amendments to our code of conduct, or waivers of these provisions, that are required to be disclosed under the rules of the SEC or NASDAQ on our website or in public filings.
131
The following table shows information regarding the compensation earned by our non-employee directors for the year ended December 31, 2014. Dr. Dunleavy, who is our Chief Executive Officer, receives no compensation for his service as a director. The compensation received by Dr. Dunleavy as an employee is described in "Executive Compensation — Summary Compensation Table."
Name
|
Fees Earned or Paid in Cash (1) |
Option Awards (2)(3) |
All Other Compensation |
Total
|
|||||||||
|---|---|---|---|---|---|---|---|---|---|---|---|---|---|
Denise K. Fletcher |
$ | 50,000 | $ | 52,994 | $ | — | $ | 102,994 | |||||
André S. Hoffmann |
25,000 | (4) | 52,994 | — | 77,994 | ||||||||
Lee D. Roberts |
50,000 | 52,994 | — | 102,994 | |||||||||
William J. Teuber Jr. |
50,000 | 52,994 | — | 102,994 | |||||||||
- (1)
- Represents
retainer for service as a director, which is paid in equal quarterly installments of $12,500.
- (2)
- The
amounts reported in the Option Awards column represent the grant date fair value of the stock options granted to the directors during 2014, computed in
accordance with Financial Accounting Standards Board Accounting Standards Codification Topic 718, or FASB ASC Topic 718. The assumptions used in calculating the grant date fair value of
the stock options reported in the Option Awards column are set forth in Note 7 to the consolidated financial statements included in this prospectus and "Management's Discussion and Analysis of
Financial Condition and Results of Operations — Critical Accounting Policies — Stock-Based Compensation." Note that the amounts reported in this column reflect
the accounting cost for these stock options and do not correspond to the actual economic value that may be received by the directors upon exercise of the options.
- (3)
- The
shares underlying these options vest in full on the first anniversary of the date of grant.
- (4)
- Mr. Hoffmann waived his right to receive compensation as a director through June 30, 2014.
We have adopted a policy with respect to the compensation payable to our non-employee directors, which will become effective upon the closing of this offering. Under this policy, each non-employee director will receive an annual cash retainer of $50,000, an annual award of $75,000 payable in equity, and reimbursement for his or her reasonable out-of-pocket expenses incurred in attending meetings of our board of directors and its committees. Directors are also entitled to the protection provided by their indemnification agreements and the indemnification provisions in our certificate of incorporation and bylaws.
132
As an emerging growth company, we have opted to comply with the executive compensation disclosure rules applicable to "smaller reporting companies," as such term is defined in the rules promulgated under the Securities Act. For the year ended December 31, 2014, our named executive officers are:
- •
- Keith R. Dunleavy, M.D., our Chief Executive Officer and Chairman of the Board;
- •
- Robert A. Wychulis, our President;
- •
- Christopher E. Greiner, our Chief Product and Operations Officer;
- •
- Thomas R. Kloster, our Chief Financial Officer; and
- •
- Joseph R. Rostock, our Chief Technology Officer.
The following table sets forth a summary of all compensation that was awarded to, earned by or paid to, as applicable, each of our named executive officers for the year ended December 31, 2014.
Name and Principal Position
|
Salary | Bonus (1) |
Option Awards (2)(3) |
All Other Compensation (4) |
Total | |||||||||||
|---|---|---|---|---|---|---|---|---|---|---|---|---|---|---|---|---|
Keith R. Dunleavy, M.D. |
$ | 205,012 | $ | — | $ | — | $ | 4,891 | $ | 209,903 | ||||||
Chief Executive Officer |
||||||||||||||||
Robert A. Wychulis |
201,935 | (5) | — | 989,302 | 105 | 1,191,343 | ||||||||||
Christopher E. Greiner |
307,395 | — | 394,119 | 107,309 | 808,823 | |||||||||||
Thomas R. Kloster |
255,776 | (6) | — | 999,916 | 412 | 1,256,103 | ||||||||||
Joseph R. Rostock |
331,563 | — | — | 10,822 | 342,384 | |||||||||||
- (1)
- Bonuses
are determined at the discretion of the Board of Directors after the end of the fiscal year and are not calculable as of the date of this
prospectus. The Board of Directors may consider a variety of factors in determining the amount of bonus awards, including, among other factors, the achievement of revenue and Adjusted EBITDA targets
and broad corporate objectives, but the Board of Directors retains discretion to award bonuses even when these objectives have not been achieved.
- (2)
- The amounts reported in the Option Awards column represent the grant date fair value of the stock options granted to the named executive officers during 2014, computed in accordance with FASB ASC Topic 718. The assumptions used in calculating the grant date fair value of the stock options reported in the Option Awards column are set forth in Note 7 to the consolidated financial statements included in this prospectus and "Management's Discussion and Analysis of Financial Condition and Results of Operations — Critical Accounting Policies — Stock-Based Compensation." Note that the amounts reported in this column reflect the accounting cost for these stock options and do not correspond to the actual economic value that may be received by the named executive officers upon exercise of the options.
133
- (3)
- Messrs.
Wychulis and Kloster were awarded options to purchase 275,265 and 289,495 shares, respectively, in connection with the commencement of their
employment in May 2014 and March 2014, respectively. Mr. Greiner was awarded options to purchase an aggregate of 31,919 shares in connection with his hiring as Chief Product Officer in May 2013
and his promotion to Chief Product and Operations Officer in May 2014.
- (4)
- For
Dr. Dunleavy, Mr. Kloster, and Mr. Rostock, represents matching contributions under our 401(k) plan and premium payments for life
insurance, and for Mr. Wychulis, represents premium payments for life insurance and for Mr. Greiner it represents relocation expense reimbursement, matching contributions under our 401(k) plan
and premium payments for life insurance.
- (5)
- Represents
the pro rata portion of Mr. Wychulis' $350,000 base salary, based on his start date of May 19, 2014.
- (6)
- Represents the pro rata portion of Mr. Kloster's $350,000 base salary, based on his start date of March 24, 2014.
Outstanding Equity Awards at Fiscal Year-End
The following table presents, for each of the named executive officers, information regarding outstanding stock options held as of December 31, 2014.
Name
|
Grant Date | Number of Securities Underlying Unexercised Options Exercisable Shares |
Number of Securities Underlying Unexercised Options Unexercisable Shares |
Option Exercise Price |
Option Expiration Date |
|||||||||||
|---|---|---|---|---|---|---|---|---|---|---|---|---|---|---|---|---|
Keith R. Dunleavy, M.D. |
— | — | — | $ | — | — | ||||||||||
Robert A. Wychulis |
8/15/2014 |
— |
275,265 |
(1) |
7.89 |
8/14/2024 |
||||||||||
Christopher E. Greiner |
6/30/2013 |
46,445 |
185,790 |
6.68 |
6/29/2023 |
|||||||||||
Chief Product and |
5/2/2014 | — | 114,105 | 7.03 | 5/1/2024 | |||||||||||
Operations Officer |
5/14/2014 | — | 45,490 | 7.50 | 5/13/2024 | |||||||||||
Thomas R. Kloster |
5/14/2014 |
— |
289,495 |
(1) |
7.50 |
5/13/2024 |
||||||||||
Joseph R. Rostock |
6/30/2013 |
46,445 |
185,790 |
6.68 |
6/29/2023 |
|||||||||||
Chief Technology Officer |
5/14/2014 | — | 41,355 | 7.50 | 5/13/2024 | |||||||||||
- (1)
- The shares underlying these options vest 20% on each of the first five anniversaries of the date of grant.
We have entered into employment agreements with each of our named executive officers, which may be terminated at any time by the named executive officer or us for any reason. The agreements provide for the principal terms and conditions of our named executive officers' employment, including their base salary, an indication of eligibility for an annual bonus opportunity (except with respect to Dr. Dunleavy), participation in our employee benefit plans as may be in effect from time to time, paid time off, and reimbursement of reasonable business expenses.
134
Pursuant to the employment agreements, the base salary and target bonus amounts for each of our named executive officers is as follows:
Named Executive Officer
|
Base Salary | Target Bonus (% of Base Salary) |
Target Bonus Amount(1) |
|||||||
|---|---|---|---|---|---|---|---|---|---|---|
Dr. Keith R. Dunleavy |
$ | 205,000 | — | $ | — | |||||
Robert A. Wychulis |
350,000 | 100 | 350,000 | |||||||
Christopher E. Greiner |
307,500 | 100 | 307,500 | |||||||
Thomas R. Kloster |
350,000 | 100 | 350,000 | |||||||
Joseph R. Rostock |
333,125 | 100 | 333,125 | |||||||
- (1)
- Bonus awards generally are paid out one-third in cash and two-thirds in equity awards.
If we terminate the employment of our named executive officers (with the exception of Dr. Dunleavy) other than for "cause" (as defined in the employment agreements), subject to the named executive officer's execution and non-revocation of a release in favor of us, we will provide the named executive officer with a lump-sum cash severance benefit equal to the greater of (i) one month's base salary or (ii) one month's base salary per each full year of their service with us, subject to a maximum of six months' base salary.
Under the employment agreements, in the absence of express written consent by us to the contrary, each of our named executive officers will devote the entirety of their professional and business time, attention, skill, and energy exclusively to our business and will adhere to certain non-competition, confidentiality, and non-disclosure provisions.
Our compensation committee intends to review the compensation of our executive officers in the second quarter of 2015. In connection with this review, the committee expects to conduct a review and analysis of our executive compensation levels and practices, peer group composition, long-term incentive plan design and grant practices, and change in control and severance practices, including an assessment of market data in order to help ensure that our compensation metrics and methods are appropriate following this offering. The committee intends to focus its analysis in order to ensure that our executive compensation program:
- •
- permits us to recruit talented and well-qualified executives to serve in leadership positions, including through peer
benchmarking;
- •
- helps us retain such experienced executives to lead our organization over the long term; and
- •
- motivates our executives to succeed by providing compensation that is based on performance and aligned with the interests of our stockholders.
In connection with this analysis, the committee may determine to adjust one or more components of the compensation of our executive officers in order to achieve those goals.
Our named executive officers are eligible to participate in our employee benefit plans, including our medical, dental, vision, group life and accidental death and dismemberment insurance plans, short-term and long-term disability insurance, and flexible spending accounts, in each case,
135
on the same basis as all of our other employees. We do not provide perquisites or personal benefits to our named executive officers.
401(k) Plan
We sponsor a Profit Sharing Plan and Trust, or 401(k) Plan, which is intended to meet the requirements of Section 401(k) of the Code. Our employees generally are eligible to participate in the 401(k) Plan upon the completion of 30 days of service with us. We match employee contributions up to 4.0% of their compensation and our matching contributions vest immediately.
Pension Benefits
Aside from our 401(k) Plan, we do not maintain any pension plan or arrangement under which our named executive officers are entitled to participate or receive post-retirement benefits.
The principal features of our equity incentive plans are summarized below. These summaries are qualified in their entirety by reference to the actual text of the plans, which are filed as exhibits to the registration statement of which this prospectus is a part.
Pre-IPO Long-Term Incentive Plan
Our Amended and Restated Long-Term Incentive Plan (as last amended on October 7, 2010), or the Pre-IPO Plan, was assumed by us in connection with the Corporate Reorganization, and, as a result, options to purchase common stock of Inovalon, Inc. were assumed by us. The Pre-IPO Plan provides for the grant of incentive stock options, which qualify for favorable tax treatment to their recipients under Section 422 of the Code, and nonstatutory stock options, as well as for the issuance of shares of common stock, performance units, "phantom" units, stock appreciation rights, or SARs, and other rights containing such terms, benefits, or restrictions as specified by the committee administering the Pre-IPO Plan. We may grant incentive stock options only to our employees. We may grant nonstatutory stock options to our employees, directors, consultants, and advisors. The exercise price of each stock option must be at least equal to the per share fair market value of our common stock underlying the option on the date of grant. The exercise price of each incentive stock option granted to 10% stockholders must be at least equal to 110% of the fair market value of our common stock underlying the option on the date of grant. The maximum permitted term of options granted under our Pre-IPO Plan is 10 years, except that the maximum permitted term of incentive stock options granted to 10% stockholders is 5 years. In the event of certain changes of control (as defined in the Pre-IPO plan), the committee administering the Pre-IPO Plan may take whatever actions it deems necessary or desirable with respect to any of the options outstanding or awards granted thereunder, including, without limitation, accelerating the expiration of options to a date no earlier than 30 days after notice of such acceleration or accelerating the exercisability of options. After the continuous service of an employee, director, consultant or advisor terminates, he or she may exercise his or her option, to the extent vested, only to the extent provided in the stock option agreement. As of September 30, 2014, we had reserved 10,275,000 shares of our Class B common stock for issuance under our Pre-IPO Plan. As of September 30, 2014, we had granted options to purchase 17,442,125 shares, options to purchase 1,419,510 of these shares had been exercised, options to purchase 9,571,340 shares have expired and returned to the pool, and as a result 2,404,215 of these shares remained available for future grant. The options to purchase 6,451,275 shares outstanding as of September 30, 2014 had a weighted-average exercise price of $5.97 per share. In November 2014, restricted stock unit awards with respect to 488,780 shares were granted under the Pre-IPO Plan. We will cease issuing awards under our Pre-IPO Plan upon the implementation of the 2015 Plan (as defined below). Our
136
2015 Plan will become effective on the date of the completion of this offering. As a result, we will not grant any additional awards under the Pre-IPO Plan following that date, and the Pre-IPO Plan will terminate at that time. However, any outstanding awards granted under the Pre-IPO Plan will remain outstanding, subject to the terms of our Pre-IPO Plan and applicable agreements, until such outstanding awards are exercised (if applicable) or terminate or expire by their terms.
2015 Omnibus Incentive Plan
Our 2015 Omnibus Incentive Plan, or the 2015 Plan, was adopted by our board of directors on January 14, 2015 and approved by our stockholders. The 2015 Plan will become effective on the date of the completion of this offering. The 2015 Plan will provide for the grant of incentive stock options, within the meaning of Section 422 of the Code, to our employees and any parent and subsidiary employees, and for the grant of non-qualified stock options, stock appreciation rights, restricted stock, restricted stock units, dividend equivalent rights, cash-based awards (including annual cash incentives and long-term cash incentives), and any combination thereof to our employees, directors, and consultants and to employees, directors, and consultants of certain affiliated entities.
In connection with this offering, we will reserve for issuance under the 2015 Plan shares of our Class A common stock equal to the sum of: (i) 7,335,430 shares of Class A common stock; and (ii) the number of shares of our Class A common stock in respect of the number of shares of our common stock underlying awards granted under the Pre-IPO Plan (6,940,055 as of the date of this prospectus) that are forfeited, canceled, or expire (whether voluntarily or involuntarily).
Our board of directors or a committee of our board of directors, which we refer to as the "administrator" in this description, will administer the 2015 Plan. In the case of awards intended to qualify as "performance-based compensation" within the meaning of Section 162(m) of the Code, the administrator will consist of two or more "outside directors" within the meaning of Section 162(m) of the Code. The administrator will have the power to determine and interpret the terms and conditions of the awards, including the employees, directors, and consultants who will receive awards, the exercise price, the number of shares subject to each such award, the vesting schedule and exercisability of the awards, the restrictions on transferability of awards, and the form of consideration payable upon exercise. The administrator also will have the authority to reduce the exercise prices of outstanding stock options and the base appreciation amount of any stock appreciation right if the exercise price or base appreciation amount exceeds the fair market value of the underlying shares, and to cancel such options and stock appreciation rights in exchange for new awards, in each case without stockholder approval.
The 2015 Plan will allow for the grant of incentive stock options that qualify under Section 422 of the Code only to our employees and employees of any of our parents or subsidiaries. Non-qualified stock options may be granted to our employees and directors and those of certain of our affiliates. The exercise price of all options granted under the 2015 Plan must be equal to at least the fair market value of our Class A common stock on the date of grant. The term of an incentive stock option may not exceed 10 years, except that with respect to any employee who owns more than 10% of the voting power of all classes of our outstanding stock or any parent or subsidiary corporation as of the grant date, the term must not exceed 5 years, and the exercise price must equal at least 110% of the fair market value on the grant date.
After the continuous service of an employee, director, or consultant terminates, he or she may exercise his or her option, to the extent vested, for the period of time specified in the option agreement. However, an option may not be exercised later than the expiration of its term.
The 2015 Plan will allow for the grant of stock appreciation rights. Stock appreciation rights allow the recipient to receive the appreciation in the fair market value of our Class A common stock
137
between the date of grant and the exercise date. The administrator will determine the terms of any stock appreciation rights, including when such rights become exercisable and whether to pay the increased appreciation in cash or with shares of our Class A common stock, or a combination thereof, except that the base appreciation amount used to determine the cash or shares to be issued pursuant to the exercise of a stock appreciation right will be no less than 100% of the fair market value per share on the date of grant. After the continuous service of an employee, director or consultant terminates, he or she may exercise his or her stock appreciation right, to the extent vested, only to the extent provided in the stock appreciation right agreement.
The 2015 Plan will allow for the grant of restricted stock. Restricted stock awards are shares of our Class A common stock that vest in accordance with terms and conditions established by the administrator. The administrator will determine the number of shares of any restricted stock granted to any employee, director or consultant. The administrator may impose whatever conditions on vesting it determines to be appropriate. For example, the administrator may set restrictions based on the achievement of specific performance goals. Shares of restricted stock that do not vest are subject to our right of repurchase or forfeiture.
The 2015 Plan will allow for the grant of restricted stock units. Restricted stock units are awards that will result in payment to a recipient at the end of a specified period only if the vesting criteria established by the administrator are achieved or the award otherwise vests. The administrator may impose whatever conditions to vesting, or restrictions and conditions to payment that it determines to be appropriate. The administrator may set restrictions based on the achievement of specific performance goals or on the continuation of service or employment. Payments of earned restricted stock units may be made, in the administrator's discretion, in cash, with shares of our Class A common stock or other securities, or a combination thereof.
The 2015 Plan also will allow for the grant of awards denominated in cash that may be settled in cash or shares of Class A common stock, which may be subject to restrictions as established by the administrator. Prior to the first stockholder meeting at which directors are to be elected to our board of directors that occurs after the close of the third calendar year following the calendar year in which this offering occurs, the maximum aggregate amount of cash that may be issued pursuant to awards under the 2015 Plan to employees who would otherwise be covered by Section 162(m) of the Code will be $40,000,000. Section 162(m) generally applies to a public company's chief executive officer and its three other most highly compensated executive officers, other than its chief financial officer.
The administrator will determine the provisions, terms, and conditions of each award including vesting schedules, forfeiture provisions, form of payment (cash, shares, or other consideration) upon settlement of the award, payment contingencies, and satisfaction of any performance criteria. The performance criteria established by the administrator for any awards intended to qualify as "performance-based compensation" for purposes of Section 162(m) of the Code, will be one of, or combination of, the following: net earnings or net income (before or after taxes); earnings per share; revenues or sales (including net sales or revenue growth); net operating profit; return measures (including return on assets, net assets, capital, invested capital, equity, sales, or revenue); cash flow (including operating cash flow, free cash flow, cash flow return on equity, and cash flow return on investment); earnings before or after taxes, interest, depreciation, or amortization; gross or operating margins; productivity ratios; share price (including growth measures and total stockholder return); expense targets; margins; operating efficiency; market share; working capital targets and change in working capital; economic value added or EVA® (net operating profit after tax minus the sum of capital multiplied by the cost of capital); or net operating income. The performance criteria may be applicable to our company, our affiliates and any individual business units of our company or any affiliate and may be measured annually or cumulatively over a period of years, on an absolute basis or relative to a pre-established target, to
138
previous years' results or to a designated comparison group, in each case as specified by the administrator.
The 2015 Plan will allow for the transfer of awards under the 2015 Plan only (i) by will, (ii) by the laws of descent and distribution, and (iii) for awards other than incentive stock options, to the extent authorized by the administrator to certain persons or entities. Only the recipient of an incentive stock option may exercise such award during his or her lifetime.
In the event of certain changes in our capitalization, to prevent enlargement of the benefits or potential benefits available under the 2015 Plan, the adminstrator will make adjustments to one or more of the number of shares that are covered by outstanding awards, the exercise or purchase price of outstanding awards, the numerical share limits contained in the 2015 Plan, and any other terms that the administrator determines require adjustment.
The 2015 Plan provides that in the event of certain corporate transactions, as such term is defined in the 2015 Plan, the portion of each outstanding award that is neither continued by us nor assumed or replaced by the successor entity or its parent will automatically terminate. In connection with a corporate transaction or change in control, as such term is defined in the 2015 Plan, the administrator has the authority to provide for the full or partial automatic vesting and exercisability of one or more outstanding unvested awards under the 2015 Plan and the release from restrictions on transfer or forfeiture rights of such awards on such terms and conditions as the administrator may specify. In addition, any incentive stock option, as defined in the 2015 Plan, accelerated in connection with a corporate transaction or change in control, will remain exercisable as an incentive stock option to the extent the dollar limitation under the Code is not exceeded, with any excess becoming a nonqualified stock option.
The 2015 Plan will automatically terminate 10 years following the date it becomes effective, unless we terminate it sooner. In addition, our board of directors has the authority to amend, suspend or terminate the 2015 Plan provided such action does not impair the rights under any outstanding award.
2015 Employee Stock Purchase Plan ("ESPP")
The ESPP will become effective on the date of the completion of this offering and will enable eligible employees to purchase shares of our Class A common stock at a discount following the date of this offering. Purchases will be accomplished through participation in discrete offering periods. The ESPP is intended to qualify as an employee stock purchase plan under Section 423 of the Code. We initially reserved 1,833,857 shares of our Class A common stock for issuance under the ESPP.
Our board of directors or a committee designated by the board, which we refer to as the "administrator" in this description, will administer the ESPP. Our employees generally are eligible to participate in the ESPP (except for employees (i) whose customary employment is 20 hours or less per week, (ii) whose customary employment is for not more than 5 months in any calendar year, (iii) who have not been employed for such continuous period as the administrator may require (up to a maximum of 2 years), or (iv) who are citizens or residents of a non-U.S. jurisdiction under certain circumstances, although the administrator may permit such categories of employees to participant in the ESPP in its discretion). Employees who are 5% stockholders, or would become 5% stockholders as a result of their participation in the ESPP, are ineligible to participate in the ESPP. We may impose additional restrictions on eligibility. Under the ESPP, eligible employees will be able to acquire shares of our Class A common stock by accumulating funds through payroll deductions. Our eligible employees will be able to select a rate of payroll deduction between 1% and 15% of their base cash compensation subject to a maximum payroll deduction per offering period of $7,500.
139
When an offering period commences, our employees who meet the eligibility requirements and wish to participate in the ESPP will be required to enroll in a timely manner. Once an employee is enrolled, participation will be automatic in subsequent offering periods. An employee's participation automatically ends upon termination of employment for any reason.
It is anticipated that the offering periods will be for six months (commencing each March 1 and September 1).
No participant will have the right to purchase our shares in an amount, when aggregated with purchase rights under all our employee stock purchase plans that are also in effect in the same calendar year(s), that has a fair market value of more than $25,000, determined as of the first day of the applicable offering period, for each calendar year in which that right is outstanding. In addition, no participant will be permitted to purchase more than 1,000 shares during any one offering period or such lesser amount determined by the administrator. The purchase price for shares of our Class A common stock purchased under the ESPP will be 85% of the fair market value of our Class A common stock on the last trading day of each purchase period in the applicable offering period.
In the event of certain corporate transactions (as defined in the ESPP), each option will be assumed by the successor corporation or a parent or subsidiary of the successor corporation, unless the administrator determines to shorten the offering period then in progress, in which case the options will either be exercised automatically or we will pay the optionees an amount equal to the excess, if any, of (x) the fair market value of the shares subject to the options over (y) the purchase price due had the options been exercised automatically.
The ESPP will terminate on the 10th anniversary of its adoption by our board of directors, unless it is terminated earlier by our administrator. The administrator may at any time and for any reason terminate or amend the ESPP. Except in connection with certain corporate transactions or changes in capitalization, no such termination can adversely affect options previously granted, provided that the ESPP may be terminated by the administrator under certain circumstances if the administrator determines that the termination of the ESPP or one or more offer periods is in our best interests or in the best interests of our stockholders. Except as described in the previous sentence, or in connection with certain corporate transactions or changes in capitalization, no amendment may make any change in any option theretofore granted which adversely affects the rights of any participant without the consent of affected participants. To the extent necessary to comply with Section 423 of the Code (or any successor rule or provision or any other applicable law), we will obtain stockholder approval of any amendment in such a manner and to such a degree as required.
Limitations on Liability and Indemnification Matters
Our restated certificate of incorporation that will become effective upon the closing of this offering contains provisions that limit the liability of our directors for monetary damages to the fullest extent permitted by the Delaware General Corporation Law. Consequently, our directors will not be personally liable to us or our stockholders for monetary damages for any breach of fiduciary duties as directors, except liability for:
- •
- any breach of the director's duty of loyalty to us or our stockholders;
- •
- any act or omission not in good faith or that involves intentional misconduct or a knowing violation of law;
- •
- unlawful payments of dividends or unlawful stock repurchases or redemptions as provided in Section 174 of the Delaware General Corporation Law; or
140
- •
- any transaction from which the director derived an improper personal benefit.
Our restated certificate of incorporation and our restated bylaws that will become effective upon the closing of this offering require us to indemnify our directors and officers to the maximum extent not prohibited by the Delaware General Corporation Law and allow us to indemnify other employees and agents as set forth in the Delaware General Corporation Law. Subject to certain limitations, our restated bylaws also require us to advance expenses incurred by our directors and officers for the defense of any action for which indemnification is required or permitted.
We have entered, and intend to continue to enter, into separate indemnification agreements with our directors, officers and, certain of our key employees, in addition to the indemnification provided for in our restated bylaws. These agreements, among other things, require us to indemnify our directors, officers, and key employees for certain expenses, including attorneys' fees, judgments, penalties fines, and settlement amounts actually and reasonably incurred by such director, officer, or key employee in any action or proceeding arising out of their service to us or any of our subsidiaries or any other company or enterprise to which the person provides services at our request. Subject to certain limitations, our indemnification agreements also require us to advance expenses incurred by our directors, officers, and key employees for the defense of any action for which indemnification is required or permitted.
We believe that these charter provisions and indemnification agreements are necessary to attract and retain qualified persons such as directors, officers, and key employees. We also maintain directors' and officers' liability insurance.
The limitation of liability and indemnification provisions in our restated certificate of incorporation and restated bylaws may discourage stockholders from bringing a lawsuit against our directors and officers for breach of their fiduciary duty. They may also reduce the likelihood of derivative litigation against our directors and officers, even though an action, if successful, might benefit us and other stockholders. Further, a stockholder's investment may be adversely affected to the extent that we pay the costs of settlement and damage awards against directors and officers as required by these indemnification provisions.
At present, there is no pending litigation or proceeding involving any of our directors or executive officers as to which indemnification is required or permitted, and we are not aware of any threatened litigation or proceeding that may result in a claim for indemnification.
Insofar as indemnification for liabilities arising under the Securities Act may be permitted to directors, executive officers or persons controlling us, we have been informed that in the opinion of the SEC such indemnification is against public policy as expressed in the Securities Act and is therefore, in the opinion of the SEC, unenforceable.
141
CERTAIN RELATIONSHIPS AND RELATED PARTY TRANSACTIONS
In addition to the executive officer and director compensation arrangements discussed above under "Management — Director Compensation" and "Executive Compensation," the following is a description of transactions since January 1, 2013 to which we have been a participant, in which the amount involved in the transaction exceeds or will exceed $120,000 and in which any of our directors, executive officers, or holders of more than 5% of our capital stock, or any immediate family member of, or person sharing the household with, any of these individuals, had or will have a direct or indirect material interest.
We are a party to the Second Amended and Restated Stockholders Rights Agreement, dated September 15, 2014, or Stockholders' Agreement, with the existing holders of our Class B common stock, including Keith R. Dunleavy, M.D., our Chief Executive Officer and Chairman, André S. Hoffmann, a member of our board of directors, Denise K. Fletcher, a member of our board of directors, William J. Teuber, a member of our board of directors, and Daniel L. Rizzo, our Chief Innovation Officer. In addition, any of our executive officers or directors who exercise options to purchase our Class B common stock subsequent to the date of this prospectus will become a party to the Stockholders' Agreement at such time. These stockholders are entitled to rights with respect to the registration of their shares for resale following this offering under the Securities Act. For a description of these registration rights, see "Description of Capital Stock — Registration Rights."
Concurrently with the completion of this offering, we will enter into indemnification agreements with each of our directors and executive officers. The indemnification agreements and our bylaws require us to indemnify our directors to the fullest extent not prohibited by Delaware law. Subject to certain limitations, our restated bylaws also require us to advance expenses incurred by our directors and officers. For more information regarding these agreements, see "Executive Compensation — Limitations on Liability and Indemnification Matters."
We are party to the Shareholders Voting Agreement, dated September 15, 2008, with the holders of a majority of our Class B common stock, including Keith R. Dunleavy, M.D., our Chief Executive Officer and Chairman, André S. Hoffmann, a member of our board of directors, and Daniel L. Rizzo, our Chief Innovation Officer, or entities controlled by them. Under the Shareholders Voting Agreement, the parties agreed to vote all shares of our voting capital stock then owned and subsequently acquired by them to elect André Hoffmann (or another individual mutually agreed upon by the parties) to our board of directors. Unless otherwise agreed by the holders of a majority of the shares subject to the agreement, the Shareholders Voting Agreement will terminate on the earliest to occur of the following: (i) as to Mr. Hoffmann, at such time as he owns less than 10% of the outstanding capital stock of our company on a fully diluted basis; (ii) as to the other parties to the agreement, at such time as they own, in the aggregate, less than 50% of the outstanding capital stock of our company on a fully diluted basis; and (iii) September 15, 2018.
Equity Grants to Executive Officers and Directors
We have granted stock options to our executive officers and directors, as more fully described in the sections entitled "Executive Compensation" and "Management — Director Compensation," respectively.
Review, Approval, or Ratification of Transactions with Related Parties
Our policy and the charters of our audit committee and our nominating and corporate governance committee that will become effective upon the closing of this offering require that any transaction with a related party that must be reported under applicable rules of the SEC (other than compensation-related matters) must be reviewed and approved or ratified by the audit committee, unless the related party is, or is associated with, a member of that committee, in which event the transaction must be reviewed and approved by the nominating and corporate governance committee.
142
The following table sets forth certain information with respect to the beneficial ownership of our Class A and Class B common stock as of December 31, 2014, and as adjusted to reflect the sale of Class A common stock offered by us in this offering, for:
- •
- each stockholder known by us to be the beneficial owner of more than 5% of our outstanding shares of Class A
common stock or Class B common stock;
- •
- each of our directors;
- •
- each of our named executive officers; and
- •
- all of our directors and executive officers as a group.
The SEC has defined "beneficial ownership" of a security to mean the possession, directly or indirectly, of voting power or investment power over such security. A stockholder is also deemed to be, as of any date, the beneficial owner of all securities that such stockholder has the right to acquire within 60 days after that date through (1) the exercise of any option, warrant, or right, (2) the conversion of a security, (3) the power to revoke a trust, discretionary account, or similar arrangement, or (4) the automatic termination of a trust, discretionary account, or similar arrangement.
Applicable percentage ownership prior to this offering is based on no shares of Class A common stock and 122,257,145 shares of Class B common stock outstanding as of September 30, 2014. Applicable percentage ownership after this offering is based on 22,222,222 shares of Class A common stock and 122,257,145 shares of Class B common stock outstanding immediately after the closing of this offering (assuming no exercise of the underwriters' option to purchase additional shares of Class A common stock). In computing the number of shares of common stock beneficially owned by a person and the percentage ownership of that person, we deemed to be outstanding (as shares of Class B common stock) all shares of common stock subject to options held by that person or entity that were exercisable on December 31, 2014, or that will become exercisable within 60 days thereafter, while such shares are not deemed outstanding for purposes of computing the percentage ownership of any other person.
Unless otherwise indicated, the address of each beneficial owner listed in the table below is c/o Inovalon Holdings, Inc., 4321 Collington Road, Bowie, Maryland 20716. Except as indicated by the footnotes below, we believe, based on the information furnished to us, that the persons and entities named in the table below have sole voting and investment power with respect to all shares of common stock that they beneficially own, subject to applicable community property laws. No
143
shares of common stock beneficially owned by any executive officer or director have been pledged as security for a loan.
| |
Shares Beneficially Owned Prior to this Offering |
% of Total Voting Power Before this Offering(1) |
Shares Beneficially Owned After this Offering |
% of Total Voting Power After this Offering(1) |
|||||||||||||||||||||||||||
|---|---|---|---|---|---|---|---|---|---|---|---|---|---|---|---|---|---|---|---|---|---|---|---|---|---|---|---|---|---|---|---|
| |
Class A | Class B | Class A | Class B | |||||||||||||||||||||||||||
Name of Beneficial Owner
|
Shares
|
%
|
Shares
|
%
|
Shares
|
%
|
Shares
|
%
|
|||||||||||||||||||||||
Named Executive Officers and Directors |
|||||||||||||||||||||||||||||||
Keith R. Dunleavy, M.D.(2) |
— | — | 54,947,255 | 44.8 | 44.8 | — | — | 54,947,255 | 44.8 | 44.0 | |||||||||||||||||||||
Robert A. Wychulis |
— | — | — | — | — | — | — | — | — | * | |||||||||||||||||||||
Christopher E. Greiner(3) |
— | — | 46,445 | * | * | — | — | 46,445 | * | * | |||||||||||||||||||||
Thomas R. Kloster |
— | — | — | — | — | — | — | — | — | * | |||||||||||||||||||||
Daniel L. Rizzo(4) |
— | — | 5,425,430 | 4.4 | 4.4 | — | — | 5,425,430 | 4.4 | 4.3 | |||||||||||||||||||||
Jason Z. Rose(3) |
— | — | 270,465 | * | * | — | — | 270,465 | * | * | |||||||||||||||||||||
Joseph R. Rostock(3) |
— | — | 46,445 | * | * | — | — | 46,445 | * | * | |||||||||||||||||||||
Shauna L. Vernal(3) |
— | — | 29,205 | * | * | — | — | 29,205 | * | * | |||||||||||||||||||||
Denise K. Fletcher |
— | — | 31,515 | * | * | — | — | 31,515 | * | * | |||||||||||||||||||||
André S. Hoffmann(5) |
— | — | 28,734,695 | 23.4 | 23.4 | — | — | 28,734,695 | 23.4 | 23.0 | |||||||||||||||||||||
Lee D. Roberts(3) |
— | — | 34,375 | * | * | — | — | 34,375 | * | * | |||||||||||||||||||||
William J. Teuber Jr. |
— | — | 15,970 | * | * | — | — | 15,970 | * | * | |||||||||||||||||||||
All executive officers and directors as a group (12 persons) |
— | — | 89,581,800 | 73.0 | 73.0 | — | — | 89,581,800 | 73.0 | 71.7 | |||||||||||||||||||||
5% Stockholders |
|||||||||||||||||||||||||||||||
Meritas Group, Inc.(2) |
— | — | 47,476,820 | 38.7 | 38.7 | — | — | 47,476,820 | 38.7 | 38.0 | |||||||||||||||||||||
Lapis Ventures SAC Limited(5) |
— | — | 19,655,645 | 16.0 | 16.0 | — | — | 19,655,645 | 16.0 | 15.7 | |||||||||||||||||||||
Meritas Holdings, LLC(2) |
— | — | 7,470,435 | 6.1 | 6.1 | — | — | 7,470,435 | 6.1 | 6.0 | |||||||||||||||||||||
Rick W. Lasch and Suzanne C.E. Lasch(6) |
— | — | 7,017,560 | 5.7 | 5.7 | — | — | 7,017,560 | 5.7 | 5.6 | |||||||||||||||||||||
- *
- Represents
beneficial ownership of less than 1% of our outstanding shares of common stock.
- (1)
- Percentage
of total voting power represents voting power with respect to all shares of our Class A and Class B common stock, as a single
class. Holders of our Class B common stock are entitled to ten votes per share and will be convertible at any time into one share of Class A common stock, which will be entitled to one
vote per share. For more information about the voting rights of our Class A and Class B common stock, see "Description of Capital Stock — Common Stock."
- (2)
- Consists
of (a) 47,476,820 shares of Class B common stock held directly by Meritas Group, Inc. and (b) 7,470,435 shares held by
Meritas Holdings, LLC. Dr. Dunleavy, as the sole officer and sole director of Meritas Group, Inc. and as sole non-member manager of Meritas Holdings, LLC, maintains sole
voting and dispositive control over such shares. All ownership interests in Meritas Group, Inc. and Meritas Holdings, LLC are owned by an irrevocable trust for the sole benefit of
Dr. Dunleavy's descendants and in which Dr. Dunleavy has no pecuniary interest.
- (3)
- Consists
of shares issuable upon the exercise of options exercisable within 60 days of the date of this prospectus.
- (4)
- Includes
(i) 61,210 shares issuable upon the exercise of options exercisable within 60 days of the date of this prospectus,
(ii) 458,765 shares owned by an irrevocable charitable trust with an unrelated trustee over which shares Mr. Rizzo maintains dispositive control, and (iii) 1,375,050 shares owned
by an irrevocable trust for the sole benefit of Mr. Rizzo's son.
- (5)
- Includes
(i) 19,655,645 shares of Class B common stock held by Lapis Ventures, SAC Limited on behalf of Lapis Healthcare,
(ii) 3,721,190 shares of Class B common stock held by Lapis Ventures Limited SAC on behalf of Lapis Data, and (ii) 835,265 shares of Class B common stock held by Lapis
Ventures, SAC Limited on behalf of Lapis Medical. Mr. Hoffmann maintains sole voting and dispositive power over the shares held by Lapis Ventures, SAC Limited.
- (6)
- Richard W. Lasch and Suzanne C.E. Lasch are husband and wife. Share numbers include (i) 2,406,245 shares of Class B Common Stock ("Shares") owned by Mr. Lasch and as to which he has sole investment discretion and voting power, (ii) an aggregate of 1,771,130 Shares held by three trusts of which Mr. Lasch is the trustee and as to which he has sole investment discretion and voting power and (iii) an aggregate of 2,840,185 shares held by two trusts of which Mrs. Lasch is the trustee and as to which she has sole investment discretion and voting power.
144
Our authorized capital stock consists of 750,000,000 shares of Class A common stock, $0.000005 par value per share, 150,000,000 shares of Class B common stock, $0.000005 par value per share, 900,000,000 shares of common stock, $0.000005 par value per share, and 100,000,000 shares of undesignated preferred stock, $0.0001 par value per share. No shares of common stock will be issued or outstanding until the date on which the number of outstanding shares of our Class B common stock represents less than 10% of the aggregate combined number of outstanding shares of our Class A common stock and Class B common stock, at which time all outstanding shares of our Class A common stock and Class B common stock will automatically convert into shares of common stock. The following description summarizes the most important terms of our capital stock. Because it is only a summary, it does not contain all the information that may be important to you and is qualified in its entirety by reference to our restated certificate of incorporation and restated bylaws, which are included as exhibits to the registration statement of which this prospectus forms a part, and to the applicable provisions of Delaware law.
Effective September 17, 2014, in order to facilitate the administration, management and development of our business and this offering, Inovalon, Inc. implemented a holding company reorganization, or the Corporate Reorganization, pursuant to which we became the new parent company and Inovalon, Inc. became our direct, wholly owned subsidiary. To implement the Corporate Reorganization, Inovalon, Inc. formed our company and we, in turn, formed Inovalon Merger Sub, Inc., or the Merger Sub. The holding company structure was implemented by the merger of Merger Sub with and into Inovalon, Inc. with Inovalon, Inc. surviving the merger as a direct, wholly-owned subsidiary of our company. As a result of the Corporate Reorganization each share of Inovalon, Inc. issued and outstanding immediately prior to the merger automatically converted into one share of common stock of our company.
After the Corporate Reorganization, our capital stock was reclassified to implement a dual class capital structure providing for two classes of common stock, with each share of common stock held by our existing stockholders reclassified as Class B common stock. Following the reclassification, we redeemed approximately 8.33% of our Class B common stock on a pro rata basis among our stockholders for an aggregate amount of $300.0 million using the proceeds from the Term Loan Facility, as more fully described in "Management's Discussion and Analysis of Financial Condition and Results of Operations — Liquidity and Capital Resources — Debt."
General
As of the date of this prospectus, no shares of Class A common stock are outstanding and 122,257,145 shares of Class B common stock are outstanding. Upon the completion of this offering, there will be 22,222,222 shares of Class A common stock outstanding (assuming no exercise of the underwriters' option to purchase additional shares) and 122,257,145 shares of Class B common stock outstanding.
Voting Rights
Holders of our Class A common stock and Class B common stock have identical voting rights, except that holders of our Class A common stock are entitled to one vote per share and holders of our Class B common stock are entitled to 10 votes per share. Holders of shares of Class A common stock and Class B common stock will vote together as a single class on all matters (including the election of directors) submitted to a vote of stockholders, except that there will be
145
separate votes of holders of shares of our Class A common stock and Class B common stock in the following circumstances:
- •
- if we propose to treat the shares of a class of our stock differently with respect to any dividend or distribution of
cash, property, or shares of our stock paid or distributed by us;
- •
- if we propose to treat the shares of a class of our stock differently with respect to any subdivision or combination of
the shares of a class of our stock; or
- •
- if we propose to treat the shares of a class of our stock differently in connection with a change of control with respect to any consideration into which the shares are converted or any consideration paid or otherwise distributed to our stockholders.
Under our restated certificate of incorporation, we may not increase or decrease the authorized number of shares of Class A common stock or Class B common stock without the affirmative vote of the holders of a majority of the combined voting power of the outstanding shares of Class A common stock and Class B common stock.
Under our restated certificate of incorporation, we may not issue any shares of Class B common stock, other than upon exercise of options, warrants, or similar rights to acquire shares of Class B common stock outstanding at the time of this offering and in connection with stock dividends and similar transactions, unless that issuance is approved by the affirmative vote of the holders of a majority of the outstanding shares of Class B common stock.
Dividend Rights
Subject to preferences that may apply to any shares of preferred stock outstanding at the time, the holders of our Class A and Class B common stock are entitled to share equally, identically and ratably, on a per share basis, with respect to any dividend or distribution of cash, property or shares of our capital stock paid or distributed by the company, unless different treatment of the shares of each such class is approved by the affirmative vote of the holders of a majority of the outstanding shares of Class A common stock and Class B common stock, each voting separately as a class. In the event a dividend or distribution is paid in the form of shares of Class A common stock or Class B common stock or rights to acquire shares of stock, the holders of Class A common stock will receive Class A common stock, or rights to acquire Class A common stock, and the holders of Class B common stock will receive Class B common stock, or rights to acquire Class B common stock.
No Preemptive or Similar Rights
Upon the completion of this offering, our common stock will not be entitled to preemptive rights and will not be subject to conversion, redemption or sinking fund provisions, except for the conversion provisions of our Class B common stock discussed below.
Right to Receive Liquidation Distributions
Upon our liquidation, dissolution or winding-up, the holders of Class A common stock and Class B common stock will be entitled to share equally, ratably, and identically, on a per share basis, in all assets remaining after the payment of any liabilities and the liquidation preferences on any outstanding preferred stock, unless different treatment of the shares of such class is approved by the affirmative vote of the holders of the majority of the outstanding shares of Class A common stock and Class B common stock, each voting separately as a class.
146
Conversion
Each outstanding share of Class B common stock is convertible at any time at the option of the holder into one share of Class A common stock. In addition, each share of Class B common stock will convert automatically into one share of Class A common stock upon any transfer, whether or not for value, except for certain transfers described in our restated certificate of incorporation, including, without limitation, transfers for tax and estate planning purposes, so long as the transferring holder of Class B common stock continues to hold exclusive voting and dispositive power with respect to the shares transferred, and transfers to persons or entitities who are Class B stockholders at the time of the transfer. Also, each share of Class B common stock held of record by a natural person, other than a natural person who held the shares as of our initial public offering, will convert automatically into one share of Class A common stock upon the death of the holder. Once converted into Class A common stock, a share of Class B common stock may not be reissued.
Upon the date on which the number of outstanding shares of Class B common stock represents less than 10% of the aggregate combined number of outstanding shares of Class A common stock and Class B common stock or upon a two-thirds vote by all holders of Class B common stock, all outstanding shares of Class A common stock and Class B common stock will convert automatically into a single class of common stock, and no additional shares of Class A common stock or Class B common stock will be issued.
Following this offering, no shares of preferred stock will be outstanding. Pursuant to our restated certificate of incorporation, our board of directors will be authorized, subject to limitations prescribed by Delaware law, to issue up to 100,000,000 shares of preferred stock in one or more series, to establish from time to time the number of shares to be included in each series, and to fix the designation, powers, preferences and rights of the shares of each series and any of its qualifications, limitations or restrictions, in each case without further vote or action by our stockholders. Our board of directors can also increase or decrease the number of shares of any series of preferred stock, but not below the number of shares of that series then outstanding, without any further vote or action by our stockholders. Our board of directors may authorize the issuance of preferred stock with voting or conversion rights that could adversely affect the voting power or other rights of the holders of our common stock. The issuance of preferred stock, while providing flexibility in connection with possible acquisitions and other corporate purposes, could, among other things, have the effect of delaying, deferring, or preventing a change in control of our company and might adversely affect the market price of our Class A common stock and the voting and other rights of the holders of our common stock. We have no current plan to issue any shares of preferred stock.
As of September 30, 2014, we had outstanding options to purchase an aggregate of 6,451,275 shares of our Class B common stock, with a weighted-average exercise price of $5.97, of which 3,765,985 were vested and exercisable.
Upon completion of this offering, we will have 488,780 restricted stock units outstanding.
147
Stock Awards Available For Future Issuance
Upon completion of this offering, a total of 9,169,287 shares of Class A common stock remain available for future issuance under our 2015 Plan and ESPP. No awards will be granted under the Pre-IPO Plan after the completion of this offering.
Pursuant to the terms of the Stockholders' Agreement, immediately following this offering, the holders of 122,257,145 shares of our Class B common stock will be entitled to rights with respect to the registration of these shares under the Securities Act, as described below. We refer to these shares collectively as registrable securities. The description below is only a summary, does not contain all the information that may be important to you and is qualified in its entirety by reference to the Stockholders' Agreement, a copy of which is included as an exhibit to the registration statement of which this prospectus forms a part.
Registration of the resale of any of the shares of common stock held by security holders with registration rights would result in such shares becoming freely tradable without restriction under the Securities Act immediately upon effectiveness of such registration.
Demand Registration Rights
Under the Stockholders' Agreement, the holders of at least 40% of the then-outstanding registrable securities may make a written request to us to register the resale of at least 40% of the registrable securities then outstanding. We are only required to file two registration statements that are declared effective upon exercise of these demand registration rights. We may postpone the filing of a registration statement for up to 180 days in any 12-month period if our board of directors determines in good faith, among other things, that the filing would be materially detrimental to us and our stockholders.
Piggyback Registration Rights
Under the Stockholders' Agreement, if, after the completion of this offering, we propose to file a registration statement in connection with an underwritten public offering of our securities for cash, we will have to use our reasonable best efforts to include in the registration statement all registrable securities that the holders request in writing be registered for resale within 20 days of mailing of notice by us to all holders of the proposed public offering. However, this right does not apply to a registration statement relating to, among other transactions, the issuance of securities under any of our stock plans, a corporate reorganization, or other transaction under Rule 145 of the Securities Act, or a registration on any registration form that does not include substantially the same information as would be required to be included in a registration statement covering the sale of the registrable securities. The underwriters of any underwritten offering will have the right to limit the number of registrable securities to be sold pursuant the holders' piggyback registration rights if they determine, in their reasonable discretion, that the inclusion of such shares would jeopardize the success of the public offering. However, in no event will the number of shares registered by these holders be limited by the underwriters to less than 20% of the total shares offered by the registration statement.
Form S-3 Registration Rights
Under the Stockholders' Agreement, the holders of at least 15% of the then-outstanding registrable securities can request that we register all or part of their shares on Form S-3 if we are eligible to file a registration statement on Form S-3 and if the aggregate price to the public of the shares offered, net of any underwriters' discounts or commissions, is at least $25.0 million. The
148
stockholders may only require us to effect two registration statements on Form S-3 in any 12-month period. We may postpone the filing of a registration statement on Form S-3 twice during any 12-month period, in each case for not more than 90 days, if our board of directors determines in good faith, among other things, that the filing would be materially detrimental to us and our stockholders. In addition, holders with registration rights may not request that we register their registrable securities for resale on a Form S-3 during the 180-day period following the filing of a registration statement by us for our own account or pursuant to the holders' registration rights.
Expenses of Registration Rights
We are generally required to bear all of the expenses of such registrations, including reasonable fees of a single counsel acting on behalf of all selling holders, except underwriting discounts and selling commissions.
Expiration of Registration Rights
The registration rights described above will expire five years after the completion of this offering and, as long as we are subject to the periodic reporting requirements under the Exchange Act, will not be exercisable as to any holder if the holder's registrable securities could otherwise be sold without restriction under Rule 144 under the Securities Act within a 90-day period.
So long as the outstanding shares of our Class B common stock represent at least 10% of the combined number of our outstanding shares of Class A common stock and Class B common stock, the holders of the shares of our Class B common stock will effectively control all matters submitted to our stockholders for a vote, as well as the overall management and direction of our company. Upon completion of this offering, holders of our Class B common stock will beneficially own an aggregate of 98.2% of the voting power of our common stock (or 98.0% if the underwriters exercise in full their option to purchase additional shares). In particular, Dr. Dunleavy will beneficially own an aggregate of 44.1% of the voting power of our common stock (or 44.0% if the underwriters exercise in full their option to purchase additional shares), and Mr. Hoffmann will beneficially own an aggregate of 23.1% of the voting power of our common stock (or 23.0% if the underwriters exercise in full their option to purchase additional shares). The voting power of our Class B common stockholders could have the effect of delaying, deferring or discouraging another person from acquiring control of our company.
After such time as the shares of our Class B common stock no longer represent at least 10% of the combined number of our outstanding shares of Class A common stock and Class B common stock, certain provisions of our restated certificate of incorporation and our restated bylaws will become effective. Those provisions, together with certain provisions of Delaware law, may further have the effect of delaying, deferring or discouraging another person from acquiring control of our company.
Delaware Law
Upon the closing of our initial public offering, we will be governed by the provisions of Section 203 of the Delaware General Corporation Law regulating corporate takeovers. This section prevents some Delaware corporations from engaging, under some circumstances, in a business combination, which includes a merger or sale of at least 10% of the corporation's assets with any interested stockholder, meaning a stockholder who, together with affiliates and associates, owns or,
149
within three years prior to the determination of interested stockholder status, did own 15% or more of the corporation's outstanding voting stock, unless:
- •
- the transaction is approved by the board of directors prior to the time that the interested stockholder became an
interested stockholder;
- •
- upon consummation of the transaction which resulted in the stockholder's becoming an interested stockholder, the
interested stockholder owned at least 85% of the voting stock of the corporation outstanding at the time the transaction commenced, excluding stock owned by directors who are also officers of the
corporation; or
- •
- subsequent to such time that the stockholder became an interested stockholder, the business combination is approved by the board of directors and authorized at an annual or special meeting of stockholders by at least two-thirds of the outstanding voting stock which is not owned by the interested stockholder.
A Delaware corporation may "opt out" of these provisions with an express provision in its original certificate of incorporation or an express provision in its certificate of incorporation or bylaws resulting from a stockholders' amendment approved by at least a majority of the outstanding voting shares. We have not opted out of these provisions. As a result, mergers or other takeover or change in control attempts of us may be discouraged or prevented.
Restated Certificate of Incorporation and Restated Bylaw Provisions
Our restated certificate of incorporation and our restated bylaws include a number of provisions that could deter hostile takeovers or delay or prevent changes in control of our company, some of which are effective today and others of which will become effective after such time as the shares of our Class B common stock no longer represent at least 10% of the combined number of our outstanding shares of Class A common stock and Class B common stock, including the following:
- •
- Dual Class
Stock. As described above in "— Class A and B Common Stock — Voting Rights," our restated
certificate of incorporation provides for a dual class common stock structure, which provides holders of our Class A common stock with one vote per share and holders of our Class B
common stock with 10 votes per share, giving holders of our Class B common stock the ability to control the outcome of matters pertaining to change in control matters, even if they own
significantly less than a majority of the shares of our outstanding Class A and Class B common stock. As a result, our executive officers, directors and their affiliates will have the
ability to exercise significant influence over those matters. Upon completion of this offering, holders of our Class B common stock will beneficially own an aggregate of 98.2% of the voting
power of our common stock (or 98.0% if the underwriters exercise in full their option to purchase additional shares). In particular, Dr. Dunleavy will beneficially own an aggregate of 44.1% of
the voting power of our common stock (or 44.0% if the underwriters exercise in full their option to purchase additional shares), and Mr. Hoffmann will beneficially own an aggregate of 23.1% of
the voting power of our common stock (or 23.0% if the underwriters exercise in full their option to purchase additional shares).
- •
- Number of Directors; Vacancies. Our restated certificate of incorporation provides that the number of our directors can be set by the board of directors. Vacancies on the board of directors may be filled only by the affirmative vote of a majority of the remaining directors then in office and not by the stockholders. These provisions will prevent a stockholder from increasing the size of our board of directors and gaining control of our board of directors by filling the resulting vacancies with its own nominees.
150
- •
- Classified
Board. Our board of directors will not initially be classified. Our restated certificate of incorporation and restated bylaws provide
that when the shares of our Class B common stock represent less than 10% of the combined number of our outstanding shares of Class A common stock and Class B common stock, our
board of directors will be classified into three classes of directors, each of which will hold office for a three-year term. In addition, thereafter, directors may only be removed from the board of
directors for cause. The existence of a classified board could delay a successful tender offeror from obtaining majority control of our board of directors, and the prospect of that delay might deter a
potential offeror.
- •
- Stockholder Action; Special Meetings of
Stockholders. Our restated certificate of incorporation provides that stockholders are able to take action by written consent. When the
shares of our Class B common stock no longer represent at least 10% of the combined number of our outstanding shares of Class A common stock and Class B common stock, our
stockholders will no longer be able to take action by written consent, and will only be able to take action at annual or special meetings of our stockholders. Our restated bylaws further provide that
so long as the shares of our Class B common stock represent at least 10% of the combined number of our outstanding shares of Class A common stock and Class B common stock, special
meetings of our stockholders may be called only by a majority of our board of directors, the chairman of our board of directors or our chief executive officer and may also be called by stockholders
holding shares that represent at least 50% of the combined voting power of our Class A common stock and Class B common stock. Thereafter, special meetings of our stockholders may only be
called by a majority of our board of directors, the chairman of our board of directors or our chief executive officer.
- •
- Advance Notice Requirements for Stockholder Proposals and Director
Nominations. Our restated bylaws provide advance notice procedures for stockholders seeking to bring business before our annual meeting
of stockholders, or to nominate candidates for election as directors at any meeting of stockholders. Our restated bylaws also specify certain requirements regarding the form and content of a
stockholder's notice. These provisions may preclude our stockholders from bringing matters before our annual meeting of stockholders or from making nominations for directors at our meetings of
stockholders.
- •
- No Cumulative
Voting. The Delaware General Corporation Law provides that stockholders are not entitled to the right to cumulate votes in the election
of directors unless a corporation's certificate of incorporation provides otherwise. Our restated certificate of incorporation and restated bylaws do not provide for cumulative voting.
- •
- Issuance of Undesignated Preferred
Stock. Our board of directors has the authority, without further action by the stockholders, to issue up to 100,000,000 shares of
undesignated preferred stock with rights and preferences, including voting rights, designated from time to time by the board of directors. The existence of authorized but unissued shares of preferred
stock enables our board of directors to render more difficult or to discourage an attempt to obtain control of us by means of a merger, tender offer, proxy contest, or otherwise.
- •
- Amendments. Amendments to our restated bylaws require the approval of a majority of the combined voting power of our Class A common stock and Class B common stock. When the outstanding shares of our class B common stock represent less than 10% of the total outstanding shares, certain amendments to our restated bylaws will require the approval of two-thirds of the voting power of our then-outstanding shares of common stock.
151
Choice of Forum
Our restated certificate of incorporation provides that the Court of Chancery of the State of Delaware will be the exclusive forum for any derivative action or proceeding brought on our behalf; any action asserting a breach of fiduciary duty; any action asserting a claim against us arising pursuant to the Delaware General Corporation Law, our restated certificate of incorporation or our restated bylaws; or any action asserting a claim against us that is governed by the internal affairs doctrine.
We have been approved to list our Class A common stock on the NASDAQ Global Select Market under the symbol "INOV."
The transfer agent and registrar for our Class A common stock will be American Stock Transfer & Trust Company. The transfer agent's address is 6201 15th Avenue, 3rd Floor, Brooklyn, NY 11219. Our shares of Class A common stock will be issued in uncertificated form only, subject to limited circumstances.
152
SHARES ELIGIBLE FOR FUTURE SALE
Prior to this offering, there has been no public market for our Class A common stock, and we cannot predict the effect, if any, that market sales of shares of our Class A common stock or the availability of shares of our Class A common stock for sale will have on the market price of our Class A common stock prevailing from time to time. Nevertheless, sales of substantial amounts of our Class A common stock, including shares issued upon exercise of outstanding options, in the public market following this offering could adversely affect market prices prevailing from time to time and could impair our ability to raise capital through the sale of our equity securities.
Upon the closing of this offering, we will have outstanding 22,222,222 shares of our Class A common stock and 122,257,145 shares of our Class B common stock, based on the number shares outstanding as of the date of this prospectus and assuming no exercise of the underwriters' option to purchase additional shares. This includes the 22,222,222 shares of Class A common stock that we are selling in this offering, which shares may be resold in the public market immediately, and assumes no additional exercise of outstanding options other than as described elsewhere in this prospectus. Shares of our Class B common stock are convertible into an equivalent number of shares of our Class A common stock and generally convert into shares of our Class A common stock upon sale or transfer.
Of these outstanding shares, all of the 22,222,222 shares of Class A common stock sold in this offering will be freely tradeable, except that any shares purchased in this offering by our affiliates, as that term is defined in Rule 144 under the Securities Act, would only be able to be sold in compliance with the Rule 144 limitations described below.
All of our security holders are subject to lock-up agreements with the underwriters or market stand-off agreements in favor of the underwriters under which they have agreed, subject to specific exceptions, not to sell, dispose of or transfer their shares of our common stock for a period of 180 days following the date of this prospectus, as described below. As a result of these agreements and the provisions of the Stockholders' Agreement described above under "Description of Capital Stock — Registration Rights," subject to the provisions of Rule 144 or Rule 701, shares will be available for sale in the public market as follows:
- •
- Beginning on the date of this prospectus, all of the shares sold in this offering will be immediately available for sale
in the public market; and
- •
- Beginning 181 days after the date of this prospectus, 122,257,145 additional shares will become eligible for sale in the public market, of which 89,093,650 shares will be held by affiliates and subject to the volume and other restrictions of Rule 144, as described below.
Lock-Up and Market Stand-Off Agreements
Pursuant to lock-up agreements with the underwriters or market stand-off agreements in favor of the underwriters, we, our executive officers and directors, and holders of all of our common stock and securities convertible into or exchangeable for our common stock have agreed, subject to certain exceptions, not to sell, dispose of, or transfer their shares of our common stock for a period of 180 days following the date of this prospectus.
The contractual lock-up agreements with the underwriters, subject to specific exceptions described in the section entitled "Underwriting" below, prohibit the offering for sale, selling, contracting to sell, granting any option for the sale of, pledging, transferring, or otherwise disposing of any shares of our common stock, options to acquire shares of our common stock or any security or instrument related to our common stock, option or warrant, or entering into any swap, hedge, or other arrangement that transfers to another any of the economic consequences of ownership of the
153
common stock, for a period of 180 days following the date of this prospectus without the prior written consent of Goldman, Sachs & Co. See "Underwriting."
In addition, all of our stockholders are subject to our Stockholders' Agreement, which contains a market stand-off agreement imposing restrictions on the ability of our stockholders to lend, offer, pledge, sell, contract to sell, sell any option or contact to purchase, purchase any option or contact to sell, grant any option, right or warrant to purchase, or otherwise transfer or dispose of, directly or indirectly, any shares of our common stock or any securities convertible into or exercisable or exchangeable for shares of our common stock for a period of 180 days following the date of this prospectus. Pursuant to the Stockholders' Agreement, the underwriters are express, third-party beneficiaries of the market stand-off agreement and can enforce the restrictions on sales of our securities. In addition, we have agreed with the underwriters that we will not take any action to modify the market stand-off agreement or waive the restrictions on sales of our securities during the 180 days after the date of this prospectus, without the prior written consent of Goldman, Sachs & Co. See "Underwriting."
In general, under Rule 144 as currently in effect, once we have been subject to public company reporting requirements for at least 90 days, a person who is not deemed to have been one of our affiliates for purposes of the Securities Act at any time during the 90 days preceding a sale and who has beneficially owned the shares proposed to be sold for at least six months, including the holding period of any prior owner other than our affiliates, is entitled to sell those shares without complying with the manner of sale, volume limitation or notice provisions of Rule 144, subject to compliance with the public information requirements of Rule 144. If such a person has beneficially owned the shares proposed to be sold for at least one year, including the holding period of any prior owner other than our affiliates, then that person would be entitled to sell those shares without complying with any of the requirements of Rule 144.
In general, under Rule 144, as currently in effect, our affiliates or persons selling shares on behalf of our affiliates are entitled to sell upon expiration of the lock-up and market standoff agreements described above, within any three-month period, a number of shares that does not exceed the greater of:
- •
- 1% of the number of shares of our Class A common stock then outstanding, which will equal approximately 222,222
shares immediately after this offering; or
- •
- the average weekly trading volume of our Class A common stock during the four calendar weeks preceding the filing of a notice on Form 144 with respect to that sale.
Sales under Rule 144 by our affiliates or persons selling shares on behalf of our affiliates are also subject to certain manner of sale provisions and notice requirements and to the availability of current public information about us.
Rule 701 generally allows a stockholder who purchased shares of our common stock pursuant to a written compensatory plan or contract and who is not deemed to have been an affiliate of our company during the immediately preceding 90 days to sell these shares in reliance upon Rule 144, but without being required to comply with the public information, holding period, volume limitation or notice provisions of Rule 144. Rule 701 also permits affiliates of our company to sell their Rule 701 shares under Rule 144 without complying with the holding period requirements of Rule 144. All holders of Rule 701 shares, however, are required by that rule to wait until 90 days after the date of this prospectus before selling those shares pursuant to Rule 701.
154
Concurrently with or shortly after the closing of this offering, we intend to file one or more registration statements on Form S-8 under the Securities Act covering all of the shares of our common stock subject to outstanding options and other equity awards and the shares of our Class A common stock reserved for issuance under our stock plans. In addition, we intend to file a registration statement on Form S-8 or such other form as may be required under the Securities Act for the resale of shares of our common stock issued upon the exercise of options that were not granted under Rule 701. We expect to file this registration statement as soon as permitted under the Securities Act. However, the shares registered on Form S-8 may be subject to the volume limitations and the manner of sale, notice and public information requirements of Rule 144 and will not be eligible for resale until expiration of the lock-up and market standoff agreements to which they are subject.
We have granted demand, piggyback, and Form S-3 registration rights to certain of our Class B stockholders to sell our common stock. Registration of the sale of these shares under the Securities Act would result in these shares becoming freely tradable without restriction under the Securities Act immediately upon the effectiveness of the registration, except for shares purchased by affiliates. For a further description of these rights, see "Description of Capital Stock — Registration Rights."
155
MATERIAL U.S. FEDERAL INCOME TAX CONSIDERATIONS
FOR NON-U.S. HOLDERS OF OUR CLASS A COMMON STOCK
This section summarizes the material U.S. federal income tax considerations for "non-U.S. holders" (as defined below) relating to the acquisition, ownership, and disposition of our Class A common stock issued pursuant to this offering. This summary does not provide a complete analysis of all potential U.S. federal income tax considerations relating thereto. The information provided below is based upon provisions of the Internal Revenue Code of 1986, as amended, or the Code, Treasury regulations promulgated thereunder, administrative rulings and judicial decisions currently in effect. These authorities may change at any time, possibly retroactively, or the Internal Revenue Service, or IRS, might interpret the existing authorities differently. In either case, the tax considerations of acquiring owning, or disposing of our Class A common stock could differ from those described below. As a result, we cannot assure you that the tax consequences described in this discussion will not be challenged by the IRS or will be sustained by a court if challenged by the IRS.
This summary does not address the tax considerations arising under the laws of any non-U.S., state or local jurisdiction, the potential application of the Medicare contribution tax, or tax considerations arising under U.S. federal gift and estate tax laws. In addition, this discussion does not address tax considerations applicable to an investor's particular circumstances or to investors that may be subject to special tax rules, including, without limitation:
- •
- banks, insurance companies, or other financial institutions;
- •
- corporations that accumulate earnings to avoid U.S. federal income tax;
- •
- persons subject to the alternative minimum tax;
- •
- tax-exempt organizations or tax-qualified retirement plans;
- •
- real estate investment trusts or regulated investment companies;
- •
- controlled foreign corporations or passive foreign investment companies;
- •
- persons who acquired our Class A common stock as compensation for services;
- •
- dealers in securities or currencies;
- •
- traders in securities that elect to use a mark-to-market method of accounting for their securities holdings;
- •
- persons that own, or are deemed to own, more than 5% of our capital stock (except to the extent specifically set forth
below);
- •
- certain former citizens or long-term residents of the United States;
- •
- persons who hold our Class A common stock as a position in a hedging transaction, "straddle," "conversion
transaction," or other risk reduction transaction;
- •
- persons who do not hold our Class A common stock as a capital asset within the meaning of Section 1221 of
the Code (generally, for investment purposes); or
- •
- persons deemed to sell our Class A common stock under the constructive sale provisions of the Code.
In addition, if a partnership or entity classified as a partnership for U.S. federal income tax purposes is a beneficial owner of our Class A common stock, the tax treatment of a partner in the partnership or an owner of the entity will depend upon the status of the partner or other owner and the activities of the partnership or other entity. Accordingly, this summary does not address tax
156
considerations applicable to partnerships that hold our Class A common stock, and partners in such partnerships should consult their tax advisors.
INVESTORS CONSIDERING THE PURCHASE OF OUR CLASS A COMMON STOCK SHOULD CONSULT THEIR OWN TAX ADVISORS REGARDING THE APPLICATION OF THE U.S. FEDERAL INCOME TAX LAWS TO THEIR PARTICULAR SITUATIONS AND THE TAX CONSEQUENCES OF THE PURCHASE, OWNERSHIP, OR DISPOSITION OF OUR CLASS A COMMON STOCK UNDER ANY OTHER FEDERAL OR ANY FOREIGN, STATE, OR LOCAL LAWS OR UNDER ANY APPLICABLE TAX TREATIES.
For purposes of this summary, a "non-U.S. holder" is a beneficial owner of our Class A common stock, other than a partnership, that is not, for U.S. federal income tax purposes:
- •
- an individual who is a citizen or resident of the United States;
- •
- a corporation, or other entity taxable as a corporation for U.S. federal income tax purposes, created or organized under
the laws of the United States, any state therein or the District of Columbia;
- •
- a trust if it (i) is subject to the primary supervision of a U.S. court and one of more U.S. persons have
authority to control all substantial decisions of the trust or (ii) has a valid election in effect under applicable U.S. Treasury regulations to be treated as a U.S. person; or
- •
- an estate whose income is subject to U.S. income tax regardless of source.
If you are a non-U.S. citizen that is an individual, you may, in many cases, be deemed to be a resident alien, as opposed to a nonresident alien, by virtue of being present in the United States for at least 31 days in the calendar year and for an aggregate of at least 183 days during a three-year period ending in the current calendar year. For these purposes, all the days present in the current year, one-third of the days present in the immediately preceding year, and one-sixth of the days present in the second preceding year are counted. Resident aliens are subject to U.S. federal income tax as if they were U.S. citizens. Such an individual is urged to consult his or her own tax advisor regarding the U.S. federal income tax consequences of the ownership or disposition of our Class A common stock.
We do not expect to declare or make any distributions on our Class A common stock in the foreseeable future. However, if we do make distributions of cash or other property on shares of our Class A common stock, such distributions will constitute dividends for U.S. federal income tax purposes to the extent paid from our current or accumulated earnings and profits, as determined under U.S. federal income tax principles. Distributions in excess of our current and accumulated earnings and profits will constitute a return of capital that is applied against and reduces, but not below zero, a non-U.S. holder's adjusted tax basis in shares of our Class A common stock. Any remaining excess will be treated as gain realized on the sale or other disposition of our Class A common stock. See "— Sale of Class A Common Stock."
Any dividend paid to a non-U.S. holder on our Class A common stock that is not effectively connected with a non-U.S. holder's conduct of a trade or business in the United States will generally be subject to U.S. withholding tax at a 30% rate. The withholding tax might not apply, however, or might apply at a reduced rate, under the terms of an applicable income tax treaty between the United States and the non-U.S. holder's country of residence. You should consult your
157
tax advisors regarding your entitlement to benefits under a relevant income tax treaty. Generally, in order for us or our paying agent to withhold tax at a lower treaty rate, a non-U.S. holder must certify its entitlement to treaty benefits. A non-U.S. holder generally can meet this certification requirement by providing a Form W-8BEN or Form W-8BEN-E (or any successor form) or appropriate substitute form to us or our paying agent. If the non-U.S. holder holds the stock through a financial institution or other agent acting on the holder's behalf, the holder will be required to provide appropriate documentation to the agent. The holder's agent will then be required to provide certification to us or our paying agent, either directly or through other intermediaries. If you are eligible for a reduced rate of U.S. federal withholding tax under an income tax treaty, you may obtain a refund or credit of any excess amounts withheld by filing an appropriate claim for a refund with the IRS in a timely manner.
Dividends received by a non-U.S. holder that are effectively connected with a U.S. trade or business conducted by the non-U.S. holder, and if required by an applicable income tax treaty between the United States and the non-U.S. holder's country of residence, are attributable to a permanent establishment maintained by the non-U.S. holder in the United States, are not subject to U.S. withholding tax. To obtain this exemption, a non-U.S. holder must provide us or our paying agent with an IRS Form W-8ECI properly certifying such exemption. Such effectively connected dividends, although not subject to withholding tax, are taxed at the same graduated rates applicable to U.S. persons, net of certain deductions and credits. In addition to being taxed at graduated tax rates, dividends received by corporate non-U.S. holders that are effectively connected with a U.S. trade or business of the corporate non-U.S. holder may also be subject to a "branch profits tax." The branch profits tax rate is 30%, although an applicable income tax treaty between the United States and the non-U.S. holder's country of residence might provide for a lower rate.
Except as otherwise described below, non-U.S. holders will generally not be subject to U.S. federal income tax on any gains realized on the sale, exchange, or other disposition of our Class A common stock unless:
- •
- the gain (i) is effectively connected with the conduct by the non-U.S. holder of a U.S. trade or business and
(ii) if required by an applicable income tax treaty between the United States and the non-U.S. holder's country of residence, is attributable to a permanent establishment (or, in certain cases
involving individual holders, a fixed base) maintained by the non-U.S. holder in the United States (in which case the special rules described below apply);
- •
- the non-U.S. holder is a nonresident alien individual who is present in the United States for 183 days or more in
the taxable year of the sale, exchange or other disposition of our Class A common stock and certain other requirements are met (in which case the gain would be subject to a flat 30% tax, or
such reduced rate as may be specified by an applicable income tax treaty, which may be offset by U.S. source capital losses, even though the individual is not considered a resident of the United
States); or
- •
- the rules of the Foreign Investment in Real Property Tax Act, or FIRPTA treat the gain as effectively connected with a U.S. trade or business.
The FIRPTA rules generally treat the gain on a sale, exchange, or other disposition of our Class A common stock as effectively connected with a U.S. trade or business if our Class A common stock constitutes U.S. real property interests by reason of us being, or having been within the shorter of the five-year period preceding the disposition and the non-U.S. holder's holding period, a "U.S. real property holding corporation," or USRPHC. In general, we would be a USRPHC if interests in U.S. real property comprised at least half of the value of our business assets. We do not believe that we are a USRPHC and we do not anticipate becoming one in the future. Even if we
158
become a USRPHC, as long as our Class A common stock is regularly traded on an established securities market, our Class A common stock will be treated as U.S. real property interests with respect to a particular non-U.S. holder only if beneficially owned by such non-U.S. holder that actually or constructively owned more than 5% of our outstanding Class A common stock at some time within the shorter of the five-year period preceding the disposition or the non-U.S. holder's holding period.
If any gain from the sale, exchange, or other disposition of our Class A common stock (i) is effectively connected with a U.S. trade or business conducted by a non-U.S. holder, and (ii) if required by an applicable income tax treaty between the United States and the non-U.S. holder's country of residence, is attributable to a permanent establishment (or, in certain cases involving individuals, a fixed base) maintained by such non-U.S. holder in the United States, then the gain generally will be subject to U.S. federal income tax at the same graduated rates applicable to U.S. persons, net of certain deductions and credits. If the non-U.S. holder is a corporation, under certain circumstances, that portion of its earnings and profits that is effectively connected with its U.S. trade or business, subject to certain adjustments, generally also would be subject to a branch profits tax. The branch profits tax rate is 30%, although an applicable income tax treaty between the United States and the non-U.S. holder's country of residence might provide for a lower rate.
Backup Withholding and Information Reporting
The Code and the Treasury regulations require those who make specified payments to report the payments to the IRS. Among the specified payments are dividends and proceeds paid by brokers to their customers. The required information returns enable the IRS to determine whether the recipient properly included the payments in income. This reporting regime is reinforced by "backup withholding" rules. These rules require the payors to withhold tax from payments subject to information reporting if the recipient fails to cooperate with the reporting regime by failing to provide his taxpayer identification number to the payor, furnishing an incorrect identification number, or failing to report interest or dividends on his returns. The backup withholding tax rate is currently 28%. The backup withholding rules do not apply to payments to corporations, whether domestic or foreign, provided they establish such exemption.
Payments to non-U.S. holders of dividends on Class A common stock generally will not be subject to backup withholding, and payments of proceeds made to non-U.S. holders by a broker upon a sale of Class A common stock will not be subject to information reporting or backup withholding, in each case so long as the non-U.S. holder certifies its nonresident status (and we or our paying agent do not have actual knowledge or reason to know the holder is a U.S. person or that the conditions of any other exemption are not, in fact, satisfied) or otherwise establishes an exemption. The certification procedures to claim treaty benefits described under "— Dividends" will generally satisfy the certification requirements necessary to avoid the backup withholding tax. We must report annually to the IRS any dividends paid to each non-U.S. holder and the tax withheld, if any, with respect to these dividends. Copies of these reports may be made available to tax authorities in the country where the non-U.S. holder resides.
Under the Treasury regulations, the payment of proceeds from the disposition of shares of our Class A common stock by a non-U.S. holder made to or through a U.S. office of a broker generally will be subject to information reporting and backup withholding unless the beneficial owner certifies, under penalties of perjury, among other things, its status as a non-U.S. holder (and the broker does not have actual knowledge or reason to know the holder is a U.S. person) or otherwise establishes an exemption. The payment of proceeds from the disposition of shares of our Class A common stock by a non-U.S. holder made to or through a non-U.S. office of a broker generally will not be subject to backup withholding and information reporting, except as noted below. Information reporting, but not backup withholding, will apply to a payment of proceeds, even if that payment is
159
made outside of the United States, if you sell our Class A common stock through a non-U.S. office of a broker that is:
- •
- a U.S. person (including a foreign branch or office of such person);
- •
- a "controlled foreign corporation" for U.S. federal income tax purposes;
- •
- a foreign person 50% or more of whose gross income from certain periods is effectively connected with a U.S. trade or
business; or
- •
- a foreign partnership if at any time during its tax year (a) one or more of its partners are U.S. persons who, in the aggregate, hold more than 50% of the income or capital interests of the partnership or (b) the foreign partnership is engaged in a U.S. trade or business;
unless the broker has documentary evidence that the beneficial owner is a non-U.S. holder and certain other conditions are satisfied, or the beneficial owner otherwise establishes an exemption (and the broker has no actual knowledge or reason to know to the contrary).
Backup withholding is not an additional tax. Any amounts withheld from a payment to a non-U.S. holder of Class A common stock under the backup withholding rules can be credited against any U.S. federal income tax liability of the non-U.S. holder and may entitle the non-U.S. holder to a refund, provided that the required information is furnished to the IRS in a timely manner.
Foreign Account Tax Compliance Act
Withholding taxes may be imposed under the Foreign Account Tax Compliance Act, or FATCA, on certain types of payments made to non-U.S. financial institutions and certain other non-U.S. entities. Specifically, subject to certain exceptions, Sections 1471 to 1474 of the Code generally impose a 30% withholding tax on dividends paid with respect to, and the gross proceeds from a sale or other disposition of, our Class A common stock, in each case paid to (i) a "foreign financial institution" (as defined in the Code), or FFI, unless the FFI enters into an agreement with the U.S. Treasury Department to perform due diligence and collect and report detailed information regarding its U.S. accounts and their holders (including certain account holders that are foreign entities that have U.S. owners), and satisfies certain other requirements and (ii) a "non-financial foreign entity" (as defined in the Code), or NFFE, unless the NFFE either certifies it does not have any "substantial United States owners" (as defined in the Code) or furnishes identifying information regarding each substantial United States owner, and complies with certain other requirements. An intergovernmental agreement implementing FATCA between the United States and an applicable non-U.S. jurisdiction may modify these requirements.
Withholding under FATCA (i) generally applies to payments of dividends on our Class A common stock and (ii) will apply to payments of gross proceeds from the sale or other disposition of such stock occurring on or after January 1, 2017. Under certain circumstances, a non-U.S. holder of shares of our Class A common stock might be eligible for refunds or credits of the tax. Prospective investors are encouraged to consult their tax advisors regarding the potential application of withholding under FATCA to their investment in our Class A common stock, including, without limitation, the interaction of FATCA withholding with the other withholding rules discussed above.
EACH PROSPECTIVE INVESTOR SHOULD CONSULT ITS OWN TAX ADVISOR REGARDING THE PARTICULAR U.S. FEDERAL, STATE, LOCAL AND FOREIGN TAX CONSEQUENCES OF PURCHASING, HOLDING AND DISPOSING OF OUR CLASS A COMMON STOCK, INCLUDING THE CONSEQUENCES OF ANY PROPOSED CHANGE IN APPLICABLE LAWS.
160
The company and the underwriters named below have entered into an underwriting agreement with respect to the shares of Class A common stock being offered. Subject to certain conditions, each underwriter has severally agreed to purchase the number of shares of Class A common stock indicated in the following table. Goldman, Sachs & Co., Morgan Stanley & Co. LLC and Citigroup Global Markets Inc. are the representatives of the underwriters.
Underwriters
|
Number of Shares of Class A Common Stock |
|||
|---|---|---|---|---|
Goldman, Sachs & Co. |
||||
Morgan Stanley & Co. LLC. |
||||
Citigroup Global Markets Inc. |
||||
Merrill Lynch, Pierce, Fenner & Smith |
||||
UBS Securities LLC |
||||
Piper Jaffray & Co. |
||||
Robert W. Baird & Co. Incorporated |
||||
Wells Fargo Securities, LLC |
||||
William Blair & Company, L.L.C. |
||||
| | | | | |
Total |
22,222,222 | |||
| | | | | |
| | | | | |
The underwriters are committed to take and pay for all of the shares of Class A common stock being offered, if any are taken, other than the shares of Class A common stock covered by the option described below unless and until this option is exercised.
The underwriters have an option to buy up to an additional 3,333,333 shares of Class A common stock from the company to cover sales by the underwriters of a greater number of shares of Class A common stock than the total number set forth in the table above. They may exercise that option for 30 days. If any shares of Class A common stock are purchased pursuant to this option, the underwriters will severally purchase shares of Class A common stock in approximately the same proportion as set forth in the table above.
The following table shows the per share and total underwriting discounts and commissions to be paid to the underwriters by the company. Such amounts are shown assuming both no exercise and full exercise of the underwriters' option to purchase additional shares of Class A common stock.
Paid by the Company
|
No Exercise
|
Full Exercise
|
|||||
|---|---|---|---|---|---|---|---|
Per Share |
$ | $ | |||||
Total |
$ | $ | |||||
Shares of Class A common stock sold by the underwriters to the public will initially be offered at the initial public offering price set forth on the cover of this prospectus. Any shares of Class A common stock sold by the underwriters to securities dealers may be sold at a discount of up to $ per share from the initial public offering price. After the initial offering of the shares of Class A common stock, the representatives may change the offering price and the other selling terms. The offering of the shares of Class A common stock by the underwriters is subject to receipt and acceptance and subject to the underwriters' right to reject any order in whole or in part.
Pursuant to lock-up agreements with the underwriters or market stand-off agreements in favor of the underwriters, we, our executive officers and directors, and holders of all of our common
161
stock and securities convertible into or exchangeable for our common stock have agreed, subject to certain exceptions, not to sell, dispose of, or transfer their shares of our common stock for a period of 180 days following the date of this prospectus.
The contractual lock-up agreements with the underwriters, subject to certain customary exceptions, prohibit the offering for sale, selling, contracting to sell, granting any option for the sale of, pledging, transferring, or otherwise disposing of any shares of our common stock, options to acquire shares of our common stock or any security or instrument related to our common stock, option or warrant, or entering into any swap, hedge, or other arrangement that transfers to another any of the economic consequences of ownership of the common stock, for a period of 180 days following the date of this prospectus without the prior written consent of Goldman, Sachs & Co. This agreement does not apply to any existing employee benefit plans. See "Shares Eligible for Future Sale" for a discussion of certain transfer restrictions.
In addition, all of our stockholders are subject to our Stockholders' Agreement, which contains a market stand-off agreement imposing restrictions on the ability of our stockholders to lend, offer, pledge, sell, contract to sell, sell any option or contact to purchase, purchase any option or contact to sell, grant any option, right or warrant to purchase, or otherwise transfer or dispose of, directly or indirectly, any shares of our common stock or any securities convertible into or exercisable or exchangeable for shares of our common stock for a period of 180 days following the date of this prospectus. Pursuant to the Stockholders' Agreement, the underwriters are express, third-party beneficiaries of the market stand-off agreement and can enforce the restrictions on sales of our securities. In addition, we have agreed with the underwriters that we will not take any action to modify the market stand-off agreement or waive the restrictions on sales of our securities during the 180 days after the date of this prospectus, without the prior written consent of Goldman, Sachs & Co.
Prior to the offering, there has been no public market for the shares of Class A common stock. The initial public offering price has been negotiated among the company and the representatives. Among the factors to be considered in determining the initial public offering price of the shares of Class A common stock, in addition to prevailing market conditions, will be the company's historical performance, estimates of the business potential and earnings prospects of the company, an assessment of the company's management and the consideration of the above factors in relation to market valuation of companies in related businesses.
We have been approved to list the common stock on the NASDAQ Global Select Market under the symbol "INOV".
In connection with the offering, the underwriters may purchase and sell shares of Class A common stock in the open market. These transactions may include short sales, stabilizing transactions, and purchases to cover positions created by short sales. Short sales involve the sale by the underwriters of a greater number of shares of Class A common stock than they are required to purchase in the offering, and a short position represents the amount of such sales that have not been covered by subsequent purchases. A "covered short position" is a short position that is not greater than the amount of additional shares of Class A common stock for which the underwriters' option described above may be exercised. The underwriters may cover any covered short position by either exercising their option to purchase additional shares of Class A common stock or purchasing shares of Class A common stock in the open market. In determining the source of shares of Class A common stock to cover the covered short position, the underwriters will consider, among other things, the price of shares of Class A common stock available for purchase in the open market as compared to the price at which they may purchase additional shares of Class A common stock pursuant to the option described above. "Naked" short sales are any short sales that create a short position greater than the amount of additional shares of Class A common stock
162
for which the option described above may be exercised. The underwriters must cover any such naked short position by purchasing shares in the open market. A naked short position is more likely to be created if the underwriters are concerned that there may be downward pressure on the price of the Class A common stock in the open market after pricing that could adversely affect investors who purchase in the offering. Stabilizing transactions consist of various bids for or purchases of Class A common stock made by the underwriters in the open market prior to the completion of the offering.
The underwriters may also impose a penalty bid. This occurs when a particular underwriter repays to the underwriters a portion of the underwriting discount received by it because the representatives have repurchased shares of Class A common stock sold by or for the account of such underwriter in stabilizing or short covering transactions.
Purchases to cover a short position and stabilizing transactions, as well as other purchases by the underwriters for their own accounts, may have the effect of preventing or retarding a decline in the market price of the company's stock, and together with the imposition of the penalty bid, may stabilize, maintain or otherwise affect the market price of the common stock. As a result, the price of the Class A common stock may be higher than the price that otherwise might exist in the open market. The underwriters are not required to engage in these activities and may end any of these activities at any time. These transactions may be effected on the exchange on which our shares are listed or quoted, in the over-the-counter market or otherwise.
In relation to each Member State of the European Economic Area which has implemented the Prospectus Directive, each a Relevant Member State, each underwriter has represented and agreed that with effect from and including the date on which the Prospectus Directive is implemented in that Relevant Member State, the Relevant Implementation Date, it has not made and will not make an offer of shares of Class A common stock to the public in that Relevant Member State prior to the publication of a prospectus in relation to the shares of Class A common stock which has been approved by the competent authority in that Relevant Member State or, where appropriate, approved in another Relevant Member State and notified to the competent authority in that Relevant Member State, all in accordance with the Prospectus Directive, except that it may, with effect from and including the Relevant Implementation Date, make an offer of shares of Class A common stock to the public in that Relevant Member State at any time:
- (a)
- to
legal entities which are authorised or regulated to operate in the financial markets or, if not so authorised or regulated, whose corporate purpose is
solely to invest in securities;
- (b)
- to
any legal entity which has two or more of (1) an average of at least 250 employees during the last financial year; (2) a total balance
sheet of more than €43,000,000 and (3) an annual net turnover of more than €50,000,000, as shown in its last annual or consolidated accounts;
- (c)
- to
fewer than 100 natural or legal persons (other than qualified investors as defined in the Prospectus Directive) subject to obtaining the prior consent of
Goldman, Sachs & Co. for any such offer; or
- (d)
- in any other circumstances which do not require the publication by the Issuer of a prospectus pursuant to Article 3 of the Prospectus Directive.
For the purposes of this provision, the expression an "offer of shares to the public" in relation to any shares of Class A common stock in any Relevant Member State means the communication in any form and by any means of sufficient information on the terms of the offer and the shares of Class A common stock to be offered so as to enable an investor to decide to purchase or subscribe the shares of Class A common stock, as the same may be varied in that Relevant Member State by any measure implementing the Prospectus Directive in that Relevant Member
163
State and the expression Prospectus Directive means Directive 2003/71/EC and includes any relevant implementing measure in each Relevant Member State.
Each underwriter has represented and agreed that:
- (a)
- it
has only communicated or caused to be communicated and will only communicate or cause to be communicated an invitation or inducement to engage in
investment activity (within the meaning of Section 21 of the FSMA) received by it in connection with the issue or sale of the shares of Class A common stock in circumstances in which
Section 21(1) of the FSMA does not apply to the company; and
- (b)
- it has complied and will comply with all applicable provisions of the FSMA with respect to anything done by it in relation to the shares of Class A common stock in, from or otherwise involving the United Kingdom.
The shares of Class A common stock may not be offered or sold by means of any document other than (i) in circumstances which do not constitute an offer to the public within the meaning of the Companies Ordinance (Cap.32, Laws of Hong Kong), or (ii) to "professional investors" within the meaning of the Securities and Futures Ordinance (Cap.571, Laws of Hong Kong) and any rules made thereunder, or (iii) in other circumstances which do not result in the document being a "prospectus" within the meaning of the Companies Ordinance (Cap.32, Laws of Hong Kong), and no advertisement, invitation or document relating to the shares of Class A common stock may be issued or may be in the possession of any person for the purpose of issue (in each case whether in Hong Kong or elsewhere), which is directed at, or the contents of which are likely to be accessed or read by, the public in Hong Kong (except if permitted to do so under the laws of Hong Kong) other than with respect to shares of Class A common stock which are or are intended to be disposed of only to persons outside Hong Kong or only to "professional investors" within the meaning of the Securities and Futures Ordinance (Cap. 571, Laws of Hong Kong) and any rules made thereunder.
This prospectus has not been registered as a prospectus with the Monetary Authority of Singapore. Accordingly, this prospectus and any other document or material in connection with the offer or sale, or invitation for subscription or purchase, of the shares of Class A common stock may not be circulated or distributed, nor may the shares of Class A common stock be offered or sold, or be made the subject of an invitation for subscription or purchase, whether directly or indirectly, to persons in Singapore other than (i) to an institutional investor under Section 274 of the Securities and Futures Act, Chapter 289 of Singapore, or SFA, (ii) to a relevant person, or any person pursuant to Section 275(1A), and in accordance with the conditions, specified in Section 275 of the SFA, or (iii) otherwise pursuant to, and in accordance with the conditions of, any other applicable provision of the SFA.
Where the shares of Class A common stock are subscribed or purchased under Section 275 by a relevant person which is: (a) a corporation (which is not an accredited investor) the sole business of which is to hold investments and the entire share capital of which is owned by one or more individuals, each of whom is an accredited investor; or (b) a trust (where the trustee is not an accredited investor) whose sole purpose is to hold investments and each beneficiary is an accredited investor, shares, debentures and units of shares and debentures of that corporation or the beneficiaries' rights and interest in that trust shall not be transferable for 6 months after that corporation or that trust has acquired the shares of Class A common stock under Section 275 except: (1) to an institutional investor under Section 274 of the SFA or to a relevant person, or any person pursuant to Section 275(1A), and in accordance with the conditions, specified in Section 275 of the SFA; (2) where no consideration is given for the transfer; or (3) by operation of law.
164
The securities have not been and will not be registered under the Financial Instruments and Exchange Law of Japan, or Financial Instruments and Exchange Law, and each underwriter has agreed that it will not offer or sell any securities, directly or indirectly, in Japan or to, or for the benefit of, any resident of Japan (which term as used herein means any person resident in Japan, including any corporation or other entity organized under the laws of Japan), or to others for re-offering or resale, directly or indirectly, in Japan or to a resident of Japan, except pursuant to an exemption from the registration requirements of, and otherwise in compliance with, the Financial Instruments and Exchange Law and any other applicable laws, regulations and ministerial guidelines of Japan.
The shares may not be publicly offered in Switzerland and will not be listed on the SIX Swiss Exchange, or SIX, or on any other stock exchange or regulated trading facility in Switzerland. This document has been prepared without regard to the disclosure standards for issuance prospectuses under art. 652a or art. 1156 of the Swiss Code of Obligations or the disclosure standards for listing prospectuses under art. 27 ff. of the SIX Listing Rules or the listing rules of any other stock exchange or regulated trading facility in Switzerland. Neither this document nor any other offering or marketing material relating to the shares or the offering may be publicly distributed or otherwise made publicly available in Switzerland.
Neither this document nor any other offering or marketing material relating to the offering, the company, the shares have been or will be filed with or approved by any Swiss regulatory authority. In particular, this document will not be filed with, and the offer of shares will not be supervised by, the Swiss Financial Market Supervisory Authority, and the offer of shares has not been and will not be authorized under the Swiss Federal Act on Collective Investment Schemes, or the CISA. The investor protection afforded to acquirers of interests in collective investment schemes under the CISA does not extend to acquirers of shares.
This prospectus relates to an Exempt Offer in accordance with the Offered Securities Rules of the Dubai Financial Services Authority, or DFSA. This prospectus is intended for distribution only to persons of a type specified in the Offered Securities Rules of the DFSA. It must not be delivered to, or relied on by, any other person. The DFSA has no responsibility for reviewing or verifying any documents in connection with Exempt Offers. The DFSA has not approved this prospectus nor taken steps to verify the information set forth herein and has no responsibility for the prospectus. The shares to which this prospectus relates may be illiquid and/or subject to restrictions on their resale. Prospective purchasers of the shares offered should conduct their own due diligence on the shares. If you do not understand the contents of this prospectus you should consult an authorized financial advisor.
No placement document, prospectus, product disclosure statement or other disclosure document has been lodged with the Australian Securities and Investments Commission, or ASIC, in relation to the offering. This prospectus does not constitute a prospectus, product disclosure statement, or other disclosure document under the Corporations Act 2001, or the Corporations Act), and does not purport to include the information required for a prospectus, product disclosure statement or other disclosure document under the Corporations Act.
Any offer in Australia of the shares may only be made to persons (the Exempt Investors) who are "sophisticated investors" (within the meaning of section 708(8) of the Corporations Act), "professional investors" (within the meaning of section 708(11) of the Corporations Act) or otherwise pursuant to one or more exemptions contained in section 708 of the Corporations Act so that it is lawful to offer the shares without disclosure to investors under Chapter 6D of the Corporations Act.
The shares applied for by Exempt Investors in Australia must not be offered for sale in Australia in the period of 12 months after the date of allotment under the offering, except in
165
circumstances where disclosure to investors under Chapter 6D of the Corporations Act would not be required pursuant to an exemption under section 708 of the Corporations Act or otherwise or where the offer is pursuant to a disclosure document which complies with Chapter 6D of the Corporations Act. Any person acquiring shares must observe such Australian on-sale restrictions.
This prospectus contains general information only and does not take account of the investment objectives, financial situation or particular needs of any particular person. It does not contain any securities recommendations or financial product advice. Before making an investment decision, investors need to consider whether the information in this prospectus is appropriate to their needs, objectives and circumstances, and, if necessary, seek expert advice on those matters.
The underwriters do not expect sales to discretionary accounts to exceed 5% of the total number of shares of Class A common stock offered.
The company estimates that its share of the total expenses of the offering, excluding underwriting discounts and commissions, will be approximately $5.0 million. In addition, the company has agreed to reimburse the underwriters for certain of their expenses incurred in connection with any required review by FINRA of the terms of the offering in an amount up to $25,000.
The company has agreed to indemnify the several underwriters against certain liabilities, including liabilities under the Securities Act.
The underwriters and their respective affiliates are full service financial institutions engaged in various activities, which may include sales and trading, commercial and investment banking, advisory, investment management, investment research, principal investment, hedging, market making, brokerage, and other financial and non-financial activities and services. Certain of the underwriters and their respective affiliates have provided, and may in the future provide, a variety of these services to the issuer and to persons and entities with relationships with the issuer, for which they received or will receive customary fees and expenses. In particular, affiliates of each of Goldman, Sachs & Co., Morgan Stanley & Co. LLC, Citigroup Global Markets Inc., Merrill Lynch, Pierce, Fenner & Smith Incorporated, and UBS Securities LLC are agents and lenders under our Term Loan Facility and our Revolving Credit Facility, for which they have received, and will receive, customary fees from us.
In the ordinary course of their various business activities, the underwriters and their respective affiliates, officers, directors, and employees may purchase, sell, or hold a broad array of investments and actively trade securities, derivatives, loans, commodities, currencies, credit default swaps, and other financial instruments for their own account and for the accounts of their customers, and such investment and trading activities may involve or relate to assets, securities or instruments of the issuer (directly, as collateral securing other obligations or otherwise) or persons and entities with relationships with the issuer. The underwriters and their respective affiliates may also communicate independent investment recommendations, market color or trading ideas or publish or express independent research views in respect of such assets, securities or instruments and may at any time hold, or recommend to clients that they should acquire, long, or short positions in such assets, securities, and instruments.
166
The validity of the shares of Class A common stock offered by this prospectus will be passed upon for us by Morrison & Foerster LLP. Certain legal matters relating to the offering will be passed upon for the underwriters by Latham & Watkins LLP.
The consolidated financial statements as of December 31, 2012 and 2013, and for each of the three years in the period ended December 31, 2013, and the related consolidated financial statement schedule included in this prospectus, have been audited by Deloitte & Touche LLP, an independent registered public accounting firm, as stated in their report appearing herein. Such consolidated financial statements and the consolidated financial statement schedule have been so included in reliance upon the report of such firm given upon their authority as experts in accounting and auditing.
WHERE YOU CAN FIND ADDITIONAL INFORMATION
We have filed with the SEC a registration statement on Form S-1 under the Securities Act with respect to the shares of Class A common stock offered hereby. This prospectus, which constitutes a part of the registration statement, does not contain all of the information set forth in the registration statement or the exhibits filed therewith. For further information about us and our Class A common stock offered hereby, reference is made to the registration statement and the exhibits filed therewith. Statements contained in this prospectus regarding the contents of any contract or any other document that is filed as an exhibit to the registration statement are not necessarily complete, and in each instance we refer you to the copy of such contract or other document filed as an exhibit to the registration statement. A copy of the registration statement and the exhibits filed therewith may be inspected without charge at the public reference room maintained by the SEC, located at 100 F Street, NE, Washington, DC 20549, and copies of all or any part of the registration statement may be obtained from that office. Please call the SEC at 1-800-SEC-0330 for further information about the public reference room. The SEC also maintains a website that contains reports, proxy and information statements and other information regarding registrants that file electronically with the SEC. The address of that website is www.sec.gov.
We currently do not file periodic reports with the SEC. Upon the closing of this offering, we will be required to file periodic reports, proxy statements and other information with the SEC pursuant to the Exchange Act. These periodic reports, proxy statements and other information will be available for inspection and copying at the SEC's public reference facilities and the website of the SEC referred to above.
We also maintain a website at www.inovalon.com. Upon completion of this offering, you may access these materials at our website free of charge as soon as reasonably practicable after they are electronically filed with, or furnished to, the SEC. Information contained on our website is not a part of this prospectus and the inclusion of our website address in this prospectus is an inactive textual reference only.
167
INOVALON HOLDINGS, INC.
INDEX TO CONSOLIDATED FINANCIAL STATEMENTS
F-1
Report of Independent Registered Public Accounting Firm
To
the Board of Directors and Stockholders of
Inovalon Holdings, Inc.
Bowie, Maryland
We have audited the accompanying consolidated balance sheets of Inovalon Holdings, Inc. and subsidiaries (the "Company") as of December 31, 2012 and 2013, and the related consolidated statements of operations, stockholders' equity (deficit), and cash flows for each of the three years in the period ended December 31, 2013. Our audits also included the consolidated financial statement schedule listed in the Index at Page F-1. These consolidated financial statements and consolidated financial statement schedule are the responsibility of the Company's management. Our responsibility is to express an opinion on these consolidated financial statements and consolidated financial statement schedule based on our audits.
We conducted our audits in accordance with the standards of the Public Company Accounting Oversight Board (United States). Those standards require that we plan and perform the audit to obtain reasonable assurance about whether the consolidated financial statements are free of material misstatement. The Company is not required to have, nor were we engaged to perform, an audit of its internal control over financial reporting. Our audits included consideration of internal control over financial reporting as a basis for designing audit procedures that are appropriate in the circumstances, but not for the purpose of expressing an opinion on the effectiveness of the Company's internal control over financial reporting. Accordingly, we express no such opinion. An audit also includes examining, on a test basis, evidence supporting the amounts and disclosures in the consolidated financial statements, assessing the accounting principles used and significant estimates made by management, as well as evaluating the overall financial statement presentation. We believe that our audits provide a reasonable basis for our opinion.
In our opinion, such consolidated financial statements present fairly, in all material respects, the financial position of Inovalon Holdings, Inc. and subsidiaries as of December 31, 2012 and 2013, and the results of their operations and their cash flows for each of the three years in the period ended December 31, 2013, in conformity with accounting principles generally accepted in the United States of America. Also, in our opinion, such consolidated financial statement schedule, when considered in relation to the basic consolidated financial statements taken as a whole, presents fairly in all material respects the information set forth therein.
/s/ DELOITTE & TOUCHE LLP
McLean, VA
October 10, 2014 (January 25, 2015 as to the effects
of the stock split described in Note 1 and in Note 12)
F-2
Inovalon Holdings, Inc.
Consolidated Balance Sheets
(in thousands, except share amounts)
| |
December 31, | |
||||||||
|---|---|---|---|---|---|---|---|---|---|---|
| |
September 30, 2014 |
|||||||||
| |
2012
|
2013
|
||||||||
| |
|
|
(unaudited) |
|||||||
ASSETS |
||||||||||
Current assets: |
||||||||||
Cash and cash equivalents |
$ | 106,361 | $ | 110,594 | $ | 131,947 | ||||
Accounts receivable (net of allowances of $451, $1,484, and $1,289 at December 31, 2012, 2013 and September 30, 2014 (unaudited), respectively) |
62,899 | 33,398 | 52,037 | |||||||
Prepaid expenses and other current assets |
2,350 | 2,531 | 5,151 | |||||||
Income tax receivable |
1,651 | 4,772 | 6,319 | |||||||
Deferred income taxes |
— | 580 | 580 | |||||||
| | | | | | | | | | | |
Total current assets |
173,261 | 151,875 | 196,034 | |||||||
Non-current assets: |
||||||||||
Property, equipment and capitalized software, net |
34,170 | 43,050 | 49,126 | |||||||
Goodwill |
62,269 | 62,269 | 62,269 | |||||||
Intangible assets, net |
15,414 | 11,815 | 7,988 | |||||||
Other assets |
541 | 737 | 1,928 | |||||||
| | | | | | | | | | | |
Total assets |
$ | 285,655 | $ | 269,746 | $ | 317,345 | ||||
| | | | | | | | | | | |
| | | | | | | | | | | |
LIABILITIES AND STOCKHOLDERS' EQUITY (DEFICIT) |
||||||||||
Current liabilities: |
||||||||||
Accounts payable |
$ | 9,010 | $ | 7,973 | $ | 9,826 | ||||
Accrued compensation |
13,616 | 6,917 | 10,343 | |||||||
Other current liabilities |
911 | 678 | 1,754 | |||||||
Deferred rent |
1,777 | 445 | 709 | |||||||
Deferred revenue |
4,350 | 2,316 | 1,851 | |||||||
Dividend payable |
6,363 | 2,852 | — | |||||||
Income tax payable |
— | — | — | |||||||
Deferred income taxes |
183 | — | — | |||||||
Credit facilities |
— | — | 15,000 | |||||||
Capital lease obligation |
118 | 132 | 105 | |||||||
| | | | | | | | | | | |
Total current liabilities |
36,328 | 21,313 | 39,588 | |||||||
Non-current liabilities: |
||||||||||
Credit facilities, less current portion |
— | — | 285,000 | |||||||
Capital lease obligation |
168 | 279 | 191 | |||||||
Deferred revenue |
— | 200 | — | |||||||
Deferred rent |
— | 3,098 | 2,681 | |||||||
Deferred income taxes |
12,330 | 13,122 | 13,246 | |||||||
| | | | | | | | | | | |
Total liabilities |
48,826 | 38,012 | 340,706 | |||||||
| | | | | | | | | | | |
Commitments and contingencies (Note 6) |
||||||||||
Stockholders' equity (deficit): |
||||||||||
Common stock, $0.000005 par value, 900,000,000 shares authorized, zero shares issued and outstanding at each of December 31, 2012 and 2013 and September 30, 2014 (unaudited) |
— | — | — | |||||||
Class A common stock, $0.000005 par value, 750,000,000 shares authorized, zero shares issued and outstanding at December 31, 2012 and 2013, and 11,109,285 and zero shares issued and outstanding at September 30, 2014 (unaudited), respectively |
— | — | — | |||||||
Class B common stock, $0.000005 par value, 150,000,000 shares authorized, 137,869,575, 134,641,780, and 122,257,145 shares issued and outstanding at December 31, 2012 and 2013 and September 30, 2014 (unaudited), respectively |
1 | 1 | 1 | |||||||
Preferred stock, $0.0001 par value, 100,000,000 shares authorized, zero shares issued and outstanding at each of December 31, 2012 and 2013 and September 30, 2014 (unaudited) |
— | — | — | |||||||
Additional paid-in-capital |
107,769 | 107,553 | 108,677 | |||||||
Retained earnings |
129,059 | 124,180 | 167,978 | |||||||
Treasury stock, at cost, zero shares at December 31, 2012 and 2013 and 11,109,285 at September 30, 2014 (unaudited), respectively |
— | — | (300,017 | ) | ||||||
| | | | | | | | | | | |
Total stockholders' equity (deficit) |
236,829 | 231,734 | (23,361 | ) | ||||||
| | | | | | | | | | | |
Total liabilities and stockholders' equity (deficit) |
$ | 285,655 | $ | 269,746 | $ | 317,345 | ||||
| | | | | | | | | | | |
| | | | | | | | | | | |
F-3
Inovalon Holdings, Inc.
Consolidated Statements of Operations
(In thousands, except per share amounts)
| |
Year Ended December 31, | Nine Months Ended September 30, |
||||||||||||||
|---|---|---|---|---|---|---|---|---|---|---|---|---|---|---|---|---|
| |
2011
|
2012
|
2013
|
2013
|
2014
|
|||||||||||
| |
|
|
|
(unaudited) |
||||||||||||
Revenue |
$ | 239,685 | $ | 300,275 | $ | 295,798 | $ | 231,264 | $ | 271,622 | ||||||
Expenses: |
||||||||||||||||
Cost of revenue |
102,695 | 101,188 | 120,054 | 94,869 | 85,065 | |||||||||||
Sales and marketing |
6,752 | 6,793 | 5,952 | 4,597 | 5,355 | |||||||||||
Research and development |
14,855 | 15,499 | 21,192 | 16,171 | 17,376 | |||||||||||
General and administrative |
63,184 | 72,661 | 80,638 | 60,266 | 62,920 | |||||||||||
Depreciation and amortization |
11,229 | 12,899 | 15,517 | 11,105 | 15,012 | |||||||||||
| | | | | | | | | | | | | | | | | |
Total operating expenses |
198,715 | 209,040 | 243,353 | 187,008 | 185,728 | |||||||||||
| | | | | | | | | | | | | | | | | |
Income from operations |
40,970 | 91,235 | 52,445 | 44,256 | 85,894 | |||||||||||
| | | | | | | | | | | | | | | | | |
Other income and (expenses): |
||||||||||||||||
Interest income |
10 | 11 | 9 | 6 | 4 | |||||||||||
Interest expense |
(62 | ) | (129 | ) | (79 | ) | (61 | ) | (209 | ) | ||||||
| | | | | | | | | | | | | | | | | |
Income before taxes |
40,918 | 91,117 | 52,375 | 44,201 | 85,689 | |||||||||||
Provision for income taxes |
15,991 | 35,962 | 19,657 | 17,218 | 33,836 | |||||||||||
| | | | | | | | | | | | | | | | | |
Net income |
$ | 24,927 | $ | 55,155 | $ | 32,718 | $ | 26,983 | $ | 51,853 | ||||||
| | | | | | | | | | | | | | | | | |
| | | | | | | | | | | | | | | | | |
Basic net income per share |
$ | 0.18 | $ | 0.40 | $ | 0.24 | $ | 0.20 | $ | 0.39 | ||||||
| | | | | | | | | | | | | | | | | |
| | | | | | | | | | | | | | | | | |
Diluted net income per share |
$ | 0.18 | $ | 0.40 | $ | 0.24 | $ | 0.20 | $ | 0.38 | ||||||
| | | | | | | | | | | | | | | | | |
| | | | | | | | | | | | | | | | | |
Weighted average shares of common stock outstanding: |
||||||||||||||||
Basic |
137,865 | 137,865 | 135,305 | 135,555 | 133,640 | |||||||||||
| | | | | | | | | | | | | | | | | |
| | | | | | | | | | | | | | | | | |
Diluted |
138,855 | 139,040 | 136,375 | 136,730 | 135,835 | |||||||||||
| | | | | | | | | | | | | | | | | |
| | | | | | | | | | | | | | | | | |
Cash dividend declared per share |
$ | 0.15 | $ | 0.36 | $ | 0.15 | $ | — | $ | — | ||||||
| | | | | | | | | | | | | | | | | |
| | | | | | | | | | | | | | | | | |
See notes to consolidated financial statements.
F-4
Inovalon Holdings, Inc.
Consolidated Statements of Stockholders' Equity (Deficit)
(in thousands, except share amounts)
| |
|
|
|
Issued Common Stock |
Issued Class A Common Stock |
Issued Class B Common Stock |
|
|
|
|
|
|||||||||||||||||||||||||||||||
|---|---|---|---|---|---|---|---|---|---|---|---|---|---|---|---|---|---|---|---|---|---|---|---|---|---|---|---|---|---|---|---|---|---|---|---|---|---|---|---|---|---|---|
| |
Preferred Stock |
|
Treasury Stock | Additional Paid-in Capital |
|
Total Stockholders' Equity (Deficit) |
||||||||||||||||||||||||||||||||||||
| |
Retained Earnings |
|||||||||||||||||||||||||||||||||||||||||
| |
Shares
|
Amount
|
|
Shares
|
Amount
|
Shares
|
Amount
|
Shares
|
Amount
|
Shares
|
Amount
|
|||||||||||||||||||||||||||||||
Balance — January 1, 2011 |
— | $ | — | — | $ | — | — | $ | — | 137,704,625 | $ | 1 | — | $ | — | $ | 101,313 | $ | 118,977 | $ | 220,291 | |||||||||||||||||||||
Exercise of stock options |
— | — | — | — | — | — | 159,450 | 120 | — | 120 | ||||||||||||||||||||||||||||||||
Compensation expense — vested restricted stock |
— | — | — | — | — | — | — | — | — | — | 80 | — | 80 | |||||||||||||||||||||||||||||
Stock compensation expense — options |
— | — | — | — | — | — | — | — | — | — | 3,687 | — | 3,687 | |||||||||||||||||||||||||||||
Dividends declared |
— | — | — | — | — | — | — | — | — | — | — | (20,000 | ) | (20,000 | ) | |||||||||||||||||||||||||||
Net income |
— | — | — | — | — | — | — | — | — | — | — | 24,927 | 24,927 | |||||||||||||||||||||||||||||
| | | | | | | | | | | | | | | | | | | | | | | | | | | | | | | | | | | | | | | | | | | |
Balance — December 31, 2011 |
— | $ | — | — | $ | — | — | $ | — | 137,864,075 | $ | 1 | — | $ | — | $ | 105,200 | $ | 123,904 | $ | 229,105 | |||||||||||||||||||||
Exercise of stock options |
— | — | — | — | — | — | 5,500 | — | — | — | 9 | — | 9 | |||||||||||||||||||||||||||||
Stock compensation expense — options |
— | — | — | — | — | — | — | — | — | — | 2,560 | — | 2,560 | |||||||||||||||||||||||||||||
Dividends declared |
— | — | — | — | — | — | — | — | — | — | — | (50,000 | ) | (50,000 | ) | |||||||||||||||||||||||||||
Net income |
— | — | — | — | — | — | — | — | — | — | — | 55,155 | 55,155 | |||||||||||||||||||||||||||||
| | | | | | | | | | | | | | | | | | | | | | | | | | | | | | | | | | | | | | | | | | | |
Balance — December 31, 2012 |
— | $ | — | — | $ | — | — | $ | — | 137,869,575 | $ | 1 | — | $ | — | $ | 107,769 | $ | 129,059 | $ | 236,829 | |||||||||||||||||||||
Repurchase of common stock for treasury |
— | — | — | — | — | — | — | — | (10,703,360 | ) | (72,114 | ) | — | — | (72,114 | ) | ||||||||||||||||||||||||||
Sale of common stock from treasury |
— | — | — | — | — | — | — | — | 7,216,610 | 52,114 | — | — | 52,114 | |||||||||||||||||||||||||||||
Retirement of common stock |
— | — | — | — | — | — | (3,486,750 | ) | — | 3,486,750 | 20,000 | (2,403 | ) | (17,597 | ) | — | ||||||||||||||||||||||||||
Exercise of stock options |
— | — | — | — | — | — | 285,955 | — | — | 270 | — | 270 | ||||||||||||||||||||||||||||||
Tax benefit from exercise of non-qualified stock options |
— | — | — | — | — | — | — | — | — | — | 437 | — | 437 | |||||||||||||||||||||||||||||
Forfeiture of fully vested non-qualified stock options |
— | — | — | — | — | — | — | — | — | — | (362 | ) | — | (362 | ) | |||||||||||||||||||||||||||
Stock compensation expense — options |
— | — | — | — | — | — | — | — | — | — | 1,842 | — | 1,842 | |||||||||||||||||||||||||||||
Dividends declared |
— | — | — | — | — | — | — | — | — | — | — | (20,000 | ) | (20,000 | ) | |||||||||||||||||||||||||||
Net income |
— | — | — | — | — | — | — | — | — | — | — | 32,718 | 32,718 | |||||||||||||||||||||||||||||
| | | | | | | | | | | | | | | | | | | | | | | | | | | | | | | | | | | | | | | | | | | |
Balance — December 31, 2013 |
— | $ | — | — | $ | — | — | $ | — | 134,641,780 | $ | 1 | — | $ | — | $ | 107,553 | $ | 124,180 | $ | 231,734 | |||||||||||||||||||||
Repurchase of Class B common stock for treasury (unaudited) |
— | — | — | — | — | — | — | — | (12,571,605 | ) | (309,083 | ) | — | — | (309,083 | ) | ||||||||||||||||||||||||||
Conversion Class B to Class A common stock (unaudited) |
11,109,285 | (11,109,285 | ) | |||||||||||||||||||||||||||||||||||||||
Retirement of treasury stock (unaudited) |
— | — | — | — | — | — | (1,462,320 | ) | — | 1,462,320 | 9,066 | (1,011 | ) | (8,055 | ) | — | ||||||||||||||||||||||||||
Exercise of stock options (unaudited) |
— | — | 186,970 | — | — | 720 | — | 720 | ||||||||||||||||||||||||||||||||||
Stock compensation expense — options (unaudited) |
— | — | — | — | — | — | — | — | — | — | 1,340 | — | 1,340 | |||||||||||||||||||||||||||||
Tax benefit from exercise of non-qualified stock options (unaudited) |
— | — | — | — | — | — | — | — | — | — | 429 | — | 429 | |||||||||||||||||||||||||||||
Forfeiture of vested non-qualified stock options (unaudited) |
— | — | — | — | — | — | — | — | — | — | (354 | ) | — | (354 | ) | |||||||||||||||||||||||||||
Net income (unaudited) |
— | — | — | — | — | — | — | — | — | — | — | 51,853 | 51,853 | |||||||||||||||||||||||||||||
| | | | | | | | | | | | | | | | | | | | | | | | | | | | | | | | | | | | | | | | | | | |
Balance — September 30, 2014 (unaudited) |
— | $ | — | 0 | $ | 0 | 11,109,285 | $ | 0 | 122,257,145 | $ | 1 | (11,109,285 | ) | $ | (300,017 | ) | $ | 108,677 | $ | 167,978 | $ | (23,361 | ) | ||||||||||||||||||
| | | | | | | | | | | | | | | | | | | | | | | | | | | | | | | | | | | | | | | | | | | |
| | | | | | | | | | | | | | | | | | | | | | | | | | | | | | | | | | | | | | | | | | | |
See notes to consolidated financial statements.
F-5
Inovalon Holdings, Inc.
Consolidated Statements of Cash Flows
(in thousands)
| |
Year Ended December 31, |
Nine Months Ended September 30, |
||||||||||||||
|---|---|---|---|---|---|---|---|---|---|---|---|---|---|---|---|---|
| |
2011
|
2012
|
2013
|
2013
|
2014
|
|||||||||||
| |
|
|
|
(unaudited) |
||||||||||||
Cash flows from operating activities: |
||||||||||||||||
Net income |
$ | 24,927 | $ | 55,155 | $ | 32,718 | $ | 26,983 | $ | 51,853 | ||||||
Adjustments to reconcile net income to net cash provided by operating activities: |
||||||||||||||||
Stock-based compensation expense |
3,767 | 2,560 | 1,842 | 1,408 | 1,340 | |||||||||||
Bad debt expense |
(240 | ) | 45 | — | — | — | ||||||||||
Depreciation |
7,979 | 9,777 | 11,918 | 8,801 | 11,185 | |||||||||||
Amortization of intangibles |
3,250 | 3,122 | 3,599 | 2,304 | 3,827 | |||||||||||
Deferred income taxes |
842 | 1,395 | (333 | ) | 1,064 | (230 | ) | |||||||||
Loss on impairment of intangible asset |
1,212 | — | — | — | — | |||||||||||
Loss on disposal of long-lived assets |
128 | 160 | 250 | 23 | 165 | |||||||||||
Loss on impairment of long-lived assets |
— | — | — | — | 109 | |||||||||||
Changes in assets and liabilities: |
||||||||||||||||
Accounts receivable |
(5,813 | ) | (26,179 | ) | 29,502 | 19,667 | (18,638 | ) | ||||||||
Prepaid expenses and other current assets |
92 | (549 | ) | (181 | ) | (723 | ) | (2,620 | ) | |||||||
Income taxes receivable |
7,211 | (1,651 | ) | (3,121 | ) | (2,349 | ) | (1,547 | ) | |||||||
Other assets |
26 | (261 | ) | (197 | ) | (22 | ) | (822 | ) | |||||||
Accounts payable |
(2,637 | ) | 5,758 | (1,468 | ) | (2,272 | ) | 1,455 | ||||||||
Accrued compensation |
3,702 | 4,092 | (6,677 | ) | (7,358 | ) | 3,513 | |||||||||
Other liabilities |
(364 | ) | (34 | ) | (233 | ) | 205 | 1,076 | ||||||||
Deferred rent |
(438 | ) | 7 | 230 | 163 | (153 | ) | |||||||||
Deferred revenue |
237 | 2,953 | (1,834 | ) | (2,606 | ) | (665 | ) | ||||||||
Income taxes payable |
2,303 | (2,645 | ) | — | — | — | ||||||||||
| | | | | | | | | | | | | | | | | |
Net cash provided by operating |
46,184 | 53,705 | 66,015 | 45,288 | 49,848 | |||||||||||
| | | | | | | | | | | | | | | | | |
Cash flows from investing activities: |
||||||||||||||||
Purchases of property and equipment |
(7,091 | ) | (5,503 | ) | (9,202 | ) | (6,807 | ) | (6,347 | ) | ||||||
Investment in capitalized software |
(5,778 | ) | (9,581 | ) | (9,664 | ) | (7,506 | ) | (11,283 | ) | ||||||
Proceeds from sale of property and equipment |
10 | — | 3 | 3 | 22 | |||||||||||
| | | | | | | | | | | | | | | | | |
Net cash used in investing activities |
(12,859 | ) | (15,084 | ) | (18,863 | ) | (14,310 | ) | (17,608 | ) | ||||||
| | | | | | | | | | | | | | | | | |
Cash flows from financing activities: |
||||||||||||||||
Repurchase of common stock |
— | — | (72,114 | ) | (72,114 | ) | (309,083 | ) | ||||||||
Sale of common stock |
— | — | 52,114 | 52,114 | — | |||||||||||
Proceeds from credit facility borrowings |
— | — | — | — | 300,000 | |||||||||||
Dividends paid |
(18,604 | ) | (46,963 | ) | (23,511 | ) | (6,363 | ) | (2,852 | ) | ||||||
Proceeds from exercise of stock options |
120 | 9 | 270 | 19 | 720 | |||||||||||
Capital lease obligations paid |
(157 | ) | (178 | ) | (115 | ) | (104 | ) | (101 | ) | ||||||
Excess tax benefits from share-based compensation |
— | — | 437 | — | 429 | |||||||||||
| | | | | | | | | | | | | | | | | |
Net cash used in financing activities |
(18,641 | ) | (47,132 | ) | (42,919 | ) | (26,448 | ) | (10,887 | ) | ||||||
| | | | | | | | | | | | | | | | | |
Increase (decrease) in cash and cash equivalents |
14,684 | (8,511 | ) | 4,233 | 4,530 | 21,353 | ||||||||||
Cash and cash equivalents, beginning of period |
100,188 | 114,872 | 106,361 | 106,361 | 110,594 | |||||||||||
| | | | | | | | | | | | | | | | | |
Cash and cash equivalents, end of period |
$ | 114,872 | $ | 106,361 | $ | 110,594 | $ | 110,891 | $ | 131,947 | ||||||
| | | | | | | | | | | | | | | | | |
| | | | | | | | | | | | | | | | | |
See notes to consolidated financial statements.
F-6
Inovalon Holdings, Inc.
Consolidated Statements of Cash Flows (Continued)
(in thousands)
| |
Year Ended December 31, |
Nine Months Ended September 30, |
||||||||||||||
|---|---|---|---|---|---|---|---|---|---|---|---|---|---|---|---|---|
| |
2011
|
2012
|
2013
|
2013
|
2014
|
|||||||||||
| |
|
|
|
(unaudited) |
||||||||||||
Supplementary cash flow disclosure: |
||||||||||||||||
Cash paid during the year for income taxes, net of refunds |
$ | 5,635 | $ | 38,868 | $ | 22,723 | $ | 18,265 | $ | 35,186 | ||||||
Non-cash investing activities: |
||||||||||||||||
Tenant improvement allowance |
103 | — | 1,536 | 1,449 | — | |||||||||||
Capital lease obligations incurred |
172 | 16 | 240 | 135 | 14 | |||||||||||
Accounts payable for purchases of and investment in property, equipment and capitalized software |
13 | 778 | 1,209 | 184 | 1,606 | |||||||||||
Accrued compensation for investment in capitalized software |
— | 298 | 276 | 213 | 189 | |||||||||||
Other current liability for purchases of property, equipment and capitalized software |
240 | — | — | — | — | |||||||||||
Non-cash financing activities: |
||||||||||||||||
Dividends declared, not paid |
3,326 | 6,363 | 2,852 | — | — | |||||||||||
See notes to consolidated financial statements.
F-7
Inovalon Holdings, Inc.
Notes to Consolidated Financial Statements
1. NATURE OF OPERATIONS
On September 17, 2014, Inovalon, Inc. implemented holding company reorganization, pursuant to which Inovalon Holdings, Inc. (together with its wholly owned subsidiaries, Inovalon or the Company) became the new parent company of Inovalon, Inc. and Inovalon, Inc. became the direct, wholly owned subsidiary of the Company. The Company was incorporated in the state of Delaware on September 11, 2014. Inovalon, Inc. was incorporated in the state of Delaware on November 18, 2005. The impact of the holding company reorganization is retrospectively presented in the accompanying consolidated financial statements by recognizing the entity as Inovalon Holdings, Inc. The consolidated balance sheet and consolidated statement of stockholders' equity (deficit) depict the newly authorized classes of stock. Additionally, earnings per share is calculated based upon the newly created Class B common stock (refer to Notes 3 and 10 for additional information). On January 14, 2015, the Company's board of directors approved a five-for-one stock split of the Company's Class A common stock and Class B common stock. Effective January 16, 2015 the Company amended its certificate of incorporation to give effect to the stock split and to change the Company's authorized common equity capital to 900,000,000 shares of common stock, 750,000,000 shares of Class A common stock, and 150,000,000 shares of Class B common stock, par value $0.000005 per share. All share data included in these financial statements give retroactive effect to the stock split and related amendment to the Company's certificate of incorporation.
The Company is a leading technology company that combines advanced cloud-based data analytics and data-driven intervention platforms to achieve meaningful impact in clinical and quality outcomes, utilization, and financial performance across the healthcare landscape. The value we deliver to our customers is achieved by turning data into insights and those insights into action. Through our large proprietary datasets, advanced integration technologies, sophisticated predictive analytics, and deep subject matter expertise, we deliver a seamless, end-to-end platform that brings the benefits of big data and large-scale analytics to the point of care. Our analytics identify gaps in care, quality, data integrity, and financial performance, while also bringing to bear the unique capabilities to resolve those gaps. This differentiating combination provides a powerful platform that drives high-value impact, improving quality and economics for health plans, hospitals, physicians, patients, pharmaceutical companies and researchers.
2. SUMMARY OF SIGNIFICANT ACCOUNTING POLICIES
Principles of Consolidation — The accompanying consolidated financial statements include the accounts of Inovalon Holdings, Inc. and its wholly owned subsidiaries. All intercompany accounts and transactions have been eliminated in consolidation.
The accompanying interim consolidated balance sheet as of September 30, 2014, and the consolidated statements of operations, consolidated statement of cash flows for the nine months ended September 30, 2013 and 2014 and the consolidated statement of stockholders' equity (deficit) for the nine months ended September 30, 2014 and the related footnote disclosures are unaudited. These unaudited interim consolidated financial statements have been prepared in accordance with accounting principles generally accepted in the United States of America, or GAAP. The unaudited interim consolidated financial statements have been prepared on the same basis as the audited financial statements and reflect, in management's opinion, include all adjustments of a normal, recurring nature that are necessary for the fair statement of the Company's financial position as of September 30, 2014 and its consolidated results of operations and cash flows for the nine months ended September 30, 2013 and 2014. The results for the nine months ended
F-8
Inovalon Holdings, Inc.
Notes to Consolidated Financial Statements (Continued)
2. SUMMARY OF SIGNIFICANT ACCOUNTING POLICIES (Continued)
September 30, 2014 are not necessarily indicative of the results expected for the full fiscal year or any other period.
Basis of Presentation and Use of Estimates — These consolidated financial statements have been prepared in accordance with GAAP. The preparation of consolidated financial statements in conformity with GAAP requires management to make estimates and assumptions that affect the reported amounts of assets and liabilities, disclosures of contingent assets and liabilities as of the date of the financial statements, and the reported amounts of revenue and expenses during the reported period.
Significant estimates made by management include, but are not limited to: revenue recognition, specifically selling prices associated with the individual elements in multiple element arrangements; accounts receivable allowances; estimates of the fair value of the Company's common stock and the related estimates of the fair value of stock-based awards; fair value of intangibles and goodwill; depreciable lives of property, equipment and capitalized software; and useful lives of intangible assets. Actual results could differ from management's estimates, and such differences could be material to the Company's consolidated financial position and results of operations.
Cash and Cash Equivalents — Cash and cash equivalents consist of highly liquid investments comprised of money market instruments with original maturities of three months or less at the time of purchase, and demand deposits with financial institutions.
Concentrations of Credit Risk — Accounts receivable and cash and cash equivalents subject the Company to its highest potential concentrations of credit risk. Although the Company deposits its cash and cash equivalents with multiple financial institutions, the Company's deposits may exceed federally insured limits. The Company has not experienced any losses on cash and cash equivalent accounts to date, and management believes the Company is not exposed to any significant credit risk related to cash and cash equivalents.
The Company sells products and services to clients without requiring collateral, based on an evaluation of the client's financial condition. Exposure to losses on receivables is principally dependent on each client's financial condition. The Company monitors its exposure for credit losses and maintains allowances for anticipated losses.
F-9
Inovalon Holdings, Inc.
Notes to Consolidated Financial Statements (Continued)
2. SUMMARY OF SIGNIFICANT ACCOUNTING POLICIES (Continued)
Revenue from significant clients, those representing 10% or more of total revenue for the respective periods, is summarized as follows:
| |
Year Ended December 31, |
Nine Months Ended September 30, |
||||||||||||||
|---|---|---|---|---|---|---|---|---|---|---|---|---|---|---|---|---|
Revenue:
|
2011
|
2012
|
2013
|
2013
|
2014
|
|||||||||||
| |
|
|
|
(Unaudited) |
||||||||||||
Client A |
17 | % | * | 10 | % | 10 | % | * | ||||||||
Client B |
15 | % | 17 | % | * | * | * | |||||||||
Client C |
12 | % | * | * | * | * | ||||||||||
Client D |
11 | % | 11 | % | 11 | % | 11 | % | * | |||||||
Client E |
* | 11 | % | 12 | % | 11 | % | * | ||||||||
Client F |
* | * | 11 | % | 11 | % | * | |||||||||
- *
- Less than 10%
Accounts receivable from significant clients, those representing 10% or more of total accounts receivable for the dates noted, is summarized below:
| |
December 31, | |
||||||||
|---|---|---|---|---|---|---|---|---|---|---|
| |
September 30, 2014 |
|||||||||
Accounts Receivable:
|
2012
|
2013
|
||||||||
| |
|
|
(Unaudited) |
|||||||
Client A |
* | * | * | |||||||
Client B |
18 | % | * | * | ||||||
Client D |
* | * | 15 | % | ||||||
Client E |
14 | % | 21 | % | * | |||||
Client F |
* | * | 11 | % | ||||||
Client G |
13 | % | * | 13 | % | |||||
Client I |
* | * | * | |||||||
Client J |
* | 12 | % | * | ||||||
- *
- Less than 10%
Accounts Receivable and Allowances — Accounts receivable consists primarily of amounts due to the Company from its normal business activities. The Company provides an allowance for estimated losses resulting from the failure of clients to make required payments (credit losses) and a sales allowance for estimated future billing adjustments resulting from client concessions or resolutions of billing disputes. The provision for sales allowances are charged against revenue while credit losses are recorded in general and administrative expenses.
Fair Value Measurements — The Company applies the Accounting Standards Codifications, or ASC, 820-10, Fair Value Measurements and Disclosures, ASC 820-10. ASC 820-10 defines fair value, establishes a fair value hierarchy for assets and liabilities measured at fair value, and expands required disclosures about fair value measurements. This guidance requires the Company to classify and disclose assets and liabilities measured at fair value on a recurring basis, as well as
F-10
Inovalon Holdings, Inc.
Notes to Consolidated Financial Statements (Continued)
2. SUMMARY OF SIGNIFICANT ACCOUNTING POLICIES (Continued)
fair value measurements of assets and liabilities measured on a nonrecurring basis in periods subsequent to initial measurement, in a three-tier fair value hierarchy as described below.
The guidance defines fair value as the exchange price that would be received for an asset or paid to transfer a liability in the principal or most advantageous market for the asset or liability in an orderly transaction between market participants on the measurement date. Valuation techniques used to measure fair value must maximize the use of observable inputs and minimize the use of unobservable inputs. The guidance describes three levels of inputs that may be used to measure fair value:
Level 1 — Financial assets and liabilities whose values are based on quoted prices (unadjusted) in active markets for identical assets or liabilities that the reporting entity can access at the measurement date.
Level 2 — Financial assets and liabilities whose values are based on inputs other than quoted prices included within Level 1 that are observable for the asset or liability, either directly or indirectly.
Level 3 — Financial assets and liabilities whose values are based on unobservable inputs for the asset or liability.
As of December 31, 2013 and 2012, the Company measured its money market investment balances at fair value based on quoted prices that are equivalent to cost (Level 1). The Company did not have any assets measured at fair value on a recurring basis using significant other observable inputs (Level 2), or significant unobservable inputs (Level 3), or any liabilities measured at fair value as prescribed by ASC 820-10.
Financial instruments are defined as cash, evidence of an ownership interest in an entity or contract that imposes an obligation to deliver cash, or other financial instruments to a third party. The carrying amounts of accounts receivable, accounts payable, other accrued expenses and capital lease obligations approximate fair value because of the short-term maturity of these instruments. The Company's policy with respect to derivative financial instruments is to record them at fair value with changes in value recognized in earnings during the period of change. At December 31, 2012 and 2013 and September 30, 2014, the Company had no derivative financial instruments.
Property, Equipment and Capitalized Software, net — Property and equipment are stated at cost, less accumulated depreciation and amortization. Depreciation and amortization on property,
F-11
Inovalon Holdings, Inc.
Notes to Consolidated Financial Statements (Continued)
2. SUMMARY OF SIGNIFICANT ACCOUNTING POLICIES (Continued)
leasehold improvements, equipment, and software is computed on a straight-line basis over the estimated useful lives of the assets, as follows:
| |
Useful Life
|
|||
|---|---|---|---|---|
Office and computer equipment |
3-5 years | |||
Purchased software |
5 years | |||
Capitalized software |
3-5 years | |||
Furniture and fixtures |
7 years | |||
Building |
40 years | |||
Leasehold improvements |
* | |||
Assets under capital leases |
* | |||
- (*)
- lesser of lease term or economic life
Expenses for repairs and maintenance that do not extend the life of property and equipment are charged to expense as incurred. Expenses for major renewals and betterments, which significantly extend the useful lives of existing property and equipment, are capitalized and depreciated. Upon retirement or disposition of property and equipment, the cost and related accumulated depreciation are removed from the accounts and any resulting gain or loss is recognized.
In accordance with ASC 350-40, Internal-use Software, the Company capitalizes certain software development costs while in the application development stage related to software developed for internal use. All other costs to develop software for internal use, either in the preliminary project stage or post implementation stage, are expensed when incurred. Software development costs are amortized on a straight-line basis over a three to five year period, which management believes represents the useful life of these capitalized costs.
In accordance with ASC 985-20, Software to be Sold, Leased, or Marketed, certain software development costs are expensed as incurred until technological feasibility has been established. Thereafter, all software development costs incurred through the software's general release date are capitalized and subsequently reported at the lower of amortized cost or net realizable value. Capitalized costs are amortized based on current and expected future revenue for each software solution with minimum annual amortization equal to the straight-line amortization over the estimated economic life, which is typically over a three to five year period, of the solution.
Intangible Assets (in thousands, except years) — Intangible assets consist of acquired technology, including developed and core technology, databases, non-competes, trade names, and customer relationships. Intangible assets are initially recorded at fair value and amortized on a
F-12
Inovalon Holdings, Inc.
Notes to Consolidated Financial Statements (Continued)
2. SUMMARY OF SIGNIFICANT ACCOUNTING POLICIES (Continued)
straight line basis over their estimated useful lives. Acquired intangible assets are being amortized over the following periods:
| |
Useful Life
|
|||
|---|---|---|---|---|
Proprietary software technology |
2-10 years | |||
Trademark |
5 years | |||
Database |
10 years | |||
Covenant not to compete |
3.5 years | |||
Customer relationships |
4-15.75 years | |||
On an annual basis, the Company reviews its intangible assets for impairment based on estimated future undiscounted cash flows attributable to the assets. In the event such cash flows are not expected to be sufficient to recover the recorded value of the assets, the assets are written down to their net realizable values. During fiscal year 2011, the Company made the decision to discontinue using the Catalyst Information Technologies, Inc. trade name, and recognized an impairment loss of $1,212 representing the remaining net carrying value at that time, which was reflected in general and administrative expense. There were no impairment charges on intangible assets for the years ended December 31, 2012 and 2013 or the nine months ended September 30, 2013 and 2014.
Goodwill — Goodwill represents the excess of acquisition costs over the fair value of tangible net assets and identifiable intangible assets of the businesses acquired. Goodwill is not amortized. Goodwill is subject to impairment testing annually as of December 31st, or whenever events or changes in circumstances indicate that the carrying amount may not be fully recoverable. The Company's impairment tests are based on a single operating segment and reporting unit structure. The Company completed its annual impairment test as of December 31, 2012 and 2013, which resulted in no impairment of goodwill. This test compares a reporting unit's carrying value to its fair value. If the fair value of the reporting unit exceeds the carrying value of the net assets, including goodwill assigned to that reporting unit, goodwill is not impaired. If the carrying value of the reporting unit's net assets, including goodwill, exceeds the fair value of the reporting unit, then the Company will determine the implied fair value of the reporting unit's goodwill. If the carrying value of a reporting unit's goodwill exceeds its implied fair value, then an impairment loss is recorded for the difference between the carrying amount and the implied fair value of the goodwill.
Valuation of Long-Lived Assets (in thousands) — The Company reviews long-lived assets for events or changes in circumstances that would indicate potential impairment. If the Company determines that an asset may not be recoverable, an impairment charge is recorded. In 2011, the Company recorded an impairment charge of $19 for leasehold improvements. There were no impairment charges on long-lived assets for the years ended December 31, 2012 and 2013. No impairment charges on long-lived assets occurred during the nine month period ended September 30, 2013, and a $109 impairment charges on long-lived assets was recognized in general as administrative expenses during the nine month period ended September 30, 2014.
Revenue Recognition — The Company recognizes revenue when it is realized (or realizable) and earned (i.e., when services have been rendered or delivery of applicable deliverables has occurred). This occurs when persuasive evidence of an arrangement exists, the product or service has been performed or delivered, fees are fixed or determinable, and collection is reasonably
F-13
Inovalon Holdings, Inc.
Notes to Consolidated Financial Statements (Continued)
2. SUMMARY OF SIGNIFICANT ACCOUNTING POLICIES (Continued)
assured. When collectability is not reasonably assured, revenue is recognized when cash is collected. Cash collections and invoices generated in excess of revenue recognized are recorded as deferred revenue until the revenue recognition criteria are met.
The Company primarily derives its revenue from multiple-element arrangement sales of its cloud-based data analytics and data-driven intervention platform services. Revenue from these multiple element arrangements are recognized in accordance with ASC 605-25, Revenue Recognition — Multiple Element Arrangements. The Company allocates revenue to its cloud-based data analytics and data-driven intervention platform services using the relative selling price method. The Company has generally been unable to establish vendor-specific objective evidence of fair value, and while the Company routinely seeks third party evidence of fair value, meaningful data has generally been unavailable as the Company's services are unique and visibility into competitors pricing is unavailable. As a result, the Company uses its best estimate of selling price to allocate arrangement consideration to its contractual service elements.
The Company has determined an estimated selling price by considering several external and internal factors including, but not limited to, pricing practices, margin objectives, competition, customer demand, internal costs, and overall economic trends.
Generally, the best estimate of selling price is consistent with the contractual arrangement fee for each element.
Revenue is recognized as cloud-based data analytics and data-driven intervention services are performed and information is delivered to clients, which generally align with the Company's right to invoice its clients. Cloud-based data analytics services are considered performed when gaps in care, quality, data integrity, or financial performance, and summarized key analytics and benchmarking analytics reports are delivered to its clients, provided that all contractual performance requirements and other revenue recognition criteria are met. Data-driven intervention services are considered performed upon the completion of each medical record data abstraction and review service, encounter decision support, encounter facilitation, outbound telephonic and written communication, and supplemental patient encounter service, provided that all contractual performance requirements and other revenue recognition criteria are met.
The Company also enters into multiple-element software arrangements, which are recognized under ASC 985-605, Software Revenue Recognition, when software subscription licenses are provided to clients. Under these arrangements, the Company provides post-contract support, or PCS, including help desk support and unspecified upgrades. Vendor-specific objective evidence of fair value has not been established for PCS as PCS is not renewed separately from the license fees. As a result, under these subscription software license agreements, the Company recognizes revenue from the license of software ratably over the life of the agreement. The Company begins to recognize revenue upon execution of a signed agreement and delivery of the software, provided that the software license fees are fixed and determinable, and collection of the resulting receivable is reasonably assured.
Certain of the Company's arrangements entitle a client to receive a refund if the Company fails to satisfy contractually specified performance obligations. The refund is limited to a portion or all of the consideration paid. In this case, revenue is recognized when performance obligations are satisfied.
F-14
Inovalon Holdings, Inc.
Notes to Consolidated Financial Statements (Continued)
2. SUMMARY OF SIGNIFICANT ACCOUNTING POLICIES (Continued)
The Company maintains an allowance, charged to revenue, which reflects the Company's estimated future billing adjustments resulting from client concessions or resolutions of billing disputes.
Cost of Revenue — Cost of revenue consists primarily of expenses for employees who provide direct revenue-generating services to our clients, including salaries, benefits, discretionary incentive bonus compensation, employment taxes, equity compensation costs, and severance. Cost of revenue also includes expenses associated with the integration and verification of data and other service costs incurred to fulfill the Company's revenue contracts. Cost of revenue does not include allocated amounts for occupancy expense and depreciation and amortization.
Research and Development — Research and development expenses consist primarily of employee-related costs. All such costs are expensed as incurred, except for certain internal use software development costs that are capitalized. Research and development excludes any allocation of occupancy expense, depreciation and amortization.
Selling and Marketing — Sales and marketing expense consists primarily of employee-related expenses including salaries, benefits, discretionary incentive compensation, employment taxes, severance and equity compensation costs for employees engaged in sales, sales support, business development, and marketing. Sales and marketing expense also includes operating expenses for marketing programs, research, trade shows and brand messages, and public relations costs. Sales and marketing expense excludes any allocation of occupancy expense, depreciation and amortization.
General and Administrative — General and administrative expense consists primarily of employee-related expenses including salaries, benefits, discretionary incentive compensation, employment taxes, severance and equity compensation costs, for employees who are responsible for management information systems, administration, human resources, finance, legal, and executive management. General and administrative expense also includes occupancy expenses (including rent, utilities, communications, and facilities maintenance), professional fees, consulting fees, insurance, travel, and other expenses. General and administrative expense excludes any allocation of depreciation and amortization.
Segments — The Company operates its business as one operating segment: delivery of a seamless, end-to-end advanced cloud-based data analytics and data-driven intervention platform services that enables the Company's clients to achieve meaningful impacts in clinical and quality outcomes, utilization, and financial performance. The Company's chief operating decision maker is the Chief Executive Officer, who reviews financial information presented on a consolidated basis for purposes of making operating decisions, assessing financial performance and allocating resources.
Income Taxes — The Company accounts for income taxes in accordance with Accounting Standards Codification ASC 740, Income Taxes, which prescribes the use of the asset and liability approach to the recognition of deferred tax assets and liabilities related to the expected future tax consequences of events that have been recognized in the Company's financial statements or income tax returns. Deferred tax assets and liabilities are measured using enacted tax rates expected to apply to taxable income in the years in which those temporary differences are expected to be recovered or settled. Valuation allowances are established, when necessary, to reduce
F-15
Inovalon Holdings, Inc.
Notes to Consolidated Financial Statements (Continued)
2. SUMMARY OF SIGNIFICANT ACCOUNTING POLICIES (Continued)
deferred tax assets when it is more likely than not that a portion or all of a given deferred tax asset will not be realized. In accordance with ASC 740, income tax expense includes (i) deferred tax expense, which generally represents the net change in the deferred tax asset or liability balance during the period plus any change in valuation allowances and (ii) current tax expense, which represents the amount of tax currently payable to or receivable from a taxing authority plus amounts accrued for expected tax contingencies (including both tax and interest). ASC 740 prescribes a recognition threshold of more-likely-than-not, and a measurement attribute for all tax positions taken or expected to be taken on a tax return, in order for those positions to be recognized in the financial statements. The Company continually reviews tax laws, regulations and related guidance in order to properly record any uncertain tax liability positions. The Company adjusts these reserves in light of changing facts and circumstances.
Stock-Based Compensation — All stock-based awards, including employee stock option grants, are recorded at fair value as of the grant date in accordance with ASC 718, Compensation — Stock Compensation, and recognized in the statement of operations over the service period of the applicable award using the straight-line method. The Company determines the fair value of its stock options on the date of grant, using the Black-Scholes option pricing model. The Company estimates the number of share-based awards that are expected to be forfeited based on historical and anticipated turnover data. The assumptions used in calculating the fair value of share-based awards represent management's best estimates.
Net Income Per Share — Basic and diluted net income per share, or EPS, are determined in accordance with ASC 260, Earnings Per Share, which specifies the computation, presentation and disclosure requirements for EPS. Basic EPS, excludes all dilutive common stock equivalents, is based upon the weighted average number of shares of common stock outstanding during the period. Diluted EPS, as calculated using the treasury stock method, reflects the potential dilution that would occur if the Company's dilutive outstanding stock options were exercised.
The Company has issued Class A common stock and Class B common stock. Holders of Class A common stock generally have the same rights, including rights to dividends, as holders of Class B common stock, except that holders of Class A common stock have one vote per share while holders of Class B common stock have ten votes per share. Each share of Class B common stock will convert into one share of Class A common stock immediately upon its sale or transfer. As such, basic and fully diluted earnings per share for Class A common stock and Class B common stock are the same.
Treasury Stock — The Company records treasury stock activities under the cost method whereby the cost of the acquired stock is recorded as treasury stock. The Company's accounting policy upon the formal retirement of treasury stock is to deduct the par value from common stock and to reflect any excess of cost over par value as a reduction to additional paid-in capital (to the extent created by previous issuances of the shares) and then retained earnings.
Comprehensive Income — The Company's net income equals comprehensive income for all periods presented as the Company has no components of other comprehensive income. No accumulated comprehensive income has been recorded for the years presented.
F-16
Inovalon Holdings, Inc.
Notes to Consolidated Financial Statements (Continued)
2. SUMMARY OF SIGNIFICANT ACCOUNTING POLICIES (Continued)
Deferred Rent — Deferred rent consists of rent escalation payment terms, tenant improvement allowances and other incentives received from landlords related to the Company's operating leases for its facilities. Rent escalation represents the difference between actual operating lease payments due and straight-line rent expense, which is recorded by the Company over the term of the lease, including any construction period. The excess is recorded as a deferred credit in the early periods of the lease, when cash payments are generally lower than straight-line rent expense, and is reduced in the later periods of the lease when payments begin to exceed the straight-line expense. Tenant allowances from landlords for tenant improvements are generally comprised of cash received from the landlord as part of the negotiated terms of the lease or reimbursements of moving costs. These cash payments are recorded as deferred rent from landlords and are amortized as a reduction of periodic rent expense, over the term of the applicable lease.
Deferred Initial Public Offering ("IPO") Issuance Costs (in thousands) — The Company capitalizes deferred issuance costs, which primarily consist of direct incremental legal and accounting fees relating to the IPO. The deferred issuance costs will be offset against IPO proceeds upon the consummation of the offering. In the event the offering is terminated or materially delayed, deferred offering costs will be expensed. No amounts were deferred at December 31, 2012 or 2013, and $805 were deferred as prepaid expenses and other current assets at September 30, 2014.
Recently Issued Accounting Standards — In July 2013, the Financial Accounting Standards Board, or FASB, issued authoritative guidance containing changes to the presentation of an unrecognized tax benefit when a loss or credit carry forward exists. This statement is effective for financial statements issued for annual periods beginning after December 15, 2013, with early adoption permitted. Adoption of the standard is not expected to materially impact the Company's financial position, results of operations, or cash flows.
In May 2014, the FASB issued updated guidance on revenue from contracts with customers. This revenue recognition guidance supersedes existing GAAP guidance, including most industry-specific guidance. The core principle is that an entity should recognize revenue to depict the transfer of promised goods or services to customers in an amount that reflects the consideration to which the entity expects to be entitled in exchange for those goods or services. The guidance identifies steps to apply in achieving this principle. This updated guidance is effective for fiscal years, and interim periods within those fiscal years, beginning after December 15, 2016. The Company is currently evaluating the potential impact of this guidance on the Company's financial disclosures and results, including whether the Company elects retrospective, or modified restrospective, method adoption.
In June 2014, the FASB issued stock compensation guidance requiring that a performance target that affects vesting and that could be achieved after the requisite service period be treated as a performance condition. The amendments in this guidance are effective for fiscal years, and interim periods within those fiscal years, beginning after December 15, 2015. The Company is currently evaluating the potential impact of this guidance on the Company's financial disclosures and results.
F-17
Inovalon Holdings, Inc.
Notes to Consolidated Financial Statements (Continued)
3. NET INCOME PER SHARE (in thousands, except per share amounts)
As discussed in Note 2, holders of all outstanding classes of common stock participate ratably in earnings on an indentical per share basis as if all shares were a single class. Basic EPS is computed by dividing net income by the weighted average number of shares of common stock, Class A common stock and Class B common stock outstanding during the period. Diluted EPS is computed by dividing net income by the sum of the weighted average number of shares of common stock outstanding and potentially dilutive securities outstanding during the period under the treasury stock method. Potentially dilutive securities include stock options. Under the treasury stock method, dilutive securities are assumed to be exercised at the beginning of the periods and as if funds obtained thereby were used to purchase common stock at the average market price during the period. Securities are excluded from the computations of diluted earnings per share if their effect would be anti-dilutive to EPS.
The following table reconciles the weighted average shares outstanding for basic and diluted EPS for the periods indicated:
| |
Year Ended December 31, | Nine Months Ended September 30, |
||||||||||||||
|---|---|---|---|---|---|---|---|---|---|---|---|---|---|---|---|---|
| |
2011 | 2012 | 2013 | 2013 | 2014 | |||||||||||
| |
|
|
|
(Unaudited) |
||||||||||||
Net income |
$ | 24,927 | $ | 55,155 | $ | 32,718 | $ | 26,983 | $ | 51,853 | ||||||
Weighted average shares used in computing basic net income per share |
137,865 | 137,865 | 135,305 | 135,555 | 133,640 | |||||||||||
| | | | | | | | | | | | | | | | | |
Net income per share — basic |
$ | 0.18 | $ | 0.40 | $ | 0.24 | $ | 0.20 | $ | 0.39 | ||||||
| | | | | | | | | | | | | | | | | |
| | | | | | | | | | | | | | | | | |
Net income |
24,927 | 55,155 | 32,718 | 26,983 | 51,853 | |||||||||||
Weighted average shares used in computing basic net income per share |
137,865 | 137,865 | 135,305 | 135,555 | 133,640 | |||||||||||
Effect of dilutive securities |
990 | 1,175 | 1,070 | 1,175 | 2,200 | |||||||||||
| | | | | | | | | | | | | | | | | |
Weighted average shares used in computing diluted net income per share |
138,855 | 139,040 | 136,375 | 136,730 | 135,840 | |||||||||||
| | | | | | | | | | | | | | | | | |
Net income per share — diluted |
$ | 0.18 | $ | 0.40 | $ | 0.24 | $ | 0.20 | $ | 0.38 | ||||||
| | | | | | | | | | | | | | | | | |
| | | | | | | | | | | | | | | | | |
The computation of diluted EPS does not include 5,715, 5,305, and 4,905 stock options for the years ended December 31, 2011, 2012, and 2013, respectively, and 4,680 and 650 stock options for the nine month periods ended September 30, 2013 and 2014, respectively, because their inclusion would have an anti-dilutive effect on EPS.
As discussed in Notes 1 and 10, in September 2014, the Company completed a holding company reorganization. As part of the reorganization, the Company implemented a multi-class stock structure. The Company has retrospectively presented the impact on EPS of this reorganization by calculating EPS based on the newly authorized, issued and outstanding Class A and Class B common stock. Only Class B common stock shares were outstanding for any of the periods presented.
F-18
Inovalon Holdings, Inc.
Notes to Consolidated Financial Statements (Continued)
4. PROPERTY, EQUIPMENT AND CAPITALIZED SOFTWARE (in thousands)
Property, equipment and capitalized software consisted of the following:
| |
December 31, | |
||||||||
|---|---|---|---|---|---|---|---|---|---|---|
| |
September 30, 2014
|
|||||||||
| |
2012
|
2013
|
||||||||
| |
|
|
(Unaudited) |
|||||||
Office and computer equipment |
$ | 20,094 | $ | 23,345 | $ | 24,206 | ||||
Leasehold improvements |
10,933 | 13,374 | 13,852 | |||||||
Purchased software |
6,436 | 8,563 | 9,891 | |||||||
Capitalized software |
12,728 | 21,091 | 30,521 | |||||||
Furniture and fixtures |
5,363 | 6,268 | 6,226 | |||||||
Land |
390 | 390 | 390 | |||||||
Building |
1,743 | 1,750 | 1,750 | |||||||
Work in process |
3,729 | 5,897 | 7,102 | |||||||
| | | | | | | | | | | |
Total |
61,416 | 80,678 | 93,938 | |||||||
Less: accumulated depreciation and amortization |
(27,246 | ) | (37,628 | ) | (44,812 | ) | ||||
| | | | | | | | | | | |
Property, equipment and capitalized software, net |
$ | 34,170 | $ | 43,050 | $ | 49,126 | ||||
| | | | | | | | | | | |
| | | | | | | | | | | |
The Company leases certain office equipment under capital lease agreements, with bargain purchase options at the end of the lease term. Leased office equipment included in property and equipment at December 31, 2012 and 2013 and September 30, 2014 was $743, $996 and $961, respectively.
Depreciation expense for the years ended December 31, 2011, 2012 and 2013 was $7,979, $9,777, and $11,918, respectively, and for the nine months ended September 30, 2013 and 2014 was $8,802 and $11,185, respectively. Amortization of the capital leases included in depreciation expense was $156, $172, $115 for the years ended December 31, 2011, 2012 and 2013, respectively, and $84 and $102 for the nine month periods ended September 30, 2013 and 2014, respectively. At December 31, 2012 and 2013 and September 30, 2014, the Company had unamortized capitalized software costs, including costs classified as work in progess, of $14,345, $20,657 and $26,208, respectively.
At December 31, 2012 and 2013 and at September 30, 2014 work in process consisted primarily of purchased software licenses, computer equipment, and capitalized software, which was not placed into service.
5. GOODWILL AND INTANGIBLE ASSETS (in thousands, except years)
Goodwill
Goodwill is primarily derived from the Company's acquisitions of Medical Reliance Group, Inc. in 2006 and Catalyst Information Technologies, Inc. in 2009. Based on the results of the impairment assessment as of December 31, 2013, the Company determined that the fair value of its reporting unit exceeded its respective carrying value. There were no goodwill impairment indicators after the date of the last annual impairment test and no goodwill impairments recorded for any other period presented.
F-19
Inovalon Holdings, Inc.
Notes to Consolidated Financial Statements (Continued)
5. GOODWILL AND INTANGIBLE ASSETS (in thousands, except years) (Continued)
Intangible Assets
Intangible assets at December 31, 2012 and 2013 and September 30, 2014 were as follows:
| |
December 31, 2012 | |
|||||||||||
|---|---|---|---|---|---|---|---|---|---|---|---|---|---|
| |
Weighted Average Remaining Useful Life (years) |
||||||||||||
| |
Gross
|
Accumulated Amortization |
Net
|
||||||||||
Proprietary software technologies |
$ | 16,077 | $ | (10,052 | ) | $ | 6,025 | 3.7 | |||||
Trademark |
360 | (238 | ) | 122 | 1.7 | ||||||||
Database |
6,500 | (2,147 | ) | 4,353 | 6.8 | ||||||||
Covenant not to compete |
245 | (231 | ) | 14 | 0.2 | ||||||||
Customer relationships |
13,650 | (8,750 | ) | 4,900 | 12.5 | ||||||||
| | | | | | | | | | | | | | |
Total |
$ | 36,832 | $ | (21,418 | ) | $ | 15,414 | ||||||
| | | | | | | | | | | | | | |
| | | | | | | | | | | | | | |
| |
December 31, 2013 | |
|||||||||||
|---|---|---|---|---|---|---|---|---|---|---|---|---|---|
| |
Weighted Average Remaining Useful Life (years) |
||||||||||||
| |
Gross
|
Accumulated Amortization |
Net
|
||||||||||
Proprietary software technologies |
$ | 16,077 | $ | (12,521 | ) | $ | 3,556 | 0.7 | |||||
Trademark |
360 | (310 | ) | 50 | 0.7 | ||||||||
Database |
6,500 | (2,797 | ) | 3,703 | 5.8 | ||||||||
Customer relationships |
13,650 | (9,144 | ) | 4,506 | 11.5 | ||||||||
| | | | | | | | | | | | | | |
Total |
$ | 36,587 | $ | (24,772 | ) | $ | 11,815 | ||||||
| | | | | | | | | | | | | | |
| | | | | | | | | | | | | | |
| |
September 30, 2014 | |
|||||||||||
|---|---|---|---|---|---|---|---|---|---|---|---|---|---|
| |
Weighted Average Remaining Useful Life (years) |
||||||||||||
| |
Gross
|
Accumulated Amortization |
Net
|
||||||||||
| |
(unaudited) |
|
|||||||||||
Proprietary software technologies |
$ | 16,077 | $ | (15,516 | ) | $ | 561 | 0.5 | |||||
Trademark |
360 | (360 | ) | — | — | ||||||||
Database |
6,500 | (3,284 | ) | 3,216 | 5.0 | ||||||||
Customer relationships |
13,650 | (9,439 | ) | 4,211 | 10.7 | ||||||||
| | | | | | | | | | | | | | |
Total |
$ | 36,587 | $ | (28,599 | ) | $ | 7,988 | ||||||
| | | | | | | | | | | | | | |
| | | | | | | | | | | | | | |
Driven primarily by the accelerated arrival of advancing generations of technological software capabilities, management decided to discontinue the use of proprietary software technology, acquired in the Medical Reliance Group acquisition, with an initial expected useful life of ten years. The Company calculated no impairment and shortened the life of the intangible asset, and plans to accelerate straight-line amortization over the period of time the Company anticipates transitioning to an advanced software application, which is expected to occur during March 2015. At December 31, 2013 and September 30, 2014, the carrying value of this proprietary software technology was $3,368 and $561, respectively.
F-20
Inovalon Holdings, Inc.
Notes to Consolidated Financial Statements (Continued)
5. GOODWILL AND INTANGIBLE ASSETS (in thousands, except years) (Continued)
Amortization expense for the years ended December 31, 2011, 2012 and 2013 was $3,250, $3,122, $3,599, respectively, and for the nine months ended September 30, 2013 and 2014 was $2,303 and $3,827, respectively.
Estimated future amortization expense of intangible assets, based upon the Company's intangible assets at December 31, 2013, is as follows:
| |
Amount
|
|||
|---|---|---|---|---|
Year ending December 31 |
||||
2014 |
$ | 4,650 | ||
2015 |
1,044 | |||
2016 |
1,044 | |||
2017 |
1,044 | |||
2018 |
1,044 | |||
Thereafter |
2,989 | |||
| | | | | |
Total |
$ | 11,815 | ||
| | | | | |
| | | | | |
Estimated future amortization expense of acquired intangible assets, based upon the Company's intangible assets at September 30, 2014, is as follows:
| |
Amount | |||
|---|---|---|---|---|
| |
(unaudited) |
|||
Remaining three months ending December 31, 2014 |
$ | 541 | ||
Year ending December 31 |
||||
2015 |
1,324 | |||
2016 |
1,044 | |||
2017 |
1,044 | |||
2018 |
1,044 | |||
Thereafter |
2,991 | |||
| | | | | |
Total |
$ | 7,988 | ||
| | | | | |
| | | | | |
6. CREDIT FACILITIES (IN THOUSANDS)
Credit facilities consisted of the following:
| |
December 31, | |
||||||||
|---|---|---|---|---|---|---|---|---|---|---|
| |
September 30, 2014 |
|||||||||
| |
2012
|
2013
|
||||||||
| |
|
|
(Unaudited) |
|||||||
Revolving credit facility |
$ | — | $ | — | $ | — | ||||
Term loan |
— | — | 300,000 | |||||||
| | | | | | | | | | | |
Total credit facilities |
— | — | 300,000 | |||||||
Less: current portion |
— | — | 15,000 | |||||||
| | | | | | | | | | | |
Non-current credit facilities |
0 | 0 | 285,000 | |||||||
| | | | | | | | | | | |
| | | | | | | | | | | |
F-21
Inovalon Holdings, Inc.
Notes to Consolidated Financial Statements (Continued)
6. CREDIT FACILITIES (IN THOUSANDS) (Continued)
On September 19, 2014, the Company entered into a Credit and Guaranty Agreement ("Agreement"), with a group of lenders including Goldman Sachs Bank USA, as administrative agent, to provide credit facilities in the aggregate maximum principal amount of $400,000, consisting of a senior unsecured term loan facility in the original principal amount of $300,000 (the "Term Loan Facility"), and a senior unsecured revolving credit facility in the maximum principal amount of $100,000 (together with the Term Loan Facility, the "Credit Facilities").
The revolving credit facility will be made available to the Company upon the earlier of the consummation by the Company of a qualified initial public offering, or the date on which the aggregate principal amount of the Term Loan Facility then outstanding does not exceed $200,000.
The Company's borrowing rate under the Credit Facilities is based on either Eurodollar loans or base rate loans. Interest accrues on Eurodollar loans at a defined Eurodollar rate, defined as the London Interbank Offer Rate ("LIBOR") plus the applicable margin of 1.25%, as defined in the Credit Facility. Interest is payable monthly in arrears.
The Credit Facility requires the Company to comply with specified financial covenants, including the maintenance of a $50,000 minimum cash and cash equivalents balance as of each calendar quarter end. The minimum cash and cash equivalents balance is not required to be held with any of the group of lenders and may be commingled with the Company's operating funds. The Credit Facility also contains various covenants, including affirmative covenants with respect to certain reporting requirements and maintaining certain business activities, and negative covenants that, among other things, may limit or impose restrictions on our ability to incur liens, incur additional indebtedness, make investments, make acquisitions and undertake certain additional actions. As of, and during, the nine months ended September 30, 2014, the Company was in compliance with our financial covenants under the Credit Facility.
Scheduled maturity of the Credit Facilities follows:
(in thousands)
|
Amount
|
|||
|---|---|---|---|---|
| |
(unaudited) |
|||
Remaining three months ending December 31, 2014 |
$ | — | ||
Year ending December 31, |
||||
2015 |
18,750 | |||
2016 |
15,000 | |||
2017 |
30,000 | |||
2018 |
45,000 | |||
Thereafter |
191,250 | |||
| | | | | |
Total |
$ | 300,000 | ||
| | | | | |
| | | | | |
F-22
Inovalon Holdings, Inc.
Notes to Consolidated Financial Statements (Continued)
7. COMMITMENTS AND CONTINGENCIES (in thousands)
Operating Leases — The Company leases office space under operating lease arrangements, some of which contain renewal options. Future non-cancellable lease payments as of December 31, 2013 are as follows:
| |
Amount
|
|||
|---|---|---|---|---|
Year ending December 31, |
||||
2014 |
$ | 7,564 | ||
2015 |
6,720 | |||
2016 |
6,287 | |||
2017 |
6,064 | |||
2018 |
4,849 | |||
Thereafter |
844 | |||
| | | | | |
Total |
$ | 32,328 | ||
| | | | | |
| | | | | |
Future non-cancellable lease payments as of September 30, 2014 are as follows:
| |
Amount | |||
|---|---|---|---|---|
| |
(unaudited) |
|||
Remaining three months ending December 31, 2014 |
$ | 1,976 | ||
Years ending December 31, |
||||
2015 |
6,720 | |||
2016 |
6,287 | |||
2017 |
6,064 | |||
2018 |
4,849 | |||
Thereafter |
844 | |||
| | | | | |
Total |
$ | 26,740 | ||
| | | | | |
| | | | | |
Total expense under operating leases was $5,484, $5,715, and $6,572 during the years ended December 31, 2011, 2012, and 2013, respectively, and was $4,739 and $5,663 during the nine month periods ended September 30, 2013 and 2014, respectively. Certain operating leases contain rent escalation clauses, which are recorded on a straight-line basis over the initial term of the lease, with the difference between the rent paid and the straight-line rent recorded as a deferred rent liability. Lease incentives received from landlords are recorded as deferred rent liabilities and are amortized on a straight-line basis over the lease term as a reduction to rent expense. The deferred rent liability was $1,777, $3,543, and $3,390 at December 31, 2012 and 2013 and at September 30, 2014, respectively.
Capital Leases — The total capital lease liability at December 31, 2012 and 2013 and September 30, 2014 was $286, $411, and $296, respectively, which approximates fair value due to the short duration of the obligations.
Letter of Credit — The Company maintains a letter of credit with its primary commercial financial institution. During the years ended December 31, 2011, 2012, and 2013 and the nine months ended September 30, 2013 and 2014, the outstanding letter of credit was $247. The letter of credit is in lieu of a security deposit for the Company's corporate office.
F-23
Inovalon Holdings, Inc.
Notes to Consolidated Financial Statements (Continued)
7. COMMITMENTS AND CONTINGENCIES (in thousands) (Continued)
Litigation — The Company is involved in various litigation matters arising out of the normal course of business. The Company consults with legal counsel on those issues related to litigation and seeks input from other experts and advisors with respect to such matters. Estimating the probable losses or a range of probable losses resulting from litigation, government actions and other legal proceedings is inherently difficult and requires an extensive degree of judgment, particularly where the matters involve indeterminate claims for monetary damages, may involve discretionary amounts, present novel legal theories, are in the early stages of the proceedings, or are subject to appeal. Whether any losses, damages or remedies ultimately resulting from such matters could reasonably have a material effect on the Company's business, financial condition, results of operation, or cash flows will depend on a number of variables, including, for example, the timing and amount of such losses or damages (if any) and the structure and type of any such remedies. The Company's management does not presently expect any of the current litigation matters to have a material adverse impact on the consolidated financial statements of the Company.
8. STOCK-BASED COMPENSATION (in thousands, except share and per share amounts, years, and percentages)
Stock Options
On December 31, 2006, the Company and its stockholders established the 2007 Long-Term Incentive Plan, or Plan, under which the Company's Board of Directors, at its discretion, can grant stock options to employees and certain directors of the Company. During 2009, the Plan was amended and currently authorizes the grant of stock options or other equity instruments for up to 10,275,000 shares of common stock. The stock options granted under the Plan generally expire at the earlier of a specified period after termination of service or the date specified by the Board of Directors at the date of grant, but not more than ten years from such grant date. Stock issued as a result of exercised stock options will be issued from the Company's authorized available stock. Effective June 5, 2012, the 2007 Long-Term Incentive Plan changed its name to the Inovalon, Inc. 2007 Long-Term Incentive Plan. Options granted under the Plan may be incentive stock options or non-qualified stock options under the applicable provisions of the Internal Revenue Code.
The Company selected the Black-Scholes option-pricing model as the most appropriate model for determining the estimated fair value for stock-based awards. The Black-Scholes option-pricing model requires the use of estimates, including the fair market value of the Company's common stock, expected stock price volatility, expected term, estimated forfeitures and the risk free- interest rate. The fair value of stock option awards is amortized on a straight-line basis over the requisite service period of the awards, which is generally the vesting period. The amount of stock-based compensation expense recognized is based on the estimated portion of the awards that are expected to vest. Actual and anticipated forfeiture rates were applied in the expense calculation.
Determining the fair value of the Company's common stock requires complex and subjective judgment and estimates. There is inherent uncertainty in making these judgments and estimates. Since the Company's share price is not publicly quoted and lacks an active trading market, the Company's Compensation Committee was required to estimate the fair value of the common stock at each meeting at which options were granted based on factors including, but not limited to, contemporaneous valuations of the Company's common stock performed by an unrelated third-party specialist, the lack of marketability of the Company's common stock, developments in
F-24
Inovalon Holdings, Inc.
Notes to Consolidated Financial Statements (Continued)
8. STOCK-BASED COMPENSATION (in thousands, except share and per share amounts, years, and percentages) (Continued)
the business, share repurchase arrangements, the status of the Company's development and sales efforts, revenue growth, valuations of comparable companies, and additional objective and subjective factors relating to the Company's business. The fair value of the underlying common stock will be determined by the Company's Compensation Committee until such time as the Company's common stock is listed on an established stock exchange.
The fair value of each option grant is estimated on the date of grant applying the Black-Scholes option pricing model using the following assumptions:
| |
December 31, | September 30, | ||||||||||||||
|---|---|---|---|---|---|---|---|---|---|---|---|---|---|---|---|---|
| |
2011
|
2012
|
2013
|
2013
|
2014
|
|||||||||||
| |
|
|
|
(unaudited) |
||||||||||||
Expected stock price volatility |
42.0% | 43.3% | 41.5% | 41.4% | 42.3% | |||||||||||
Expected term |
6.5 Years | 6.5 Years | 6.5 Years | 6.5 Years | 6.5 Years | |||||||||||
Expected dividend yield |
— | — | — | — | — | |||||||||||
Risk-free interest rate |
2.8% | 1.1% | 2.3% | 1.9% | 2.2% | |||||||||||
Weighted-average fair value of underlying common stock |
$ | 6.59 | $ | 6.30 | $ | 6.90 | $ | 6.80 | $ | 7.58 | ||||||
Expected volatility was calculated as of each grant date based on reported data for several unrelated public companies within the Company's industry that are considered to be comparable to the Company and for which historical information was available. The average expected term was determined under the simplified calculation as provided by the Securities and Exchange Commission's Staff Accounting Bulletin No. 107, Share-Based Payment, which is the mid-point between the vesting date and the end of the contractual term. The dividend yield assumption of zero is based upon the fact that the Company does not have a formal dividend payment policy, the Company does not intend to continue to pay cash dividends on its common stock in the future, and, to the extent the Company pays dividends in the future, there is no assurance that any such dividends will be comparable to those previously declared. Any declarations of dividends and the establishment of future record and payment dates are subject to the final determination of the Company's Board of Directors. The risk-free interest rate is determined by reference to the U.S. Treasury yield curve rates with the remaining term commensurate with the expected life assumed at the date of grant. Forfeitures are estimated based on historical experience and adjustments are made annually to reflect actual forfeiture experience.
F-25
Inovalon Holdings, Inc.
Notes to Consolidated Financial Statements (Continued)
8. STOCK-BASED COMPENSATION (in thousands, except share and per share amounts, years, and percentages) (Continued)
Activity under the Plan is as follows:
| |
Shares Available for Grant |
Number of Shares Outstanding |
Weighted- Average Exercise Price |
Weighted- Average Remaining Contractual Life (in years) |
Aggregate Intrinsic Value |
|||||||||||
|---|---|---|---|---|---|---|---|---|---|---|---|---|---|---|---|---|
Balance at January 1, 2011 |
1,976,080 | 7,490,285 | 6.18 | 8.4 | $ | 12,367 | ||||||||||
Stock options granted |
(1,609,340 | ) | 1,609,340 | 6.59 | ||||||||||||
Stock options exercised |
— | (159,450 | ) | 0.75 | ||||||||||||
Stock options cancelled |
1,969,570 | (1,969,570 | ) | 8.00 | ||||||||||||
| | | | | | | | | | | | | | | | | |
Balance at December 31, 2011 |
2,336,310 | 6,970,605 | 5.97 | 7.0 | 7,551 | |||||||||||
Stock options granted |
(1,247,615 | ) | 1,247,615 | 6.30 | ||||||||||||
Stock options exercised |
— | (5,500 | ) | 1.71 | ||||||||||||
Stock options cancelled |
1,824,680 | (1,824,680 | ) | 7.34 | ||||||||||||
| | | | | | | | | | | | | | | | | |
Balance at December 31, 2012 |
2,913,375 | 6,388,040 | 5.63 | 6.2 | 14,557 | |||||||||||
Stock options granted |
(1,246,985 | ) | 1,246,985 | 6.90 | ||||||||||||
Stock options exercised |
— | (258,955 | ) | 1.04 | ||||||||||||
Stock options cancelled |
1,466,535 | (1,466,535 | ) | 7.29 | ||||||||||||
| | | | | | | | | | | | | | | | | |
Balance at December 31, 2013 |
3,132,925 | 5,909,535 | 5.69 | 5.7 | 10,471 | |||||||||||
Stock options granted (unaudited) |
(1,644,720 | ) | 1,644,720 | 7.58 | ||||||||||||
Stock options exercised (unaudited) |
— | (186,970 | ) | 3.85 | ||||||||||||
Stock options cancelled (unaudited) |
916,010 | (916,010 | ) | 7.45 | ||||||||||||
| | | | | | | | | | | | | | | | | |
Balance at September 30, 2014 (unaudited) |
2,404,215 | 6,451,275 | 5.97 | 6.0 | 107,281 | |||||||||||
| | | | | | | | | | | | | | | | | |
Exercisable at December 31, 2013 |
3,898,890 | 5.03 | 4.3 | 9,798 | ||||||||||||
Vested and expected to vest at December 31, 2013 |
5,185,700 | 5.51 | 5.3 | 10,229 | ||||||||||||
Exercisable at September 30, 2014 (unaudited) |
3,765,985 | 5.06 | 3.8 | 66,066 | ||||||||||||
Vested and expected to vest at September 30, 2014 (unaudited) |
5,484,570 | 5.75 | 5.5 | 92,443 | ||||||||||||
The total grant-date fair value of stock options granted during the years ended December 31, 2011, 2012 and 2013 and the nine month period ending September 30, 2014 was $4,609, $3,321, $3,661, and $5,766, respectively. The weighted average grant-date fair value of stock options granted during the years ended December 31, 2011, 2012, 2013 and the nine month period ended September 30, 2014 was $2.86 per share, $2.66 per share, $2.94 per share, and $3.51 per share, respectively.
Total stock-based compensation expense recorded in general and administrative expenses for the years ended December 31, 2011, 2012, 2013 and for the nine month periods ended September 30, 2013 and 2014 was $3,687, $2,560, $1,842, $1,408, and $1,340, respectively. As of December 31, 2013, there is $5,521 of total unrecognized compensation expense related to
F-26
Inovalon Holdings, Inc.
Notes to Consolidated Financial Statements (Continued)
8. STOCK-BASED COMPENSATION (in thousands, except share and per share amounts, years, and percentages) (Continued)
unvested stock options, and this expense is expected to be recognized over a weighted-average period of 3.5 years. As of September 30, 2014, there is $8,498 of total unrecognized compensation expense related to unvested stock options, and this expense is expected to be recognized over a weighted-average period of 4.0 years.
The aggregate intrinsic value in the table above represents the total intrinsic value (the difference between the fair value of the Company's common stock and the exercise price, multiplied by the number of in-the-money options) that would have been received by the option holders had all option holders exercised their options. This amount is subject to change based on changes to the fair market value of the Company's common stock.
9. EMPLOYEE BENEFIT PLAN (in thousands)
On June 1, 2007, the Company adopted a 401(k) Profit Sharing Plan and Trust, or 401(k) Plan. The 401(k) Plan was amended on February 1, 2010. The amended 401(k) Plan allows employees to become eligible to participate upon the completion of 30 days of service. The Company matches employee contributions up to 4.0% of their compensation and the employer contributions vest immediately. During the years ended December 31, 2011, 2012 and 2013 and the nine month periods ended September 30, 2013 and 2014, total expense recorded for the Company's matching 401(k) contributions were $1,847, $2,254, $2,846, $2,233, and $2,186, respectively.
10. STOCKHOLDERS' EQUITY (DEFICIT) (in thousands, except share amounts)
In February 2013, to provide liquidity to certain existing stockholders who desired liquidity and to reduce the number of stockholders and outstanding shares of common stock, the Company initiated a share repurchase and liquidity initiative for and among existing stockholders. During 2013, the Company repurchased 10,703,360 shares of common stock for aggregate consideration of $72,114 and sold 7,216,610 shares of common stock for $52,114, resulting in a net repurchase of 3,486,750 treasury stock shares at an aggregate net cost of $20,000. Upon repurchase, the treasury stock shares were immediately retired. In connection with the retirement, of the $20,000 value assigned to the treasury stock shares, $2,403 was allocated to additional paid-in capital and $17,597 was allocated to retained earnings. The amount allocated to additional paid-in capital was determined based on the paid-in capital per share generated from the historical issuances of these treasury stock shares.
During June 2014, the Company repurchased 1,462,320 shares at a cost of $9,066. Upon repurchase, the shares were immediately retired. In connection with the retirement, of the $9,066 value assigned to the repurchased shares, $1,011 was allocated to additional paid-in capital and $8,055 was allocated to retained earnings. The amount allocated to additional paid-in capital was determined based on the paid-in capital per share generated from the historical issuances of these shares.
On September 16, 2014, in connection with the holding company reorganization, the Company's common stock was reclassified to implement a multi-class capital structure providing for common stock, Class A common stock and Class B common stock. Each share of common stock
F-27
Inovalon Holdings, Inc.
Notes to Consolidated Financial Statements (Continued)
10. STOCKHOLDERS' EQUITY (DEFICIT) (in thousands, except share amounts) (Continued)
held by the then-existing stockholders of Inovalon, Inc. at the time of the holding company reorganization was reclassified as Class B common stock of the Company.
On September 19, 2014, the Company authorized the pro-rata redemption of approximately 8.33% of the Company's outstanding Class B common stock from the then-existing holders. During September 2014, the Company completed the pro-rata redemption and repurchased 11,109,285 shares of Class B common stock for $300,000, which automatically converted from Class B common stock to Class A common stock. At September 30, 2014, these repurchased 11,109,285 Class A common stock shares were held as treasury shares by the Company.
11. INCOME TAXES (in thousands, except percentages)
The provision for income taxes consisted of the following:
| |
Year Ended December 31, | |||||||||
|---|---|---|---|---|---|---|---|---|---|---|
| |
2011
|
2012
|
2013
|
|||||||
Current: |
||||||||||
Federal |
$ | 13,365 | $ | 28,749 | $ | 16,254 | ||||
State |
1,784 | 5,818 | 3,443 | |||||||
Foreign (Puerto Rico) |
— | — | 293 | |||||||
| | | | | | | | | | | |
Total current provision |
15,149 | 34,567 | 19,990 | |||||||
| | | | | | | | | | | |
Deferred: |
||||||||||
Federal |
613 | 437 | (347 | ) | ||||||
State |
229 | 958 | 14 | |||||||
| | | | | | | | | | | |
Total deferred provision |
842 | 1,395 | (333 | ) | ||||||
| | | | | | | | | | | |
Total provision for income taxes |
$ | 15,991 | $ | 35,962 | $ | 19,657 | ||||
| | | | | | | | | | | |
| | | | | | | | | | | |
The provision for income taxes reconciles to the amount computed by applying the federal statutory rate (35.0%) to income before income taxes as follows:
| |
Year Ended December 31, | ||||||||||||||||||
|---|---|---|---|---|---|---|---|---|---|---|---|---|---|---|---|---|---|---|---|
| |
2011
|
2012
|
2013
|
||||||||||||||||
Expected federal income tax |
35.0 | % | $ | 14,322 | 35.0 | % | $ | 31,891 | 35.0 | % | $ | 18,331 | |||||||
State income taxes, net of federal income tax effect |
4.2 | 1,721 | 4.5 | 4,092 | 3.9 | 2,047 | |||||||||||||
Permanent items |
1.5 | 597 | 0.4 | 368 | 0.5 | 237 | |||||||||||||
Research and development tax credits |
— | — | (0.3 | ) | (293 | ) | (1.4 | ) | (744 | ) | |||||||||
Other |
(1.6 | ) | (649 | ) | (0.1 | ) | (96 | ) | (0.5 | ) | (214 | ) | |||||||
| | | | | | | | | | | | | | | | | | | | |
Income tax expense |
39.1 | % | $ | 15,991 | 39.5 | % | $ | 35,962 | 37.5 | % | $ | 19,657 | |||||||
| | | | | | | | | | | | | | | | | | | | |
| | | | | | | | | | | | | | | | | | | | |
Deferred income taxes reflect the net tax effects of temporary differences between the carrying amounts of assets and liabilities for financial reporting purposes and the amounts used for income
F-28
Inovalon Holdings, Inc.
Notes to Consolidated Financial Statements (Continued)
11. INCOME TAXES (in thousands, except percentages) (Continued)
tax purposes. Significant components of the Company's deferred tax assets and liabilities were as follows:
| |
December 31, | ||||||
|---|---|---|---|---|---|---|---|
| |
2012
|
2013
|
|||||
Components of deferred tax assets and liabilities |
|||||||
Deferred tax assets: |
|||||||
Accrued expenses and reserves |
$ | 257 | $ | 830 | |||
Stock-based compensation |
2,466 | 2,565 | |||||
Deferred rent |
692 | 1,385 | |||||
Other |
— | 45 | |||||
| | | | | | | | |
Total deferred tax assets |
$ | 3,415 | $ | 4,825 | |||
| | | | | | | | |
Deferred tax liabilities: |
|||||||
Intangibles |
$ | 6,000 | $ | 4,619 | |||
Property, equipment and capitalized software |
9,490 | 12,318 | |||||
Prepaids and other |
438 | 430 | |||||
| | | | | | | | |
Total deferred tax liabilities |
$ | 15,928 | $ | 17,367 | |||
| | | | | | | | |
| | | | | | | | |
In 2012, the Company recognized tax benefit of $293 related to the impact of the research and development, or R&D, tax credit for the tax year ended December 31, 2011. On January 2, 2013, the American Taxpayer Relief Act of 2012 was signed into law, which retroactively reinstated the R&D tax credit for two years, from January 1, 2012 through December 31, 2013. The financial impacts of tax law changes are recognized in the period in which new legislation is enacted. Accordingly, in 2013 the Company recognized a retroactive benefit of $409 for the U.S. R&D tax credit for the tax year ended December 31, 2012.
Uncertain Tax Positions — During the years ended December 31, 2011, 2012, and 2013, changes in the liability for gross unrecognized tax benefits, including interest, totaled $336, $12, and $48, respectively. At December 31, 2012 and 2013, the Company had a total liability for unrecognized tax benefits, including interest and penalties, of $48 and $0, respectively, which is recorded in other liabilities and other current liabilities on the Company's consolidated balance sheet.
While the Company believes it has adequately provided for all tax positions, amounts asserted by taxing authorities could differ from the Company's accrued position. Accordingly, additional provisions on federal, state and foreign tax-related matters could be recorded in the future as revised estimates are made or the underlying matters are settled or otherwise resolved.
The Company is subject to taxation in the U.S. and various state and foreign jurisdictions. The number of years with open tax audits varies depending on the tax jurisdiction.
12. SUBSEQUENT EVENTS
The Company has evaluated subsequent events through October 10, 2014, the date that the consolidated financial statements were issued, and January 25, 2015, the date on which the
F-29
Inovalon Holdings, Inc.
Notes to Consolidated Financial Statements (Continued)
12. SUBSEQUENT EVENTS (Continued)
retrospectively revised consolidated financial statements were issued (as to the effects of the stock split described in Note 1). Other than events discussed below, no other events occurred through those dates, which required disclosure.
Holding Company Reorganization
On September 17, 2014, Inovalon, Inc. implemented a holding company reorganization, pursuant to which the Company became the new parent company of Inovalon, Inc. and Inovalon, Inc. became the direct, wholly owned subsidiary of the Company. As a result of the holding company reorganization, each share of Inovalon, Inc. that was issued and outstanding automatically converted into one share of common stock of the Company.
Multi-Class Structure
On September 19, 2014, in connection with the holding company reorganization, the Company's common stock was reclassified to implement a multi-class capital structure providing for common stock, Class A common stock and Class B common stock. Each share of common stock held by the existing stockholders of Inovalon, Inc. at the time of the holding company reorganization was reclassified as Class B common stock. As discussed in Notes 1 and 3, the holding company reorganization is retrospectively presented in the consolidated financial statements.
Credit Agreement
On September 19, 2014, the Company entered into a Credit and Guaranty Agreement, or Agreement, with a group of lenders with Goldman Sachs Bank USA, as administrative agent, to provide credit facilities in the aggregate maximum principal amount of $400 million, consisting of a senior unsecured term loan facility in the original principal amount of $300 million, the Term Loan Facility, and a senior unsecured revolving credit facility in the maximum principal amount of $100 million, together with the Term Loan Facility, the Credit Facilities. The Term Loan Facility was utilized to repurchase $300 million of the Company's outstanding Class B common stock, as described below. The obligations under the Credit Facilities are guaranteed by the Company's domestic, wholly owned subsidiaries.
Partial Redemption of Class B Common Stock
On September 19, 2014, the Company announced that approximately 8.33% of the Company's outstanding Class B common stock will be redeemed on a pro rata basis among the then-existing holders of Class B common stock at a redemption price equal to $27.01 per share for an aggregate redemption amount of approximately $300 million. The pro-rata stock redemption was completed prior to September 30, 2014.
Stock Split and Change to Authorized Common Equity Capital
On January 14, 2015, the Company's board of directors approved a five-for-one stock split of the Company's Class A common stock and Class B common stock. Effective January 16, 2015 the Company amended its certificate of incorporation to give effect to the stock split and to change the Company's authorized common equity capital to 900,000,000 shares of common stock,
F-30
Inovalon Holdings, Inc.
Notes to Consolidated Financial Statements (Continued)
12. SUBSEQUENT EVENTS (Continued)
750,000,000 shares of Class A common stock, and 150,000,000 shares of Class B common stock, par value $0.000005 per share. All share data included in these financial statements give retroactive effect to the stock split and related amendment to the Company's certificate of incorporation.
13. SUBSEQUENT EVENTS (UNAUDITED)
The Company has evaluated subsequent events through January 12, 2015, the date that the unaudited interim consolidated financial statements were issued, and January 25, 2015, the date on which the retrospectively revised unaudited interim consolidated financial statements were issued (as to the effects of the stock split described in Note 1 and Note 12). Other than events discussed below, no other events occurred through those dates which required disclosure.
On November 13, 2014, the Compensation Committee granted 488,780 restricted stock units ("RSUs") pursuant to the Company's Plan. RSUs are share awards that, upon vesting, will deliver to the holder shares of the Company's Class B common stock under the Plan. The awards granted vest over five years on the later of each annual anniversary of the award grant date and the earlier of an initial public offering or certain change of control events. Pursuant to the terms of the awards, the shares not vested terminate upon the RSU holders separation from the Company.
The RSUs have a grant date fair value of $9,722. The Company estimated the fair value of these awards using a Black-Scholes put-option valuation model resulting in the fair value of $19.89 per RSU. Pursuant to the terms of the awards, there was no vesting and no expense recognition during 2014.
* * * * *
F-31
INOVALON HOLDINGS, INC.
Schedule II
Valuation and Qualifying Accounts and Reserves
(in thousands)
Description
|
Balance at Beginning of Year |
Additions Charged Against Revenue |
Additions Charged to Cost and Expense |
Deductions
|
Balance at End of Year |
|||||||||||
|---|---|---|---|---|---|---|---|---|---|---|---|---|---|---|---|---|
|
Year Ended December 31, 2013 | |||||||||||||||
Allowance for accounts receivable |
$ | 451 | $ | 2,711 | $ | — | $ | (1,678 | ) | $ | 1,484 | |||||
|
Year Ended December 31, 2012 |
|||||||||||||||
Allowance for accounts receivable |
$ | 1,402 | $ | 1,297 | $ | 45 | $ | (2,293 | ) | $ | 451 | |||||
|
Year Ended December 31, 2011 |
|||||||||||||||
Allowance for accounts receivable |
$ | 1,643 | $ | 986 | $ | (240 | ) | $ | (987 | ) | $ | 1,402 | ||||
F-32

PART II
INFORMATION NOT REQUIRED IN PROSPECTUS
Item 13. Other Expenses of Issuance and Distribution.
The following table sets forth all costs and expenses, other than underwriting discounts and commissions, paid or payable by us in connection with the sale of the Class A common stock being registered. All amounts shown are estimates except for the SEC registration fee, the Financial Industry Regulatory Authority, or FINRA, filing fee and the NASDAQ Global Select Market listing fee:
| |
Amount Paid or to Be Paid |
|||
|---|---|---|---|---|
SEC registration fee |
$ | 71,269 | ||
FINRA filing fee |
100,167 | |||
NASDAQ Global Select Market listing fee |
150,000 | |||
Blue sky qualification fees and expenses |
— | |||
Printing and engraving expenses |
300,000 | |||
Legal fees and expenses |
2,600,000 | |||
Accounting fees and expenses |
1,300,000 | |||
Transfer agent and registrar fees and expenses |
60,000 | |||
Miscellaneous expenses |
418,564 | |||
| | | | | |
Total |
$ | 5,000,000 | ||
| | | | | |
| | | | | |
Item 14. Indemnification of Directors and Officers.
Section 145 of the Delaware General Corporation Law authorizes a court to award, or a corporation's board of directors to grant, indemnity to directors and officers under certain circumstances and subject to certain limitations. The terms of Section 145 of the Delaware General Corporation Law are sufficiently broad to permit indemnification under certain circumstances for liabilities, including reimbursement of expenses incurred, arising under the Securities Act.
As permitted by the Delaware General Corporation Law, the Registrant's restated certificate of incorporation to be effective upon the closing of this offering contains provisions that eliminate the personal liability of its directors for monetary damages for any breach of fiduciary duties as a director, except liability for the following:
- •
- any breach of the director's duty of loyalty to the Registrant or its stockholders;
- •
- acts or omissions not in good faith or that involve intentional misconduct or a knowing violation of law;
- •
- under Section 174 of the Delaware General Corporation Law (regarding unlawful dividends and stock purchases); or
- •
- any transaction from which the director derived an improper personal benefit.
As permitted by the Delaware General Corporation Law, the Registrant's restated bylaws to be effective upon the closing of this offering, provide that:
- •
- the Registrant is required to indemnify its directors and executive officers to the fullest extent permitted by the
Delaware General Corporation Law, subject to very limited exceptions;
- •
- the Registrant may indemnify its other employees and agents as set forth in the Delaware General Corporation Law;
II-1
- •
- the Registrant is required to advance expenses, as incurred, to its directors and executive officers in connection with a
legal proceeding to the fullest extent permitted by the Delaware General Corporation Law, subject to very limited exceptions; and
- •
- the rights conferred in the bylaws are not exclusive.
Prior to the closing of this offering, the Registrant has entered into indemnification agreements with each of its current directors and executive officers to provide these directors and executive officers additional contractual assurances regarding the scope of the indemnification set forth in the Registrant's restated certificate of incorporation and restated bylaws and to provide additional procedural protections. There is no pending litigation or proceeding involving a director or executive officer of the Registrant for which indemnification is sought. Reference is also made to Section 9 of the underwriting agreement to be filed as Exhibit 1.1 to this registration statement, which provides for the indemnification of executive officers, directors and controlling persons of the Registrant against certain liabilities. The indemnification provisions in the Registrant's restated certificate of incorporation, restated bylaws and the indemnification agreements entered into or to be entered into between the Registrant and each of its directors and executive officers may be sufficiently broad to permit indemnification of the Registrant's directors and executive officers for liabilities arising under the Securities Act.
The Registrant currently carries liability insurance for its directors and officers.
Item 15. Recent Sales of Unregistered Securities.
In the three years preceding the filing of this registration statement, we have issued the following securities that were not registered under the Securities Act:
From November 1, 2011 to November 13, 2014, we granted stock options to purchase an aggregate of 3,932,525 shares of our Class B common stock to directors, officers, and employees with per share exercise prices ranging from $6.30 to $7.89 under our Pre-IPO Plan. The sales of securities described above were deemed to be exempt from registration under the Securities Act in reliance upon Rule 701 promulgated under Section 3(b) of the Securities Act in that they were offered and sold either pursuant to written compensatory plans or pursuant to a written contract relating to compensation, as provided by Rule 701. All recipients have received the disclosure required under Rule 701.
In February 2013, we sold an aggregate of 7,216,660 to six accredited investors at $7.22 per share in a transaction deemed to be exempt from registration under the Securities Act in reliance upon Section 4(a)(2) of the Securities Act.
In November 2014, we granted an aggregate of 488,780 restricted stock units to employees under our Pre-IPO Plan. The sales of securities described above were deemed to be exempt from registration under the Securities Act in reliance upon Rule 701 promulgated under Section 3(b) of the Securities Act in that they were offered and sold either pursuant to written compensatory plans or pursuant to a written contract relating to compensation, as provided by Rule 701. All recipients have received the disclosure required under Rule 701.
None of the foregoing transactions involved any underwriters, underwriting discounts or commissions, or any public offering, and the Registrant believes each transaction was exempt from the registration requirements of the Securities Act as stated above. All recipients of the foregoing transactions either received adequate information about the Registrant or had access, through their relationships with the Registrant, to such information. Furthermore, the Registrant affixed appropriate legends to the share certificates and instruments issued in each foregoing transaction setting forth that the securities had not been registered and the applicable restrictions on transfer.
II-2
Item 16. Exhibits and Financial Statement Schedules.
(a) Exhibits.
The list of exhibits filed with or incorporated by reference in this Registration Statement is set forth in the Exhibit Index following the signature page herein.
(b) Financial Statement Schedules.
All financial statement schedules are omitted because they are not applicable or the information is included in the Registrant's consolidated financial statements or related notes.
The undersigned Registrant hereby undertakes to provide to the underwriters at the closing specified in the underwriting agreement certificates in such denominations and registered in such names as required by the underwriters to permit prompt delivery to each purchaser.
Insofar as indemnification for liabilities arising under the Securities Act may be permitted to directors, officers and controlling persons of the registrant pursuant to the foregoing provisions, or otherwise, the registrant has been advised that in the opinion of the Securities and Exchange Commission such indemnification is against public policy as expressed in the Securities Act and is, therefore, unenforceable. In the event that a claim for indemnification against such liabilities (other than the payment by the registrant of expenses incurred or paid by a director, officer or controlling person of the registrant in the successful defense of any action, suit or proceeding) is asserted by such director, officer or controlling person in connection with the securities being registered, the registrant will, unless in the opinion of its counsel the matter has been settled by controlling precedent, submit to a court of appropriate jurisdiction the question whether such indemnification by it is against public policy as expressed in the Securities Act and will be governed by the final adjudication of such issue.
The undersigned Registrant hereby undertakes that:
(1) For purposes of determining any liability under the Securities Act, the information omitted from the form of prospectus filed as part of this registration statement in reliance upon Rule 430A and contained in a form of prospectus filed by the registrant pursuant to Rule 424(b)(1) or (4) or 497(h) under the Securities Act shall be deemed to be part of this registration statement as of the time it was declared effective.
(2) For the purpose of determining any liability under the Securities Act, each post-effective amendment that contains a form of prospectus shall be deemed to be a new registration statement relating to the securities offered therein, and the offering of such securities at that time shall be deemed to be the initial bona fide offering thereof.
II-3
Pursuant to the requirements of the Securities Act of 1933, the Registrant has duly caused this Registration Statement to be signed on its behalf by the undersigned, thereunto duly authorized, in the City of Bowie, State of Maryland, on this 10th day of February, 2015.
| Inovalon Holdings, Inc. | ||||
By: |
/s/ KEITH R. DUNLEAVY, M.D. Keith R. Dunleavy, M.D. Chief Executive Officer and Chairman |
|||
Pursuant to the requirements of the Securities Act of 1933, this registration statement has been signed by the following persons in the capacities and on the dates indicated.
Name
|
Capacity
|
Date
|
||||
|---|---|---|---|---|---|---|
| /s/ KEITH R. DUNLEAVY, M.D. Keith R. Dunleavy, M.D. |
Chief Executive Officer and Chairman (Principal Executive Officer) | February 10, 2015 | ||||
/s/ THOMAS R. KLOSTER Thomas R. Kloster |
Chief Financial Officer (Principal Financial Officer and Principal Accounting Officer) |
February 10, 2015 |
||||
* Denise K. Fletcher |
Director |
February 10, 2015 |
||||
* André S. Hoffmann |
Director |
February 10, 2015 |
||||
* Lee D. Roberts |
Director |
February 10, 2015 |
||||
* William J. Teuber Jr. |
Director |
February 10, 2015 |
||||
| *By: | /s/ KEITH R. DUNLEAVY, M.D. Keith R. Dunleavy, M.D. Attorney-in-Fact |
Exhibit Number |
Description of Document
|
|
|---|---|---|
| 1.1** | Form of Underwriting Agreement. | |
3.1** |
Second Amended and Restated Certificate of Incorporation. |
|
3.2** |
Second Amended and Restated Bylaws. |
|
5.1** |
Opinion of Morrison & Foerster LLP. |
|
10.1** |
Form of Indemnification Agreement. |
|
10.2** |
Inovalon, Inc. Amended and Restated Long-term Incentive Plan (as amended on October 7, 2010), as assumed by Inovalon Holdings, Inc. |
|
10.3** |
Form of Stock Option Agreement under the Amended and Restated Long-term Incentive Plan (as amended on October 7, 2010), as assumed by Inovalon Holdings, Inc. |
|
10.4** |
Form of Restricted Stock Units Agreement under the Amended and Restated Long-term Incentive Plan (as amended on October 7, 2010), as assumed by Inovalon Holdings, Inc. |
|
10.5** |
2015 Omnibus Incentive Plan. |
|
10.6** |
Form of Stock Option Award under the 2015 Omnibus Incentive Plan. |
|
10.7** |
Form of Restricted Stock Award under the 2015 Omnibus Incentive Plan. |
|
10.8** |
Form of Restricted Stock Unit Award under the 2015 Omnibus Incentive Plan. |
|
10.9** |
Form of Stock Option Award under the 2015 Omnibus Incentive Plan (Section 16 Grantees). |
|
10.10** |
Form of Restricted Stock Award under the 2015 Omnibus Incentive Plan (Section 16 Grantees). |
|
10.11** |
Form of Restricted Stock Unit Award under the 2015 Omnibus Incentive Plan (Section 16 Grantees). |
|
10.12** |
Employee Stock Purchase Plan. |
|
10.13** |
Shareholders Voting Agreement, dated as of September 15, 2008, by and among Inovalon Holdings, Inc. and those persons identified on Exhibit A thereto. |
|
10.14** |
Credit and Guaranty Agreement, dated as September 19, 2014 by and among Inovalon Holdings, Inc., certain subsidiaries of Inovalon Holdings, Inc., as guarantors, various lenders, Goldman Sachs Bank USA, as joint lead arranger and joint lead bookrunner, and Goldman Sachs Bank USA, as administrative agent. |
|
10.15** |
Second Amended and Restated Stockholders Rights Agreement, dated as of September 15, 2014, by and among Inovalon Holdings, Inc. and certain of its stockholders. |
|
10.16** |
Amended and Restated Employment Agreement, dated December 3, 2014, by and between Inovalon, Inc. and Dr. Keith R. Dunleavy. |
|
10.17** |
Amended and Restated Employment Agreement, dated December 3, 2014, by and between Inovalon, Inc. and Robert A. Wychulis. |
|
10.18** |
Amended and Restated Employment Agreement, dated December 3, 2014, by and between Inovalon, Inc. and Thomas R. Kloster. |
|
10.19** |
Amended and Restated Employment Agreement, dated December 3, 2014, by and between Inovalon, Inc. and Christopher E. Greiner. |
Exhibit Number |
Description of Document
|
|
|---|---|---|
| 10.20** | Amended and Restated Employment Agreement, dated December 3, 2014, by and between Inovalon, Inc. and Daniel L. Rizzo. | |
10.21** |
Amended and Restated Employment Agreement, dated December 3, 2014, by and between Inovalon, Inc. and Jason Z. Rose. |
|
10.22** |
Amended and Restated Employment Agreement, dated December 3, 2014, by and between Inovalon, Inc. and Joseph R. Rostock. |
|
10.23** |
Amended and Restated Employment Agreement, dated December 3, 2014, by and between Inovalon, Inc. and Shauna Vernal. |
|
21.1** |
Subsidiaries of the Registrant. |
|
23.1* |
Consent of Deloitte & Touche LLP. |
|
23.2** |
Consent of Morrison & Foerster LLP (included in Exhibit 5.1). |
|
24.1** |
Power of Attorney (included on signature page). |
- *
- Filed
herewith.
- **
- Previously filed.