Attached files
| file | filename |
|---|---|
| EXCEL - IDEA: XBRL DOCUMENT - Green Plains Inc. | Financial_Report.xls |
| EX-23.1 - EX-23.1 - Green Plains Inc. | gpre-20141231ex231e5bf97.htm |
| EX-31.2 - EX-31.2 - Green Plains Inc. | gpre-20141231ex31282c5f3.htm |
| EX-32.1 - EX-32.1 - Green Plains Inc. | gpre-20141231ex321313e7b.htm |
| EX-31.1 - EX-31.1 - Green Plains Inc. | gpre-20141231ex311159b57.htm |
| EX-21.1 - EX-21.1 - Green Plains Inc. | gpre-20141231ex21188b912.htm |
| EX-32.2 - EX-32.2 - Green Plains Inc. | gpre-20141231ex322755b1b.htm |
UNITED STATES SECURITIES AND EXCHANGE COMMISSION
Washington, D.C. 20549
FORM 10-K
☒ ANNUAL REPORT PURSUANT TO SECTION 13 OR 15(D) OF THE SECURITIES EXCHANGE ACT OF 1934
For the fiscal year ended December 31, 2014
or
☐ TRANSITION REPORT PURSUANT TO SECTION 13 OR 15(d) OF THE SECURITIES EXCHANGE ACT OF 1934
For the transition period from ____ to _____
Commission file number 001-32924
Green Plains Inc.
(Exact name of registrant as specified in its charter)
|
Iowa |
84-1652107 |
|
(State or other jurisdiction of incorporation or organization) |
(I.R.S. Employer Identification No.) |
|
|
|
|
450 Regency Parkway, Suite 400, Omaha, NE 68114 |
(402) 884-8700 |
|
(Address of principal executive offices, including zip code) |
(Registrant’s telephone number, including area code) |
Securities registered pursuant to Section 12(b) of the Act: Common Stock, $.001 par value
Name of exchanges on which registered: NASDAQ Stock Market
Securities registered pursuant to Section 12(g) of the Act: None
Indicate by check mark if the registrant is a well-known seasoned issuer, as defined in Rule 405 of the Securities Act.
Yes ☐ No ☒
Indicate by check mark if the registrant is not required to file reports pursuant to Section 13 or Section 15(d) of the Act.
Yes ☐ No ☒
Indicate by check mark whether the registrant (1) has filed all reports required to be filed by Section 13 or 15(d) of the Securities Exchange Act of 1934 during the preceding 12 months (or for such shorter period that the registrant was required to file such reports), and (2) has been subject to such filing requirements for the past 90 days. Yes ☒ No ☐
Indicate by check mark whether the registrant has submitted electronically and posted on its corporate Web site, if any, every Interactive Data File required to be submitted and posted pursuant to Rule 405 of Regulation S-T (§232.405 of this chapter) during the preceding 12 months (or for such shorter period that the registrant was required to submit and post such files).
Yes ☒ No ☐
Indicate by check mark if disclosure of delinquent filers pursuant to Item 405 of Regulation S-K is not contained herein, and will not be contained, to the best of registrant’s knowledge, in definitive proxy or information statements incorporated by reference in Part III of this Form 10-K or any amendment to this Form 10-K. ☒.
Indicate by check mark whether the registrant is a large accelerated filer, an accelerated filer, a non-accelerated filer or a smaller reporting company. See definition of “large accelerated filer,” “accelerated filer” and “smaller reporting company” in Rule 12b-2 of the Exchange Act.
Large accelerated filer ☒. Accelerated filer ☐. Non-accelerated filer ☐ Smaller reporting company ☐
Indicate by check mark whether the registrant is a shell company (as defined in Rule 12b-2 of the Act). Yes ☐ No ☒
The aggregate market value of the Company’s voting common stock held by non-affiliates of the registrant as of June 30, 2014 (the last business day of the second quarter), based on the last sale price of the common stock on that date of $32.87, was approximately $1.1 billion. For purposes of this calculation, executive officers, directors and holders of 10% or more of the registrant’s common stock are deemed to be affiliates of the registrant.
As of February 5, 2015, there were 37,608,982 shares of the registrant’s common stock outstanding.
DOCUMENTS INCORPORATED BY REFERENCE
Portions of the registrant’s definitive Proxy Statement for the 2015 Annual Meeting of Shareholders are incorporated by reference in Part III herein. The Company intends to file such Proxy Statement with the Securities and Exchange Commission no later than 120 days after the end of the period covered by this report on Form 10-K.
|
|
TABLE OF CONTENTS
|
|
|
Page |
|
|
PART I |
|
|
|
|
|
|
Item 1. |
1 |
|
|
|
|
|
|
Item 1A. |
16 |
|
|
|
|
|
|
Item 1B. |
32 |
|
|
|
|
|
|
Item 2. |
32 |
|
|
|
|
|
|
Item 3. |
32 |
|
|
|
|
|
|
Item 4. |
32 |
|
|
|
|
|
|
|
PART II |
|
|
|
|
|
|
Item 5. |
33 |
|
|
|
|
|
|
Item 6. |
35 |
|
|
|
|
|
|
Item 7. |
Management’s Discussion and Analysis of Financial Condition and Results of Operations. |
36 |
|
|
|
|
|
Item 7A. |
54 |
|
|
|
|
|
|
Item 8. |
56 |
|
|
|
|
|
|
Item 9. |
Changes in and Disagreements With Accountants on Accounting and Financial Disclosure. |
56 |
|
|
|
|
|
Item 9A. |
56 |
|
|
|
|
|
|
Item 9B. |
59 |
|
|
|
|
|
|
|
PART III |
|
|
|
|
|
|
Item 10. |
59 |
|
|
|
|
|
|
Item 11. |
59 |
|
|
|
|
|
|
Item 12. |
Security Ownership of Certain Beneficial Owners and Management and Related Stockholder Matters. |
59 |
|
|
|
|
|
Item 13. |
Certain Relationships and Related Transactions, and Director Independence. |
59 |
|
|
|
|
|
Item 14. |
59 |
|
|
|
|
|
|
|
PART IV |
|
|
|
|
|
|
Item 15. |
60 |
|
|
|
|
|
|
69 |
||
Cautionary Information Regarding Forward-Looking Statements
The Securities and Exchange Commission, or SEC, encourages companies to disclose forward-looking information so that investors can better understand a company’s future prospects and make informed investment decisions. This report contains such “forward-looking statements” within the meaning of the Private Securities Litigation Reform Act of 1995. These statements may be made directly in this report, and they may also be made a part of this report by reference to other documents filed with the SEC, which is known as “incorporation by reference.”
This report contains forward-looking statements based on current expectations that involve a number of risks and uncertainties. Forward-looking statements generally do not relate strictly to historical or current facts, but rather to plans and objectives for future operations based upon management’s reasonable estimates of future results or trends, and include statements preceded by, followed by, or that include words such as “anticipates,” “believes,” “continue,” “estimates,” “expects,” “intends,” “outlook,” “plans,” “predicts,” “may,” “could,” “should,” “will,” and words and phrases of similar impact, and include, but are not limited to, statements regarding future operating or financial performance, business strategy, business environment, key trends, and benefits of actual or planned acquisitions. In addition, any statements that refer to expectations, projections or other characterizations of future events or circumstances, including any underlying assumptions, are forward-looking statements. The forward-looking statements are made pursuant to safe harbor provisions of the Private Securities Litigation Reform Act of 1995. Although we believe that our expectations regarding future events are based on reasonable assumptions, any or all forward-looking statements in this report may turn out to be incorrect. They may be based on inaccurate assumptions or may not account for known or unknown risks and uncertainties. Consequently, no forward-looking statement is guaranteed, and actual future results may vary materially from the results expressed or implied in our forward-looking statements. The cautionary statements in this report expressly qualify all of our forward-looking statements. In addition, we are not obligated, and do not intend, to update any of our forward-looking statements at any time unless an update is required by applicable securities laws. Factors that could cause actual results to differ from those expressed or implied in the forward-looking statements include, but are not limited to, those discussed in the section entitled “Risk Factors” in this report or in any document incorporated by reference. Specifically, we may experience significant fluctuations in future operating results due to a number of economic conditions, including, but not limited to, competition in the ethanol and other industries in which we operate, commodity market risks, financial market risks, counter-party risks, risks associated with changes to federal policy or regulation, risks related to closing and achieving anticipated results from acquisitions, and other risk factors detailed in our reports filed with the SEC. Actual results may differ from projected results due, but not limited, to unforeseen developments.
In light of these assumptions, risks and uncertainties, the results and events discussed in the forward-looking statements contained in this report or in any document incorporated by reference might not occur. Investors are cautioned not to place undue reliance on the forward-looking statements, which speak only as of the date of this report or the date of the document incorporated by reference in this report. We are not under any obligation, and we expressly disclaim any obligation, to update or alter any forward-looking statements, whether as a result of new information, future events or otherwise.
PART I
Item 1. Business.
Overview
References to “we,” “us,” “our,” “Green Plains,” or the “Company” in this report refer to Green Plains Inc., an Iowa corporation founded in June 2004, and its subsidiaries.
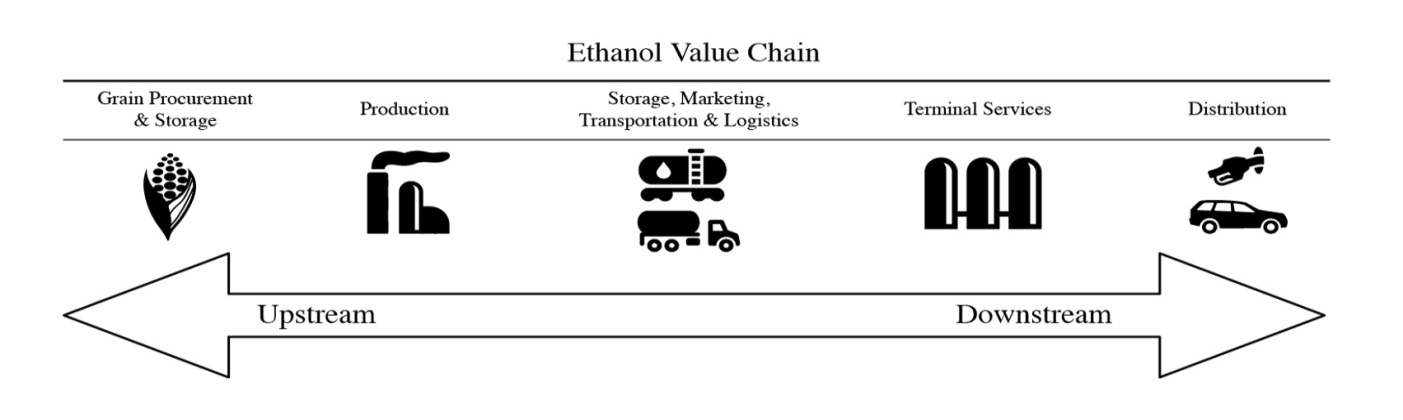
We are a Fortune 1000, vertically-integrated producer, marketer and distributor of ethanol focused on generating stable operating margins through our diversified business segments and our risk management strategy. We believe that owning and operating strategically-located assets throughout the ethanol value chain enables us to mitigate changes in commodity prices and differentiates us from companies focused only on ethanol production. We have operations throughout the ethanol value chain, beginning upstream with our grain handling and storage operations, continuing through our ethanol, distillers grains and corn oil production operations, and ending downstream with our marketing, terminal and distribution services. Following is our visual presentation of the ethanol value chain:
1
Our disciplined risk management strategy is designed to lock in operating margins by forward contracting the primary commodities involved in or derived from ethanol production: corn, natural gas, ethanol, distillers grains and corn oil. We also seek to maintain a safe environment of continuous operational improvement to increase our efficiency and effectiveness as a low-cost producer of ethanol.
We review our operations within the following four separate operating segments:
|
· |
Ethanol Production. We are North America’s fourth largest ethanol producer. We operate twelve ethanol plants in Indiana, Iowa, Michigan, Minnesota, Nebraska and Tennessee. We have the capacity to consume approximately 360 million bushels of corn per year and produce over one billion gallons of ethanol and approximately 2.9 million tons of distillers grains annually. |
|
· |
Corn Oil Production. We operate corn oil extraction systems at our ethanol plants, with the capacity to produce approximately 250 million pounds annually. The corn oil systems are designed to extract non-edible corn oil, a value-added product, from the whole stillage immediately prior to production of distillers grains. Industrial uses for corn oil include feedstock for biodiesel, livestock feed additives, rubber substitutes, rust preventatives, inks, textiles, soaps and insecticides. |
|
· |
Agribusiness. Within our bulk grain business, we have grain storage capacity of approximately 42.2 million bushels. Our cattle feedlot operation has the capacity to support approximately 70,000 head of cattle. We believe our agribusiness operations provide synergies with our ethanol production segment as it supplies a portion of the feedstock and utilizes a portion of the distillers grains output of our ethanol plants. |
|
· |
Marketing and Distribution. Our in-house marketing business is responsible for the sale, marketing and distribution of all ethanol, distillers grains and corn oil produced at our ethanol plants. We also market and provide logistical services for ethanol and other commodities for a third-party producer. We purchase and sell ethanol, distillers grains, corn oil, grain, natural gas and other commodities and participate in other merchant trading activities in various markets. Additionally, we operate eight fuel terminals with approximately 822 million gallons per year, or mmgy, of total throughput capacity in seven south central U.S. states. To optimize the value of our assets, we utilize a portion of our leased railcar fleet to transport crude oil for third parties. |
In June 2014, we acquired the assets of a cattle-feeding business near Kismet, Kansas, which includes a feedlot and grain storage facilities. The operation, which is part of our agribusiness segment, consists of approximately 2,600 acres of land, which has the capacity to support 70,000 head of cattle, and approximately 3.8 million bushels of grain storage capacity.
In June 2013, we acquired an ethanol plant located in Atkinson, Nebraska with the capacity to produce approximately 50 mmgy. We began operations at the ethanol plant early in the third quarter of 2013. Corn oil extraction technology was installed at the plant late in the fourth quarter of 2013. Also, in June 2013, we acquired a grain elevator in Archer, Nebraska. In November 2013, we acquired two ethanol plants, located in Wood River, Nebraska and Fairmont, Minnesota, with combined annual production capacity of approximately 230 mmgy. The Fairmont, Minnesota plant, which was not operational at the time of its acquisition, began operations in January 2014 upon completion of certain maintenance and enhancement projects.
We intend to continue to take a disciplined approach in evaluating new opportunities related to potential acquisition of additional ethanol plants by considering whether the plants meet our design, engineering, valuation and geographic criteria. We believe certain expansion projects could be implemented at our ethanol plants that have the potential to utilize the
2
strategic location and capacity of these assets and cost effectively increase our annual production. In our marketing and distribution segment, our strategy is to build or acquire additional fuel terminals, expand our marketing efforts by entering into new or renewed contracts with other ethanol producers and realize additional profit margins by optimizing our commodity logistics. In 2013, we began to implement a plan to realign our agribusiness operations by adding grain storage capacity located at or near our ethanol plants to take advantage of our current infrastructure and enhance our corn origination and trading capabilities. We intend to continue to add grain storage capacity with the goal of owning approximately 50 million bushels of total storage capacity by the end of 2015. We also intend to pursue opportunities to develop or acquire additional grain elevators, specifically those located near our ethanol plants. We believe that owning additional grain handling and storage operations in close proximity to our ethanol plants enables us to strengthen relationships with local corn producers, allowing us to source corn more effectively and at a lower average cost. We will also consider acquisitions of additional cattle feedlot operations. We also own approximately 63% of BioProcess Algae LLC, which was formed to commercialize advanced photo-bioreactor technologies for growing and harvesting algal biomass.
Our Competitive Strengths
We believe we have created an efficient platform with diversified revenues and income streams. Fundamentally, we focus on managing commodity price risks, improving operating efficiencies and optimizing market opportunities. We believe our competitive strengths include:
Disciplined Risk Management. We believe risk management is a core competency of ours. Our primary focus is to lock in favorable operating margins whenever possible. We do not speculate on general price movements by taking significant unhedged positions on commodities such as corn, ethanol or natural gas. Our comprehensive risk management platform allows us to monitor real-time commodity price risk exposure at each of our plants, and to respond quickly to lock in acceptable margins or to temporarily reduce production levels at our ethanol plants during periods of compressed margins. By using a variety of risk management tools and hedging strategies, including our internally-developed real-time operating margin management system, we believe we are able to maintain a disciplined approach to risk management.
Demonstrated Acquisition and Integration Capabilities. We believe U.S. ethanol production capacity is poised for further consolidation and have demonstrated the ability to make strategic acquisitions that we believe create synergies within our vertically-integrated platform and enhance our ability to mitigate risks. Our balance sheet allows us to be opportunistic in that process. Since our inception, we have acquired or developed twelve ethanol plants in addition to upstream grain handling and storage businesses, a cattle-feeding operation and downstream terminal and distribution services. We installed corn oil extraction technology at each of our ethanol plants to generate incremental returns from this value-added product. We believe such acquisitions, developments and improvements have been successfully integrated into our business and have enhanced our overall returns.
Focus on Operational Excellence. All of our plants are staffed by experienced industry personnel. We focus on continuous incremental operational improvements to enhance overall production efficiencies, and we share operational knowledge across our plants. Using real-time production data and control systems, we continually monitor our plants in an effort to optimize performance. We believe our ability to improve operating efficiencies provides an operating cost advantage over most of our competitors. In turn, we believe we are well positioned to increase operating margins for any facilities that we may acquire in the future.
Leading Vertically-Integrated Ethanol Producer. We believe our operations throughout the ethanol value chain reduce our commodity and operating risks, and increase our pricing visibility and influence in key markets. Combined, we believe our agribusiness, ethanol production, corn oil production, and marketing and distribution segments provide efficiencies across the ethanol value chain, from grain procurement to blending fuel. Our agribusiness operations help to reduce our supply risk by providing grain handling and storage capabilities. Using our logistical capabilities and expertise, we market and distribute ethanol, distillers grains, corn oil and other commodity products. Our corn oil systems are designed to extract non-edible corn oil that has multiple industrial uses. Our fuel terminals allow us to source, store, blend and distribute ethanol and biodiesel across multiple states.
Proven Management Team. Our senior management team averages approximately 25 years of commodity risk management and related industry experience. We have specific expertise across all aspects of the ethanol supply, production, and distribution chain – from agribusiness, to plant operations and management, to commodity markets and risk management, to ethanol marketing and distribution. We believe the level of operational and financial expertise of our management team will prove critical in successfully executing our business strategies.
3
Our Business Strategies
We intend to continue our focus on strengthening and diversifying our vertically-integrated platform by implementing or continuing the following growth strategies:
Pursue Attractive Organic Growth Opportunities. We believe certain expansion projects could be implemented at our ethanol plants that have the potential to utilize the strategic location and capacity of these assets and cost effectively increase our annual production. We also intend to increase the grain storage capacity at our ethanol plants to take advantage of our existing infrastructure as well as strengthen relationships with local corn producers, allowing us to source corn more effectively and at a lower average cost. We intend to pursue opportunities to develop additional grain elevators at or near our ethanol plants. Since all of our plants are located within or near the corn belt where a number of competitors also have ethanol facilities, we believe that owning grain elevators provides us with a competitive advantage in the procurement of corn supplies.
Pursue Accretive Acquisitions and Consolidation Opportunities. We continue to focus on the potential acquisition of additional ethanol plants and grain elevators. In the past several years, we have been approached with opportunities to acquire ethanol plants. We believe those plants were available for a number of reasons including financial distress of a particular facility, a lack of operational expertise or a desire by existing owners to exit their original investment. We take a disciplined approach in evaluating new opportunities by considering whether the plants or grain elevators fit within our design, engineering, financial and geographic criteria. We believe that our integrated platform, plant operations experience and disciplined risk management approach give us the ability to generate favorable returns from chosen acquisitions.
Expand Marketing and Distribution Activities. We plan to continue expanding our downstream access to customers and seeking opportunities to arbitrage markets with minimal risk allocation. We currently participate in ethanol logistic, transload services and continually seek opportunities to expand the capacity of these facilities through organic growth. We intend to seek acquisition of fuel terminal facilities that involve conventional, as well as renewable, fuels. We believe the expansion of our capacity will encourage the distribution of blended fuel and enable us to continue to capitalize on our vertically-integrated platform.
Conduct Safe, Reliable, Efficient Operations and Improve Operational Efficiency. We are committed to maintaining the safety, reliability, environmental compliance and efficiency of our operations. All of our assets are staffed by experienced industry personnel. We will also continue to focus on incremental operational improvements to enhance overall production results. We continually research operational processes that may increase our efficiency by increasing yields, lowering processing cost per gallon and increasing production volumes. Additionally, we employ an extensive production control system at each plant to continuously monitor its performance. We are able to use the plants’ performance data to develop strategies for cost reduction and efficiency that can be applied across our platform.
Invest in Adjacent Businesses to Take Advantage of Our Competencies. In June 2014, we acquired the assets of a cattle-feeding business near Kismet, Kansas. We plan to continue to seek acquisitions of adjacent businesses, including additional feedlots, that will allow us to apply our commodity processing and trading expertise as a competitive advantage in selected agricultural and energy markets. We believe we have specialized knowledge, existing processes and an expandable infrastructure that can be successfully applied to other business operations that involve commodity processing. In addition, we are continuing our investment in the BioProcess Algae joint venture, which is focused on the commercialization of advanced photo-bioreactor technologies for the growing and harvesting of algal biomass, which can be used as high-quality feedstocks with a number of high-value applications in human nutrition, pharmaceutical applications, animal feed, chemicals and biofuels. We believe this technology has specific applications for facilities that emit carbon dioxide, including ethanol plants.
Ethanol Industry Overview
Ethanol (also known as ethyl alcohol or grain alcohol) is a clear, colorless liquid made by fermenting and distilling material, usually from plants. The ethanol we produce is fuel grade, principally from the starch extracted from corn, and is primarily used in the blending of gasoline. In the United States, corn is the most common product used to produce ethanol. One bushel of corn produces about 2.8 gallons of ethanol and 17 pounds of distillers’ grains, a high-protein livestock feed for our food supply. To reduce corn transportation costs, most ethanol plants are located near areas where corn is grown; therefore the majority of U.S. ethanol plants are located in the midwestern region, commonly referred to as the corn belt. Outside the Unites States, including Brazil, sugarcane is the primary feedstock used in ethanol production.
4
The fuel ethanol industry is a key component of the biofuels industry. Biofuels are transportation fuels that are derived from renewable biological materials and are typically blended with gasoline, diesel fuel and other petroleum-based transportation fuels as they are a good source for oxygenates and octanes. When added to petroleum-based transportation fuels, oxygenates enable a cleaner-burning fuel, thereby reducing tailpipe pollution and carbon monoxide emissions. Oxygenates are not only utilized for their vehicle emission benefits, but also for their blending properties in motor gasoline as a fuel extender and a fuel enhancer as an octane booster. Globally, including within in the United States, ethanol is an economical source of both oxygenate and octane for blending into the fuel supply.
The ethanol industry is growing worldwide as ethanol production is cost competitive with gasoline. Additionally, due to its environmental and economic benefits, approximately 30 countries either mandate or incentivize ethanol and bio-diesel blending for motor fuels. These policies are often motivated partly by the need to reduce greenhouse gas emissions or air pollution and partly by the desire to be less dependent on oil imports. The worldwide fuel ethanol industry has grown significantly over the past decade, with annual reported production increasing from approximately 5.0 billion gallons in 2001 to approximately 23.4 billion gallons in 2013, according to the U.S. Energy Information Administration, or EIA. Furthermore, the United States and Brazil are the two largest producers and exporters of ethanol in the world. Over the same time frame, the U.S. ethanol industry grew from 1.8 billion gallons to 13.3 billion gallons. Today, ethanol comprises approximately 10% of the U.S. gasoline market.
In the United States, ethanol is mandated by the federal government. The U.S. Environmental Protection Agency, or EPA, uses renewable identification numbers, or RINs, to track renewable transportation fuels and to monitor compliance with the Renewable Fuel Standard, or RFS, a federal program that requires transportation fuels sold in the United States to contain minimum volumes of renewable fuels. The RFS program assigns obligated parties (fuel refiners, blenders and importers) a renewable volume obligation. The renewable volume obligation for each party is the volume of renewable fuels it is obligated to sell, based on a percentage of the company's total fuel sales, and is met by blending a certain quota of renewable fuel, such as ethanol, into gasoline. Obligated parties utilize RINs to track and show proof of compliance that they have met their RFS-mandated volumes. RINs are bought and sold among obligated parties and producers to fulfill quotas of renewable fuels during the blending process. Parties that produce or own RINs must register with the EPA and comply with RINs record and reporting guidelines on a quarterly basis.
We believe ethanol, as a proportion of global transportation fuels, will continue to remain consistent, or potentially increase, due to a continuing focus on reducing reliance on petroleum-based transportation fuels. Contributing factors include volatile oil prices, heightened environmental concerns, energy independence and national security concerns. We believe ethanol’s high octane value, environmental benefits, ability to improve gasoline performance, fuel supply extender capabilities, attractive production economics and favorable government policies could enable ethanol to comprise an increasingly larger portion of the global fuel supply, as described more fully below:
|
· |
Emissions Reduction. Ethanol demand increased substantially in the 1990’s, when federal law began requiring the use of oxygenates in reformulated gasoline in cities with unhealthy levels of air pollution on a seasonal or year-round basis. These oxygenates included ethanol and methyl tertiary-butyl ether, or MTBE, which reduce vehicle emissions when blended with gasoline. Oxygenated gasoline is used in order to help meet separate federal and state air emission standards. In the United States, the refining industry has all but abandoned the use of MTBE, making ethanol the primary clean air oxygenate currently used. |
|
· |
Octane Enhancer. Ethanol, with an octane rating of 113, is used to increase the octane value of gasoline with which it is blended, thereby improving engine performance. It is used as an octane enhancer both for producing regular grade gasoline from lower octane blending stocks and for upgrading regular gasoline to premium grades. The domestic gasoline market continues to evolve as refiners are producing more conventional blendstocks for oxygenate blending, or CBOB. According to data gathered by the EIA, CBOB represents approximately 80% of total conventional gasoline sold in 2014. CBOB is an 84 octane sub-grade gasoline, which requires ethanol or other octane sources to meet the minimum octane rating requirements for the U.S. gasoline market. Ethanol has become the primary additive used by refiners to increase octane levels. |
|
· |
Fuel Stock Extender. Ethanol is a valuable blend component that is used by refiners in the United States to extend fuel supplies. According to the EIA, from 2001 to 2014, ethanol as a component of the United States gasoline supply has grown from 1.4% to 9.9%. In 2014 alone, ethanol replaced the need for approximately 712 million barrels of oil in the United States. |
5
|
· |
E15 Blending Waiver. Through a series of decisions beginning in October 2010, the U.S. Environmental Protection Agency, or EPA, has granted a waiver for the use of up to 15% ethanol blended with gasoline, or E15, in model year 2001 and newer passenger vehicles, including cars, sport utility vehicles, or SUVs, and light pickup trucks. In June 2012, the EPA gave final approval for the sale and use of E15 ethanol blends. The nation’s first retail E15 ethanol blends were sold in July 2012. As of January 20, 2015, there were 110 retail fuel stations in 16 states offering E15 to consumers. |
|
· |
Mandated Use of Renewable Fuels. The growth in ethanol usage in the United States has also been supported by legislative requirements dictating the use of renewable fuels, including ethanol. The Energy Independence and Security Act of 2007, or EISA, established the Renewable Fuel Standard II, or RFS II, which modified a renewable fuel standard established in previous legislation. RFS II mandated a minimum usage of corn-derived renewable fuels of 12.0 billion gallons in 2010, increasing annually by 600 million gallons to 15.0 billion gallons in 2015. Under the provisions of EISA, authority has been delegated to the EPA to assign mandated volumes of renewable fuels to be blended into transportation fuel to individual fuel blenders. The EPA has not set mandated volumes for 2014 or 2015. RFS II, has been, and we expect will continue to be, a driving factor in the growth of ethanol usage. |
|
· |
Net Ethanol Exports. Prior to 2010, the United States had a long history as a net importer of ethanol. According to the U.S. Department of Agriculture, or USDA, in 2010, the United States became the global low-cost ethanol producer, surpassing Brazil as the largest exporter of ethanol to world markets. According to the EIA, U.S. ethanol exports, net of imports, in 2014 were approximately 750 million gallons and in 2013 were approximately 200 million gallons. |
Our Operating Segments
Ethanol Production Segment
We have the capacity to produce over one billion gallons of ethanol per year within our ethanol production segment. Our plants use a dry mill process to produce ethanol and co-products such as wet, modified wet or dried distillers grains. Processing at full capacity, our plants consume approximately 360 million bushels of corn and produce approximately 2.9 million tons of distillers grains annually. Each of our plants is located adjacent to and has access to major rail lines. We operate all of our ethanol plants through wholly-owned operating subsidiaries. A summary of these plants is outlined below:
|
Plant |
Plant Production Capacity (mmgy) |
Initial Operation or Acquisition Date |
Technology |
Land Owned (acres) |
On-Site Ethanol Storage Capacity (gallons) |
|
Atkinson, Nebraska |
50 |
June 2013 |
Delta-T |
80 |
2,074,000 |
|
Bluffton, Indiana (1) |
120 |
Sept. 2008 |
ICM |
419 |
3,000,000 |
|
Central City, Nebraska |
100 |
July 2009 |
ICM |
40 |
2,250,000 |
|
Fairmont, Minnesota |
115 |
Nov. 2013 |
Delta-T |
209 |
3,124,000 |
|
Lakota, Iowa |
100 |
Oct. 2010 |
ICM/Lurgi |
91 |
2,500,000 |
|
Obion, Tennessee (1) |
120 |
Nov. 2008 |
ICM |
230 |
3,000,000 |
|
Ord, Nebraska |
55 |
July 2009 |
ICM |
171 |
1,550,000 |
|
Otter Tail, Minnesota |
60 |
Mar. 2011 |
Delta-T |
117 |
2,000,000 |
|
Riga, Michigan |
60 |
Oct. 2010 |
Delta-T |
137 |
1,239,000 |
|
Shenandoah, Iowa (1) |
65 |
Aug. 2007 |
ICM |
110 |
1,524,000 |
|
Superior, Iowa (1) |
60 |
July 2008 |
Delta-T |
263 |
1,238,000 |
|
Wood River, Nebraska |
115 |
Nov. 2013 |
Delta-T |
126 |
3,124,000 |
|
(1) |
We constructed these four plants; all other ethanol plants were acquired. |
Six of the twelve plants we own are what we believe to be industry-leading ethanol processing technology developed by ICM, Inc. The remaining six plants are Delta-T technology, which is also a quality processing technology in the ethanol industry. Our years of combined experience with building, acquiring and operating these technologies provides us with a deep understanding of how to effectively and efficiently manage both systems for maximum performance.
6
Corn Feedstock and Ethanol Production
Ethanol is a chemical produced by the fermentation of carbohydrates found in grains and other biomass. Ethanol can be produced from a number of different types of grains, such as corn, wheat and sorghum, as well as from agricultural waste products such as rice hulls, cheese whey, potato waste, brewery and beverage wastes and forestry and paper wastes. At present, the majority of ethanol in the United States is produced from corn because corn contains large quantities of carbohydrates, can be handled efficiently and is in greater supply than other grains. Such carbohydrates convert into glucose more easily than most other kinds of biomass. Outside the United States, sugarcane is the primary feedstock used in ethanol production.
Our plants use corn as feedstock in the dry mill ethanol production process. Each of our plants requires, depending on their production capacity, approximately 20 million to 40 million bushels of corn annually. The price and availability of corn are subject to significant fluctuations depending upon a number of factors that affect commodity prices in general, including crop conditions, weather, governmental programs and foreign purchases. Because the market price of ethanol is not directly related to corn prices, ethanol producers are generally not able to compensate for increases in the cost of corn feedstock through adjustments to prices charged for their ethanol.
Our corn supply is obtained primarily from local markets. To utilize synergies between our agribusiness and ethanol production segments, corn is procured by our agribusiness segment and subsequently provided to our ethanol production segment. We utilize cash and forward purchase contracts with grain producers and elevators for the physical delivery of corn to our plants. At seven of our ethanol plants, we maintain direct relationships with local farmers, grain elevators and cooperatives, which serve as our primary sources of grain feedstock. Most farmers in the areas where these plants are located store their corn in their own storage facilities, which allows us to purchase much of the corn needed to supply our plants directly from farmers throughout the year. At five of our ethanol plants, we have contracted with third-party grain originators to supply all corn required for ethanol production. These contracts terminate between September 2015 and November 2023. Each of our plants is also situated on rail lines or has other logistical solutions to access corn supplies from other regions of the country if local corn supplies are insufficient.
Corn is received at the plant by truck or rail, is then weighed and unloaded in a receiving building. Storage bins are utilized to inventory grain, which is passed through a scalper to remove rocks and debris prior to processing. Thereafter, the corn is transported to a hammer mill where it is ground into coarse flour and conveyed into a slurry tank for enzymatic processing. Water, heat and enzymes are added to convert the complex starch molecules into simpler carbohydrates. The slurry is heated to reduce the potential of microbial contamination and pumped to a liquefaction tank where additional enzymes are added. Next, the grain slurry is pumped into fermenters, where yeast, enzymes, and nutrients are added, to begin a batch fermentation process. A beer column, within the distillation system, separates the alcohol from the spent grain mash. Alcohol is then transported through a rectifier column, a side stripper and a molecular sieve system where it is dehydrated to 200-proof alcohol. The 200-proof alcohol is either pumped to a holding tank and blended with approximately two percent denaturant (usually natural gasoline) as it is pumped into finished product storage tanks or is marketed as undenatured ethanol.
Distillers Grains
The spent grain mash from the beer column is pumped into one of several decanter type centrifuges for dewatering. The water, or thin stillage, is pumped from the centrifuges and then to an evaporator where it is dried into a thick syrup. The solids, or wet cake, that exit the centrifuge are conveyed to the dryer system. The wet cake is dried at varying temperatures, resulting in the production of distillers grains. Syrup might be reapplied to the wet cake prior to drying, providing additional nutrients to the distillers grains. Distillers grains, the principal co-product of the ethanol production process, are principally used as high-protein, high-energy animal fodder and feed supplements marketed to the dairy, beef, swine and poultry industries.
Dry mill ethanol processing potentially creates three forms of distillers grains, depending on the number of times the solids are passed through the dryer system: wet, modified wet and dried distillers grains. Wet distillers grains are processed wet cake that contains approximately 65% to 70% moisture. Wet distillers grains have a shelf life of approximately three days and can be sold only to dairies or feedlots within the immediate vicinity of an ethanol plant. Modified wet distillers grains, which have been dried further to approximately 50% to 55% moisture, have a slightly longer shelf life of approximately three weeks and are marketed to regional dairies and feedlots. Dried distillers grains, which have been dried more extensively to approximately 10% to 12% moisture, have an almost indefinite shelf life and may be stored, sold and shipped to any market regardless of its proximity to an ethanol plant.
7
The production of ethanol requires significant amounts of natural gas, electricity and water.
Natural Gas. Ethanol plants produce process steam from their own boiler systems and dry the distillers grains co-product via direct gas-fired dryers. Depending on certain production parameters, our ethanol plants are expected to use approximately 22,000 to 32,000 British Thermal Units of natural gas per gallon of production. We have entered into certain service agreements for the natural gas required by our ethanol plants and pay tariff fees to these providers for transporting the gas through their pipelines to our plants.
Electricity. Our plants require between 0.5 and 1.0 kilowatt hours of electricity per gallon of production. Local utilities supply necessary electricity to all of our ethanol plants.
Water. Although some of our plants satisfy the majority of their water requirements from wells located on their respective properties, each plant also obtains potable water from local municipal water sources. Each facility operates a filtration system to purify the well water that is utilized for its operations. Local municipalities supply all of the necessary water for our plants that do not have onsite wells. Much of the water used in an ethanol plant is recycled back into the production process.
Corn Oil Production Segment
We operate corn oil extraction systems at our ethanol plants. The corn oil systems are designed to extract non-edible corn oil from the thin stillage evaporation process immediately prior to production of distillers grains. Corn oil is produced by processing syrup and evaporated thin stillage through a decanter style centrifuge or a disk stack style centrifuge. Corn oil has a lower density than water or solids which make up the syrup. The centrifuges separate the relatively light oil from the heavier components of the syrup, eliminating the need for significant retention time. We extract approximately 0.7 pounds of corn oil per bushel of corn used to produce ethanol. De-oiled syrup is returned to the process for blending into wet, modified, or dry distillers grains. Industrial uses for corn oil include feedstock for biodiesel, livestock feed additives, rubber substitutes, rust preventatives, inks, textiles, soaps and insecticides.
8
Agribusiness Segment
We own and operate four grain elevators in three states with combined grain storage capacity of approximately 9.0 million bushels. Our cattle-feeding operation has approximately 2,600 acres of land, with 3.8 million bushels of grain storage capacity and the ability to support 70,000 head of cattle. Our ethanol plants have approximately 29.4 million bushels of total grain storage capacity. A summary of our agribusiness segment facilities is outlined below:
|
Facility Location |
Land Owned (acres) |
On-Site Grain Storage Capacity (bushels) |
|
Grain Elevators |
||
|
Archer, Nebraska |
12 |
1,200,000 |
|
Essex, Iowa |
17 |
3,700,000 |
|
Hopkins, Missouri |
10 |
2,000,000 |
|
St. Edward, Nebraska |
9 |
2,100,000 |
|
Feedlot Operation |
||
|
Kismet, Kansas |
2,600 |
3,800,000 |
|
Ethanol Plants |
||
|
Atkinson, Nebraska |
* |
2,280,000 |
|
Bluffton, Indiana |
* |
4,789,000 |
|
Central City, Nebraska |
* |
1,400,000 |
|
Fairmont, Minnesota |
* |
1,611,000 |
|
Lakota, Iowa |
* |
3,532,000 |
|
Obion, Tennessee |
* |
2,422,000 |
|
Ord, Nebraska |
* |
2,266,000 |
|
Otter Tail, Minnesota |
* |
2,504,000 |
|
Riga, Michigan |
* |
2,321,000 |
|
Shenandoah, Iowa |
* |
636,000 |
|
Superior, Iowa |
* |
2,477,000 |
|
Wood River, Nebraska |
* |
3,199,000 |
* Land owned at the ethanol plant locations is disclosed in the ethanol segment discussion above.
We buy bulk grain, primarily corn and soybeans, and cattle from area producers and provide grain drying and storage services to those producers. Our bulk grain business supplies a portion of the feedstock for our ethanol plants. The grain is also sold to grain processing companies and area livestock producers while cattle are sold to meat processors. Bulk grain and cattle commodities are readily traded on commodity exchanges and inventory values are affected by market changes and spreads. In an attempt to reduce risks due to market fluctuations from purchase and sale commitments for grain and cattle, as well as grain and cattle held in inventory, we enter into exchange-traded futures and options contracts that function as economic hedges. We believe our agribusiness operations increase our operational efficiency, reduce commodity price and supply risks, and diversify our revenue streams.
Seasonality is present within our agribusiness operations. The fall harvest period generally results in higher handling margins and stronger financial results for this segment during the fourth quarter.
Marketing and Distribution Segment
We have an in-house marketing business responsible for the sale, marketing and distribution of all ethanol, distillers grains and corn oil produced at our ethanol plants. We also market and provide logistical services for ethanol and other commodities for a third-party ethanol producer. We purchase and sell ethanol, distillers grains, corn oil, grain, natural gas and other commodities in various markets. Additionally, we operate eight fuel terminals, with approximately 822 mmgy of total throughput capacity, allowing us to source, store and distribute biodiesel and ethanol, including our production and that of other producers, across multiple states.
9
Marketing
We market our ethanol and that of a third-party producer to many different customers on a local, regional, national and international basis. In addition, we purchase ethanol from other independent producers to realize price arbitrages that may exist. To achieve the best prices for the ethanol that we market, we sell into various markets under sales agreements with integrated energy companies, jobbers, retailers, traders and resellers. Under these agreements, ethanol is priced under fixed and indexed pricing arrangements. We produce ethanol that conforms to domestic and certain international specifications; accordingly, our ethanol is also sold to buyers for export to Brazil, Canada, Europe and other international markets.
The market for distillers grains generally consists of local markets for wet, modified wet and dried distillers grains, and national and international markets for dried distillers grains. In addition, the market can be segmented by geographic region and livestock industry. The bulk of the current demand is for deliveries to geographic regions without significant local corn or distillers grains production. Our market strategy includes shipping a substantial amount of distillers grains as dried distillers grains to regional and national markets by barge and rail.
Most of our modified wet distillers grains are sold to midwestern feedlot markets. Our dried distillers grains are generally shipped to feedlot and poultry markets, as well as to Texas and west coast rail markets. Some of our distillers grains are shipped by truck to dairy, beef, and poultry operations in the eastern United States. Also, at certain times of the year, we transport product to the Mississippi River to be loaded on barges. We also ship by railcars into Eastern and Southeastern feed mill, poultry and dairy operations, as well as to domestic trade companies. We also sell dried distillers grains to exporters for shipment to international markets. The largest distillers grains export markets in 2014 included China, Mexico, Vietnam, and South Korea. Access to diversified markets allows us to sell product to customers that are offering the highest net price.
Our corn oil is primarily sold to biodiesel manufactures and, to a lesser extent, feed lot and poultry markets. We generally transport our corn oil by truck to locations in a close proximity to our ethanol plants, primarily in the southeastern and midwestern regions of the United States.
Transportation and Delivery
Most ethanol plants are situated near major highways or rail lines to ensure efficient movement. The distribution of ethanol primarily consists of movements from ethanol plants to bulk terminals via railcar, transport truck or barge. It is difficult to transport ethanol in pipelines because it is water-soluble and, as a result, will mix readily with any water present in a pipeline. We manage the logistics and transportation requirements of our customers to improve efficiencies of our fleet and reduce operating costs.
To meet the challenge of marketing ethanol and distillers grains to diverse market segments, our plants generally have access to rail lines, with several having extensive rail siding capable of handling more than 150 railcars on-site. At certain of our locations, we have large loop tracks which enable loading of unit trains of both ethanol and dried distillers grains, as well as spurs connecting the site’s rail loop to the railroad mainline or spurs that allow movement and storage of railcars on-site. These rail lines allow us to sell our products to various regional and national markets. The rail providers for our ethanol plants can switch cars to most of the other major railroads, allowing the plants to ship ethanol and distillers grains throughout the United States. Our railcar fleet is comprised of approximately 2,200 leased tank cars for the transportation of ethanol and approximately 900 leased hopper cars for the transportation of distillers grains. The lease contract initial terms are for periods up to ten years. Deliveries to the majority of the local markets, within 150 miles of the plants, are generally transported by truck, and deliveries to more distant markets are shipped by rail using major U.S. rail carriers. We seek to optimize the utilization of our rail assets, including potential use for transportation of products other than ethanol and distillers grains, depending on market opportunities. To optimize the value of our assets, we have utilized a portion of our railcar fleet to transport crude oil for third parties and to lease railcars to other users.
Terminal and Distribution Services
Once stored in our terminal facilities near our plants, ethanol is transported to third-party blending terminals where it is then blended with gasoline to the appropriate level. Ethanol blending typically occurs at the rack level where the two products are combined in the proper proportion and transferred on to the loading rack for delivery into the transport truck, which then transports the blended gasoline to retail gas stations.
10
We own and operate fuel holding tanks and terminals, and provide terminal services and logistics solutions to markets that currently do not have efficient access to renewable fuels. We operate fuel terminals at one owned and seven leased locations on approximately 28 acres in seven states with a combined total storage capacity of approximately 7.4 million gallons and throughput capacity of approximately 822 mmgy. The fuel terminal facilities are summarized below:
|
Facility Location |
Storage Capacity (gallons) |
Throughput Capacity (mmgy) |
|
Birmingham, Alabama - Unit Train Terminal |
6,542,000 |
300 |
|
Birmingham, Alabama - Other |
120,000 |
72 |
|
Bossier City, Louisiana |
180,000 |
60 |
|
Collins, Mississippi |
180,000 |
180 |
|
Little Rock, Arkansas |
30,000 |
36 |
|
Louisville, Kentucky |
60,000 |
30 |
|
Nashville, Tennessee |
160,000 |
60 |
|
Oklahoma City, Oklahoma |
150,000 |
84 |
Risk Management and Hedging Activities
The profitability of our operations and our industry are highly dependent on commodity prices, especially prices for ethanol, distillers grains, corn oil, corn and natural gas. Because market price fluctuations among these commodities are not always correlated, at times ethanol production may be unprofitable.
We enter into forward contracts to sell a portion of our respective ethanol and distillers grains production or to purchase a portion of our respective corn or natural gas requirements in an attempt to partially offset the effects of volatility of ethanol, distillers grains, corn and natural gas prices. We also engage in other hedging transactions involving exchange-traded futures contracts for corn, natural gas and ethanol from time to time. The financial statement impact of these activities is dependent upon, among other things, the prices involved and our ability to physically receive or deliver the commodities involved. Hedging arrangements also expose us to the risk of financial loss in situations where the counterparty to the hedging contract defaults on its contract or, in the case of exchange-traded contracts, where there is a change in the expected differential between the price of the commodity underlying the hedging agreement and the actual prices paid or received by us for the physical commodity bought or sold. Hedging activities can themselves result in losses when a position is purchased in a declining market or a position is sold in a rising market. A hedge position is often settled in the same time frame as the physical commodity is either purchased (corn and natural gas) or sold (ethanol, distillers grains and corn oil). Hedging losses may be offset by a decreased cash price for corn and natural gas and an increased cash price for ethanol, distillers grains and corn oil. We also vary the amount of hedging or other risk mitigation strategies we undertake, and we may choose not to engage in hedging transactions at all. By using a variety of risk management tools and hedging strategies, including our internally-developed real-time operating margin management system, we believe our approach to risk management allows us to monitor real-time operating price risk exposure at each of our plants and to respond quickly to lock in acceptable margins when they are available or temporarily reduce production levels at our ethanol plants during periods in which we have identified compressed margins. In addition, our multiple business lines and revenue streams help diversify our operations and profitability.
Recent Acquisition and Disposition Activity
In January 2012, we acquired a grain elevator located in St. Edward, Nebraska. The grain elevator is located approximately 40 miles from our Central City, Nebraska ethanol plant and is included in our agribusiness segment.
In December 2012, we sold 12 grain elevators located in northwestern Iowa and western Tennessee. The sale of assets, previously included in our agribusiness segment, consisted of approximately 32.6 million bushels of grain storage capacity and all of our agronomy and retail petroleum operations.
In June 2013, we acquired an ethanol plant located in Atkinson, Nebraska. The plant, which is part of our ethanol production segment, has production capacity of approximately 50 mmgy, adding to our ethanol and distillers grains production. Corn oil extraction technology was installed at the plant late in the fourth quarter of 2013. Also, in June 2013, we acquired a grain elevator in Archer, Nebraska, which is included in our agribusiness segment.
11
In November 2013, we acquired two ethanol plants, located in Wood River, Nebraska and Fairmont, Minnesota. The plants, which are part of our ethanol production segment, have combined production capacity of 230 mmgy, adding to our ethanol, distillers grains and corn oil production. The Fairmont, Minnesota plant, which was not operational at the time of its acquisition, began operations in January 2014 upon completion of certain maintenance and enhancement projects.
In June 2014, we acquired the assets of a cattle-feeding business near Kismet, Kansas, which includes a feedlot and grain storage facility. The operation, which is part of our agribusiness segment, consists of approximately 2,600 acres of land, which has the capacity to support 70,000 head of cattle, and corn storage capacity of approximately 3.8 million bushels.
BioProcess Algae Joint Venture
Our BioProcess Algae joint venture is focused on developing technology to grow and harvest algae, which consume carbon dioxide, in commercially viable quantities. Through multiple stages of expansion, BioProcess Algae has constructed a five-acre algae farm next to our Shenandoah, Iowa ethanol plant and has been operating its Grower Harvesters™ bioreactors since January 2011. The joint venture is currently focused on verification of growth rates, energy balances, capital requirements and operating expenses of the technology, which are considered to be some of the key steps to commercialization.
BioProcess Algae announced on April 22, 2013, that it had been selected to receive a grant of up to $6.4 million from the U.S. Department of Energy, or DOE, as part of a pilot-scale biorefinery project related to production of hydrocarbon fuels meeting military specification. The project uses renewable carbon dioxide, lignocellulosic sugars and waste heat through BioProcess Algae’s Grower Harvester™ technology platform. The objective of the project is to demonstrate technologies to cost-effectively convert biomass into advanced drop-in biofuels. BioProcess Algae is required to contribute a minimum of 50% matching funds for the project. The project with the DOE has been divided into three phases, with the first phase successfully completed in August 2014. We have agreed with the DOE to move into the second phase in which the detailed design, engineering, scheduling and budgeting for construction of a pilot-scale integrated biorefinery will be developed. The third phase would involve construction of the biorefinery.
If we and the other BioProcess Algae members determine that the joint venture can achieve the desired economic performance, a larger build-out will be considered, possibly as large as 200 to 400 acres of Grower Harvester™ reactors. Such a build-out may be completed in stages and could take up to two years to complete. Funding for such a project would come from a variety of sources, including current partners, new equity investors, debt financing or a combination thereof. We increased our ownership of BioProcess Algae to approximately 63% during the second quarter of 2014. However, we still do not possess the requisite control of this investment to consolidate it.
Our Competition
Domestic Ethanol Competitors
We compete with numerous other ethanol producers located throughout the United States. In 2014, the three largest ethanol producers in North America were Archer-Daniels-Midland Company, POET, LLC and Valero Energy Corporation. We believe that our principal competitors’ expected managed annual production capacity and ethanol marketed ranges between approximately 300 mmgy and approximately 1,800 mmgy. Based on production capacity as reported by Ethanol Producer Magazine, we believe we are the fourth largest ethanol producer in North America. According to Ethanol Producer Magazine, as of December 31, 2014, there were 213 ethanol-producing plants within the United States, capable of producing 15.9 billion gallons of ethanol annually. The industry typically does not operate at 100% of capacity with historical rates of annual production to available plant capacity averaging in the high 80 percent to the low 90 percent range.
Our competitors also include plants owned by farmers who earn their primary livelihood through the production and sale of grain and competitors whose primary business is oil refining and retail fuel sales. These competitors may continue to operate their plants when market conditions are uneconomic due to benefits realized in other operations.
Competition for corn supply from other ethanol plants and other corn consumers exists in all areas and regions in which our plants operate. According to Ethanol Producer Magazine, as of December 31, 2014, the states of Iowa, Indiana, Michigan, Minnesota, Nebraska and Tennessee had a total of 113 operational ethanol plants, with Iowa and Nebraska having the majority of the plants. The state of Iowa had 44 operational ethanol plants concentrated, for the most part, in the northern and central regions of the state where a majority of the corn is produced. The state of Nebraska had 26 operational ethanol plants.
12
Foreign Ethanol Competitors
We also face foreign competition in the production of ethanol. Brazil is currently the second largest ethanol producer in the world. Brazil’s ethanol production is sugarcane based, as opposed to corn based, and, depending on feedstock prices, may be less expensive to produce. Under RFS II, certain parties were obligated to meet an advanced biofuel standard calling for 3.75 billion gallons of biofuels in 2014. In recent years, sugarcane ethanol imported from Brazil has been one of the most economical means for obligated parties to meet this standard. Other foreign producers may be able to produce ethanol at lower input costs, including costs of feedstock, facilities and personnel, than we can. If significant additional foreign ethanol production capacity is created, such facilities could create excess supplies of ethanol on world markets, which may result in lower prices of ethanol throughout the world, including the United States.
Other Competition
Alternative fuels, gasoline oxygenates and ethanol production methods are continually under development by ethanol and oil companies. Ethanol production technologies continue to evolve, and changes are expected to occur primarily in the area of ethanol made from cellulose obtained from other sources of biomass such as switchgrass or fast-growing poplar trees. Because our plants are designed as single-feedstock facilities, we have limited ability to adapt the plants to a different feedstock or process system without additional capital investment and retooling.
Regulatory Matters
Government Ethanol Programs and Policies
Demand for cleaner, more sustainable transportation fuels is growing around the world. Growth of ethanol demand is being driven by progressive policies adopted by more than 30 foreign countries, calling for increasing amounts of ethanol in those countries’ motor fuel supplies. Ethanol has become crucial to the global fuel mix, providing an economical source of oxygenate and octane for global fuel supplies.
In an effort to reduce this country’s dependence on foreign oil, federal and state governments have enacted numerous policies, incentives and subsidies to encourage the usage of domestically-produced alternative fuels. The U.S. ethanol industry has benefited significantly as a direct result of these policies. While historically the ethanol industry has been dependent on economic incentives, the need for such incentives has and may continue to diminish as the acceptance of ethanol as a primary fuel and as a fuel extender continues to increase.
Pursuant to the provisions of EISA, RFS II was established, which modified a renewable fuel standard established in previous legislation. RFS II increased the volume of renewable fuel required to be blended into transportation fuel and mandated a minimum usage of corn-derived renewable fuels of 12.0 billion gallons in 2010, increasing annually by 600 million gallons to 15.0 billion gallons in 2015. Under the provisions of EISA, authority has been delegated to the EPA to assign mandated volumes of renewable fuels to be blended into transportation fuel to individual fuel blenders. RFS II, has been, and we expect will continue to be, a driving factor in the growth of ethanol usage in the United States. On April 10, 2013 the Renewable Fuel Standard Elimination Act was introduced as H.R. 1461 to target the repeal of RFS II. Also introduced on April 10, 2013 was the RFS Reform Bill, H.R. 1462, which would prohibit more than ten percent ethanol in gasoline and reduce the RFS II mandated volume of renewable fuel. On May 14, 2013, the Domestic Alternatives Fuels Act of 2013 was introduced in the U.S. House of Representatives as H.R. 1959 to allow ethanol produced from natural gas to be used to meet the RFS II mandate. These bills failed to make it out of congressional committee and were not enacted into law. H.R. 21 was introduced on January 6, 2015 to provide for a comprehensive assessment of the scientific and technical research on the implications of the use of mid-level ethanol blends, and for other purposes. This bill would seek to eliminate the waiver granted by the EPA to allow E15 in 2001 and newer model cars and light trucks. H.R. 434 was introduced on January 21, 2015 which seeks to modify the Clean Air Act by limiting or removing the authority of the EPA to grant waivers for higher blends of ethanol in the U.S. gasoline supply. The bill also seeks to repeal existing waivers already granted by the EPA concerning E15. H.R.704, introduced February 4, 2015, is similar to H.R. 21 as it proposes limiting ethanol blends higher than 10% in the U.S. fuel supply and seeks to repeal the renewable fuel standard.
Under the provisions of EISA, the EPA has the authority to waive the mandated RFS II requirements in whole or in part. To grant the waiver, the EPA administrator must determine, in consultation with the Secretaries of Agriculture and Energy, that one of two conditions has been met: (1) there is inadequate domestic renewable fuel supply or (2) implementation of the requirement would severely harm the economy or environment of a state, region or the United States. In the third quarter of
13
2012, several waiver requests were filed with the EPA based on drought conditions, which were subsequently denied.
The RFS II mandate increased to 14.4 billion gallons of corn-derived renewable fuel for 2014, 600 million gallons over the mandated volume in 2013, and increases to 15.0 billion gallons for 2015. On November 15, 2013, the EPA released its Notice of Proposed Rulemaking for the 2014 Renewable Fuel Standard. The proposal discusses a variety of approaches for setting the 2014 standards, and includes a number of production and consumption ranges for key categories of biofuel covered by RFS II. The proposal seeks comment on a range of total renewable fuel volumes for 2014 and proposes a level within that range of 15.2 billion gallons, including approximately 13.0 billion gallons of corn-derived renewable fuel. The proposal addresses two constraints of RFS II: (1) limitations in the volume of ethanol that can be consumed in gasoline given practical constraints on the supply of higher ethanol blends to the vehicles that can use them and (2) limitations in the ability of the industry to produce sufficient volumes of qualifying renewable fuel. On November 21, 2014, the EPA announced that it rescinded its proposal from 2013 and will not be finalizing 2014 applicable percentage standards under the RFS program before the end of 2014. In light of this delay in issuing the 2014 RFS standards, the compliance demonstration deadline for the 2013 RFS standards will take place in 2015. The EPA will be making modifications to ensure that RINs generated in 2012 are valid for demonstrating compliance with the 2013 applicable standards.
To measure compliance with RFS II, RINs are generated and are attached to renewable fuels, such as the ethanol we produce, and detached when the renewable fuel is blended into the transportation fuel supply. Detached RINs may be retired by obligated parties to demonstrate compliance with RFS II or may be separately traded in the market. The market price of detached RINs may affect the price of ethanol in certain U.S. markets as obligated parties may factor these costs into their purchasing decisions. Moreover, at certain price levels for various types of RINs, it becomes more economical to import foreign sugar cane ethanol. If changes to RFS II result in significant changes in the price of various types of RINs, it could negatively affect the price of ethanol, and our operations could be adversely impacted.
To further drive growth in the increased adoption of ethanol, Growth Energy, an ethanol industry trade association, and a number of ethanol producers requested a waiver from the EPA to increase the amount of ethanol blended into gasoline from the current 10% level, or E10, to a 15% level, or E15. Through a series of decisions beginning in October 2010, the EPA granted a waiver for the use of E15 in model year 2001 and newer passenger vehicles, including cars, SUVs and light pickup trucks. In June 2012, the EPA gave final approval for the sale and use of E15 ethanol blends. The nation’s first retail E15 ethanol blends were sold in July 2012. As of January 20, 2015, there were 110 retail fuel stations in 16 states offering E15 to consumers.
The Clean Air Act requires use of oxygenated gasoline in areas where winter time carbon monoxide levels exceed federal air quality standards. Without oxygenated gasoline, carbon monoxide emissions from gasoline-fueled vehicles tend to increase in cold weather. Winter-oxygenated gasoline programs are implemented by the individual states.
Changes in corporate average fuel economy standards, or CAFE, have also benefited the ethanol industry by encouraging use of E85 fuel products. CAFE provides an effective 54% efficiency bonus to flexible-fuel vehicles running on E85. Today, E85 is available at 2,804 fuel stations concentrated in 10 U.S. states. The EIA estimates that there are 14.2 million flexible-fuel vehicles in the United States, representing 6.3% of cars and light trucks on the road. It also estimates that approximately 200 million gallons of E85 were sold in 2013. Auto manufacturers may find it attractive to build more flexible-fuel trucks and sport utility vehicles that are otherwise unlikely to meet CAFE standards.
The Master Limited Partnership Parity Act was introduced on April 24, 2013 in the U.S. House of Representatives as H.R. 1696 to extend the publicly traded partnership ownership structure to renewable energy projects, including ethanol production. The legislation would provide a more level financing system and tax burden for renewable energy and fossil energy projects. H.R. 1696 did not advance out of committee during the 113th Congress; currently, the co-sponsors have not re-introduced the bill.
In addition to these federal standards, many states have taken other steps to encourage ethanol consumption including tax credits, mandated blend rates and subsidies.
On July 21, 2010, President Obama signed the Dodd-Frank Wall Street Reform and Consumer Protection Act, or the Reform Act, which, among other things, aims to improve transparency and accountability in derivative markets. While the Reform Act increases the regulatory authority of the Commodity Futures Trading Commission, or CFTC, regarding over-the-counter derivatives, there is uncertainty on several issues related to market clearing, definitions of market participants, reporting, and capital requirements. While some of the details have been addressed in CFTC regulations, others remain and at this time we do not anticipate any material impact to our risk management strategy.
14
The Domestic Alternative Fuels Act of 2012 was introduced on January 18, 2012 in the U.S. House of Representatives and was re-introduced on March 15, 2013 as H.R. 1214 to provide liability protection for claims based on the sale or use of certain fuels and fuel additives. Passage of this bill would provide liability protection to consumers in the event they unintentionally put any transportation fuel into their motor vehicle for which such fuel has not been approved. Some automobile manufacturers have publicly stated that the use of fuels not approved in their owners’ manuals, such as E15, is considered misfueling and any resulting damage would not be covered by their warranties. The American Fuel Protection Act of 2013, or H.R. 2267, was introduced on June 5, 2013 in the U.S. House of Representatives to make the United States exclusively liable for certain claims of liability for damages resulting from, or aggravated by, the inclusion of ethanol in transportation fuel. These bills failed to advance out of congressional committee and were not enacted into law.
Environmental and Other Regulation
Our ethanol production and agribusiness activities are subject to environmental and other regulations. We obtain environmental permits to construct and operate our ethanol plants.
Ethanol production involves the emission of various airborne pollutants, including particulate, carbon dioxide, oxides of nitrogen, hazardous air pollutants and volatile organic compounds. In 2007, the U.S. Supreme Court classified carbon dioxide as an air pollutant under the Clean Air Act in a case seeking to require the EPA to regulate carbon dioxide in vehicle emissions. In February 2010, the EPA released its final regulations on the RFS II. We believe these final regulations grandfather our plants at their current authorized capacity, though expansion of our plants above these levels will need to meet a threshold of a 20% reduction in greenhouse gas, or GHG, emissions from a 2005 baseline measurement to produce ethanol eligible for the RFS II mandate. In order to expand capacity at our plants, we may be required to obtain additional permits, achieve EPA “efficient producer” status under the pathway petition program, install advanced technology, or reduce drying of certain amounts of distillers grains.
Separately, the California Air Resources Board, or CARB, has adopted a Low Carbon Fuel Standard, or LCFS, requiring a 10% reduction in average carbon intensity of gasoline and diesel transportation fuels from 2010 to 2020. After a series of rulings that temporarily prevented CARB from enforcing these regulations, the State of California Office of Administrative Law approved the LCFS on November 26, 2012, and revised LCFS regulations took effect in January 2013. An Indirect Land Use Change, or ILUC, component is included in this lifecycle GHG emissions calculation which may have an adverse impact on the market for corn-based ethanol in California.
The U.S. ethanol industry has long relied on railroads to deliver its product to market. We lease approximately 2,200 tank cars. These tank cars may need to be retrofitted or replaced if new regulations proposed by the U.S. Department of Transportation, or DOT, to address concerns related to safety are adopted, which could in turn cause a shortage of compliant tank cars. The proposed regulations call for a phase out within four years of the use of legacy DOT-111 tank cars for transporting highly-flammable liquids, including ethanol. According to the proposed rule, the DOT expects about 66,000 tank cars to be retrofitted and about 23,000 cars to be shifted to transporting other liquids. The Canadian government has also proposed that its nation’s rail shippers use sturdier tank cars for transportation of crude oil and ethanol. Adoption of the proposed regulations, which could result in upgrades or replacements of our tank cars, would likely have an adverse effect on our operations as lease costs for tank cars would likely increase. Additionally, existing tank cars could be out of service for a period of time while such upgrades are made, tightening supply in an industry that is highly dependent on such railcars to transport its product. The DOT recently announced that the comprehensive crude-by-rail safety rule will be submitted to the White House for final review with hopes that the rule will be finalized by May 2015.
Part of our business is regulated by environmental laws and regulations governing the labeling, use, storage, discharge and disposal of hazardous materials. Our agribusiness operations are subject to government regulation and regulation by certain private sector associations. Production levels, markets and prices of the grains we merchandise are affected by federal government programs, which include acreage control and price support programs of the U.S. Department of Agriculture, or USDA. In addition, grain that we sell must conform to official grade standards imposed by the USDA. Other examples of government policies that can have an impact on our business include tariffs, duties, subsidies, import and export restrictions and outright embargos.
We also employ maintenance and operations personnel at each of our ethanol plants. In addition to the attention that we place on the health and safety of our employees, the operations at our facilities are governed by the regulations of the Occupational Safety and Health Administration, or OSHA.
15
Major Customer
Revenues from two customers, controlled by the same entity, of our marketing and distribution segment totaled approximately $325.0 million, or 10.0%, of our consolidated revenues.
Employees
As of December 31, 2014, we had approximately 840 full-time, part-time and temporary or seasonal employees. At that date, we employed 145 people, including 68 employees of our subsidiary, Green Plains Trade Group LLC, at our corporate office in Omaha, 74 employees at our agribusiness operations, 19 employees at other locations in our marketing and distribution segment, and the remainder at our ethanol plants.
Available Information
Our annual reports on Form 10-K, quarterly reports on Form 10-Q, current reports on Form 8-K and amendments to those reports filed or furnished pursuant to Section 13(a) or 15(d) of the Securities Exchange Act of 1934, or the Exchange Act, are available free of charge on our website at www.gpreinc.com as soon as reasonably practicable after we file or furnish such information electronically with the SEC. Also available on our website in our corporate governance section are the charters of our audit, compensation, and nominating committees, and a copy of our code of conduct and ethics that applies to our directors, officers and other employees, including our Chief Executive Officer and all senior financial officers. The information found on our website is not part of this or any other report we file with or furnish to the SEC.
The public may read and copy any materials we file with the SEC at the SEC’s Public Reference Room at 100 F Street, NE, Washington, DC 20549. The public may obtain information on the operation of the Public Reference Room by calling the SEC at 1-800-SEC-0330. The SEC also maintains an Internet site that contains reports, proxy and information statements, and other information regarding issuers that file electronically with the SEC at http://www.sec.gov.
We operate in an evolving industry that presents numerous risks. Many of these risks are beyond our control and are driven by factors that often cannot be predicted. Investors should carefully consider the risk factors set forth below, as well as the other information appearing in this report, before making any investment in our securities. If any of the risks described below or in the documents incorporated by reference in this report actually occur, our financial results, financial condition or market price of our common stock could be materially adversely affected. These risk factors should be considered in conjunction with the other information included in this report.
Risks relating to our business and industry
Our results of operations and ability to operate at a profit is largely dependent on managing the spread among the prices of corn, natural gas, ethanol, distillers grains and corn oil, the prices of which are subject to significant volatility and uncertainty.
The results of our ethanol production business are highly impacted by commodity prices, including the spread between the cost of corn and natural gas that we must purchase, and the price of ethanol, distillers grains and corn oil that we sell. Prices and supplies are subject to and determined by market forces over which we have no control, such as weather, domestic and global demand, shortages, export prices, crude oil prices, currency valuations and various governmental policies in the United States and around the world. As a result of price volatility for these commodities, our operating results may fluctuate substantially. Increases in corn or natural gas prices or decreases in ethanol, distillers grains and corn oil prices may make it unprofitable to operate our plants. No assurance can be given that we will be able to purchase corn and natural gas at, or near, current prices and that we will be able to sell ethanol, distillers grains and corn oil at, or near, current prices. Consequently, our results of operations and financial position may be adversely affected by increases in the price of corn or natural gas or decreases in the price of ethanol, distillers grains and corn oil.
We continuously monitor the profitability of our ethanol plants with a variety of risk management tools, including our internally-developed real-time operating margin management system. In recent years, the spread between ethanol and corn prices has fluctuated widely and narrowed significantly. Fluctuations are likely to continue to occur. A sustained narrow spread or any further reduction in the spread between ethanol and corn prices, whether as a result of sustained high or increased corn prices or sustained low or decreased ethanol prices, would adversely affect our results of operations and
16
financial position. Further, combined revenues from sales of ethanol, distillers grains and corn oil could decline below our marginal cost of production, which could cause us to reduce or suspend production at some or all of our plants. A decrease in production volumes could adversely impact our overall profitability.
Price volatility of each commodity that we buy and sell could each adversely affect our results of operations and our ability to operate at a profit.
Corn. Because ethanol competes with non-corn derived fuels, we generally are unable to pass along increases in corn costs to our customers. At certain levels, corn prices may make ethanol uneconomical to produce. There is significant price pressure on local corn markets caused by nearby ethanol plants, livestock industries and other corn consuming enterprises. Additionally, local corn supplies and prices could be adversely affected by rising prices for alternative crops, increasing input costs, changes in government policies, shifts in global markets, or damaging growing conditions such as plant disease or adverse weather, including but not limited to drought.
Natural Gas. The prices for and availability of natural gas are subject to volatile market conditions. These market conditions often are affected by factors beyond our control, such as weather conditions, overall economic conditions, and foreign and domestic governmental regulation and relations. Significant disruptions in the supply of natural gas could impair our ability to manufacture ethanol for our customers. Furthermore, increases in natural gas prices or changes in our natural gas costs relative to natural gas costs paid by competitors may adversely affect our results of operations and financial position.
Ethanol. Our revenues are dependent on market prices for ethanol. These market prices can be volatile as a result of a number of factors, including, but not limited to, the availability and price of competing fuels, the overall supply and demand for ethanol and corn, the price of gasoline, crude oil and corn, and government policies.
Ethanol is marketed as a fuel additive to reduce vehicle emissions from gasoline, as an octane enhancer to improve the octane rating of the gasoline with which it is blended and, to a lesser extent, as a gasoline substitute. As a result, ethanol prices are influenced by the supply of and demand for gasoline. Our results of operations may be materially harmed if the demand for, or the price of, gasoline decreases. Market prices for ethanol produced in the United States are also influenced by the supply of and demand for imported ethanol. Imported ethanol is not subject to an import tariff and under RFS II sugarcane ethanol imported from Brazil has been one of the most economical means for obligated parties to meet an advanced biofuel standard.
Distillers Grains. Distillers grains compete with other protein-based animal feed products. The price of distillers grains may decrease when the prices of competing feed products decrease. The prices of competing animal feed products are based in part on the prices of the commodities from which these products are derived. Downward pressure on commodity prices, such as soybeans, will generally cause the price of competing animal feed products to decline, resulting in downward pressure on the price of distillers grains.
Historically, sales prices for distillers grains have been correlated with prices of corn. However, there have been occasions when the price increase for this co-product has lagged behind increases in corn prices. In addition, our distillers grains co-product competes with products made from other feedstocks, the cost of which may not have risen as corn prices have risen. Consequently, the price we may receive for distillers grains may not rise as corn prices rise, thereby lowering our cost recovery percentage relative to corn.
Due to industry increases in U.S. dry mill ethanol production, the production of distillers grains in the United States has increased dramatically, and this trend may continue. This may cause distillers grains prices to fall in the United States, unless demand increases or other market sources are found. Since 2010, approximately 25% of distillers grains produced in the United States have been exported; China has been the largest importer. To date, demand for distillers grains in the United States has increased roughly in proportion to supply. We believe this is because U.S. farmers use distillers grains as a feedstock, and distillers grains are slightly less expensive than corn, for which it is a substitute. However, if prices for distillers grains in the United States fall, it may have an adverse effect on our business. In 2013, China began to reject distillers grains due to the presence of unapproved genetically-modified organisms. The U.S. Department of Agriculture stated on December 17, 2014 that Chinese officials have approved imports of Syngenta GMO corn trait MIR 162 and two varieties of biotech soybeans. China’s lift of the ban now allows for imports of distillers grains back into their country beginning in early 2015. If shipments to China are again rejected or delayed, the market for distillers grains would be negatively impacted, which could have a negative impact on our profitability.
17
Corn Oil. Industrial uses for corn oil include feedstock for biodiesel, livestock feed additives, rubber substitutes, rust preventatives, inks, textiles, soaps and insecticides. Corn oil is generally marketed as a feedstock for biodiesel and, therefore, the price of corn oil is affected by demand for biodiesel. In general, corn oil prices follow the same price trends as heating oil and soybean oil. If the price for corn oil fluctuates, it may have an adverse effect on our business.
Our risk management strategies, including hedging transactions, may be ineffective and may expose us to decreased liquidity.
In an attempt to partially offset the effects of volatility of ethanol, distillers grains, corn oil, corn and natural gas prices, we enter into forward contracts to sell a portion of our respective ethanol, distillers grains and corn oil production or to purchase a portion of our respective corn or natural gas requirements. We also engage in other hedging transactions involving exchange-traded futures contracts for corn, natural gas, ethanol and unleaded gasoline from time to time. The financial statement impact of these activities is dependent upon, among other things, the prices involved and our ability to physically receive or deliver the commodities involved. Hedging arrangements also expose us to the risk of financial loss in situations where the counterparty to the hedging contract defaults on its contract or, in the case of exchange-traded contracts, where there is a change in the expected differential between the price of the commodity underlying the hedging agreement and the actual prices paid or received by us for the physical commodity bought or sold. Hedging activities can themselves result in losses when a position is purchased in a declining market or a position is sold in a rising market. A hedge position is often settled in the same time frame as the physical commodity is either expensed as a cost of goods sold (corn and natural gas) or recognized as revenue (ethanol, distillers grains and corn oil). Hedging losses may be offset by a decreased cash price for corn and natural gas and an increased cash price for ethanol, distillers grains and corn oil. We also vary the amount of hedging or other risk mitigation strategies we undertake, and we may choose not to engage in hedging transactions at all. We cannot assure you that our risk management and hedging activities will be effective in offsetting the effects of volatility. If we fail to offset such volatility, our results of operations and financial position may be adversely affected.
The use of derivative financial instruments frequently involves cash deposits with brokers, or margin calls. Sudden changes in commodity prices may require additional cash deposits immediately. Depending on our open derivative positions, we may require additional liquidity with little advance notice to meet margin calls. As part of our risk management strategy, we have routinely had to, and in the future will likely be required to, cover margin calls. While we continuously monitor our exposure to margin calls, we cannot guarantee you that we will be able to maintain adequate liquidity to cover margin calls in the future.
The ethanol industry is dependent on government usage mandates affecting ethanol production and any changes to such regulation could adversely affect the market for ethanol and our results of operations.
The domestic market for ethanol is significantly impacted by federal mandates for blending ethanol with gasoline. The RFS II mandate level for conventional biofuels for 2014 is 14.4 billion gallons. Future demand will be largely dependent upon the economic incentives to blend based upon the relative value of gasoline versus ethanol, taking into consideration the relative octane value of ethanol, environmental requirements and the RFS II mandate. Any significant increase in production capacity beyond the RFS II mandated level may have an adverse impact on ethanol prices.
Due primarily to drought conditions in 2012 and claims that blending of ethanol into the motor fuel supply will be constrained by unwillingness of the market to accept greater than ten percent ethanol blends, or the blend wall, legislation aimed at reducing or eliminating the renewable fuel use required by RFS II has been introduced in Congress. On April 10, 2013, the Renewable Fuel Standard Elimination Act was introduced as H.R. 1461. The bill is targeted to repeal RFS II. Also introduced on April 10, 2013 was the RFS Reform Bill, H.R. 1462, which would prohibit more than ten percent ethanol in gasoline and reduce the RFS II mandated volume of renewable fuel. On May 14, 2013, the Domestic Alternatives Fuels Act of 2013 was introduced in the U.S. House of Representatives as H.R. 1959 to allow ethanol produced from natural gas to be used to meet the RFS II mandate. These bills failed to make it out of congressional committee and were not enacted into law. We believe RFS II is a significant component of national energy policy that reduces dependence on foreign oil by the United States. Our operations could be adversely impacted if legislation reducing the RFS II mandate is enacted.
Additionally, under the provisions of EISA, the EPA has the authority to waive the mandated RFS II requirements in whole or in part. To grant the waiver, the EPA administrator must determine, in consultation with the Secretaries of Agriculture and Energy, that one of two conditions has been met: (1) there is inadequate domestic renewable fuel supply or (2) implementation of the requirement would severely harm the economy or environment of a state, region or the United States.
18
On November 21, 2014, the EPA announced that it will not be finalizing 2014 applicable percentage standards under the RFS II before the end of 2014. In light of this delay in issuing the 2014 RFS standards, the compliance demonstration deadline for the 2013 RFS standards will take place in 2015. The EPA will be making modifications to ensure that RINs generated in 2012 are valid for demonstrating compliance with the 2013 applicable standards.
To measure compliance with RFS II, RINs are generated and attached to renewable fuels, such as the ethanol we produce, and detached when the renewable fuel is blended into the transportation fuel supply. Detached RINs may be retired by obligated parties to demonstrate compliance with RFS II or may be separately traded in the market. The market price of detached RINs may affect the price of ethanol in certain U.S. markets as obligated parties may factor these costs into their purchasing decisions. Moreover, at certain price levels for various types of RINs, it becomes more economical to import foreign sugar cane ethanol. If changes to RFS II result in significant changes in the price of various types of RINs, it could negatively affect the price of ethanol, which could adversely affect our operations.
Federal law mandates the use of oxygenated gasoline in the winter in areas that do not meet Clean Air Act standards for carbon monoxide. If these mandates are repealed, the market for domestic ethanol could be diminished. Additionally, flexible-fuel vehicles receive preferential treatment in meeting corporate average fuel economy standards, or CAFE. However, high-blend ethanol fuels such as E85, a blend of ethanol and gasoline composed of up to 85% ethanol, result in lower fuel efficiencies. Absent the CAFE preferences, it may be unlikely that auto manufacturers would build flexible-fuel vehicles. Any change in these CAFE preferences could reduce the growth of E85 markets and result in lower ethanol prices, which could adversely impact our operating results.
To the extent that such federal or state laws or regulations are modified, the demand for ethanol may be reduced, which could negatively and materially affect our ability to operate profitably.
Future demand for ethanol is uncertain and may be affected by changes to federal mandates, public perception, consumer acceptance and overall consumer demand for transportation fuel, any of which could negatively affect demand for ethanol and our results of operations.
Ethanol production from corn has not been without controversy. Although many trade groups, academics and governmental agencies have supported ethanol as a fuel additive that promotes a cleaner environment, others have criticized ethanol production as consuming considerably more energy and emitting more greenhouse gases than other biofuels and potentially depleting water resources. Some studies have suggested that corn-based ethanol is less efficient than ethanol produced from switchgrass or wheat grain and that it negatively impacts consumers by causing prices for dairy, meat and other foodstuffs from livestock that consume corn to increase. Additionally, ethanol critics contend that corn supplies are redirected from international food markets to domestic fuel markets. If negative views of corn-based ethanol production gain acceptance, support for existing measures promoting use and domestic production of corn-based ethanol could decline, leading to reduction or repeal of federal mandates, which would adversely affect the demand for ethanol. These views could also negatively impact public perception of the ethanol industry and acceptance of ethanol as an alternative fuel.
Beyond the federal mandates, there are limited markets for ethanol. Discretionary blending and E85 blending are important secondary markets. Discretionary blending is often determined by the price of ethanol versus the price of gasoline. In periods when discretionary blending is financially unattractive, the demand for ethanol may be reduced. Also, the demand for ethanol is affected by the overall demand for transportation fuel, which peaked in 2007, was declining until early 2013 but has been increasing modestly since then. Demand for transportation fuel is affected by the number of miles traveled by consumers and the fuel economy of vehicles. Market acceptance of E15 may partially offset the effects of decreases in transportation fuel demand. A reduction in the demand for our products may depress the value of our products, erode our margins, and reduce our ability to generate revenue or to operate profitably. Consumer acceptance of E15 and E85 fuels is one factor that may be needed before ethanol can achieve any significant growth in market share.
Increased federal support of cellulosic ethanol may result in increased competition to corn-derived ethanol producers.
Recent legislation, such as the American Recovery and Reinvestment Act of 2009 and EISA, provides numerous funding opportunities in support of cellulosic ethanol, which is obtained from other sources of biomass such as switchgrass and fast growing poplar trees. In addition, the RFS II mandates an increasing level of production of biofuels that are not derived from corn. Federal policies suggest a long-term political preference for cellulosic processes using alternative feedstocks such as switchgrass, silage, wood chips or other forms of biomass. Cellulosic ethanol may have a smaller carbon footprint because the feedstock does not require energy-intensive fertilizers and industrial production processes. Additionally, cellulosic ethanol is favored because it is unlikely that foodstuff is being diverted from the market. Several cellulosic ethanol plants are
19
under development. As research and development programs persist, there is the risk that cellulosic ethanol could displace corn ethanol. In addition, any replacement of federal mandates from corn-based to cellulosic-based ethanol production may reduce our profitability.
Our plants are designed as single-feedstock facilities and would require significant additional investment to convert to the production of cellulosic ethanol. Additionally, our plants are strategically located in high-yield, low-cost corn production areas. At present, there is limited supply of alternative feedstocks near our facilities. As a result, the adoption of cellulosic ethanol and its use as the preferred form of ethanol would have a significant adverse impact on our business.
Any inability to maintain required regulatory permits may impede or completely prohibit our ability to successfully operate our plants. Additionally, any change in environmental and safety regulations, or violations thereof, could impede our ability to successfully operate our businesses.
Our ethanol production and agribusiness segments are subject to extensive air, water and other environmental regulation. We have had to obtain a number of environmental permits to construct and operate our plants. Ethanol production involves the emission of various airborne pollutants, including particulate, carbon dioxide, oxides of nitrogen, hazardous air pollutants and volatile organic compounds. In addition, the governing state agencies could impose conditions or other restrictions in the permits that are detrimental to us or which increase our costs above those required for profitable operations. Any such event could have a material adverse effect on our operations, cash flows and financial position.
Environmental laws and regulations, both at the federal and state level, are subject to change and changes can be made retroactively. It is possible that more stringent federal or state environmental rules or regulations could be adopted, which could increase our operating costs and expenses. Consequently, even if we have the proper permits at the present time, we may be required to invest or spend considerable resources to comply with future environmental regulations. Furthermore, ongoing plant operations are governed by OSHA. OSHA regulations may change in a way that increases the costs of operations at our plants. If any of these events were to occur, they could have an adverse impact on our operations, cash flows and financial position.
Part of our business is regulated by environmental laws and regulations governing the labeling, use, storage, discharge and disposal of hazardous materials. Because we use and handle hazardous substances in our businesses, changes in environmental requirements or an unanticipated significant adverse environmental event could have an adverse effect on our business. While we strive to ensure compliance, we cannot assure you that we have been, or will at all times be, in compliance with all environmental requirements, or that we will not incur material costs or liabilities in connection with these requirements. Private parties, including current and former employees, could bring personal injury or other claims against us due to the presence of, or exposure to, hazardous substances used, stored or disposed of by us, or contained in its products. We are also exposed to residual risk because some of our facilities and land may have environmental liabilities arising from their prior use. In addition, changes to environmental regulations may require us to modify existing plant and processing facilities and could significantly increase the cost of those operations.
Our inability to generate or obtain RINs could adversely affect our operating margins
Nearly all of our ethanol production is sold with RINs used by our customers to comply with the Renewable Fuel Standard, or RFS. If our ethanol production does not meet the requirements for RIN generation as administered by the U.S. Environmental Protection Agency, or EPA, in the future, we may be required to purchase additional RINs in the open market or sell our ethanol production at lower prices to compensate for the lack of RINs. Because of uncertainty surrounding how the EPA will implement proposed regulations, RIN prices have remained volatile and increased in 2014. In 2013 and 2014, prices for RINs have been significantly higher than in prior periods. We cannot predict the future prices of RINs as the cost of RINs is dependent upon a variety of factors, which include the availability of qualifying biofuels, the availability of RINs for purchase, the price at which RINs can be purchased, transportation fuel production levels, the mix of our ethanol and its fuel blending. If we fail to obtain sufficient RINs, or rely on invalid RINs, we could be subject to fines and penalties imposed by the EPA. The costs to generate or obtain the necessary number of RINs and any fines imposed for a failure to do so, could adversely affect our operating margins, which, in turn could adversely affect our results of operations, cash flows and financial condition.
In the past, one of our wholly-owned subsidiaries has traded ethanol and associated RINs acquired from third-parties, and may make such trades in the future. If it were to be discovered that we had purchased ethanol and associated RINs that were determined to have invalid ethanol RINs, albeit unknowingly, we could be subject to penalties. If assessed at the maximum amount allowed by law, such penalties could be substantial. However, EPA policy has been to assess very modest
20
penalties for RINs violations prior to 2013. With the industry now on notice of the possibility of invalid RINs, the EPA could assess much higher penalties going forward, and if we were subject to such penalties, it could have an adverse impact on our profitability.
Meeting the requirements of evolving environmental, health and safety laws and regulations, and in particular those related to climate change, could adversely affect our financial performance.
Our plants emit carbon dioxide as a by-product of the ethanol production process. In 2007, the U.S. Supreme Court classified carbon dioxide as an air pollutant under the Clean Air Act in a case seeking to require the EPA to regulate carbon dioxide in vehicle emissions. On February 3, 2010, the EPA released its final regulations on RFS II. We believe these final regulations grandfather our plants at their current authorized capacity, though expansion of our plants may need to meet a threshold of a 20% reduction in GHG emissions from a 2005 baseline measurement for the ethanol over current capacity to be eligible for the RFS II mandate. The EPA issued its final rule on GHG emissions from stationary sources under the Clean Air Act in May 2010.
Separately, CARB has adopted a LCFS requiring a 10% reduction in average carbon intensity of gasoline and diesel transportation fuels from 2010 to 2020. After a series of rulings that temporarily prevented CARB from enforcing these regulations, the State of California Office of Administrative Law approved the LCFS on November 26, 2012, and revised LCFS regulations took effect in January 2013. An ILUC component is included in this lifecycle GHG emissions calculation which may have an adverse impact on the market for corn-based ethanol in California.
These federal and state regulations may require us to apply for additional permits for our ethanol plants. In order to expand capacity at our plants, we may have to apply for additional permits, achieve EPA “efficient producer” status under the pathway petition program, install advanced technology, or reduce drying of certain amounts of distillers grains. We may also be required to install carbon dioxide mitigation equipment or take other steps unknown to us at this time in order to comply with other future law or regulation. Compliance with future law or regulation of carbon dioxide, or if we choose to expand capacity at certain of our plants, compliance with then-current regulation of carbon dioxide, could be costly and may prevent us from operating our plants as profitably, which may have an adverse impact on our operations, cash flows and financial position.
We operate in a highly competitive industry. Depending on commodity prices, foreign producers may produce ethanol at a lower cost than we can, which may result in lower ethanol prices which could adversely affect our financial results.
In the United States, we compete with other corn processors and refiners. Although some of our competitors are larger than we are, there are also many smaller competitors. Farm cooperatives comprised of groups of individual farmers have been able to compete successfully. As of December 31, 2014, the top ten domestic producers accounted for approximately 52% of all production, with production capacities ranging from approximately 300 mmgy to 1,800 mmgy. If our competitors consolidate or otherwise grow and we are unable to similarly increase our size and scope, our business and prospects may be significantly and adversely affected.
Our competitors also include plants owned by farmers who earn their livelihood through the sale of corn and competitors whose primary business is oil refining and retail gasoline sales. These competitors may continue to operate their plants when market conditions are uneconomic due to benefits realized in other operations.
Additionally, there is a risk of foreign competition in the ethanol industry. Foreign producers may, depending on feedstock, labor and other production costs, be able to produce ethanol cheaper than we can. Brazil is currently the second largest ethanol producer in the world. Brazil’s ethanol production is sugarcane based, as opposed to corn based, and, depending on feedstock prices, may be less expensive to produce. Under RFS II, certain parties were obligated to meet an advanced biofuel standard calling for 3.75 billion gallons of biofuels in 2014. In recent years, sugarcane ethanol imported from Brazil has been one of the most economical means for obligated parties to meet this standard.
While foreign demand, transportation costs and infrastructure constraints may temper the market impact throughout the United States, competition from imported ethanol may affect our ability to sell our ethanol profitably, which may have an adverse effect on our operations, cash flows and financial position.
If significant additional foreign ethanol production capacity is created, such facilities could create excess supplies of ethanol on world markets, which may result in lower prices of ethanol throughout the world, including the United States. Such foreign competition is a risk to our business. Any penetration of ethanol imports into the domestic market may have a
21
material adverse effect on our operations, cash flows and financial position.
Increased ethanol industry penetration by oil companies or other multinational companies may adversely impact our margins.
We operate in a very competitive environment. The ethanol industry is primarily comprised of smaller entities that engage exclusively in ethanol production and large integrated grain companies that produce ethanol along with their base grain businesses. We face competition for capital, labor, corn and other resources from these companies. Until recently, oil companies, petrochemical refiners and gasoline retailers have not been engaged in ethanol production to a large extent. These companies, however, form the primary distribution networks for marketing ethanol through blended gasoline. During the past five years, several large oil companies have entered the ethanol production market. If these companies increase their ethanol plant ownership or other oil companies seek to engage in direct ethanol production, there will be less of a need to purchase ethanol from independent ethanol producers like us. Such a structural change in the market could result in an adverse effect on our operations, cash flows and financial position.
We do not own our railcar fleet and our railcar assets are subject to lease agreements with several lessors.
Our fleet of railcars is leased by us from several lessors pursuant to lease agreements with remaining terms ranging from eight months to approximately seven years. If at the end of the terms under the lease agreements we or the applicable lessor do not elect to renew or extend the lease agreements, and we are unable to find replacement railcars on suitable terms, our operations may be negatively impacted. Furthermore, any renewal or extension of the lease agreements or any replacement lease agreements may not be on favorable commercial terms. To the extent we are unable to renew or replace such lease agreements on terms that are favorable to us, our revenues and cash flows could be adversely affected.
Tank cars used to transport crude oil and ethanol may need to be retrofitted or replaced to meet proposed new rail safety regulations.
The U.S. ethanol industry has long relied on railroads to deliver its product to market. We have approximately 2,200 leased tank cars. These leased tank cars may need to be retrofitted or replaced if new regulations proposed by the U.S. Department of Transportation, or DOT, to address concerns related to safety are adopted, which could in turn cause a shortage of compliant tank cars. The proposed regulations call for a phase out within four years of the use of legacy DOT-111 tank cars for transporting highly-flammable liquids, including ethanol. According to the proposed rule, the DOT expects about 66,000 tank cars to be retrofitted and about 23,000 cars to be shifted to transporting other liquids. The Canadian government has also proposed that its nation’s rail shippers use sturdier tank cars for transportation of crude oil and ethanol. Adoption of the proposed regulations, which could result in upgrades or replacements of our tank cars, would likely have an adverse effect on our operations as lease costs for tank cars would likely increase. Additionally, existing tank cars could be out of service for a period of time while such upgrades are made, tightening supply in an industry that is highly dependent on such railcars to transport its product.
Our revenue from the sale of distillers grains depends upon its continued market acceptance as an animal feed.
Distillers grains is a co-product from the fermentation of various crops, including corn, to produce ethanol. Antibiotics may be utilized during the fermentation process to control bacterial contamination; therefore antibiotics may be present in small quantities in distillers grains marketed as animal feed. The U.S. Food and Drug Administration’s, or FDA’s, Center for Veterinary Medicine has expressed concern about potential animal and human health hazards from the use of distillers grains as an animal feed due to the possibility of antibiotic residues. As a result, the market value of this co-product could be diminished if the FDA were to introduce regulations that limit the sale of distillers grains in the domestic market or for export to international markets, which in turn would have a negative impact on our profitability. If public perception of distillers grains as an acceptable animal feed were to change or if the public became concerned about the impact of distillers grains in the food supply, the market for distillers grains would be negatively impacted, which would have a negative impact on our profitability. Also, China, a significant global purchaser of distillers grains, may reject shipments of distillers grains due to the presence of unapproved genetically-modified organisms. If shipments to China are rejected or delayed, the market for distillers grains could be negatively impacted, which could have a negative impact on our profitability.
We extract non-edible corn oil from the whole stillage process immediately prior to the production of distillers grains. Several universities are trying to determine how corn oil extraction may affect nutritional energy values of the resulting distillers grains. If it is determined that corn oil extraction adversely affects the digestible energy content of distillers grains, the value of our distillers grains may be affected, which could have a negative impact on our profitability.
22
Our agribusiness operations are subject to significant governmental and private sector regulations.
Our agribusiness operations are subject to government regulation and regulation by certain private sector associations, compliance with which can impose significant costs on our business. Failure to comply with such regulations can result in additional costs, fines or criminal action. Production levels, markets and prices of the grains we merchandise are affected by federal government programs, which include acreage control and price support programs of the USDA. In addition, grain that we sell must conform to official grade standards imposed by the USDA. Other examples of government policies that can have an impact on our business include tariffs, duties, subsidies, import and export restrictions and outright embargos. Changes in government policies and producer supports may impact the amount and type of grains planted, which in turn, may impact our ability to buy grain in our market region. A portion of our grain sales may be to exporters. Therefore, the imposition of export restrictions or tariffs could limit our sales opportunities.
Our agribusiness segment is affected by the supply and demand of commodities, and is sensitive to factors that are often outside of our control.
Within our agribusiness segment, we compete with other grain merchandisers, grain processors and end-users for the purchase of grain, as well as with other grain merchandisers, private elevator operators and cooperatives for the sale of grain. Many of our grain competitors are significantly larger and compete in more diverse markets, and our failure to compete effectively would impact our profitability.
Fixed-price purchase obligations and carrying grain inventories subject us to the risk of market price fluctuations for periods of time between the time of purchase and final sale. Weather, economic, political, environmental and technological conditions and developments, both local and worldwide, as well as other factors beyond our control, can affect the supply and demand of these commodities and expose them to liquidity pressures due to rapidly rising or falling market prices. Changes in the supply and demand of these commodities can also affect the value of inventories held for resale. Fluctuating costs of grain inventory could decrease operating margins and adversely affect profitability of the agribusiness segment.
While our grain business hedges the majority of its grain inventory positions with derivative instruments to manage risk associated with commodity price changes, including purchase and sale contracts, we are unable to hedge all of the price risk of each transaction due to timing, unavailability of hedge contract counterparties and third-party credit risk. Furthermore, there is a risk that the derivatives we employ will not be effective in offsetting the changes associated with the risks we are attempting to manage. This can happen when the derivative and the hedged item are not perfectly matched. Our grain derivatives, for example, do not hedge the basis pricing component of our grain inventory and contracts. Basis is defined as the difference between the cash price of a commodity in one of our grain facilities and the nearest in time exchange-traded futures price. Differences can reflect time periods, locations or product forms. Although the basis component is smaller and generally less volatile than the futures component of grain market prices, significant unfavorable basis movement on grain positions as large as ours may significantly impact our profitability.
Commodities futures trading is subject to extensive regulation.
Certain of our operating segments use exchange-traded futures contracts as part of their hedging strategies or for other purposes. The futures industry is subject to extensive regulation. We are required to comply with a wide range of requirements imposed by the Commodity Futures Trading Commission, National Futures Association and the exchanges on which we trade. These regulatory bodies are responsible for safeguarding the integrity of futures markets and protecting the interests of participants in those markets. As a market participant, we may be subject to regulation concerning trade practices, business conduct, trade reporting, position limits, record retention, the conduct of our officers and employees, and other matters.
Failure to comply with any of the laws, rules or regulations applicable to futures trading could have adverse consequences. It is possible that we and our officers and other employees may be subject to claims arising from acts that regulators assert were in contravention of these laws, rules or regulations. These claims may result in the payment of fines, settlements or the suspension of trading privileges for us or our officers or employees. Such sanctions could have a material adverse impact on our business, financial condition or operating results.
23
Owning and operating a cattle-feeding business is affected by many external factions that could negatively impact our business, results of operations and financial condition.
Cattle-feeding operations involve numerous risks, including:
|
· |
the cost and supply of livestock and feed ingredients and the selling price of our cattle, which are determined by constantly changing and potentially volatile market forces of supply and demand as well as other factors over which we have little or no control; |
|
· |
any outbreak of disease in our feedlot or elsewhere domestically, or even in other countries, or the perception by the public that an outbreak has occurred, could reduce consumer confidence in the safety and quality of beef products, generate adverse publicity, lead to inadequate supply, result in cancellation of orders by customers or result in the imposition of import or export restrictions; |
|
· |
any contamination, or allegations of contamination, of our products or those of our competitors that may subject us to product liability claims or product recalls; |
|
· |
potential for liability in excess of insurance policy limits, or related to uninsurable risks, if outbreaks of disease or other conditions result in significant losses; |
|
· |
an inability to attract sufficient custom-feeding customers to maximize operational efficiencies; |
|
· |
the loss of one or more significant customers, a significant decline in the volume of orders from customers or a significant decrease in beef product prices for a sustained period of time; |
|
· |
defaults by customers on financing of cattle or feed and other inputs; |
|
· |
diminished access to international markets, including the closing of borders by foreign countries to product imports due to disease or other perceived health or food safety issues, changes in political or economic conditions, or general trade restrictions; |
|
· |
potential reductions in consumption of red meat (whether due to dietary changes or other issues) leading to depressed cattle prices; |
|
· |
water use restrictions, including those related to diminishing water table levels, that increase costs; |
|
· |
operational restrictions resulting from government regulations; and |
|
· |
risks relating to environmental hazards. |
These items may lead to increased costs or decreased demand or prices for beef products, any of which could have an adverse effect on our business, results of operations and financial condition.
Our operating results may suffer if our marketing and sales efforts are not effective.
We have established our own marketing, transportation and storage infrastructure. We lease tanker railcars and have contracted with storage terminals near our customers and at strategic locations for efficient delivery of our finished ethanol product. We have also hired a marketing and sales force, as well as logistical and other operational personnel to staff our distribution activities. The marketing, sales, distribution, transportation, storage or administrative efforts we have implemented may not achieve expected results. Any failure to successfully execute these efforts would have a material adverse effect on our results of operations and financial position. Our financial results also may be adversely affected by our need to establish inventory in storage locations to fulfill our marketing and distribution contracts.
Our debt level could negatively impact our financial condition, results of operations and business prospects.
As of December 31, 2014, our total debt was $672.8 million. Our level of debt could have significant consequences to our shareholders, including the following:
|
· |
requiring the dedication of a substantial portion of cash flow from operations to make payments on debt, thereby reducing the availability of cash flow for working capital, capital expenditures and other general business activities; |
|
· |
requiring a substantial portion of our corporate cash reserves to be held as a reserve for debt service, limiting our ability to invest in new growth opportunities; |
24
|
· |
limiting the ability to obtain additional financing in the future for working capital, capital expenditures, acquisitions and general corporate and other activities; |
|
· |
limiting the flexibility in planning for, or reacting to, changes in the business and industry in which we operate; |
|
· |
increasing our vulnerability to both general and industry-specific adverse economic conditions; |
|
· |
being at a competitive disadvantage against less leveraged competitors; |
|
· |
being vulnerable to increases in prevailing interest rates; |
|
· |
subjecting all or substantially all of our assets to liens, which means that there may be no assets left for shareholders in the event of a liquidation; and |
|
· |
limiting our ability to make business and operational decisions regarding our business and subsidiaries, including, among other things, limiting our subsidiaries’ ability to pay dividends, make capital improvements, sell or purchase assets or engage in transactions deemed appropriate and in our best interest. |
Most of our debt bears interest at variable rates, which creates exposure to interest rate risk. If interest rates increase, our debt service obligations with respect to the variable rate indebtedness would increase even though the amount borrowed remained the same, and our net income would decrease.
Our ability to make scheduled payments of principal and interest, or to refinance our indebtedness, depends on our future performance, which is subject to economic, financial, competitive and other factors beyond our control. Our business may not continue to generate cash flow in the future sufficient to service our debt because of factors beyond our control, including but not limited to the spread between corn prices and ethanol and distillers grains prices. If we are unable to generate sufficient cash flows, we may be required to adopt one or more alternatives, such as selling assets, restructuring debt or obtaining additional equity capital on terms that may be onerous or highly dilutive. Our ability to refinance our indebtedness will depend on the capital markets and our financial condition at such time. We may not be able to engage in any of these activities or engage in these activities on desirable terms, which could result in a default on our debt obligations.
Despite our current debt levels, we and our subsidiaries may incur substantially more debt or take other actions which would intensify the risks discussed above.
Despite our current debt levels, we and our subsidiaries may incur additional debt in the future, including secured debt. We and certain of our subsidiaries are not currently restricted under the terms of our debt from incurring additional debt, pledging assets, recapitalizing our debt or taking a number of other actions that are not limited by the terms of the debt but that could diminish our ability to make payments thereunder.
Our existing debt arrangements require us to abide by certain restrictive loan covenants that may hinder our ability to operate and reduce our profitability.
The loan agreements governing secured debt financing at our subsidiaries and the 3.25% Convertible Senior Notes due 2018, or the 3.25% Notes, contain a number of restrictive affirmative and negative covenants. These covenants limit the ability of our subsidiaries to, among other things, incur additional indebtedness, make capital expenditures above certain limits, pay dividends or distributions, merge or consolidate, or dispose of substantially all of their assets.
For certain loan agreements, we are also required to maintain specified financial ratios, including minimum cash flow coverage, minimum working capital and minimum net worth. Some of our loan agreements require us to utilize a portion of any excess cash flow generated by operations to prepay the respective term debt. A breach of any of these covenants or requirements could result in a default under our loan agreements. If any of our subsidiaries default, and if such default is not cured or waived, our lenders could, among other remedies, accelerate their debt and declare that debt immediately due and payable. If this occurs, we may not be able to repay such debt or borrow sufficient funds to refinance. Even if new financing is available, it may not be on terms that are acceptable. No assurance can be given that the future operating results of our subsidiaries will be sufficient to achieve compliance with such covenants and requirements, or in the event of a default, to remedy such default.
25
In the past, we have received waivers from our lenders for failure to meet certain financial covenants and have amended our subsidiary loan agreements to change these covenants. No assurance can be given that, if we are unable to comply with these covenants in the future, we will be able to obtain the necessary waivers or amend our subsidiary loan agreements to prevent a default. Default by us or any of our subsidiaries with respect to any loan in excess of $10.0 million constitutes an event of default under the 3.25% Notes, which could result in the convertible senior notes being declared due and payable.
We operate in capital intensive businesses and rely on cash generated from operations and external financing. Limitations on access to external financing could adversely affect our operating results.
Some ethanol producers have faced financial distress, culminating with bankruptcy filings by several companies over the past five years. This, in combination with continued volatility in the capital markets has resulted in reduced availability of capital for the ethanol industry generally. Construction of our plants and anticipated levels of required working capital were funded under long-term credit facilities. Increases in liquidity requirements could occur due to, for example, increased commodity prices. Our operating cash flow is dependent on our ability to profitably operate our businesses and overall commodity market conditions. In addition, we may need to raise additional financing to fund growth of our businesses. In some market environments, we may experience limited access to incremental financing. This could cause us to defer or cancel growth projects, reduce our business activity or, if we are unable to meet our debt repayment schedules, cause a default in our existing debt agreements. These events could have an adverse effect on our operations and financial position.
Our subsidiaries’ debt facilities have ongoing payment requirements which we generally expect to meet from their operating cash flow. Our ability to repay current and anticipated future indebtedness will depend on our financial and operating performance and on the successful implementation of our business strategies. Our financial and operational performance will depend on numerous factors including prevailing economic conditions, volatile commodity prices, and financial, business and other factors beyond our control. If we cannot pay our debt service, as well as refinance or extend current debt at scheduled maturity dates, we may be forced to reduce or delay capital expenditures, sell assets, restructure our indebtedness or seek additional capital. If we are unable to restructure our indebtedness or raise funds through sales of assets, equity or otherwise, our ability to operate could be harmed and the value of our stock could be significantly reduced.
We are a holding company, and there are limitations on our ability to receive distributions from our subsidiaries.
We conduct most of our operations through subsidiaries and are dependent upon dividends or other intercompany transfers of funds from our subsidiaries to generate free cash flow. Moreover, some of our subsidiaries are currently, or are expected in the future to be, limited in their ability to pay dividends or make distributions to us by the terms of their financing agreements. Consequently, we are not able to rely on the cash flow from one subsidiary to satisfy the loan obligations of another subsidiary. As a result, if a subsidiary is unable to satisfy its loan obligations, we may not be able to prevent a default on the loan by providing additional cash to that subsidiary, even if sufficient cash exists elsewhere in our consolidated organization.
Our success may depend on our ability to manage our growing and changing operations.
Since our formation in 2004, our business has grown significantly in size and complexity. This growth has placed, and is expected to continue to place, significant demands on our management, systems, internal controls and financial and physical resources. In addition, if we acquire additional operations, we expect that we will need to further develop our financial and managerial controls and reporting systems to accommodate future growth. This will require us to incur expenses related to hiring additional qualified personnel, retaining professionals to assist in developing the appropriate control systems and expanding our information technology infrastructure. Our inability to manage growth effectively could have an adverse effect on our results of operations, financial position and cash flows.
Future acquisitions may involve the issuance of equity securities as payment or in connection with financing the business or assets acquired and, as a result, could dilute your ownership interest. In addition, additional debt may be necessary in order to complete these transactions, which could have a material adverse effect on our financial condition. The failure to successfully evaluate and execute acquisitions or joint ventures or otherwise adequately address the risks associated with acquisitions or joint ventures could have a material adverse effect on our business, results of operations and financial condition.
26
We may fail to realize all of the anticipated benefits of mergers and acquisitions that we have undertaken or may undertake because of integration challenges.
We have increased the size of our operations significantly through mergers and acquisitions and intend to continue to explore potential merger or acquisition opportunities. The anticipated benefits and cost savings of such mergers and acquisitions may not be realized fully, or at all, or may take longer to realize than expected. Acquisitions involve numerous risks, any of which could harm our business, including:
|
· |
difficulties in integrating the operations, technologies, products, existing contracts, accounting processes and personnel of the target and realizing the anticipated synergies of the combined businesses; |
|
· |
risks relating to environmental hazards on purchased sites; |
|
· |
risks relating to acquiring or developing the infrastructure needed for facilities or acquired sites, including access to rail networks; |
|
· |
difficulties in supporting and transitioning customers, if any, of the target company; |
|
· |
diversion of financial and management resources from existing operations; |
|
· |
the purchase price or other devoted resources may exceed the value realized, or the value we could have realized if the purchase price or other resources had been allocated to another opportunity; |
|
· |
risks of entering new markets or areas in which we have limited or no experience, or are outside our core competencies; |
|
· |
potential loss of key employees, customers and strategic alliances from either our current business or the business of the target; |
|
· |
assumption of unanticipated problems or latent liabilities, such as problems with the quality of the target company’s products; and |
|
· |
inability to generate sufficient revenue to offset acquisition costs and development costs. |
We also may pursue growth through joint ventures or partnerships. Partnerships and joint ventures typically involve restrictions on actions that the partnership or joint venture may take without the approval of the partners. These types of provisions may limit our ability to manage a partnership or joint venture in a manner that is in our best interest but is opposed by our other partner or partners.
Future acquisitions may involve the issuance of equity securities as payment or in connection with financing the business or assets acquired and, as a result, could dilute your ownership interest. In addition, additional debt may be necessary in order to complete these transactions, which could have a material adverse effect on our financial condition. The failure to successfully evaluate and execute acquisitions or joint ventures or otherwise adequately address the risks associated with acquisitions or joint ventures could have a material adverse effect on our business, results of operations and financial condition.
We may fail to realize the anticipated benefits of our joint venture to commercialize algae production.
We have majority ownership in a joint venture that is focused on developing technology to grow and harvest algae, which consume carbon dioxide, in commercially viable quantities. We do not possess requisite control of this investment to consolidate it. The algae produced have the potential to be used for high-quality feedstocks for human nutrition, pharmaceutical applications, animal feed and biofuels, but our current primary focus is on efficiently growing and developing primary markets for algae on a large scale. We believe this technology has specific applications with facilities that emit carbon dioxide, including ethanol plants. However, we may fail to realize the expected benefits of capturing carbon dioxide to grow and harvest algae as acceptable production rates, operating costs, capital requirements and product market prices may not be achieved.
27
Our ability to successfully operate is dependent on the availability of energy and water at anticipated prices.
Our plants require a significant and uninterrupted supply of natural gas, electricity and water to operate. We rely on third parties to provide these resources. We cannot assure you that we will be able to secure an adequate supply of energy or water to support current and expected plant operations. If there is an interruption in the supply of energy or water for any reason, such as supply, delivery or mechanical problems, we may be required to halt production. If production is halted for an extended period of time, it may have a material adverse effect on our operations, cash flows and financial position.
Replacement technologies that are under development might result in the obsolescence of corn-derived ethanol or our process systems.
Ethanol is primarily an additive and oxygenate for blended gasoline. Although use of oxygenates is currently mandated, there is always the possibility that a preferred alternative product will emerge and eclipse the current market. Critics of ethanol blends argue that ethanol decreases fuel economy, causes corrosion of ferrous components and damages fuel pumps. Any alternative oxygenate product would likely be a form of alcohol (like ethanol) or ether (like MTBE). Prior to federal restrictions and ethanol mandates, MTBE was the dominant oxygenate. It is possible that other ether products could enter the market and prove to be environmentally or economically superior to ethanol. It is also possible that alternative biofuel alcohols such as methanol and butanol could evolve into ethanol replacement products.
Research is currently underway to develop other products that could directly compete with ethanol and may have more potential advantages than ethanol. Advantages of such competitive products may include, but are not limited to: lower vapor pressure, making it easier to add gasoline; energy content closer to or exceeding that of gasoline, such that any decrease in fuel economy caused by the blending with gasoline is reduced; an ability to blend at a higher concentration level for use in standard vehicles; reduced susceptibility to separation when water is present; and suitability for transportation in petroleum pipelines. Such products could have a competitive advantage over ethanol, making it more difficult to market our ethanol, which could reduce our ability to generate revenue and profits.
New ethanol process technologies may emerge that require less energy per gallon produced. The development of such process technologies would result in lower production costs. Our process technologies may become outdated and obsolete, placing us at a competitive disadvantage against competitors in the industry. The development of replacement technologies may have a material adverse effect on our operations, cash flows and financial position.
We may be required to provide remedies for the delivery of off-specification ethanol, distillers grains or corn oil.
If we produce or purchase ethanol, distillers grains or corn oil that does not meet the specifications defined by our sales contract, we may be subject to quality claims requiring us to refund the purchase price of any non-conforming product or replace any non-conforming product at our expense. We may be forced to purchase replacement quantities of ethanol, distillers grains or corn oil at higher prices to fulfill these contractual obligations. In addition, ethanol, distillers grains or corn oil purchased from other producers, including producers that we provide marketing and distribution services for, and subsequently sold to others may result in similar claims if the product does not meet applicable contract specifications.
We are exposed to credit risk resulting from the possibility that a loss may occur from the failure of our contractual counterparties to perform according to the terms of our agreements.
In selling ethanol, distillers grains and corn oil we may experience concentrations of credit risk from a variety of customers, including major integrated oil companies, large independent refiners, petroleum wholesalers, other marketers and jobbers. We are also exposed to credit risk resulting from sales of grain to large commercial buyers, including other ethanol plants. Our fixed-price forward contracts also result in credit risk when prices change significantly prior to delivery. In addition, we may prepay for or make deposits on undelivered inventories. Concentrations of credit risk with respect to inventory advances are primarily with a few major suppliers of petroleum products and agricultural inputs. The inability of a third party to make payments to us for our sales, to provide product to us on advances made, or to perform on fixed-price contracts may cause us to experience losses and may adversely impact our liquidity and our ability to make our payments when due.
28
A loss may occur from the failure of our counterparties to perform according to the terms of their marketing agreements.
Under our third-party marketing agreement, we purchase all of a third-party producer’s ethanol production. In turn, we sell the ethanol in various markets for future deliveries. Under this marketing agreement, the third-party producer is not obligated to produce any minimum amount of ethanol and we cannot assure you that we will receive the full amount of ethanol that this third-party plant is expected to produce. The interruption or curtailment of production by this third-party producer for any reason could cause us to be unable to deliver quantities of ethanol sold under the contract. As a result, we may be forced to purchase replacement quantities of ethanol at higher prices to fulfill this contractual obligation. However, these recoveries would be dependent on our third-party producer’s ability to pay, and in the event they were unable to pay, our profitability could be materially and adversely impacted.
We are exposed to potential business disruption from factors outside our control, including natural disasters, seasonality, severe weather conditions, accidents, and unforeseen operational failures due to faulty construction design or other factors, any of which could adversely affect our cash flows and operating results.
Potential business disruption in available transportation due to natural disasters, significant track damage resulting from a train derailment, or strikes by our transportation providers could result in delays in procuring and supplying raw materials to our ethanol or grain facilities, or transporting ethanol and distillers grains to our customers. We also run the risk of unforeseen operational issues, due to faulty construction design or other factors that may result in an extended facility shutdown. Such business disruptions would cause the normal course of our business operations to stall and may result in our inability to meet customer demand or contract delivery requirements, as well as the potential loss of customers.
Many of our grain business activities, as well as corn procurement for our ethanol plants, are dependent on weather conditions. Adverse weather may result in a reduction in grain harvests caused by inadequate or excessive amounts of rain during the growing season, or by overly wet conditions, an early freeze or snowy weather during the harvest season. Additionally, corn stored in an open pile may become damaged by too much rain and warm weather before the corn is dried, shipped, consumed or moved into a storage structure.
Casualty losses may occur for which we have not secured adequate insurance.
We have acquired insurance that we believe to be adequate to prevent loss from material foreseeable risks. However, events occur for which no insurance is available or for which insurance is not available on terms that are acceptable to us. Loss from such an event, such as, but not limited to war, riot, terrorism or other risks, may not be insured and such a loss may have a material adverse effect on our operations, cash flows and financial position.
Our Obion, Tennessee plant is located within a recognized seismic zone as are certain of our fuel terminals. The design of the Obion facility has been modified to fortify it to meet structural requirements for that region of the country. We have also obtained additional insurance coverage specific to earthquake risk for this plant and the fuel terminals. However, there is no assurance that any such facility would remain in operation if a seismic event were to occur.
Terrorist attacks, cyber-attacks, threats of war or actual war, or failure of our internal computer network and applications to operate as designed may negatively affect our operations.
Terrorist attacks in the United States, as well as events occurring in response to or in connection with them, including threats of war or actual war, may adversely affect our operations. Ethanol-related assets (including ethanol production plants, storage facilities, fuel terminals and railcars such as those owned and operated by us) may be at greater risk of future terrorist attacks than other possible targets. A direct attack on our assets or assets used by us could have a material adverse effect on our financial condition, results of operations and cash flows. In addition, any terrorist attack could have an adverse impact on ethanol prices. Disruption or significant increases in ethanol prices could result in government-imposed price controls.
We rely on network infrastructure and enterprise applications, and internal technology systems for our operational, marketing support and sales, and product development activities. The hardware and software systems related to such activities are subject to damage from earthquakes, floods, lightning, tornados, fire, power loss, telecommunication failures and other similar events. They are also subject to acts such as computer viruses, physical or electronic vandalism or other similar disruptions that could cause system interruptions and loss of critical data, and could prevent us from fulfilling our customers’ orders. We cannot assure that any of our backup systems would be sufficient. Any event that causes failures or interruption in our hardware or software systems could result in disruption of our business operations, have a negative impact on our operating results, and damage our reputation.
29
We may not be able to hire and retain qualified personnel to operate our ethanol plants.
Our success depends, in part, on our ability to attract and retain competent personnel. Qualified managers, engineers, merchandisers, operations and other personnel must be hired for each of our locations. Competition for such employees in the ethanol industry can be intense, and we may not be able to attract and retain qualified personnel. If we are unable to hire and retain productive and competent personnel, the amount of ethanol we produce may decrease and we may not be able to efficiently operate our ethanol plants and execute our business strategy.
Our access to capital may be negatively impacted if disruptions in credit markets occur or if credit rating downgrades occur.
Events may occur which could cause us to seek additional capital. If rating agencies downgrade our credit rating or disruptions in credit markets were to occur, the cost of debt under our existing financing arrangements, as well as future financing arrangements and borrowings, could increase. Access to capital markets could become unavailable or may only be available under less favorable terms. A downgrade of our credit ratings may also affect our ability to trade with various commercial counterparties or cause our counterparties to require other forms of credit support.
We have had a history of operating losses and may incur future operating losses.
We incurred operating losses from 2006 to 2008, as well as during the first three quarters of 2012, and may incur operating losses in the future, which could be substantial. Although we have had periods of sustained profitability, we may not be able to maintain or increase profitability on a quarterly or annual basis, which could result in a decrease in the trading price of our common stock.
Risks relating to ownership of our common stock
The price of our common stock may be volatile.
The trading price of our common stock may be highly volatile and could be subject to fluctuations in response to a number of factors beyond our control. Some of these factors are:
|
· |
our results of operations and the performance of our competitors; |
|
· |
the public’s reaction to our press releases, other public announcements and filings with the SEC; |
|
· |
changes in earnings estimates or recommendations by research analysts who follow us or other companies in our industry; |
|
· |
changes in general economic conditions; |
|
· |
changes in market prices for our products or for our raw materials; |
|
· |
actions of our historical equity investors, including sales of common stock by our directors, executive officers and significant shareholders; |
|
· |
actions by institutional investors trading in our stock; |
|
· |
disruption of our operations; |
|
· |
any major change in our management team; |
|
· |
other developments affecting us, our industry or our competitors; and |
|
· |
U.S. and international economic, legal and regulatory factors unrelated to our performance. |
In recent years the stock market has experienced significant price and volume fluctuations. These fluctuations may be unrelated to the operating performance of particular companies. These broad market fluctuations may cause declines in the market price of our common stock. The price of our common stock could fluctuate based upon factors that have little or nothing to do with our Company or its performance, and those fluctuations could materially reduce our common stock price.
30
Anti-takeover provisions could make it difficult for a third party to acquire us.
Our second amended and restated articles of incorporation, our amended and restated bylaws and Iowa law contain anti-takeover provisions that could have the effect of delaying or preventing changes in control of us or our management. These provisions could also discourage proxy contests and make it more difficult for our shareholders to elect directors and take other corporate actions without the concurrence of our Board of Directors. The provisions in our charter documents include the following:
|
· |
a classified Board of Directors pursuant to which our directors are divided into three classes, with three-year staggered terms; |
|
· |
members of our Board of Directors can only be removed for cause by shareholders with the affirmative vote of not less than two-thirds of the outstanding shares of capital stock; |
|
· |
shareholder action may be taken only at a special or annual meeting, and not by any written consent, except where required by Iowa law; |
|
· |
our bylaws restrict our shareholders’ ability to make proposals at shareholder meetings; and |
|
· |
our Board of Directors has the ability to cause us to issue authorized and unissued shares of stock from time to time. |
We are subject to the provisions of the Iowa Business Corporations Act, or IBCA, under which, certain business combinations between an Iowa corporation whose stock is publicly traded or held by more than 2,000 shareholders and an interested shareholder are prohibited for a three-year period following the date that such a shareholder became an interested shareholder unless certain exemption requirements are met. In addition, certain other provisions of the IBCA may have anti-takeover effects in certain situations.
Certain provisions in the convertible notes and the related indenture could make it more difficult or more expensive for a third party to acquire us. For example, if a takeover would constitute a fundamental change, holders of the notes will have the right to require us to repurchase their notes in cash. In addition, if a takeover constitutes a make-whole fundamental change, we may be required to increase the conversion rate for holders who convert their notes in connection with such takeover. In either case, and in other cases, our obligations under the notes and the related indenture could increase the cost of acquiring us or otherwise discourage a third party from acquiring us or removing incumbent management.
The foregoing items may discourage transactions that otherwise could provide for the payment of a premium over prevailing market prices of our common stock and also could limit the price that investors are willing to pay in the future for shares of our common stock.
Non-U.S. holders may be subject to U.S. income tax with respect to gain on disposition of their common stock.
If we are or have been a U.S. real property holding corporation at any time within the shorter of the five-year period preceding a disposition of common stock by a non-U.S. holder or such holder’s holding period of the stock disposed of, such non-U.S. holder may be subject to United States federal income tax with respect to gain on such disposition. Because the determination of whether we are a USRPHC depends on the fair market value of our United States real property interests relative to the fair market value of our other trade or business assets and our non-U.S. real property interests, there can be no assurance that we are not a USRPHC or will not become one in the future.
31
Item 1B. Unresolved Staff Comments.
None.
Our loan agreements grant a security interest in substantially all of our owned real property. See Note 10 – Debt included herein as part of the Notes to Consolidated Financial Statements for a discussion of our loan agreements.
Corporate
We currently lease approximately 30,000 square feet of office space at 450 Regency Parkway in Omaha, Nebraska for our corporate headquarters, which houses our corporate administrative functions and commodity trading operations.
Ethanol Production Segment
As detailed in our discussion of the ethanol production segment, we own a total of approximately 2,000 acres of land at and in areas surrounding our ethanol plants with a combined annual ethanol production capacity of over one billion gallons. We believe that the property owned and leased at the sites of our ethanol plants will be adequate to accommodate our current needs, as well as potential expansion, at those sites.
Agribusiness Segment
As detailed in our discussion of the agribusiness segment above, we own a total of approximately 50 acres of land at our grain elevators with a combined grain storage capacity of 9.0 million bushels, and own approximately 2,600 acres of land at our cattle-feeding operation, which has the capacity to support 70,000 head of cattle, and approximately 3.8 million bushels of grain storage capacity. We believe that the property owned will be adequate to accommodate our current needs, as well as potential expansion, at those sites.
Marketing and Distribution Segment
Our ethanol, distillers grains and corn oil marketing operations are primarily located at our corporate office, which is discussed above. We also lease office space in McKinney, Texas and Des Moines, Iowa for these operations. We own approximately 9.0 acres of land and lease approximately 19 acres of land at eight locations in seven south central U.S. states, as disclosed in Item 1 – Business, for our fuel terminal services. We believe that the property owned and leased at the locations will be adequate to accommodate our current needs, as well as potential expansion.
We are currently involved in litigation that has arisen in the ordinary course of business; however, we do not believe that any of this litigation will have a material adverse effect on our financial position, results of operations or cash flows.
Item 4. Mine Safety Disclosures.
Not applicable.
32
PART II
Item 5. Market for Registrant’s Common Equity, Related Stockholder Matters and Issuer Purchases of Equity Securities.
Our common stock trades under the symbol “GPRE” on The NASDAQ Global Market, or NASDAQ. The following table sets forth, for the periods indicated, the high and low common stock sale prices as reported by NASDAQ.
|
Year Ended December 31, 2014 |
High |
Low |
||||
|
Three months ended December 31, 2014 (1) |
$ |
37.77 |
$ |
21.19 | ||
|
Three months ended September 30, 2014 |
46.28 | 32.56 | ||||
|
Three months ended June 30, 2014 |
33.52 | 25.62 | ||||
|
Three months ended March 31, 2014 |
31.57 | 18.02 | ||||
|
Year Ended December 31, 2013 |
High |
Low |
||||
|
Three months ended December 31, 2013 |
$ |
20.00 |
$ |
13.78 | ||
|
Three months ended September 30, 2013 |
18.40 | 13.37 | ||||
|
Three months ended June 30, 2013 |
16.54 | 10.32 | ||||
|
Three months ended March 31, 2013 |
12.40 | 7.51 | ||||
|
(1) The closing price of our common stock on December 31, 2014 was $24.78. |
||||||
Holders of Record
As of December 31, 2014, as reported to us by our transfer agent, there were 2,296 holders of record of our common stock, not including beneficial holders whose shares are held in names other than their own. This figure does not include approximately 32.3 million shares held in depository trusts.
Dividend Policy
In August 2013, our Board of Directors approved the initiation of a quarterly cash dividend. We paid a quarterly cash dividend of $0.04 per share during the third and fourth quarters of 2013, as well as the first and second quarters of 2014, and a dividend of $0.08 per share during the third and fourth quarters of 2014. We anticipate declaring a cash dividend in future quarters on a regular basis; however, future declarations of dividends are subject to Board approval and may be adjusted as our liquidity, business needs or market conditions change.
Issuer Purchases of Equity Securities
Employees surrender shares upon the vesting of restricted stock grants to satisfy statutory minimum required payroll tax withholding obligations. The following table sets forth the shares that were surrendered by month during the fourth quarter of 2014.
|
Month |
Total Number of Shares Withheld |
Average Price Paid per Share |
|||
|
October |
- |
$ |
- |
||
|
November |
2,022 | 34.20 | |||
|
December |
- |
- |
|||
|
Total |
2,022 |
$ |
34.20 | ||
In August 2014, we announced a share repurchase program of up to $100 million of our common stock. Under the share repurchase program, we may repurchase shares from time to time in open market transactions, privately-negotiated transactions, accelerated share buyback programs, tender offers or by other means. The timing and amount of repurchase transactions will be determined by our management based on its evaluation of market conditions, share price, legal requirements and other factors. The program may be suspended, modified or discontinued at any time without prior notice. No shares have been repurchased pursuant to this repurchase program.
33
Recent Sales of Unregistered Securities
None.
Equity Compensation Plans
Refer to Part III, Item 12, contained herein, for information regarding shares authorized for issuance under equity compensation plans.
Performance Graph
The following line-graph compares our cumulative stockholder return on an indexed basis with the NASDAQ Composite Index (IXIC) and the NASDAQ Clean Edge Green Energy Index (CELS) for the years ended December 31, 2010, 2011, 2012, 2013 and 2014. The graph assumes that the value of the investment in our common stock and each index was $100 at December 31, 2009, and that all dividends were reinvested.
|
12/09 |
12/10 |
12/11 |
12/12 |
12/13 |
12/14 |
|||||||||||||
|
Green Plains Inc. |
$ |
100.00 |
$ |
75.72 |
$ |
65.64 |
$ |
53.19 |
$ |
130.96 |
$ |
168.64 | ||||||
|
NASDAQ Composite |
100.00 | 117.61 | 118.70 | 139.00 | 196.83 | 223.74 | ||||||||||||
|
NASDAQ Clean Edge Green Energy |
100.00 | 104.21 | 63.71 | 65.59 | 121.90 | 126.44 | ||||||||||||
The information contained in the Performance Graph will not be deemed to be soliciting material or to be filed with the SEC, nor will such information be incorporated by reference into any future filing under the Securities Act of 1933, as amended, or the Securities Act, or under the Securities Exchange Act of 1934, except to the extent that we specifically incorporate it by reference into any such filing.
34
Item 6. Selected Financial Data.
The following selected financial data have been derived from our consolidated financial statements. The statement of operations data for the years ended December 31, 2014, 2013 and 2012, and the balance sheet data as of December 31, 2014 and 2013 are derived from and should be read in conjunction with our audited consolidated financial statements, including accompanying notes, included elsewhere in this report. The statement of operations data for the years ended December 31, 2011 and 2010, and the balance sheet data as of December 31, 2012, December 31, 2011 and December 31, 2010 were derived from our audited consolidated financial statements not included in this report, which also contain a description of a number of matters that materially affect the comparability of the periods presented. The data should be read together with Item 7 – Management’s Discussion and Analysis of Financial Condition and Results of Operations of this report. The financial information below is not necessarily indicative of results to be expected for any future period. Future results could differ materially from historical results due to many factors, including those discussed in Item 1A – Risk Factors of this report.
|
Year Ended December 31, |
||||||||||||||
|
2014 |
2013 |
2012 |
2011 |
2010 |
||||||||||
|
Statement of Operations Data: |
||||||||||||||
|
(in thousands, except per share information) |
||||||||||||||
|
Revenues |
$ |
3,235,611 |
$ |
3,041,011 |
$ |
3,476,870 |
$ |
3,553,712 |
$ |
2,133,922 | ||||
|
Cost of goods sold |
2,860,813 | 2,867,991 | 3,380,099 | 3,381,480 | 1,981,396 | |||||||||
|
Gross profit |
374,798 | 173,020 | 96,771 | 172,232 | 152,526 | |||||||||
|
Selling, general and administrative expenses |
(88,524) | (65,169) | (79,019) | (73,219) | (60,475) | |||||||||
|
Gain on disposal of assets (1) |
- |
- |
47,133 |
- |
- |
|||||||||
|
Operating income |
286,274 | 107,851 | 64,885 | 99,013 | 92,051 | |||||||||
|
Total other expense |
(35,844) | (35,570) | (39,729) | (37,114) | (26,000) | |||||||||
|
Net income |
159,504 | 43,391 | 11,763 | 38,213 | 48,162 | |||||||||
|
Net income attributable to Green Plains |
159,504 | 43,391 | 11,779 | 38,418 | 48,012 | |||||||||
|
Earnings per share attributable to Green Plains: |
||||||||||||||
|
Basic |
$ |
4.37 |
$ |
1.44 |
$ |
0.39 |
$ |
1.09 |
$ |
1.55 | ||||
|
Diluted |
$ |
3.96 |
$ |
1.26 |
$ |
0.39 |
$ |
1.01 |
$ |
1.51 | ||||
|
Other Data: |
||||||||||||||
|
EBITDA (unaudited and in thousands) (2) |
$ |
350,700 |
$ |
156,640 |
$ |
115,505 |
$ |
148,620 |
$ |
129,550 | ||||
|
December 31, |
||||||||||||||
|
2014 |
2013 |
2012 |
2011 |
2010 |
||||||||||
|
Balance Sheet Data (in thousands): |
||||||||||||||
|
Cash and cash equivalents |
$ |
425,510 |
$ |
272,027 |
$ |
254,289 |
$ |
174,988 |
$ |
233,205 | ||||
|
Current assets |
910,910 | 633,305 | 568,035 | 576,420 | 606,686 | |||||||||
|
Total assets |
1,828,557 | 1,532,045 | 1,349,734 | 1,420,828 | 1,397,779 | |||||||||
|
Current liabilities |
511,540 | 409,197 | 432,384 | 360,965 | 342,503 | |||||||||
|
Long-term debt |
399,440 | 480,746 | 362,549 | 493,407 | 527,900 | |||||||||
|
Total liabilities |
1,031,108 | 986,687 | 859,232 | 915,471 | 900,137 | |||||||||
|
Stockholders' equity |
797,449 | 545,358 | 490,502 | 505,357 | 497,642 | |||||||||
(1) In December 2012, we sold 12 grain elevators located in northwestern Iowa and western Tennessee consisting of approximately 32.6 million bushels of grain storage capacity and all of our agronomy and retail petroleum operations.
(2) Management uses earnings before interest, income taxes, depreciation and amortization, or EBITDA, to compare the financial performance of our business segments and to internally manage those segments. Management believes that EBITDA provides useful information to investors as a measure of comparison with peer and other companies. EBITDA should not be considered an alternative to, or more meaningful than, net income or cash flow as determined in accordance with generally accepted accounting principles. EBITDA calculations may vary from company to company. Accordingly, our computation of EBITDA may not be comparable with a similarly titled measure of another company. The following sets forth the reconciliation of net income to EBITDA for the periods indicated (in thousands):
35
|
Year Ended December 31, |
||||||||||||||
|
2014 |
2013 |
2012 |
2011 |
2010 |
||||||||||
|
Net income |
$ |
159,504 |
$ |
43,391 |
$ |
11,763 |
$ |
38,213 |
$ |
48,162 | ||||
|
Interest expense |
39,908 | 33,357 | 37,521 | 36,645 | 26,144 | |||||||||
|
Income tax expense |
90,926 | 28,890 | 13,393 | 23,686 | 17,889 | |||||||||
|
Depreciation and amortization |
60,362 | 51,002 | 52,828 | 50,076 | 37,355 | |||||||||
|
EBITDA |
$ |
350,700 |
$ |
156,640 |
$ |
115,505 |
$ |
148,620 |
$ |
129,550 | ||||
Item 7. Management’s Discussion and Analysis of Financial Condition and Results of Operations.
General
The following discussion and analysis provides information which management believes is relevant to an assessment and understanding of our consolidated financial condition and results of operations. This discussion should be read in conjunction with the consolidated financial statements included herewith and notes to the consolidated financial statements thereto and the risk factors contained herein.
Overview
We are a Fortune 1000, vertically-integrated producer, marketer and distributer of ethanol focused on generating stable operating margins through our diversified business segments and our risk management strategy. We believe that owning and operating assets throughout the ethanol value chain enables us to mitigate changes in commodity prices and differentiates us from companies focused only on ethanol production. We have operations throughout the ethanol value chain, beginning upstream with our grain handling and storage operations, continuing through our ethanol, distillers grains and corn oil production operations, and ending downstream with our marketing, terminal and distribution services.
In January 2012, we acquired a grain elevator located in St. Edward, Nebraska. The grain elevator is included in our agribusiness segment.
In December 2012, we sold 12 grain elevators located in northwestern Iowa and western Tennessee consisting of approximately 32.6 million bushels of our grain storage capacity and all of our agronomy and retail petroleum operations. We believe the sale of assets represented an opportunity to maximize shareholder value. Revenues and gross profit generated by the sold operations represented approximately 91% and 93%, respectively, of 2012 agribusiness segment results. We continue to operate grain handling and storage businesses through the retained grain handling assets and assets acquired or developed at or near our ethanol plants.
In June 2013, we acquired an ethanol plant located in Atkinson, Nebraska. The plant, which is part of our ethanol production segment, has production capacity of approximately 50 mmgy, adding to our ethanol and distillers grains production. Corn oil extraction technology was installed at the plant in the fourth quarter of 2013. Also, in June 2013, we acquired a grain elevator in Archer, Nebraska, which is included in our agribusiness segment.
In November 2013, we acquired two ethanol plants located in Wood River, Nebraska and Fairmont, Minnesota. The plants, which are part of our ethanol production segment, have combined production capacity of 230 mmgy, adding to our ethanol, distillers grains and corn oil production. The Fairmont, Minnesota plant, which was not operational at the time of its acquisition, began operations in January 2014 upon completion of certain maintenance and enhancement projects.
In June 2014, we acquired the assets of a cattle-feeding business near Kismet, Kansas, which includes a feedlot and grain storage facility. The operation, which is part of our agribusiness segment, consists of approximately 2,600 acres of land, which has the capacity to support 70,000 head of cattle, and corn storage capacity of approximately 3.8 million bushels.
Our management reviews our operations in four separate operating segments:
|
· |
Ethanol Production. We are North America’s fourth largest ethanol producer. We operate twelve ethanol plants in Indiana, Iowa, Michigan, Minnesota, Nebraska and Tennessee. We have the capacity to consume approximately 360 million bushels of corn per year and produce over one billion gallons of ethanol and approximately 2.9 million tons of distillers grains annually. |
36
|
· |
Corn Oil Production. We operate corn oil extraction systems at our ethanol plants, with the capacity to produce approximately 250 million pounds annually. The corn oil systems are designed to extract non-edible corn oil, a value-added product, from the whole stillage immediately prior to production of distillers grains. Industrial uses for corn oil include feedstock for biodiesel, livestock feed additives, rubber substitutes, rust preventatives, inks, textiles, soaps and insecticides. |
|
· |
Agribusiness. Within our bulk grain business, we have grain storage capacity of approximately 42.2 million bushels. Our cattle feedlot operation has the capacity to support approximately 70,000 head of cattle. We believe our agribusiness operations provide synergies with our ethanol production segment as it supplies a portion of the feedstock and utilizes a portion of the distillers grains output of our ethanol plants. |
|
· |
Marketing and Distribution. Our in-house marketing business is responsible for the sale, marketing and distribution of all ethanol, distillers grains and corn oil produced at our ethanol plants. We also market and provide logistical services for ethanol and other commodities for a third-party producer. We purchase and sell ethanol, distillers grains, corn oil, grain, natural gas and other commodities and participate in other merchant trading activities in various markets. Additionally, we own and operate eight fuel terminals with approximately 822 million gallons per year, or mmgy, of total throughput capacity in seven south central U.S. states. To optimize the value of our assets, we utilize a portion of our leased railcar fleet to transport crude oil for third parties. |
We intend to continue to take a disciplined approach in evaluating new opportunities related to potential acquisition of additional ethanol plants by considering whether the plants meet our design, engineering, valuation and geographic criteria. We believe certain expansion projects could be implemented at our ethanol plants that have the potential to utilize the strategic location and capacity of these assets and cost effectively increase our annual production. In our marketing and distribution segment, our strategy is to build or acquire additional fuel terminal facilities, expand our marketing efforts by entering into new or renewal contracts with other ethanol producers and realize additional profit margins by optimizing our commodity logistics. In 2013, we began to implement a plan to realign our agribusiness operations by adding grain storage capacity located at or near our ethanol plants to take advantage of our current infrastructure and enhance our corn origination and trading capabilities. We intend to continue to add grain storage capacity with the goal of owning approximately 50 million bushels of total storage capacity by the end of 2015. We also intend to pursue opportunities to develop or acquire additional grain elevators, specifically those located near our ethanol plants. We believe that owning additional grain handling and storage operations in close proximity to our ethanol plants enables us to strengthen relationships with local corn producers, allowing us to source corn more effectively and at a lower average cost. We have majority ownership in a joint venture that is focused on developing technology to grow and harvest algae, which consume carbon dioxide, in commercially viable quantities.
Ethanol Industry Dynamics
U.S. Supply and Demand
Since 2001, according to the U.S. Energy Information Administration, or EIA, U.S. fuel ethanol consumption has increased at a rate of over 15% per year, from 1.7 billion gallons in 2001 to over 13.3 billion gallons in 2013. In addition to government regulations which mandate the use of ethanol in blending, ethanol acts as both an octane enhancer and fuel stock extender. According to Ethanol Producer Magazine, as of December 31, 2014, there were 213 ethanol plants within the United States, capable of producing 15.9 billion gallons a year. Further, the fuel ethanol production market is fairly fragmented with the top five producers, with us being the fourth largest, accounting for approximately 40% of overall production.
With ethanol comprising approximately 10% of the U.S. gasoline market and wholesale CBOB gasoline being the primary feedstock of finished gasoline in the United States, there is an economic relationship between the two, particularly with regard to blending gasoline. Blenders generally have been able to charge the same amount for E10 (gasoline with 10% ethanol) that 100% gasoline would sell for, thereby realizing the difference between less-expensive ethanol and gasoline as a profit margin, resulting in ethanol being an economic source for octane and renewable fuel requirements.
Global Supply and Demand
The United States is the world’s largest producer and consumer of fuel ethanol. According to the USDA Foreign Agriculture Service, collectively, the United States and Brazil account for over 80% of all fuel ethanol production and fuel ethanol consumption (based on latest publically-available data). Rather than producing ethanol using corn as its primary feedstock, Brazil’s ethanol production is sugarcane-based.
37
Led by the United States, global ethanol production has grown significantly over recent years, as approximately 30 countries either mandate or incentivize ethanol and bio-diesel blending for motor fuels. Annual reported global production has increased from approximately 5.0 billion gallons in 2001 to approximately 23.4 billion gallons in 2013, according to the EIA. We believe ethanol, as a proportion of total transportation fuels, will continue to experience increasing global demand due to a continuing focus on reducing reliance on petroleum-based transportation fuels.
In 2010, the United States became the world's leading supplier of ethanol, according to the EIA. In 2013, the United States imported approximately 300 million gallons and exported approximately 600 million gallons of ethanol, the latter of which was the third highest annual total on record. U.S. ethanol exports were approximately 727 million gallons and imports were approximately 561 million gallons for 2012. At present, approximately 94% of the ethanol produced domestically is used and marketed to the United States, with the remaining being used and marketed worldwide, mainly in Canada. According to Credit Suisse Securities Research and Analysis, global demand for ethanol could grow at a rate of 2% to 3% annually, which equates to an additional need for 200 million to 300 million gallons of fuel grade ethanol.
According to the “Renewable Energy Top Markets for U.S. Exports 2014-2015” report by the U.S. Department of Commerce – International Trade Administration, as more countries mandate the blending of ethanol, new export opportunities for U.S. ethanol producers are emerging. Through 2015, however, Canada and Brazil will likely remain the two largest export destinations for U.S. ethanol. However, the industry is developing into other markets such as Philippines, India, Mexico, South Korea and Peru. Additionally, Brazil, India and the Philippines are moving forward with higher blends of ethanol in their fuel – Brazil is planning to move to 27.5% from 25%, India is moving to a 10% ethanol blend from E5 and is giving consideration to a 20% fuel blend, and the Philippines is evaluating steps to move to higher blends from their current E10 mandate.
Industry Factors Affecting our Results of Operations
Variability of Commodity Prices. Our operations and our industry are highly dependent on commodity prices, especially prices for corn, ethanol, distillers grains and natural gas. Because the market prices of these commodities are not always correlated, at times ethanol production may be unprofitable. As commodity price volatility poses a significant threat to our margin structure, we have developed a risk management strategy focused on locking in favorable operating margins when available. We continually monitor market prices of corn, natural gas and other input costs relative to the prices for ethanol and distillers grains at each of our production facilities. We create offsetting positions by using derivative instruments, fixed-price purchases and sales contracts, or a combination of strategies within strict limits. Our primary focus is not to manage general price movements of individual commodities, for example to minimize the cost of corn consumed, but rather to lock in favorable profit margins whenever possible. By using a variety of risk management tools and hedging strategies, including our internally-developed real-time margin management system, we believe we are able to maintain a disciplined approach to price risks.
In 2014, U.S. ethanol production was 13.6 billion gallons compared with production of 13.3 billion gallons in 2013. For 2014, 14.4 billion gallons of conventional biofuels was mandated by the Renewable Fuel Standard, or RFS II. As a result of the U.S. ethanol industry rationalizing production, inventory stocks reached a low of 628 million gallons at the end of October 2013, the lowest level since October 2010. Domestic inventory stocks were 760 million gallons at December 31, 2014. Lower production, stocks and corn prices had a positive effect on ethanol margins in 2013, especially in the fourth quarter, continuing through 2014. Drought conditions in the midwestern region of the United States during 2012 caused corn to trade at unusually high prices through the third quarter of 2013. Also, during 2012, sugarcane ethanol imported from Brazil, which totaled approximately 530 million gallons, was one of the most economical means for certain parties to comply with an RFS II requirement to blend, in the aggregate, 2.0 billion gallons of advanced biofuels in 2012. Effective May 1, 2013, the Brazilian government increased the required percentage of ethanol in vehicle fuel sold in Brazil to 25 percent (from 20 percent) which, along with more competitively priced ethanol produced from corn, has reduced U.S. ethanol imports from Brazil. According to the U.S. Department of Commerce, in 2014 U.S. ethanol imports were approximately 75 million gallons and exports were approximately 835 million gallons, compared to ethanol imports of 400 million gallons and exports of 600 million gallons in 2013. As of January 12, 2015, the USDA has projected the U.S. corn crop harvest to be a record 14.2 billion bushels with a projected yield per acre of 171.0 bushels on 83.1 million acres harvested. This corn production is anticipated to result in corn ending stocks of 1.9 billion bushels at August 31, 2015. We believe that U.S. ethanol production levels will continue to adjust to supply and demand factors for ethanol and corn.
There may be periods of time that, due to the variability of commodity prices and compressed margins, we reduce or cease ethanol production operations at certain of our ethanol plants. The reduced production rates increase ethanol yields and
38
optimize cash flow in lower margin environments. In 2012, we reduced production volumes at several of our ethanol plants which resulted in total production of approximately 91% of our total daily average capacity in direct response to unfavorable operating margins. During 2013 and 2014 we produced at approximately 94% and 96% of our total daily average capacity, respectively, due to an improvement in the ethanol margin environment.
Reduced Availability of Capital. Some ethanol producers have faced financial distress over the past few years, culminating with bankruptcy filings by several companies. This, in combination with continued volatility in the capital markets, has resulted in reduced availability of capital for the ethanol industry in general. In this market environment, we may experience limited access to incremental financing.
Legislation. Federal and state governments have enacted numerous policies and incentives to encourage the usage of domestically-produced alternative fuels. RFS II has been, and we expect will continue to be, a driving factor in the growth of ethanol usage. Due to drought conditions in 2012 and claims that blending of ethanol into the motor fuel supply will be constrained by unwillingness of the market to accept greater than ten percent ethanol blends, or the blend wall, legislation aimed at reducing or eliminating the renewable fuel use required by RFS II has been introduced into Congress.
To further drive the increased adoption of ethanol, Growth Energy, an ethanol industry trade association, and a number of ethanol producers requested a waiver from the EPA to increase the allowable amount of ethanol blended into gasoline from the current ten percent level, or E10, to a 15% level, or E15. Through a series of decisions beginning in October 2010, the EPA has granted a waiver for the use of E15 in model year 2001 and newer passenger vehicles, including cars, sport utility vehicles, and light pickup trucks. In June 2012, the EPA gave final approval for the sale and use of E15 ethanol blends. On June 24, 2013 the U.S. Supreme Court declined to hear an appeal from the American Petroleum Institute and other organizations challenging the EPA’s decision to permit the sale of E15. According to the EPA, as of January 20, 2015, there were 110 gas stations in 16 states offering E15 to consumers.
The Domestic Alternative Fuels Act of 2012 was introduced on January 18, 2012 in the U.S. House of Representatives and was re-introduced on March 15, 2013 as H.R. 1214 to provide liability protection for claims based on the sale or use of certain fuels and fuel additives. Passage of this bill would provide liability protection to consumers in the event they unintentionally put any transportation fuel into their motor vehicle for which such fuel has not been approved. Some automobile manufacturers have publicly stated that the use of fuels not approved in their owners’ manuals, such as E15, is considered misfueling and any resulting damage would not be covered by their warranties. The American Fuel Protection Act of 2013, or H.R. 2267, was introduced on June 5, 2013 in the U.S. House of Representatives to make the United States exclusively liable for certain claims of liability for damages resulting from, or aggravated by, the inclusion of ethanol in transportation fuel. These bills failed to advance out of congressional committee and were not enacted into law.
The Master Limited Partnership Parity Act was introduced on April 24, 2013 in the U.S. House of Representatives as H.R. 1696 to extend the publicly traded partnership ownership structure to renewable energy projects. The legislation would provide a more level financing system and tax burden for renewable energy and fossil energy projects.
Industry Fundamentals. The ethanol industry is supported by a number of market fundamentals that drive its long-term outlook and extend beyond the short-term margin environment. Following the EPA’s approval, the industry is working to broadly introduce E15 into the retail fuel market. The RFS II mandate increased to 14.4 billion gallons of corn-derived renewable fuel for 2014, 600 million gallons over the mandated volume in 2013, and continues to increase through 2015. The EPA has not set mandated volumes for 2014 or 2015. RFS II, has been, and we expect will continue to be, a driving factor in the growth of ethanol usage in the United States. The EPA will be making modifications to ensure that RINs generated in 2012 are valid for demonstrating compliance with the 2013 applicable standards.
The domestic gasoline market continues to evolve as refiners are producing more CBOB, a sub-grade (84 octane) gasoline, which requires ethanol or other octane sources to meet the minimum octane rating requirements for the U.S. gasoline market. The demand for ethanol is also affected by the overall demand for transportation fuel. Currently, according to the EIA, total U.S. gasoline demand is approximately 135 billion gallons annually. The ethanol blend rate in 2014 was approximately 9.9% of total gasoline demand, or 13.5 billion gallons. Demand for transportation fuel is affected by the number of miles traveled by businesses and consumers and the fuel economy of vehicles. Consumer acceptance of E15 and E85 (85% ethanol blended) fuels and flex-fuel vehicles is one factor that may be needed before ethanol can achieve any significant growth in market share. In addition, ethanol export markets, although affected by competition from other ethanol exporters, mainly from Brazil, are expected to remain active in 2014. Overall, the U.S. ethanol industry is producing at levels to meet current domestic and export demand and ethanol prices have remained at a discount to gasoline, providing blenders and refiners with an economic incentive to blend.
39
BioProcess Algae Joint Venture
Our BioProcess Algae joint venture is focused on developing technology to grow and harvest algae, which consume carbon dioxide, in commercially viable quantities. Through multiple stages of expansion, BioProcess Algae has constructed a five-acre algae farm next to our Shenandoah, Iowa ethanol plant and has been operating its Grower Harvesters™ bioreactors since January 2011. The joint venture is currently focused on verification of growth rates, energy balances, capital requirements and operating expenses of the technology, which are considered to be some of the key steps to commercialization.
BioProcess Algae announced in April 2013 that it had been selected to receive a grant of up to $6.4 million from the U.S. Department of Energy, or DOE, as part of a pilot-scale biorefinery project related to production of hydrocarbon fuels meeting military specification. The project uses renewable carbon dioxide, lignocellulosic sugars and waste heat through BioProcess Algae’s Grower Harvester™ technology platform. The objective of the project is to demonstrate technologies to cost-effectively convert biomass into advanced drop-in biofuels. BioProcess Algae is required to contribute a minimum of 50% matching funds for the project. The project with the DOE has been divided into three phases, with the first phase successfully completed in August 2014. We have agreed with the DOE to move into the second phase in which the detailed design, engineering, scheduling and budgeting for construction of a pilot-scale integrated biorefinery will be developed. The third phase would involve construction of the biorefinery.
If we and the other BioProcess Algae members determine that the joint venture can achieve the desired economic performance, a larger build-out will be considered, possibly as large as 200 to 400 acres of Grower Harvester™ reactors at the Shenandoah site. Such a build-out may be completed in stages and could take up to two years to complete. Funding for such a project would come from a variety of sources including current partners, new equity investors, debt financing or a combination thereof. We increased our ownership of BioProcess Algae to approximately 63% during the second quarter of 2014. However, we still do not possess the requisite control of this investment to consolidate it.
Critical Accounting Policies and Estimates
This disclosure is based upon our consolidated financial statements, which have been prepared in accordance with accounting principles generally accepted in the United States. The preparation of these financial statements requires that we make estimates and assumptions that affect the reported amounts of assets, liabilities, revenues and expenses, and related disclosure of contingent assets and liabilities. We base our estimates on historical experience and other assumptions that we believe are proper and reasonable under the circumstances. We regularly evaluate the appropriateness of estimates and assumptions used in the preparation of our consolidated financial statements. Actual results could differ materially from those estimates. Key accounting policies, including but not limited to those relating to revenue recognition, depreciation of property and equipment, impairment of long-lived assets and goodwill, derivative financial instruments, and accounting for income taxes, are impacted significantly by judgments, assumptions and estimates used in the preparation of the consolidated financial statements.
Revenue Recognition
We recognize revenue when all of the following criteria are satisfied: persuasive evidence of an arrangement exists; risk of loss and title transfer to the customer; the price is fixed and determinable; and collectability is reasonably assured.
For sales of ethanol, distillers grains and other commodities, revenue is recognized when title to the product and risk of loss transfer to an external customer. Revenue related to marketing operations for third parties is recorded on a gross basis in the consolidated financial statements, as we take title to the product and assume risk of loss. Unearned revenue is reflected on our consolidated balance sheets for goods in transit for which we have received payment and title has not been transferred to the customer. Revenues from our fuel terminal operations, which include ethanol transload services, are recognized when these services are completed.
We routinely enter into fixed-price, physical-delivery ethanol sales agreements. In certain instances, we intend to settle the transaction by open market purchases of ethanol rather than by delivery from our own production. These transactions are reported net as a component of revenues. Revenues also include realized gains and losses on related derivative financial instruments, ineffectiveness on cash flow hedges, and reclassifications of realized gains and losses on effective cash flow hedges from accumulated other comprehensive income (loss).
40
Sales of agricultural commodities, including cattle, are recognized when title to the product and risk of loss transfer to the customer, which is dependent on the agreed upon sales terms with the customer. These sales terms provide for passage of title either at the time shipment is made or at the time the commodity has been delivered to its destination and final weights, grades and settlement prices have been agreed upon with the customer. Revenues related to grain merchandising are presented gross in the statements of operations with amounts billed for shipping and handling included in revenues and also as a component of cost of goods sold. Revenues from grain storage are recognized as services are rendered.
Intercompany revenues are eliminated on a consolidated basis for reporting purposes.
Depreciation of Property and Equipment
Property and equipment are stated at cost less accumulated depreciation. Depreciation on our ethanol production facilities, grain storage facilities, railroad tracks, computer equipment and software, office furniture and equipment, vehicles, and other fixed assets has been provided on the straight-line method over the estimated useful lives of the assets, which currently range from 3 to 40 years.
Land improvements are capitalized and depreciated. Expenditures for property betterments and renewals are capitalized. Costs of repairs and maintenance are charged to expense as incurred.
We periodically evaluate whether events and circumstances have occurred that may warrant revision of the estimated useful life of fixed assets, which is accounted for prospectively.
Impairment of Long-Lived Assets and Goodwill
Our long-lived assets consist of property and equipment. We review long-lived assets for impairment whenever events or changes in circumstances indicate that the carrying amount of a long-lived asset may not be recoverable. We measure recoverability of assets to be held and used by comparing the carrying amount of an asset to the estimated undiscounted future cash flows expected to be generated by the asset. If the carrying amount of an asset exceeds its estimated future cash flows, we record an impairment charge in the amount by which the carrying amount of the asset exceeds the fair value of the asset. No impairment charges have been recorded during the periods presented.
Our goodwill consists of amounts relating to certain acquisitions within our ethanol production and marketing and distribution segments. We review goodwill at an individual plant or subsidiary level for impairment at least annually, as of October 1, or more frequently whenever events or changes in circumstances indicate that impairment may have occurred. We assess the qualitative factors of goodwill to determine whether it is more likely than not that the fair value of a reporting unit is less than its carrying amount as a basis for determining whether it is necessary to perform a two-step goodwill impairment test. Under the first step, we compare the estimated fair value of the reporting unit with its carrying value (including goodwill). If the estimated fair value of the reporting unit is less than its carrying value, we complete a second step to determine the amount of the goodwill impairment that we should record. In the second step, we determine an implied fair value of the reporting unit’s goodwill by allocating the reporting unit’s fair value to all of its assets and liabilities other than goodwill. We compare the resulting implied fair value of the goodwill to the carrying amount and record an impairment charge for the difference.
The reviews of long-lived assets and goodwill require making estimates regarding amount and timing of projected cash flows to be generated by an asset or asset group over an extended period of time. Management judgment regarding the existence of circumstances that indicate impairment is based on numerous potential factors including, but not limited to, a decline in our future projected cash flows, a decision to suspend operations at a plant for an extended period of time, a sustained decline in our market capitalization, a sustained decline in market prices for similar assets or businesses, or a significant adverse change in legal or regulatory factors or the business climate. Significant management judgment is required in determining the fair value of our long-lived assets and goodwill to measure impairment, including projections of future cash flows. Fair value is determined through various valuation techniques including discounted cash flow models, sales of comparable properties and third-party independent appraisals, as considered necessary. Changes in estimates of fair value could result in a write-down of the asset in a future period. Given the current economic and regulatory environment and uncertainties regarding the impact on our business, there are no assurances that our estimates and assumptions will prove to be an accurate prediction of the future.
41
Derivative Financial Instruments
To minimize the risk and the effects of the volatility of commodity price changes primarily related to corn, ethanol and natural gas, we use various derivative financial instruments, including exchange-traded futures, and exchange-traded and over-the-counter options contracts. We monitor and manage this exposure as part of our overall risk management policy. As such, we seek to reduce the potentially adverse effects that the volatility of these markets may have on our operating results. We may take hedging positions in these commodities as one way to mitigate risk. While we attempt to link our hedging activities to purchase and sales activities, there are situations in which these hedging activities can themselves result in losses.
By using derivatives to hedge exposures to changes in commodity prices, we have exposures on these derivatives to credit and market risk. We are exposed to credit risk that the counterparty might fail to fulfill its performance obligations under the terms of the derivative contract. We minimize our credit risk by entering into transactions with high quality counterparties, limiting the amount of financial exposure we have with each counterparty and monitoring the financial condition of our counterparties. Market risk is the risk that the value of the financial instrument might be adversely affected by a change in commodity prices or interest rates. We manage market risk by incorporating monitoring parameters within our risk management strategy that limit the types of derivative instruments and derivative strategies we use, and the degree of market risk that may be undertaken by the use of derivative instruments.
We evaluate our contracts that involve physical delivery to determine whether they may qualify for the normal purchase or normal sale exemption and are expected to be used or sold over a reasonable period in the normal course of business. Any contracts that do not meet the normal purchase or sale criteria are recorded at fair value with the change in fair value recorded in operating income unless the contracts qualify for, and we elect, hedge accounting treatment.
Certain qualifying derivatives related to our ethanol production and agribusiness segments are designated as cash flow hedges. Prior to entering into cash flow hedges, we evaluate the derivative instrument to ascertain its effectiveness. For cash flow hedges, any ineffectiveness is recognized in current period results, while other unrealized gains and losses are reflected in accumulated other comprehensive income until gains and losses from the underlying hedged transaction are realized. In the event that it becomes probable that a forecasted transaction will not occur, we would discontinue cash flow hedge treatment, which would affect earnings. These derivative financial instruments are recognized in current assets or other current liabilities at fair value.
At times, we hedge our exposure to changes in the value of inventories and designate certain qualifying derivatives as fair value hedges. The carrying amount of the hedged inventory is adjusted through current period results for changes in the fair value arising from changes in underlying prices. Any ineffectiveness is recognized in current period results to the extent that the change in the fair value of the inventory is not offset by the change in the fair value of the derivative.
Accounting for Income Taxes
Income taxes are accounted for under the asset and liability method in accordance with GAAP. Deferred tax assets and liabilities are recognized for the future tax consequences attributable to differences between the financial statement carrying amount of existing assets and liabilities and their respective tax basis and for net operating loss and tax credit carry-forwards. Deferred tax assets and liabilities are measured using enacted tax rates expected to apply to taxable income in years in which those temporary differences are expected to be recovered or settled. The effect of a change in tax rates on deferred tax assets and liabilities is recognized in operations in the period that includes the enactment date. The realization of deferred tax assets is dependent upon the generation of future taxable income during the periods in which temporary differences become deductible. Management considers scheduled reversal of deferred tax liabilities, projected future taxable income and tax planning strategies in making this assessment. Management’s evaluation of the need for, or reversal of, a valuation allowance must consider positive and negative evidence, and the weight given to the potential effects of such positive and negative evidence is based on the extent to which it can be objectively verified.
Related to accounting for uncertainty in income taxes, we follow a process by which the likelihood of a tax position is gauged based upon the technical merits of the position, perform a subsequent measurement related to the maximum benefit and the degree of likelihood, and determine the amount of benefit to be recognized in the financial statements, if any.
42
Recently Issued Accounting Pronouncements
Effective January 1, 2017, we will adopt the amended guidance in ASC Topic 606, Revenue from Contracts with Customers. The amended guidance requires revenue recognition to reflect the transfer of promised goods or services to customers and replaces existing revenue recognition guidance. The updated standard permits the use of either the retrospective or cumulative effect transition method. We have not yet selected a transition method nor have we determined the effect of the updated standard on our consolidated financial statements and related disclosures.
Off-Balance Sheet Arrangements
We do not have any off-balance sheet arrangements that have or are reasonably likely to have a current or future material effect on our consolidated financial condition, results of operations or liquidity.
Components of Revenues and Expenses
Revenues. In our ethanol production segment, our revenues are derived primarily from the sale of ethanol and distillers grains, which is a co-product of the ethanol production process. In our corn oil production segment, our revenues are derived from the sale of corn oil, which is extracted from the whole stillage process immediately prior to the production of distillers grains. In our agribusiness segment, the sale of grain and cattle are our primary source of revenue. In our marketing and distribution segment, the sale of ethanol, distillers grains and corn oil that we market for our ethanol plants, the sale of ethanol we market for a third-party ethanol plant and the sale of other commodities purchased in the open market represent our primary sources of revenue. Revenues also include net gains or losses from derivatives related to products sold.
Cost of Goods Sold. Cost of goods sold in our ethanol production and corn oil production segments includes costs for direct labor, materials and certain plant overhead costs. Direct labor includes all compensation and related benefits of non-management personnel involved in the operation of our ethanol plants. Plant overhead costs primarily consist of plant utilities, plant depreciation and outbound freight charges. Our cost of goods sold in these segments is mainly affected by the cost of corn, natural gas, purchased distillers grains and transportation. Within our corn oil segment, we compensate the ethanol plants for the value of distillers grains displaced during the production process. In the ethanol production segment, corn is our most significant raw material cost. We purchase natural gas to power steam generation in our ethanol production process and to dry our distillers grains. Natural gas represents our second largest cost in this business segment. Cost of goods sold also includes net gains or losses from derivatives related to commodities purchased.
Grain acquisition costs represent the primary components of cost of goods sold in our agribusiness segment. Grain inventories held for sale, forward purchase contracts and forward sale contracts are valued at market prices, where available, or other market quotes adjusted for differences, primarily transportation, between the exchange-traded market and the local markets on which the terms of the contracts are based. Changes in the market value of grain inventories, forward purchase and sale contracts, and exchange-traded futures and options contracts are recognized in earnings as a component of cost of goods sold. In the cattle-feeding operation, the costs of cattle acquired, feed and veterinary supplies, as well as direct labor and feedlot overhead costs, are accumulated as inventory and included as a component of cost of goods sold when the cattle are sold. Direct labor includes all compensation and related benefits of non-management personnel involved in the operation of our feedlot. Feedlot overhead costs primarily consist of feedlot utilities, depreciation, repairs and maintenance, and yard expenses.
In our marketing and distribution segment, purchases of ethanol, distillers grains and corn oil represent the largest components of cost of goods sold. Transportation expense represents an additional major component of our cost of goods sold in this segment. Transportation expense includes rail car leases, freight and shipping of our ethanol and co-products, as well as costs incurred in storing ethanol at destination terminals.
Selling, General and Administrative Expenses. Selling, general and administrative expenses are recognized at the operating segment level, as well as at the corporate level. These expenses consist of employee salaries, incentives and benefits; office expenses; director fees; and professional fees for accounting, legal, consulting, and investor relations activities. Personnel costs, which include employee salaries, incentives and benefits, are the largest single category of expenditures in selling, general and administrative expenses. We refer to selling, general and administrative expenses that are not allocable to a segment as corporate activities.
Other Income (Expense). Other income (expense) includes interest earned, interest expense, equity earnings in nonconsolidated subsidiaries and other non-operating items.
43
Results of Operations
Comparability
The following summarizes various events that affect the comparability of our operating results for the past three years:
|
· |
January 2012St. Edward, Nebraska grain elevator was acquired |
|
· |
December 2012Twelve grain elevators located in northwestern Iowa and western Tennessee |
and all agronomy and retail petroleum operations were sold
|
· |
June 2013Atkinson, Nebraska ethanol plant was acquired |
|
· |
June 2013Archer, Nebraska grain elevator was acquired |
|
· |
November 2013Fairmont, Minnesota and Wood River, Nebraska ethanol plants were acquired |
|
· |
June 2014Kismet, Kansas cattle-feeding business was acquired |
The year ended December 31, 2012 included eleven months of operations at our Tennessee and Iowa agribusiness operations that were divested in December 2012. The year ended December 31, 2013 includes approximately seven months of operations at our Atkinson plant and a little more than five weeks of operations at our Wood River plant. Our Fairmont plant, which was not operational at the time of its acquisition, began production in early January 2014. The year ended December 31, 2014 includes approximately six months of operations at our Kansas cattle-feeding business.
Segment Results
Our operations fall within the following four segments: (1) production of ethanol and related distillers grains, collectively referred to as ethanol production, (2) corn oil production, (3) grain handling and storage and cattle feedlot operations, collectively referred to as agribusiness, and (4) marketing, merchant trading and logistics services for Company-produced and third-party ethanol, distillers grains, corn oil and other commodities, and the operation of fuel terminal facilities, collectively referred to as marketing and distribution. Selling, general and administrative expenses, primarily consisting of compensation of corporate employees, professional fees and overhead costs not directly related to a specific operating segment, are reflected in the table below as corporate activities. When the Company’s management evaluates segment performance, they review the information provided below, as well as segment EBITDA.
During the normal course of business, our operating segments enter into transactions with one another. For example, our ethanol production and corn oil production segments sell ethanol, distillers grains and corn oil to our marketing and distribution segment and our agribusiness segment sells grain to our ethanol production segment. These intersegment activities are recorded by each segment at prices approximating market and treated as if they are third-party transactions. Consequently, these transactions impact segment performance. However, intersegment revenues and corresponding costs are eliminated in consolidation, and do not impact our consolidated results.
44
The tables below reflect selected operating segment financial information for the periods indicated (in thousands):
|
Year Ended December 31, |
|||||||||
|
2014 |
2013 |
2012 |
|||||||
|
Revenues: |
|||||||||
|
Ethanol production: |
|||||||||
|
Revenues from external customers (1) |
$ |
(51,424) |
$ |
116,272 |
$ |
200,443 | |||
|
Intersegment revenues |
2,222,446 | 1,934,770 | 1,708,800 | ||||||
|
Total segment revenues |
2,171,022 | 2,051,042 | 1,909,243 | ||||||
|
Corn oil production: |
|||||||||
|
Revenues from external customers (1) |
- |
- |
529 | ||||||
|
Intersegment revenues |
79,750 | 69,163 | 57,315 | ||||||
|
Total segment revenues |
79,750 | 69,163 | 57,844 | ||||||
|
Agribusiness: |
|||||||||
|
Revenues from external customers (1) |
100,436 | 51,883 | 408,622 | ||||||
|
Intersegment revenues |
1,208,120 | 761,835 | 176,062 | ||||||
|
Total segment revenues |
1,308,556 | 813,718 | 584,684 | ||||||
|
Marketing and distribution: |
|||||||||
|
Revenues from external customers (1) |
3,186,599 | 2,872,856 | 2,867,276 | ||||||
|
Intersegment revenues |
171,201 | 21,790 | 355 | ||||||
|
Total segment revenues |
3,357,800 | 2,894,646 | 2,867,631 | ||||||
|
Revenues including intersegment activity |
6,917,128 | 5,828,569 | 5,419,402 | ||||||
|
Intersegment eliminations |
(3,681,517) | (2,787,558) | (1,942,532) | ||||||
|
Revenues as reported |
$ |
3,235,611 |
$ |
3,041,011 |
$ |
3,476,870 | |||
|
(1) Revenues from external customers include realized gains and losses from derivative financial instruments. |
|||||||||
|
Gross profit (loss): |
|||||||||
|
Ethanol production |
$ |
236,096 |
$ |
79,109 |
$ |
(4,895) | |||
|
Corn oil production |
42,937 | 36,615 | 32,388 | ||||||
|
Agribusiness |
14,833 | 6,258 | 35,973 | ||||||
|
Marketing and distribution |
80,326 | 57,671 | 32,362 | ||||||
|
Intersegment eliminations |
606 | (6,633) | 943 | ||||||
|
$ |
374,798 |
$ |
173,020 |
$ |
96,771 | ||||
|
Operating income (loss): |
|||||||||
|
Ethanol production |
$ |
214,497 |
$ |
63,012 |
$ |
(20,393) | |||
|
Corn oil production |
42,651 | 36,569 | 32,140 | ||||||
|
Agribusiness |
8,497 | 3,324 | 60,030 | ||||||
|
Marketing and distribution |
52,669 | 40,971 | 17,290 | ||||||
|
Intersegment eliminations |
666 | (6,588) | 977 | ||||||
|
Corporate activities |
(32,706) | (29,437) | (25,159) | ||||||
|
$ |
286,274 |
$ |
107,851 |
$ |
64,885 | ||||
45
The table below shows total assets for our operating segments as of the periods indicated (in thousands):
|
Year Ended December 31, |
||||||
|
2014 |
2013 |
|||||
|
Total assets: |
||||||
|
Ethanol production |
$ |
983,289 |
$ |
911,315 | ||
|
Corn oil production |
31,405 | 28,569 | ||||
|
Agribusiness |
234,626 | 165,570 | ||||
|
Marketing and distribution |
305,675 | 258,361 | ||||
|
Corporate assets |
290,123 | 175,210 | ||||
|
Intersegment eliminations |
(16,561) | (6,980) | ||||
|
$ |
1,828,557 |
$ |
1,532,045 | |||
Year Ended December 31, 2014 Compared to the Year Ended December 31, 2013
Consolidated Results
Consolidated revenues increased by $194.6 million in 2014 compared to 2013. Revenues from sales of ethanol, distillers grain and other grains increased by $23.3 million, $43.3 million and $82.5 million, respectively. Ethanol revenues were affected by an increase in volumes, offset by a decrease in revenue per gallon. Distillers grains revenues were affected by an increase in volumes produced and merchant trading activities, offset partially by a decrease in average realized prices. Grain revenues were impacted by an increase in merchant trading activities. Gross profit increased by $201.8 million compared to 2013 primarily as a result of increased volumes of ethanol and corn oil production as well as improved margins for ethanol production. Operating income increased by $178.4 million in 2014 compared to 2013 as a result of the factors discussed above, partially offset by an increase in selling, general and administrative expenses of $23.4 million. Selling, general and administrative expenses were higher in 2014 compared to 2013 due most significantly to an increase in personnel costs and the expanded scope of operations following the acquisitions of the Atkinson, Fairmont and Wood River ethanol plants in the second and fourth quarters of 2013. Interest expense increased by $6.6 million compared to 2013 due to higher average debt balances outstanding, as well as higher average borrowing costs. Income tax expense was $90.9 million in 2014 compared to $28.9 million in 2013.
The following discussion of segment results provides greater detail on period-to-period results.
Ethanol Production Segment
The table below presents key operating data within our ethanol production segment for the periods indicated:
|
Year Ended December 31, |
||||
|
2014 |
2013 |
|||
|
Ethanol sold |
||||
|
(thousands of gallons) |
966,176 | 734,483 | ||
|
Distillers grains sold |
||||
|
(thousands of equivalent dried tons) |
2,670 | 2,038 | ||
|
Corn consumed |
||||
|
(thousands of bushels) |
343,892 | 257,663 | ||
Revenues in the ethanol production segment increased by $120.0 million in 2014 compared to 2013 primarily due to higher volumes produced and sold, partially offset by lower average ethanol and distillers grains prices. Revenues in 2014 included a full year of production from our Atkinson, Fairmont and Wood River plants, which were acquired in the second and fourth quarters of 2013 and contributed an additional combined 214.0 million gallons of ethanol production and $438.0 million in revenue. The ethanol production segment produced 966.2 million gallons of ethanol, which represents approximately 95.6% of daily average production capacity, during 2014.
Cost of goods sold in the ethanol production segment decreased by $37.0 million for 2014 compared to 2013. Corn consumption increased by 86.2 million bushels, offset by a 33% decrease in the average cost per bushel during 2014
46
compared to 2013. As a result of the factors identified above, gross profit and operating income for the ethanol production segment increased by $157.0 million and $151.5 million, respectively, for 2014 compared to the same period in 2013.
Corn Oil Production Segment
Revenues in the corn oil production segment increased by $10.6 million in 2014 compared to 2013. During 2014, we sold 234.6 million pounds of corn oil compared to 170.4 million pounds in 2013. Revenues in 2014 included production from our Atkinson, Fairmont and Wood River plants, which were acquired in the second and fourth quarters of 2013, and contributed an additional 54.3 million pounds of corn oil production. The average price realized for corn oil was 15% lower in 2014 compared to 2013.
Gross profit and operating income in the corn oil production segment increased by $6.3 million and $6.1 million, respectively in 2014 compared to 2013. The increase in revenues were offset by $4.3 million of additional cost of goods sold related to increased volumes produced.
Agribusiness Segment
Revenues in the agribusiness segment increased by $494.8 million and gross profit and operating income increased by $8.6 million and $5.2 million, respectively, in 2014 compared to 2013. We sold 308.3 million bushels of grain, including 294.5 million to our ethanol production segment in 2014, compared to sales of 142.8 million bushels of grain, including 137.3 million bushels to our ethanol production segment, during 2013. The increase in grain sold during 2014 compared to 2013 is due to an increase in the number of ethanol plants in our ethanol production segment to which the agribusiness segment supplied corn, including our ethanol plants in Atkinson, Fairmont and Wood River, which were acquired in the second and fourth quarters of 2013. Additionally, $29.4 million of the increase in revenues is due to the cattle-feeding operation that was acquired during the second quarter of 2014.
Marketing and Distribution Segment
Revenues in our marketing and distribution segment increased by $463.2 million in 2014 compared to 2013. The increase in revenues was primarily due to a $315.9 million increase in ethanol, distillers grain and other grain revenues due to additional volumes produced by our recently-acquired ethanol plants and an increase in merchant trading of distillers grains and other grains. In addition, revenues from the sale of natural gas to our ethanol production segment increased by $120.7 million. The marketing and distribution segment sold approximately 1.2 billion and 1.0 billion gallons of ethanol during 2014 and 2013, respectively.
Gross profit and operating income for the marketing and distribution segment increased by $22.7 million and $11.7 million, respectively, in 2014 compared to 2013, primarily due to increased merchant trading activities for ethanol, distillers grain and other grains, partially offset by reduced crude oil transportation activities.
Intersegment Eliminations
Intersegment eliminations of revenues increased by $894.0 million for 2014 compared to 2013 due to the following factors: increased corn sales from the agribusiness segment to the ethanol production segment of $453.5 million, increased natural gas sales from the marketing and distribution segment to the ethanol production segment of $120.7 million, and increased sales of ethanol from the ethanol production segment to the marketing and distribution segment of $319.0 million, which is primarily due to the ethanol plants acquired in the second and fourth quarters of 2013.
Intersegment eliminations of gross profit and operating income decreased by $7.2 million for 2014 compared to 2013 due primarily to reduced quantities of ethanol in transit to customers and decreased average margins eliminated. Beginning in October, 2013, ethanol is sold from the ethanol production segment to the marketing and distribution segment as it is produced and transferred into storage tanks located at each respective plant. The finished product is then sold by the marketing and distribution segment to external customers. Profit is recognized by the ethanol production segment upon sale to the marketing and distribution segment, but is eliminated from consolidated results until title to the product has been transferred to a third party. Ethanol quantities held as inventory by the marketing and distribution segment declined during 2014 and the average margin per gallon realized by the ethanol production segment decreased, resulting in a reduction in deferred intersegment profits during 2014. This was partially offset by increased intersegment profits eliminated for corn oil and distillers grains in transit to customers at the end of 2014 which will be recognized in future periods.
47
Corporate Activities
Operating income was impacted by an increase in operating expenses for corporate activities of $3.3 million for 2014 compared to 2013, primarily due to an increase in personnel costs.
Income Taxes
We recorded income tax expense of $90.9 million for 2014 compared to $28.9 million in 2013. The effective tax rate (calculated as the ratio of income tax expense to income before income taxes) was approximately 36.3% for 2014 compared to 40.0% for 2013. The annual effective tax rate was favorably impacted primarily by an income tax deduction for qualified production activities. The annual effective tax rate for 2013 reflects a change in estimate related to nondeductible compensation expense and an increase in the accrual for uncertain tax positions partially offset by an increase in tax benefits.
Year ended December 31, 2013 Compared to the Year ended December 31, 2012
Consolidated Results
Consolidated revenues decreased by $435.9 million in 2013 compared to 2012 primarily as a result of lower grain and agronomy sales and lower ethanol volumes partially offset by higher average prices realized for ethanol and distillers grains. The decline in grain and agronomy sales resulted from the sale of certain grain elevators and agronomy assets during the fourth quarter of 2012. Gross profit increased by $76.2 million compared to 2012 primarily as a result of significantly improved margins for ethanol, additional profits realized from merchant trading and logistics activities, and the deployment of railcars for crude oil transportation, offset partially by a decrease in grain and agronomy margins. Operating income increased by $43.0 million in 2013 compared to 2012 as a result of the factors discussed above, partially offset by a $47.1 million gain on the sale of certain agribusiness assets in December 2012. Selling, general and administrative expenses were $13.9 million lower in 2013 compared to 2012 due most significantly to the grain elevator sale during the fourth quarter of 2012. Interest expense decreased by $4.2 million compared to 2012 due to lower average debt balances. Income tax expense was $28.9 million in 2013 compared to $13.4 million in 2012.
The following discussion of segment results provides greater detail on period-to-period results.
Ethanol Production Segment
The table below presents key operating data within our ethanol production segment for the periods indicated:
|
Year Ended December 31, |
||||
|
2013 |
2012 |
|||
|
Ethanol sold |
||||
|
(thousands of gallons) |
734,483 | 677,082 | ||
|
Distillers grains sold |
||||
|
(thousands of equivalent dried tons) |
2,038 | 1,882 | ||
|
Corn consumed |
||||
|
(thousands of bushels) |
257,663 | 238,740 | ||
Revenues in the ethanol production segment increased by $141.8 million in 2013 compared to 2012. Revenues in 2013 included production from our Atkinson and Wood River plants, which began operations on July 25, 2013 and November 22, 2013, respectively, and contributed an additional 19.8 million and 12.6 million gallons of ethanol production and $46.7 million and $32.5 million in revenues, respectively. The increase in revenues was also due to higher volumes of ethanol and distillers grains produced and sold due to an increase in utilization of existing production capacity year over year. In 2013, the ethanol production segment produced 729.2 million gallons of ethanol, which represents approximately 94% of our total daily average capacity. The ethanol production segment operated at 91% of production capacity in 2012.
Cost of goods sold in the ethanol production segment increased by $57.8 million in 2013 compared to 2012. Consumption of corn increased by 18.9 million bushels, but the average cost per bushel decreased by approximately 11% year over year. Also, cost of goods sold was reduced by approximately $4.0 million from a contractor recovery relating to grain silo issues at certain ethanol plants. As a result of the factors identified above, gross profit and operating income for the ethanol production segment increased by $84.0 million and $83.4 million, respectively, in 2013 compared to 2012.
48
Corn Oil Production Segment
Revenues in the corn oil production segment increased by $11.3 in 2013 compared to 2012. During 2013, we sold 170.4 million pounds of corn oil compared to 145.8 million pounds in 2012. The average price realized for corn oil was 3% higher in 2013 compared to 2012. Revenues in 2013 included production from our Wood River plant, which began operations on November 22, 2013 and contributed an additional 3.5 million pounds of corn oil production and $1.1 million in revenues.
Gross profit and operating income in the corn oil production segment increased by $4.2 million and $4.4 million, respectively in 2013 compared to 2012. The increase in revenues was partially offset by $3.9 million of additional expense related to higher input costs due to increased prices and volumes for distillers grains purchased in 2013 compared to 2012.
Agribusiness Segment
Revenues in the agribusiness segment increased by $229.0 million and gross profit and operating income decreased by $29.7 million and $56.7 million, respectively, in 2013 compared to 2012. We sold 142.8 million bushels of grain, including 137.3 million to our ethanol production segment, and had no fertilizer sales in 2013 compared to sales of 60.8 million bushels of grain, including 24.7 million bushels to our ethanol production segment, and 56 thousand tons of fertilizer in 2012. Subsequent to the sale of certain grain elevators and the agronomy business during the fourth quarter of 2012, we increased our focus on supplying corn to our ethanol plants from our agribusiness segment. As a result, 96 percent of the grain sold by our agribusiness segment in 2013 was sold to our ethanol plants rather than to external customers. The decrease in gross profit and operating income is due to the factors discussed above.
Marketing and Distribution Segment
Revenues in our marketing and distribution segment increased by $27.0 million in 2013 compared to 2012. The increase in revenues was primarily due to an increase in grain trading activity within our marketing and distribution segment, higher average prices for ethanol and distillers grains, expanded trading and logistic operations, and our unit-train terminal in Birmingham, Alabama that commenced operations in the fourth quarter of 2012. In addition, revenues were impacted by a decrease of 84 million gallons of ethanol sold in 2013 compared to 2012 and lower revenues from crude oil transportation. Ethanol revenues decreased by $72.3 million and distillers grains revenues increased by $46.6 million. We sold 983 million and 1,066 million gallons of ethanol during 2013 and 2012, respectively, within the marketing and distribution segment.
Gross profit and operating income for the marketing and distribution segment increased by $25.3 million and $23.7 million, respectively, in 2013 compared to 2012, primarily due to profits realized from merchant trading and logistics activities, higher margins related to the deployment of railcars for crude oil transportation and the operation of the Birmingham unit-train terminal.
Intersegment Eliminations
Intersegment eliminations of revenues increased by $845.0 million in 2013 compared to 2012 due to increased corn sales from our agribusiness segment to our ethanol production segment of $600.3 million. In addition, sales of ethanol and distillers grains from our ethanol production segment to our marketing and distribution segment increased by $192.5 million and $37.3 million, respectively, between the years.
Corporate Activities
Operating income was impacted by an increase in operating expenses for corporate activities of $4.3 million in 2013 compared to 2012 primarily due to an increase in personnel costs and increased fees for professional services related to the acquisition of two ethanol plants in November 2013.
49
Liquidity and Capital Resources
On December 31, 2014, we had $425.5 million in cash and equivalents, excluding restricted cash, comprised of $252.7 million held at our parent company and the remainder at our subsidiaries. We also had up to an additional $187.5 million available under revolving credit agreements at our subsidiaries at December 31, 2014, some of which was subject to borrowing base restrictions or other specified lending conditions. Funds held at our subsidiaries are generally required for their ongoing operational needs and distributions from our subsidiaries are restricted pursuant to their credit agreements. At December 31, 2014, there were approximately $681.4 million of net assets at our subsidiaries that were not available to be transferred to the parent company in the form of dividends, loans or advances due to restrictions contained in the credit facilities of these subsidiaries.
We incurred capital expenditures of $61.5 million in 2014 for various projects, mainly installation of fine grind technology at several of our ethanol plants, process improvements at our recently-acquired ethanol plants and grain storage expansions. Capital spending for 2015 is expected to be approximately $91.0 million, which includes expansion projects for ethanol production capacity and grain storage capacity, as well as expenditures for various other projects, and is expected to be financed with available borrowings under our credit facilities and cash provided by operating activities.
Net cash provided by operating activities was $221.6 million in 2014 compared to $107.3 million in 2013. Operating activities were affected by increased operating profits and an increase in working capital for 2014, primarily consisting of an increase in accounts receivable and inventories, net of an increase in accounts payable and accrued liabilities. In 2014, we had net income of $159.5 million compared to $43.4 million in 2013. Net cash used by investing activities was $78.6 million in 2014, due primarily to capital expenditures at our ethanol plants, as well as the acquisition of the cattle-feeding business. Net cash provided by financing activities was $10.5 million in 2014. Green Plains Trade, Green Plains Cattle and Green Plains Grain utilize revolving credit facilities to finance working capital requirements. These facilities are frequently drawn upon and repaid, resulting in significant cash movements that are reflected on a gross basis within financing activities as proceeds from and payments on short-term borrowings.
Our business is highly impacted by commodity prices, including prices for corn, ethanol, distillers grains and natural gas. We attempt to reduce the market risk associated with fluctuations in commodity prices through the use of derivative financial instruments. Sudden changes in commodity prices may require cash deposits with brokers or margin calls. Depending on our open derivative positions, we may require significant liquidity with little advanced notice to meet margin calls. We continuously monitor our exposure to margin calls and believe that we will continue to maintain adequate liquidity to cover such margin calls from operating results and borrowings. Increases in grain prices and hedging activity have led to more frequent and larger margin calls.
We were in compliance with our debt covenants at December 31, 2014. Based upon our forecasts and the current margin environment, we believe we will maintain compliance at each of our subsidiaries for the upcoming twelve months, or if necessary have sufficient liquidity available on a consolidated basis to resolve a subsidiary’s noncompliance. No assurance can be provided that actual operating results will approximate our forecasts or that we will inject the necessary capital into a subsidiary to maintain compliance with its respective covenants. In the event actual results differ significantly from our forecasts and a subsidiary is unable to comply with its respective debt covenants, the subsidiary’s lenders may determine that an event of default has occurred. Upon the occurrence of an event of default, and following notice, the lenders may terminate any commitment and declare the entire unpaid balance due and payable.
In August 2013, our Board of Directors approved the initiation of a quarterly cash dividend. We have paid a quarterly cash dividend since this initial authorization and anticipate declaring a cash dividend in future quarters on a regular basis; however, future declarations of dividends are subject to Board approval and may be adjusted as our cash position, business needs or market conditions change.
We believe that we have sufficient working capital for our existing operations. However, a sustained period of unprofitable operations may strain our liquidity and make it difficult to maintain compliance with our financing arrangements. While we may seek additional sources of working capital in response, we can provide no assurance that we will be able to secure this funding if necessary. We may sell additional equity or borrow additional amounts to improve or preserve our liquidity, expand our existing businesses, or build additional or acquire existing businesses. We can provide no assurance that we will be able to secure the funding necessary for these additional projects or for additional working capital needs at reasonable terms, if at all.
50
Debt
For additional information related to our debt, see Note 10 – Debt included herein as part of the Notes to Consolidated Financial Statements.
Ethanol Production Segment
Our ethanol production segment has credit facilities with various lender groups that provide for term and revolving term loans to finance construction and operation of the production facilities.
During the second quarter of 2014, Green Plains Processing LLC, a wholly-owned subsidiary of Green Plains Inc., issued term debt under a $225 million Term Loan B facility, which was used to repay all term loans and revolving term loans at Green Plains Bluffton, Green Plains Central City, Green Plains Ord, Green Plains Otter Tail and Green Plains Shenandoah, including the Green Plains Bluffton Revenue Bonds. At December 31, 2014, $213.8 million was outstanding on the facility. The facility is secured by the Atkinson, Bluffton, Central City, Ord, Otter Tail and Shenandoah ethanol plants, including their corn oil production assets, and requires quarterly principal payments of $0.6 million and interest payments through maturity. The facility bears interest at a rate equal to 5.5% plus LIBOR, subject to a 1.0% floor. At December 31, 2014, the interest rate on this term debt was 6.5%. The facility matures on June 30, 2020.
The following debt, which had a combined total balance of $199.0 million at the end of the first quarter of 2014, was paid in full during the second and third quarters of 2014, in conjunction with the Green Plains Processing term loan transaction discussed above.
|
· |
Green Plains Bluffton debt included a $70.0 million amortizing term loan and a $20.0 million revolving term loan which were both scheduled to mature in January 2015. |
|
· |
Green Plains Bluffton Subordinate Solid Waste Disposal Facility Revenue Bond of $22.0 million with the city of Bluffton, Indiana. |
|
· |
Green Plains Central City debt included a $55.0 million amortizing term loan and a $30.5 million revolving term loan, which were both scheduled to mature in July 2016. |
|
· |
Green Plains Ord debt included a $25.0 million amortizing term loan and a $13.0 million revolving term loan, which were both scheduled to mature in July 2016. |
|
· |
Green Plains Otter Tail debt included a $30.3 million amortizing term loan, and a $19.2 million note payable, both of which were scheduled to mature in September 2018. The notes payable extinguishment included a gain of $2.2 million, which was the outstanding obligation forgiven according to terms of the financing agreement, and was recorded in other income in the consolidated financials for the year ended December 31, 2014. |
|
· |
Green Plains Shenandoah debt included a $17.0 million revolving term loan which was scheduled to mature in September 2018. |
Green Plains Fairmont and Green Plains Wood River combined debt included a $27.0 million short-term loan that was scheduled to mature on November 27, 2014 and includes a $62.5 million term loan that matures on November 27, 2015. In June 2014, the short-term loan balance was repaid and the loan commitment was extinguished. In July 2014, the $62.5 million term loan was amended to increase the outstanding amount from $50.0 million to $62.5 million. At December 31, 2014, $40.0 million was outstanding on the term loan. The term loan required quarterly principal payments of $2.5 million in 2014 and requires quarterly principal payments of $1.3 million beginning in 2015.
Green Plains Holdings II debt consists of three individual amortizing term loans totaling $46.8 million and a $20.0 million revolving term loan. At December 31, 2014, $29.5 million was outstanding on the term loans and $6.0 million was outstanding on the revolving term loan. The amortizing term loans require total quarterly principal payments of $1.8 million. The final maturity date of the amortizing term loans and the revolving term loan is July 1, 2019.
Green Plains Obion debt included a $60.0 million amortizing term loan and includes a revolving term loan of $37.4 million, which was amended in June 2014. The outstanding balance of the amortizing term loan was paid in full on its maturity date of May 20, 2014. At December 31, 2014, $27.4 million on the revolving term loan was outstanding. The revolving term loan matures on May 20, 2020.
Green Plains Superior debt included a $40.0 million term loan and includes a $15.6 million revolving term loan. In August 2014, the revolving term loan was amended to increase the commitment amount from $10.0 million to $15.6 million,
51
as well as extend the maturity date, and the term loan was extinguished. At December 31, 2014, $15.0 million was outstanding on the revolving term loan. The revolving term loan matures on October 20, 2019.
The Green Plains Processing term loan, has a provision that requires us to make quarterly special payments of 50% to 75% of the available free cash flow from the entity’s operations (as defined in the loan agreement), subject to certain limitations. The Green Plains Wood River and Green Plains Fairmont term loan has a provision that requires us to make quarterly special payments of 50% of available free cash flow from the entity’s operations as defined in the loan agreement), subject to certain limitations, beginning with the first quarter of 2015.
The term loans and revolving term loans bear interest at various rates, with the majority of all such loans having interest rates between LIBOR plus 3.85% to 5.50% or lender-established prime rates plus 3.50% to 4.50%. Some have established a floor on the underlying LIBOR index. As security for the loans, the lenders received a first-priority lien on all personal property and real estate owned by the respective borrower, including an assignment of all contracts and rights pertinent to the on-going operations of the plant. Each respective borrower is required to maintain certain financial and non-financial covenants during the term of the loans.
Additionally, certain subsidiaries have small equipment financing loans, capital leases on equipment or facilities, or other forms of debt financing.
Agribusiness Segment
Green Plains Grain has a $125.0 million senior secured revolving credit facility to provide the agribusiness segment with working capital funding subject to a borrowing base as defined in the facility. The revolving credit facility matures on August 26, 2016. The revolving credit facility includes total revolving credit commitments of $125.0 million and an accordion feature whereby amounts available under the facility may be increased by up to $75.0 million of new lender commitments upon agent approval. The facility also allows for additional seasonal borrowings up to $50.0 million. The total commitments outstanding under the facility cannot exceed $250.0 million. As security for the revolving credit facility, the lender received a first priority lien on certain cash, inventory, accounts receivable and other assets owned by subsidiaries of the agribusiness segment. Advances on the revolving credit facility are subject to interest charges at a rate per annum equal to the LIBOR rate for the outstanding period, or the base rate, plus the respective applicable margin. At December 31, 2014, $37.0 million on the revolving credit facility was outstanding.
Green Plains Cattle has a $100.0 million senior secured asset-based revolving credit facility to provide for working capital financing. The lender will make loans up to $100.0 million based on eligible collateral. The amount of eligible collateral is determined by a calculated borrowing base value equal to the sum of percentages of eligible receivables, eligible inventories and eligible other current assets, less certain miscellaneous adjustments. Advances are subject to interest charges at a variable rate per annum equal to the LIBOR rate for the outstanding period plus 3.00%, 2.50%, or 2.0%, depending upon remaining availability. The revolving credit facility matures on October 31, 2017. At December 31, 2014, $77.0 million on the revolving credit facility was outstanding. As security for the revolving credit facility, the lender received a first priority lien on certain cash, inventory, accounts receivable, property and equipment and other assets owned by Green Plains Cattle.
Marketing and Distribution Segment
Green Plains Trade has a senior secured asset-based revolving credit facility of up to $150.0 million, subject to a borrowing base value equal to the sum of percentages of eligible receivables and eligible inventories, less certain miscellaneous adjustments. At December 31, 2014, $95.9 million was outstanding on the revolving credit facility. The revolving credit facility expires on April 26, 2016 and bears interest at the lender’s commercial floating rate plus 1.50% or LIBOR plus 2.50%. As security for the loan, the lender received a first-position lien on substantially all of the assets of Green Plains Trade, including accounts receivable, inventory and other property and collateral owned by Green Plains Trade.
In June 2013, certain of our subsidiaries executed a New Markets Tax Credits financing transaction. In order to facilitate this financing transaction, we were required to issue promissory notes payable in the amount of $10.0 million and a note receivable in the amount of $8.1 million. The promissory notes payable and note receivable bear interest at 1% per annum, payable quarterly. Beginning in March 2020, the promissory notes and note receivable each require quarterly principal and interest payments of approximately $0.2 million. The Company retains the right to call $8.1 million of the promissory notes in 2020. The promissory notes payable and note receivable mature on September 15, 2031 and will be fully amortized upon maturity. In connection with the New Markets Tax Credits financing transaction, income tax credits were generated for the benefit of the lender. We have guaranteed the lender the face value of these income tax credits over their statutory lives, a
52
period of seven years, in the event that the income tax credits are recaptured or reduced. The value of the income tax credits was anticipated to be $5.0 million at the time of the transaction. We believe the likelihood of recapture or reduction of the income tax credits is remote, and therefore we have not established a liability in connection with this guarantee.
Corporate Activities
In September 2013, we issued $120.0 million of 3.25% Convertible Senior Notes due 2018, or the 3.25% Notes. The 3.25% Notes represent senior, unsecured obligations, with interest payable on April 1 and October 1 of each year. At the time we issued the 3.25% Notes, we were only permitted to settle conversions with shares of our common stock. We received shareholder approval at our 2014 annual meeting to allow for flexible settlement which gives us the option to settle conversions in cash, shares of common stock, or any combination thereof. We intend to satisfy conversion of the 3.25% Notes with cash for the principal amount of the debt and cash or shares of common stock for any related conversion premium. The 3.25% Notes contain liability and equity components which were bifurcated and accounted for separately. The liability component of the 3.25% Notes, as of the issuance date, was calculated by estimating the fair value of a similar liability issued at an 8.21% effective interest rate, which was determined by considering the rate of return investors would require for comparable debt without conversion rights. The amount of the equity component was calculated by deducting the fair value of the liability component from the principal amount of the 3.25% Notes, resulting in the initial recognition of $24.5 million as debt discount costs recorded in additional paid-in capital. The carrying amount of the 3.25% Notes will be accreted to the principal amount over the remaining term to maturity, and we will record a corresponding amount of noncash interest expense. Additionally, we incurred debt issuance costs of $5.1 million related to the 3.25% Notes and allocated $4.0 million of debt issuance costs to the liability component of the 3.25% Notes. These costs will be amortized to noncash interest expense over the five-year term of the 3.25% Notes. Prior to April 1, 2018, the 3.25% Notes will not be convertible unless certain conditions are satisfied. The conversion rate is subject to adjustment upon the occurrence of certain events, including the payment of a quarterly cash dividend that exceeds $0.04 per share. As a result, the conversion rate was recently adjusted to 48.0607 shares of common stock per $1,000 principal amount of 3.25% Notes, which is equal to a current conversion price of approximately $20.81 per share. In addition, we may be obligated to increase the conversion rate for any conversion that occurs in connection with certain corporate events, including calling the 3.25% Notes for redemption.
We may redeem for cash all, but not less than all, of the 3.25% Notes at any time on or after October 1, 2016 if the sale price of our common stock equals or exceeds 140% of the applicable conversion price for a specified time period ending on the trading day immediately prior to the date we deliver notice of the redemption. The redemption price will equal 100% of the principal amount of the 3.25% Notes, plus any accrued and unpaid interest. In addition, upon the occurrence of a fundamental change, such as a change in control, holders of the 3.25% Notes will have the right, at their option, to require us to repurchase their 3.25% Notes in cash at a price equal to 100% of the principal amount of the 3.25% Notes to be repurchased, plus accrued and unpaid interest. Default with respect to any loan in excess of $10.0 million constitutes an event of default under the 3.25% Notes, which could result in the 3.25% Notes being declared due and payable.
On February 14, 2014, we gave notice of our intention to redeem all of our previously-issued and outstanding $90.0 million of 5.75% Convertible Senior Notes due 2015, or the 5.75% Notes, pursuant to the optional redemption right in the indenture governing the 5.75% Notes. The 5.75% Notes were convertible into shares of the Company’s common stock at the conversion rate of 72.5846 shares of common stock for each $1,000 principal amount of 5.75% Notes from February 14, 2014 through February 28, 2014. From March 1, 2014 to March 19, 2014, the conversion rate was adjusted to 72.6961 shares of common stock for each $1,000 principal amount as a result of the quarterly cash dividend. Approximately $89.95 million of the 5.75% Notes were submitted for conversion into 6,532,713 shares of common stock through March 19, 2014. On March 20, 2014, the Company redeemed the remaining 5.75% Notes at par value plus accrued and unpaid interest through March 19, 2014. All $90.0 million of the 5.75% Notes were retired effective March 20, 2014.
53
Contractual Obligations
Our contractual obligations as of December 31, 2014 were as follows (in thousands):
|
Payments Due By Period |
||||||||||
|
Contractual Obligations |
Total |
Less than 1 year |
1-3 years |
3-5 years |
More than 5 years |
|||||
|
Long-term and short-term debt obligations (1) |
$ 691,946 |
$ 273,351 |
$ 28,033 |
$ 157,314 |
$ 233,248 |
|||||
|
Interest and fees on debt obligations (2) |
130,653 | 31,419 | 44,541 | 36,433 | 18,260 | |||||
|
Operating lease obligations (3) |
106,783 | 30,316 | 43,720 | 23,824 | 8,923 | |||||
|
Deferred tax liabilities |
115,235 |
- |
- |
- |
115,235 | |||||
|
Purchase obligations |
||||||||||
|
Forward grain purchase contracts (4) |
235,615 | 223,758 | 4,298 | 3,666 | 3,893 | |||||
|
Other commodity purchase contracts (5) |
72,754 | 72,754 |
- |
- |
- |
|||||
|
Other |
188 | 101 | 57 | 30 |
- |
|||||
|
Total contractual obligations |
$ 1,353,174 |
$ 631,699 |
$ 120,649 |
$ 221,267 |
$ 379,559 |
|||||
|
(1) Includes the current portion of long-term debt and excludes the effect of any debt discounts. |
||||||||||
|
(2) Interest amounts are calculated over the terms of the loans using current interest rates, assuming scheduled principle and interest amounts are |
||||||||||
|
paid pursuant to the debt agreements. Includes administrative and/or commitment fees on debt obligations. |
||||||||||
|
(3) Operating lease costs are primarily for railcars and office space. |
||||||||||
|
(4) Purchase contracts represent index-priced and fixed-price contracts. Index purchase contracts are valued at current year-end prices. |
||||||||||
|
(5) Includes fixed-price ethanol, dried distillers grains and natural gas purchase contracts. |
||||||||||
Item 7A. Qualitative and Quantitative Disclosures About Market Risk.
We are exposed to various market risks, including changes in commodity prices and interest rates. Market risk is the potential loss arising from adverse changes in market rates and prices. In the ordinary course of business, we enter into various types of transactions involving financial instruments to manage and reduce the impact of changes in commodity prices and interest rates. At this time, we do not expect to have exposure to foreign currency risk as we expect to conduct all of our business in U.S. dollars.
Interest Rate Risk
We are exposed to market risk from changes in interest rates. Exposure to interest rate risk results primarily from holding term and revolving loans that bear variable interest rates. Specifically, we had $672.8 million outstanding in debt as of December 31, 2014, $536.4 million of which is variable-rate in nature. Interest rates on our variable-rate debt are determined based upon the market interest rate of either the lender’s prime rate or LIBOR, as applicable. A 10% change in interest rates would affect our interest cost on such debt by approximately $2.6 million per year in the aggregate. Other details of our outstanding debt are discussed in the notes to the consolidated financial statements included as a part of this report.
Commodity Price Risk
We produce ethanol, distillers grains and corn oil from corn and our business is sensitive to changes in the prices of each of these commodities. The price of corn is subject to fluctuations due to unpredictable factors such as weather; corn planted and harvested acreage; changes in national and global supply and demand; and government programs and policies. We use natural gas in the ethanol production process and, as a result, our business is also sensitive to changes in the price of natural gas. The price of natural gas is influenced by such weather factors as extreme heat or cold in the summer and winter, or other natural events like hurricanes in the spring, summer and fall. Other natural gas price factors include North American exploration and production, and the amount of natural gas in underground storage during both the injection and withdrawal seasons. Ethanol prices are sensitive to world crude-oil supply and demand; crude-oil refining capacity and utilization; government regulation; and consumer demand for alternative fuels. Distillers grains prices are sensitive to various demand factors such as numbers of livestock on feed, prices for feed alternatives, and supply factors, primarily production by ethanol plants and other sources.
54
We attempt to reduce the market risk associated with fluctuations in the price of corn, natural gas, ethanol, distillers grains and corn oil by employing a variety of risk management and economic hedging strategies. Strategies include the use of forward fixed-price physical contracts and derivative financial instruments, such as futures and options executed on the Chicago Board of Trade and the New York Mercantile Exchange.
We focus on locking in operating margins based on a model that continually monitors market prices of corn, natural gas and other input costs against prices for ethanol and distillers grains at each of our production facilities. We create offsetting positions by using a combination of forward fixed-price physical purchases and sales contracts and derivative financial instruments. As a result of this approach, we frequently have gains on derivative financial instruments that are conversely offset by losses on forward fixed-price physical contracts or inventories and vice versa. In our ethanol production segment, gains and losses on derivative financial instruments are recognized each period in operating results while corresponding gains and losses on physical contracts are generally designated as normal purchase or normal sale contracts and are not recognized until quantities are delivered or utilized in production. For cash flow hedges, any ineffectiveness is recognized in current period results, while other unrealized gains and losses are deferred in accumulated other comprehensive income until gains and losses from the underlying hedged transaction are realized. In the event that it becomes probable that a forecasted transaction will not occur, we would discontinue cash flow hedge treatment, which would affect earnings. During the year ended December 31, 2014, revenues included net losses of $244.7 million and cost of goods sold included net losses of $40.6 million from derivative financial instruments. To the extent net gains or losses from settled derivative instruments are related to hedging current period production, they are generally offset by physical commodity purchases or sales resulting in the realization of the intended operating margins. However, our results of operations are impacted when there is a mismatch of gains or losses associated with the change in fair value of derivative instruments at the reporting period when the physical commodity purchase or sale has not yet occurred since they are designated as a normal purchase or normal sale.
In our agribusiness segment, inventory positions, physical purchase and sale contracts, and financial derivatives are marked to market with gains and losses included in results of operations. The market value of derivative financial instruments such as exchange-traded futures and options has a high, but not perfect, correlation to the underlying market value of grain inventories and related purchase and sale contracts.
Ethanol Production Segment
A sensitivity analysis has been prepared to estimate our ethanol production segment exposure to ethanol, corn, distillers grains and natural gas price risk. Market risk related to these factors is estimated as the potential change in net income resulting from hypothetical 10% changes in prices of our expected corn and natural gas requirements, and ethanol and distillers grains output for a one-year period from December 31, 2014. This analysis excludes the impact of risk management activities that result from our use of fixed-price purchase and sale contracts and derivatives. The results of this analysis, which may differ from actual results, are as follows (in thousands):
|
Commodity |
Estimated Total Volume Requirements for the Next 12 Months (1) |
Unit of Measure |
Net Income Effect of Approximate 10% Change |
||||
|
Ethanol |
1,020,000 |
Gallons |
$ |
96,639 |
|||
|
Corn |
360,000 |
Bushels |
$ |
89,389 |
|||
|
Distillers grains |
2,900 |
Tons (2) |
$ |
21,111 |
|||
|
Natural gas |
28,700 |
MMBTU (3) |
$ |
3,928 |
|||
|
(1) Assumes production at full capacity. |
|||||||
|
(2) Distillers grains quantities are stated on an equivalent dried ton basis. |
|||||||
|
(3) Millions of British Thermal Units |
|||||||
Corn Oil Production Segment
A sensitivity analysis has been prepared to estimate our corn oil production segment exposure to corn oil price risk. Market risk related to these factors is estimated as the potential change in net income resulting from hypothetical 10% changes in prices of our expected corn oil output for a one-year period from December 31, 2014. This analysis includes the impact of risk management activities that result from our use of fixed-price sale contracts. Market risk at December 31, 2014,
55
based on the estimated net income effect resulting from a hypothetical 10% change in such prices, was approximately $4.0 million.
Agribusiness Segment
The availability and price of agricultural commodities are subject to wide fluctuations due to unpredictable factors such as weather, plantings, foreign and domestic government farm programs and policies, changes in global demand created by population changes and changes in standards of living, and global production of similar and competitive crops. To reduce price risk caused by market fluctuations in purchase and sale commitments for grain and cattle, as well as grain held in inventory, we enter into exchange-traded futures and options contracts that function as economic hedges. The market value of exchange-traded futures and options used for hedging has a high, but not perfect correlation, to the underlying market value of grain inventories and related purchase and sale contracts for grain and cattle. The less correlated portion of inventory and purchase and sale contract market value, known as basis, is much less volatile than the overall market value of exchange-traded futures and tends to follow historical patterns. We manage this less volatile risk by constantly monitoring our position relative to the price changes in the market. In addition, inventory values are affected by the month-to-month spread relationships in the regulated futures markets, as we carry inventories over time. These spread relationships are also less volatile than the overall market value and tend to follow historical patterns, but also represent a risk that cannot be directly mitigated. Our accounting policy for our futures and options, as well as the underlying inventory held for sale and purchase and sale contracts, is to mark them to the market and include gains and losses in the consolidated statement of operations.
A sensitivity analysis has been prepared to estimate agribusiness segment exposure to market risk of our commodity position (exclusive of basis risk). Our daily net commodity position consists of inventories related to purchase and sale contracts and exchange-traded contracts. The fair value of our position, which is a summation of the fair values calculated for each commodity by valuing each net position at quoted futures market prices, is approximately $30.8 million at December 31, 2014. Market risk at that date, based on the estimated net income effect resulting from a hypothetical 10% change in such prices, was approximately $2.0 million.
Item 8. Financial Statements and Supplementary Data.
The required consolidated financial statements and notes thereto are included in this report and are listed in Part IV, Item 15.
Item 9. Changes in and Disagreements With Accountants on Accounting and Financial Disclosure.
None.
Item 9A. Controls and Procedures.
Evaluation of Disclosure Controls and Procedures
We maintain disclosure controls and procedures that are designed to ensure that information required to be disclosed in the reports that we file or submit under the Securities Exchange Act of 1934, or Exchange Act, is recorded, processed, summarized and reported within the time periods specified in the SEC’s rules and forms, and that such information is accumulated and communicated to our management, including our Chief Executive Officer and Chief Financial Officer, as appropriate, to allow timely decisions regarding required financial disclosure.
As of the end of the period covered by this report, our management carried out an evaluation, under the supervision of and with the participation of our Chief Executive Officer and Chief Financial Officer, of the effectiveness of the design and operation of our disclosure controls and procedures (as defined in Rules 13a-15(e) and 15d-15(e) under the Exchange Act). Our disclosure controls and procedures are designed to ensure that information required to be disclosed in the reports that we file or submit under the Exchange Act is recorded, processed, summarized and reported within the time periods specified in SEC rules and forms. These disclosure controls and procedures are designed to ensure that information required to be disclosed by us in the reports that we file or submit under the Exchange Act is accumulated and communicated to our management, including our Chief Executive Officer and Chief Financial Officer, as appropriate, to allow timely decisions regarding required financial disclosure. Based upon that evaluation, our management, including the Chief Executive Officer and the Chief Financial Officer, concluded that our disclosure controls and procedures were effective.
56
Management’s Annual Report on Internal Control over Financial Reporting
Our management is responsible for establishing and maintaining effective internal control over financial reporting, as defined in Exchange Act Rule 13a-15(f). Our internal control system is designed to provide reasonable assurance regarding the reliability of financial reporting and the preparation of financial statements in accordance with U.S. generally accepted accounting principles.
Under the supervision of and with the participation of management, including our Chief Executive Officer and Chief Financial Officer, our management assessed the design and operating effectiveness of internal control over financial reporting as of December 31, 2014 based on the framework set forth in Internal Control-Integrated Framework (1992) issued by the Committee of Sponsoring Organizations of the Treadway Commission. In June 2014, we acquired the assets of a cattle-feeding business near Kismet, Kansas, which includes a feedlot and grain storage facility. Our management excluded the acquired cattle-feeding business from its assessment of the effectiveness of our internal control over financial reporting as of December 31, 2014. The acquired cattle-feeding business represents approximately 6% of our total assets at December 31, 2014 and it contributed approximately 1% of our total revenues in 2014.
Based on this assessment, management concluded that our internal control over financial reporting was effective as of December 31, 2014. KMPG LLP, an independent registered public accounting firm, has audited and issued a report on the Company’s internal control over financial reporting as of December 31, 2014. That report is included herein.
Changes in Internal Control over Financial Reporting
Our management is responsible for establishing and maintaining effective internal control over financial reporting to provide reasonable assurance regarding the reliability of our financial reporting and the preparation of our consolidated financial statements for external purposes in accordance with U.S. generally accepted accounting principles. There were no material changes in our internal control over financial reporting that occurred during the period covered by this annual report that have materially affected, or are reasonably likely to materially affect, our internal control over financial reporting.
57
Report of Independent Registered Public Accounting Firm
The Board of Directors and Stockholders
Green Plains Inc.:
We have audited Green Plains Inc. and subsidiaries’ (the Company) internal control over financial reporting as of December 31, 2014, based on criteria established in Internal Control – Integrated Framework (1992) issued by the Committee of Sponsoring Organizations of the Treadway Commission (COSO). The Company’s management is responsible for maintaining effective internal control over financial reporting and for its assessment of the effectiveness of internal control over financial reporting, included in the accompanying Management’s Annual Report on Internal Control over Financial Reporting. Our responsibility is to express an opinion on the Company’s internal control over financial reporting based on our audit.
We conducted our audit in accordance with the standards of the Public Company Accounting Oversight Board (United States). Those standards require that we plan and perform the audit to obtain reasonable assurance about whether effective internal control over financial reporting was maintained in all material respects. Our audit included obtaining an understanding of internal control over financial reporting, assessing the risk that a material weakness exists, and testing and evaluating the design and operating effectiveness of internal control based on the assessed risk. Our audit also included performing such other procedures as we considered necessary in the circumstances. We believe that our audit provides a reasonable basis for our opinion.
A company’s internal control over financial reporting is a process designed to provide reasonable assurance regarding the reliability of financial reporting and the preparation of financial statements for external purposes in accordance with generally accepted accounting principles. A company’s internal control over financial reporting includes those policies and procedures that (1) pertain to the maintenance of records that, in reasonable detail, accurately and fairly reflect the transactions and dispositions of the assets of the company; (2) provide reasonable assurance that transactions are recorded as necessary to permit preparation of financial statements in accordance with generally accepted accounting principles, and that receipts and expenditures of the company are being made only in accordance with authorizations of management and directors of the company; and (3) provide reasonable assurance regarding prevention or timely detection of unauthorized acquisition, use, or disposition of the company’s assets that could have a material effect on the financial statements.
Because of its inherent limitations, internal control over financial reporting may not prevent or detect misstatements. Also, projections of any evaluation of effectiveness to future periods are subject to the risk that controls may become inadequate because of changes in conditions, or that the degree of compliance with the policies or procedures may deteriorate.
In our opinion, the Company maintained, in all material respects, effective internal control over financial reporting as of December 31, 2014, based on criteria established in Internal Control – Integrated Framework (1992) issued by the Committee of Sponsoring Organizations of the Treadway Commission (COSO).
The Company acquired the assets of Supreme Cattle Feeders from Agri Beef Co (referred to as the Cattle Feedlot), on June 10, 2014 and management excluded from its assessment of the effectiveness of the Company’s internal control over financial reporting as of December 31, 2014, the Cattle Feedlot’s internal control over financial reporting associated with the Cattle Feedlot which represent approximately 6% of the Company’s consolidated total assets and approximately 1% of the Company’s consolidated total revenues as of and for the year ended December 31, 2014. Our audit of internal control over financial reporting of the Company also excluded an evaluation of the internal control over financial reporting of the Cattle Feedlot.
We also have audited, in accordance with the standards of the Public Company Accounting Oversight Board (United States), the consolidated balance sheets of the Company as of December 31, 2014 and 2013, and the related consolidated statements of operations, comprehensive income, stockholders’ equity, and cash flows for each of the years in the three-year period ended December 31, 2014, and our report dated February 10, 2015 expressed an unqualified opinion on those consolidated financial statements.
/s/ KPMG LLP
Omaha, Nebraska
February 10, 2015
58
None.
PART III
Item 10. Directors, Executive Officers and Corporate Governance.
Information included in the sections entitled “Information about the Board of Directors and Corporate Governance,” “Proposal 1 – Election of Directors,” “Executive Officers,” and “Section 16(a) Beneficial Ownership Reporting Compliance” in our Proxy Statement for the 2015 Annual Meeting of Stockholders (the “Proxy Statement”) is incorporated herein by reference.
The Company has adopted a Code of Ethics that applies to our Chief Executive Officer and all senior financial officers, including the Chief Financial Officer, principal accounting officer, other senior financial officers and persons performing similar functions. The full text of the Code of Ethics is published on our website at www.gpreinc.com in the “Investors – Corporate Governance” section. We intend to disclose future amendments to, or waivers from, certain provisions of the Code of Ethics on our website within five business days following the adoption of such amendment or waiver.
Item 11. Executive Compensation.
Information included in the sections entitled “Information about the Board of Directors and Corporate Governance,” “Director Compensation” and “Executive Compensation” in the Proxy Statement is incorporated herein by reference.
Item 12. Security Ownership of Certain Beneficial Owners and Management and Related Stockholder Matters.
Information included in the sections entitled “Principal Shareholders,” “Equity Compensation Plans” and “Executive Compensation” in the Proxy Statement is incorporated herein by reference.
Item 13. Certain Relationships and Related Transactions, and Director Independence.
Information included in the sections entitled “Information about the Board of Directors and Corporate Governance” and “Certain Relationships and Related Party Transactions,” if any, in the Proxy Statement is incorporated herein by reference.
Item 14. Principal Accounting Fees and Services.
Information included in the section entitled “Independent Public Accountants” in the Proxy Statement is incorporated herein by reference.
59
PART IV
Item 15. Exhibits, Financial Statement Schedules.
(1) Financial Statements. The following index lists consolidated financial statements and notes thereto filed as part of this annual report on Form 10-K.
|
|
Page |
|
Report of Independent Registered Public Accounting Firm |
F-1 |
|
Consolidated Balance Sheets as of December 31, 2014 and 2013 |
F-2 |
|
Consolidated Statements of Operations for the years-ended December 31, 2014, 2013 and 2012 |
F-3 |
|
Consolidated Statements of Comprehensive Income for the years-ended December 31, 2014, 2013 and 2012 |
F-4 |
|
Consolidated Statements of Stockholders’ Equity for the years-ended December 31, 2014, 2013 and 2012 |
F-5 |
|
Consolidated Statements of Cash Flows for the years-ended December 31, 2014, 2013 and 2012 |
F-6 |
|
Notes to Consolidated Financial Statements |
F-8 |
(2) Financial Statement Schedules. The following condensed financial information and notes thereto are filed as part of this annual report on Form 10-K.
|
|
Page |
|
Schedule I – Condensed Financial Information of the Registrant |
F-37 |
All other schedules have been omitted because they are not applicable or the required information is included in the consolidated financial statements or notes thereto.
(3) Exhibits. The following exhibit index lists exhibits incorporated herein by reference, filed as a part of this annual report on Form 10-K, or furnished as part of this annual report on Form 10-K.
Exhibit Index
|
Exhibit No. |
Description of Exhibit |
||||
|
2.1 |
Agreement and Plan of Merger among the Company, GPMS, Inc., Global Ethanol, LLC and Global Ethanol, Inc. dated September 28, 2010 (Incorporated by reference to Exhibit 2.1 to the Company’s Current Report on Form 8-K dated October 22, 2010) |
||||
|
2.2(a) |
Asset Purchase Agreement among Green Plains Grain Company LLC, Green Plains Grain Company TN LLC, Green Plains Renewable Energy, Inc. and The Andersons, Inc. dated October 26, 2012 (Incorporated by reference to Exhibit 2.1 of the Company’s Current Report on Form 8-K filed October 29, 2012) |
||||
|
2.2(b) |
First Amendment to Asset Purchase Agreement among Green Plains Grain Company LLC, Green Plains Grain Company TN LLC, Green Plains Renewable Energy, Inc. and The Andersons, Inc. effective as of November 30, 2012 (Incorporated by reference to Exhibit 2.2 of the Company’s Current Report on Form 8-K filed December 6, 2012) |
||||
|
2.3 |
Asset Purchase Agreement by and among Ethanol Holding Company, LLC, Green Plains Renewable Energy, Inc., Green Plains Wood River LLC and Green Plains Fairmont LLC dated November 1, 2013 (Incorporated by reference to Exhibit 2.1 of the Company’s Current Report on Form 8-K filed November 25, 2013) |
||||
|
2.4 |
Amendment to Asset Purchase Agreement by and among Ethanol Holding Company, LLC, Green Plains Renewable Energy, Inc., Green Plains Wood River LLC and Green Plains Fairmont LLC dated November 22, 2013 (Incorporated by reference to Exhibit 2.2 of the Company’s Current Report on Form 8-K filed November 25, 2013) |
||||
|
3.1(a) |
Second Amended and Restated Articles of Incorporation of the Company (Incorporated by reference to Exhibit 3.1 of the Company’s Current Report on Form 8-K filed October 15, 2008) |
||||
|
3.1(b) |
Articles of Amendment to Second Amended and Restated Articles of Incorporation of Green Plains Renewable Energy, Inc. (Incorporated by reference to Exhibit 3.1 of the Company’s Current Report on Form 8-K filed May 9, 2011) |
||||
60
|
3.1(c) |
Second Articles of Amendment to Second Amended and Restated Articles of Incorporation of Green Plains Renewable Energy, Inc. (Incorporated by reference to Exhibit 3.1 of the Company’s Current Report on Form 8-K filed May 16, 2014) |
||||
|
3.2 |
Second Amended and Restated Bylaws of Green Plains Renewable Energy, Inc., dated August 14, 2012 (Incorporated by reference to Exhibit 3.1 of the Company’s Current Report on Form 8-K filed August 15, 2012) |
||||
|
4.1 |
Shareholders’ Agreement by and among Green Plains Renewable Energy, Inc., each of the investors listed on Schedule A, and each of the existing shareholders and affiliates identified on Schedule B, dated May 7, 2008 (Incorporated by reference to Appendix F of the Company’s Registration Statement on Form S-4/A filed September 4, 2008) |
||||
|
4.2 |
Form of Senior Indenture (Incorporated by reference to Exhibit 4.5 of the Company’s Registration Statement on Form S-3/A filed December 30, 2009) |
||||
|
4.3 |
Form of Subordinated Indenture (Incorporated by reference to Exhibit 4.6 of the Company’s Registration Statement on Form S-3/A filed December 30, 2009) |
||||
|
4.4 |
Indenture relating to the 3.25% Convertible Senior Notes due 2018, dated as of September 20, 2013, between Green Plains Renewable Energy, Inc. and Willington Trust, National Association, including the form of Global Note attached as Exhibit A thereto (Incorporated by reference to Exhibit 4.1 to the Company’s Current Report on Form 8-K filed September 20, 2013) |
||||
|
*10.1 |
Amended and Restated Employment Agreement dated October 24, 2008, by and between the Company and Jerry L. Peters (Incorporated by reference to Exhibit 10.1 of the Company’s Current Report on Form 8-K dated October 28, 2008) |
||||
|
*10.2 |
2007 Equity Incentive Plan (Incorporated by reference to Appendix A of the Company’s Definitive Proxy Statement filed March 27, 2007) |
||||
|
10.3 |
Form of Indemnification Agreement (Incorporated by reference to Exhibit 10.53 of the Company’s Registration Statement on Form S-4/A filed August 1, 2008) |
||||
|
*10.4(a) |
Employment Agreement with Todd Becker (Incorporated by reference to Exhibit 10.54 of the Company’s Registration Statement on Form S-4/A filed August 1, 2008) |
||||
|
*10.4(b) |
Amendment No. 1 to Employment Agreement with Todd Becker, dated December 18, 2009. (Incorporated by reference to Exhibit 10.7(b) of the Company’s Annual Report on Form 10-K filed February 24, 2010) |
||||
|
10.5(a) |
Construction/Permanent Mortgage Security Agreement, Assignment of Leases and Rents, Financing Statement and Fixture Filing dated as of February 27, 2007 by Green Plains Bluffton LLC (f/k/a Indiana Bio-Energy, LLC) in favor of AgStar Financial Services, PCA (Incorporated by reference to Exhibit 10.48 of the Company’s Annual Report on Form 10-KT dated March 31, 2009) |
||||
|
10.5(b) |
Second Amended and Restated Master Loan Agreement dated as of April 22, 2013 by and among Green Plains Bluffton LLC and AgStar Financial Services, PCA (Incorporated by reference to Exhibit 10.1 of the Company’s Quarterly Report on Form 10-Q filed May 2, 2013) |
||||
|
*10.6 |
Non-Statutory Stock Option Agreement between Steve Bleyl and Green Plains Renewable Energy, Inc. dated October 15, 2008 (Incorporated by reference to Exhibit 10.50 of the Company’s Annual Report on Form 10-KT dated March 31, 2009) |
||||
|
*10.7 |
Non-Statutory Stock Option Agreement between Michael Orgas and Green Plains Renewable Energy, Inc. dated November 1, 2008 (Incorporated by reference to Exhibit 10.52 of the Company’s Annual Report on Form 10-KT, dated March 31, 2009) |
||||
|
*10.8 |
Employment Agreement by and between Green Plains Renewable Energy, Inc. and Michael C. Orgas dated November 1, 2008 (Incorporated by reference to Exhibit 10.1 of the Company’s Quarterly Report on Form 10-Q filed May 15, 2009) |
||||
|
*10.9(a) |
2009 Equity Incentive Plan (Incorporated by reference to Exhibit 10.1 of the Company’s Current Report on Form 8-K dated May 11, 2009) |
||||
|
*10.9(b) |
Amendment No. 1 to the 2009 Equity Incentive Plan (Incorporated by reference to Appendix A of the Company’s Definitive Proxy Statement filed March 25, 2011) |
||||
61
|
*10.9(c) |
Amendment No. 2 to the 2009 Equity Incentive Plan (Incorporated by reference to Appendix A of the Company’s Definitive Proxy Statement filed March 29, 2013) |
||||
|
*10.9(d) |
Form of Stock Option Award Agreement for 2009 Equity Incentive Plan (Incorporated by reference to Exhibit 10.19(b) of the Company’s Annual Report on Form 10-K filed February 24, 2010) |
||||
|
*10.9(e) |
Form of Restricted Stock Award Agreement for 2009 Equity Incentive Plan (Incorporated by reference to Exhibit 10.19(c) of the Company’s Annual Report on Form 10-K/A (Amendment No. 1) filed February 25, 2010) |
||||
|
*10.9(f) |
Form of Deferred Stock Unit Award Agreement for 2009 Equity Incentive Plan (Incorporated by reference to Exhibit 10.19(d) of the Company’s Annual Report on Form 10-K filed February 24, 2010) |
||||
|
10.10(a) |
Credit Agreement by and among Green Plains Ord LLC, Green Plains Holdings LLC, AgStar Financial Services, PCA as Administrative Agent and the Banks named therein, dated July 2, 2009 (Incorporated by reference to Exhibit 10.5 of the Company’s Quarterly Report on Form 10-Q filed August 10, 2009) |
||||
|
10.10(b) |
Deed of Trust, Security Agreement, Assignment of Rents and Leases and Fixture Filing by and among Green Plains Ord LLC, Ticor Title Insurance Company and AgStar Financial Services, PCA, dated July 2, 2009 (Incorporated by reference to Exhibit 10.22(b) of the Company’s Annual Report on Form 10-K filed February 24, 2010) |
||||
|
10.10(c) |
Security Agreement by and among Green Plains Ord LLC, Green Plains Holdings LLC and AgStar Financial Services, PCA, dated July 2, 2009 (Incorporated by reference to Exhibit 10.22(c) of the Company’s Annual Report on Form 10-K filed February 24, 2010) |
||||
|
10.10(d) |
Affiliate Security Agreement between Green Plains Central City LLC and AgStar Financial Services, PCA, dated July 2, 2009 (Incorporated by reference to Exhibit 10.22(d) of the Company’s Annual Report on Form 10-K filed February 24, 2010) |
||||
|
10.10(e) |
Affiliate Deed of Trust, Security Agreement, Assignment of Rents and Leases and Fixture Filing between Green Plains Central City LLC, Ticor Title Insurance Company, and AgStar Financial Services, PCA, dated July 2, 2009 (Incorporated by reference to Exhibit 10.22(e) of the Company’s Annual Report on Form 10-K filed February 24, 2010) |
||||
|
10.11(a) |
Credit Agreement by and among Green Plains Central City LLC, Green Plains Holdings LLC, AgStar Financial Services, PCA as Administrative Agent, and the Banks named therein, dated July 2, 2009 (Incorporated by reference to Exhibit 10.6 of the Company’s Quarterly Report on Form 10-Q filed August 10, 2009) |
||||
|
10.11(b) |
Deed of Trust, Security Agreement, Assignment of Rents and Leases and Fixture Filing by and among Green Plains Central City LLC, Ticor Title Insurance Company, and AgStar Financial Services, PCA, dated July 2, 2009 (Incorporated by reference to Exhibit 10.23(b) of the Company’s Annual Report on Form 10-K filed February 24, 2010) |
||||
|
10.11(c) |
Security Agreement by and among Green Plains Central City LLC, Green Plains Holdings LLC and AgStar Financial Services, PCA, dated July 2, 2009 (Incorporated by reference to Exhibit 10.23(c) of the Company’s Annual Report on Form 10-K filed February 24, 2010) |
||||
|
10.11(d) |
Affiliate Security Agreement between Green Plains Ord LLC and AgStar Financial Services, PCA, dated July 2, 2009 (Incorporated by reference to Exhibit 10.23(d) of the Company’s Annual Report on Form 10-K filed February 24, 2010) |
||||
|
10.11(e) |
Affiliate Deed of Trust, Security Agreement, Assignment of Rents and Leases and Fixture Filing between Green Plains Ord LLC, Ticor Title Insurance Company, and AgStar Financial Services, PCA, dated July 2, 2009 (Incorporated by reference to Exhibit 10.23(e) of the Company’s Annual Report on Form 10-K filed February 24, 2010) |
||||
|
10.11(f) |
First Amendment to Credit Agreement by and among Green Plains Central City LLC, Green Plains Holdings LLC, AgStar Financial Services, PCA as Administrative Agent, and the Banks named therein, dated December 31, 2010 (Incorporated by reference to Exhibit 10.23(f) of the Company’s Annual Report on Form 10-K filed March 4, 2011) |
||||
62
|
10.11(g) |
Second Amendment dated June 30, 2011 to the Credit Agreement dated July 2, 2009 by and among Green Plains Central City LLC, Green Plains Holdings LLC, AgStar Financial Services, PCA as Administrative Agent and the Banks named therein (Incorporated by reference to Exhibit 10.5 of the Company’s Quarterly Report on Form 10-Q filed August 3, 2011) |
||||
|
10.11(h) |
Third Amendment dated June 30, 2011 to the Credit Agreement dated July 2, 2009 by and among Green Plains Central City LLC, Green Plains Holdings LLC, AgStar Financial Services, PCA as Administrative Agent and the Banks named therein (Incorporated by reference to Exhibit 10.6 of the Company’s Quarterly Report on Form 10-Q filed August 3, 2011) |
||||
|
10.11(i) |
Fourth Amendment dated June 28, 2012 to the Credit Agreement, as amended, dated June 2, 2009 by and among Green Plains Central City LLC, Green Plains Holdings LLC, AgStar Financial Services, PCA as Administrative Agent and the Banks named therein (Incorporated by reference to Exhibit 10.1 of the Company’s Quarterly Report on Form 10-Q filed July 31, 2012) |
||||
|
10.11(j) |
Fifth Amendment dated September 28, 2012 to the Credit Agreement, as amended, dated June 2, 2009 by and among Green Plains Central City LLC, Green Plains Holdings LLC, AgStar Financial Services, PCA as Administrative Agent and the Banks named therein (Incorporated by reference to Exhibit 10.3 of the Company’s Quarterly Report on Form 10-Q filed November 1, 2012) |
||||
|
10.11(k) |
Sixth Amendment dated June 27, 2013 to the Credit Agreement, as amended, dated June 2, 2009 by and among Green Plains Central City LLC, Green Plains Holdings LLC, AgStar Financial Services, PCA as Administrative Agent and the Banks named therein (Incorporated by reference to Exhibit 10.1 of the Company’s Quarterly Report on Form 10-Q filed August 1, 2013) |
||||
|
10.11(l) |
Seventh Amendment dated August 26, 2013 to the Credit Agreement, as amended, dated June 2, 2009 by and among Green Plains Central City LLC, Green Plains Holdings LLC, AgStar Financial Services, PCA as Administrative Agent and the Banks named therein (Incorporated by reference to Exhibit 10.1 of the Company’s Quarterly Report on Form 10-Q filed October 31, 2013) |
||||
|
10.11(m) |
Eighth Amendment dated December 1, 2013 to the Credit Agreement, as amended, dated June 2, 2009 by and among Green Plains Central City LLC, Green Plains Holdings LLC, AgStar Financial Services, PCA as Administrative Agent and the Banks named therein (Incorporated by reference to Exhibit 10.12(m) of the Company’s Annual Report on Form 10-K filed February 10,2014) |
||||
|
10.11(n) |
First Amendment dated June 30, 2011 to Credit Agreement dated July 2, 2009 by and among Green Plains Ord LLC, Green Plains Holdings LLC, AgStar Financial Services, PCA as Administrative Agent and the Banks named therein (Incorporated by reference to Exhibit 10.7 of the Company’s Quarterly Report on Form 10-Q filed August 3, 2011) |
||||
|
10.11(o) |
Second Amendment dated June 30, 2011 to Credit Agreement dated July 2, 2009 by and among Green Plains Ord LLC, Green Plains Holdings LLC, AgStar Financial Services, PCA as Administrative Agent and the Banks named therein (Incorporated by reference to Exhibit 10.8 of the Company’s Quarterly Report on Form 10-Q filed August 3, 2011) |
||||
|
10.11(p) |
Third Amendment dated June 28, 2012 to the Credit Agreement, as amended, dated June 2, 2009 by and among Green Plains Ord LLC, Green Plains Holdings LLC, AgStar Financial Services, PCA as Administrative Agent and the Banks named therein (Incorporated by reference to Exhibit 10.2 of the Company’s Quarterly Report on Form 10-Q filed July 31, 2012) |
||||
|
10.11(q) |
Fourth Amendment dated September 28, 2012 to the Credit Agreement, as amended, dated June 2, 2009 by and among Green Plains Ord LLC, Green Plains Holdings LLC, AgStar Financial Services, PCA as Administrative Agent and the Banks named therein (Incorporated by reference to Exhibit 10.2 of the Company’s Quarterly Report on Form 10-Q filed November 1, 2012) |
||||
|
10.11(r) |
Fifth Amendment dated June 27, 2013 to the Credit Agreement, as amended, dated June 2, 2009 by and among Green Plains Ord LLC, Green Plains Holdings LLC, AgStar Financial Services, PCA as Administrative Agent and the Banks named therein (Incorporated by reference to Exhibit 10.2 of the Company’s Quarterly Report on Form 10-Q filed August 1, 2013) |
||||
|
10.11(s) |
Sixth Amendment dated August 26, 2013 to the Credit Agreement, as amended, dated June 2, 2009 by and among Green Plains Ord LLC, Green Plains Holdings LLC, AgStar Financial Services, PCA as Administrative Agent and the Banks named therein (Incorporated by reference to Exhibit 10.2 of the Company’s Quarterly Report on Form 10-Q filed October 31, 2013) |
||||
63
|
10.11(t) |
Seventh Amendment dated December 1, 2013 to the Credit Agreement, as amended, dated June 2, 2009 by and among Green Plains Ord LLC, Green Plains Holdings LLC, AgStar Financial Services, PCA as Administrative Agent and the Banks named therein (Incorporated by reference to Exhibit 10.12(t) of the Company’s Annual Report on Form 10-K filed February 10,2014) |
||||
|
10.12(a) |
Second Amended and Restated Revolving Credit and Security Agreement dated April 26, 2013 by and among Green Plains Trade Group LLC and PNC Bank, National Association (as Lender and Agent) (Incorporated by reference to Exhibit 10.2 of the Company’s Quarterly Report on Form 10-Q filed May 2, 2013) |
||||
|
10.12(b) |
Third Amended and Restated Revolving Credit and Security Agreement dated November 26, 2014 by and among Green Plains Trade Group LLC, the Lenders and PNC Bank, National Association (as Lender and Agent) (Incorporated by reference to Exhibit 10.1 of the Company’s Current Report on Form 8-K filed December 2, 2014) |
||||
|
10.12(c) |
Second Amended and Restated Revolving Credit Note dated April 26, 2013 by and among Green Plains Trade Group LLC and PNC Bank, National Association (Incorporated by reference to Exhibit 10.2(a) of the Company’s Quarterly Report on Form 10-Q filed May 2, 2013) |
||||
|
10.12(d) |
Revolving Credit Note dated April 26, 2013 by and among Green Plains Trade Group LLC and Citibank, N.A. (Incorporated by reference to Exhibit 10.2(b) of the Company’s Quarterly Report on Form 10-Q filed May 2, 2013) |
||||
|
10.12(e) |
Revolving Credit Note dated April 26, 2013 by and among Green Plains Trade Group LLC and BMO Harris Bank N.A. (Incorporated by reference to Exhibit 10.2(c) of the Company’s Quarterly Report on Form 10-Q filed May 2, 2013) |
||||
|
10.12(f) |
Revolving Credit Note dated April 26, 2013 by and among Green Plains Trade Group LLC and Alostar Bank of Commerce (Incorporated by reference to Exhibit 10.2(d) of the Company’s Quarterly Report on Form 10-Q filed May 2, 2013) |
||||
|
10.12(g) |
Revolving Credit Note dated April 26, 2013 by and among Green Plains Trade Group LLC and Bank of America (Incorporated by reference to Exhibit 10.2(e) of the Company’s Quarterly Report on Form 10-Q filed May 2, 2013) |
||||
|
*10.13 |
Short-Term Incentive Plan (Incorporated by reference to Exhibit 10.1 of the Company’s Current Report on Form 8-K filed January 27, 2010) |
||||
|
*10.14 |
Director Compensation effective April 1, 2014 (Incorporated by reference to Exhibit 10.15 of the Company’s Annual Report on Form 10-K filed February 10, 2014) |
||||
|
*10.15 |
Employment Agreement dated March 4, 2011 by and between the Company and Jeffrey S. Briggs (Incorporated by reference to Exhibit 10.1 of the Company’s Current Report on Form 8-K filed March 8, 2011) |
||||
|
*10.16 |
Employment Agreement dated March 4, 2011 by and between the Company and Carl S. (Steve) Bleyl (Incorporated by reference to Exhibit 10.2 of the Company’s Current Report on Form 8-K filed March 8, 2011) |
||||
|
10.17(a) |
Master Loan Agreement dated June 13, 2011 by and among Green Plains Obion LLC and Farm Credit Services of Mid-America, FLCA (Incorporated by reference to Exhibit 10.12 of the Company’s Quarterly Report on Form 10-Q filed August 3, 2011) |
||||
|
10.17(b) |
Amendment to the Master Loan Agreement, dated October 24, 2012, by and among Green Plains Obion LLC, Farm Credit Services of Mid-America, FLCA and Farm Credit Services of Mid-America, PCA (Incorporated by reference to Exhibit 10.6 of the Company’s Quarterly Report on Form 10-Q filed November 1, 2012) |
||||
|
10.17(c) |
Real Estate Deed of Trust dated January 18, 2007 by and among Ethanol Grain Processors, LLC (n/k/a Green Plains Obion LLC) , Farm Credit Services of Mid-America, FLCA and Farm Credit Services of Mid-America, PCA (Incorporated by reference to Exhibit 10.18(c) of the Company’s Annual Report on Form 10-K filed February 15, 2013) |
||||
64
|
10.17(d) |
Amendment to the Master Loan Agreement, dated November 13, 2013, by and among Green Plains Obion LLC, Farm Credit Services of Mid-America, FLCA and Farm Credit Services of Mid-America, PCA (Incorporated by reference to Exhibit 10.18(d) of the Company’s Annual Report on Form 10-K filed February 10, 2014) |
||||
|
10.17(e) |
Revolving Term Loan Supplement, dated June 26, 2014, by and between Green Plains Obion LLC and Farm Credit Mid-America, FLCA (Incorporated by reference to Exhibit 10.1 of the Company’s Quarterly Report on Form 10-Q filed July 31, 2014) |
||||
|
10.18(a) |
Master Loan Agreement dated June 20, 2011 by and among Green Plains Superior LLC and Farm Credit Services of America, FLCA (Incorporated by reference to Exhibit 10.9 of the Company’s Quarterly Report on Form 10-Q filed August 3, 2011) |
||||
|
10.18(b) |
Amendment dated December 21, 2012 to the Master Loan Agreement dated June 20, 2011 by and among Green Plains Superior LLC and Farm Credit Services of America, FLCA (Incorporated by reference to Exhibit 10.19(b) of the Company’s Annual Report on Form 10-K filed February 15, 2013) |
||||
|
10.18(c) |
Amendment dated October 24, 2013 to the Master Loan Agreement, as amended, dated June 20, 2011 by and among Green Plains Superior LLC and Farm Credit Services of America, FLCA (Incorporated by reference to Exhibit 10.5 of the Company’s Quarterly Report on Form 10-Q filed October 31, 2013) |
||||
|
10.18(d) |
Amendment dated August 18, 2014 to the Master Loan Agreement, as amended, dated June 20, 2011 by and among Green Plains Superior LLC and Farm Credit Services of America, FLCA (Incorporated by reference to Exhibit 10.1 of the Company’s Quarterly Report on Form 10-Q filed October 30, 2014) |
||||
|
10.18(e) |
Revolving Term Loan Supplement dated June 20, 2011 by and among Green Plains Superior LLC and Farm Credit Services of America, FLCA (Incorporated by reference to Exhibit 10.11 of the Company’s Quarterly Report on Form 10-Q filed August 3, 2011) |
||||
|
10.18(f) |
Revolving Term Loan Supplement dated August 18, 2014 to the Master Loan Agreement, as amended, dated June 20, 2011 by and among Green Plains Superior LLC and Farm Credit Services of America, FLCA (Incorporated by reference to Exhibit 10.2 of the Company’s Quarterly Report on Form 10-Q filed October 30, 2014) |
||||
|
10.19 |
Stock Repurchase Agreement between Greenstar North America Holdings Inc. and Green Plains Renewable Energy. Inc. (Incorporated by reference to Exhibit 10.1 of the Company’s Current Report on Form 8-K filed September 14, 2011) |
||||
|
10.20(a) |
Master Loan Agreement, dated September 28, 2011, by and among Green Plains Shenandoah LLC and Farm Credit Services of America, FLCA (Incorporated by reference to Exhibit 10.3 of the Company’s Quarterly Report on Form 10-Q filed November 1, 2011) |
||||
|
10.20(b) |
Amendment to the Master Loan Agreement, dated February 5, 2013, between Green Plains Shenandoah LLC and Farm Credit Services of America, FLCA (Incorporated by reference to Exhibit 10.21(b) of the Company’s Annual Report on Form 10-K filed February 15, 2013) |
||||
|
10.20(c) |
Amendment to the Master Loan Agreement, as amended, dated October 15, 2013, between Green Plains Shenandoah LLC and Farm Credit Services of America, FLCA (Incorporated by reference to Exhibit 10.4 of the Company’s Quarterly Report on Form 10-Q filed October 31, 2013) |
||||
|
10.20(d) |
Revolving Term Loan Supplement, dated February 5, 2013, by and among Green Plains Shenandoah LLC and Farm Credit Services of America, FLCA (Incorporated by reference to Exhibit 10.21(c) of the Company’s Annual Report on Form 10-K filed February 15, 2013) |
||||
|
10.20(e) |
Multiple Advance Term Loan Supplement, dated September 28, 2011, by and among Green Plains Shenandoah LLC and Farm Credit Services of America, FLCA (Incorporated by reference to Exhibit 10.5 of the Company’s Quarterly Report on Form 10-Q filed November 1, 2011) |
||||
65
|
10.21(a) |
Credit Agreement dated October 28, 2011 by and among Green Plains Grain Company LLC, Green Plains Grain Company TN LLC, Green Plains Essex Inc., BNP Paribas Securities Corp. as Lead Arranger, Rabo Agrifinance, Inc. as Syndication Agent, ABN AMRO Capital USA LLC as Documentation Agent and BNP Paribas as Administrative Agent (Incorporated by reference to Exhibit 10.1 of the Company’s Current Report on Form 8-K filed November 3, 2011) |
||||
|
10.21(b) |
Security Agreement dated October 28, 2011 by and among Green Plains Grain Company LLC, Green Plains Grain Company TN LLC, Green Plains Essex Inc. and BNP Paribas (Incorporated by reference to Exhibit 10.2 of the Company’s Current Report on Form 8-K filed November 3, 2011) |
||||
|
10.21(c) |
Promissory Note dated October 28, 2011 by and among Green Plains Grain Company LLC, Green Plains Grain Company TN LLC, Green Plains Essex Inc. and Bank of Oklahoma (Incorporated by reference to Exhibit 10.3 of the Company’s Current Report on Form 8-K filed November 3, 2011) |
||||
|
10.21(d) |
Promissory Note dated October 28, 2011 by and among Green Plains Grain Company LLC, Green Plains Grain Company TN LLC, Green Plains Essex Inc. and U.S. Bank National Association (Incorporated by reference to Exhibit 10.4 of the Company’s Current Report on Form 8-K filed November 3, 2011) |
||||
|
10.21(e) |
Promissory Note dated October 28, 2011 by and among Green Plains Grain Company LLC, Green Plains Grain Company TN LLC, Green Plains Essex Inc. and Farm Credit Bank of Texas (Incorporated by reference to Exhibit 10.5 of the Company’s Current Report on Form 8-K filed November 3, 2011) |
||||
|
10.21(f) |
First Amendment to Credit Agreement dated January 6, 2012 by and among Green Plains Grain Company LLC, Green Plains Grain Company TN LLC, Green Plains Essex Inc., BNP Paribas and the Required Lenders (Incorporated by reference to Exhibit 10.26(k) of the Company’s Annual Report on Form 10-K filed February 17, 2012) |
||||
|
10.21(g) |
Second Amendment to Credit Agreement, dated October 26, 2012, by and among Green Plains Grain Company LLC, Green Plains Grain Company TN LLC, Green Plains Essex, Inc., BNP Paribas, as the administrative agent under the Credit Agreement, and the lenders party to the Credit Agreement (Incorporated by reference to Exhibit 10.5 of the Company’s Quarterly Report on Form 10-Q filed November 1, 2012) |
||||
|
10.21(h) |
Third Amendment to Credit Agreement, dated August 27, 2013, by and among Green Plains Grain Company LLC, Green Plains Grain Company TN LLC, Green Plains Essex, Inc., BNP Paribas, as the administrative agent under the Credit Agreement, and the lenders party to the Credit Agreement (Incorporated by reference to Exhibit 10.3 of the Company’s Quarterly Report on Form 10-Q filed October 31, 2013) |
||||
|
10.21(i) |
Fourth Amendment to Credit Agreement, dated August 8, 2014, by and among Green Plains Grain Company LLC (including in its capacity as successor by merger to Green Plains Essex Inc.), Green Plains Grain Company TN LLC, BNP Paribas, as the administrative agent under the Credit Agreement, and the lenders party to the Credit Agreement (Incorporated by reference to Exhibit 10.3 of the Company’s Quarterly Report on Form 10-Q filed October 30, 2014) |
||||
|
10.22(a) |
Amended and Restated Credit Agreement, dated February 9, 2012 by and among Green Plains Holdings II, various lenders and CoBank, ACB (as Administrative Agent, Syndication Agent and Lead Arranger) (Incorporated by reference to Exhibit 10.27(a) of the Company’s Annual Report on Form 10-K filed February 17, 2012) |
||||
|
10.22(b) |
First Amendment to Amended and Restated Credit Agreement, dated October 16, 2012, by and between Green Plains Holdings II LLC and CoBank, ACB (Incorporated by reference to Exhibit 10.4 of the Company’s Quarterly Report on Form 10-Q filed November 1, 2012) |
||||
|
10.22(c) |
Second Amendment to Amended and Restated Credit Agreement, dated February 28, 2014, by and between Green Plains Holdings II LLC and CoBank ACB (Incorporated by reference to Exhibit 10.1 of the Company’s Quarterly Report on Form 10-Q filed May 1, 2014) |
||||
|
10.22(d) |
Amended and Restated Support and Subordination Agreement, dated February 9, 2012 by and among Green Plains Holdings II, as Borrower, Green Plains Renewable Energy, Inc., as Parent, and CoBank, ACB, as Administrative Agent (Incorporated by reference to Exhibit 10.27(b) of the Company’s Annual Report on Form 10-K filed February 17, 2012) |
||||
66
|
10.22(e) |
Security Agreement, dated February 9, 2012 by and among Green Plains Holdings II (the Grantor) and CoBank, ACB (the Secured Party) (Incorporated by reference to Exhibit 10.27(c) of the Company’s Annual Report on Form 10-K filed February 17, 2012) |
||||
|
10.22(f) |
Second Amendment to Mortgage, dated February 9, 2012 by and among, Green Plains Holdings II and CoBank ACB (Incorporated by reference to Exhibit 10.27(d) of the Company’s Annual Report on Form 10-K filed February 17, 2012) |
||||
|
10.22(g) |
Second Amendment to Amended and Restated Real Estate Mortgage, dated February 9, 2012 by and among Green Plains Holdings II and CoBank, ACB (Incorporated by reference to Exhibit 10.27(e) of the Company’s Annual Report on Form 10-K filed February 17, 2012) |
||||
|
10.23 |
Stock Repurchase Agreement dated February 28, 2012 between Greenstar Investments LLC, Greenstar North America Holdings, Inc. and Green Plains Renewable Energy, Inc. (Incorporated by reference to Exhibit 10.1 of the Company’s Current Report on Form 8-K filed March 2, 2012) |
||||
|
*10.24 |
Employment Agreement by and between Green Plains Renewable Energy, Inc. and Patrich Simpkins dated April 1, 2012 (Incorporated by reference to Exhibit 10.2 of the Company’s Quarterly Report on Form 10-Q filed May 1, 2014) |
||||
|
10.25(a) |
Term Loan Agreement, dated as of June 10, 2014, among Green Plains Processing, LLC, as Borrower, the Lenders Party Hereto, BNP Paribas, as Administrative Agent and as Collateral Agent, and BMO Capital Markets and BNP Paribas Securities Corp., as Joint Lead Arrangers and Joint Book Runners (Incorporated by reference to Exhibit 10.1 to the Company’s Current Report on Form 8-K dated June 12, 2014) |
||||
|
10.25(b) |
Guaranty - Green Plains Inc. (Incorporated by reference to Exhibit 10.2 to the Company’s Current Report on Form 8-K dated June 12, 2014) |
||||
|
10.25(c) |
Guaranty - Green Plains Processing Subsidiaries (Incorporated by reference to Exhibit 10.3 to the Company’s Current Report on Form 8-K dated June 12, 2014) |
||||
|
10.25(d) |
Pledge Agreement (Incorporated by reference to Exhibit 10.4 to the Company’s Current Report on Form 8-K dated June 12, 2014) |
||||
|
10.25(e) |
Security Agreement (Incorporated by reference to Exhibit 10.5 to the Company’s Current Report on Form 8-K dated June 12, 2014) |
||||
|
10.25(f) |
Deed of Trust, Assignment of Leases and Rents, Security Agreement and Fixture Filing Statement by Green Plains Atkinson LLC (Incorporated by reference to Exhibit 10.6 to the Company’s Current Report on Form 8-K dated June 12, 2014) |
||||
|
10.25(g) |
Deed of Trust, Assignment of Leases and Rents, Security Agreement and Fixture Filing Statement by Green Plains Central City LLC (Incorporated by reference to Exhibit 10.7 to the Company’s Current Report on Form 8-K dated June 12, 2014) |
||||
|
10.25(h) |
Deed of Trust, Assignment of Leases and Rents, Security Agreement and Fixture Filing Statement by Green Plains Ord LLC (Incorporated by reference to Exhibit 10.8 to the Company’s Current Report on Form 8-K dated June 12, 2014) |
||||
|
10.25(i) |
Mortgage, Assignment of Leases and Rents, Security Agreement and Fixture Filing Statement by Green Plains Bluffton LLC (Incorporated by reference to Exhibit 10.9 to the Company’s Current Report on Form 8-K dated June 12, 2014) |
||||
|
10.25(j) |
Mortgage, Assignment of Leases and Rents, Security Agreement and Fixture Filing Statement by Green Plains Otter Tail LLC (Incorporated by reference to Exhibit 10.10 to the Company’s Current Report on Form 8-K dated June 12, 2014) |
||||
|
10.25(k) |
Mortgage, Assignment of Leases and Rents, Security Agreement and Fixture Filing Statement by Green Plains Shenandoah LLC (Incorporated by reference to Exhibit 10.11 to the Company’s Current Report on Form 8-K dated June 12, 2014) |
||||
|
10.26(a) |
Credit Agreement dated December 3, 2014 among Green Plains Cattle Company, LLC, Bank of the West and ING Capital LLC, as Joint Administrative Agents, and the lenders party to the Credit Agreement (Incorporated by reference to Exhibit 10.1 to the Company’s Current Report on Form 8-K dated December 5, 2014) |
||||
67
|
10.26(b) |
Security and Pledge Agreement dated December 3, 2014 among Green Plains Cattle Company, LLC, and Bank of the West and ING Capital LLC in their capacity as Joint Administrative Agents (Incorporated by reference to Exhibit 10.2 to the Company’s Current Report on Form 8-K dated December 5, 2014) |
||||
|
21.1 |
Schedule of Subsidiaries |
||||
|
23.1 |
Consent of KPMG LLP |
||||
|
31.1 |
Certification of Chief Executive Officer pursuant to Rule 13a-14(a) and Section 302 of the Sarbanes-Oxley Act of 2002 |
||||
|
31.2 |
Certification of Chief Financial Officer pursuant to Rule 13a-14(a) and Section 302 of the Sarbanes-Oxley Act of 2002 |
||||
|
32.1 |
Certification of Chief Executive Officer pursuant to 18 U.S.C. Section 1350, as adopted pursuant to Section 906 of the Sarbanes-Oxley Act of 2002 |
||||
|
32.2 |
Certification of Chief Financial Officer pursuant to 18 U.S.C. Section 1350, as adopted pursuant to Section 906 of the Sarbanes-Oxley Act of 2002 |
||||
|
101 |
The following information from Green Plains Inc.’s Annual Report on Form 10-K for the annual period ended December 31, 2014, formatted in Extensible Business Reporting Language (XBRL): (i) the Consolidated Balance Sheets, (ii) the Consolidated Statements of Operations, (iii) the Consolidated Statements of Comprehensive Income (iv) the Consolidated Statements of Stockholders’ Equity (v) the Consolidated Statements of Cash Flows and (vi) the Notes to Consolidated Financial Statements and Financial Statement Schedule. _______________________________________________________ |
||||
|
* Represents management compensatory contracts |
|||||
68
Pursuant to the requirements of Section 13 or 15(d) of the Securities Exchange Act of 1934, the registrant has duly caused this report to be signed on its behalf by the undersigned, thereunto duly authorized.
GREEN PLAINS INC.
(Registrant)
Date: February 10, 2015
By: /s/ Todd A. Becker
Todd A. Becker
President and Chief Executive Officer
(Principal Executive Officer)
Pursuant to the requirements of the Securities Exchange Act of 1934, this report has been signed below by the following persons on behalf of the registrant and in the capacities and on the dates indicated.
|
Signature |
Title |
Date |
|
/s/ Todd A. Becker |
President and Chief Executive Officer |
February 10, 2015 |
|
Todd A. Becker |
(Principal Executive Officer) and Director |
|
|
/s/ Jerry L. Peters |
Chief Financial Officer (Principal Financial |
February 10, 2015 |
|
Jerry L. Peters |
Officer and Principal Accounting Officer) |
|
|
/s/ Wayne B. Hoovestol |
Chairman of the Board |
February 10, 2015 |
|
Wayne B. Hoovestol |
||
|
/s/ Jim Anderson |
Director |
February 10, 2015 |
|
Jim Anderson |
||
|
/s/ Jim Barry |
Director |
February 10, 2015 |
|
Jim Barry |
||
|
/s/ James F. Crowley |
Director |
February 10, 2015 |
|
James F. Crowley |
||
|
/s/ S. Eugene Edwards |
Director |
February 10, 2015 |
|
S. Eugene Edwards |
||
|
/s/ Gordon F. Glade |
Director |
February 10, 2015 |
|
Gordon F. Glade |
||
|
/s/ Brian D. Peterson |
Director |
February 10, 2015 |
|
Brian D. Peterson |
||
|
/s/ Alain Treuer |
Director |
February 10, 2015 |
|
Alain Treuer |
||
69
Report of Independent Registered Public Accounting Firm
The Board of Directors and Stockholders
Green Plains Inc.:
We have audited the accompanying consolidated balance sheets of Green Plains Inc. and subsidiaries (the Company) as of December 31, 2014 and 2013, and the related consolidated statements of operations, comprehensive income, stockholders’ equity, and cash flows for each of the years in the three‑year period ended December 31, 2014. In connection with our audits of the consolidated financial statements, we also have audited the financial statement schedule listed in the Index in Item 15. These consolidated financial statements and financial statement schedule are the responsibility of the Company’s management. Our responsibility is to express an opinion on these consolidated financial statements and related financial statement schedule based on our audits.
We conducted our audits in accordance with the standards of the Public Company Accounting Oversight Board (United States). Those standards require that we plan and perform the audit to obtain reasonable assurance about whether the financial statements are free of material misstatement. An audit includes examining, on a test basis, evidence supporting the amounts and disclosures in the financial statements. An audit also includes assessing the accounting principles used and significant estimates made by management, as well as evaluating the overall financial statement presentation. We believe that our audits provide a reasonable basis for our opinion.
In our opinion, the consolidated financial statements referred to above present fairly, in all material respects, the financial position of the Company as of December 31, 2014 and 2013, and the results of its operations and its cash flows for each of the years in the three‑year period ended December 31, 2014, in conformity with U.S. generally accepted accounting principles. Also, in our opinion, the related financial statement schedule, when considered in relation to the basic consolidated financial statements taken as a whole, presents fairly, in all material respects, the information set forth therein.
We also have audited, in accordance with the standards of the Public Company Accounting Oversight Board (United States), the Company’s internal control over financial reporting as of December 31, 2014, based on criteria established in Internal Control – Integrated Framework (1992) issued by the Committee of Sponsoring Organizations of the Treadway Commission (COSO), and our report dated February 10, 2015 expressed an unqualified opinion on the effectiveness of the Company’s internal control over financial reporting.
/s/ KPMG LLP
Omaha, Nebraska
February 10, 2015
F-1
GREEN PLAINS INC. AND SUBSIDIARIES
CONSOLIDATED BALANCE SHEETS
(in thousands, except share amounts)
|
December 31, |
|||||
|
2014 |
2013 |
||||
|
ASSETS |
|||||
|
Current assets |
|||||
|
Cash and cash equivalents |
$ |
425,510 |
$ |
272,027 | |
|
Restricted cash |
29,742 | 26,994 | |||
|
Accounts receivable, net of allowances of $1,231 and $308, respectively |
138,073 | 106,808 | |||
|
Inventories |
254,967 | 158,328 | |||
|
Prepaid expenses and other |
18,776 | 12,893 | |||
|
Deferred income taxes |
7,495 | 7,619 | |||
|
Derivative financial instruments |
36,347 | 48,636 | |||
|
Total current assets |
910,910 | 633,305 | |||
|
Property and equipment, net |
825,210 | 806,046 | |||
|
Goodwill |
40,877 | 40,877 | |||
|
Other assets |
51,560 | 51,817 | |||
|
Total assets |
$ |
1,828,557 |
$ |
1,532,045 | |
|
LIABILITIES AND STOCKHOLDERS' EQUITY |
|||||
|
Current liabilities |
|||||
|
Accounts payable |
$ |
170,199 |
$ |
112,001 | |
|
Accrued and other liabilities |
61,118 | 37,949 | |||
|
Income taxes payable |
2,907 | 696 | |||
|
Unearned revenue |
3,965 | 4,118 | |||
|
Short-term notes payable and other borrowings |
209,886 | 171,500 | |||
|
Current maturities of long-term debt |
63,465 | 82,933 | |||
|
Total current liabilities |
511,540 | 409,197 | |||
|
Long-term debt |
399,440 | 480,746 | |||
|
Deferred income taxes |
115,235 | 91,294 | |||
|
Other liabilities |
4,893 | 5,450 | |||
|
Total liabilities |
1,031,108 | 986,687 | |||
|
Stockholders' equity |
|||||
|
Common stock, $0.001 par value; 75,000,000 shares authorized; |
|||||
|
44,808,982 and 37,703,946 shares issued, and 37,608,982 |
|||||
|
and 30,503,946 shares outstanding, respectively |
45 | 38 | |||
|
Additional paid-in capital |
569,431 | 468,962 | |||
|
Retained earnings |
299,101 | 148,505 | |||
|
Accumulated other comprehensive loss |
(5,320) | (6,339) | |||
|
Treasury stock, 7,200,000 shares |
(65,808) | (65,808) | |||
|
Total stockholders' equity |
797,449 | 545,358 | |||
|
Total liabilities and stockholders' equity |
$ |
1,828,557 |
$ |
1,532,045 | |
See accompanying notes to the consolidated financial statements.
F-2
GREEN PLAINS INC. AND SUBSIDIARIES
CONSOLIDATED STATEMENTS OF OPERATIONS
(in thousands, except per share amounts)
|
Year Ended December 31, |
||||||||||||
|
2014 |
2013 |
2012 |
||||||||||
|
Revenues |
$ |
3,235,611 |
$ |
3,041,011 |
$ |
3,476,870 | ||||||
|
Cost of goods sold |
2,860,813 | 2,867,991 | 3,380,099 | |||||||||
|
Gross profit |
374,798 | 173,020 | 96,771 | |||||||||
|
Selling, general and administrative expenses |
(88,524) | (65,169) | (79,019) | |||||||||
|
Gain on disposal of assets |
- |
- |
47,133 | |||||||||
|
Operating income |
286,274 | 107,851 | 64,885 | |||||||||
|
Other income (expense) |
||||||||||||
|
Interest income |
635 | 294 | 191 | |||||||||
|
Interest expense |
(39,908) | (33,357) | (37,521) | |||||||||
|
Other, net |
3,429 | (2,507) | (2,399) | |||||||||
|
Total other income (expense) |
(35,844) | (35,570) | (39,729) | |||||||||
|
Income before income taxes |
250,430 | 72,281 | 25,156 | |||||||||
|
Income tax expense |
90,926 | 28,890 | 13,393 | |||||||||
|
Net income |
159,504 | 43,391 | 11,763 | |||||||||
|
Net loss attributable to noncontrolling interests |
- |
- |
16 | |||||||||
|
Net income attributable to Green Plains |
$ |
159,504 |
$ |
43,391 |
$ |
11,779 | ||||||
|
Earnings per share: |
||||||||||||
|
Income attributable to Green Plains stockholders - basic |
$ |
4.37 |
$ |
1.44 |
$ |
0.39 | ||||||
|
Income attributable to Green Plains stockholders - diluted |
$ |
3.96 |
$ |
1.26 |
$ |
0.39 | ||||||
|
Weighted average shares outstanding: |
||||||||||||
|
Basic |
36,467 | 30,183 | 30,296 | |||||||||
|
Diluted |
40,730 | 38,304 | 30,463 | |||||||||
See accompanying notes to the consolidated financial statements.
F-3
GREEN PLAINS INC. AND SUBSIDIARIES
CONSOLIDATED STATEMENTS OF COMPREHENSIVE INCOME
(in thousands)
|
Year Ended December 31, |
||||||||
|
2014 |
2013 |
2012 |
||||||
|
Net income |
$ |
159,504 |
$ |
43,391 |
$ |
11,763 | ||
|
Other comprehensive income (loss), net of tax: |
||||||||
|
Unrealized gains (losses) on derivatives arising during period, |
||||||||
|
net of tax (expense) benefit of $138,874, $53,068 and $(19,013), respectively |
(160,810) | (85,521) | 30,986 | |||||
|
Reclassification of realized (gains) losses on derivatives, net |
||||||||
|
of tax expense (benefit) of $(139,754), $(46,941) and $15,032, respectively |
161,829 | 75,647 | (24,498) | |||||
|
Other comprehensive income (loss) |
1,019 | (9,874) | 6,488 | |||||
|
Comprehensive income |
160,523 | 33,517 | 18,251 | |||||
|
Comprehensive loss attributable to noncontrolling interests |
- |
- |
16 | |||||
|
Comprehensive income attributable to Green Plains |
$ |
160,523 |
$ |
33,517 |
$ |
18,267 | ||
See accompanying notes to the consolidated financial statements.
F-4
GREEN PLAINS INC. AND SUBSIDIARIES
CONSOLIDATED STATEMENTS OF STOCKHOLDERS’ EQUITY
(in thousands)
|
Accum. |
|||||||||||||||||||||
|
Other |
Total |
||||||||||||||||||||
|
Common |
Additional |
Comp |
Green Plains |
Non- |
Total |
||||||||||||||||
|
Stock |
Paid-in |
Retained |
Income |
Treasury Stock |
Stockholders' |
Control. |
Stockholders' |
||||||||||||||
|
Shares |
Amount |
Capital |
Earnings |
(Loss) |
Shares |
Amount |
Equity |
Interests |
Equity |
||||||||||||
|
Balance, December 31, 2011 |
36,414 |
$ |
36 |
$ |
440,469 |
$ |
95,761 |
$ |
(2,953) | 3,500 |
$ |
(28,201) |
$ |
505,112 |
$ |
245 |
$ |
505,357 | |||
|
Net income |
- |
- |
- |
11,779 |
- |
- |
- |
11,779 | (16) | 11,763 | |||||||||||
|
Other comprehensive |
|||||||||||||||||||||
|
income, net of tax |
- |
- |
- |
- |
6,488 |
- |
- |
6,488 |
- |
6,488 | |||||||||||
|
Repurchase of common |
|||||||||||||||||||||
|
stock |
- |
- |
- |
- |
- |
3,700 | (37,607) | (37,607) |
- |
(37,607) | |||||||||||
|
Stock-based compensation |
421 | 1 | 4,290 |
- |
- |
- |
- |
4,291 |
- |
4,291 | |||||||||||
|
Stock options exercised |
69 |
- |
452 |
- |
- |
- |
- |
452 |
- |
452 | |||||||||||
|
Other |
- |
- |
(13) |
- |
- |
- |
- |
(13) | (229) | (242) | |||||||||||
|
Balance, December 31, 2012 |
36,904 | 37 | 445,198 | 107,540 | 3,535 | 7,200 | (65,808) | 490,502 |
- |
490,502 | |||||||||||
|
Net income |
- |
- |
- |
43,391 |
- |
- |
- |
43,391 |
- |
43,391 | |||||||||||
|
Cash dividends declared |
- |
- |
- |
(2,426) |
- |
- |
- |
(2,426) |
- |
(2,426) | |||||||||||
|
Other comprehensive loss |
|||||||||||||||||||||
|
before reclassification |
- |
- |
- |
- |
(85,521) |
- |
- |
- |
- |
- |
|||||||||||
|
Amounts reclassified from |
|||||||||||||||||||||
|
accumulated other |
|||||||||||||||||||||
|
comprehensive loss |
- |
- |
- |
- |
75,647 |
- |
- |
- |
- |
- |
|||||||||||
|
Other comprehensive loss, |
|||||||||||||||||||||
|
net of tax |
- |
- |
- |
- |
(9,874) |
- |
- |
(9,874) |
- |
(9,874) | |||||||||||
|
Stock-based compensation |
419 | 1 | 4,703 |
- |
- |
- |
- |
4,704 |
- |
4,704 | |||||||||||
|
Stock options and warrants |
|||||||||||||||||||||
|
exercised |
381 |
- |
4,498 |
- |
- |
- |
- |
4,498 |
- |
4,498 | |||||||||||
|
Issuance of 3.25% notes |
|||||||||||||||||||||
|
due 2018, net of tax |
- |
- |
14,563 |
- |
- |
- |
- |
14,563 |
- |
14,563 | |||||||||||
|
Balance, December 31, 2013 |
37,704 | 38 | 468,962 | 148,505 | (6,339) | 7,200 | (65,808) | 545,358 |
- |
545,358 | |||||||||||
|
Net income |
- |
- |
- |
159,504 |
- |
- |
- |
159,504 |
- |
159,504 | |||||||||||
|
Cash dividends declared |
- |
- |
- |
(8,908) |
- |
- |
- |
(8,908) |
- |
(8,908) | |||||||||||
|
Other comprehensive loss |
|||||||||||||||||||||
|
before reclassification |
- |
- |
- |
- |
(160,810) |
- |
- |
- |
- |
- |
|||||||||||
|
Amounts reclassified from |
|||||||||||||||||||||
|
accumulated other |
|||||||||||||||||||||
|
comprehensive loss |
- |
- |
- |
- |
161,829 |
- |
- |
- |
- |
- |
|||||||||||
|
Other comprehensive |
|||||||||||||||||||||
|
income, net of tax |
- |
- |
- |
- |
1,019 |
- |
- |
1,019 |
- |
1,019 | |||||||||||
|
Stock-based compensation |
302 |
- |
5,729 |
- |
- |
- |
- |
5,729 |
- |
5,729 | |||||||||||
|
Stock options exercised |
270 |
- |
4,404 |
- |
- |
- |
- |
4,404 |
- |
4,404 | |||||||||||
|
Conversion of 5.75% Notes |
6,533 | 7 | 90,336 |
- |
- |
- |
- |
90,343 |
- |
90,343 | |||||||||||
|
Balance, December 31, 2014 |
44,809 |
$ |
45 |
$ |
569,431 |
$ |
299,101 |
$ |
(5,320) | 7,200 |
$ |
(65,808) |
$ |
797,449 |
$ |
- |
$ |
797,449 | |||
See accompanying notes to the consolidated financial statements.
F-5
GREEN PLAINS INC. AND SUBSIDIARIES
CONSOLIDATED STATEMENTS OF CASH FLOWS
(in thousands)
|
Year Ended December 31, |
||||||||
|
2014 |
2013 |
2012 |
||||||
|
Cash flows from operating activities: |
||||||||
|
Net income |
$ |
159,504 |
$ |
43,391 |
$ |
11,763 | ||
|
Adjustments to reconcile net income to net cash |
||||||||
|
provided (used) by operating activities: |
||||||||
|
Depreciation and amortization |
60,362 | 51,002 | 52,828 | |||||
|
Amortization of debt issuance costs and debt discount |
8,766 | 4,827 | 3,199 | |||||
|
Gain on disposal of assets |
(4,658) |
- |
(47,133) | |||||
|
Deferred income taxes |
23,537 | 27,493 | 10,704 | |||||
|
Stock-based compensation |
3,440 | 3,928 | 4,291 | |||||
|
Undistributed equity in loss of affiliates |
4,129 | 2,507 | 2,398 | |||||
|
Other |
923 | 89 | (894) | |||||
|
Changes in operating assets and liabilities before |
||||||||
|
effects of business combinations and dispositions: |
||||||||
|
Accounts receivable |
(28,145) | (25,448) | 7,538 | |||||
|
Inventories |
(90,910) | 22,759 | (63,739) | |||||
|
Derivative financial instruments |
14,184 | (44,746) | 2,594 | |||||
|
Prepaid expenses and other assets |
(5,391) | (445) | (671) | |||||
|
Accounts payable and accrued liabilities |
73,023 | 22,061 | 13,074 | |||||
|
Income taxes payable |
4,417 | (1,497) | 1,971 | |||||
|
Unearned revenues |
(417) | 182 | (10,295) | |||||
|
Other |
(1,214) | 1,233 | (1,352) | |||||
|
Net cash provided (used) by operating activities |
221,550 | 107,336 | (13,724) | |||||
|
Cash flows from investing activities: |
||||||||
|
Purchases of property and equipment |
(59,547) | (19,764) | (26,776) | |||||
|
Acquisition of businesses, net of cash acquired |
(23,900) | (123,301) | (1,490) | |||||
|
Proceeds on disposal of assets, net |
9,258 | 245 | 117,711 | |||||
|
Investments in unconsolidated subsidiaries |
(4,406) | (4,764) | (7,998) | |||||
|
Net cash provided (used) by investing activities |
(78,595) | (147,584) | 81,447 | |||||
|
Cash flows from financing activities: |
||||||||
|
Proceeds from the issuance of long-term debt |
542,692 | 343,799 | 73,100 | |||||
|
Payments of principal on long-term debt |
(557,850) | (303,495) | (120,153) | |||||
|
Proceeds from short-term borrowings |
3,708,896 | 3,348,510 | 3,324,523 | |||||
|
Payments on short-term borrowings |
(3,670,529) | (3,321,556) | (3,249,371) | |||||
|
Payments for repurchase of common stock |
- |
- |
(10,445) | |||||
|
Change in restricted cash |
(547) | (1,298) | (6,196) | |||||
|
Payments of cash dividends |
(8,908) | (2,426) |
- |
|||||
|
Payments of loan fees |
(7,630) | (10,046) | (332) | |||||
|
Proceeds from exercises of stock options and warrants |
4,404 | 4,498 | 452 | |||||
|
Net cash provided by financing activities |
10,528 | 57,986 | 11,578 | |||||
|
Net change in cash and cash equivalents |
153,483 | 17,738 | 79,301 | |||||
|
Cash and cash equivalents, beginning of period |
272,027 | 254,289 | 174,988 | |||||
|
Cash and cash equivalents, end of period |
$ |
425,510 |
$ |
272,027 |
$ |
254,289 | ||
|
Continued on the following page |
||||||||
F-6
GREEN PLAINS INC. AND SUBSIDIARIES
CONSOLIDATED STATEMENTS OF CASH FLOWS
(in thousands)
|
Continued from the previous page |
||||||||
|
Year Ended December 31, |
||||||||
|
2014 |
2013 |
2012 |
||||||
|
Supplemental disclosures of cash flow: |
||||||||
|
Cash paid for income taxes |
$ |
61,817 |
$ |
2,667 |
$ |
737 | ||
|
Cash paid for interest |
$ |
38,244 |
$ |
30,633 |
$ |
33,276 | ||
|
Assets acquired in acquisitions and mergers |
$ |
25,611 |
$ |
136,934 |
$ |
1,590 | ||
|
Less: liabilities assumed |
(1,711) | (13,633) | (100) | |||||
|
Net assets acquired |
$ |
23,900 |
$ |
123,301 |
$ |
1,490 | ||
|
Assets disposed of in sale |
$ |
- |
$ |
- |
$ |
191,167 | ||
|
Less: liabilities disposed |
- |
- |
(120,589) | |||||
|
Net assets disposed |
$ |
- |
$ |
- |
$ |
70,578 | ||
|
Common stock issued for conversion of 5.75% Notes |
$ |
89,950 |
$ |
- |
$ |
- |
||
|
Short-term note payable issued to repurchase common stock |
$ |
- |
$ |
- |
$ |
27,162 | ||
See accompanying notes to the consolidated financial statements.
F-7
GREEN PLAINS INC. AND SUBSIDIARIES
NOTES TO CONSOLIDATED FINANCIAL STATEMENTS
1. BASIS OF PRESENTATION and DESCRIPTION OF BUSINESS
References to the Company
References to “Green Plains” or the “Company” in the consolidated financial statements and in these notes to the consolidated financial statements refer to Green Plains Inc., an Iowa corporation, and its subsidiaries.
Consolidated Financial Statements
The consolidated financial statements include the accounts of the Company and its controlled subsidiaries. All significant intercompany balances and transactions have been eliminated on a consolidated basis for reporting purposes. Unconsolidated entities are included in the financial statements on an equity basis.
Use of Estimates in the Preparation of Consolidated Financial Statements
The preparation of consolidated financial statements in conformity with U.S. generally accepted accounting principles, or GAAP, requires management to make certain estimates and assumptions that affect the reported amounts of assets and liabilities and disclosure of contingent assets and liabilities at the date of the consolidated financial statements and the reported amounts of revenues and expenses during the reporting period. The Company bases its estimates on historical experience and other assumptions that it believes are proper and reasonable under the circumstances. The Company regularly evaluates the appropriateness of estimates and assumptions used in the preparation of its consolidated financial statements. Actual results could differ from those estimates. Key accounting policies, including but not limited to those relating to revenue recognition, depreciation of property and equipment, impairment of long-lived assets and goodwill, derivative financial instruments, and accounting for income taxes, are impacted significantly by judgments, assumptions and estimates used in the preparation of the consolidated financial statements.
Description of Business
The Company operates its business within four segments: (1) production of ethanol and distillers grains, collectively referred to as ethanol production, (2) corn oil production, (3) grain handling and storage and cattle feedlot operations, collectively referred to as agribusiness, and (4) marketing, merchant trading and logistics services for Company-produced and third-party ethanol, distillers grains, corn oil and other commodities, and the operation of fuel terminals, collectively referred to as marketing and distribution. The Company also is a partner in a joint venture to commercialize advanced technologies for the growing and harvesting of algal biomass.
Ethanol Production Segment
Green Plains is North America’s fourth largest ethanol producer. The Company operates twelve ethanol plants, which have the capacity to produce approximately one billion gallons of ethanol per year through separate wholly-owned operating subsidiaries. The Company’s ethanol plants also produce co-products such as wet, modified wet or dried distillers grains, as well as corn oil which is reported in a separate segment. The Company’s plants use a dry mill process to produce ethanol and co-products. At capacity, the Company’s plants consume approximately 360 million bushels of corn and produce approximately 2.9 million tons of distillers grains annually.
Corn Oil Production Segment
The Company produces corn oil at its ethanol plants within the corn oil production segment, which have the capacity to produce approximately 250 million pounds annually. The corn oil systems are designed to extract non-edible corn oil from the whole stillage immediately prior to production of distillers grains.
Agribusiness Segment
The Company owns and operates grain handling and storage assets through its agribusiness segment, which has grain storage capacity of approximately 42.2 million bushels, with 29.4 million bushels of storage capacity at the Company’s ethanol plants, 9.0 million bushels of total storage capacity at its four separate grain elevators and 3.8 million bushels of
F-8
storage capacity at its cattle-feeding operation. The Company owns a feedlot with the capacity to support 70,000 head of cattle. The Company’s agribusiness operations provide synergies with the ethanol production segment as it supplies a portion of the feedstock and utilizes a portion of the distillers grains output of the Company’s ethanol plants.
Marketing and Distribution Segment
The Company has an in-house marketing business that is responsible for the sale, marketing and distribution of all ethanol, distillers grains and corn oil produced at its ethanol plants as well as logistical services for ethanol and other commodities for a third-party producer. The Company also purchases and sells ethanol, distillers grains, corn oil, grain, natural gas and other commodities and participates in other merchant trading activities in various markets. The Company operates fuel terminals at eight locations in seven south central U.S. states with approximately 822 million gallons per year, or mmgy, of total throughput capacity.
2. SUMMARY OF SIGNIFICANT accounting POLICIES
Cash and Cash Equivalents and Restricted Cash
The Company considers short-term highly liquid investments with original maturities of three months or less to be cash equivalents. Cash and cash equivalents include bank deposits. The Company also has restricted cash which is comprised of cash restricted as to use for payment towards a revolving credit agreement.
Revenue Recognition
The Company recognizes revenue when all of the following criteria are satisfied: persuasive evidence of an arrangement exists; risk of loss and title transfer to the customer; the price is fixed and determinable; and collectability is reasonably assured.
For sales of ethanol, distillers grains and other commodities by the Company’s marketing business, revenue is recognized when title to the product and risk of loss transfer to an external customer. Revenues related to marketing operations for third parties are recorded on a gross basis as the Company takes title to the product and assumes risk of loss. Unearned revenue is reflected on the consolidated balance sheets for goods in transit for which the Company has received payment and title has not been transferred to the customer. Revenues from the Company’s fuel terminal operations, which include ethanol transload services, are recognized when these services are completed.
The Company routinely enters into fixed-price, physical-delivery ethanol sales agreements. In certain instances, the Company intends to settle the transaction by open market purchases of ethanol rather than by delivery from its own production. These transactions are reported net as a component of revenues. Revenues also include realized gains and losses on related derivative financial instruments, ineffectiveness on cash flow hedges, and reclassifications of realized gains and losses on effective cash flow hedges from accumulated other comprehensive income (loss).
Sales of agricultural commodities, including cattle, are recognized when title to the product and risk of loss transfer to the customer, which is dependent on the agreed upon sales terms with the customer. These sales terms provide for passage of title either at the time shipment is made or at the time the commodity has been delivered to its destination and final weights, grades and settlement prices have been agreed upon with the customer. Revenues related to grain merchandising are presented gross in the statements of operations with amounts billed for shipping and handling included in revenues and also as a component of cost of goods sold. Revenues from grain storage are recognized as services are rendered.
Cost of Goods Sold
Cost of goods sold includes costs for direct labor, materials and certain plant overhead costs. Direct labor includes all compensation and related benefits of non-management personnel involved in the operation of the Company’s ethanol plants. Grain purchasing and receiving costs, other than labor costs for grain buyers and scale operators, are also included in cost of goods sold. Direct materials consist of the costs of corn feedstock, denaturant, and process chemicals. Corn feedstock costs include unrealized gains and losses on related derivative financial instruments not designated as cash flow hedges, inbound freight charges, inspection costs and transfer costs. Corn feedstock costs also include realized gains and losses on related derivative financial instruments, ineffectiveness on cash flow hedges, and reclassifications of realized gains and losses on effective cash flow hedges from accumulated other comprehensive income (loss). Plant overhead costs primarily consist of plant utilities, plant depreciation and outbound freight charges. Shipping costs incurred directly by the Company, including railcar lease costs, are also reflected in cost of goods sold.
F-9
The Company uses exchange-traded futures and options contracts to minimize the effects of changes in the prices of agricultural commodities on its agribusiness segment’s grain and cattle inventories and forward purchase and sales contracts. Exchange-traded futures and options contracts are valued at quoted market prices. These contracts are predominantly settled in cash. The Company is exposed to loss in the event of non-performance by the counter-party to forward purchase and forward sale contracts. Grain inventories held for sale, forward purchase contracts and forward sale contracts in the agribusiness segment are valued at market prices, where available, or other market quotes adjusted for differences, primarily transportation, between the exchange-traded market and the local markets on which the terms of the contracts are based. Changes in the fair value of grain inventories held for sale, forward purchase and sale contracts, and exchange-traded futures and options contracts in the agribusiness segment, are recognized in earnings as a component of cost of goods sold.
Derivative Financial Instruments
To minimize the risk and the effects of the volatility of commodity price changes primarily related to corn, ethanol, cattle and natural gas, the Company uses various derivative financial instruments, including exchange-traded futures, and exchange-traded and over-the-counter options contracts. The Company monitors and manages this exposure as part of its overall risk management policy. As such, the Company seeks to reduce the potentially adverse effects that the volatility of these markets may have on its operating results. The Company may take hedging positions in these commodities as one way to mitigate risk. While the Company attempts to link its hedging activities to purchase and sales activities, there are situations in which these hedging activities can themselves result in losses.
By using derivatives to hedge exposures to changes in commodity prices, the Company has exposures on these derivatives to credit and market risk. The Company is exposed to credit risk that the counterparty might fail to fulfill its performance obligations under the terms of the derivative contract. The Company minimizes its credit risk by entering into transactions with high quality counterparties, limiting the amount of financial exposure it has with each counterparty and monitoring the financial condition of its counterparties. Market risk is the risk that the value of the financial instrument might be adversely affected by a change in commodity prices or interest rates. The Company manages market risk by incorporating monitoring parameters within its risk management strategy that limit the types of derivative instruments and derivative strategies the Company uses, and the degree of market risk that may be undertaken by the use of derivative instruments.
The Company evaluates its contracts that involve physical delivery to determine whether they may qualify for the normal purchase or normal sale exemption and are expected to be used or sold over a reasonable period in the normal course of business. Any contracts that do not meet the normal purchase or sale criteria are recorded at fair value with the change in fair value recorded in operating income unless the contracts qualify for, and the Company elects, hedge accounting treatment.
Certain qualifying derivatives related to ethanol production and agribusiness segments are designated as cash flow hedges. Prior to entering into cash flow hedges, the Company evaluates the derivative instrument to ascertain its effectiveness. For cash flow hedges, any ineffectiveness is recognized in current period results, while other unrealized gains and losses are reflected in accumulated other comprehensive income until gains and losses from the underlying hedged transaction are realized. In the event that it becomes probable that a forecasted transaction will not occur, the Company would discontinue cash flow hedge treatment, which would affect earnings. These derivative financial instruments are recognized in current assets or other current liabilities at fair value.
At times, the Company hedges its exposures to changes in the value of inventories and designates certain qualifying derivatives as fair value hedges. The carrying amount of the hedged inventory is adjusted through current period results for changes in the fair value arising from changes in underlying prices. Any ineffectiveness is recognized in current period results to the extent that the change in the fair value of the inventory is not offset by the change in the fair value of the derivative.
Concentrations of Credit Risk
In the normal course of business, the Company is exposed to credit risk resulting from the possibility that a loss may occur from the failure of another party to perform according to the terms of a contract. The Company transacts sales of ethanol and distillers grains and is marketing products for third parties, which may result in concentrations of credit risk from a variety of customers, including major integrated oil companies, large independent refiners, petroleum wholesalers, other marketers and jobbers. The Company is also exposed to credit risk resulting from sales of grain to large commercial buyers, including other ethanol plants, which it continually monitors. Although payments are typically received within fifteen days of sale for ethanol and distillers grains, the Company continually monitors this credit risk exposure. In addition, the Company
F-10
may prepay for or make deposits on undelivered inventories. Concentrations of credit risk with respect to inventory advances are primarily with a few major suppliers of petroleum products and agricultural inputs.
Inventories
Corn to be used in ethanol production, ethanol and distillers grains inventories are stated at the lower of average cost or market, except for fair value hedged inventories, which are carried at market.
Other grain inventories include readily-marketable physical quantities of grain, forward contracts to buy and sell grain, and exchange traded futures and option contracts (all stated at market value). The futures and options contracts, which are used to hedge the value of both owned grain and forward contracts, are considered derivatives. All grain inventories held for sale are marked to the market price with changes reflected in cost of goods sold. The forward contracts require performance in future periods. Contracts to purchase grain from producers generally relate to the current or future crop years for delivery periods quoted by regulated commodity exchanges. Contracts for the sale of grain to processors or other consumers generally do not extend beyond one year. The terms of contracts for the purchase and sale of grain are consistent with industry standards.
Finished goods inventory consists of denatured ethanol and its related co-products and is valued at the lower of average cost or market. In addition to ethanol and its co-products in process and not completed to finished goods, work-in-process inventory includes the cost of cattle acquired and related feed and veterinary supplies, as well as direct labor and feedlot overhead costs, and is valued at the lower of average cost or market.
Property and Equipment
Property and equipment are stated at cost less accumulated depreciation. Depreciation of these assets is generally computed using the straight-line method over the following estimated useful lives of the assets:
|
Years |
|
|
Plant, buildings and improvements |
10-40 |
|
Ethanol production equipment |
15-40 |
|
Other machinery and equipment |
5-7 |
|
Land improvements |
20 |
|
Railroad track and equipment |
20 |
|
Computer and software |
3-5 |
|
Office furniture and equipment |
5-7 |
Property and equipment is capitalized at cost. Land improvements are capitalized and depreciated. Expenditures for property betterments and renewals are capitalized. Costs of repairs and maintenance are charged to expense as incurred. The Company periodically evaluates whether events and circumstances have occurred that may warrant revision of the estimated useful life of its fixed assets.
Impairment of Long-Lived Assets
The Company reviews its long-lived assets, currently consisting of property and equipment, for impairment whenever events or changes in circumstances indicate that the carrying amount of a long-lived asset may not be recoverable. Recoverability of assets to be held and used is measured by comparison of the carrying amount of an asset to estimated undiscounted future cash flows expected to be generated by the asset. If the carrying amount of an asset exceeds its estimated future cash flows, an impairment charge is recognized in the amount by which the carrying amount of the asset exceeds the fair value of the asset. Significant management judgment is required in determining the fair value of long-lived assets to measure impairment, including projections of future discounted cash flows. No impairment charges were recorded for the periods reported.
F-11
Goodwill
Goodwill is an asset representing the future economic benefits arising from other assets acquired in a business combination that are not individually identified and separately recognized. The Company has recorded goodwill for business combinations to the extent the purchase price exceeded the fair value of the net identifiable tangible and intangible assets of each acquired company. The Company’s goodwill currently is comprised of amounts relating to its acquisitions of five ethanol plants and its fuel terminal and distribution business.
Goodwill is reviewed for impairment at least annually. The qualitative factors of goodwill are assessed to determine whether it is more likely than not that the fair value of a reporting unit is less than its carrying amount as a basis for determining whether it is necessary to perform the two-step goodwill impairment test. Under the first step, the fair value of the reporting unit is compared with its carrying value (including goodwill). If the fair value of the reporting unit is less than its carrying value, an indication of goodwill impairment exists for the reporting unit and the entity must perform step two of the impairment test. Under the second step, an impairment loss is recognized for any excess of the carrying amount of the reporting unit’s goodwill over the implied fair value of that goodwill. The implied fair value of goodwill is determined by allocating the fair value of the reporting unit in a manner similar to a purchase price allocation and the residual fair value after this allocation is the implied fair value of the reporting unit goodwill. Fair value of the reporting unit is determined using a discounted cash flow analysis. If the fair value of the reporting unit exceeds its carrying value, no further analysis is necessary. The Company performs its annual impairment review of goodwill at October 1, and when a triggering event occurs between annual impairment tests. No impairment losses were recorded for the periods reported.
Financing Costs
Fees and costs related to securing debt financing are recorded as financing costs. Debt issuance costs are stated at cost and are amortized utilizing the effective interest method for term loans and on a straight-line basis for revolving credit arrangements over the life of the agreements. However, during periods of construction, amortization of such costs is capitalized in construction-in-progress.
Selling, General and Administrative Expenses
Selling, general and administrative expenses are primarily general and administrative expenses for employee salaries, incentives and benefits; office expenses; director compensation; and professional fees for accounting, legal, consulting, and investor relations activities; as well as non-plant depreciation and amortization costs.
Environmental Expenditures
Environmental expenditures that pertain to current operations and relate to future revenue are expensed or capitalized consistent with the Company’s capitalization policy. Probable liabilities incurred that are reasonably estimable are also expensed or capitalized according to this policy and if material, would be disclosed in its quarterly and annual filings. Expenditures that result from the remediation of an existing condition caused by past operations and that do not contribute to future revenue are expensed as incurred.
Stock-Based Compensation
The Company recognizes compensation cost using a fair value based method whereby compensation cost is measured at the grant date based on the value of the award and is recognized over the service period, which is usually the vesting period. The Company uses the Black-Scholes pricing model to calculate the fair value of options and warrants issued to both employees and non-employees. Stock issued for compensation is valued using the market price of the stock on the date of the related agreement.
Income Taxes
The provision for income taxes is computed using the asset and liability method, under which deferred tax assets and liabilities are recognized for the expected future tax consequences attributable to temporary differences between the financial reporting carrying amount of existing assets and liabilities and their respective tax bases. Deferred tax assets and liabilities are measured using enacted tax rates expected to apply to taxable income in years in which those temporary differences are expected to be recovered or settled. The effect on deferred tax assets and liabilities of a change in tax rates is recognized in operating results in the period of enactment. Deferred tax assets are reduced by a valuation allowance when it is more likely than not that some portion or all of the deferred tax assets will not be realized.
F-12
The Company recognizes uncertainties in income taxes within the financial statements under a process by which the likelihood of a tax position is gauged based upon the technical merits of the position, and then a subsequent measurement relates the maximum benefit and the degree of likelihood to determine the amount of benefit recognized in the financial statements.
Recent Accounting Pronouncements
Effective January 1, 2017, the Company will adopt the amended guidance in ASC Topic 606, Revenue from Contracts with Customers. The amended guidance requires revenue recognition to reflect the transfer of promised goods or services to customers and replaces existing revenue recognition guidance. The updated standard permits the use of either the retrospective or cumulative effect transition method. The Company has not yet selected a transition method nor has it determined the effect of the updated standard on its consolidated financial statements and related disclosures.
3. ACQUISITIONS AND DISPOSITIONS
Acquisition of Fairmont and Wood River Ethanol Plants
In November 2013, the Company acquired ethanol plants located in Fairmont, Minnesota and Wood River, Nebraska, with a combined annual production capacity of 230 million gallons. Total consideration was $114.3 million and acquisition-related costs of $0.8 million were recorded in selling, general and administrative expenses. The Company issued approximately $77.0 million of short-term notes payable and term debt shortly after the acquisition, with the acquired assets serving as collateral for these loans, and entered into capital leases totaling $10.0 million for grain facilities that were previously leased by the predecessor owner of the acquired assets. The following is a summary of assets acquired and liabilities assumed (in thousands):
|
Amounts of Identifiable Assets Acquired |
||||
|
Accounts receivable |
$ |
119 | ||
|
Inventory |
8,680 | |||
|
Prepaid expenses and other |
2,696 | |||
|
Property and equipment, net |
112,274 | |||
|
Other assets |
4,193 | |||
|
Current liabilities |
(4,260) | |||
|
Long-term portion of capital leases and |
||||
|
tax increment financing bond |
(7,895) | |||
|
Other liabilities |
(1,489) | |||
|
Total identifiable net assets |
$ |
114,318 | ||
The operating results of the Wood River ethanol plant have been included in the Company’s consolidated financial statements since November 22, 2013. At the time of acquisition, the Fairmont ethanol plant was not operational; however, upon completion of certain maintenance and enhancement projects, operations began at the plant in early January 2014. Pro forma revenue and net income, had the acquisition of these two plants occurred on January 1, 2013, would have been $3.3 billion and $47.7 million, respectively, for the year ended December 31, 2013. This information is based on historical results of operations, and, in our opinion, is not necessarily indicative of the results that would have been achieved had we operated the two ethanol plants acquired since such dates.
There is ongoing litigation related to the consideration for this acquisition. To the extent that this litigation is resolved favorably for the Company, it will result in a gain in a future period with no impact in the event of a negative outcome.
Sale of Grain Assets
In December 2012, the Company sold twelve grain elevators located in northwestern Iowa and western Tennessee. The transaction involved approximately 32.6 million bushels, or 83%, of the Company’s reported agribusiness grain storage capacity and all of its agronomy and retail petroleum operations. The divested assets were reported within the Company’s agribusiness segment. The gross proceeds from the sale, including assumption of debt, current liabilities and fees, were $241.0 million. Cash proceeds from the sale totaled $117.7 million and a pre-tax gain from the sale of $47.1 million was
F-13
included in operating income in the consolidated statement of operations for the year ended December 31, 2012. The following is a summary of divested assets and liabilities (in thousands):
|
Amounts of Disposed Assets and Liabilities |
||
|
Current assets |
$ |
146,527 |
|
Property and equipment, net |
44,640 | |
|
Current liabilities |
92,386 | |
|
Long-term debt, net |
27,974 | |
4. FAIR VALUE DISCLOSURES
The following methods, assumptions and valuation techniques were used in estimating the fair value of the Company’s financial instruments:
Level 1 – unadjusted quoted prices in active markets for identical assets or liabilities that the Company has the ability to access at the measurement date. Level 1 unrealized gains and losses on commodity derivatives relate to exchange-traded open trade equity and option values in the Company’s brokerage accounts.
Level 2 – directly or indirectly observable inputs such as quoted prices for similar assets or liabilities in active markets other than quoted prices included within Level 1; quoted prices for identical or similar assets in markets that are not active; and other inputs that are observable or can be substantially corroborated by observable market data by correlation or other means. Grain inventories held for sale in the agribusiness segment are valued at nearby futures values, plus or minus nearby basis levels.
Level 3 – unobservable inputs that are supported by little or no market activity and that are a significant component of the fair value of the assets or liabilities. The Company currently does not have any recurring Level 3 financial instruments.
There have been no changes in valuation techniques and inputs used in measuring fair value. The following tables set forth the Company’s assets and liabilities by level for the dates indicated (in thousands):
|
Fair Value Measurements at December 31, 2014 |
|||||||||||
|
Quoted Prices in Active Markets for Identical Assets |
Significant Other Observable Inputs |
Reclassification for Balance Sheet |
|||||||||
|
(Level 1) |
(Level 2) |
Presentation |
Total |
||||||||
|
Assets: |
|||||||||||
|
Cash and cash equivalents |
$ |
425,510 |
$ |
- |
$ |
- |
$ |
425,510 | |||
|
Restricted cash |
29,742 |
- |
- |
29,742 | |||||||
|
Margin deposits |
24,488 |
- |
(24,488) |
- |
|||||||
|
Inventories carried at market |
- |
36,411 |
- |
36,411 | |||||||
|
Unrealized gains on derivatives |
11,877 | 18,111 | 6,359 | 36,347 | |||||||
|
Other assets |
118 | 3 |
- |
121 | |||||||
|
Total assets measured at fair value |
$ |
491,735 |
$ |
54,525 |
$ |
(18,129) |
$ |
528,131 | |||
|
Liabilities: |
|||||||||||
|
Unrealized losses on derivatives |
$ |
18,129 |
$ |
28,082 |
$ |
(18,129) |
$ |
28,082 | |||
|
Total liabilities measured at fair value |
$ |
18,129 |
$ |
28,082 |
$ |
(18,129) |
$ |
28,082 | |||
F-14
|
Fair Value Measurements at December 31, 2013 |
|||||||||||
|
Quoted Prices in Active Markets for Identical Assets |
Significant Other Observable Inputs |
Reclassification for Balance Sheet |
|||||||||
|
(Level 1) |
(Level 2) |
Presentation |
Total |
||||||||
|
Assets: |
|||||||||||
|
Cash and cash equivalents |
$ |
272,027 |
$ |
- |
$ |
- |
$ |
272,027 | |||
|
Restricted cash |
26,994 |
- |
- |
26,994 | |||||||
|
Margin deposits |
77,102 |
- |
(77,102) |
- |
|||||||
|
Inventories carried at market |
- |
23,782 |
- |
23,782 | |||||||
|
Unrealized gains on derivatives |
3,629 | 18,712 | 26,295 | 48,636 | |||||||
|
Other assets (1) |
2,200 |
- |
- |
2,200 | |||||||
|
Total assets measured at fair value |
$ |
381,952 |
$ |
42,494 |
$ |
(50,807) |
$ |
373,639 | |||
|
Liabilities: |
|||||||||||
|
Unrealized losses on derivatives |
$ |
50,807 |
$ |
4,612 |
$ |
(50,807) |
$ |
4,612 | |||
|
Other |
9 |
- |
- |
9 | |||||||
|
Total liabilities measured at fair value |
$ |
50,816 |
$ |
4,612 |
$ |
(50,807) |
$ |
4,621 | |||
|
(1) |
Represents long-term restricted cash related to the $22.0 million revenue bond of Green Plains Bluffton. |
The Company believes the fair value of its debt approximated $676.5 million compared to a book value of $672.8 million at December 31, 2014 and that the fair value of its debt approximated $775.7 million compared to a book value of $735.2 million at December 31, 2013. The Company estimates the fair value of its outstanding debt using Level 2 inputs. The Company believes the fair values of its accounts receivable and accounts payable approximate book value, which were $138.1 million and $170.2 million, respectively, at December 31, 2014 and $106.8 and $112.0 million, respectively, at December 31, 2013.
Although the Company currently does not have any recurring Level 3 financial measurements, the fair values of the tangible assets and goodwill acquired and the equity component of convertible debt represent Level 3 measurements and were derived using a combination of the income approach, the market approach and the cost approach as considered appropriate for the specific assets or liabilities being valued.
5. SEGMENT INFORMATION
Company management reviews financial and operating performance in the following four separate operating segments: (1) production of ethanol and distillers grains, collectively referred to as ethanol production, (2) corn oil production, (3) grain handling and storage and cattle feedlot operations, collectively referred to as agribusiness, and (4) marketing, merchant trading and logistics services for Company-produced and third-party ethanol, distillers grains, corn oil and other commodities, and the operation of fuel terminals, collectively referred to as marketing and distribution. Selling, general and administrative expenses, primarily consisting of compensation of corporate employees, professional fees and overhead costs not directly related to a specific operating segment, are reflected in the table below as corporate activities.
During the normal course of business, the Company enters into transactions between segments. Examples of these intersegment transactions include, but are not limited to, the ethanol production segment selling ethanol to the marketing and distribution segment and the agribusiness segment selling grain to the ethanol production segment. These intersegment activities are recorded by each segment at prices approximating market and treated as if they are third-party transactions. Consequently, these transactions impact segment performance. However, revenues and corresponding costs are eliminated in consolidation and do not impact the Company’s consolidated results.
F-15
The following tables set forth certain financial data for the Company’s operating segments (in thousands):
|
Year Ended December 31, |
|||||||||
|
2014 |
2013 |
2012 |
|||||||
|
Revenues: |
|||||||||
|
Ethanol production: |
|||||||||
|
Revenues from external customers (1) |
$ |
(51,424) |
$ |
116,272 |
$ |
200,443 | |||
|
Intersegment revenues |
2,222,446 | 1,934,770 | 1,708,800 | ||||||
|
Total segment revenues |
2,171,022 | 2,051,042 | 1,909,243 | ||||||
|
Corn oil production: |
|||||||||
|
Revenues from external customers (1) |
- |
- |
529 | ||||||
|
Intersegment revenues |
79,750 | 69,163 | 57,315 | ||||||
|
Total segment revenues |
79,750 | 69,163 | 57,844 | ||||||
|
Agribusiness: |
|||||||||
|
Revenues from external customers (1) |
100,436 | 51,883 | 408,622 | ||||||
|
Intersegment revenues |
1,208,120 | 761,835 | 176,062 | ||||||
|
Total segment revenues |
1,308,556 | 813,718 | 584,684 | ||||||
|
Marketing and distribution: |
|||||||||
|
Revenues from external customers (1) |
3,186,599 | 2,872,856 | 2,867,276 | ||||||
|
Intersegment revenues |
171,201 | 21,790 | 355 | ||||||
|
Total segment revenues |
3,357,800 | 2,894,646 | 2,867,631 | ||||||
|
Revenues including intersegment activity |
6,917,128 | 5,828,569 | 5,419,402 | ||||||
|
Intersegment eliminations |
(3,681,517) | (2,787,558) | (1,942,532) | ||||||
|
Revenues as reported |
$ |
3,235,611 |
$ |
3,041,011 |
$ |
3,476,870 | |||
|
(1) Revenues from external customers include realized gains and losses from derivative financial instruments. |
|||||||||
|
Gross profit (loss): |
|||||||||
|
Ethanol production |
$ |
236,096 |
$ |
79,109 |
$ |
(4,895) | |||
|
Corn oil production |
42,937 | 36,615 | 32,388 | ||||||
|
Agribusiness |
14,833 | 6,258 | 35,973 | ||||||
|
Marketing and distribution |
80,326 | 57,671 | 32,362 | ||||||
|
Intersegment eliminations |
606 | (6,633) | 943 | ||||||
|
$ |
374,798 |
$ |
173,020 |
$ |
96,771 | ||||
|
Operating income (loss): |
|||||||||
|
Ethanol production |
$ |
214,497 |
$ |
63,012 |
$ |
(20,393) | |||
|
Corn oil production |
42,651 | 36,569 | 32,140 | ||||||
|
Agribusiness |
8,497 | 3,324 | 60,030 | ||||||
|
Marketing and distribution |
52,669 | 40,971 | 17,290 | ||||||
|
Intersegment eliminations |
666 | (6,588) | 977 | ||||||
|
Corporate activities |
(32,706) | (29,437) | (25,159) | ||||||
|
$ |
286,274 |
$ |
107,851 |
$ |
64,885 | ||||
|
Income (loss) before income taxes: |
|||||||||
|
Ethanol production |
$ |
198,598 |
$ |
44,061 |
$ |
(42,430) | |||
|
Corn oil production |
42,655 | 36,570 | 32,142 | ||||||
|
Agribusiness |
5,996 | 793 | 54,172 | ||||||
|
Marketing and distribution |
47,921 | 37,098 | 13,768 | ||||||
|
Intersegment eliminations |
666 | (6,588) | 977 | ||||||
|
Corporate activities |
(45,406) | (39,653) | (33,473) | ||||||
|
$ |
250,430 |
$ |
72,281 |
$ |
25,156 |
F-16
|
Year Ended December 31, |
|||||||||
|
2014 |
2013 |
2012 |
|||||||
|
Depreciation and amortization: |
|||||||||
|
Ethanol production |
$ |
52,393 |
$ |
45,312 |
$ |
44,239 | |||
|
Corn oil production |
1,756 | 1,175 | 1,156 | ||||||
|
Agribusiness |
1,441 | 362 | 4,209 | ||||||
|
Marketing and distribution |
3,096 | 2,836 | 1,942 | ||||||
|
Corporate activities |
1,676 | 1,317 | 1,282 | ||||||
|
$ |
60,362 |
$ |
51,002 |
$ |
52,828 | ||||
|
Interest expense: |
|||||||||
|
Ethanol production |
$ |
22,749 |
$ |
18,988 |
$ |
22,081 | |||
|
Corn oil production |
- |
- |
- |
||||||
|
Agribusiness |
2,591 | 2,531 | 5,881 | ||||||
|
Marketing and distribution |
5,267 | 4,079 | 3,532 | ||||||
|
Intersegment eliminations |
(238) | (982) | (1,137) | ||||||
|
Corporate activities |
9,539 | 8,741 | 7,164 | ||||||
|
$ |
39,908 |
$ |
33,357 |
$ |
37,521 |
|
Capital expenditures: |
|||||||||
|
Ethanol production |
$ |
32,050 |
$ |
8,469 |
$ |
7,637 | |||
|
Corn oil production |
8,154 | 1,782 | 725 | ||||||
|
Agribusiness |
17,166 | 6,514 | 2,006 | ||||||
|
Marketing and distribution |
1,334 | 2,347 | 15,791 | ||||||
|
Corporate activities |
2,829 | 652 | 617 | ||||||
|
$ |
61,533 |
$ |
19,764 |
$ |
26,776 |
The following table sets forth total assets by operating segment (in thousands):
|
Year Ended December 31, |
||||||
|
2014 |
2013 |
|||||
|
Total assets: |
||||||
|
Ethanol production |
$ |
983,289 |
$ |
911,315 | ||
|
Corn oil production |
31,405 | 28,569 | ||||
|
Agribusiness |
234,626 | 165,570 | ||||
|
Marketing and distribution |
305,675 | 258,361 | ||||
|
Corporate assets |
290,123 | 175,210 | ||||
|
Intersegment eliminations |
(16,561) | (6,980) | ||||
|
$ |
1,828,557 |
$ |
1,532,045 | |||
The following table sets forth revenues by product line (in thousands):
|
Year Ended December 31, |
|||||||||
|
2014 |
2013 |
2012 |
|||||||
|
Revenues: |
|||||||||
|
Ethanol |
$ |
2,362,812 |
$ |
2,339,470 |
$ |
2,507,119 | |||
|
Distillers grains |
531,696 | 488,396 | 433,088 | ||||||
|
Corn oil |
99,167 | 74,251 | 58,640 | ||||||
|
Grain |
174,997 | 92,487 | 348,413 | ||||||
|
Other |
66,939 | 46,407 | 129,610 | ||||||
|
$ |
3,235,611 |
$ |
3,041,011 |
$ |
3,476,870 | ||||
Revenues from two customers, controlled by the same entity, of the Company’s marketing and distribution segment totaled approximately $325.0 million, or 10.0%, of the Company’s consolidated revenues.
F-17
6. INVENTORIES
Inventories are carried at the lower of cost or market, except grain held for sale and fair value hedged inventories, which are valued at market value. The components of inventories are as follows (in thousands):
|
December 31, |
|||||
|
2014 |
2013 |
||||
|
Finished goods |
$ |
34,639 |
$ |
56,664 | |
|
Grain held for sale |
23,027 | 23,782 | |||
|
Raw materials |
78,095 | 51,726 | |||
|
Work-in-process |
100,221 | 11,506 | |||
|
Supplies and parts |
18,985 | 14,650 | |||
|
$ |
254,967 |
$ |
158,328 | ||
7. PROPERTY AND EQUIPMENT
The components of property and equipment are as follows (in thousands):
|
December 31, |
|||||
|
2014 |
2013 |
||||
|
Plant equipment |
$ |
777,987 |
$ |
749,627 | |
|
Buildings and improvements |
159,178 | 147,663 | |||
|
Land and improvements |
73,819 | 59,481 | |||
|
Railroad track and equipment |
40,882 | 39,852 | |||
|
Construction-in-progress |
23,276 | 3,789 | |||
|
Computers and software |
9,305 | 7,380 | |||
|
Office furniture and equipment |
2,127 | 1,662 | |||
|
Leasehold improvements and other |
13,179 | 12,111 | |||
|
Total property and equipment |
1,099,753 | 1,021,565 | |||
|
Less: accumulated depreciation |
(274,543) | (215,519) | |||
|
Property and equipment, net |
$ |
825,210 |
$ |
806,046 | |
8. GOODWILL
The Company did not have any changes in the total carrying amount of goodwill, which was $40.9 million during the years ended December 31, 2014 and 2013. Goodwill of $30.3 million is attributable to the ethanol production segment and $10.6 million is attributable to the marketing and distribution segment.
9. DERIVATIVE FINANCIAL INSTRUMENTS
At December 31, 2014, the consolidated balance sheets reflect unrealized losses, net of tax, of $5.3 million in accumulated other comprehensive loss. The Company expects all of the unrealized losses at December 31, 2014 will be reclassified into operating income over the next 12 months as a result of hedged transactions that are forecasted to occur. The amount ultimately realized in operating income, however, will differ as commodity prices change.
F-18
Fair Values of Derivative Instruments
The following table provides information about the fair values of the Company’s derivative financial instruments and the line items on the consolidated balance sheets in which the fair values are reflected (in thousands):
|
Asset Derivatives' |
Liability Derivatives' |
||||||||||
|
Fair Value at December 31, |
Fair Value at December 31, |
||||||||||
|
2014 |
2013 |
2014 |
2013 |
||||||||
|
Derivative financial instruments (1) |
$ |
11,859 | (2) |
$ |
(28,466) | (3) |
$ |
- |
$ |
- |
|
|
Other assets |
3 |
- |
- |
- |
|||||||
|
Accrued and other liabilities |
- |
- |
28,082 | 4,612 | |||||||
|
Total |
$ |
11,862 |
$ |
(28,466) |
$ |
28,082 |
$ |
4,612 | |||
(1) Derivative financial instruments as reflected on the balance sheet include a margin deposit assets of $24.5 million and $77.1 million at December 31, 2014 and 2013, respectively.
(2) Balance at December 31, 2014, includes $0.6 million of net unrealized losses on derivative financial instruments designated as cash flow hedging instruments.
(3)Balance at December 31, 2013, includes $47.1 million of net unrealized losses on derivative financial instruments designated as cash flow hedging instruments.
Refer to Note 4 - Fair Value Disclosures, which also contains fair value information related to derivative financial instruments.
Effect of Derivative Instruments on Consolidated Statements of Operations and Consolidated Statements of Stockholders’ Equity and Comprehensive Income
The following tables provide information about gains or losses recognized in income and other comprehensive income on the Company’s derivative financial instruments and the line items in the consolidated financial statements in which such gains and losses are reflected (in thousands):
|
Gains (Losses) on Derivative Instruments Not |
Year Ended December 31, |
||||||||
|
Designated in a Hedging Relationship |
2014 |
2013 |
2012 |
||||||
|
Revenues |
$ |
13,369 |
$ |
(10,855) |
$ |
(6,206) | |||
|
Cost of goods sold |
165 | 12,701 | (12,050) | ||||||
|
Net increase (decrease) recognized in earnings before tax |
$ |
13,534 |
$ |
1,846 |
$ |
(18,256) | |||
|
Gains (Losses) Due to Ineffectiveness |
Year Ended December 31, |
||||||||
|
of Cash Flow Hedges |
2014 |
2013 |
2012 |
||||||
|
Revenues |
$ |
(326) |
$ |
(84) |
$ |
(10) | |||
|
Cost of goods sold |
481 | (490) |
- |
||||||
|
Net increase (decrease) recognized in earnings before tax |
$ |
155 |
$ |
(574) |
$ |
(10) | |||
|
Gains (Losses) Reclassified from Accumulated |
Year Ended December 31, |
||||||||
|
into Net Income |
2014 |
2013 |
2012 |
||||||
|
Revenues |
$ |
(257,730) |
$ |
(96,736) |
$ |
(17,318) | |||
|
Cost of goods sold |
(43,853) | (25,852) | 56,848 | ||||||
|
Net increase (decrease) recognized in earnings before tax |
$ |
(301,583) |
$ |
(122,588) |
$ |
39,530 | |||
|
Effective Portion of Cash Flow |
Year Ended December 31, |
||||||||
|
Other Comprehensive Income (Loss) |
2014 |
2013 |
2012 |
||||||
|
Commodity Contracts |
$ |
(299,684) |
$ |
(138,589) |
$ |
49,999 | |||
F-19
|
Gains (Losses) from Fair Value |
Year Ended December 31, |
||||||||
|
Hedges of Inventory |
2014 |
2013 |
2012 |
||||||
|
Cost of goods sold (effect of change in inventory value) |
$ |
304 |
$ |
102 |
$ |
- |
|||
|
Cost of goods sold (effect of fair value hedge) |
2,612 | 674 |
- |
||||||
|
Ineffectiveness recognized in earnings before tax |
$ |
2,916 |
$ |
776 |
$ |
- |
|||
There were no gains or losses due to the discontinuance of cash flow hedge or fair value hedge treatment during the years ended December 31, 2014, 2013 and 2012.
The following table summarizes volumes of open commodity derivative positions as of December 31, 2014 (in thousands):
|
December 31, 2014 |
||||||||||
|
Exchange Traded |
Non-Exchange Traded |
|||||||||
|
Derivative Instruments |
Net Long & (Short) (1) |
Long (2) |
(Short) (2) |
Unit of Measure |
Commodity |
|||||
|
Futures |
(4,410) |
Bushels |
Corn, Soybeans and Wheat |
|||||||
|
Futures |
3,675 |
(3) |
Bushels |
Corn |
||||||
|
Futures |
(9,010) |
(4) |
Bushels |
Corn |
||||||
|
Futures |
46,410 |
Gallons |
Ethanol |
|||||||
|
Futures |
(82,950) |
(3) |
Gallons |
Ethanol |
||||||
|
Futures |
958 |
mmBTU |
Natural Gas |
|||||||
|
Futures |
(4,318) |
(4) |
mmBTU |
Natural Gas |
||||||
|
Futures |
1,320 |
Pounds |
Cattle |
|||||||
|
Futures |
(37,040) |
(3) |
Pounds |
Cattle |
||||||
|
Futures |
(2,700) |
Pounds |
Soybean Oil |
|||||||
|
Options |
(2,461) |
Bushels |
Corn, Soybeans and Wheat |
|||||||
|
Options |
(15,095) |
Gallons |
Ethanol |
|||||||
|
Options |
(30) |
mmBTU |
Natural Gas |
|||||||
|
Forwards |
19,041 | (16,251) |
Bushels |
Corn and Soybeans |
||||||
|
Forwards |
8,046 | (160,901) |
Gallons |
Ethanol |
||||||
|
Forwards |
104 | (461) |
Tons |
Distillers Grains |
||||||
|
Forwards |
3,744 | (60,490) |
Pounds |
Corn Oil |
||||||
|
Forwards |
9,310 | (876) |
mmBTU |
Natural Gas |
||||||
|
(1) |
Exchange traded futures and options are presented on a net long and (short) position basis. Options are presented on a delta-adjusted basis. |
|
(2) |
Non-exchange traded forwards are presented on a gross long and (short) position basis including both fixed-price and basis contracts. |
|
(3) |
Futures used for cash flow hedges. |
|
(4) |
Futures used for fair value hedges |
Energy trading contracts that do not involve physical delivery are presented net in revenues on the consolidated statements of operations. Included in revenues are net gains of $8.0 million, net losses of $1.2 million, and net gains of $0.5 million for the years ended December 31, 2014, 2013 and 2012, respectively, on energy trading contracts.
F-20
10. DEBT
The principal balances of the components of long-term debt are as follows (in thousands):
|
December 31, |
|||||
|
2014 |
2013 |
||||
|
Green Plains Bluffton: |
|||||
|
$70.0 million term loan |
$ |
- |
$ |
26,621 | |
|
$20.0 million revolving term loan |
- |
15,000 | |||
|
$22.0 million revenue bond |
- |
15,780 | |||
|
Green Plains Central City: |
|||||
|
$55.0 million term loan |
- |
33,100 | |||
|
$30.5 million revolving term loan |
- |
17,739 | |||
|
Equipment financing loan |
- |
36 | |||
|
Green Plains Fairmont and Green Plains Wood River: |
|||||
|
$62.5 million term loan |
40,000 | 50,000 | |||
|
$27.0 million term loan |
- |
26,756 | |||
|
Tax increment financing bond |
3,589 | 3,626 | |||
|
Capital leases on grain facilities |
9,994 | 9,994 | |||
|
Capital lease on equipment and other |
4,192 | 5,489 | |||
|
Green Plains Holdings II: |
|||||
|
$46.8 million term loans |
29,510 | 15,914 | |||
|
$20.0 million revolving term loan |
6,000 | 31,960 | |||
|
Green Plains Obion: |
|||||
|
$60.0 million term loan |
- |
3,879 | |||
|
$37.4 million revolving term loan |
27,400 | 28,400 | |||
|
Equipment financing loan |
- |
126 | |||
|
Economic development grant |
1,156 | 1,245 | |||
|
Green Plains Ord: |
|||||
|
$25.0 million term loan |
- |
15,143 | |||
|
$13.0 million revolving term loan |
- |
2,151 | |||
|
Green Plains Otter Tail: |
|||||
|
$30.3 million term loan |
- |
17,960 | |||
|
$19.2 million note payable |
- |
19,151 | |||
|
Equipment financing loan |
11 |
- |
|||
|
Green Plains Processing: |
|||||
|
$225.0 million term loan |
213,775 |
- |
|||
|
Green Plains Shenandoah: |
|||||
|
$17.0 million revolving term loan |
- |
9,000 | |||
|
Green Plains Superior: |
|||||
|
$40.0 million term loan |
- |
9,750 | |||
|
$15.6 million revolving term loan |
15,025 | 8,000 | |||
|
Equipment financing loan |
- |
18 | |||
|
Corporate: |
|||||
|
$90.0 million convertible notes |
- |
90,000 | |||
|
$120.0 million convertible notes |
100,845 | 96,653 | |||
|
Capital lease |
- |
188 | |||
|
Other |
11,408 | 10,000 | |||
|
Total long-term debt |
462,905 | 563,679 | |||
|
Less: current portion of long-term debt |
(63,465) | (82,933) | |||
|
Long-term debt |
$ |
399,440 |
$ |
480,746 | |
F-21
Scheduled long-term debt repayments, excluding the effects of any debt discounts and including full accretion of the $120.0 million convertible notes (due 2018) at their maturity, are as follows (in thousands):
|
Year Ending December 31, |
Amount |
||
|
2015 |
$ |
63,465 | |
|
2016 |
13,070 | ||
|
2017 |
14,963 | ||
|
2018 |
134,949 | ||
|
2019 |
22,365 | ||
|
Thereafter |
233,248 | ||
|
Total |
$ |
482,060 | |
Short-term notes payable and other borrowings at December 31, 2014 included working capital revolvers at Green Plains Cattle, Green Plains Grain and Green Plains Trade with outstanding balances of $77.0 million, $37.0 million and $95.9 million, respectively. Short-term notes payable and other borrowings at December 31, 2013 included working capital revolvers at Green Plains Grain and Green Plains Trade with outstanding balances of $95.0 million and $76.5 million, respectively.
Related to loan covenant discussions below, the following definitions generally apply to the Company’s loans (all calculated in accordance with GAAP consistently applied):
|
· |
Working capital – current assets less current liabilities. |
|
· |
Net worth – total assets less total liabilities plus subordinated debt. |
|
· |
Tangible Net worth – total assets less intangible assets less total liabilities plus subordinated debt. |
|
· |
Debt service coverage ratio* – (1) net income (after taxes), plus depreciation and amortization, divided by (2) all current portions of regularly scheduled long-term debt for the prior period (previous year end). |
|
· |
Fixed charge coverage ratio* – |
|
· (1) adjusted EBITDA divided by (2) fixed charges, which are generally the sum of interest expense, scheduled principal payments, distributions, and maintenance capital, within the ethanol production segment. |
|
· (1) EBITDA, less capital expenditures and interest expense of working capital financings divided by (2) scheduled principal payments and interest expense on long-term indebtedness, within the agribusiness segment. |
|
· (1) EBITDA less capital expenditures less distributions less cash taxes, divided by (2) all debt payments for the previous four quarters, on a trailing quarter basis, within the marketing and distribution segment. |
|
· |
Leverage ratio – total liabilities divided by tangible net worth. |
*Certain credit agreements allow for the inclusion of equity contributions from the parent company in the calculations of the debt service and fixed charge coverage ratios.
Ethanol Production Segment
Loan Repayment Terms
Term Loans –
Scheduled principal payments are as follows:
|
• |
Green Plains Fairmont and |
|
|
Green Plains Wood River |
$1.3 million per quarter |
|
|
• |
Green Plains Holdings II |
$1.8 million per quarter |
|
• |
Green Plains Processing |
$0.6 million per quarter |
F-22
Final maturity dates (at the latest) are as follows:
|
• |
Green Plains Fairmont and |
|
|
Green Plains Wood River |
November 27, 2015 |
|
|
• |
Green Plains Holdings II |
July 1, 2019 |
|
• |
Green Plains Processing |
June 30, 2020 |
The Green Plains Processing term loan requires quarterly special payments of 50% to 75% of the available free cash flow from the entity’s operations (as defined in the loan agreement), subject to certain limitations. The Green Plains Fairmont and Green Plains Wood River term loan requires quarterly special payments of 50% of available free cash flow from the entities’ operations (as defined in the loan agreement), subject to certain limitations, beginning with the first quarter of 2015. As of December 31, 2014, free cash flow payments under the Green Plains Fairmont and Green Plains Wood River term loan are discontinued when the aggregate of such future payments equals $16.0 million. In all instances, the loan agreements specify that any amounts owed would be reduced or eliminated to avoid a covenant compliance default, if applicable.
Free cash flow payments currently are not to exceed the following amounts in any given year:
|
• |
Green Plains Fairmont and |
|
|
Green Plains Wood River |
$4.0 million |
|
|
• |
Green Plains Processing |
$54.0 million annually, $27.0 million for 2014 |
Revolving Term Loans – The revolving term loans are generally available for advances throughout the life of the commitment. Allowable advances under the Green Plains Superior loan agreement are reduced by $0.6 million each quarter commencing on October 20, 2014. Allowable advances under the Green Plains Obion loan agreement are reduced by $0.8 million each quarter commencing on August 20, 2014. Interest-only payments are due each month on all revolving term loans until their final respective maturity dates.
Final maturity dates (at the latest) are as follows:
|
• |
Green Plains Holdings II |
July 1, 2019 |
|
• |
Green Plains Obion |
May 20, 2020 |
|
• |
Green Plains Superior |
October 20, 2019 |
Interest and Fees
The term loans bear interest at LIBOR plus 4.50% to 5.50% or lender-established prime rates. The Green Plains Fairmont and Green Plains Wood River combined term loan bears interest at the three-month LIBOR plus 6.25%. The Green Plains Processing term loan has established a 1% floor on the underlying LIBOR index. A portion of the Green Plains Holdings II term loan is fixed at 8.22%.The revolving term loans bear interest at LIBOR plus 3.85% to 4.50% or lender-established prime rates. Unused commitment fees, when charged, are 0.25% to 0.65%.
Security
As security for the loans, the lenders received a first-position lien on all personal property and real estate owned by the respective entity, and its subsidiaries, if applicable, borrowing the funds, including an assignment of all contracts and rights pertinent to construction and on-going operations of the plant. These borrowing entities are also required to maintain certain financial and non-financial covenants during the terms of the loans.
F-23
Covenants
The loan agreements contain affirmative covenants (including financial covenants) and negative covenants including:
|
Maintenance of working capital, including unused portion of revolver, as follows: |
||
|
• |
Green Plains Holdings II |
$15.0 million |
|
• |
Green Plains Obion |
$9.0 million |
|
• |
Green Plains Superior |
$3.0 million |
|
Maintenance of net worth as follows: |
||
|
• |
Green Plains Holdings II |
$100.0 million plus 25% of net income before tax |
|
• |
Green Plains Obion |
$95.0 million plus 25% of net income before tax |
|
• |
Green Plains Superior |
$33.0 million |
|
Maintenance of annual fixed charge coverage ratios: |
||
|
• |
Green Plains Processing |
1.25 to 1.00 |
|
Maintenance of annual debt service coverage ratios: |
||
|
• |
Green Plains Fairmont and Green Plains Wood River |
2.25 to 1.00 |
|
• |
Green Plains Holdings II |
1.25 to 1.00 |
|
• |
Green Plains Obion |
1.25 to 1.00 |
|
• |
Green Plains Superior |
1.00 to 1.00 |
|
Maintenance of annual leverage ratio: |
||
|
• |
Green Plains Fairmont and Green Plains Wood River |
3.25 to 1.00 (decreasing to 2.00 to 1.00 in 2015) |
|
• |
Green Plains Processing |
4.00 to 1.00 (decreasing to 3.25 to 1.00 in 2019) |
|
Annual capital expenditures will be limited as follows: |
||
|
• |
Green Plains Fairmont and Green Plains Wood River |
$2.0 million growth and $4.0 million maintenance |
Allowable dividends and other non-overhead distributions from each respective subsidiary are subject to certain additional restrictions including compliance with all loan covenants, terms and conditions, as follows:
|
• |
Green Plains Fairmont |
Up to amounts equal to permitted tax |
|
and Green Plains Wood River |
distributions, as defined in the loan agreement |
|
|
• |
Green Plains Holdings II |
Up to 40% of net profit before tax, and |
|
unlimited if working capital is greater than or |
||
|
equal to $20.0 million |
||
|
• |
Green Plains Obion |
Up to 40% of net profit before tax, and |
|
unlimited if working capital is greater than or |
||
|
equal to $15.0 million |
||
|
• |
Green Plains Processing |
Amounts may be distributed after quarterly free |
|
cash flow payment is made, subject to certain |
||
|
limitations, as defined in the loan agreement |
||
|
• |
Green Plains Superior |
Up to 40% of net profit before tax, and |
|
unlimited after free cash flow payment is made |
During the second quarter of 2014, Green Plains Processing LLC, a wholly-owned subsidiary of Green Plains Inc., issued term debt under a $225 million Term Loan B facility, which was used to repay all term loans and revolving term loans at Green Plains Bluffton, Green Plains Central City, Green Plains Ord, Green Plains Otter Tail and Green Plains Shenandoah, including the Green Plains Bluffton Revenue Bonds. The new facility is secured by the Atkinson, Bluffton, Central City, Ord, Otter Tail and Shenandoah ethanol plants, including their corn oil production assets, and bears interest at a rate equal to 5.5% plus LIBOR, subject to a 1.0% floor. At December 31, 2014, the interest rate on this term debt was 6.5%. The facility matures on June 30, 2020.
In 2007, Green Plains Bluffton issued $22.0 million of Subordinate Solid Waste Disposal Facility Revenue Bonds bearing interest at 7.50% per annum with the City of Bluffton, Indiana. The revenue bonds required: (1) semi-annual principal and interest payments of approximately $1.5 million through March 1, 2019 and (2) a final principal and interest payment of $3.7 million on September 1, 2019. In July 2014, the revenue bonds were paid in full in accordance with the terms of the $225 million Term Loan B facility.
F-24
In February 2014, the Green Plains Holdings II credit agreement was amended to restructure the commitments on the amortizing term loan and term revolver, extend the final maturity date and modify various financial covenants. The amendment increased the commitment of the amortizing term loan to $46.8 million, and decreased the commitment on the revolver to $20.0 million. In June 2014, the Green Plains Obion revolving term loan was amended to extend the maturity date and modify various financial covenants. In June 2014, the Green Plains Fairmont and Green Plains Wood River $27.0 million term loan was paid in full. In July 2014, the Green Plains Fairmont and Green Plains Wood River $50.0 million term loan, secured by these subsidiaries, was amended to increase the outstanding amount to $62.5 million. In August 2014, the Green Plains Superior revolving term loan was amended to increase the commitment amount from $10.0 million to $15.6 million and extend the maturity date. The Green Plains Superior term loan was extinguished. The descriptions and covenants above have been updated to reflect the amendments.
In March 2007, Green Plains Otter Tail issued $19.2 million in senior notes under New Market Tax Credits financing. The notes bear interest at an annual rate equal to the prime rate (as defined) plus 1.5%, but not less than 4.0%, payable monthly, and require monthly principal payments of approximately $0.3 million beginning in September 2014. The senior notes, which were scheduled to mature in September 2018, were extinguished in April 2014, with $2.2 million of the outstanding obligation forgiven according to terms of the financing, which is included in other income in the consolidated financial statements for the year ended December 31, 2014.
Agribusiness Segment
Green Plains Grain has a $125.0 million senior secured asset-based revolving credit facility with various lenders to provide for working capital financing. The lenders will make loans up to the maximum commitment based on eligible collateral. The amount of eligible collateral is determined by a calculated borrowing base value equal to the sum of percentages of eligible cash, eligible receivables and eligible inventories, less certain miscellaneous adjustments. Advances are subject to interest charges at a rate per annum equal to the LIBOR rate for the outstanding period plus the applicable margin or the base rate plus the applicable margin. The revolving credit facility matures on August 26, 2016. The revolving credit facility includes total revolving credit commitments of $125.0 million and an accordion feature whereby amounts available under the facility may be increased by up to $75.0 million of new lender commitments upon agent approval. The facility also allows for additional seasonal borrowings up to $50.0 million. The total commitments outstanding under the facility cannot exceed $250.0 million. As security for the revolving credit facility, the lender received a first priority lien on certain cash, inventory, accounts receivable and other assets owned by subsidiaries of the agribusiness segment. The loan agreement includes affirmative covenants and negative covenants including maintenance of working capital of $23.0 million, maintenance of net worth of $26.3 million, maintenance of a fixed charge coverage ratio of 1.25 to 1.00, maintenance of an annual leverage ratio of 6.00 to 1.00 and capital expenditure limitation of $15.0 million annually. In addition to other customary covenants, this revolving credit facility contains restrictions on distributions with respect to capital stock, with exceptions for distributions of up to 40% of net profit before tax, subject to certain conditions.
Green Plains Cattle has a $100.0 million senior secured asset-based revolving credit facility with various lenders to provide for working capital financing for the cattle feedlot operations. This loan replaced the $15.0 million senior secured asset-based revolving credit facility that matured in December 2014. The lenders will make loans up to the maximum commitment based on eligible collateral. The amount of eligible collateral is determined by a calculated borrowing base value equal to the sum of percentages of eligible receivables, eligible inventories and eligible other current assets, less certain miscellaneous adjustments. Advances are subject to interest charges at a variable rate per annum equal to the LIBOR rate for the outstanding period plus 3.00%, 2.50%, or 2.00%, depending upon availability. The revolving credit facility matures on October 31, 2017. The revolving credit facility includes total revolving credit commitments of $100.0 million and an accordion feature whereby amounts available under the facility may be increased by up to $50.0 million of new lender commitments upon agent approval. The loan agreement includes affirmative covenants and negative covenants including maintenance of working capital of $15.0 million, maintenance of net worth of $20.0 million plus 50% of prior year net income, maintenance of an annual leverage ratio of 3.50 to 1.00 and capital expenditure limitation of $3.0 million annually. As security for the revolving credit facility, the lender received a first priority lien on certain cash, inventory, accounts receivable, property and equipment and other assets owned by Green Plains Cattle.
Marketing and Distribution Segment
Green Plains Trade has a $150.0 million senior secured asset-based revolving credit facility that was amended in November 2014, to increase the commitment amount from $130.0 million to $150.0 million and to extend the maturity date to November 26, 2019. The revolving credit facility, with various lenders, is used to provide for working capital financing. The lenders will make loans up to $150.0 million based on eligible collateral. The amount of eligible collateral is determined
F-25
by a calculated borrowing base value equal to the sum of percentages of eligible receivables and eligible inventories, less certain miscellaneous adjustments. The outstanding balance, if any, is subject to interest charges at the lender’s floating base rate plus the applicable margin or LIBOR plus the applicable margin. In addition to other customary covenants, this revolving credit facility contains restrictions on distributions with respect to capital stock, with exceptions for distributions with respect to tax obligations, subject to certain conditions, whereby distributions may be made in an amount up to 50% of net income if (a) undrawn availability under this facility, on a pro forma basis, is greater than $10.0 million for the preceding 30 days and (b) as of the date of the distribution, the borrower would be in compliance with the fixed charge coverage ratio on a pro forma basis. The loan agreement includes affirmative covenants and negative covenants including maintenance of a fixed charge coverage ratio of 1.15 to 1.00 and capital expenditure limitation of $1.0 million annually. At December 31, 2014, Green Plains Trade had $22.9 million, presented as restricted cash on the consolidated balance sheets, the use of which was restricted for repayment towards the outstanding loan balance.
In June 2013, subsidiaries of the Company executed a New Markets Tax Credits financing transaction related to the Birmingham, Alabama terminal. In order to facilitate this financing transaction, the Company was required to issue promissory notes payable in the amount of $10.0 million and a note receivable in the amount of $8.1 million. The promissory notes payable and note receivable bear interest at 1% per annum, payable quarterly. Beginning in March 2020, the promissory notes and note receivable each require quarterly principal and interest payments of approximately $0.2 million; the Company retains the right to call $8.1 million of the promissory notes in 2020. The promissory notes payable and note receivable mature on September 15, 2031 and will be fully amortized upon maturity. In connection with the New Markets Tax Credits financing transaction, income tax credits were generated for the benefit of the lender. The Company has guaranteed the lender the value of these income tax credits over their statutory lives, a period of seven years, in the event that the income tax credits are recaptured or reduced. The value of the income tax credits was anticipated to be $5.0 million at the time of the transaction. The Company believes the likelihood of recapture or reduction of the income tax credits is remote, and therefore has not established a liability in connection with this guarantee.
Corporate Activities
In September 2013, the Company issued $120.0 million of 3.25% Convertible Senior Notes due 2018, or the 3.25% Notes. The 3.25% Notes represent senior, unsecured obligations of the Company, with interest payable on April 1 and October 1 of each year. At the time the Company issued the 3.25% Notes, it was only permitted to settle conversions with shares of its common stock. The Company received shareholder approval at its 2014 annual meeting, held in the second quarter, to allow for flexible settlement which gives it the option to settle conversions in cash, shares of common stock, or any combination thereof. The Company intends to satisfy conversion of the 3.25% Notes with cash for the principal amount of the debt and cash or shares of common stock for any related conversion premium. The 3.25% Notes contain liability and equity components which were bifurcated and accounted for separately. The liability component of the 3.25% Notes, as of the issuance date, was calculated by estimating the fair value of a similar liability issued at an 8.21% effective interest rate, which was determined by considering the rate of return investors would require for comparable debt of the Company without conversion rights. The amount of the equity component was calculated by deducting the fair value of the liability component from the principal amount of the 3.25% Notes, resulting in the initial recognition of $24.5 million as debt discount costs recorded in additional paid-in capital. The carrying amount of the 3.25% Notes will be accreted to the principal amount over the remaining term to maturity, and the Company will record a corresponding amount of noncash interest expense. Additionally, the Company incurred debt issuance costs of $5.1 million related to the 3.25% Notes and allocated $4.0 million of debt issuance costs to the liability component of the 3.25% Notes. These costs will be amortized to noncash interest expense over the five-year term of the 3.25% Notes. Prior to April 1, 2018, the 3.25% Notes will not be convertible unless certain conditions are satisfied. The conversion rate is subject to adjustment upon the occurrence of certain events, including the payment of a quarterly cash dividend that exceeds $0.04 per share. As a result, the conversion rate was recently adjusted to 48.0607 shares of common stock per $1,000 principal amount of 3.25% Notes, which is equal to a current conversion price of approximately $20.81 per share. In addition, the Company may be obligated to increase the conversion rate for any conversion that occurs in connection with certain corporate events, including the Company calling the 3.25% Notes for redemption.
The Company may redeem for cash all, but not less than all, of the 3.25% Notes at any time on or after October 1, 2016 if the sale price of the Company's common stock equals or exceeds 140% of the applicable conversion price for a specified time period ending on the trading day immediately prior to the date the Company delivers notice of the redemption. The redemption price will equal 100% of the principal amount of the 3.25% Notes, plus any accrued and unpaid interest. In addition, upon the occurrence of a fundamental change, such as a change in control, holders of the 3.25% Notes will have the right, at their option, to require the Company to repurchase their 3.25% Notes in cash at a price equal to 100% of the
F-26
principal amount of the 3.25% Notes to be repurchased, plus accrued and unpaid interest. Default with respect to any loan in excess of $10.0 million constitutes an event of default under the 3.25% Notes, which could result in the 3.25% Notes being declared due and payable.
On February 14, 2014, the Company gave notice of its intention to redeem all of its previously-issued and outstanding $90.0 million of 5.75% Convertible Senior Notes due 2015, or the 5.75% Notes, pursuant to the optional redemption right in the indenture governing the 5.75% Notes. The 5.75% Notes were convertible into shares of the Company’s common stock at the conversion rate of 72.5846 shares of common stock for each $1,000 principal amount of 5.75% Notes from February 14, 2014 through February 28, 2014. From March 1, 2014 through March 19, 2014, the conversion rate was adjusted to 72.6961 shares of common stock for each $1,000 principal amount as a result of the quarterly cash dividend. Approximately $89.95 million of the 5.75% Notes were submitted for conversion into 6,532,713 shares of common stock through March 19, 2014. On March 20, 2014, the Company redeemed the remaining 5.75% Notes at par value plus accrued and unpaid interest through March 19, 2014. All $90.0 million of the 5.75% Notes were retired effective March 20, 2014.
Covenant Compliance
The Company, including all of its subsidiaries, was in compliance with its debt covenants as of December 31, 2014.
Capitalized Interest
The Company had $191 thousand in capitalized interest during the year ended December 31, 2014, no capitalized interest during the year ended December 31, 2013 and $285 thousand in capitalized interest during the year ended December 31, 2012.
Restricted Net Assets
At December 31, 2014, there were approximately $681.4 million of net assets at the Company’s subsidiaries that were not available to be transferred to the parent company in the form of dividends, loans or advances due to restrictions contained in the credit facilities of these subsidiaries.
11. STOCK-BASED COMPENSATION
The Company has an equity incentive plan which reserves a total of 3.5 million shares of common stock for issuance pursuant to its terms. The plan provides for the granting of shares of stock, including options to purchase shares of common stock, stock appreciation rights tied to the value of common stock, restricted stock, and restricted and deferred stock unit awards to eligible employees, non-employee directors and consultants. The Company measures share-based compensation grants at fair value on the grant date, adjusted for estimated forfeitures. The Company records noncash compensation expense related to equity awards in its consolidated financial statements over the requisite service period on a straight-line basis. Substantially all of the Company’s existing share-based compensation awards have been determined to be equity awards.
Grants under the equity incentive plans may include:
|
· |
Options – Stock options may be granted that are currently exercisable, that become exercisable in installments, or that are not exercisable until a fixed future date. Certain options that have been issued are exercisable during their term regardless of termination of employment while other options have been issued that terminate at a designated time following the date employment is terminated. Options issued to date may be exercised immediately and/or at future vesting dates, and must be exercised no later than five to eight years after the grant date or they will expire. |
|
· |
Stock Awards – Stock awards may be granted to directors and employees with ownership of the common stock vesting immediately or over a period determined by the Compensation Committee and stated in the award. Stock awards granted to date vested in some cases immediately and at other times over a period determined by the Compensation Committee and were restricted as to sales for a specified period. Compensation expense was recognized upon the grant award date if fully vested, or over the requisite vesting period. |
|
· |
Deferred Stock Units – Deferred stock units may be granted to directors and employees with ownership of the common stock vesting immediately or over a period determined by the Compensation Committee and stated in the award. As determined by the Compensation Committee, deferred stock units granted to date vest over a specific
F-27
|
period with underlying shares of common stock issuable in a period beyond the vesting date. Compensation expense was recognized upon the grant award date if fully vested, or over the requisite vesting period. |
For stock options granted during the periods indicated below, the fair value of options granted was estimated on the date of grant using the Black‑Scholes option‑pricing model, a pricing model acceptable under GAAP. The Company did not grant any stock option awards during the years ended December 31, 2014 and 2013. The fair value of stock option awards granted in 2012 were calculated using assumptions of an expected life of 6.0 years, an interest rate of 0.63% and a volatility rate of 76.26%.
The expected life of options granted represents the period of time in years that options granted are expected to be outstanding. The interest rate represents the annual interest rate a risk-free investment could potentially earn during the expected life of the option grant. Expected volatility is based on weighted-average historical volatility of the Company’s common stock.
All of the Company’s existing share-based compensation awards have been determined to be equity awards. The Company recognizes compensation costs for stock option awards which vest with the passage of time with only service conditions on a straight-line basis over the requisite service period.
The following table summarizes exercisable stock option activity for the year ended December 31, 2014:
|
Shares |
Weighted-Average Exercise Price |
Weighted-Average Remaining Contractual Term (in years) |
Aggregate Intrinsic Value (in thousands) |
||||||
|
Outstanding at December 31, 2013 |
610,250 |
$ |
10.71 |
3.4 |
$ |
5,310 | |||
|
Granted |
- |
- |
|||||||
|
Exercised |
(270,500) | 10.56 | 5,270 | ||||||
|
Forfeited |
- |
- |
|||||||
|
Expired |
- |
- |
|||||||
|
Outstanding at December 31, 2014 |
339,750 |
$ |
10.82 |
3.1 |
$ |
4,763 | |||
|
Exercisable at December 31, 2014 (1) |
339,750 |
$ |
10.82 |
3.1 |
$ |
4,763 | |||
|
(1) |
Includes in-the-money options totaling 339,750 shares at a weighted-average exercise price of $10.82. |
The Company’s option awards allow employees to exercise options through cash payment to the Company for the shares of common stock or through a simultaneous broker-assisted cashless exercise of a share option, through which the employee authorizes the exercise of an option and the immediate sale of the option shares in the open market. The Company uses newly-issued shares of common stock to satisfy its share-based payment obligations.
The following table summarizes non-vested stock award and deferred stock unit activity for the year ended December 31, 2014:
|
Non-Vested Shares and Deferred Stock Units |
Weighted-Average Grant-Date Fair Value |
Weighted-Average Remaining Vesting Term |
||||
|
Nonvested at December 31, 2013 |
738,950 |
$ |
10.39 | |||
|
Granted |
407,393 | 23.56 | ||||
|
Forfeited |
(5,516) | 10.88 | ||||
|
Vested |
(462,323) | 13.49 | ||||
|
Nonvested at December 31, 2014 |
678,504 |
$ |
16.18 |
1.8 |
||
Compensation costs expensed for the Company’s share-based payment plan described above were approximately $7.2 million, $5.5 million and $5.5 million for the years ended December 31, 2014, 2013 and 2012, respectively. At December 31, 2014, there were $6.6 million of unrecognized compensation costs from share-based compensation arrangements, which are related to non-vested awards. This compensation is expected to be recognized over a weighted-average period of
F-28
approximately 1.8 years. The potential tax benefit realizable for the anticipated tax deductions of the exercise of share-based payment arrangements generally would approximate 37.5% of these expense amounts.
12. EARNINGS PER SHARE
Basic earnings per share, or EPS, is calculated by dividing net income available to common stockholders by the weighted average number of common shares outstanding during the period. Diluted EPS is computed by dividing net income on an if-converted basis for 2012, 2013 and the first quarter of 2014, with respect to the 3.25% Notes and the 5.75% Notes, by the weighted average number of common shares outstanding during the period, adjusted for the dilutive effect of any outstanding dilutive securities. All of the 5.75% Notes were retired during the first quarter of 2014. During the second quarter of 2014, the Company received shareholder approval to allow for flexible settlement in cash, shares of common stock, or a combination of cash and shares of common stock for the conversion of the 3.25% Notes. The Company intends to settle conversions in cash for the principal amount and cash or shares of the Company’s common stock for any related conversion premium. Accordingly, beginning in the second quarter of 2014, diluted EPS is computed using the treasury stock method by dividing net income by the weighted average number of common shares outstanding during the period, adjusted for the dilutive effect of any outstanding dilutive securities. The calculations of basic and diluted EPS are as follows (in thousands):
|
Year Ended December 31, |
||||||||
|
2014 |
2013 |
2012 |
||||||
|
Basic EPS: |
||||||||
|
Net income attributable to Green Plains |
$ |
159,504 |
$ |
43,391 |
$ |
11,779 | ||
|
Weighted average shares outstanding - basic |
36,467 | 30,183 | 30,296 | |||||
|
EPS - basic |
$ |
4.37 |
$ |
1.44 |
$ |
0.39 | ||
|
Diluted EPS: |
||||||||
|
Net income attributable to Green Plains |
$ |
159,504 |
$ |
43,391 |
$ |
11,779 | ||
|
Interest and amortization on convertible debt, net of tax effect: |
||||||||
|
5.75% Notes |
576 | 3,578 |
- |
|||||
|
3.25% Notes |
1,379 | 1,473 |
- |
|||||
|
Net income attributable to Green Plains - diluted |
$ |
161,459 |
$ |
48,442 |
$ |
11,779 | ||
|
Weighted average shares outstanding - basic |
36,467 | 30,183 | 30,296 | |||||
|
Effect of dilutive convertible debt: |
||||||||
|
5.75% Notes |
1,006 | 6,286 |
- |
|||||
|
3.25% Notes |
3,040 | 1,624 |
- |
|||||
|
Effect of dilutive stock-based compensation awards |
217 | 211 | 167 | |||||
|
Weighted average shares oustanding - diluted |
40,730 | 38,304 | 30,463 | |||||
|
EPS - diluted |
$ |
3.96 |
$ |
1.26 |
$ |
0.39 | ||
Excluded from the computations of diluted EPS for the years ended December 31, 2013 and 2012, were stock-based compensation awards totaling 14 thousand and 0.8 million shares, respectively, because the exercise prices or the grant-date fair value, as applicable, of the corresponding awards were greater than the average market price of the Company’s common stock during the respective periods. Also, the effect of 5.75% Notes due 2015 was excluded from the computation of diluted EPS for the year ended December 31, 2012 as inclusion would be antidilutive.
13. STOCKHOLDERS’ EQUITY
Treasury Stock
The Company holds 7.2 million shares of its common stock at a cost of $65.8 million. Shares of repurchased common stock are recorded at cost as treasury stock, resulting in a reduction of stockholders’ equity in the consolidated balance sheets. When shares are reissued, the Company will use the weighted average cost method for determining the cost basis. The difference between the cost of the shares and the issuance price will be added or deducted from additional paid-in capital.
F-29
Share Repurchase Program
In August 2014, the Company announced a share repurchase program of up to $100 million of its common stock. Under the share repurchase program, the Company may repurchase shares from time to time in open market transactions, privately negotiated transactions, accelerated share buyback programs, tender offers or by other means. The timing and amount of repurchase transactions will be determined by its management based on its evaluation of market conditions, share price, legal requirements and other factors. The program may be suspended, modified or discontinued at any time without prior notice. No shares have been repurchased pursuant to this repurchase program.
Dividends
In August 2013, the Company’s Board of Directors approved the initiation of a quarterly cash dividend. The Company has paid a quarterly cash dividend since this initial authorization and anticipates declaring cash dividends in future quarters on a regular basis; however, future declarations of dividends are subject to Board approval and may be adjusted as the Company’s cash position, business needs or market conditions change.
Accumulated Other Comprehensive Income
Changes in accumulated other comprehensive income relate primarily to gains and losses on derivative financial instruments. Amounts reclassified from accumulated other comprehensive income are as follows (in thousands):
|
Year Ended December 31, |
Statements of Operations |
|||||||||
|
2014 |
2013 |
2012 |
Classification |
|||||||
|
Gains (losses) on cash flow hedges: |
||||||||||
|
Ethanol commodity derivatives |
$ |
(257,730) |
$ |
(96,736) |
$ |
(17,318) |
Revenues |
|||
|
Corn commodity derivatives |
(43,853) | (25,852) | 56,848 |
Cost of goods sold |
||||||
|
Total |
(301,583) | (122,588) | 39,530 |
Income (loss) before income taxes |
||||||
|
Income tax benefit |
(139,754) | (46,941) | 15,032 |
Income tax expense (benefit) |
||||||
|
Amounts reclassified from accumulated |
||||||||||
|
other comprehensive income (loss) |
$ |
(161,829) |
$ |
(75,647) |
$ |
24,498 | ||||
14. INCOME TAXES
Income taxes are accounted for under the asset and liability method. Deferred tax assets and liabilities are recognized for the future tax consequences attributable to differences between the financial statement carrying amounts of existing assets and liabilities and their respective tax bases, and for net operating loss and tax credit carry-forwards. Deferred tax assets and liabilities are measured using enacted tax rates expected to apply to taxable income in the years in which those temporary differences are expected to be recovered or settled. The effect on deferred tax assets and liabilities of a change in tax rates is recognized in income in the period that includes the enactment date.
Income tax expense consists of the following (in thousands):
|
Year Ended December 31, |
|||||||||
|
2014 |
2013 |
2012 |
|||||||
|
Current |
$ |
67,389 |
$ |
1,397 |
$ |
2,689 | |||
|
Deferred |
23,537 | 27,493 | 10,704 | ||||||
|
Total |
$ |
90,926 |
$ |
28,890 |
$ |
13,393 | |||
F-30
Differences between the income tax expense computed at the statutory federal income tax rate and as presented on the consolidated statements of operations are summarized as follows (in thousands):
|
Year Ended December 31, |
||||||||
|
2014 |
2013 |
2012 |
||||||
|
Tax expense at federal statutory |
||||||||
|
rate of 35% |
$ |
87,650 |
$ |
25,299 |
$ |
8,810 | ||
|
State income tax expense, net |
||||||||
|
of federal benefit |
6,810 | 2,002 | 4,036 | |||||
|
Qualified production activities deduction |
(4,637) |
- |
- |
|||||
|
Increase (decrease) in valuation allowance |
||||||||
|
against deferred tax assets |
- |
(709) |
- |
|||||
|
Nondeductible compensation |
848 | 1,491 |
- |
|||||
|
Other |
255 | 807 | 547 | |||||
|
Income tax expense |
$ |
90,926 |
$ |
28,890 |
$ |
13,393 | ||
Significant components of deferred tax assets and liabilities are as follows (in thousands):
|
December 31, |
|||||
|
2014 |
2013 |
||||
|
Deferred tax assets: |
|||||
|
Net operating loss carryforwards - State |
$ |
471 |
$ |
1,232 | |
|
Tax credit carryforwards - Federal |
- |
2,062 | |||
|
Tax credit carryforwards - State |
4,910 | 5,662 | |||
|
Derivative financial instruments |
975 | 2,297 | |||
|
Organizational and start-up costs |
851 | 2,371 | |||
|
Stock-based compensation |
2,868 | 2,975 | |||
|
Accrued expenses |
7,196 | 7,219 | |||
|
Capital leases |
3,743 |
- |
|||
|
Other |
1,532 | 1,690 | |||
|
Total deferred tax assets |
22,546 | 25,508 | |||
|
Deferred tax liabilities: |
|||||
|
Convertible debt |
$ |
(6,878) |
$ |
(8,444) | |
|
Fixed assets |
(118,132) | (94,864) | |||
|
Investment in partnerships |
(1,534) | (1,786) | |||
|
Total deferred tax liabilities |
(126,544) | (105,094) | |||
|
Valuation allowance |
(3,742) | (3,765) | |||
|
Deferred income taxes |
$ |
(107,740) |
$ |
(83,351) | |
As of December 31, 2013, the Company had utilized all of its federal net operating loss carryforwards of $30.5 million from 2012. The Company continues to maintain a valuation allowance against some of its net deferred tax assets due to the uncertainty of realizing these assets in the future. The deferred tax valuation allowance of $3.7 million as of December 31, 2014 relates to certain Iowa and Nebraska tax credits that started expiring in 2014 and will continue to expire through 2016. In assessing the realizability of deferred tax assets, management considers whether it is more likely than not that some or all of the deferred tax assets will be realized. The ultimate realization of deferred tax assets is dependent upon the generation of future taxable income and other tax attributes during the periods in which those temporary differences become deductible. Management considers the scheduled reversal of deferred tax liabilities, projected future taxable income, and tax planning strategies in making this assessment.
The Company conducts business and files tax returns in several states within the U.S. The Company’s federal and state returns for the tax years ended November 30, 2011 and later are still subject to audit.
F-31
A reconciliation of the beginning and ending amount of unrecognized tax benefits is as follows (in thousands):
|
Unrecognized Tax Benefits |
||
|
Balance at January 1, 2014 |
$ |
279 |
|
Additions for current year tax positions |
- |
|
|
Additions for prior year tax positions |
33 | |
|
Reductions for prior year tax positions |
- |
|
|
Reductions as a result of a lapse of applicable statue of expirations |
- |
|
|
Balance at December 31, 2014 |
$ |
312 |
The unrecognized tax benefits, if recognized, would favorably impact the Company’s effective tax rate. The Company accrues interest and penalties associated with uncertain tax positions as part of selling, general and administrative expense.
15. COMMITMENTS AND CONTINGENCIES
Operating Leases
The Company leases certain facilities and parcels of land under agreements that expire at various dates. For accounting purposes, rent expense is based on a straight-line amortization of the total payments required over the lease term. The Company incurred lease expenses of $31.8 million, $19.9 million and $18.3 million during the years ended December 31, 2014, 2013 and 2012, respectively. Aggregate minimum lease payments under these agreements for future fiscal years are as follows (in thousands):
|
Year Ending December 31, |
Amount |
||
|
2015 |
$ |
30,316 | |
|
2016 |
26,910 | ||
|
2017 |
16,810 | ||
|
2018 |
13,835 | ||
|
2019 |
9,989 | ||
|
Thereafter |
8,923 | ||
|
Total |
$ |
106,783 | |
Commodities
As of December 31, 2014 the Company had contracted for future purchases of grain, corn oil, natural gas, ethanol, distillers grains and cattle valued at approximately $308.3 million.
Legal
In April 2011, Aventine Renewable Energy, Inc. filed a complaint in the United States Bankruptcy Court for the District of Delaware in connection with its Chapter 11 bankruptcy naming as defendants Green Plains Inc., Green Plains Obion LLC, Green Plains Bluffton LLC, Green Plains VBV LLC and Green Plains Trade Group LLC. This action alleged $24.4 million of damages from preferential transfers or, in the alternative, $28.4 million of damages from fraudulent transfers under an ethanol marketing agreement and an unspecified amount of damages for a continuing breach of a termination agreement related to rail cars. In April 2012, the parties mutually agreed to a negotiated settlement whereby the Company agreed to a cash payment and the purchase of 20 million gallons of ethanol from Aventine over a four-month period beginning in May 2012. An after-tax charge of $2.4 million for the settlement was reflected in operations for the year ended December 31, 2012.
In November 2013, the Company acquired ethanol plants located in Fairmont, Minnesota and Wood River, Nebraska. There is ongoing litigation related to the consideration for this acquisition. To the extent that this litigation is resolved favorably for the Company, it will result in a gain in a future period with no impact in the event of a negative outcome.
In addition to the above-described proceeding, the Company is currently involved in other litigation that has arisen in the ordinary course of business; however, it does not believe that any of this litigation will have a material adverse effect on its financial position, results of operations or cash flows.
F-32
Insurance Recoveries
In March 2014, the Green Plains Otter Tail ethanol plant was damaged by a fire, which caused substantial property damage and business interruption costs. The Company has property damage and business interruption insurance coverages and, as a result, the fire has not had a material adverse impact on the Company’s financial results.
As of December 31, 2014, the Company had received $7.8 million for the property damage portion of the claim, representing reimbursement, net of deductible, for the replacement value of the damaged property and equipment. This recovery is in excess of the book value of the damaged assets, resulting in a gain of $4.2 million, which was recorded in other income during the year ended December 31, 2014.
The Company had also received insurance proceeds of $10.5 million as of December 31, 2014 related to the business interruption portion of the claim, reimbursing a substantial majority of lost profits, net of deductible, during the repair of this equipment. These proceeds are recorded as a reduction of cost of goods sold.
The amounts above for both property damage and business interruption insurance claims are final and have been approved and paid by the insurance carrier.
16. EMPLOYEE BENEFIT PLANS
The Company offers eligible employees a comprehensive employee benefits plan that includes health, dental, vision, life and accidental death, short-term disability and long-term disability insurance, and flexible spending accounts. Additionally, the Company offers a 401(k) retirement plan that enables eligible employees to save on a tax-deferred basis up to the limits allowable under the Internal Revenue Code. The Company matches up to 4% of eligible employee contributions. Employee and employer contributions are 100% vested immediately. Employer contributions to the 401(k) plan were $1.1 million, $0.9 million and $0.9 million for the years ended December 31, 2014, 2013 and 2012, respectively.
The Company contributes to a defined benefit pension plan. Although benefits under the plan were frozen as of January 1, 2009, the Company remains obligated to ensure that the plan is funded in accordance with applicable requirements. As of December 31, 2014, assets of the plan were $6.4 million and liabilities of the plan were $6.0 million. Excess plan assets over plan liabilities of $0.4 million were included in other assets on the consolidated balance sheet at December 31, 2014 and excess plan liabilities over plan assets of $0.3 million were included in other liabilities on the consolidated balance sheet at December 31, 2013.
17. RELATED PARTY TRANSACTIONS
Commercial Contracts
Three subsidiaries of the Company have executed separate financing agreements for equipment with AXIS Capital Inc. Gordon F. Glade, President and Chief Executive Officer of AXIS Capital, is a member of the Company’s Board of Directors. In March 2014, a subsidiary of the Company entered into $1.4 million of new equipment financing agreements with AXIS Capital with monthly payments beginning in April 2014. Totals of $1.2 million and $0.1 million were included in debt at December 31, 2014 and 2013, respectively, under these financing arrangements. Payments, including principal and interest, totaled $0.3 million, $0.1 million and $0.3 million for the years ended December 31, 2014, 2013 and 2012, respectively, and the weighted average interest rate for all outstanding financing agreements with AXIS Capital is 6.8%.
Aircraft Leases
Effective April 1, 2014, the Company entered into two agreements with entities controlled by Wayne B. Hoovestol for the lease of two aircrafts. Mr. Hoovestol is Chairman of the Company’s Board of Directors. In total, the Company agreed to pay $15,834 per month for combined use of up to 125 hours per year of the aircrafts. Any flight time in excess of 125 hours per year will incur additional hourly-based charges. These agreements replaced a prior agreement with an entity controlled by Mr. Hoovestol for the lease of an aircraft for $6,667 per month for use of up to 100 hours per year, with any flight time in excess of 100 hours resulting in additional hourly-based charges. During the years ended December 31, 2014, 2013 and 2012, payments related to these leases totaled $187 thousand, $136 thousand and $121 thousand, respectively. The Company had approximately $2 thousand in outstanding payables related to this agreement at December 31, 2014 and no outstanding payables at December 31, 2013.
F-33
Effective January 1, 2015, the Company has entered into two agreements with an entity controlled by Mr. Hoovestol for the lease of two different aircrafts, replacing the prior agreements. Under the new agreements, the Company has agreed to pay $9,766 per month for combined use of up to 125 hours per year of the aircrafts. Any flight time in excess of 125 hours per year will incur additional hourly-based charges.
18. QUARTERLY FINANCIAL DATA (Unaudited)
The following tables set forth certain unaudited financial data for each of the quarters within the years ended December 31, 2014 and 2013 (in thousands, except per share amounts). This information has been derived from the Company’s consolidated financial statements and in management’s opinion, reflects all adjustments necessary for a fair presentation of the information for the quarters presented. The operating results for any quarter are not necessarily indicative of results for any future period.
|
Three Months Ended |
||||||||||||
|
December 31, |
September 30, |
June 30, |
March 31, |
|||||||||
|
Revenues |
$ |
829,939 |
$ |
833,925 |
$ |
837,858 |
$ |
733,889 | ||||
|
Cost of goods sold |
732,288 | 735,842 | 759,543 | 633,140 | ||||||||
|
Operating income |
73,929 | 75,055 | 58,946 | 78,343 | ||||||||
|
Other expense |
(9,315) | (9,056) | (8,857) | (8,615) | ||||||||
|
Income tax expense |
22,377 | 24,250 | 17,775 | 26,525 | ||||||||
|
Net income attributable to Green Plains |
42,237 | 41,749 | 32,314 | 43,203 | ||||||||
|
Basic earnings per share attributable to Green Plains |
1.12 | 1.11 | 0.86 | 1.30 | ||||||||
|
Diluted earnings per share attributable to Green Plains |
1.07 | 1.03 | 0.82 | 1.04 | ||||||||
|
Three Months Ended |
||||||||||||
|
December 31, |
September 30, |
June 30, |
March 31, |
|||||||||
|
Revenues |
$ |
712,869 |
$ |
757,971 |
$ |
804,696 |
$ |
765,476 | ||||
|
Cost of goods sold |
640,697 | 716,947 | 772,085 | 738,262 | ||||||||
|
Operating income |
51,051 | 25,534 | 18,562 | 12,704 | ||||||||
|
Other expense |
(10,219) | (8,491) | (8,309) | (8,551) | ||||||||
|
Income tax expense |
15,371 | 7,633 | 4,288 | 1,598 | ||||||||
|
Net income attributable to Green Plains |
25,461 | 9,410 | 5,965 | 2,555 | ||||||||
|
Basic earnings per share attributable to Green Plains |
0.84 | 0.31 | 0.20 | 0.09 | ||||||||
|
Diluted earnings per share attributable to Green Plains |
0.65 | 0.28 | 0.19 | 0.08 | ||||||||
F-34
Schedule I – Condensed Financial Information of the Registrant (Parent Company Only)
GREEN PLAINS INC.
CONDENSED FINANCIAL INFORMATION OF THE REGISTRANT
STATEMENTS OF BALANCE SHEET – PARENT COMPANY ONLY
(in thousands)
|
December 31, |
||||||
|
2014 |
2013 |
|||||
|
ASSETS |
||||||
|
Current assets |
||||||
|
Cash and cash equivalents |
$ |
252,689 |
$ |
143,852 | ||
|
Restricted cash |
6,309 |
- |
||||
|
Accounts receivable, including amounts from related parties of |
||||||
|
$196 and $69, respectively |
268 | 128 | ||||
|
Prepaid expenses and other |
893 | 860 | ||||
|
Due from subsidiaries |
30,823 | 20,987 | ||||
|
Total current assets |
290,982 | 165,827 | ||||
|
Property and equipment, net |
4,147 | 3,052 | ||||
|
Investment in consolidated subsidiaries |
611,311 | 568,410 | ||||
|
Other assets |
18,323 | 19,374 | ||||
|
Total assets |
$ |
924,763 |
$ |
756,663 | ||
|
LIABILITIES AND STOCKHOLDERS' EQUITY |
||||||
|
Current liabilities |
||||||
|
Accounts payable |
$ |
2,098 |
$ |
4,310 | ||
|
Accrued liabilities |
20,057 | 14,344 | ||||
|
Current maturities of long-term debt |
- |
188 | ||||
|
Total current liabilities |
22,155 | 18,842 | ||||
|
Long-term debt |
100,845 | 186,654 | ||||
|
Deferred income taxes |
4,010 | 5,446 | ||||
|
Other liabilities |
304 | 363 | ||||
|
Total liabilities |
127,314 | 211,305 | ||||
|
Stockholders' equity |
||||||
|
Common stock |
45 | 38 | ||||
|
Additional paid-in capital |
569,431 | 468,962 | ||||
|
Retained earnings |
299,101 | 148,505 | ||||
|
Accumulated other comprehensive loss |
(5,320) | (6,339) | ||||
|
Treasury stock |
(65,808) | (65,808) | ||||
|
Total stockholders' equity |
797,449 | 545,358 | ||||
|
Total liabilities and stockholders' equity |
$ |
924,763 |
$ |
756,663 | ||
|
|
See accompanying notes to the condensed financial statements.
F-35
GREEN PLAINS INC.
CONDENSED FINANCIAL INFORMATION OF THE REGISTRANT
STATEMENTS OF OPERATIONS – PARENT COMPANY ONLY
(in thousands)
|
Year Ended December 31, |
||||||||
|
2014 |
2013 |
2012 |
||||||
|
Selling, general and administrative expenses |
$ |
- |
$ |
88 |
$ |
- |
||
|
Operating (loss) |
- |
(88) |
- |
|||||
|
Other income (expense) |
||||||||
|
Interest income |
462 | 192 | 112 | |||||
|
Interest expense |
(9,539) | (8,742) | (7,165) | |||||
|
Other, net |
(3,860) | (2,647) | (2,399) | |||||
|
Total other expense |
(12,937) | (11,197) | (9,452) | |||||
|
Loss before income taxes |
(12,937) | (11,285) | (9,452) | |||||
|
Income tax benefit |
4,361 | 5,018 | 218 | |||||
|
Loss before equity in earnings of subsidiaries |
(8,576) | (6,267) | (9,234) | |||||
|
Equity in earnings of consolidated subsidiaries |
168,080 | 49,658 | 21,013 | |||||
|
Net income |
$ |
159,504 |
$ |
43,391 |
$ |
11,779 | ||
See accompanying notes to the condensed financial statements.
F-36
GREEN PLAINS INC.
CONDENSED FINANCIAL INFORMATION OF THE REGISTRANT
STATEMENTS OF CASH FLOWS – PARENT COMPANY ONLY
(in thousands)
|
Year Ended December 31, |
||||||||
|
2014 |
2013 |
2012 |
||||||
|
Cash flows from operating activities: |
$ |
(7,653) |
$ |
(1,924) |
$ |
(279) | ||
|
Net cash provided (used) by operating activities |
(7,653) | (1,924) | (279) | |||||
|
Cash flows from investing activities: |
||||||||
|
Purchases of property and equipment |
(2,829) | (652) | (616) | |||||
|
Proceeds on disposal of assets, net |
- |
42 |
- |
|||||
|
Investment in subsidiaries, net |
125,179 | (53,754) | 54,426 | |||||
|
Issuance of notes receivable from subsidiaries, |
||||||||
|
net of payments received |
9,500 | 15,356 | (6,832) | |||||
|
Investments in unconsolidated subsidiaries |
(4,309) | (3,264) | (7,998) | |||||
|
Net cash provided (used) by investing activities |
127,541 | (42,272) | 38,980 | |||||
|
Cash flows from financing activities: |
||||||||
|
Proceeds from the issuance of long-term debt |
- |
120,000 |
- |
|||||
|
Payments of principal on long-term debt |
(238) | (1,841) | (204) | |||||
|
Payments on short-term borrowings |
- |
(27,162) |
- |
|||||
|
Payments for repurchase of common stock |
- |
- |
(10,445) | |||||
|
Change in restricted cash |
(6,309) |
- |
- |
|||||
|
Payment of cash dividends |
(8,908) | (2,426) |
- |
|||||
|
Payment of loan fees |
- |
(5,072) |
- |
|||||
|
Proceeds from the exercise of stock options |
4,404 | 4,498 |
- |
|||||
|
Other, net |
- |
- |
452 | |||||
|
Net cash provided (used) by financing activities |
(11,051) | 87,997 | (10,197) | |||||
|
Net change in cash and equivalents |
108,837 | 43,801 | 28,504 | |||||
|
Cash and cash equivalents, beginning of period |
143,852 | 100,051 | 71,547 | |||||
|
Cash and cash equivalents, end of period |
$ |
252,689 |
$ |
143,852 |
$ |
100,051 | ||
See accompanying notes to the condensed financial statements.
F-37
GREEN PLAINS INC.
CONDENSED FINANCIAL INFORMATION OF THE REGISTRANT
NOTES TO CONDENSED FINANCIAL STATEMENTS – PARENT COMPANY ONLY
1. BASIS OF PRESENTATION
References to the “Parent Company” refer to Green Plains Inc., a holding company that conducts substantially all of its business operations through its subsidiaries. As specified in certain of its subsidiaries’ debt agreements, there are restrictions on the Parent Company’s ability to obtain funds from certain of its subsidiaries through dividends, loans or advances. See Note 10 – Debt in the Notes to the Consolidated Financial Statements for further information. Accordingly, these condensed financial statements have been presented on a “parent-only” basis. Under a parent-only presentation, the Parent Company’s investments in its consolidated subsidiaries are presented under the equity method of accounting. These financial statements should be read in conjunction with Green Plains Inc.’s audited consolidated financial statements included elsewhere herein.
2. COMMITMENTS AND CONTINGENCIES
Operating Leases
The Parent Company leases certain facilities under agreements that expire at various dates. For accounting purposes, rent expense is based on a straight-line amortization of the total payments required over the lease term. The Parent Company incurred lease expenses of $1.0 million, $0.9 million and $0.9 million during the years ended December 31, 2014, 2013 and 2012, respectively. Aggregate minimum lease payments under these agreements for future fiscal years are as follows (in thousands):
|
Year Ending December 31, |
Amount |
||
|
2015 |
$ |
1,085 | |
|
2016 |
1,088 | ||
|
2017 |
296 | ||
|
2018 |
120 | ||
|
2019 |
122 | ||
|
Thereafter |
249 | ||
|
Total |
$ |
2,960 | |
Parent Guarantees
The various operating subsidiaries of the Parent Company enter into contracts as a routine part of their business activities. Examples of these contracts include financing and lease arrangements, commodity purchase and sale agreements, and agreements with vendors. In certain instances, the contractual obligations of such subsidiaries are guaranteed by, or otherwise supported by, the Parent Company. As of December 31, 2014, the Parent Company had $187.9 million in guarantees of subsidiary contracts and indebtedness.
3. DEBT
Parent Company debt as of December 31, 2014 is comprised of the 3.25% Convertible Senior Notes due 2018, or the 3.25% Notes. Scheduled long-term debt repayments, excluding the effects of any debt discounts and including full accretion of the 3.25% Notes at their maturity, are as follows (in thousands):
|
Year Ending December 31, |
Amount |
||
|
2015 |
$ |
- |
|
|
2016 |
- |
||
|
2017 |
- |
||
|
2018 |
120,000 | ||
|
2019 |
- |
||
|
Thereafter |
- |
||
|
Total |
$ |
120,000 | |
F-38