Attached files
| file | filename |
|---|---|
| 8-K - ALBANY INTERNATIONAL CORP. 8-K - ALBANY INTERNATIONAL CORP /DE/ | a51036288.htm |
| EX-99.1 - EXHIBIT 99.1 - ALBANY INTERNATIONAL CORP /DE/ | a51036288ex991.htm |
Exhibit 99.2
February 9, 2015 Albany International Corp. Q4 Financial Performance
‘Non‐GAAP’ Items and Forward‐Looking Statements This presentation contains certain items, such as net income attributable to the Company, excluding adjustments (absolute as well as per‐share), earnings before interest, taxes, depreciation and amortization (EBITDA), adjusted EBITDA and net debt, that could be considered ‘non‐GAAP’ financial measures under SEC rules. We think such items provide useful information to investors regarding the Company’s operational performance. This presentation also may contain statements, estimates, or projections that constitute “forward‐looking statements” as defined under U.S. federal securities laws. Forward‐looking statements are subject to certain risks and uncertainties that could cause actual results to differ materially from the Company’s historical experience and our present expectations or projections. We disclaim any obligation to update any information in this presentation to reflect any changes or developments after the date on the cover page. Certain additional disclosures regarding our use of these ‘non‐GAAP’ items and forward‐looking statements are set forth in our fourth‐quarter earnings press release dated February 9, 2015, and in our SEC filings, including our most recent quarterly reports and our annual reports for the years ended December 31, 2011, 2012, and 2013. Our use of such items in this presentation is subject to those additional disclosures, which we urge you to read. 2
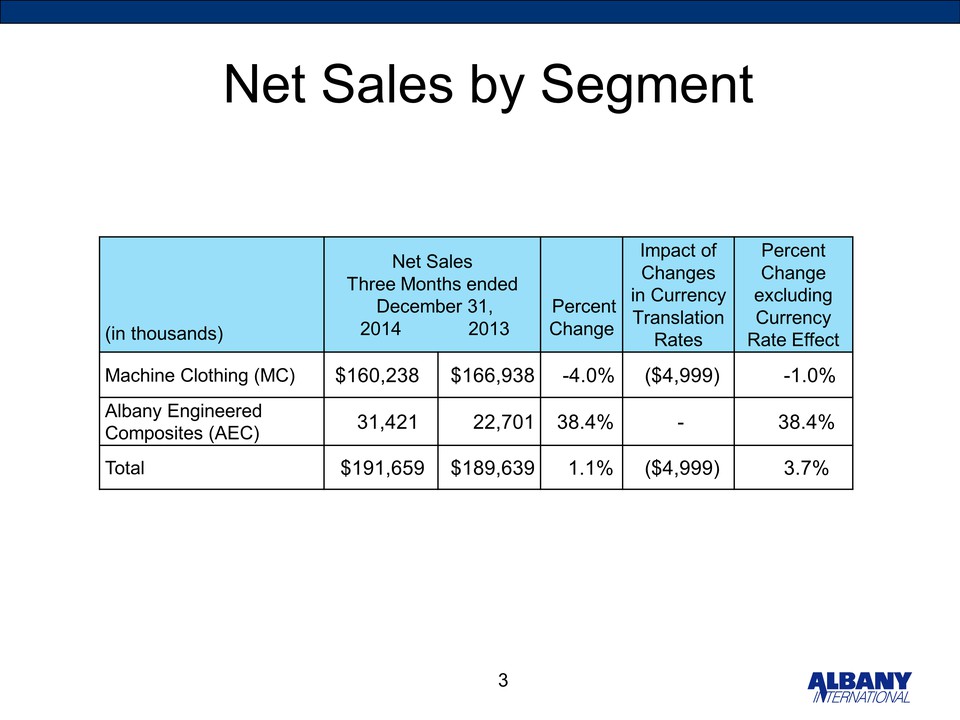
Net Sales by Segment (in thousands) Net Sales Three Months ended December 31, 2014 2013 Percent Change Impact of Changes in Currency Translation Rates Percent Change excluding Currency Rate Effect Machine Clothing (MC) $160,238 $166,938 -4.0% ($4,999) -1.0% Albany Engineered Composites (AEC) 31,421 22,701 38.4% - 38.4% Total $191,659 $189,639 1.1% ($4,999) 3.7% 3
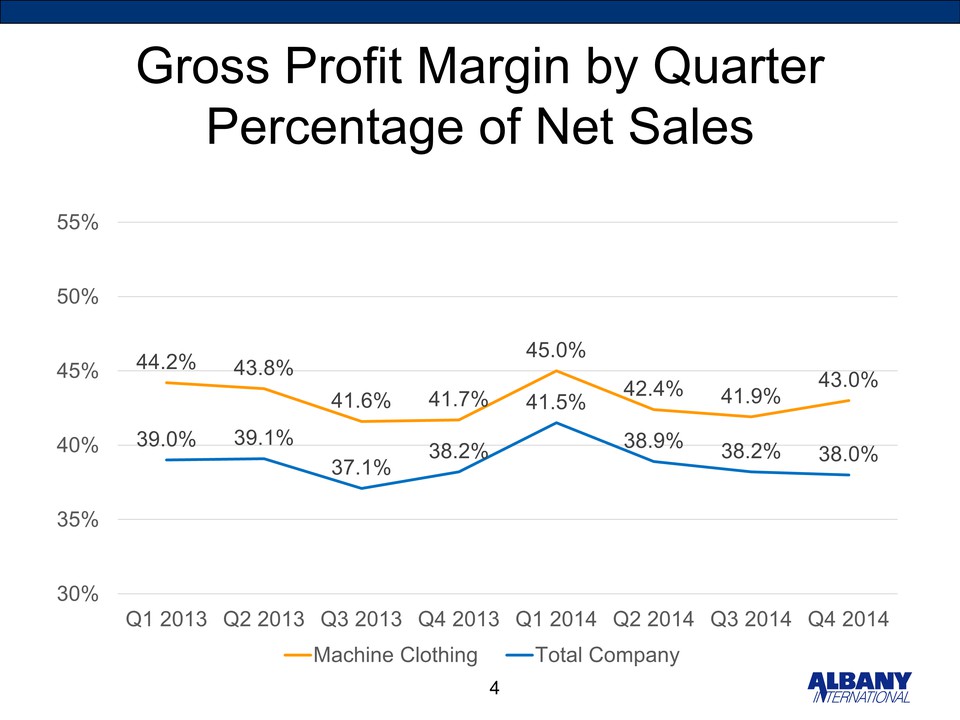
Gross Profit Margin by Quarter Percentage of Net Sales 44.2% 43.8% 41.6% 41.7% 45.0% 42.4% 41.9% 43.0% 39.0% 39.1% 37.1% 38.2% 41.5% 38.9% 38.2% 38.0% 30% 35% 40% 45% 50% 55% Q1 2013 Q2 2013 Q3 2013 Q4 2013 Q1 2014 Q2 2014 Q3 2014 Q4 2014 Machine Clothing Total Company 4
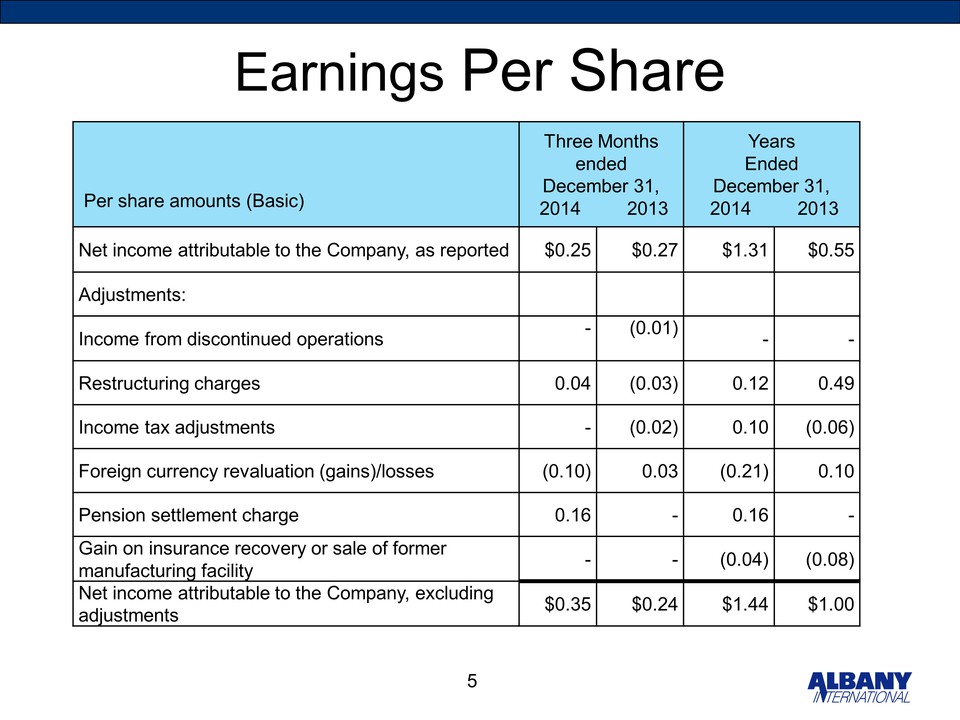
Earnings Per Share Per share amounts (Basic) Three Months ended December 31, 2014 2013 Years Ended December 31, 2014 2013 Net income attributable to the Company, as reported $0.25 $0.27 $1.31 $0.55 Adjustments: Income from discontinued operations - (0.01) - - Restructuring charges 0.04 (0.03) 0.12 0.49 Income tax adjustments - (0.02) 0.10 (0.06) Foreign currency revaluation (gains)/losses (0.10) 0.03 (0.21) 0.10 Pension settlement charge 0.16 - 0.16 - Gain on insurance recovery or sale of former manufacturing facility - - (0.04) (0.08) Net income attributable to the Company, excluding adjustments $0.35 $0.24 $1.44 $1.00 5
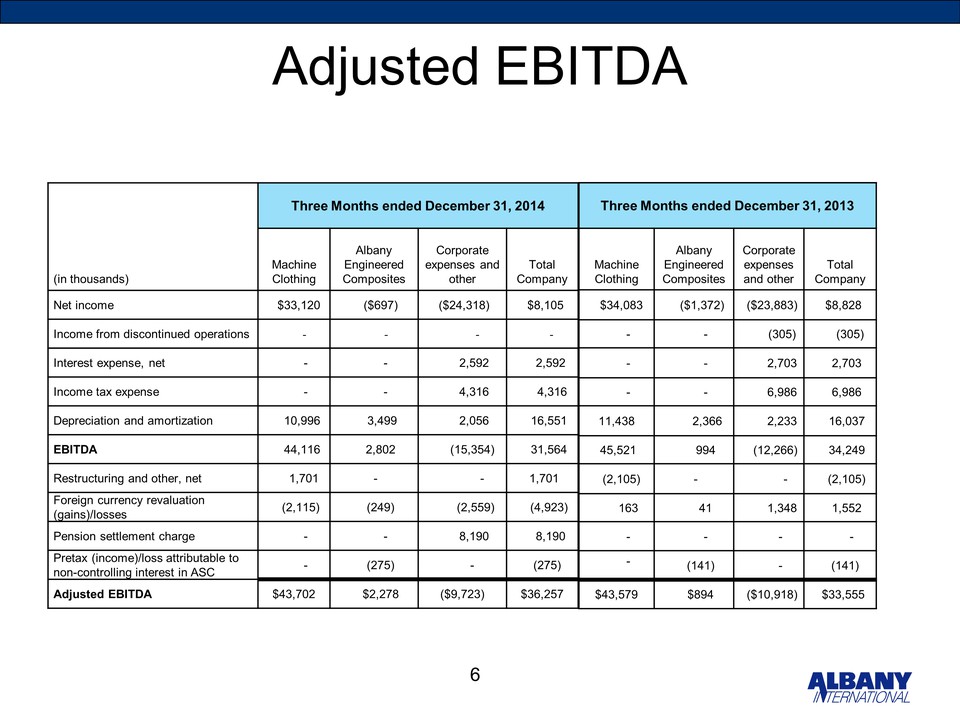
Adjusted EBITDA (in thousands) Three Months ended December 31, 2014 Machine Clothing Albany Engineered Composites Corporate expenses and other Total Company Net income $33,120 ($697) ($24,318) $8,105 Income from discontinued operations - - - - Interest expense, net - - 2,592 2,592 Income tax expense - - 4,316 4,316 Depreciation and amortization 10,996 3,499 2,056 16,551 EBITDA 44,116 2,802 (15,354) 31,564 Restructuring and other, net 1,701 - - 1,701 Foreign currency revaluation (gains)/losses (2,115) (249) (2,559) (4,923) Pension settlement charge - - 8,190 8,190 Pretax (income)/loss attributable to non-controlling interest in ASC - (275) - (275) Adjusted EBITDA $43,702 $2,278 ($9,723) $36,257 Three Months ended December 31, 2013 Machine Clothing Albany Engineered Composites Corporate expenses and other Total Company $34,083 ($1,372) ($23,883) $8,828 - - (305) (305) - - 2,703 2,703 - - 6,986 6,986 11,438 2,366 2,233 16,037 45,521 994 (12,266) 34,249 (2,105) - - (2,105) 163 41 1,348 1,552 - - - - - (141) - (141) $43,579 $894 ($10,918) $33,555 6
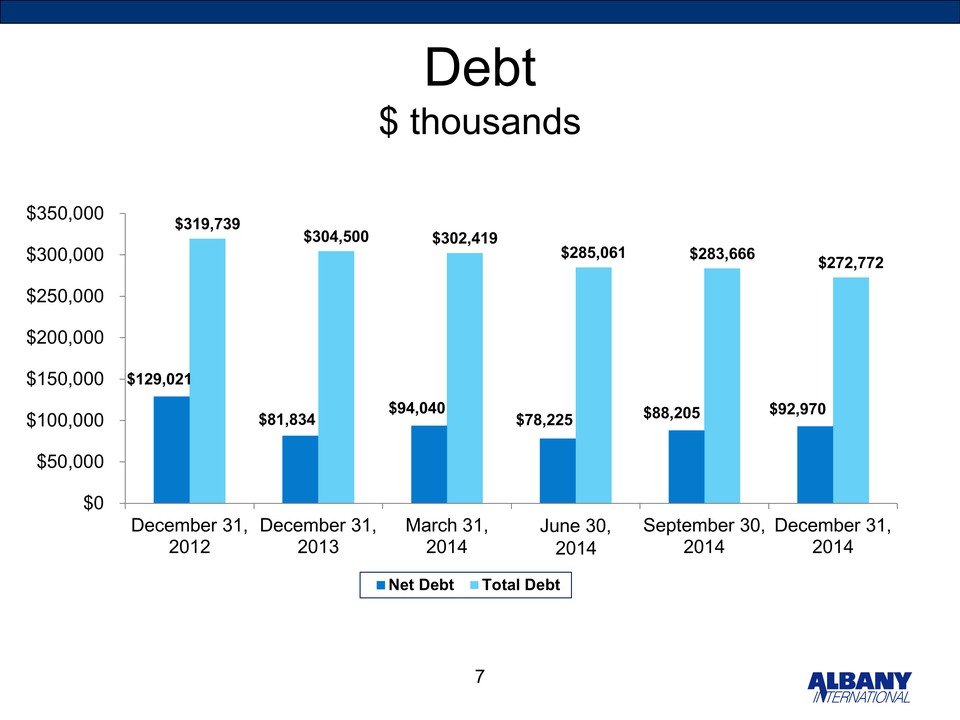
Debt $ thousands $129,021 $81,834 $94,040 $78,225 $88,205 $92,970 $319,739 $304,500 $302,419 $285,061 $283,666 $272,772 $0 $50,000 $100,000 $150,000 $200,000 $250,000 $300,000 $350,000 December 31, 2012 December 31, 2013 March 31, 2014 June 30, 2014 September 30, 2014 December 31, 2014 Net Debt Total Debt 7