Attached files
| file | filename |
|---|---|
| 8-K - 8-K - Pioneer PE Holding LLC | d866648d8k.htm |
| EX-99.3 - EX-99.3 - Pioneer PE Holding LLC | d866648dex993.htm |
| EX-99.1 - EX-99.1 - Pioneer PE Holding LLC | d866648dex991.htm |
 Investor Presentation
February 2015
Exhibit 99.2 |
 2
Forward Looking Statements and Cautionary Statements
Forward-Looking Statements The information in
this presentation includes “forward-looking statements” that are made pursuant to the Safe Harbor Provisions of the Private Securities Litigation Reform Act of 1995. All
statements, other than statements of historical fact included in this presentation, regarding our
strategy, future operations, financial position, estimated revenues and losses, projected costs,
prospects, plans and objectives of management are forward-looking statements. When used in this
presentation, the words “could,” “believe,” “anticipate,” “intend,” “estimate,” “expect,” “project” and
similar expressions are intended to identify forward-looking statements, although not all
forward-looking statements contain such identifying words. These forward-looking statements are based on
Parsley Energy, Inc.’s (“Parsley Energy,” “Parsley,” or the
“Company”) current expectations and assumptions about future events and are based on currently available information as to the outcome
and timing of future events. We caution you that these forward-looking statements are subject to
all of the risks and uncertainties, most of which are difficult to predict and many of which are beyond
our control, incident to the exploration for and development, production, gathering and sale of oil
and natural gas. These risks include, but are not limited to, commodity price volatility, inflation, lack
of availability of drilling and production equipment and services, environmental risks, drilling and
other operating risks, regulatory changes, the uncertainty inherent in estimating reserves and in
projecting future rates of production, cash flow and access to capital, the timing of development
expenditures and the risk factors discussed in or referenced in the prospectus prepared in
connection with this offering.
You are cautioned not to place undue reliance on any forward-looking statements, which speak only
as of the date of this presentation. Except as otherwise required by applicable law, we disclaim
any duty to update any forward-looking statements, all of which are expressly qualified by the
statements in this section, to reflect events or circumstances after the date of this presentation.
Our production forecasts and expectations for future periods are dependent upon many assumptions,
including estimates of production decline rates from existing wells and the undertaking and
outcome of future drilling activity, which may be affected by significant commodity price declines or
drilling cost increases. Industry and Market Data
This presentation has been prepared by Parsley and includes market data and other statistical
information from third-party sources, including independent industry publications, government
publications or other published independent sources. Although Parsley believes these third-party
sources are reliable as of their respective dates, Parsley has not independently verified the
accuracy or completeness of this information. Some data are also based on the Parsley’s good
faith estimates, which are derived from its review of internal sources as well as the third-party
sources described above.
Oil & Gas Reserves This presentation
provides disclosure of the Parsley’s proved reserves, which are those quantities of oil and gas, which, by analysis of geoscience and engineering data, can be estimated with
reasonable certainty to be economically producible—from a given date forward, from known
reservoirs, and under existing economic conditions (using unweighted average 12-month first day of
the month prices), operating methods, and government regulations—prior to the time at which
contracts providing the right to operate expire, unless evidence indicates that renewal is reasonably
certain, regardless of whether deterministic or probabilistic methods are used for the estimation.
In this presentation, proved reserves attributable to Parsley as of 12/31/14 are estimated utilizing
SEC reserve recognition standards and pricing assumptions based on SEC pricing of $91.48 / bbl
crude, $4.35 / mmbtu gas, and adjusted realized pricing of $85.99 / bbl crude, $35.27 / bbl NGL, and
$4.281 / mcf residue gas. References to our estimated proved reserves as of 12/31/14 are
derived from our proved reserve report (the “NSAI Report”) prepared by Netherland, Sewell
& Associates, Inc. (“NSAI”). PV-10 would be $717 million if based on internal estimates at realized
pricing of NYMEX strip prices on 1/29/2015.
We may use the term “expected ultimate recoveries” (“EURs”) or other descriptions
of volumes of reserves, which terms include quantities of oil and gas that may not meet the SEC’s definitions of
proved, probable and possible reserves, and which the SEC's guidelines strictly prohibit Parsley from
including in filings with the SEC. Unless otherwise stated in this presentation, such estimates
have been prepared internally by our engineers and management without review by independent engineers.
These estimates are by their nature more speculative than estimates of proved, probable and
possible reserves and accordingly are subject to substantially greater risk of being actually realized, particularly in areas or zones where there has been limited or no drilling history.
We include these estimates to demonstrate what we believe to be the potential for future drilling and
production by the company. Actual locations drilled and quantities that may be ultimately
recovered from our properties will differ substantially. In addition, we have made no commitment to
drill all of the drilling locations. Ultimate recoveries will be dependent upon numerous factors
including actual encountered geological conditions, the impact of future oil and gas pricing,
exploration and development costs, and our future drilling decisions and budgets based upon our future
evaluation of risk, returns and the availability of capital and, in many areas, the outcome of
negotiation of drilling arrangements with holders of adjacent or fractional interest leases. Our estimates
may change significantly as development of our properties provide additional data and therefore actual
quantities that may ultimately be recovered will likely differ from these estimates. Our related
expectations for future periods are dependent upon many assumptions, including estimates of production
decline rates from existing wells, the undertaking and outcome of future drilling activity and
activity that may be affected by significant commodity price declines or drilling cost increases.
|
 3
Surface
Effective
(6)
Midland Basin Core
49,504
221,604
Midland Basin Tier 1
30,131
149,204
Midland Basin Other
26,474
----------
Total Midland Basin
106,109
370,808
S. Delaware Basin
30,238
----------
Total Permian Basin
136,347
370,808
Parsley Energy Overview
NYSE Symbol: PE
Market Cap: $2,484 MM
(1)
Net Debt: $395 MM
(2)
Enterprise Value: $2,879 MM
(3)
Pro Forma Net Acreage
(5)
Market Snapshot
Premier Acreage Position
Investment Highlights
4Q14 Production: 18.2 MBoe/d
Proved Reserves: 91 MMBoe
(4)
Horizontal well productivity among best in Midland Basin
Compelling well economics even with depressed oil prices
Recent acquisitions enhance premier asset base, now with 1,800+
horizontal drilling locations in the heart of Midland Basin
Disciplined capital allocation optimizes returns and financial strength, while
also providing significant growth
Value upside from downspacing, de-risking of additional formations, and
promising S. Delaware exploratory program
(1) Based on 2/5/2015 closing price and pro forma for common stock offering priced
2/6/2015 (2) As of 12/31/2014 pro forma for $224 MM of net proceeds
from common stock offering priced 2/6/2015 (3) Based on market cap as of 2/5/2015 and net debt as of
12/31/2014, both pro forma for common stock offering priced 2/6/2015. (4) Per NSAI
12/31/14 reserve report. (5) As of end of 4Q14 pro forma for acquisitions.
(6) Includes the following intervals: Spraberry, Wolfcamp A, B, and C, Cline, and Atoka.
Production and Reserves
•
Liquids: 77%
•
Proved Developed: 51%
•
Midland Basin Core: 85%
—
Peak 30-day IP per 1,000’
of 197 Boe/d in Core acreage
—
690 MBoe EUR type curve indicates 20% ROR at NYMEX strip
pricing; 20% cost reductions would increase ROR to more than 30%
—
Actual production has meaningfully exceeded the front end of the
type curve, enhancing returns
—
Efficient 2015 spending plan, with estimated production up 30% Y/Y
to 18.0-19.0 MBoe/d on estimated capex of $225-250 MM
—
Ample pro forma liquidity of $519 MM at end of 4Q14 based on
committed
portion
($365
MM)
of
$562
MM
borrowing
base
(2)
—
Significantly hedged, with 94% and 126% of estimated 2015 oil
production hedged in 2015 and 2016, respectively |
 4
2015 Capital Program –
Flexible and Efficient
Efficient spending plan with Y/Y average and exit to exit
production growth on sharply reduced capital budget
Estimated capex of $225-$250 million, representing less than
50% of 2014 capital expenditures
Expect to average 3 horizontal rigs in 2015
—
Shape of activity to reflect anticipated uplift in returns
driven by lower service costs
2 horizontal rigs on average in 1H15
4 horizontal rigs on average in 2H15
—
Expect to complete 30-35 gross horizontal wells with
average working interest of 90%+
—
High-grading drilling program, with approximately 85% of
capex targeted for Core acreage and approximately 80-
90% of planned wells targeting the Wolfcamp B formation
To hold acreage, plan to operate 1 vertical rig on an as-needed
basis
—
Expect to complete 18-22 gross vertical wells with
average working interest of 90%+
Able to ramp up or slow down as macro and cost environment
warrant
—
Current plan generates significant momentum heading
into 2016
Estimated 2015 Capex Mix
2015 Capital Program Overview
10% Vt.
75% Hz.
Drilling &
Completion
~85%
Facilities &
Other
~15%
Midland
Basin Core
~85%
Midland
Basin Tier I
~15%
Capital Discipline
Horizontal Drilling Program
Vertical Drilling Program
Flexibility |
 5
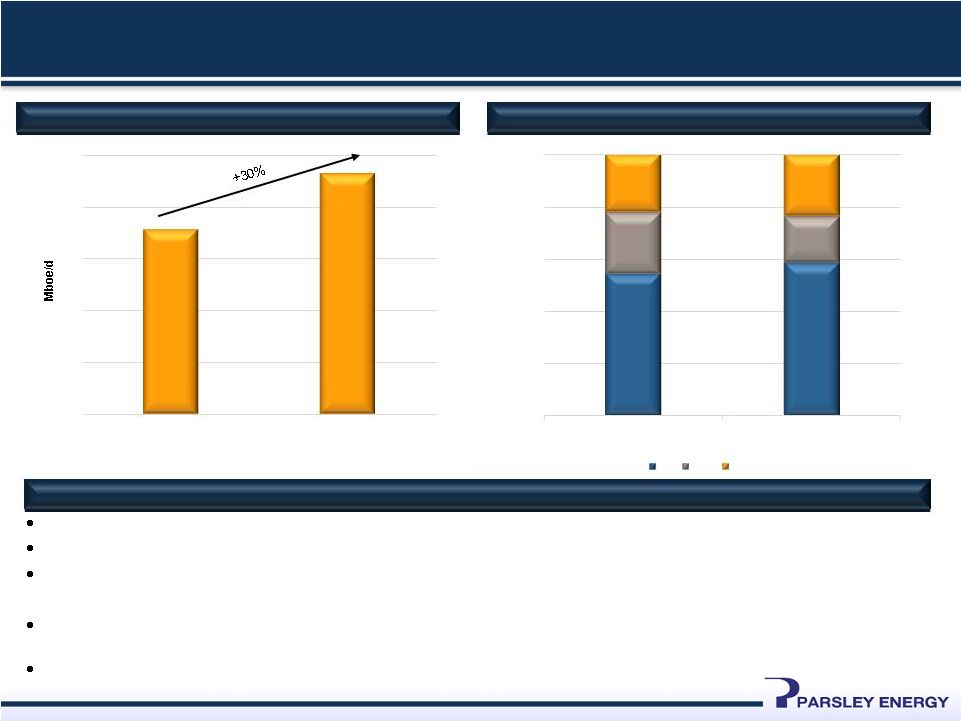
Efficient Production Growth with Improving Margins
Estimated production between 18.0 and 19.0 MBoe/d, up from 14.2 MBoe/d in
2014 30% Y/Y production growth at midpoint of guidance range
After weather-related disruptions in January, production back to pre-storm
level —
Most
recent
7-day
average
production
greater
than
20
MBoe/d
(1/23/15
–
1/29/15)
Relatively shallow decline rate from legacy vertical production and robust
productivity from new horizontal wells supports production growth profile in
2015 and beyond Mix shift toward oil
Estimated Y/Y Production Growth
Estimated 2015 Production Mix
2015 Production Profile
0
4
8
12
16
20
2014
2015E
0%
20%
40%
60%
80%
100%
2014
2015E
Oil
Gas
NGL |
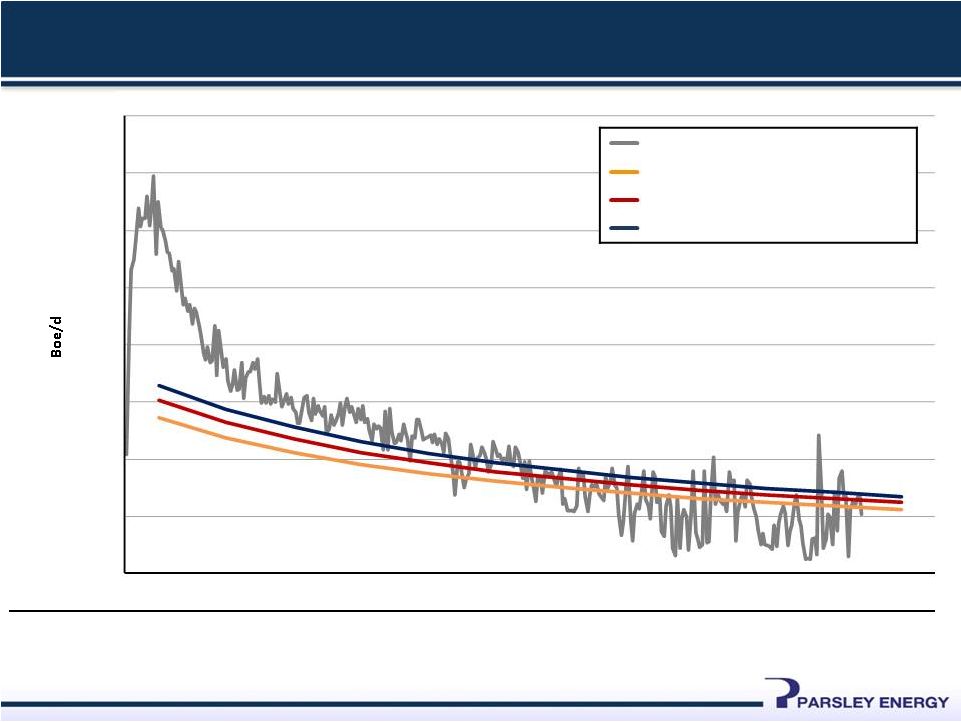 Highly
Productive Horizontal Wells 6
Months
1
2
3
4
5
6
7
8
9
10
11
12
Well Count
in PE Average
20
18
14
12
9
6
5
4
3
2
1
0
0
200
400
600
800
1,000
1,200
1,400
1,600
PE Average Horizontal Well Production
(1)
690 MBoe EUR Type Curve
(2)
10% EUR Increase: 760 MBoe
20% EUR Increase: 830 MBoe
(1) Normalized to 7,000’ stimulated lateral and for downtime of 24 hours or more. (2) Derived from public well data
as of 10/14; see slide 21 for additional information. |
 7
Attractive Well Economics Become More Compelling with Service Cost
Declines and EUR Improvement
690 MBoe EUR Type Curve
Rate of Return Sensitivity to D&C Costs
Type Well Assumption
10% EUR Increase: 760 MBoe
Rate of Return Sensitivity to D&C Costs
20% EUR Increase: 830 MBoe
Rate of Return Sensitivity to D&C Costs
7
Pricing
Oil: $49.03 -
$66.13
Gas: $2.81 -
$3.82
NGL: 40% of Oil Price
Lateral Length
D&C Cost
LOE
—
Gas: $3.50
—
NGL: 40% of Oil Price
—
Varies with Sensitivity
—
7,000’
stimulated interval
—
100% WI
—
75% NRI
Strip Pricing (1/29/2015)
$5.8 MM -
$7.2MM
—
$7,500 / Month Fixed
—
$2.00 / BO / Month
Variable
Interest |
 8
Bolt-on Acquisitions Enhance Premier Asset Base
Transaction Summary
Midland Basin Position and Acquisition
Closed on 8,450 net acres, primarily in Reagan County, for $139 million
Bolt-on assets in heart of Horizontal Focus Area
Based on offset results, anticipate attractive well economics on
acquired properties even at depressed commodity prices
100% operated, 73% HBP, with 75% NRI and average working interest
of 91%
Full rights to Wolfcamp and below across acquired acreage
Adds 199 net horizontal locations
to drilling inventory
(191 Core; 8 Tier 1)
(1)
Average stimulated lateral length of approximately 6,300’
Core: approximately 6,400’
Tier 1: approximately 4,500’
Adds 410 net vertical locations to drilling inventory
(1) Acquired location count assumes recently approved 330’ offset from lease line and 660’
between well spacing. |
 Acquired
Properties Surrounded by Strong Wells (1) Liquids % based on the period for
which the 30-day IP is presented. 9
Horizontal well productivity
among best in Midland Basin
Lower drilling costs in Tier 1
enhance returns
Stimulated
Number of
Peak 24-hr IP
Peak 30-day IP
Peak 30-day IP
Number
Well Name
County
Well Zone
Lateral Length
Stages
(Boe/d)
(Boe/d)
per 1,000' Lateral
% Liquids
(1)
Core
1
Dusek 45-1HB
Upton
Wolfcamp B
9,061
39
2,044
1,592
176
92
2
Shackelford 7-1HB
Upton
Wolfcamp B
4,571
21
1,441
796
174
91
3
Dusek 44-1HB
Upton
Wolfcamp B
4,697
22
1,569
1,063
226
91
4
Shackelford 7-2HB
Upton
Wolfcamp B
4,874
21
1,134
878
180
89
5
Skaggs 8-2HB
Upton
Wolfcamp B
4,799
22
1,351
992
207
92
7
Elwood 16-21-1HB
Upton
Wolfcamp B
7,645
37
1,750
1,525
199
92
9
Mary 18-1HB
Upton
Wolfcamp B
4,681
24
1,399
992
212
92
10
JRS Farms 24BC-1HB
Upton
Wolfcamp B
4,637
25
1,255
974
210
92
13
Dusek 44-1HA
Upton
Wolfcamp A
4,968
25
1,269
921
185
90
Average
197
91
Tier 1
6
Char Hughes 1HB
Reagan
Wolfcamp B
5,785
28
1,262
891
154
92
8
Char Hughes 2HB
Reagan
Wolfcamp B
5,879
29
1,036
879
150
91
11
Tucker 166-1HB
Reagan
Wolfcamp B
4,515
25
1,312
956
212
88
12
Tucker 166-2HB
Reagan
Wolfcamp B
4,489
27
1,023
804
179
89
Average
174
90 |
 10
Strong Liquidity Position Enhances Flexibility
Strong balance sheet to fund drilling plan through 2016,
with $519 million of pro forma liquidity based on
committed portion of borrowing base
—
Pro forma cash of $154 million as of December 31,
2014
—
Undrawn borrowing base of $562 million with a
current commitment of $365 million
Estimated 2015 development capex of $225-$250
million
Plenty of room to accelerate heading into 2016
Favorable maturity schedule, with 7.5% senior notes not
due until 2022
Pro
Forma
Liquidity
(1)
Favorable Debt Maturity Schedule
($ millions)
First lien borrowing base
$562
Committed portion of borrowing base
$365
Pro Forma Cash
154
Total liquidity
$519
(2)
7.50% Senior Notes
$0
$400
$600
2014
2015
2016
2017
2018
2019
2020
2021
2022
Senior Credit Facility -
Borrowing Base
$562
$550
$200
Note: Revolver and cash balances as of 12/31/14. (1) Pro forma for $224 million
net proceeds from common stock offering priced 2/6/2015; assumes all proceeds used to pay down first lien revolver.
(2) Parsley has chosen to limit the lenders’ aggregate commitment to $365 million. |
 Capturing Hedge Value
Capture unrealized value of hedge position in depressed oil price
environment while retaining upside exposure to improving oil prices
Focused on 2H15 and 2016 given the possibility of additional near-
term downside in the oil market
Turned
unrealized
gains
into
$49
million
of
cash
net
of
the
cost
of
entering new contracts with lower strike prices
Total barrels hedged unchanged:
—
94% and 126% of estimated 2015 oil production hedged in
2015 and 2016, respectively
Original long put
Original short put
New long put
New short put
Strategy
Benefits
Illustration of Rolled Position
11
$49 million of
realized value
(with additional
upside potential)
$40
$50
$60
$70
$80
$90
Q3-15
Q4-15
Q1-16
Q2-16
Q3-16
Q4-16
Original position
New position
Parsley monetized a portion of its hedge value by “rolling” future positions to lower put
spreads |
 12
Oil Hedge Position
Oil Positions
(1) When NYMEX price is above call price, PE receives call price. When NYMEX price
is between put price and call price, PE receives NYMEX price. When NYMEX price is between the put price and the
short put price, PE receives put price. When NYMEX price is below the short put
price, PE receives NYMEX price plus the difference between the short put price and put price.
1Q15
2Q15
3Q15
4Q15
1Q16
2Q16
3Q16
4Q16
1Q17
2Q17
Put Spreads (Bbl/day)
5,222
6,264
7,826
10,272
10,989
12,198
14,185
15,326
Put Price ($/Bbl)
$77.29
$77.76
$66.35
$55.00
$55.00
$55.00
$60.17
$59.79
Short Put Price ($/Bbl)
$57.77
$58.16
$50.10
$40.00
$40.00
$40.00
$45.17
$44.79
4,000
3,462
3,424
2,120
2,418
1,648
3,333
3,297
Call Price ($/Bbl)
$113.75
$112.86
$112.86
$114.62
$116.82
$120.00
$115.00
$115.00
Put Price ($/Bbl)
$84.03
$83.10
$83.10
$85.00
$85.00
$85.00
$80.00
$80.00
Short Put Price ($/Bbl)
$62.22
$65.00
$65.00
$65.00
$65.00
$65.00
$60.00
$60.00
Total barrels per day hedged
9,222
9,725
11,250
12,391
13,407
13,846
14,185
15,326
3,333
3,297
-
-
-
-
-
-
-
-
-
-
-
-
-
-
Three
Way
Collars
(1)
(Bbl/day)
$80.21
$79.66
$71.45
$60.13
$60.41
$58.57
$60.17
$59.79
$80.00
$80.00
$0
$10
$20
$30
$40
$50
$60
$70
$80
$90
$100
0
2,000
4,000
6,000
8,000
10,000
12,000
14,000
16,000
Q1-15
Q2-15
Q3-15
Q4-15
Q1-16
Q2-16
Q3-16
Q4-16
Q1-17
Q2-17
Bbls/d Hedged
Weighted Average Long Put Price |
 13
Gas Hedge Position
Natural Gas Positions
(1) When NYMEX price is above call price, PE receives call price. When NYMEX price
is between put price and call price, PE receives NYMEX price. When NYMEX price is between the put price and the
short put price, PE receives put price. When NYMEX price is below the short put
price, PE receives NYMEX price plus the difference between the short put price and put price.
1Q15
2Q15
3Q15
4Q15
Three Way Collars
(1)
(MMBtu/day)
10,000
9,890
9,783
9,783
Call Price ($/MMBtu)
$5.25
$5.25
$5.25
$5.25
Put Price ($/MMBtu)
$4.50
$4.50
$4.50
$4.50
Short Put Price ($/MMBtu)
$3.75
$3.75
$3.75
$3.75
Total MMbtu per day hedged
10,000
9,890
9,783
9,783
$4.50
$4.50
$4.50
$4.50
$0.00
$0.50
$1.00
$1.50
$2.00
$2.50
$3.00
$3.50
$4.00
$4.50
$5.00
0
2,000
4,000
6,000
8,000
10,000
12,000
Q1-15
Q2-15
Q3-15
Q4-15
MMBtu/d
Weighted Average Long Put Price |
 14
Substantial Reserve Growth
Reserve summary, as of 12/31/14, prepared by Netherland, Sewell & Associates,
Inc. (“NSAI”) Drillbit
F&D
of
$19.68/Boe
(1)
Reserves up 66% Y/Y
PDP up 126% Y/Y
PV-10 up 79% Y/Y
Net Proved Reserves
Proved Reserves Allocation
1P PV-10
Oil (Mbbls)
Nat Gas (Mmcf)
NGL (Mbbls)
Total (Mboe)
PV-10 ($MM)
(2)
PDP
23,368
64,829
11,370
45,543
$928
PDNP
179
655
121
409
$7
PUD
24,070
58,161
11,176
44,939
$379
Total Proved
47,617
123,645
22,667
90,891
$1,314
PDP
50%
PDNP
1%
PUD
49%
Liquids
77%
Gas
23%
PDP
71%
PDNP
0%
PUD
29%
(1) Drillbit F&D is defined as expected 2014 development capital cost divided by the sum of
extensions and discoveries and revisions of previous estimates. Revisions of previous estimates include negative
14 MMBoe of reserves associated with reduced vertical well activity over next
five years, and 0.3 MMBoe of pricing revisions. (2) As of 12/31/14; based on SEC pricing of $91.48 / bbl crude, $4.35 / mmbtu gas, and adjusted
realized pricing of $85.99 / bbl crude, $35.27 / bbl NGL, and $4.281 / mcf residue gas. PV-10 of the
Company’s total proved reserves would be $717 million if based on
internal estimates at realized pricing of NYMEX strip prices on 1/29/2015.
|
 15
Promising Southern Delaware Exploration Program
Parsley’s acreage position in the Coyanosa sub-basin, within the Southern
Delaware Basin, has Pennsylvanian-aged rocks in the oil window
Stacked pay potential from Bone Spring down through the Woodford
3 vertical well exploratory program
W
E
Drilling
Testing
Testing
6,000’
7,000’
8,000’
9,000’
10,000’
11,000’
12,000’
16,000’
13,000’
14,000’
15,000’
1 mile
A’
A
Trees Ranch Cross Section
52 Square Mile Proprietary 3D Seismic Data Shoot
Wolfcamp Structure Map
TD early due to
excess
pressure
27-1
–
Successful
Penn
oil
test
–
producing
from
Wolfcamp/Penn;
future
tests
in Bone Spring
47-1 –
Wolfcamp/Penn test at facility constrained rates of 350+ Bo/d and 650+
Mcf/d; successful Woodford oil test; future tests in Bone Spring
17-1 –
TD’d in Mississippian.
No drilling locations have been booked in the area
Proprietary 3D seismic survey confirms limited geohazards across majority of
acreage
position
|
 Appendix |
 17
Premier Acreage Position
Of Parsley’s 49,000+ net acres in the Core area,
approximately 98% are located in the Company’s Horizontal
Focus Area
Strong well results from Parsley and others throughout the
Horizontal Focus Area
Net Surface Acreage
Core
Tier 1
Total
49,504
30,131
79,634
Net Effective Acreage
Core
Tier 1
Total
Lower Spraberry
14,603
16,553
31,156
Wolfcamp A
34,550
26,604
61,154
Wolfcamp B
37,022
26,604
63,626
Wolfcamp C
37,188
26,604
63,792
Cline
49,147
26,604
75,751
Atoka
49,095
26,235
75,329
(1) As of end 4Q14 pro forma for closed acquisitions.
Midland Basin Acreage Map
Midland
Basin
Pro
Forma
Acreage
(1)
Acreage Highlights
Total
221,604
149,204
370,808 |
 18
Substantial Drilling Inventory
100% of Parsley’s Core area horizontal locations are located in the
Company’s Horizontal Focus Area
Potential upside from down-spacing:
Net Horizontal Undrilled Locations
Core
(2)
Tier 1
(3)
Total
(4)
Lower Spraberry
63
89
152
Wolfcamp A
175
121
296
Wolfcamp B
182
117
299
Wolfcamp C
197
123
320
Cline
228
118
346
Atoka
300
108
408
Midland Basin Drilling Inventory
Midland
Basin
Pro
Forma
Drilling
Inventory
(1)
Total
1,145
676
1,821
Inventory Highlights
No horizontal locations attributed to Midland Basin Other or Southern
Delaware acreage
Current
location
count
based
on
870’
spacing
(6 wells/section/zone), except 199 recently acquired locations based
on 330’
lease line offset and 660’
between well spacing
Net Vertical
Drilling
Locations
2,180
913
3,093
Additional
upside
with
wells
permitted
330’
from
lease
line
Downspaced development plan accommodates up to 15
wells/section/zone
(1) As of end 4Q14 pro forma for acquisitions.
(2) Average Core stimulated lateral length - 5,560 ft.
(3) Average Tier 1 stimulated lateral length - 4,930 ft.
(4) Average Core and Tier 1 stimulated lateral length - 5,326 ft.
|
 19
Disclaimer
The Horizontal Type Curve was prepared by Parsley’s internal reserve engineers
by conducting a decline curve analysis of third party production data
submitted to the Texas Rail Road Commission for 106 horizontal wells drilled since 2011 in Reagan, Upton and Midland
counties. The Horizontal Type Curve is not based on Parsley production data and has
not been reviewed by Parsley’s independent reserve engineers. The
Horizontal Type Curve is subject to numerous limitations and may not be representative of the type curves or ultimate
recoveries achievable on Parsley’s Midland Basin horizontal drilling
inventory. For example: Investors are cautioned not to place undue reliance
on the Horizontal Type Curve. Parsley’s actual production results and ultimate recoveries
are likely to differ substantially.
Of the 106 wells utilized by Parsley in the decline curve analysis, 30 are located
in Upton County, 5 in Midland County and 71 in Reagan County. To date,
Parsley has drilled 20 horizontal wells (1 in Midland County, 12 in Upton County, 6 in Reagan County and 1 in Irion
County) and the majority of Parsley’s horizontal drilling locations are in
Upton and Reagan Counties, where there is even more limited third
party
production
data.
Parsley
cannot
make
assurances
that
the
type
curves
or
ultimate
recoveries
for
horizontal
wells
in
these
locations will be consistent with the Horizontal Type Curve.
The drilling and completion techniques (such as frac design, sand concentration,
lateral length and orientation) for the 106 wells used to calculate the
Horizontal Type Curve are unknown, and may differ significantly from the completion techniques used by Parsley,
which
could
cause
the
results
from
Parsley’s
horizontal
drilling
to
vary
materially
from
the
production
and
ultimate
recoveries
implied
by the Horizontal Type Curve.
For
periods
for
which
insufficient
production
data
is
available,
Parsley
estimated
the
decline
rates
by
utilizing
a
b-factor
of
1.3.
The
actual decline rates may vary significantly from the b-factor utilized in
Parsley’s estimates. The ultimate recoveries implied by the
Horizontal
type
Curve
may
be
overstated
if
the
average
decline
rate
on
Parsley’s
horizontal
wells
is
greater
than
the
rate
implied
by
the b-factor utilized in Parsley’s analysis.
The
historical
production
data
used
in
the
decline
curve
analysis
is
limited,
with
only
106
of
the
wells
having
production
data.
The
decline
curve
analysis
may
yield
different
results
as
more
wells
are
drilled
and
additional
production
data
is
gathered.
In
particular,
Parsley’s estimated decline rates for periods of longer than one year are
based on limited or no data and are therefore based on significant
assumptions and estimates. |