Attached files
| file | filename |
|---|---|
| 8-K - 8-K - COMERICA INC /NEW/ | a2015creditsuisse8-k.htm |

Comerica Incorporated Credit Suisse Financial Services ForumFebruary 10, 2015 Karen ParkhillVice Chairman and Chief Financial Officer Judy LovePresident, Comerica Bank -California Market 2 Safe Harbor Statement Any statements in this presentation that are not historical facts are forward-looking statements as defined in the Private Securities LitigationReform Act of 1995. Words such as “anticipates,” “believes,” “contemplates,” “feels,” “expects,” “estimates,” “seeks,” “strives,” “plans,” “intends,”“outlook,” “forecast,” “position,” “target,” “mission,” “assume,” “achievable,” “potential,” “strategy,” “goal,” “aspiration,” “opportunity,” “initiative,”“outcome,” “continue,” “remain,” “maintain,” “on course,” “trend,” “objective,” “looks forward,” “projects,” “models” and variations of such words andsimilar expressions, or future or conditional verbs such as “will,” “would,” “should,” “could,” “might,” “can,” “may” or similar expressions, as theyrelate to Comerica or its management, are intended to identify forward-looking statements. These forward-looking statements are predicated onthe beliefs and assumptions of Comerica's management based on information known to Comerica's management as of the date of thispresentation and do not purport to speak as of any other date. Forward-looking statements may include descriptions of plans and objectives ofComerica's management for future or past operations, products or services, and forecasts of Comerica's revenue, earnings or other measures ofeconomic performance, including statements of profitability, business segments and subsidiaries, estimates of credit trends and global stability.Such statements reflect the view of Comerica's management as of this date with respect to future events and are subject to risks anduncertainties. Should one or more of these risks materialize or should underlying beliefs or assumptions prove incorrect, Comerica's actual resultscould differ materially from those discussed. Factors that could cause or contribute to such differences are changes in general economic, politicalor industry conditions; changes in monetary and fiscal policies, including changes in interest rates; volatility and disruptions in global capital andcredit markets; changes in Comerica's credit rating; the interdependence of financial service companies; changes in regulation or oversight;unfavorable developments concerning credit quality; the effects of more stringent capital or liquidity requirements; declines or other changes in thebusinesses or industries of Comerica's customers; operational difficulties, failure of technology infrastructure or information security incidents; theimplementation of Comerica's strategies and business initiatives; Comerica's ability to utilize technology to efficiently and effectively develop,market and deliver new products and services; changes in the financial markets, including fluctuations in interest rates and their impact on depositpricing; competitive product and pricing pressures among financial institutions within Comerica's markets; changes in customer behavior; anyfuture strategic acquisitions or divestitures; management's ability to maintain and expand customer relationships; management's ability to retainkey officers and employees; the impact of legal and regulatory proceedings or determinations; the effectiveness of methods of reducing riskexposures; the effects of terrorist activities and other hostilities; the effects of catastrophic events including, but not limited to, hurricanes,tornadoes, earthquakes, fires and floods; changes in accounting standards and the critical nature of Comerica's accounting policies. Comericacautions that the foregoing list of factors is not exclusive. For discussion of factors that may cause actual results to differ from expectations, pleaserefer to our filings with the Securities and Exchange Commission. In particular, please refer to “Item 1A. Risk Factors” beginning on page 12 ofComerica's Annual Report on Form 10-K for the year ended December 31, 2013. Forward-looking statements speak only as of the date they aremade. Comerica does not undertake to update forward-looking statements to reflect facts, circumstances, assumptions or events that occur afterthe date the forward-looking statements are made. For any forward-looking statements made in this presentation or in any documents, Comericaclaims the protection of the safe harbor for forward-looking statements contained in the Private Securities Litigation Reform Act of 1995.

3 Well Positioned in California Steady, Robust Loan and Deposit Growth At 12/31/14 Established presence: 1991 Acquired 10 banks from 1991 to 2001 Today, 104 banking centers in major metropolitan areas 11.8 12.7 14.0 15.4 2011 2012 2013 2014 CAGR+9% California Average Loans($ in billions) California Average Deposits($ in billions) 12.7 14.6 14.7 16.1 2011 2012 2013 2014 CAGR+8% = Banking Centers 1826 45 15 44 Banking Centers in Northern CA 60 Banking Centers in Southern CA 4 CaliforniaLarge, Diverse, Growing Economy At 12/31/14 ● 1Source: US Census Bureau, released 2014 ● 22014 forecast. Source: Comerica Regional Economic Update 12/17/14; Moody’s Analytics ● 3Includes Mining, Utilities, Other Services Comerica Located in 9 of the Top 15 Most Populous Cities: 4 CA Cities1(Population in millions) 0.8 0.8 0.8 0.8 0.9 1.0 1.3 1.4 1.4 1.5 1.6 2.2 2.7 3.9 8.4 Columbus San Francisco Indianapolis Jacksonville Austin San Jose Dallas San Diego San Antonio Phoenix Philadelpia Houston Chicago Los Angeles New YorkNe Los Angeles hicago t Philadelphi San Antoni San San Jos ti Indianapolis Jacksonville San Francisco Columbus 1.0% 1.2% S California N California Population Growth2(YoY % change) Personal Income2(YoY % change) 4.6% 5.7% S California N California U.S. Average 0.8% U.S. Average 4.0% Finance/Real Estate 21% Manufacturing 11% Professional Services 13% Information 8% Education/Health 7% Other 5%3 Arts/Ent. 4% Construction 3% Transportation 2% Agriculture 2% California: Diverse Economy(Based on state GDP for 2013) Trade 11%Government 13%

5 California: Key Contributor to Comerica’s Growth California$15.4B33% Texas$11.0B23% Michigan$13.3B29% Other Markets$6.9B15% Average Loans by Market(FY14 average balances) Average Deposits by Market(FY14 average balances) California$16.1B29% Texas$10.8B20% Michigan$21.0B38% Other Markets$6.4B12%Finance/ Other $0.5B1% 14.4 14.8 15.4 15.5 15.8 4Q13 1Q14 2Q14 3Q14 4Q14 California Average Loans($ in billions) +9% 15.2 14.8 15.4 16.4 18.0 4Q13 1Q14 2Q14 3Q14 4Q14 California Average Deposits($ in billions) +18% 6 Diverse Businesses and Footprint Supports Growth FY14 average balances ● 1Primarily includes businesses with a national perspective CaliforniaDiverse Average Loan Portfolio California Markets Average Loans San Diego$0.5B 3% Los Angeles/Orange County$7.4B 48% San Jose$3.1B 20% San Francisco$1.9B 12% Other1$2.5B 17% = Total Middle Market (64%) Tech. & Life Sciences Commercial Real Estate National Dealer Services Entertainment Focus on Industry Middle Market Banking$3.9B 25%Other General Middle Market$0.2B 1% National Dealer$3.5B 23% Tech. & Life Sciences$1.7B 11% Entertainment$0.5B 4% Corporate Banking $0.9B 6% Commercial Real Estate $1.9B 12% Small Business$0.6B 4% Retail Banking$0.3B 2%Private Banking$1.9B 12%
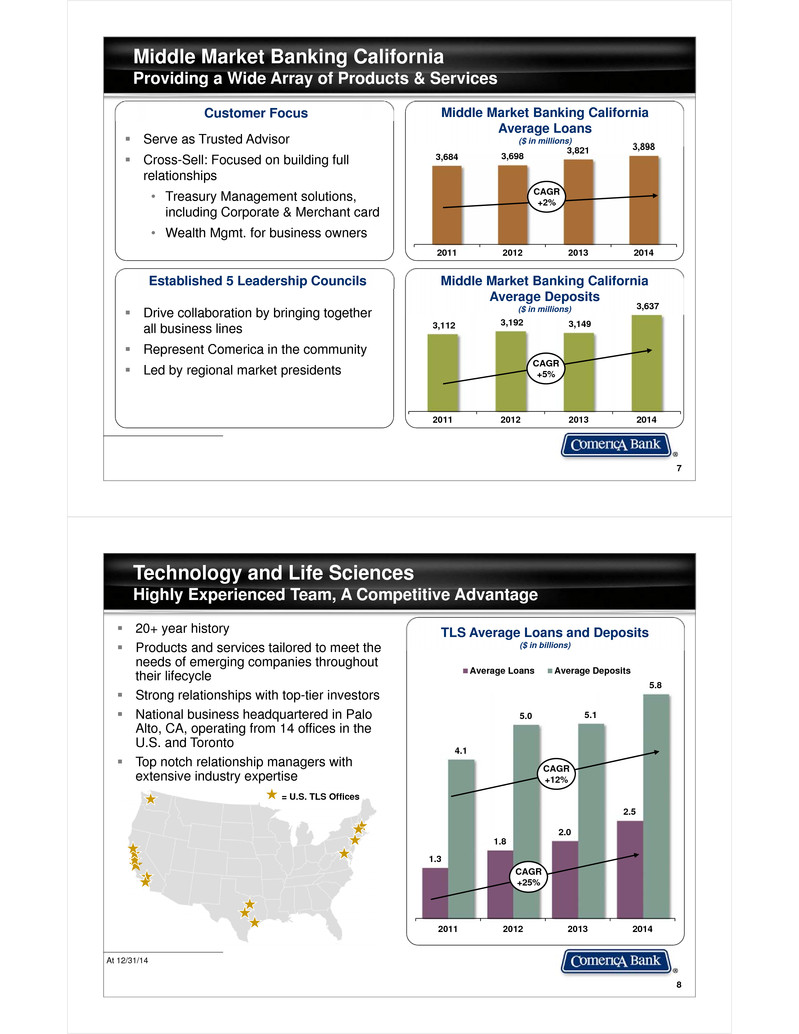
7 3,684 3,698 3,821 3,898 2011 2012 2013 2014 Middle Market Banking CaliforniaProviding a Wide Array of Products & Services Middle Market Banking CaliforniaAverage Loans($ in millions) Middle Market Banking CaliforniaAverage Deposits($ in millions) 3,112 3,192 3,149 3,637 2011 2012 2013 2014 Serve as Trusted Advisor Cross-Sell: Focused on building full relationships• Treasury Management solutions, including Corporate & Merchant card• Wealth Mgmt. for business owners Customer Focus Established 5 Leadership Councils Drive collaboration by bringing together all business lines Represent Comerica in the community Led by regional market presidents CAGR+2% CAGR+5% 8 Technology and Life SciencesHighly Experienced Team, A Competitive Advantage At 12/31/14 20+ year history Products and services tailored to meet the needs of emerging companies throughout their lifecycle Strong relationships with top-tier investors National business headquartered in Palo Alto, CA, operating from 14 offices in the U.S. and Toronto Top notch relationship managers with extensive industry expertise TLS Average Loans and Deposits($ in billions) = U.S. TLS Offices 1.3 1.8 2.0 2.5 4.1 5.0 5.1 5.8 2011 2012 2013 2014 Average Loans Average Deposits CAGR+12% CAGR+25%

- Owned by Venture Capital (VC) firms- High liquidity- Reliant on cash and equity infusions - High growth private companies- Typically evolved from an early stage relationship - Working capital requirements - Small public/ large private companies- Standard credit metrics - Profile similar to middle market 9 Technology & Life SciencesCustomer Segment Overview At 12/31/14 Early Stage (~20%) Growth (~40%) Late Stage (~10%) Percentage of overall portfolio, based on loan outstandings - Commercial banking services for venture capital and private equity firms- Bridge financing for capital calls- Strong credit profile Equity Funds Services (~25%) - Strong credit profile- Provide acquisition financing for best VC and private equity customers Leveraged Finance (~5%) 10 California: Largest Dealer Market At 12/31/14 National Dealer Loans By Market(4Q14 average balances) National Dealer CaliforniaAverage Loans($ in billions) 65+ years of Floor Plan lending Top tier strategy Focus on “Mega Dealer” (five or more dealerships in group) Strong credit quality Robust monitoring of company inventory and performance 2.0 2.5 3.1 3.5 2011 2012 2013 2014 California$3,578MM63% Texas$473MM8% Michigan$1,035MM18% Other Markets$650MM11% CAGR+20%

11 Commercial Real Estate Line of Business2 Years of Strong Growth At 12/31/14 ● 1Based on location of property ● 2Includes CRE line of business loans not secured by real estate Residential $250MM 14% Multi-Family $733MM 41% Retail$182MM 10% Office$230MM 13%Commercial$111MM 6% Other$77MM 4% Multi-use$148MM 8% Land Carry$71MM 4% 1,270 1,266 1,555 1,898 2011 2012 2013 2014 Commercial & Other Real Estate ConstructionCommercial Mortgages CRE California Average Loans($ in millions)2California Commercial Mortgage & Real Estate Construction1 Provides construction and bridge financing Well-established developers Focused on urban markets Conservative underwriting CRE California Average Deposits($ in millions) 386 472 609 904 2011 2012 2013 2014 CAGR+14% CAGR+33% 12 Wealth ManagementCalifornia Leading the Way in Collaboration 1Since inception of program in 2012 Business Owner Advisory Services Business Bank Wealth Management 1.5 1.4 1.7 1.9 2011 2012 2013 2014 Wealth Management CaliforniaAverage Loans($ in billions) 1.6 1.8 1.8 2.0 2011 2012 2013 2014 Wealth Management CaliforniaAverage Deposits($ in billions) Business Owner Advisory Service ~ $1B Loans, Deposits & AUM1 1,700+ Referrals made1 ~45% of Revenue from CA 1 Identifying opportunities to expand relationships between Wealth Mgmt. and the Business Bank Providing integrated solutions to meet business and personal goalsCAGR+8% CAGR+7%

13 Comerica Competitive Advantage Focused on growing and maintaining long-term relationships Relationship Managers known for ingenuity, flexibility & responsiveness Experience in a number of distinct industries Strive to be customers’ trusted advisor by providing value-added recommendations Emphasis on having a clear understanding of our customers & their banking needs Able to offer a wide array of products & services Prompt turnaround on customer requests due to local decision making React swiftly to changing markets Well Positioned for Growth Focused on Relationship Banking Model 14 2014 Accomplishments At 12/31/14 ● 1Reflecting decreases of $48MM in litigation-related expenses and $47MM in pension expense. ● 2Through dividends and share repurchase program. Grew the Bottom Line Shareholder Return Controlling What We Can Control Focus on Relationships • 11% increase in EPS to $3.16• 10% increase in net income to $593MM • 5%, or $2.2B, increase in average loans to $46.6B• 6%, or $3.1B, increase in average deposits to $54.8B• $5MM increase in customer-driven fee income • 6%, or $96MM, decrease in noninterest expenses1• 5 bps of NCOs - Credit quality continued to be strong • 66% of net income, or $392MM, returned to shareholders2• 6% increase in tangible book value per share to $37.72 • Capital position continued to be solid

15 Loan Growth Outpaces Peers 1Source: SNL Financial. Excludes MTB as amounts were not available as of 2/5/15. 44.1 45.1 46.7 47.2 47.4 3.58 3.39 3.31 3.22 3.22 4Q13 1Q14 2Q14 3Q14 4Q14 Loan Yields Broad-Based Loan GrowthLoan Yields Stabilized(Average $ in billions) January Average Loan Trends Mortgage Banker lower, in line with typical seasonality Energy increased with tight capital markets Continued slow growth in most remaining businesses Focus on pricing and structure discipline +7.5% 11.4 % 9.2% 7.5% 6.2% 5.5% 5.1% 3.9% 3.6% 3.2% 3.1% 1.8% BOK F HBA N CMA ST I KEY SNV FHN FITB ZIO N BBT RF Top Quartile Loan Growth1(Average 4Q14 vs. 4Q13) Peer Average: 5.3% 16 Robust, Broad-Based Deposit Growth 1Source: SNL Financial ● 2Source: SNL Financial. Excludes BOKF, MTB & SNV as amounts were not available as of 2/5/15. 4Q14 interest incurred on deposits as a percentage of average deposits. 52.8 52.8 53.4 55.2 57.8 4Q13 1Q14 2Q14 3Q14 4Q14 Growing Deposit Base(Average $ in billions) Lowest Cost of Deposits2(In basis points) 22 18 16 16 15 14 11 11 8 FITB BB T HBA N STI KEY FHN RF ZIO N CMA 12.4 % 9.5% 8.5% 6.8% 4.9% 4.1% 3.5% 2.8% 2.7% 2.1% 1.9% 0.9 % MTB CMA HBA N STI FHN BOK F BBT ZIO N FITB R F KEY SNV Strong Relative Deposit Growth1(Average 4Q14 vs. 4Q13) Peer Average: 4.6% 29% 29% 29% 30% 30% 3 4% 34% 37 % 38% 41 % 43% 47 % FHN SNV ST I HBA N BBT RF FITB MTB BOK F KEY ZIO N CMA Highest Proportion of Noninterest-Bearing Deposits1(4Q14 average balances) +9%
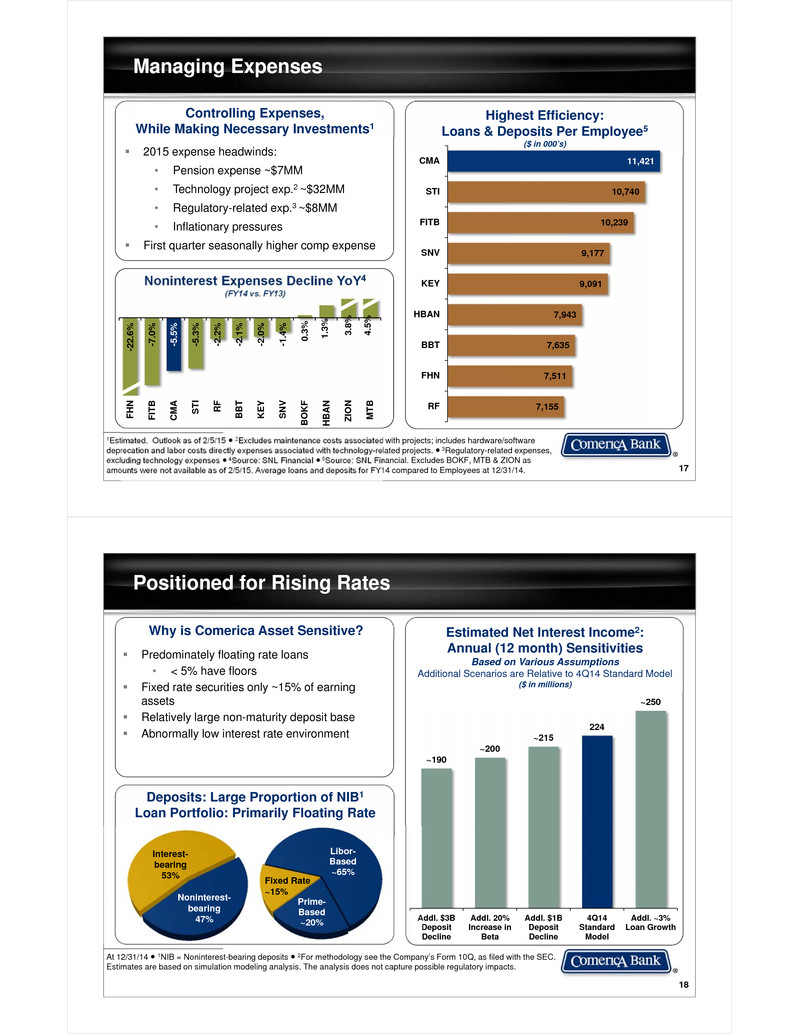
17 Managing Expenses 1Estimated. Outlook as of 2/5/15 ● 2Excludes maintenance costs associated with projects; includes hardware/software deprecation and labor costs directly expenses associated with technology-related projects. ● 3Regulatory-related expenses, excluding technology expenses ● 4Source: SNL Financial ● 5Source: SNL Financial. Excludes BOKF, MTB & ZION as amounts were not available as of 2/5/15. Average loans and deposits for FY14 compared to Employees at 12/31/14. 7,155 7,511 7,635 7,943 9,091 9,177 10,239 10,740 11,421 RF FHN BBT HBAN KEY SNV FITB STI CMA Highest Efficiency: Loans & Deposits Per Employee5($ in 000’s) Noninterest Expenses Decline YoY4(FY14 vs. FY13) -22. 6% -7.0 % -5.5 % -5.3 % -2.2 % -2.1 % -2.0 % -1.4 % 0.3% 1.3 % 3.8% 4.5% FHN FITB CMA ST I RF BBT KEY SNV BOK F HBA N ZIO N MTB Controlling Expenses, While Making Necessary Investments1 2015 expense headwinds: • Pension expense ~$7MM • Technology project exp.2 ~$32MM • Regulatory-related exp.3 ~$8MM • Inflationary pressures First quarter seasonally higher comp expense 18 Positioned for Rising Rates At 12/31/14 ● 1NIB = Noninterest-bearing deposits ● 2For methodology see the Company’s Form 10Q, as filed with the SEC. Estimates are based on simulation modeling analysis. The analysis does not capture possible regulatory impacts. Predominately floating rate loans • < 5% have floors Fixed rate securities only ~15% of earning assets Relatively large non-maturity deposit base Abnormally low interest rate environment Why is Comerica Asset Sensitive? ~190 ~200 ~215 224 ~250 Addl. $3BDepositDecline Addl. 20%Increase inBeta Addl. $1BDepositDecline 4Q14StandardModel Addl. ~3%Loan Growth Estimated Net Interest Income2: Annual (12 month) SensitivitiesBased on Various AssumptionsAdditional Scenarios are Relative to 4Q14 Standard Model($ in millions) Libor-Based~65% Prime-Based~20% Deposits: Large Proportion of NIB1Loan Portfolio: Primarily Floating Rate Interest-bearing53% Noninterest-bearing47% Fixed Rate~15%
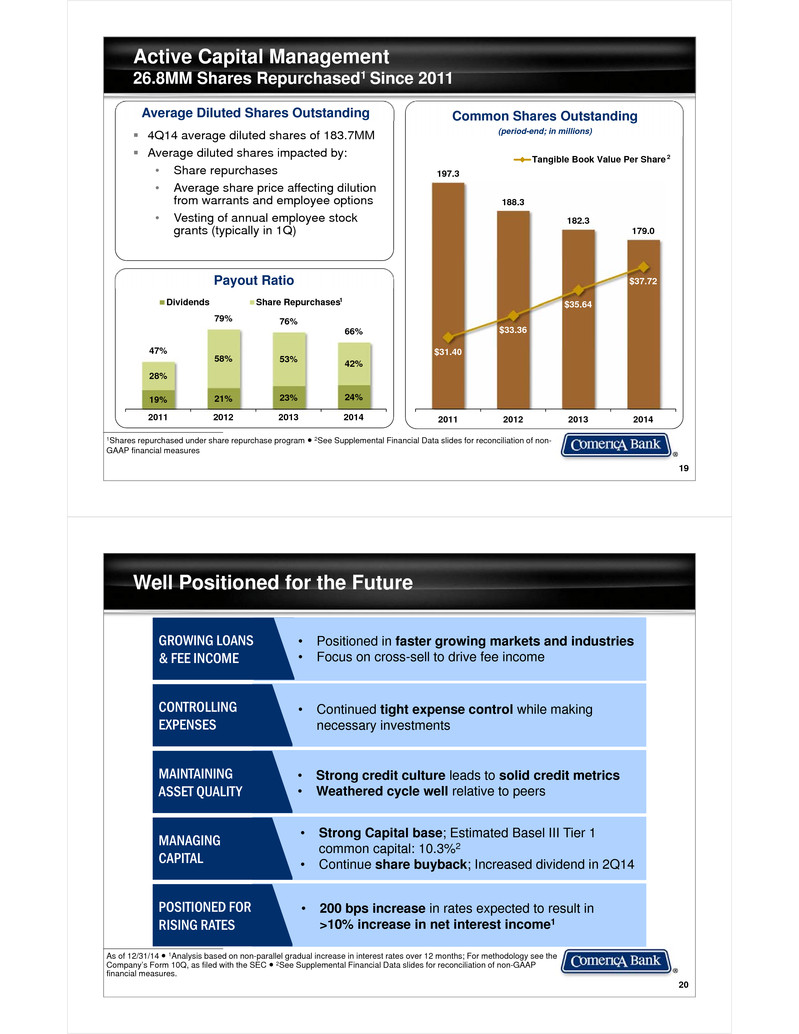
19 Active Capital Management26.8MM Shares Repurchased1 Since 2011 1Shares repurchased under share repurchase program ● 2See Supplemental Financial Data slides for reconciliation of non-GAAP financial measures 19% 21% 23% 24% 28% 58% 53% 42%47% 79% 76% 66% 2011 2012 2013 2014 Dividends Share Repurchases Payout Ratio 197.3 188.3 182.3 179.0 $31.40 $33.36 $35.64 $37.72 2011 2012 2013 2014 Tangible Book Value Per Share Common Shares Outstanding (period-end; in millions) 2 4Q14 average diluted shares of 183.7MM Average diluted shares impacted by:• Share repurchases• Average share price affecting dilution from warrants and employee options• Vesting of annual employee stock grants (typically in 1Q) Average Diluted Shares Outstanding 1 20 Well Positioned for the Future As of 12/31/14 ● 1Analysis based on non-parallel gradual increase in interest rates over 12 months; For methodology see the Company’s Form 10Q, as filed with the SEC ● 2See Supplemental Financial Data slides for reconciliation of non-GAAP financial measures. GROWING LOANS & FEE INCOME CONTROLLING EXPENSES MAINTAINING ASSET QUALITY MANAGING CAPITAL POSITIONED FOR RISING RATES • Positioned in faster growing markets and industries• Focus on cross-sell to drive fee income • Continued tight expense control while making necessary investments • Strong Capital base; Estimated Basel III Tier 1 common capital: 10.3%2• Continue share buyback; Increased dividend in 2Q14 • Strong credit culture leads to solid credit metrics• Weathered cycle well relative to peers • 200 bps increase in rates expected to result in >10% increase in net interest income1

Appendix 22 Loans by Business and Market Average $ in billions Middle Market: Serving companies with revenues generally between $20-$500MM Corporate Banking: Serving companies (and their U.S. based subsidiaries) with revenues generally over $500MM Small Business: Serving companies with revenues generally under $20MM By Line of Business 4Q14 3Q14 4Q13 Middle MarketGeneralEnergyNational Dealer ServicesEntertainmentTech. & Life SciencesEnvironmental Services $13.43.55.70.62.71.0 $13.63.35.50.62.60.9 $13.22.85.30.62.10.8 Total Middle Market $26.9 $26.5 $24.8 Corporate BankingUS BankingInternational 2.71.8 2.81.8 2.61.8 Mortgage Banker Finance 1.4 1.6 1.1 Commercial Real Estate 4.2 4.2 3.8 BUSINESS BANK $37.0 $36.9 $34.1 Small Business 3.7 3.7 3.6 Retail Banking 1.8 1.8 1.7 RETAIL BANK $5.5 $5.5 $5.3 Private Banking 4.9 4.8 4.7 WEALTH MANAGEMENT $4.9 $4.8 $4.7 TOTAL $47.4 $47.2 $44.1 By Market 4Q14 3Q14 4Q13 Michigan $13.2 $13.3 $13.4 California 15.8 15.5 14.4 Texas 11.3 11.1 9.8 Other Markets 7.1 7.3 6.5 TOTAL $47.4 $47.2 $44.1
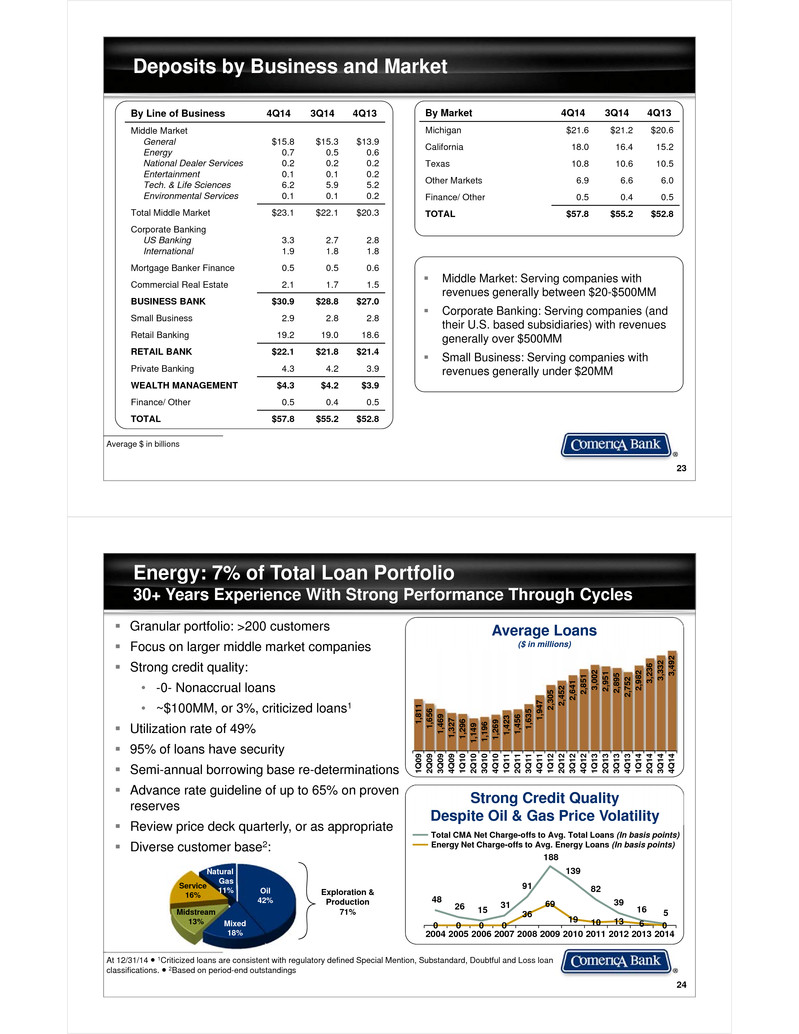
23 Deposits by Business and Market Average $ in billions Middle Market: Serving companies with revenues generally between $20-$500MM Corporate Banking: Serving companies (and their U.S. based subsidiaries) with revenues generally over $500MM Small Business: Serving companies with revenues generally under $20MM By Line of Business 4Q14 3Q14 4Q13 Middle MarketGeneralEnergyNational Dealer ServicesEntertainmentTech. & Life SciencesEnvironmental Services $15.80.70.20.16.20.1 $15.30.50.20.15.90.1 $13.90.60.20.25.20.2 Total Middle Market $23.1 $22.1 $20.3 Corporate BankingUS BankingInternational 3.31.9 2.71.8 2.81.8 Mortgage Banker Finance 0.5 0.5 0.6 Commercial Real Estate 2.1 1.7 1.5 BUSINESS BANK $30.9 $28.8 $27.0 Small Business 2.9 2.8 2.8 Retail Banking 19.2 19.0 18.6 RETAIL BANK $22.1 $21.8 $21.4 Private Banking 4.3 4.2 3.9 WEALTH MANAGEMENT $4.3 $4.2 $3.9 Finance/ Other 0.5 0.4 0.5 TOTAL $57.8 $55.2 $52.8 By Market 4Q14 3Q14 4Q13 Michigan $21.6 $21.2 $20.6 California 18.0 16.4 15.2 Texas 10.8 10.6 10.5 Other Markets 6.9 6.6 6.0 Finance/ Other 0.5 0.4 0.5 TOTAL $57.8 $55.2 $52.8 24 Energy: 7% of Total Loan Portfolio30+ Years Experience With Strong Performance Through Cycles At 12/31/14 ● 1Criticized loans are consistent with regulatory defined Special Mention, Substandard, Doubtful and Loss loan classifications. ● 2Based on period-end outstandings 1,81 1 1,65 6 1,46 9 1,32 7 1,29 6 1,14 9 1,19 6 1,26 9 1,42 3 1,45 6 1,63 5 1,94 7 2,30 5 2,45 2 2,64 1 2,85 1 3,00 2 2,95 1 2,89 5 2,75 2 2,98 2 3,23 6 3,33 2 3,49 2 1Q0 9 2Q0 9 3Q0 9 4Q0 9 1Q1 0 2Q1 0 3Q1 0 4Q1 0 1Q1 1 2Q1 1 3Q1 1 4Q1 1 1Q1 2 2Q1 2 3Q1 2 4Q1 2 1Q1 3 2Q1 3 3Q1 3 4Q1 3 1Q1 4 2Q1 4 3Q1 4 4Q1 4 Average Loans($ in millions) Granular portfolio: >200 customers Focus on larger middle market companies Strong credit quality: • -0- Nonaccrual loans• ~$100MM, or 3%, criticized loans1 Utilization rate of 49% 95% of loans have security Semi-annual borrowing base re-determinations Advance rate guideline of up to 65% on proven reserves Review price deck quarterly, or as appropriate Diverse customer base2: Exploration & Production 71%Midstream13% Service16% Natural Gas 11% Oil42% Mixed18% 48 26 15 31 91 188 139 82 39 16 5 0 0 0 0 36 69 19 10 13 6 02004 2005 2006 2007 2008 2009 2010 2011 2012 2013 2014 Strong Credit Quality Despite Oil & Gas Price Volatility Total CMA Net Charge-offs to Avg. Total Loans (In basis points)Energy Net Charge-offs to Avg. Energy Loans (In basis points)

25 Mortgage Banker Finance Average Deposits($ in millions) 40+ years’ experience with reputation for consistent, reliable approach Provide short-term warehouse financing: bridge from origination of residential mortgage until sale into end market Extensive backroom provides collateral monitoring and customer service Focus on full banking relationships 360 481 52 3 551 6 37 513 372 399 4 41 454 49 7 62 5 645 665 643 566 565 516 516 526 1Q1 0 2Q1 0 3Q1 0 4Q1 0 1Q1 1 2Q1 1 3Q1 1 4Q1 1 1Q1 2 2Q1 2 3Q1 2 4Q1 2 1Q1 3 2Q1 3 3Q1 3 4Q1 3 1Q1 4 2Q1 4 3Q1 4 4Q1 4 425 707 943 1 ,101 566 61 4 923 1,53 5 1,48 3 1,50 7 1,99 6 2,09 4 1,73 7 1,81 5 1,60 5 1,10 9 886 1,31 9 1,59 5 1,39 7 1Q1 0 2Q1 0 3Q1 0 4Q1 0 1Q1 1 2Q1 1 3Q1 1 4Q1 1 1Q1 2 2Q1 2 3Q1 2 4Q1 2 1Q1 3 2Q1 3 3Q1 3 4Q1 3 1Q1 4 2Q1 4 3Q1 4 4Q1 4 At 12/31/14 Average Loans($ in millions) 26 Commercial Real Estate Line of Business At 12/31/14 ● 1Includes CRE line of business loans not secured by real estate 5.7 5.4 5.1 4.8 4.4 4.0 4.4 4.6 4.4 4.3 3.9 3.7 3.7 3.8 3.8 3.8 4 .0 4.1 4.2 4.2 1Q1 0 2Q1 0 3Q1 0 4Q1 0 1Q1 1 2Q1 1 3Q1 1 4Q1 1 1Q1 2 2Q1 2 3Q1 2 4Q1 2 1Q1 3 2Q1 3 3Q1 3 4Q1 3 1Q1 4 2Q1 4 3Q1 4 4Q1 4 Commercial MortgagesReal Estate ConstructionCommercial & Other Average Loans($ in billions) 5.2 5.4 5.6 6.0 6.4 4Q13 1Q14 2Q14 3Q14 4Q14 Commitments($ in billions; Based on period-end) 160+ years experience with focus on well-established developers, primarily in our footprint Provide construction and mini-perm mortgage financing +22% 1

27 Shared National Credit (SNC) Relationships At 12/31/14 ● SNCs are not a line of business. The balances shown above are included in the line of business balances shown on slide #20 ● SNCs are facilities greater than $20 million shared by three or more federally supervised financial institutions which are reviewed by regulatory authorities at the agent bank level. Period-end Loans of $10.8B Commercial Real Estate$0.7B 7% Corporate $2.7B 24% General$2.3B 22%National Dealer $0.5B 4% Energy$3.3B 30% Entertainment$0.3B 3% Tech. & Life Sciences$0.3B 3% Environmental Services $0.4B 4% Mortgage Banker$0.3B 3% = Total Middle Market (66%) SNC relationships included in business line balances Approximately 855 borrowers Strategy: Pursue full relationships with ancillary business Comerica is agent for approx. 19% Adhere to same credit underwriting standards as rest of loan book Credit quality mirrors total portfolio 28 Government Card ProgramsGenerate Valuable Retail Deposits 720 948 1,221 1,444 2011 2012 2013 2014 US Treasury ProgramState Card Programs At 12/31/14 ● 1Source: the Nilson Report July 2014, based on 2013 data ● 2Based on a 2014 survey conducted by KRC Research ● 3Source: U.S. Department of the Treasury ● 4Source: Social Security Administration Growing Average Noninterest-Bearing Deposits($ in millions) #1 prepaid card issuer in US1 State/ Local government benefit programs:• 49 distinct programs US Treasury DirectExpress Program:• Exclusive provider of prepaid debit cards since 2008; contract extended to January 2020• ~80k new accounts per month• 95% of Direct Express card holders report they are satisfied2• Eliminating monthly benefit checks, resulting in significant taxpayer savings3 # of Social Security Beneficiaries4(in millions) 25 30 35 40 45 50 55 60 1970 1975 1980 1985 1990 1995 2000 2005 2010 Key Facts
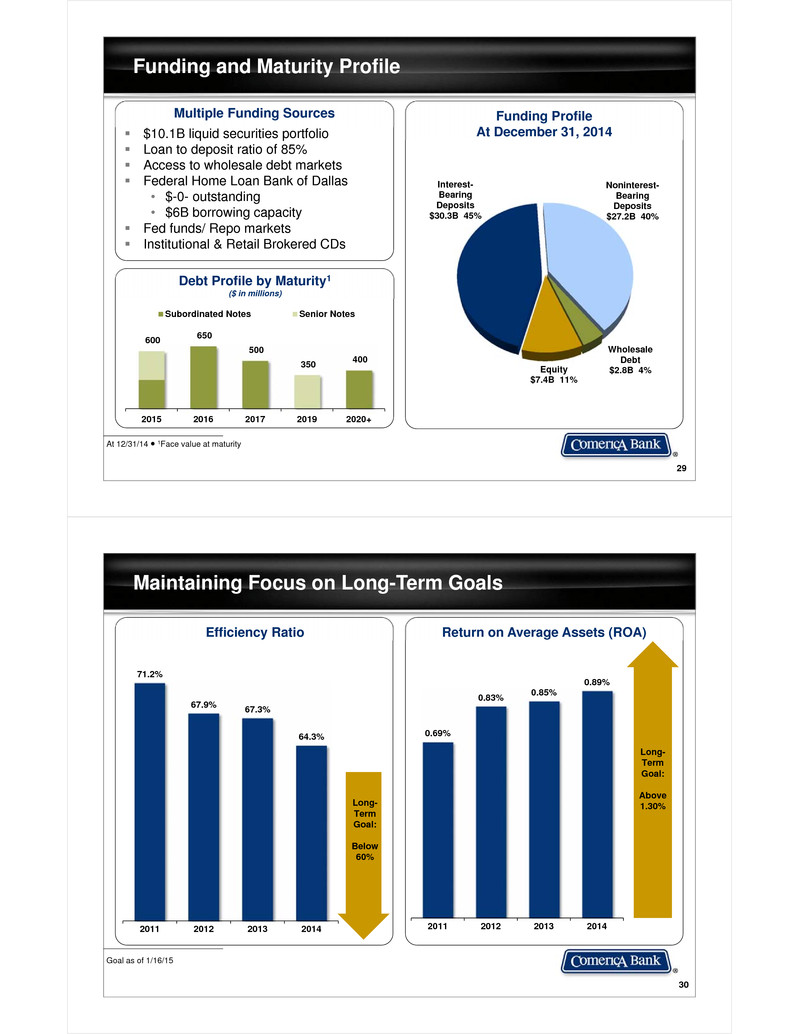
29 Funding and Maturity Profile At 12/31/14 ● 1Face value at maturity $10.1B liquid securities portfolio Loan to deposit ratio of 85% Access to wholesale debt markets Federal Home Loan Bank of Dallas• $-0- outstanding • $6B borrowing capacity Fed funds/ Repo markets Institutional & Retail Brokered CDs Multiple Funding Sources Debt Profile by Maturity1($ in millions) 600 650 500 350 400 2015 2016 2017 2019 2020+ Subordinated Notes Senior Notes Equity$7.4B 11% Interest-Bearing Deposits$30.3B 45% Noninterest-Bearing Deposits$27.2B 40% Wholesale Debt $2.8B 4% Funding ProfileAt December 31, 2014 30 Maintaining Focus on Long-Term Goals Goal as of 1/16/15 Efficiency Ratio 71.2% 67.9% 67.3% 64.3% 2011 2012 2013 2014 Return on Average Assets (ROA) 0.69% 0.83% 0.85% 0.89% 2011 2012 2013 2014 Long-TermGoal: Above 1.30%Long-TermGoal: Below 60%

31 Holding Company Debt Rating As of 2/3/15 ● Source: SNL Financial ● Debt Ratings are not a recommendation to buy, sell, or hold securities Senior Unsecured/Long-Term Issuer Rating S&P Moody’s Fitch BB&T A- A2 A+ BOK Financial A- A2 A Comerica A- A3 A M&T Bank A- A3 A- KeyCorp BBB+ Baa1 A- Fifth Third BBB+ Baa1 A SunTrust BBB+ Baa1 BBB+ Huntington BBB Baa1 A- Regions Financial BBB Ba1 BBB Zions Bancorporation BBB- Ba1 BBB- First Horizon National Corp BB+ Baa3 BBB- Synovus Financial Corp BB- Ba3 BB+ Wells Fargo & Company A+ A2 AA- U.S. Bancorp A+ A1 AA- JP Morgan A A3 A+ PNC Financial Services Group A- A3 A+ Bank of America A- Baa2 A Pee r Ba nks Larg e Ba nks Supplemental Financial DataReconciliation of non-GAAP financial measures with financial measures defined by GAAP ($ in millions) 32 The Tier 1 common capital ratio removes preferred stock and qualifying trust preferred securities from Tier 1 capital as defined by and calculated in conformity with bank regulations. The tangible common equity ratio removes preferred stock and the effect of intangible assets from capital and the effect of intangible assets from total assets. Tangible common equity per share of common stock removed the effect of intangible assets from common shareholders equity per share of common stock.The Corporation believes these measurements are meaningful measures of capital adequacy used by investors, regulators, management and others to evaluate the adequacy of common equity and to compare against other companies in the industry.1Tier 1 Capital and risk-weighted assets as defined and calculated in accordance with regulation.2December 31, 2014 Tier 1 Capital and Risk-Weighted assets are estimated. 12/31/14 9/30/14 12/31/13 12/31/12 12/31/11 Tier 1 and Tier 1 common capital1,2Risk-weighted assets1,2Tier 1 and Tier 1 common capital ratio2 7,16868,10110.53% 7,10567,10610.59% 6,89564,82510.64% Common shareholders’ equityLess: GoodwillLess: Other intangible assets $7,40263515 $7,43363515 $7,15063517Tangible common equity $6,752 $6,783 $6,498Total assetsLess: GoodwillLess: Other intangible assets $69,19063515 $68,88763515 $65,22463517Tangible assets $68,540 $68,237 $64,572Common equity ratio 10.85% 10.79% 10.97%Tangible common equity ratio 9.85 9.94 10.07 Common shareholders’ equity $7,402 $7,433 $7,150 $6,939 $6,865Tangible common equity $6,752 $6,783 $6,498 $6,282 $6,198Shares of common stock outstanding (in millions) 179 180 182 188 197 Common shareholders’ equity per share of common stock $41.35 $41.26 $39.22 $36.86 $34.79Tangible common equity per share of common stock 37.72 37.65 35.64 33.36 31.40

Supplemental Financial DataTier 1 Common Equity under Basel III ($ in millions) 33 The Tier 1 common capital ratio removes preferred stock and qualifying trust preferred securities from Tier 1 capital as defined by and calculated in conformity with bank regulations. The Basel III Tier 1 common capital ratio further adjusts Tier 1 common capital and risk-weighted assets to account for the final rule approved by U.S. banking regulators in July 2013 for the U.S. adoption of the Basel III regulatory capital framework. The final Basel III capital rules are effective January 1, 2015 for banking organizations subject to the standardized approach. The Corporation believes these measurements are meaningful measures of capital adequacy used by investors, regulators, management and others to evaluate the adequacy of common equity and to compare against other companies in the industry.1Tier 1 Capital and risk-weighted assets as defined in accordance with regulation.2Estimated ratios based on the standardized approach in the final rule, as fully phased-in, and excluding most elements of accumulated other comprehensive income (AOCI).3December 31, 2014 Tier 1 Capital and Risk-Weighted assets are estimated. Basel III Tier 1 Common Capital Ratio 12/31/14 9/30/14 6/30/14 3/31/14 12/31/13 Tier 1 common capital3Basel III adjustments2 $7,168-- $7,105(1) $7,027(1) $6,962(2) $6,895(6) Basel III Tier 1 common capital2 $7,168 $7,104 $7,026 $6,960 $6,889 Risk-weighted assets1,3Basel III adjustments2 $68,1011,751 $67,1061,492 $66,9111,594 $65,7881,590 $64,8251,754Basel III risk-weighted assets2 $69,852 $68,598 $68,505 $67,378 $66,579 Tier 1 common capital ratio3Basel III Tier 1 common capital ratio2 10.5%10.3% 10.6%10.4% 10.5%10.3% 10.6%10.3% 10.6%10.3% Assets under administration of $146.7B at 12/31/14
